Nordic EV Outlook 2018 - iea.org · Response to policy incentives and customer satisfaction ......
105
Insights from leaders in electric mobility Nordic EV Outlook 2018
Transcript of Nordic EV Outlook 2018 - iea.org · Response to policy incentives and customer satisfaction ......
Insights from leaders in electric mobilityNordic EV Outlook 2018

IEA member countries: Australia
Austria Belgium
CanadaCzech Republic
DenmarkEstonia
Finland France
GermanyGreece
HungaryIreland
ItalyJapan
KoreaLuxembourgMexicoNetherlandsNew Zealand NorwayPolandPortugalSlovak RepublicSpainSwedenSwitzerland
TurkeyUnited Kingdom
United States
The European Commission also participates in
the work of the IEA.
© OECD/IEA, 2018
International Energy Agency Website: www.iea.org
Please note that this publication is subject to specific restrictions that limit its use and distribution.
The terms and conditions are available online at www.iea.org/t&c/
INTERNATIONAL ENERGY AGENCY
The IEA examines the full spectrum of energy issues including oil, gas and coal supply and demand, renewable energy technologies, electricity markets, energy efficiency, access
to energy, demand side management and much more. Through its work, the IEA advocates policies that will enhance the reliability, affordability and sustainability of energy in its 30 member countries, 7 association countries and beyond.
The four main areas of IEA focus are:
n Energy Security: Promoting diversity, efficiency, flexibility and reliability for all fuels and energy sources;
n Economic Development: Supporting free markets to foster economic growth and eliminate energy poverty;
n Environmental Awareness: Analysing policy options to offset the impact of energy production and use on the environment, especially for
tackling climate change and air pollution; and
n Engagement Worldwide: Working closely with association and partner countries, especially major emerging
economies, to find solutions to shared energy and environmental
concerns.
Together
SecureSustainable

© OECD/IEA 2018 Nordic EV Outlook 2018 Insights from leaders in electric mobility
Page | 1
Page | 1
Page | 1
Page | 1
Page | 1
Page | 1
Page | 1
Page | 1
Page | 1
Page | 1
Page | 1
Page | 1
Page | 1
Page | 1
Page | 1
Page | 1
Page | 1
Page | 1
Page | 1
Page | 1
Page | 1
Page | 1
Page | 1
Page | 1
Page | 1
Page | 1
Page | 1
Page | 1
Table of Contents
Executive summary ................................................................................................................. 7
1. Introduction ...................................................................................................................... 11
The Electric Vehicles Initiative ..................................................................................................... 11
The EV30@30 campaign ......................................................................................................... 12
Nordic Energy Research .............................................................................................................. 12
Scope ........................................................................................................................................... 13
Data sources ................................................................................................................................ 13
2. Electric car market in the Nordic countries ......................................................................... 15
Electric car stock .......................................................................................................................... 15
New electric car sales .................................................................................................................. 16
Electric vehicle technology choices ............................................................................................. 17
Model availability ........................................................................................................................ 18
Policy drivers ............................................................................................................................... 19
CO₂ emission regulations and targets ..................................................................................... 19
Taxes on vehicle purchases ..................................................................................................... 20
Purchase incentives for electric cars ....................................................................................... 21
Taxes on circulation and use ................................................................................................... 25
Local measures ........................................................................................................................ 26
Public procurement ................................................................................................................. 28
Consumer response: Focus on Norway ....................................................................................... 29
Electric car adopters ................................................................................................................ 29
Electric car use......................................................................................................................... 30
Response to policy incentives and customer satisfaction ....................................................... 30
The role of fleets in the uptake of electric vehicles .................................................................... 31
Direct impacts ......................................................................................................................... 32
Indirect impacts ....................................................................................................................... 33
Lessons from the Nordic experience on electric car uptake ....................................................... 34
3. Electric vehicle supply equipment ...................................................................................... 37
Standards and types of chargers ................................................................................................. 37
Status of EVSE deployment ......................................................................................................... 38
Charging behaviour: Lessons from Norway and Sweden ............................................................ 41
Norway .................................................................................................................................... 41
Sweden .................................................................................................................................... 42
EVSE ecosystem ........................................................................................................................... 43
Nordic EV Outlook 2018 © OECD/IEA 2018 Insights from leaders in electric mobility
Page | 2 Page | 2 Page | 2 Page | 2 Page | 2 Page | 2 Page | 2 Page | 2 Page | 2 Page | 2 Page | 2 Page | 2 Page | 2 Page | 2 Page | 2 Page | 2 Page | 2 Page | 2 Page | 2 Page | 2 Page | 2 Page | 2 Page | 2 Page | 2 Page | 2 Page | 2 Page | 2 Page | 2
EVSE business models and charging prices ............................................................................. 45
Policy and regulations supporting EVSE deployment ................................................................. 47
EU policy framework for EVSE ................................................................................................. 48
National EVSE policy support .................................................................................................. 50
Regional/local policy and regulation ....................................................................................... 53
Key implications .......................................................................................................................... 54
4. EVs and the power grid ...................................................................................................... 57
Nordic power market .................................................................................................................. 57
Power generation mix ................................................................................................................. 58
Electricity prices .......................................................................................................................... 60
Electricity demand from EVs ....................................................................................................... 61
Are electric cars impacting the power grid? ............................................................................... 61
Reducing grid impacts and seizing opportunities ....................................................................... 64
Demand-side management ..................................................................................................... 64
Network investments and planning ........................................................................................ 67
5. Market and policy outlook ................................................................................................. 69
Plans and targets for electric vehicles and decarbonisation ....................................................... 69
Plans and targets for EVSE deployment ...................................................................................... 71
Electric vehicle deployment prospects ....................................................................................... 73
Electric car outlook to 2030 .................................................................................................... 73
Electric car charging infrastructure projections to 2030 ......................................................... 75
Electricity use and GHG emission savings ............................................................................... 76
Policy strategies for a successful transition ................................................................................ 79
Transitioning EV support mechanisms and vehicle taxation .................................................. 79
Mobilising private investments ............................................................................................... 80
Long-term implications ........................................................................................................... 81
Statistical annex .................................................................................................................... 83
Electric car stock .......................................................................................................................... 83
New electric car sales .................................................................................................................. 84
Market share of electric cars ....................................................................................................... 85
EVSE stock ................................................................................................................................... 86
References ....................................................................................................................................... 87
Acronyms, abbreviations and units of measure.............................................................................. 99
© OECD/IEA 2018 Nordic EV Outlook 2018 Insights from leaders in electric mobility
Page | 3 Page | 3 Page | 3 Page | 3 Page | 3 Page | 3 Page | 3 Page | 3 Page | 3 Page | 3 Page | 3 Page | 3 Page | 3 Page | 3 Page | 3 Page | 3 Page | 3 Page | 3 Page | 3 Page | 3 Page | 3 Page | 3 Page | 3 Page | 3 Page | 3 Page | 3 Page | 3 Page | 3
List of figures
Figure E.1 • Number of electric cars, new sales and market share in Nordic countries, 2010-17 ...................................................................................................................... 7
Figure E.2 • Outlook for electric cars in the Nordic countries to 2030.......................................... 9 Figure 1.1 • Stock of electric cars and per capita levels worldwide and in the Nordic
region, 2016 ............................................................................................................. 11 Figure 2.1 • Electric car stock in the Nordic countries, 2010-17 ................................................. 15 Figure 2.2 • New sales and market share of electric cars in the Nordic countries, 2012-17 ...... 16 Figure 2.3 • Share of BEVs in the electric car stock in the Nordic countries, 2012-17 ................ 17 Figure 2.4 • Model availability and market share of electric cars for each segment and EV
powertrain type, by country, in 2017 ....................................................................... 18 Figure 2.5 • Total purchase price for mid-size ICE, BEV and PHEV cars in the Nordic
countries, 2017 ........................................................................................................ 22 Figure 2.6 • Purchase price incentives, price gap and market share in the Nordic countries..... 24 Figure 2.7 • Purchase price in the upper market segment of ICE, BEV and PHEV models,
Denmark, 2015-17 .................................................................................................... 24 Figure 2.8 • Electric car owner profiles in Norway, 2013 and 2016 ............................................ 29 Figure 2.9 • Electric car use profiles in Norway, 2013 and 2016 ................................................. 30 Figure 2.10 • Perceived importance of Norway’s electric car support policies based on survey
results ....................................................................................................................... 31 Figure 3.1 • Number of charging outlets in the Nordic region, 2010-17 ..................................... 39 Figure 3.2 • Electric car stock and publicly available EVSE outlets, by type of charger and
country, 2017 ........................................................................................................... 39 Figure 3.3 • Ratio of publicly accessible EVSE outlets per electric car in the Nordic region,
2017.......................................................................................................................... 40 Figure 3.4 • Frequency of charging by EVSE category in Norway, 2014-17 ................................ 42 Figure 3.5 • Stakeholders and competencies in the EVSE value chain ........................................ 44 Figure 3.6 • Price ranges for a selection of charging practices in the Nordic region .................. 45 Figure 3.7 • Existing policies and regulations for EVSE development ......................................... 48 Figure 4.1 • Stakeholders in the Nordic power sector ................................................................ 57 Figure 4.2 • Power generation mix and CO₂ emissions per kWh by country and EU
average, 2015 ........................................................................................................... 59 Figure 4.3 • Well-to-wheel GHG intensity of a BEV compared to an ICE by country and EU,
2017.......................................................................................................................... 59 Figure 4.4 • Household electricity prices, including taxes, Q4 2016 ........................................... 60 Figure 4.5 • Total electricity consumption for EVs in the Nordic countries, 2017 ...................... 61 Figure 4.6 • Peak electricity demand in Norwegian houses (detached) with home charging .... 62 Figure 5.1 • Deployment scenario for the stock of electric cars by country to 2030 .................. 74 Figure 5.2 • Deployment scenario for publicly accessible charging outlets to 2030 ................... 76 Figure 5.3 • Total electricity consumption attributable to electric cars in the Nordic
countries, 2017 and 2030 ........................................................................................ 77 Figure 5.4 • GHG emissions from electric cars compared with ICEs in the Nordic countries,
2017-30 .................................................................................................................... 78 Figure 5.5 • Share of electricity demand by mode (cars, buses and minibuses) and GHG
emissions of electric or diesel powered buses and minibuses, in 2030 .................. 79

Nordic EV Outlook 2018 © OECD/IEA 2018 Insights from leaders in electric mobility
Page | 4 Page | 4 Page | 4 Page | 4 Page | 4 Page | 4 Page | 4 Page | 4 Page | 4 Page | 4 Page | 4 Page | 4 Page | 4 Page | 4 Page | 4 Page | 4 Page | 4 Page | 4 Page | 4 Page | 4 Page | 4 Page | 4 Page | 4 Page | 4 Page | 4 Page | 4 Page | 4 Page | 4
List of Tables
Table 2.1 • Overview of support policies for electric cars in the Nordic region, 2017 .............. 19 Table 2.2 • Incentives for electric car purchase in the Nordic region, 2017 ............................. 21 Table 2.3 • Influence of vehicle purchase taxes on the electric vehicle market structure ....... 23 Table 2.4 • Electric cars: circulation tax incentives in the Nordic region, 2017 ........................ 26 Table 3.1 • Characteristics of EVSE in the Nordic region ........................................................... 37 Table 3.2 • Pricing models used by selected public EV charging ............................................... 46 Table 3.3 • Overview of investment cost for chargers in Sweden, USD 2017 ........................... 47 Table 3.4 • Overview of EVSE policies in Nordic countries........................................................ 50 Table 5.1 • Decarbonisation goals, EV deployment targets and announced policies as of
end-2017 .................................................................................................................. 69 Table 5.2 • Overview of announced EVSE-related policy instruments in the Nordic
countries and the European Union ........................................................................ 71 Table 5.3 • National targets for EVSE deployment in the Nordic countries that are
members of the European Union............................................................................. 73
List of Boxes
Box 2.1 • Taxation on company cars: Focus on Sweden ......................................................... 25 Box 2.2 • Strong electric car uptake induced by local measures: Examples from Norway ..... 27 Box 2.3 • Electric buses in Nordic cities ................................................................................... 28 Box 2.4 • Finland’s Transport Services Act: a crucial step towards MaaS ............................... 32 Box 2.5 • Electric car-sharing schemes in Denmark ................................................................ 34 Box 3.1 • EVSE deployment strategy in Oslo ........................................................................... 54 Box 4.1 • Carbon intensity of electric cars............................................................................... 59 Box 5.1 • Sweden's Environmental Zones Programme ........................................................... 71 Box 5.2 • Impacts of bus electrification on electricity use and GHG emissions ...................... 78

© OECD/IEA 2018 Nordic EV Outlook 2018 Insights from leaders in electric mobility
Page | 5 Page | 5 Page | 5 Page | 5 Page | 5 Page | 5 Page | 5 Page | 5 Page | 5 Page | 5 Page | 5 Page | 5 Page | 5 Page | 5 Page | 5 Page | 5 Page | 5 Page | 5 Page | 5 Page | 5 Page | 5 Page | 5 Page | 5 Page | 5 Page | 5 Page | 5 Page | 5 Page | 5
Acknowledgements The Nordic EV Outlook was developed and prepared by the Energy Technology Policy (ETP) Division of the Directorate of Sustainability, Technology and Outlooks (STO) of the International Energy Agency (IEA), under the direction of Dave Turk, Acting Director of STO, and the guidance of Juho Lipponen, Acting Head of the ETP Division. Pierpaolo Cazzola co-ordinated this project.
This report was collectively developed by Pierpaolo Cazzola, Marine Gorner, Sacha Scheffer, Renske Schuitmaker and Jacopo Tattini. It benefitted from the support of Leonardo Paoli, Oskar Kvarnström, Simon Bennett, Emanuele Bianco and Rachel Boyd. Betrand Sadin assisted with the graphic design.
The work of the IEA team has been significantly supported by partners in the Nordic countries to collect data, provide analytical content and review the report, notably Martina Wikström (Sweden); Sigurður Friðleifsson (Iceland); Lasse Fridstrøm and Erik Figenbaum (Norway) and Martti Korkiakoski (Finland).
Data collection and content development were also supported by: Jens Christian Lodberg Høj, Mick Franke Andersen and Niels Frees (Insero); Lisa Bjergbakke (Danish Ministry for Energy, Utilities and Climate); Michael Rask (Raskgreentech ApS); Friðrik Hjörleifsson (Icelandic Transport Authority); Laerke Flader and Søren Jakobsen (Dansk Elbil Alliance); Asbjørn Johnsen (Norwegian Public Roads Administration); Valgerður Guðmundsdóttir (European Free Trade Association); Markus Wråke (Energiforsk); Petter Haugneland (Norwegian EV Association); Sigurður H. Magnússon (Icelandic Energy Agency); Karl Hillman (University of Gävle); Shveta Soam (University of Gävle); Lena Kitzing and Stefan Petrovic (Technical University of Denmark [DTU]); Kirsta Huhtala-Jenks (Finnish Ministry of Transport and Communications); Eija Laineenoja and Pentti Puhakka (Finnish Ministry of Employment and Economics); Bert Witkamp (European Alternative Fuels Observatory [EAFO]).
Relevant stakeholders in the public and private sectors have been interviewed in order to understand their various roles in the electric vehicle (EV) value chain as well as to gather specific insights on EV markets and policies. The individuals interviewed include: Odd-Even Bustnes (Tesla); Juha Stenberg (Ensto); Jussi Palola (Virta); Elia Pöyry (Liikennevirta); Sture Portvik (City of Oslo); Peter Bach Andersen (DTU); Ronja Helleshøj Sørensen and Kathrine Fjendbo Jørgensen (Capital Region of Denmark); Peter Kjaer Hansen (Dansk Energi); Laerke Flader (Dansk Elbil Alliance); Johan Christian Hofland (Hafslund AS); Thomas Daiber (Hubject); Jan Haugen Ihle (Ionity); Trond Thrønbjørnsen (Lyse Energy); Robert Lujan (Nissan); Petter Haugneland (Norwegian EV Association); Christer Skotland and Dag Spilde (Norwegian Water Resources and Energy Directorate); Olle Johansson (PowerCircle); Michael Molitor (Uniti); Prof. Dr. Henk Meurs (Radboud University of Nijmegen); Lars Ström (Swedish Energy Markets Inspectorate) and Robert Granström (Test Site Sweden).
Peer reviewers provided essential feedback to improve the quality of the report. They include: Johanna Hofmann (Hubject); Lisa Bjergbakke (Danish Ministry for Energy, Utilities and Climate); Peter Bach Andersen (DTU); Alexander Körner (United Nations Environment Programme), Christer Skotland and Kjersti Ness (Norwegian Water Resources and Energy Directorate); Svend Søyland and Kevin Johnsen (Nordic Energy Research); Ronja Helleshøj Sørensen and Kathrine Fjendbo Jørgensen (Capital Region of Denmark); Matteo Muratori (US National Renewable Energy Laboratory); Tali Trigg (German Society for International Cooperation); Harm Weken (FIER Automotive B.V.); Bert Witkamp (EAFO); Asbjørn Johnsen

Nordic EV Outlook 2018 © OECD/IEA 2018 Insights from leaders in electric mobility
Page | 6 Page | 6 Page | 6 Page | 6 Page | 6 Page | 6 Page | 6 Page | 6 Page | 6 Page | 6 Page | 6 Page | 6 Page | 6 Page | 6 Page | 6 Page | 6 Page | 6 Page | 6 Page | 6 Page | 6 Page | 6 Page | 6 Page | 6 Page | 6 Page | 6 Page | 6 Page | 6 Page | 6
(Norwegian Public Roads Administration); Anders Lewald (Swedish Energy Agency); Mikkel Bosack (DTU); Erik Lorentzen (Norwegian EV Association) and Caroline Watson (C40 Cities).
The development of this report was facilitated by targeted funding from Nordic Energy Research and the budget generated by country contributions to the IEA for the coordination of the Electric Vehicles Initiative.

© OECD/IEA 2018 Nordic EV Outlook 2018 Insights from leaders in electric mobility
Page | 7
Page | 7
Page | 7
Page | 7
Page | 7
Page | 7
Page | 7
Page | 7
Page | 7
Page | 7
Page | 7
Page | 7
Page | 7
Page | 7
Page | 7
Page | 7
Page | 7
Page | 7
Page | 7
Page | 7
Page | 7
Page | 7
Page | 7
Page | 7
Page | 7
Page | 7
Page | 7
Page | 7
Executive summary
Recent developments in electric mobility
Electric cars
In the Nordic region – Denmark, Finland, Iceland, Norway and Sweden – the stock of electric cars has been expanding steadily since 2010.1 It reached almost 250 000 cars by the end of 2017 and accounted for roughly 8% of the global total of electric vehicles (EVs) in 2016. The Nordic region has one of the highest ratios of electric cars per capita in the world.
In 2017, the sales of new electric cars in the Nordic region reached around 90 000, up 57% from the previous year and setting a new record in absolute terms. The market shares of electric cars of the Nordic countries are amongst the highest globally, and the average for the region is 10.6%. Taken together, the Nordic countries represent the third-largest electric car market by sales volume in the world, after the People’s Republic of China (hereafter “China”) and the United States.
Figure E.1 • Number of electric cars, new sales and market share in Nordic countries, 2010-17
Notes: BEV = battery electric vehicle; PHEV = plug-in hybrid electric vehicle. The electric car stock shown here is primarily estimated on the basis of cumulative sales since 2005. When available, stock numbers from official national statistics have been used, provided good consistency with sales evolution.
Sources: IEA analysis based on country submissions, complemented with ACEA (2017a, 2017b); Autoalan tiedotuskeskus (2017); EAFO (2017); EEA (2017); and Insero (2017).
Key point: The stock of electric cars in the Nordic region increased since 2010, with over 70% of the region's stock being located in Norway. Four of the five Nordic countries have a market share above 2%, and all are experiencing a progression of PHEV market shares.
1 Electric cars include battery electric vehicles (BEV), plug-in hybrid electric vehicles (PHEV) and fuel cell electric vehicles (FCEV) in the category of passenger light-duty vehicles (PLDVs). BEVs and PHEVs are the majority of electric cars in use today in the Nordic region and are the focus of this report.
0%
20%
40%
60%
80%
100%
0
12
24
36
48
60
72
2012
2017
2012
2017
2012
2017
2012
2017
2012
2017
Mar
ket
shar
e
New
ele
ctric
car
sal
es [t
hous
ands
] Marketshare ofelectriccars
PHEVmarketshare inthe total ofelectriccars
0
50
100
150
200
250
2010 2011 2012 2013 2014 2015 2016 2017
Elec
tric
car
sto
ck (t
hous
ands
) Denmark
Finland
Iceland
Norway
Sweden
BEV
BEV + PHEV
Nordic EV Outlook 2018 © OECD/IEA 2018 Insights from leaders in electric mobility
Page | 8 Page | 8 Page | 8 Page | 8 Page | 8 Page | 8 Page | 8 Page | 8 Page | 8 Page | 8 Page | 8 Page | 8 Page | 8 Page | 8 Page | 8 Page | 8 Page | 8 Page | 8 Page | 8 Page | 8 Page | 8 Page | 8 Page | 8 Page | 8 Page | 8 Page | 8 Page | 8 Page | 8
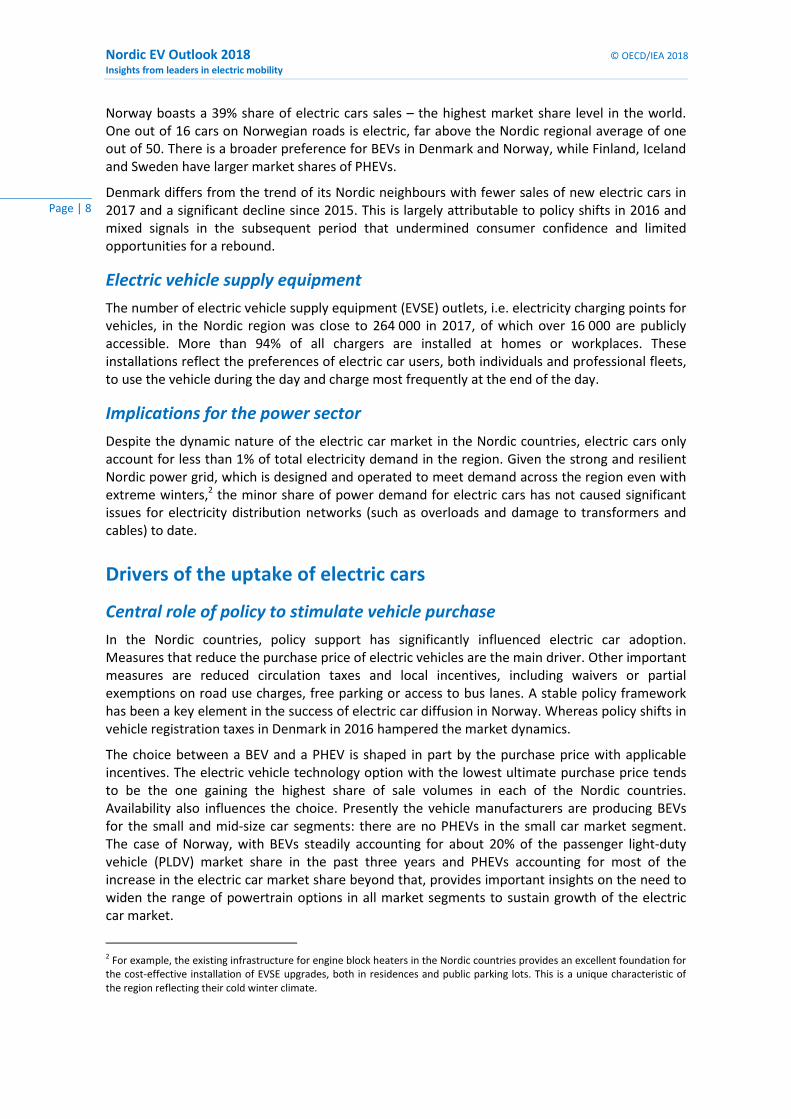
Norway boasts a 39% share of electric cars sales – the highest market share level in the world. One out of 16 cars on Norwegian roads is electric, far above the Nordic regional average of one out of 50. There is a broader preference for BEVs in Denmark and Norway, while Finland, Iceland and Sweden have larger market shares of PHEVs.
Denmark differs from the trend of its Nordic neighbours with fewer sales of new electric cars in 2017 and a significant decline since 2015. This is largely attributable to policy shifts in 2016 and mixed signals in the subsequent period that undermined consumer confidence and limited opportunities for a rebound.
Electric vehicle supply equipment
The number of electric vehicle supply equipment (EVSE) outlets, i.e. electricity charging points for vehicles, in the Nordic region was close to 264 000 in 2017, of which over 16 000 are publicly accessible. More than 94% of all chargers are installed at homes or workplaces. These installations reflect the preferences of electric car users, both individuals and professional fleets, to use the vehicle during the day and charge most frequently at the end of the day.
Implications for the power sector
Despite the dynamic nature of the electric car market in the Nordic countries, electric cars only account for less than 1% of total electricity demand in the region. Given the strong and resilient Nordic power grid, which is designed and operated to meet demand across the region even with extreme winters,2 the minor share of power demand for electric cars has not caused significant issues for electricity distribution networks (such as overloads and damage to transformers and cables) to date.
Drivers of the uptake of electric cars
Central role of policy to stimulate vehicle purchase
In the Nordic countries, policy support has significantly influenced electric car adoption. Measures that reduce the purchase price of electric vehicles are the main driver. Other important measures are reduced circulation taxes and local incentives, including waivers or partial exemptions on road use charges, free parking or access to bus lanes. A stable policy framework has been a key element in the success of electric car diffusion in Norway. Whereas policy shifts in vehicle registration taxes in Denmark in 2016 hampered the market dynamics.
The choice between a BEV and a PHEV is shaped in part by the purchase price with applicable incentives. The electric vehicle technology option with the lowest ultimate purchase price tends to be the one gaining the highest share of sale volumes in each of the Nordic countries. Availability also influences the choice. Presently the vehicle manufacturers are producing BEVs for the small and mid-size car segments: there are no PHEVs in the small car market segment. The case of Norway, with BEVs steadily accounting for about 20% of the passenger light-duty vehicle (PLDV) market share in the past three years and PHEVs accounting for most of the increase in the electric car market share beyond that, provides important insights on the need to widen the range of powertrain options in all market segments to sustain growth of the electric car market.
2 For example, the existing infrastructure for engine block heaters in the Nordic countries provides an excellent foundation for the cost-effective installation of EVSE upgrades, both in residences and public parking lots. This is a unique characteristic of the region reflecting their cold winter climate.

© OECD/IEA 2018 Nordic EV Outlook 2018 Insights from leaders in electric mobility
Page | 9
Page | 9
Page | 9
Page | 9
Page | 9
Page | 9
Page | 9
Page | 9
Page | 9
Page | 9
Page | 9
Page | 9
Page | 9
Page | 9
Page | 9
Page | 9
Page | 9
Page | 9
Page | 9
Page | 9
Page | 9
Page | 9
Page | 9
Page | 9
Page | 9
Page | 9
Page | 9
Page | 9
Influence of consumer preferences on charging practices and availability
Consumer practices in the Nordic countries suggest that EVSE (charging infrastructure) policies are secondary to those that provide economic incentives for the purchase of electric cars. Surveys indicate strong consumer preference for home charging. Early adopters of electric cars often have access to parking that can be equipped with a charging point. While the current use of publicly available charging outlets is fairly low, public charging points should be seen as an important part of the ecosystem of charging infrastructure, as they ensure interregional access and are essential for electric car owners that do not have access to a reserved parking place.
Outlook to 2030
Electric cars
The policy ambition of the Nordic region – demonstrated by commitments to decarbonise the energy system, targets for EV deployment and specific announcements on the continuation or the strengthening of related policy measures over the next few years – suggest that the electric car fleet in Nordic countries will grow significantly. Figure E.2 shows the projections for electric cars by country in the period to 2030.
Figure E.2 • Outlook for electric cars in the Nordic countries to 2030
Key point: Based on current market development, announced policies and climate ambitions in the five Nordic countries, the electric car stock is projected to reach 4 million units by 2030.
By 2030, it is projected that 4 million electric cars will be on the road in the region, implying more than a 15-fold growth of the electric car stock from 2017 volumes. Norway and Sweden are leading this growth accounting for 80% of the region’s total EV stock in 2030. This reflects the large PLDV stock shares (65% of the region’s total) in these two countries today, as well as the stated ambition of Norway to have only sales of zero-emission cars as from 2025.
This outlook assumes that existing decarbonisation goals and EV deployment targets are met. The technology deployment needed in this context is likely to require a progressive transition from economic incentives for electric vehicle purchases towards regulatory measures that de-risk original equipment manufacturers’ (OEMs) investments in electric technologies and foster cost
0.0
0.5
1.0
1.5
2.0
2.5
3.0
3.5
4.0
4.5
2010 2015 2020 2025 2030
Elec
tric
car
s (m
illio
ns)
Sweden
Norway
Iceland
Finland
Denmark

Nordic EV Outlook 2018 © OECD/IEA 2018 Insights from leaders in electric mobility
Page | 10 Page | 10 Page | 10 Page | 10 Page | 10 Page | 10 Page | 10 Page | 10 Page | 10 Page | 10 Page | 10 Page | 10 Page | 10 Page | 10 Page | 10 Page | 10 Page | 10 Page | 10 Page | 10 Page | 10 Page | 10 Page | 10 Page | 10 Page | 10 Page | 10 Page | 10 Page | 10 Page | 10
reductions. The development of mobility-as-a-service (MaaS) would also help making progress towards the targets.3 Further, this scenario factors in the need for road pricing to compensate a decline in government revenues from fuel taxes and accounts for a situation where the publicly available charging outlets are operated in a manner that ensures full recover of investment cost.
Charging outlets
Along with the outlook for 4 million electric cars in 2030 in the Nordic countries is a projection of 290 000 publicly accessible charging outlets across the region. This projection assumes that the countries with the highest market shares of electric cars today (Norway, Iceland and Sweden) maintain a similar ratio of publicly accessible charging outlets per car – one per 19, 45 and 12 cars, respectively – over the period to 2030. The ratio of electric cars to chargers decreases in Denmark and Finland to one charger per 10 electric cars (in line with the European directive recommendations on the deployment of alternative fuels infrastructure). Using various assumptions for the EVSE per electric car ratios, and in particular assuming rates similar to the current values observed in Norway, or equal to those set out in the European Union directive, yields a range of 210 000 – 400 000 charging outlets in the period to 2030.
Power demand
The estimated power demand to serve the 4 million electric cars in 2030 is around 9 terawatt-hours (TWh) for the Nordic region. This is equivalent to about 2-3% of estimated electricity demand for the region in 2030.
This increase in electricity demand will need to be adequately addressed in planning and operation of the grids, especially at the distribution level. Demand management, including delayed or modulated charging, dynamic electricity pricing and, possibly, vehicle-to-grid technologies can be instrumental to limit the need for grid upgrades, while also supporting the integration of larger shares of variable renewable energy sources.
Greenhouse gas emissions
While climate change mitigation is not an intrinsic feature of electric mobility due to its upstream emissions (complementing its zero-emission profile at the tailpipe), the climate mitigation potential of electric vehicles in the Nordic region is very significant. The key elements of this are the better efficiency of electric cars compared with internal combustion engine (ICE) vehicles, the low-carbon intensity of the Nordic electricity system and policy actions to continue to reduce the carbon intensity of the power supply. Consequently, it is estimated that the use of 4 million electric cars in 2030 in the Nordic countries would emit 0.2 million tonnes of carbon-dioxide equivalent (MtCO2-eq). This value is 40 times less than the emissions from the same number of ICE cars, which would emit 8.4 MtCO2-eq in 2030.
3 These services are characterised by high utilisation rates of vehicles and therefore high mileage. They can benefit significantly by vehicle electrification to reduce operational costs owing to their high efficiency.
© OECD/IEA 2018 Nordic EV Outlook 2018 Insights from leaders in electric mobility
Page | 11
Page | 11
Page | 11
Page | 11
Page | 11
Page | 11
Page | 11
Page | 11
Page | 11
Page | 11
Page | 11
Page | 11
Page | 11
Page | 11
Page | 11
Page | 11
Page | 11
Page | 11
Page | 11
Page | 11
Page | 11
Page | 11
Page | 11
Page | 11
Page | 11
Page | 11
Page | 11
Page | 11
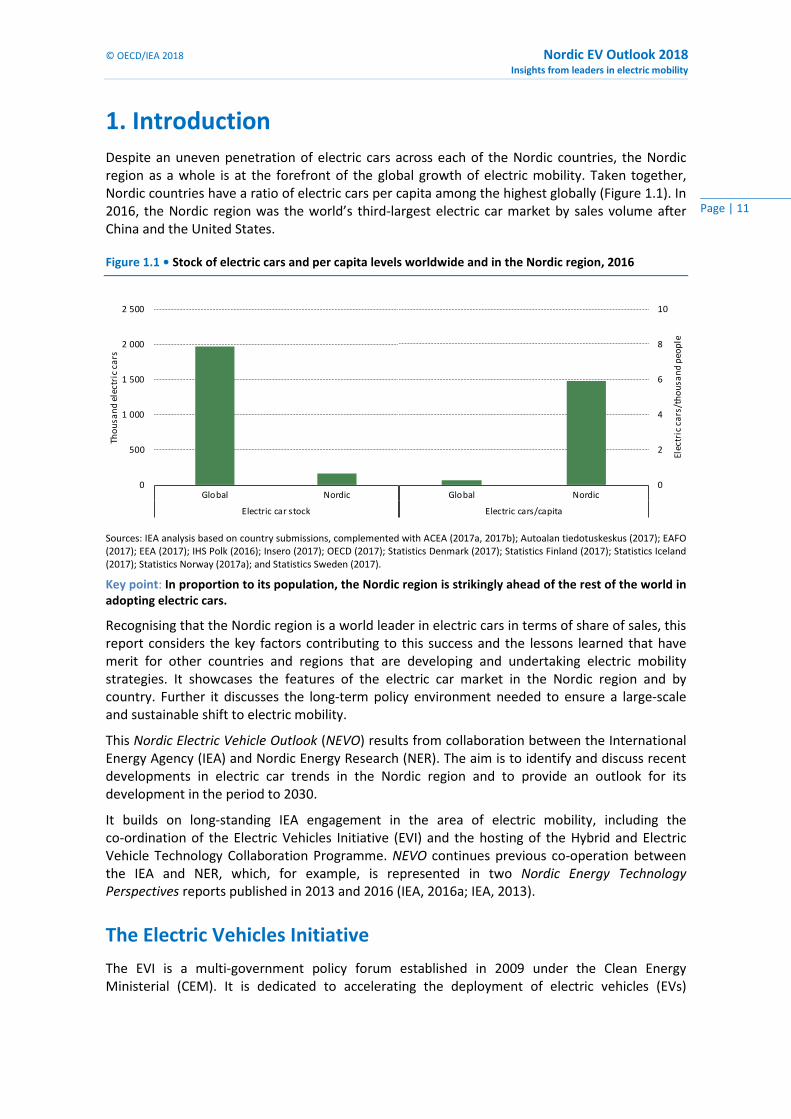
1. Introduction Despite an uneven penetration of electric cars across each of the Nordic countries, the Nordic region as a whole is at the forefront of the global growth of electric mobility. Taken together, Nordic countries have a ratio of electric cars per capita among the highest globally (Figure 1.1). In 2016, the Nordic region was the world’s third-largest electric car market by sales volume after China and the United States.
Figure 1.1 • Stock of electric cars and per capita levels worldwide and in the Nordic region, 2016
Sources: IEA analysis based on country submissions, complemented with ACEA (2017a, 2017b); Autoalan tiedotuskeskus (2017); EAFO (2017); EEA (2017); IHS Polk (2016); Insero (2017); OECD (2017); Statistics Denmark (2017); Statistics Finland (2017); Statistics Iceland (2017); Statistics Norway (2017a); and Statistics Sweden (2017).
Key point: In proportion to its population, the Nordic region is strikingly ahead of the rest of the world in adopting electric cars.
Recognising that the Nordic region is a world leader in electric cars in terms of share of sales, this report considers the key factors contributing to this success and the lessons learned that have merit for other countries and regions that are developing and undertaking electric mobility strategies. It showcases the features of the electric car market in the Nordic region and by country. Further it discusses the long-term policy environment needed to ensure a large-scale and sustainable shift to electric mobility.
This Nordic Electric Vehicle Outlook (NEVO) results from collaboration between the International Energy Agency (IEA) and Nordic Energy Research (NER). The aim is to identify and discuss recent developments in electric car trends in the Nordic region and to provide an outlook for its development in the period to 2030.
It builds on long-standing IEA engagement in the area of electric mobility, including the co-ordination of the Electric Vehicles Initiative (EVI) and the hosting of the Hybrid and Electric Vehicle Technology Collaboration Programme. NEVO continues previous co-operation between the IEA and NER, which, for example, is represented in two Nordic Energy Technology Perspectives reports published in 2013 and 2016 (IEA, 2016a; IEA, 2013).
The Electric Vehicles Initiative
The EVI is a multi-government policy forum established in 2009 under the Clean Energy Ministerial (CEM). It is dedicated to accelerating the deployment of electric vehicles (EVs)
0
500
1 000
1 500
2 000
2 500
Global Nordic
Electric car stock
Thou
sand
ele
ctri
c ca
rs
0
2
4
6
8
10
NordicGlobal
Electric cars/capita
Elec
tric
car
s/th
ousa
nd p
eopl
e

Nordic EV Outlook 2018 © OECD/IEA 2018 Insights from leaders in electric mobility
Page | 12 Page | 12 Page | 12 Page | 12 Page | 12 Page | 12 Page | 12 Page | 12 Page | 12 Page | 12 Page | 12 Page | 12 Page | 12 Page | 12 Page | 12 Page | 12 Page | 12 Page | 12 Page | 12 Page | 12 Page | 12 Page | 12 Page | 12 Page | 12 Page | 12 Page | 12 Page | 12 Page | 12
worldwide. At the end of 2017, the EVI included 13 member governments:1 Canada, China, Finland, France, Germany, India, Japan, Mexico, Netherlands, Norway, Sweden, United Kingdom and United States. Currently, Canada, China and the United States2 co-lead the EVI. Collectively, EVI members account for most of the global EV sales and stock and include the largest and most rapidly growing EV markets worldwide. The IEA serves as EVI co-ordinator.
The EV30@30 campaign
The EV30@30 campaign, launched at the Eighth Clean Energy Ministerial in June 2017, redefined the EVI ambition by setting a collective aspirational goal of a 30% market share for electric vehicles in the total of all passenger cars, light commercial vehicles, buses and trucks by 2030. The EV30@30 campaign is supported by 13 of the EVI members: Canada, China, Finland, France, India, Japan, Mexico, Netherlands, Norway and Sweden. The campaign includes several implementing actions to help achieve this goal in accordance with the priorities and programmes developed in each EVI country. These actions include:
• Supporting the deployment of charging infrastructure and tracking progress.
• Fostering public and private sector commitments for EV uptake in company and supplier fleets.
• Scaling up policy research, including policy efficacy analysis, information and experience sharing, as well as capacity building.
• Establishing the Global EV Pilot City Programme, a global co-operative programme to facilitate the exchange of experiences and the replication of best practices for the promotion of EVs in the urban environment.
Nordic Energy Research
NER is a regional platform for co-operative energy research and policy development under the auspices of Nordic Council of Ministers. NER is based in Oslo, together with its sister organisations Nordforsk and Nordic Innovation. Nordic co-operation in energy research started in 1975, leading to common research funding since 1985 and the establishment of NER as an institution under the Nordic Council of Ministers in 1999. The governance structure of NER is closely connected to both the national governments of the five Nordic countries as well as the intergovernmental Nordic system. NER manages numerous projects and facilitates Ministerial working groups that provide input to energy technology policy making in the region.
NER funds research that is of shared Nordic interest and that supports the region’s ambition to reduce carbon emissions and dependence on fossil fuels, and to create new growth industries based on green technology. It does so by expanding knowledge on sustainable energy and contributing to the development of new and competitive energy solutions.
NER has been supporting research at the intersection of transport, energy and environment since its inception. In particular, NER funded research on electro-fuels, biofuels, fuel cells and electric transport. Projects funded by NER cover various modes of transport, including aviation, heavy freight, maritime transport, public transport and personal electric vehicles. Selected examples of activities supported by NER include:
1 In addition to the 13 member governments, Chile is currently undergoing accession to EVI. 2 The role of the United States as co-lead of the EVI has been under review since early 2017.
© OECD/IEA 2018 Nordic EV Outlook 2018 Insights from leaders in electric mobility
Page | 13
Page | 13
Page | 13
Page | 13
Page | 13
Page | 13
Page | 13
Page | 13
Page | 13
Page | 13
Page | 13
Page | 13
Page | 13
Page | 13
Page | 13
Page | 13
Page | 13
Page | 13
Page | 13
Page | 13
Page | 13
Page | 13
Page | 13
Page | 13
Page | 13
Page | 13
Page | 13
Page | 13
• The Nordic EV Summit, co-organised by NER since 2016 to gather members of the automobile industry, Nordic ministers, representatives from the Nordic EV industry, researchers and others to discuss electric mobility.
• The Shift project, aiming to develop and apply tools that integrate poorly understood factors – modal shifts, fuel options, new business models and consumer behaviour – into scenario modelling and carry out in-depth analysis of the two key areas of long-haul freight and urban passenger transport. The project is led by the Swedish Environmental Research Institute (IVL) and involves the Technical University of Denmark (DTU), the Norwegian Institute of Transport Economics (TØI), and Victoria information and communication technology research institute.
• The Nordic Energy Technology Perspectives 2016 (IEA, 2016a) and Nordic Energy Technology Perspectives 2013 (IEA, 2013), the Nordic editions of the IEA’s Energy Technology Perspectives, offering detailed scenario-based analysis of how the Nordic countries can achieve a near carbon-neutral energy system.
• Targeted seminars on Nordic Electric Bus Initiatives in Gothenburg and Stockholm, aiming to bring together representatives from public transport authorities, traffic operators, manufacturers, private stakeholders and academia for an informative best-practice sharing event on Nordic electric bus initiatives.
• The Energy and Transport Programme, from 2010 to 2014 which aimed to support the Nordic region a leading region in Europe for developing, demonstrating and using new, sustainable energy technologies in the transportation sector.
• The promotion of the market introduction of fuel-cell electric vehicles and hydrogen refuel infrastructure, in co-operation with the Scandinavian Hydrogen Highway Partnership.
Scope
This main focus of this report is the electric car market in the five Nordic countries. This focus is due to the dynamism of the region’s electric car market and the wider availability of data for this vehicle group. Targeted information on electric buses complement the view of electric cars.
NEVO is structured around market and policy observations in the electric mobility sector, starting with an overview of the electric car market in the Nordic region from 2010 to 2017. The subsequent chapters provide insights and analyses on the deployment of charging infrastructure and the interaction between EVs and electricity networks in the region. The report reviews policies and business models that help to shape the various components of this market, with a view to provide insights on the factors that deliver achievements and lessons learned. It also includes an assessment of future developments for electric cars in the Nordic region, taking into account of the strong policy commitments already in place.
Data sources
The main sources of statistical information used in this report include submissions from the NEVO country partners, statistics and indicators available from the European Alternative Fuels Observatory (EAFO,2017) and data extracted from information released by relevant

Nordic EV Outlook 2018 © OECD/IEA 2018 Insights from leaders in electric mobility
Page | 14 Page | 14 Page | 14 Page | 14 Page | 14 Page | 14 Page | 14 Page | 14 Page | 14 Page | 14 Page | 14 Page | 14 Page | 14 Page | 14 Page | 14 Page | 14 Page | 14 Page | 14 Page | 14 Page | 14 Page | 14 Page | 14 Page | 14 Page | 14 Page | 14 Page | 14 Page | 14 Page | 14
stakeholders (ACEA, 2017a, 2017b; EEA, 2017; Insero, 2017; OICA, 2017; Autoalan tiedotuskeskus, 2017; Flader, 2017; and Nobil, 2017).
Information on policy details was collected via questionnaires completed by NEVO country partners, complemented by insights collected in a series of interviews with stakeholders from the private and public sector, as well as desk research by the IEA.

© OECD/IEA 2018 Nordic EV Outlook 2018 Insights from leaders in electric mobility
Page | 15
Page | 15
Page | 15
Page | 15
Page | 15
Page | 15
Page | 15
Page | 15
Page | 15
Page | 15
Page | 15
Page | 15
Page | 15
Page | 15
Page | 15
Page | 15
Page | 15
Page | 15
Page | 15
Page | 15
Page | 15
Page | 15
Page | 15
Page | 15
Page | 15
Page | 15
Page | 15
Page | 15
2. Electric car market in the Nordic countries This section discusses trends in new electric car sales, market shares and stock of electric cars in the Nordic region in the period 2010-17. It provides a review of the main stakeholders involved in the region’s electric car market and highlights the key market features of each of the five countries. Recent developments in electric car uptake are assessed against national and local policy frameworks, in an attempt to identify best practices as well as areas with potential for improvement. This section also looks at end-user preferences and public perception of electric cars, and business models that have emerged in the electric mobility sector.
Electric car stock
The electric car stock in the Nordic region has been on the upswing since 2010 to reach 247 000 cars by end-2017 (Figure 2.1). The growth rate of the electric car stock was 57% in 2017, down from 69% in 2016.
Figure 2.1 • Electric car stock in the Nordic countries, 2010-17
Notes: The electric car stock shown here is primarily estimated on the basis of cumulative sales since 2005. When available, stock numbers from official national statistics have been used, provided good consistency with sales evolution.
Sources: IEA analysis based on country submissions, complemented by ACEA (2017a, 2017b); Autoalan tiedotuskeskus (2017); EAFO (2017); EEA (2017); and Insero (2017).
Key point: The stock of electric cars in the Nordic region increased since 2010, with over 70% of the region's stock being located in Norway.
With 176 000 electric cars in 2017, Norway accounts for 70% of the stock of electric cars in the Nordic region. Reflecting its leadership and effective support of electric car deployment, one-out-of-16 cars on Norwegian roads is electric, far beyond the one-out-of-50 level of the overall Nordic region. Sweden has more than 49 000 electric cars in circulation and accounts for 20% of the
0
50
100
150
200
250
2010 2011 2012 2013 2014 2015 2016 2017
Elec
tric
car
sto
ck (t
hous
ands
) Denmark
Finland
Iceland
Norway
Sweden
BEV
BEV + PHEV
0
20
40
60
80
100
120
140
160
2010 2011 2012 2013 2014 2015 2016 2017
Elec
tric
car
sto
ck (t
hous
ands
)
BEV
2010 2011 2012 2013 2014 2015 2016 2017
PHEV

Nordic EV Outlook 2018 © OECD/IEA 2018 Insights from leaders in electric mobility
Page | 16 Page | 16 Page | 16 Page | 16 Page | 16 Page | 16 Page | 16 Page | 16 Page | 16 Page | 16 Page | 16 Page | 16 Page | 16 Page | 16 Page | 16 Page | 16 Page | 16 Page | 16 Page | 16 Page | 16 Page | 16 Page | 16 Page | 16 Page | 16 Page | 16 Page | 16 Page | 16 Page | 16
total Nordic stock. Despite a decline in sales in 2016 and 2017, Denmark has the third-largest electric car stock in the Nordic region, with 9 900 vehicles. This is roughly double the number in Finland and Iceland (6 300 and 5 100, respectively). The uptake of electric vehicles other than cars has been limited in the Nordic region. To date, there are around 104 electric buses on Nordic roads, mostly in early commercial deployment.
New electric car sales
New electric cars sales1 in the Nordic region reached almost 90 000 in 2017, up 43% from 2016, and hitting a new record in absolute numbers of new sales. The increase in electric car sales is almost double, in absolute numbers, if compared with one year earlier.
Electric car sales and their market shares are not evenly distributed across the Nordic region (Figure 2.2):
• Norway is by far the largest Nordic market for electric cars, accounting for 69% of the regional total sold in 2017 (62 300 vehicles), thanks to a record high 39% market share.
• Sweden, where electric cars accounted for 6.3% of the new sales in 2017, is the second-largest national market with 20 300 electric cars registered.
• It is followed by Iceland and Finland, where electric car sales witnessed a significant growth in 2016 and 2017. In Iceland, the share of electric cars reached 11.7% in 2017, more than doubling compared with the 5.6% of 2016 and confirming Iceland as the Nordic market with the second-highest electric car share after Norway. In Finland electric cars had a 2.6% market share in 2017.
• Electric car sales declined significantly in Denmark after 2015. By 2017, Denmark was the Nordic country with the lowest number of new electric cars registered (1 200) and the lowest market share (0.6%).
Figure 2.2 • New sales and market share of electric cars in the Nordic countries, 2012-17
Note: For Denmark and Norway, historical data on new electric car sales have been revised here with respect to IEA (2017a).
Sources: IEA analysis based on country submissions, complemented with ACEA (2017a, 2017b); Autoalan tiedotuskeskus (2017); EAFO (2017); EEA (2017); and Insero (2017).
Key point: Electric cars have a market share above 2% in four Nordic countries, with Norway leading in both volume and market share. The preference for BEVs or PHEVs is not uniform across the countries but all are experiencing a progression of PHEV market shares.
1 Throughout the entire publication, sales exclude second-hand imports.
0%
20%
40%
60%
80%
100%
0
12
24
36
48
60
72
2012
2017
2012
2017
2012
2017
2012
2017
2012
2017
Mar
ket s
hare
New
ele
ctri
c ca
r sa
les
[tho
usan
ds]
Denmark
Finland
Iceland
Norway
Sweden
Market share ofelectric cars
PHEV marketshare in the totalof electric cars

© OECD/IEA 2018 Nordic EV Outlook 2018 Insights from leaders in electric mobility
Page | 17
Page | 17
Page | 17
Page | 17
Page | 17
Page | 17
Page | 17
Page | 17
Page | 17
Page | 17
Page | 17
Page | 17
Page | 17
Page | 17
Page | 17
Page | 17
Page | 17
Page | 17
Page | 17
Page | 17
Page | 17
Page | 17
Page | 17
Page | 17
Page | 17
Page | 17
Page | 17
Page | 17
Electric vehicle technology choices
EV technology choice is not uniform across the Nordic electric car markets. In 2017, BEVs accounted for more than half of the electric car sales in Denmark (56%) and in Norway (53%). PHEVs were the first choice in Sweden (79%), Finland (84%) and Iceland (72%) in the same year. This is consistent with the characteristics of the best-selling models in each of the Nordic countries: Renault Zoe (BEV) in Denmark, Mercedes GLC (PHEV) in Finland, Mitsubishi Outlander (PHEV) in Iceland, Volkswagen e-Golf (BEV) in Norway and Volkswagen Passat (PHEV) in Sweden (Insero, 2018; BNEF, 2017).
The market share of PHEVs is increasing at a faster rate than that of BEVs in each Nordic country. In Norway, BEVs stabilised at about 20% of the total market, and most of the incremental growth of electric cars achieved in the past two years in terms of market share is due to PHEVs (Haugneland et al., 2016). The share of PHEVs in total car sales in Norway increased from 5% in 2015 to 18% in 2017. In the Nordic region, BEV models are most popular in the small vehicle size segment of the market, while PHEVs are more popular for larger car models. This follows the availability of electric car models on the Nordic market, with wider availability of small model BEVs, while PHEVs shares are on the rise as their availability expands (in 2013-15, few PHEVs models were available).
Between 2013 and 2017, the stock share of PHEVs increased from 14% to 43% in the region (Figure 2.3). In Norway, a larger share of BEV sales prior to 2016 led to an electric car stock composed of 66% of BEVs in 2017. Recent changes in Norway’s market and incentive structures that are leading to a growing share of PHEVs, as well as increasing electric car sales in the Icelandic, Finnish and Swedish markets, which tend to PHEVs, are pushing up the proportion of PHEVs in the region’s electric car stock.
Figure 2.3 • Share of BEVs in the electric car stock in the Nordic countries, 2012-17
Sources: IEA analysis based on country submissions, complemented with ACEA (2017a, 2017b); Autoalan tiedotuskeskus (2017); EAFO (2017); EEA (2017); and Insero (2017, 2018).
Key point: On a regional basis, the share of BEVs in the electric car stock is declining.
0%
10%
20%
30%
40%
50%
60%
70%
80%
90%
100%
2012 2013 2014 2015 2016 2017
Shar
e of
BEV
s in
the
EV s
tock
Denmark
Finland
Iceland
Norway
Sweden
Nordicregion

Nordic EV Outlook 2018 © OECD/IEA 2018 Insights from leaders in electric mobility
Page | 18 Page | 18 Page | 18 Page | 18 Page | 18 Page | 18 Page | 18 Page | 18 Page | 18 Page | 18 Page | 18 Page | 18 Page | 18 Page | 18 Page | 18 Page | 18 Page | 18 Page | 18 Page | 18 Page | 18 Page | 18 Page | 18 Page | 18 Page | 18 Page | 18 Page | 18 Page | 18 Page | 18
Model availability
In 2016, only 20 BEV models were available in the broad European market, compared to 417 ICE car models (Transport and Environment, 2017). In the Nordic region, Norway’s market had the highest number of available BEV and PHEV models (Figure 2.4), suggesting that OEMs tend to follow consumer demand rather than to proactively create an offer for electric cars (Transport and Environment, 2017). While electric cars in Iceland are expanding their share of the market, Iceland offers the fewest model choices among the Nordic countries suggesting that market size and geographical location influence availability of electric car models.2
Figure 2.4 • Model availability and market share of electric cars for each segment and EV powertrain type, by country, in 2017
Notes: The categories include the car segments: small cars: A, B; mid-size cars: C; large cars: D, E; and SUVs: J. Shading in the boxes reflects the market share (in a scale from 0 to 100%, in each box) of electric cars for each EV powertrain type, each market segment and each country. Numerical values in the boxes reflect the number of models available in the same categories.
Sources: IEA analysis based on data from Insero (2018) and, for Iceland, BNEF (2017).
Key point: BEVs are almost exclusively found among small and mid-size models. PHEVs dominate the larger models segment. Higher market shares are observed where more models are available.
The electric car models available in the Nordic region do not cover all PLDV market segments. BEV models are almost exclusively in the small and mid-size car segments, while PHEV models are absent from this segment. The concentration of BEVs in the small car segments reflects their general use for short distance and commuter trips, and the additional cost for large battery capacity needed for larger electric cars which may be used more frequently for longer distance trips. The reason why PHEVs models are not found in the small car segment is likely due to the increased complexity and associated cost in developing dual powertrains on small cars, when their relatively low fuel economy and typical daily range allow for reasonable battery sizes and thus a single electric powertrain. Norway, a much more mature electric car market than its 2 Selected examples illustrate the model availability and consumer demand situation in Iceland. The 2017 model of the Nissan Leaf was not available. The Hyundai Ionic arrived later than in other markets and supply shortages were observed very quickly. Car buyers in Iceland are reacting to supply delays and limited model availability by importing second-hand electric cars from other countries (Friðleifsson, 2017).
© OECD/IEA 2018 Nordic EV Outlook 2018 Insights from leaders in electric mobility
Page | 19
Page | 19
Page | 19
Page | 19
Page | 19
Page | 19
Page | 19
Page | 19
Page | 19
Page | 19
Page | 19
Page | 19
Page | 19
Page | 19
Page | 19
Page | 19
Page | 19
Page | 19
Page | 19
Page | 19
Page | 19
Page | 19
Page | 19
Page | 19
Page | 19
Page | 19
Page | 19
Page | 19
neighbours, has a wide model availability across all market segments, both for BEVs and PHEVs. Greater market diversification in Norway is also confirmed by the market share of the top 5 electric car models, accounting for 61% of the total electric car market – a value that is among the lowest observed in other Nordic countries where this share ranges between 58% and 80% (Insero, 2018). An even lower market concentration (58%) is found in Finland. Figure 2.4 also shows country details that reflect policy measures and the maturity of the domestic electric car market. The availability of BEV models is the highest in the small car segment in Denmark in which the tax regime favours small cars comparatively to the other countries (see Table 2.3).
Policy drivers
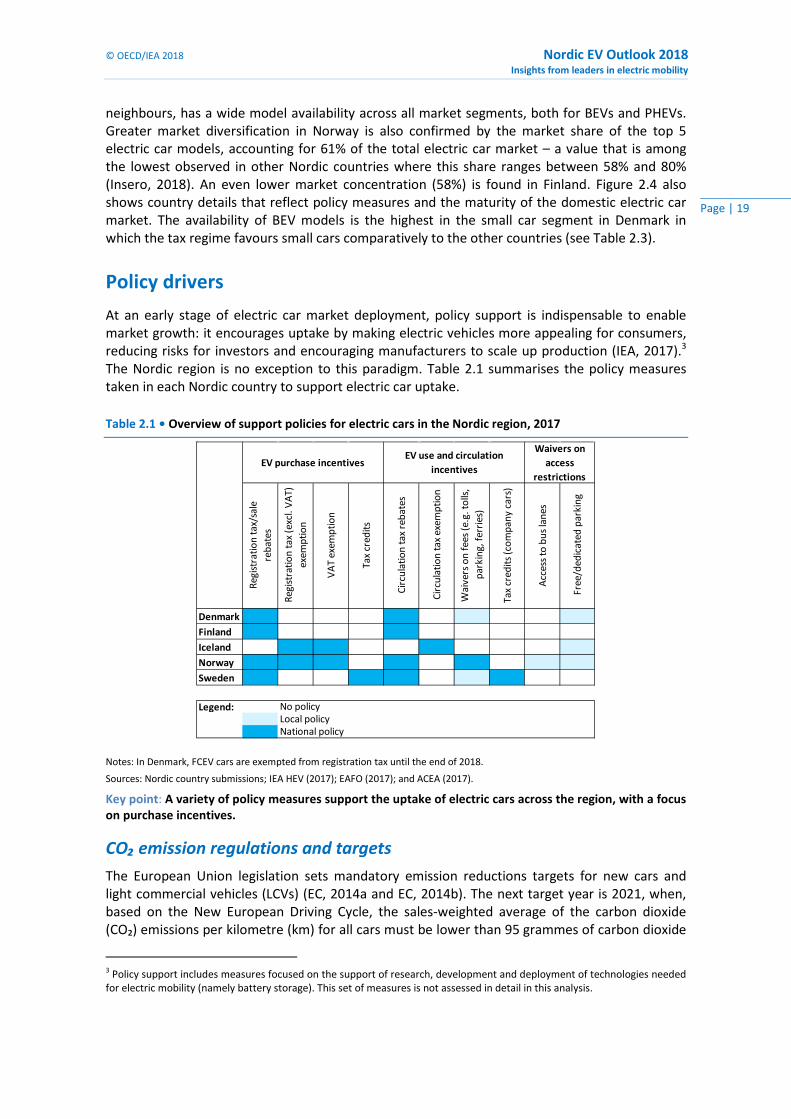
At an early stage of electric car market deployment, policy support is indispensable to enable market growth: it encourages uptake by making electric vehicles more appealing for consumers, reducing risks for investors and encouraging manufacturers to scale up production (IEA, 2017).3 The Nordic region is no exception to this paradigm. Table 2.1 summarises the policy measures taken in each Nordic country to support electric car uptake.
Table 2.1 • Overview of support policies for electric cars in the Nordic region, 2017
Notes: In Denmark, FCEV cars are exempted from registration tax until the end of 2018.
Sources: Nordic country submissions; IEA HEV (2017); EAFO (2017); and ACEA (2017).
Key point: A variety of policy measures support the uptake of electric cars across the region, with a focus on purchase incentives.
CO₂ emission regulations and targets The European Union legislation sets mandatory emission reductions targets for new cars and light commercial vehicles (LCVs) (EC, 2014a and EC, 2014b). The next target year is 2021, when, based on the New European Driving Cycle, the sales-weighted average of the carbon dioxide (CO₂) emissions per kilometre (km) for all cars must be lower than 95 grammes of carbon dioxide
3 Policy support includes measures focused on the support of research, development and deployment of technologies needed for electric mobility (namely battery storage). This set of measures is not assessed in detail in this analysis.
DenmarkFinlandIcelandNorwaySweden
Legend: No policyLocal policyNational policy
Acc
ess
to b
us la
nes
Free
/ded
icat
ed p
arki
ng
Waivers on access
restrictionsEV purchase incentives
EV use and circulation incentives
Regi
stra
tion
tax/
sale
re
bate
s
Regi
stra
tion
tax
(exc
l. V
AT)
ex
empt
ion
VA
T ex
empt
ion
Tax
cred
its
Circ
ulat
ion
tax
reba
tes
Circ
ulat
ion
tax
exem
ptio
n
Wai
vers
on
fees
(e.g
. tol
ls,
park
ing,
ferr
ies)
Tax
cred
its (c
ompa
ny c
ars)

Nordic EV Outlook 2018 © OECD/IEA 2018 Insights from leaders in electric mobility
Page | 20 Page | 20 Page | 20 Page | 20 Page | 20 Page | 20 Page | 20 Page | 20 Page | 20 Page | 20 Page | 20 Page | 20 Page | 20 Page | 20 Page | 20 Page | 20 Page | 20 Page | 20 Page | 20 Page | 20 Page | 20 Page | 20 Page | 20 Page | 20 Page | 20 Page | 20 Page | 20 Page | 20
per kilometre (gCO₂/km). The same type of target for LCV emissions is 147 gCO₂/km. The European Union (EU) regulation includes credits aiming to encourage OEMs to produce vehicles emitting less than 50 gCO₂/km by granting greater weight in the evaluation of the average emissions for all new vehicle sales. A new CO2 performance standard for cars and LCVs, aiming to achieve a 30% reduction in CO₂ emissions/km between 2021 and 2030 and including a CO₂ credit for OEMs achieving 15% zero- and low-emissions vehicles (equivalent to fuel-cell electric vehicles, BEVs and PHEVs) sales by 2025, and 30% by 2030, was proposed by the European Commission in late 2017 (EC, 2017a).
Among the Nordic countries, Norway and Iceland are not EU members and thus do not contribute to the achievement of the EU fuel-economy standards goals. Nonetheless, as members of the European Economic Area (EEA), both Iceland and Norway adopted the European regulation aiming to reduce the fleet average CO₂ emissions. Norway’s commitment to deploy electric cars is consistent with its decision to accelerate the transition to low-emission vehicles, demonstrated by the adoption of a national target of 85 gCO₂/km for the average new vehicle sold by 2020. Though it is non-binding, this target was met in 2017 thanks to the high market penetration of BEVs and PHEVs: the average type approval (NEDC) rate of CO₂ emissions from new passenger cars registered in Norway during 2017 was 82 gCO₂/km (Fridstrøm, 2018).
Taxes on vehicle purchases
Registration and value-added taxes
Taxes on vehicle registration can be an important contributor to large-scale deployment of electric mobility. They use a fiscal lever to reduce the purchase price gap between ICE and electric cars by differentiating tax rates between car types.
In the Nordic countries, the taxes levied on the purchase of motor vehicles are generally higher than in other countries. Denmark, Norway and Sweden have a value-added tax (VAT) rate of 25%, while Finland and Iceland apply 24% (ACEA, 2017c).
With the exception of Sweden, Nordic countries apply high to very high vehicle registration taxes. For an average internal combustion engine car, the registration tax is 15% of the untaxed price in Iceland, 23% in Finland, 30% in Norway and 88% in Denmark.4 In Norway, for ICE cars, the VAT and purchase tax taken together typically add 50-100% to the import vehicle price – or even higher for the largest and least energy efficient models. In Denmark, the combined taxes can go up to 150% for large ICE cars (ACEA, 2017c; Bjergbakke, 2018). By comparison, VAT in Europe ranges between 19-22%, and registration taxes are below 20%. In the United States, the highest taxes on vehicle purchase are in California (up to 10.8%, depending on the county) (ACEA, 2017c).
In Finland and Iceland, the registration tax is based on the CO₂/km rating of the car to promote the purchase of zero- and low-emissions vehicles. Norway has a similar system, where the registration is differentiated on the basis of curb weight, CO₂ and nitrogen oxides (NOX) emission rates per km.5 Norway’s registration tax is also dynamic: the CO₂ and NOX emission levels correspond to different taxation levels that are frequently adapted to take into account the improvement of the environmental performances of the fleet, promoting
4 The value for Denmark has been calculated considering the taxation scheme enforced in October 2017. 5 In Norway, the CO₂ component was introduced in 2007 and the NOx component in 2012 (Fridstrøm, 2017a). In 2017, the engine power component was abolished. The CO₂ tax element is negative below 75 gCO₂/km, i.e. leading to a deduction in the weight and NOx taxes for PHEVs. PHEVs have an additional reduction in weight before the calculation. The overall tax, however, cannot be less than zero.
© OECD/IEA 2018 Nordic EV Outlook 2018 Insights from leaders in electric mobility
Page | 21
Page | 21
Page | 21
Page | 21
Page | 21
Page | 21
Page | 21
Page | 21
Page | 21
Page | 21
Page | 21
Page | 21
Page | 21
Page | 21
Page | 21
Page | 21
Page | 21
Page | 21
Page | 21
Page | 21
Page | 21
Page | 21
Page | 21
Page | 21
Page | 21
Page | 21
Page | 21
Page | 21
the adoption of cleaner technologies. Denmark also applies a rebate to its high vehicle registration tax based on the fuel economy of the car.
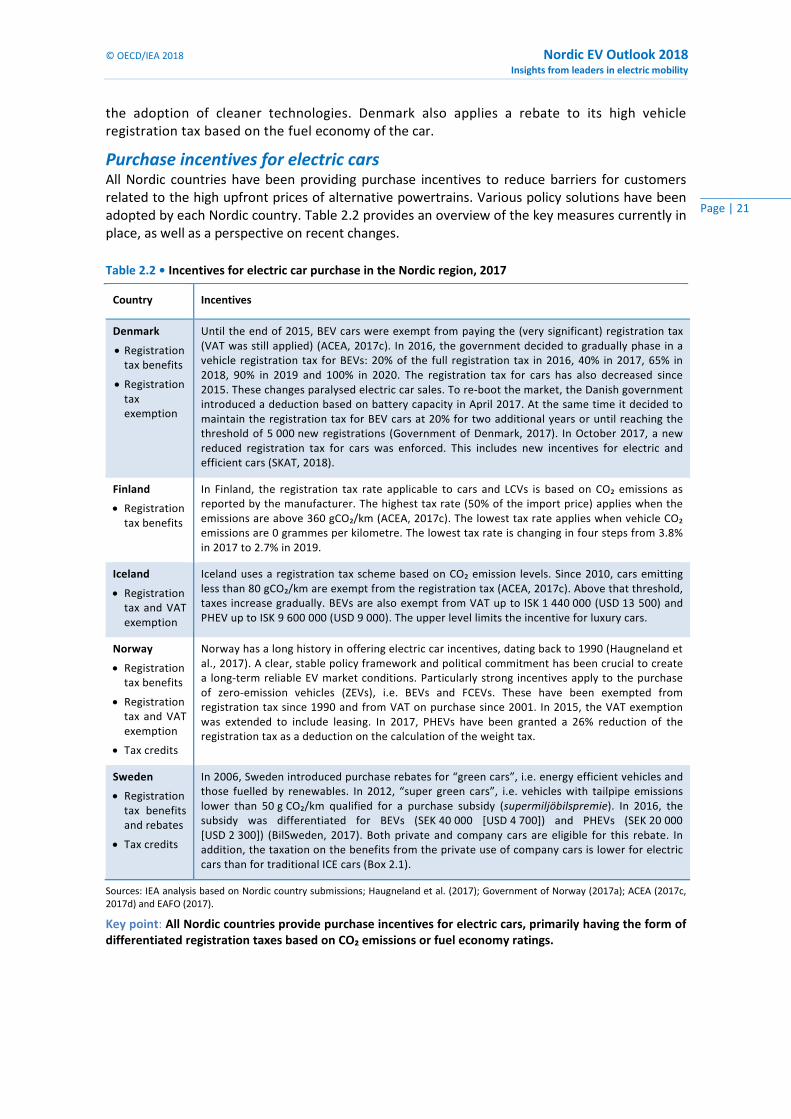
Purchase incentives for electric cars All Nordic countries have been providing purchase incentives to reduce barriers for customers related to the high upfront prices of alternative powertrains. Various policy solutions have been adopted by each Nordic country. Table 2.2 provides an overview of the key measures currently in place, as well as a perspective on recent changes.
Table 2.2 • Incentives for electric car purchase in the Nordic region, 2017
Country Incentives
Denmark
• Registration tax benefits
• Registration tax exemption
Until the end of 2015, BEV cars were exempt from paying the (very significant) registration tax (VAT was still applied) (ACEA, 2017c). In 2016, the government decided to gradually phase in a vehicle registration tax for BEVs: 20% of the full registration tax in 2016, 40% in 2017, 65% in 2018, 90% in 2019 and 100% in 2020. The registration tax for cars has also decreased since 2015. These changes paralysed electric car sales. To re-boot the market, the Danish government introduced a deduction based on battery capacity in April 2017. At the same time it decided to maintain the registration tax for BEV cars at 20% for two additional years or until reaching the threshold of 5 000 new registrations (Government of Denmark, 2017). In October 2017, a new reduced registration tax for cars was enforced. This includes new incentives for electric and efficient cars (SKAT, 2018).
Finland
• Registration tax benefits
In Finland, the registration tax rate applicable to cars and LCVs is based on CO₂ emissions as reported by the manufacturer. The highest tax rate (50% of the import price) applies when the emissions are above 360 gCO₂/km (ACEA, 2017c). The lowest tax rate applies when vehicle CO₂ emissions are 0 grammes per kilometre. The lowest tax rate is changing in four steps from 3.8% in 2017 to 2.7% in 2019.
Iceland
• Registration tax and VAT exemption
Iceland uses a registration tax scheme based on CO₂ emission levels. Since 2010, cars emitting less than 80 gCO₂/km are exempt from the registration tax (ACEA, 2017c). Above that threshold, taxes increase gradually. BEVs are also exempt from VAT up to ISK 1 440 000 (USD 13 500) and PHEV up to ISK 9 600 000 (USD 9 000). The upper level limits the incentive for luxury cars.
Norway
• Registration tax benefits
• Registration tax and VAT exemption
• Tax credits
Norway has a long history in offering electric car incentives, dating back to 1990 (Haugneland et al., 2017). A clear, stable policy framework and political commitment has been crucial to create a long-term reliable EV market conditions. Particularly strong incentives apply to the purchase of zero-emission vehicles (ZEVs), i.e. BEVs and FCEVs. These have been exempted from registration tax since 1990 and from VAT on purchase since 2001. In 2015, the VAT exemption was extended to include leasing. In 2017, PHEVs have been granted a 26% reduction of the registration tax as a deduction on the calculation of the weight tax.
Sweden
• Registration tax benefits and rebates
• Tax credits
In 2006, Sweden introduced purchase rebates for “green cars”, i.e. energy efficient vehicles and those fuelled by renewables. In 2012, “super green cars”, i.e. vehicles with tailpipe emissions lower than 50 g CO₂/km qualified for a purchase subsidy (supermiljöbilspremie). In 2016, the subsidy was differentiated for BEVs (SEK 40 000 [USD 4 700]) and PHEVs (SEK 20 000 [USD 2 300]) (BilSweden, 2017). Both private and company cars are eligible for this rebate. In addition, the taxation on the benefits from the private use of company cars is lower for electric cars than for traditional ICE cars (Box 2.1).
Sources: IEA analysis based on Nordic country submissions; Haugneland et al. (2017); Government of Norway (2017a); ACEA (2017c, 2017d) and EAFO (2017).
Key point: All Nordic countries provide purchase incentives for electric cars, primarily having the form of differentiated registration taxes based on CO₂ emissions or fuel economy ratings.

Nordic EV Outlook 2018 © OECD/IEA 2018 Insights from leaders in electric mobility
Page | 22 Page | 22 Page | 22 Page | 22 Page | 22 Page | 22 Page | 22 Page | 22 Page | 22 Page | 22 Page | 22 Page | 22 Page | 22 Page | 22 Page | 22 Page | 22 Page | 22 Page | 22 Page | 22 Page | 22 Page | 22 Page | 22 Page | 22 Page | 22 Page | 22 Page | 22 Page | 22 Page | 22
Figure 2.5 illustrates the strength of existing incentives across the Nordic region by comparing the purchase price of cars in the mid-size market segment.6 In order to allow a fair comparison of the three model versions (ICE, BEV and PHEV), the same base import value per version was assumed across the countries (based on that of Norway7), while vehicle taxation reflects the structure in place in each of the Nordic countries.
Figure 2.5 • Total purchase price for mid-size ICE, BEV and PHEV cars in the Nordic countries, 2017
Notes: This comparison is based on Volkswagen Golf models: Golf 1.0 110 horsepower (hp) Turbo Stratified Injection (TSI) petrol for ICE, e-Golf for BEV and Golf GTE for PHEV. Finland applies CO2 based registration taxes. Sweden has a direct purchase subsidy (super green car rebate) equivalent to USD 4 700 for BEVs and USD 2 300 for PHEVs. In Iceland there is a combination of CO2 based registration taxes and a VAT exemption for electric cars. Norway applies VAT and weight tax exemptions for electric cars (partial weight tax exemption for PHEVs). Denmark applies a registration tax deduction for BEVs and PHEVs equivalent to USD 1 500, and an additional registration tax reduction for BEVs. The tax scheme considered for Denmark is the one in place before October 2017.
Sources: IEA analysis based on ACEA (2017c, 2017d); Bjergbakke (2018); Haugneland et al. (2017); Insero (2018); Volkswagen (2017a, 2017b, 2017c, 2017d, 2017e).
Key point: The purchase price of cars is high due to the VAT and registration tax structures. Purchase prices for BEVs and PHEVs are reduced in several Nordic countries with support mechanisms. In Denmark, Iceland and Norway, such measures close the price gap between BEVs (and sometimes PHEVs) and ICEs.
The price difference between ICE and electric cars is very narrow in some of the Nordic countries (Figure 2.5). In Norway, the BEV version has a retail price that is on par with the ICE version thanks to tax exemptions. In Denmark, the high registration tax and its partial exemption for BEV cars makes this version less expensive than the equivalent ICE and PHEV models.8 In Iceland, Finland and Sweden, the ICE car has a lower upfront price than the electric models, despite the purchase incentives summarised in Table 2.3. The registration tax and VAT exemption are not sufficient to enable cost parity for BEVs in Iceland, but they do so for the PHEV version. In Sweden, the subsidy granted to electric cars is not sufficient to close the price gap between the ICE and electric versions.9 Considering the purchase price levels shown in Figure 2.5 with the
6 The Volkswagen Golf was chosen for our comparison as its BEV model had the largest share of electric cars sold in the Nordic region in 2017 (Insero, 2018); and it is available in all the Nordic countries in ICE, BEV and PHEV models. 7 The choice to use the same import price across countries is dictated by the intention to compare the taxation schemes implemented in the different countries with the same starting values. However, car importers may significantly change the base import price for some car models. This may be the case for Denmark, where the actual total purchase price for VW Golf ICE and PHEV versions in December 2017 are respectively DKK 260 000 (USD 38 500) and DKK 320 000 (USD 47 400) (Insero, 2018). 8 Denmark also has the highest total purchase cost for each of the models analysed due to a high registration tax. 9 Despite this and notwithstanding differences across models, which limit comparative assessments, the total cost of ownership (TCO) – which includes purchase price, fuel costs, taxes, vehicle depreciation, maintenance and repair, insurance and interest payments – is still likely lower for electric than for ICE cars. For example, a Swedish study by Hagman et al. (2016)
- 10
0
10
20
30
40
50
60
70
ICE BEV PHEV ICE BEV PHEV ICE BEV PHEV ICE BEV PHEV ICE BEV PHEV
Denmark Finland Iceland Norway Sweden
thou
sand
s U
SD 2
017
Scrapping tax
Subsidy
VAT
Registration tax
Import price
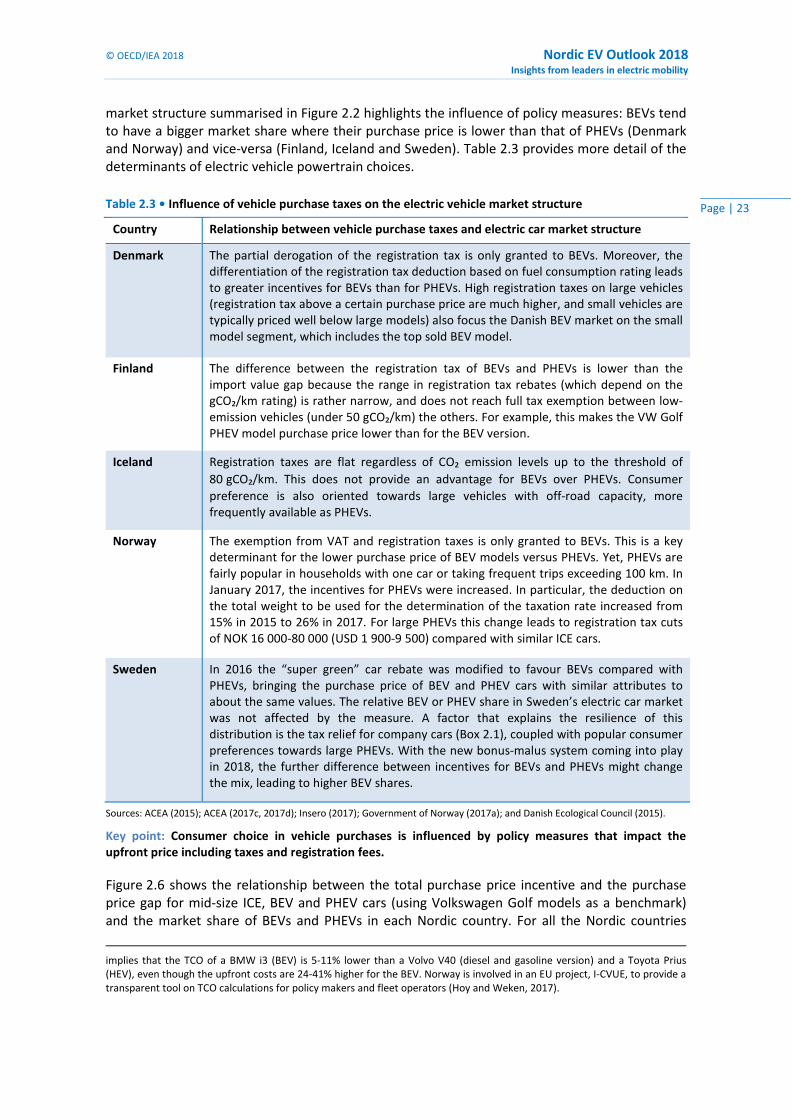
© OECD/IEA 2018 Nordic EV Outlook 2018 Insights from leaders in electric mobility
Page | 23 Page | 23 Page | 23 Page | 23 Page | 23 Page | 23 Page | 23 Page | 23 Page | 23 Page | 23 Page | 23 Page | 23 Page | 23 Page | 23 Page | 23 Page | 23 Page | 23 Page | 23 Page | 23 Page | 23 Page | 23 Page | 23 Page | 23 Page | 23 Page | 23 Page | 23 Page | 23 Page | 23
market structure summarised in Figure 2.2 highlights the influence of policy measures: BEVs tend to have a bigger market share where their purchase price is lower than that of PHEVs (Denmark and Norway) and vice-versa (Finland, Iceland and Sweden). Table 2.3 provides more detail of the determinants of electric vehicle powertrain choices.
Table 2.3 • Influence of vehicle purchase taxes on the electric vehicle market structure
Country Relationship between vehicle purchase taxes and electric car market structure
Denmark The partial derogation of the registration tax is only granted to BEVs. Moreover, the differentiation of the registration tax deduction based on fuel consumption rating leads to greater incentives for BEVs than for PHEVs. High registration taxes on large vehicles (registration tax above a certain purchase price are much higher, and small vehicles are typically priced well below large models) also focus the Danish BEV market on the small model segment, which includes the top sold BEV model.
Finland The difference between the registration tax of BEVs and PHEVs is lower than the import value gap because the range in registration tax rebates (which depend on the gCO₂/km rating) is rather narrow, and does not reach full tax exemption between low-emission vehicles (under 50 gCO₂/km) the others. For example, this makes the VW Golf PHEV model purchase price lower than for the BEV version.
Iceland Registration taxes are flat regardless of CO₂ emission levels up to the threshold of 80 gCO₂/km. This does not provide an advantage for BEVs over PHEVs. Consumer preference is also oriented towards large vehicles with off-road capacity, more frequently available as PHEVs.
Norway The exemption from VAT and registration taxes is only granted to BEVs. This is a key determinant for the lower purchase price of BEV models versus PHEVs. Yet, PHEVs are fairly popular in households with one car or taking frequent trips exceeding 100 km. In January 2017, the incentives for PHEVs were increased. In particular, the deduction on the total weight to be used for the determination of the taxation rate increased from 15% in 2015 to 26% in 2017. For large PHEVs this change leads to registration tax cuts of NOK 16 000-80 000 (USD 1 900-9 500) compared with similar ICE cars.
Sweden In 2016 the “super green” car rebate was modified to favour BEVs compared with PHEVs, bringing the purchase price of BEV and PHEV cars with similar attributes to about the same values. The relative BEV or PHEV share in Sweden’s electric car market was not affected by the measure. A factor that explains the resilience of this distribution is the tax relief for company cars (Box 2.1), coupled with popular consumer preferences towards large PHEVs. With the new bonus-malus system coming into play in 2018, the further difference between incentives for BEVs and PHEVs might change the mix, leading to higher BEV shares.
Sources: ACEA (2015); ACEA (2017c, 2017d); Insero (2017); Government of Norway (2017a); and Danish Ecological Council (2015).
Key point: Consumer choice in vehicle purchases is influenced by policy measures that impact the upfront price including taxes and registration fees.
Figure 2.6 shows the relationship between the total purchase price incentive and the purchase price gap for mid-size ICE, BEV and PHEV cars (using Volkswagen Golf models as a benchmark) and the market share of BEVs and PHEVs in each Nordic country. For all the Nordic countries
implies that the TCO of a BMW i3 (BEV) is 5-11% lower than a Volvo V40 (diesel and gasoline version) and a Toyota Prius (HEV), even though the upfront costs are 24-41% higher for the BEV. Norway is involved in an EU project, I-CVUE, to provide a transparent tool on TCO calculations for policy makers and fleet operators (Hoy and Weken, 2017).

Nordic EV Outlook 2018 © OECD/IEA 2018 Insights from leaders in electric mobility
Page | 24 Page | 24 Page | 24 Page | 24 Page | 24 Page | 24 Page | 24 Page | 24 Page | 24 Page | 24 Page | 24 Page | 24 Page | 24 Page | 24 Page | 24 Page | 24 Page | 24 Page | 24 Page | 24 Page | 24 Page | 24 Page | 24 Page | 24 Page | 24 Page | 24 Page | 24 Page | 24 Page | 24
except for Denmark, Figure 2.6 suggests that policy frameworks leading to smaller purchase price gaps tend to be associated with higher market shares. Figure 2.6 indicates also that fiscal incentives have the biggest impact when they close the purchase price gap between electric and ICE cars.
Figure 2.6 • Purchase price incentives, price gap and market share in the Nordic countries
Notes: The size of the bubbles indicates the market shares of electric vehicles in 2017. The purchase price gap on the y axis includes VAT exemptions, vehicle registration tax reductions and exemptions, direct subsidies and differentiated taxes for CO2 emissions, NOx emissions and fuel economy compared to equivalent ICE cars. The tax scheme considered for Denmark is the one enforced before October 2017. Both the purchase price incentives and the price gap refer to the Volkswagen Golf models already used for Figure 2.5. “Market share” refers to the sales share of electric cars in the national PLDV market.
Sources: IEA analysis based on ACEA (2017a, 2017b, 2017c, 2017d); Autoalan tiedotuskeskus (2017); EAFO (2017); EEA (2017); Insero (2017); Insero (2018); and Volkswagen (2017a, 2017b, 2017c, 2017d, 2017e).
Key point: The market share of electric cars in Nordic countries tends to be higher when incentives are larger and when the price gap between electric cars and equivalent ICE models is smaller, with the exception of Denmark.
Figure 2.7 • Purchase price in the upper market segment of ICE, BEV and PHEV models, Denmark, 2015-17
Notes: Three equivalent large car models are considered: Audi A7 (252 hp 2.0 Turbo Fuel Stratified Injection) for ICE, Tesla model S (75D four-wheel drive) for BEV and Mercedes Benz E350-Hybrid (Hybrid SE 4-dr 7G-Tronic) for PHEV. We assume an import value before taxes as that in Norway.
Source: IEA analysis based on ACEA (2017c, 2017d); Bjergbakke (2018); Haugneland et al. (2017); Insero (2018); Mercedes Benz (2017); and Tesla (2017).
Key point: Changes in vehicle registration taxes in Denmark resulted in a reversal of the cost competitiveness in the upper segment of electric cars models between 2015 and 2017.
Denmark is the main exception. While it has the largest purchase incentives of the Nordic region (due to extensive cuts in vehicle registration taxes), its electric car market share is the
Iceland PHEVDenmark BEV
Finland BEV
Finland PHEV
Norway BEV
Norway PHEV
Sweden BEV
Sweden PHEV
Iceland BEV Denmark PHEV1%
5%
20%
-20%
-10%
0%
10%
20%
30%
40%
50%
0 10000 20000 30000 40000 50000 60000
Purc
hase
pri
ce g
ap w
ith re
spec
t to
an e
quiv
alen
t ICE
Fiscal incentive on purchase price (USD 2017)
Market share
0
50
100
150
200
250
ICE BEV PHEV ICE BEV PHEV ICE BEV PHEV ICE BEV PHEV
2015 2016 2017 before October 2017 after October
thou
sand
s U
SD 2
017
VAT
Registrationtax
Import price

© OECD/IEA 2018 Nordic EV Outlook 2018 Insights from leaders in electric mobility
Page | 25 Page | 25 Page | 25 Page | 25 Page | 25 Page | 25 Page | 25 Page | 25 Page | 25 Page | 25 Page | 25 Page | 25 Page | 25 Page | 25 Page | 25 Page | 25 Page | 25 Page | 25 Page | 25 Page | 25 Page | 25 Page | 25 Page | 25 Page | 25 Page | 25 Page | 25 Page | 25 Page | 25
lowest in the region. This is largely attributable to Denmark’s changes in vehicle registration taxes for both for ICE and electric cars (see Table 2.2 for details). In particular, the partial removal of the exemption from the vehicle registration tax for electric cars and the contextual reduction in the vehicle registration tax (applicable to all cars, including ICEs) in 2016, led to a reversal of the cost competiveness of electric vehicles in the upper market segment (Figure 2.7). Since this segment accounted for nearly two-thirds of the 2015 electric car sales, Danish electric car sales fell very significantly in 2016 (Danish EV Alliance, 2017). The corrective measure freezing the increase in registration taxes for electric cars adopted in April 2017 and the new registration tax scheme enforced in October 2017 continued to provide mixed signals, undermining consumer confidence and limiting opportunities for a rebound.
Box 2.1 • Taxation on company cars: Focus on Sweden
In most countries, the benefit represented by the private use of company cars is subject to income taxes. The amount is typically calculated as a percentage of the purchase value of the car, including vehicle registration taxes and operational costs (personal travel only), also accounting for depreciation.
In Sweden, where cars are not subject to registration taxes, the application of this approach would favour ICE over electric cars, given their comparatively lower purchase price. The Swedish legislation allows reducing the value of the benefit represented by the private use of company cars if they are electric*, and therefore reduces the amount of income taxes that needs to be paid on it. Thanks to this, the monthly cost of leasing an electric car is lower than that of an equivalent ICE for the employee, even if the car is still more expensive for the company (Wikström, 2018).
In Sweden, this measure, combined with complementary activities to stimulate response from corporate social responsibility programmes, proved to be effective in stimulating the adoption ofelectric cars. In November 2017, company cars accounted for approximately 70% of the new electric car sales (Wikström, 2018).
*The reduction of the value of the benefits was capped at EUR 1 700 (USD 1 900) in 2012-16 and at EUR 950 (USD 1 070) in2017 (Wikström, 2018).
Taxes on circulation and use
This section broadens the perspective on policies supporting electric mobility in the Nordic region. It focuses on circulation taxes.
Circulation taxes in most Nordic countries tend to promote vehicles with good environmental performance and vehicles in the smaller car market segments thanks to differentiated rates based on key environmental indicators (Table 2.4). Their influence on consumer decisions is mitigated by the tendency for consumers to give greater relevance to near-term expenditures, and by the fact that the absolute amounts of circulation taxes tend to be low if compared to registration taxes. These factors make purchase incentives a more important driver of consumer choice.

Nordic EV Outlook 2018 © OECD/IEA 2018 Insights from leaders in electric mobility
Page | 26 Page | 26 Page | 26 Page | 26 Page | 26 Page | 26 Page | 26 Page | 26 Page | 26 Page | 26 Page | 26 Page | 26 Page | 26 Page | 26 Page | 26 Page | 26 Page | 26 Page | 26 Page | 26 Page | 26 Page | 26 Page | 26 Page | 26 Page | 26 Page | 26 Page | 26 Page | 26 Page | 26
Table 2.4 • Electric cars: circulation tax incentives in the Nordic region, 2017
Country Incentives
Denmark • Circulation tax rebates
In Denmark, circulation taxes are differentiated based on fuel consumption and weight. BEVs pay the minimum amount and PHEVs pay less than an equivalent ICE car.
Finland • Circulation tax rebates
In Finland, the circulation tax consists of two components: a base tax, dependent on a CO₂/km rating and a tax dependent on the fuel used, intended primarily to rebalance the effect of lower taxes on diesel fuel, natural gas and electricity. BEVs pay the minimum amount (EUR 106 [USD 120] per year) and PHEVs pay less than ICE cars.
Iceland • Circulation tax exemption
In Iceland, circulation taxes depend on a CO₂/km rating. BEVs are exempt from the annual circulation tax (about ISK 4 200 [USD 40]. Since the tax rate is flat in the range up to the threshold of 121 gCO₂/km, PHEVs pay the same amount as small ICE cars.
Norway • Circulation tax rebates
Norway bases circulation taxes on the type of fuel. BEVs and PHEVs are granted a reduction and pay the minimum amount, NOK 455 (USD 55).
Sweden • Circulation tax rebates
In Sweden, vehicles are subject to an annual circulation tax based on weight and CO₂ emissions per km. “Super green” cars are exempt for the first five-years after registration. This corresponds, on average, to an annual tax relief of about SEK 1 760 (USD 210).
Sources: IEA analysis based on country submissions, complemented with ACEA (2017a, 2017b); Autoalan tiedotuskeskus (2017); EAFO (2017); EEA (2017); and Insero (2017, 2018).
Key point: Several Nordic countries differentiate circulation taxes based on environmental performance as well as providing economic incentives for electric car ownership.
Local measures
Measures implemented by local administrations can effectively complement national regulatory and fiscal policies, enhancing the value proposition of electric cars. This section provides an overview of selected local measures that were adopted in the Nordic region, focusing on measures that had significant impact in terms of consumer awareness or electric car market development. Box 2.2 discusses the impact of such measures in Norway, providing quantitative indications on the market response.
Free or discounted parking
A reduction or waiver on parking fees for electric cars is the local policy instrument that is most widely applied in the Nordic region.
• Since 2016, Norwegian municipalities have the authority to determine fees andexemption categories. This led to different local regulatory frameworks: electric cars paythe same parking fee as ICEs in Trondheim; half the price of ICEs in the city centre ofBergen; and they are subject to strongly differentiated parking fees in Oslo, where1 300 of the 6 500 parking places in municipal parking lots are dedicated to electric carcharging and equipped with slow chargers (3.6 kW). These parking spots plus chargingare free until 2019.10
10 Olso also plans to include more than 25 000 previously unregulated street parking places in new parking zones, giving advantages to electric cars.

© OECD/IEA 2018 Nordic EV Outlook 2018 Insights from leaders in electric mobility
Page | 27 Page | 27 Page | 27 Page | 27 Page | 27 Page | 27 Page | 27 Page | 27 Page | 27 Page | 27 Page | 27 Page | 27 Page | 27 Page | 27 Page | 27 Page | 27 Page | 27 Page | 27 Page | 27 Page | 27 Page | 27 Page | 27 Page | 27 Page | 27 Page | 27 Page | 27 Page | 27 Page | 27
• Electric cars can be parked for free for up to two hours in the city centre of Reykjavik andAkureyri in Iceland (Bilastaedasjodur, 2017).
• The Danish government issued a rule exempting electric cars from parking fees for up toDKK 5 000 (USD 760) per year (Flader, 2017). In practice, this means that other than inCopenhagen, electric car owners rarely pay for public parking.11
Waivers on access to bus lanes
In Norway, electric cars are granted free access to bus lanes, but several bus corridors are experiencing regular congestion during rush hour.12 The municipality of Oslo tackled this issue in 2017 by granting access to the bus lane on two specific corridors during rush hours only to electric cars with two or more persons on board.13
Reduced charges on the use of transport infrastructure
Road use charges are in place both in Norway and Sweden (where both Gothenburg and Stockholm apply congestion charges). In Norway, electric cars enjoy exemptions.
In Norway, electric cars are exempt from paying for the use of regional toll roads. This measure added up to NOK 7 500 (USD 900) in 2016 (Figenbaum and Kolbenstvedt 2016).14 From 2019, electric cars will have to pay the tolls, but at a lower fee. Since 2009, electric cars have been granted free access on most ferries that connect parts of the national road network. On ferry crossings that are not part of the national road network, local governments decide the fees.
Box 2.2 • Strong electric car uptake induced by local measures: Examples from Norway
Local incentives are in force simultaneously with national measures. As a result, it is not easy to separate to what extent each incentive influences the uptake of electric cars. However, the variation in the shares of electric car adoption in specific areas is indicative of the impact of local incentives. Given the wider extent of local incentives and the robust electric car market uptake, Norway provides the best examples in this respect.
The geographic variation in electric car uptake appears to be strongly linked to two particularly important aspects of the local road network: whether there are ferry crossings, toll roads or cordon toll rings in operation along main commuting routes, and whether there is pronounced congestion that BEVs may avoid by using a bus lane.
The highest share of BEV cars in the stock of any Norwegian municipality, with more than 21% of the fleet as of December 2017, is found in the sparsely populated archipelago of Finnøy northeast of Stavanger. The costs savings from the NOK 150 (USD 18) toll levied in each direction on the undersea tunnel connecting the archipelago to the mainland are likely a strong driver. Even with a 40% discount Local incentives are in force simultaneously with national measures. As a result, it is not easy to separate to what extent each incentive influences the uptake of electric cars. However, the variation in the shares of electric car adoption in specific areas is indicative of the impact of local incentives. Given the wider extent of local incentives and the robust electric car market uptake, Norway provides the best examples in this respect.
11 The exemption is payed for by municipalities and is optional. Not all municipalities use the rule. 12 Regulations fall under the national regulation on traffic signs, which since 2005 allows electric cars in bus lanes, unless indicated by the municipality (local roads) or Norway’s Public Roads Administration (national roads) (Figenbaum, 2018). 13 While implementing this type of local policy, it is important to avoid a modal shift from public buses to cars. In the case of Norway, the access to bus lanes for electric cars has not reduced the modal share of buses, but instead bus utilisation is at its highest ever level. The main reason is that public transport is less expensive than cars. 14 In the third quarter of 2017, the price of toll roads in Norway was differentiated for ICE gasoline and ICE diesel cars: during peak hours, the price for diesel ICE cars doubled, while price for gasoline ICEs was slightly decreased.

Nordic EV Outlook 2018 © OECD/IEA 2018 Insights from leaders in electric mobility
Page | 28 Page | 28 Page | 28 Page | 28 Page | 28 Page | 28 Page | 28 Page | 28 Page | 28 Page | 28 Page | 28 Page | 28 Page | 28 Page | 28 Page | 28 Page | 28 Page | 28 Page | 28 Page | 28 Page | 28 Page | 28 Page | 28 Page | 28 Page | 28 Page | 28 Page | 28 Page | 28 Page | 28
The geographic variation in electric car uptake appears to be strongly linked to two particularly important aspects of the local road network: whether there are ferry crossings, toll roads or cordon toll rings in operation along main commuting routes, and whether there is pronounced congestion that BEVs may avoid by using a bus lane.
The highest share of BEV cars in the stock of any Norwegian municipality, with more than 21% of the fleet as of December 2017, is found in the sparsely populated archipelago of Finnøy northeast of Stavanger. The costs savings from the NOK 150 (USD 18) toll levied in each direction on the undersea tunnel connecting the archipelago to the mainland are likely a strong driver. Even with a 40% discount available to users paying a NOK 4 800 (USD 580) advance deposit, commuters using electric cars may avoid an annual toll expenditure on the order of NOK 37 000 (USD 4 500) (Fridstrøm, 2017a).
The electric car stock share is also above the national average in the city of Oslo and in the surrounding municipalities: at end-2017, the BEV car share in this area was 9-12%, compared with a national average around 4% (Fridstrøm, 2018). This suggests that the combination of the cordon toll exemption, free parking and free charging in Oslo, and facilitated access to bus lanes have boosted demand for electric cars. Among vehicles crossing the Oslo cordon toll ring during January-June 2017, BEVs represented around 10% of all light vehicles (passenger cars and small cargo vans) (Fridstrøm, 2017a).
Public procurement
Public procurement programmes can encourage the uptake of electric vehicles. Adopting electric vehicles in public fleets provides a number of advantages in kick-starting a wider electric vehicle market: having leverage on prices via bulk purchasing; central charging outlets; showcasing the technology to the public and making it common in the urban landscape. Increasing demand in public fleets also helps stimulate the availability of models and attracts new market player for charging services. This, in turn, will benefit individual customers when they choose to drive electric vehicles.
Eight EVI member countries committed to electrify their public fleets in the Government Fleet Declaration (EVI, 2016).15 Among the Nordic countries, the Swedish government mandates the adoption of environment-friendly and electric cars in government fleets, with the exception of some classes of cars (e.g. emergency vehicles, cars with more than five seats, vehicles used by security and protection institutions) (Sveriges Riksdag, 2009). The Swedish public fleet comprises approximately 32 000 vehicles (passenger cars and vans) (Wikström, 2018). The public EV fleets represent a significant purchasing group and contribute to national climate change goals. Since 2013, the Danish Energy Agency has funded programmes to support municipalities and companies in the purchase of electric cars for fleets (Sørensen, 2017). Public procurement is moving quickly in Copenhagen, which aims to convert its entire bus fleet to electric vehicles by 2031 (Niss, 2017).
Box 2.3 • Electric buses in Nordic cities
The use of electric buses in the Nordic countries is currently transitioning from the testing and demonstration phase to the commercial phase. According to the data we were able to collect from each Nordic country there are approximately 104 electric buses and minibuses on the road in the Nordic region: 6 in Denmark, 16 in Finland, 1 in Iceland, 28 in Norway and 53 in Sweden. At least 18 cities in the Nordic countries are testing electric buses or operating entire lines of electric buses (EAFO, 2018), while another five cities have announced that they will begin to make use of electric buses in the coming years. Capital cities have the most ambitious plans for the electrification of public buses: Copenhagen would like to have its fleet fully composed of electric buses by 2031 (Niss,
15 Canada, China, France, Japan, Norway, Sweden, United Kingdom and United States.

© OECD/IEA 2018 Nordic EV Outlook 2018 Insights from leaders in electric mobility
Page | 29 Page | 29 Page | 29 Page | 29 Page | 29 Page | 29 Page | 29 Page | 29 Page | 29 Page | 29 Page | 29 Page | 29 Page | 29 Page | 29 Page | 29 Page | 29 Page | 29 Page | 29 Page | 29 Page | 29 Page | 29 Page | 29 Page | 29 Page | 29 Page | 29 Page | 29 Page | 29 Page | 29
2017); Oslo plans to have 60% of its bus fleet electrified by 2025 (Ruter, 2018); Helsinki plans to have one-third of its fleet electrified by 2025 (HSL, 2015). If these cities achieve their public transport electrification pledges by 2025, about 2 000 electric buses will be on the roads, representing a substantial increase in the uptake of electric buses in the coming years.
In addition to their low GHG emissions, if fuelled by low-carbon electricity, electric buses have three additional benefits that make them attractive compared with biofuel and conventional buses: they emit no tailpipe emissions; they produce less noise in urban environments; and they provide a more comfortable journey experience due to lower vibration and noise. Electric buses have a purchase price premium, for which policy measures can help in the deployment of electric buses. For example in Sweden, electric buses are granted a rebate, which in February 2018 was increased to cover 20% of the bus cost thus reducing the price premium for local authorities (Miljö- och energidepartementet, 2016).
Consumer response: Focus on Norway
Norway clearly stands out as the most developed electric car market in terms of sales share and stock. “Elbilisten” survey of electric car owners in Norway, carried out by the Norwegian Electric Car Association, provides a number of insights (Norsk Elbilforening, 2017). Key indicators are briefly discussed in the following sections.
Electric car adopters Early adopters of electric cars in Norway identified by the Elbilisten survey are primarily middle-aged men (average 47 years for BEV owners, 55 years for PHEV owners; the latter value is similar for ICE car owners) with a high level of education and income, and living in urban areas (Figenbaum and Kolbenstvetdt, 2016). The gender distribution of electric car owners has not change significantly in recent years (Norsk Elbilforening, 2013 and Norsk Elbilforening, 2016). As a wider range of non-luxury electric car models have reached the Norwegian market in recent years, consumers having a broader range of income levels had access to electric car models (Figenbaum, 2018). Most electric cars were sold in households with more than one car (Figure 2.8). The Elbilisten survey also noted that, on average, electric car owners have inspired 2.4 other people (e.g. colleagues or family members) to purchase an electric car (Norsk Elbilforening, 2017), suggesting that electric car adoption was rather strongly influenced by the consumer's network.
Figure 2.8 • Electric car owner profiles in Norway, 2013 and 2016
Sources: Norsk Elbilforening (2013); Norsk Elbilforening (2016).
Key point: Norway’s electric car market is dominated by male customers and multi-car households.
0%
10%
20%
30%
40%
50%
60%
70%
80%
90%
100%
Gender Household type Gender Household type
2013 2016
Multi-car household
Single-car household
Female
Male

Nordic EV Outlook 2018 © OECD/IEA 2018 Insights from leaders in electric mobility
Page | 30 Page | 30 Page | 30 Page | 30 Page | 30 Page | 30 Page | 30 Page | 30 Page | 30 Page | 30 Page | 30 Page | 30 Page | 30 Page | 30 Page | 30 Page | 30 Page | 30 Page | 30 Page | 30 Page | 30 Page | 30 Page | 30 Page | 30 Page | 30 Page | 30 Page | 30 Page | 30 Page | 30
Electric car use
Single car households, which constituted only 15% of the electric car market in Norway in 2016, tend to have a preference for electric cars in the upper market segment compared to households owning both electric and ICE cars (Figenbaum, Kolbenstvedt and Elvebakk, 2014). A Swedish survey also finds that PHEVs are chosen more frequently than BEVs by households that have one vehicle (Granström et al., 2017). This is revealing of a still high reliance on the ICE part of the PHEV for at least a portion of the vehicle owner's trips, in a context of a nascent market with electric ranges and EVSE deployment that do not yet ensure that all trips can be made on electricity.
Among households with more than one car – the vast majority of the electric car market – the electric car is often the most frequently used vehicle. Electric cars are mostly (95%) used for everyday commuting trips and common day trips (57%), but only rarely for holidays, when ICE cars are the preferred choice (Haugneland et al., 2016). Nevertheless, an increasing share of multi-car households owning both an electric and an ICE car, choose the electric car for long journeys: 31% of the respondents to the Elbilisten survey in 2016 compared to 12% in 2013 (Norsk Elbilforening, 2013 and Norsk Elbilforening, 2016). On average, the respondents to the survey indicated an annual mileage (with their electric car) of around 17 000 km (Norsk Elbilforening, 2017) (Figure 2.9).
The Norsk Elbilforening survey noted that the adoption of an electric car influenced the travel patterns of 13% (PHEV) to 33% (BEV) of survey respondents after buying the car (compared to 11% for consumers purchasing an ICE model) (Figenbaum and Kolbenstvedt, 2016). Overall, an electric car purchase reduces reliance on walking, cycling and public transport and increases the number of car trips. This is consistent with the general observation that lower operational costs induce an increased reliance on car use.
Figure 2.9 • Electric car use profiles in Norway, 2013 and 2016
Note: Professional trips are trips that electric car owners make while they are working (other than commutes to the main work location).
Sources: Norsk Elbilforening (2013); Norsk Elbilforening (2016).
Key point: Over the period, electric cars increased annual mileage, mostly for routine trips though the share of non-routine trips increased.
Response to policy incentives and customer satisfaction
The insights provided by the Elbilforening electric vehicle owner survey clearly suggest that they are satisfied with their choice (96.5% of respondents declared themselves either satisfied or very
0
2
4
6
8
10
12
14
16
18
20
0%
10%
20%
30%
40%
50%
60%
70%
80%
90%
100%
Purpose Mileage Purpose Mileage
2013 2016
Mil
eage
(tho
usan
ds k
m)
More than 20 000
12-20 000 km
Below 12 000 km
Professional trips
Vacation
Day-to-day trips
Average mileage

© OECD/IEA 2018 Nordic EV Outlook 2018 Insights from leaders in electric mobility
Page | 31 Page | 31 Page | 31 Page | 31 Page | 31 Page | 31 Page | 31 Page | 31 Page | 31 Page | 31 Page | 31 Page | 31 Page | 31 Page | 31 Page | 31 Page | 31 Page | 31 Page | 31 Page | 31 Page | 31 Page | 31 Page | 31 Page | 31 Page | 31 Page | 31 Page | 31 Page | 31 Page | 31
satisfied) (Norsk Elbilforening, 2016). If they had to make a new car purchase, 70% of the respondents stated that they would choose an electric car again (Norsk Elbilforening, 2016).16 However, the survey also indicates that this choice is strongly dependent on the availability of fiscal incentives: only 17% of the electric car owners would buy an electric car without the VAT exemption, and only 18% would do so without the registration exemption. The percentage increases to 40% in case the waivers or reductions on toll roads were removed, but purchase incentives maintained (Norsk Elbilforening, 2016).
For 67% of respondents to the Elbilisten survey, economic benefits were the main reason for purchasing an electric car (Norsk Elbilforening, 2016). Reduction of the purchase price has been the main driver influencing the decision to buy an electric car, with VAT and registration tax exemption as the most important factors among a wide set of incentives (Figure 2.10).17 In a market phase where costs are still higher than those of competing technologies, these results confirm that the promotion of electric cars is unlikely to succeed without measures to reduce the vehicle upfront purchase price gap.
Figure 2.10 • Perceived importance of Norway’s electric car support policies based on survey results
Notes: Respondents were asked to pick the three most important policy measures related to their choice to purchase an electric car. The y axis reflects the proportion of which each policy measure was selected by the respondents.
Source: Norsk Elbilforening (2016).
Key point: Economic incentives to lower the purchase price of electric cars are the main driver of their market uptake in Norway.
The effectiveness of incentives for vehicle purchase is followed by waivers or partial exemptions on use and circulation taxes or charges. Among these, free toll roads stands as the most effective policy measure.
Local policies are not ranked among the main levers leading to the choice of acquiring an electric car according to the respondents of the Elbilisten survey. Among local measures, free parking and access to bus lanes are perceived as the most important incentives. The lower priority given to local policies in influencing the decision to buy an electric car is also reflected by the percentage
16 Similar results are confirmed in Sweden: 90% of Swedish BEV owners surveyed were convinced that the next car they would purchase would also be electric, and so did close to 50% of the PHEV owners (Granström et al., 2017). 17 This is consistent with the observation that the change in the competitiveness of the purchase price for electric cars in the upper market segment, observed in Denmark in 2016, led to a major drop in their uptake.
Incentives at vehiclepurchase
Waivers on use andcirculation taxes
Local measures
0%
10%
20%
30%
40%
50%
60%
70%
80%
Perc
enta
ge o
f res
pons
es

Nordic EV Outlook 2018 © OECD/IEA 2018 Insights from leaders in electric mobility
Page | 32 Page | 32 Page | 32 Page | 32 Page | 32 Page | 32 Page | 32 Page | 32 Page | 32 Page | 32 Page | 32 Page | 32 Page | 32 Page | 32 Page | 32 Page | 32 Page | 32 Page | 32 Page | 32 Page | 32 Page | 32 Page | 32 Page | 32 Page | 32 Page | 32 Page | 32 Page | 32 Page | 32
of owners (71-82%) that would still buy an electric car even without local incentives. But the relative value given by customers to different incentives varies significantly between geographic regions. Local incentives constitute strong arguments in favour of electric cars in some places (e.g. Oslo, some islands) (Box 2.2).
The role of fleets in the uptake of electric vehicles
Direct impacts
Fleet managers, both in public authorities and in businesses, enjoy a number of advantages in the deployment of a new car technology:
• Vehicles used in fleets tend to be operated more than vehicles owned by individuals. Given the far greater energy efficiency of electric cars and the much lower operational costs that this entails when they are compared with ICE versions, operators managing fleets with high rates of capital utilisation (i.e. high mileage, such as buses and taxis) are clearly subject to a stronger business case for choosing electric vehicles.
• Thanks to the lever of the large size of the fleet that they operate, fleet managers also have greater margins of negotiation with OEMs to reduce vehicle acquisition prices.
• Managers of company fleets are less subject to the application of very high implicit discount rates when making their decisions.
This has direct implications for purchasing decisions and direct impacts on the adoption of electric vehicle adoption.
Mobility-as-a-Service
The case of MaaS, which consists of a shift to a seamless ecosystem of mobility services that offer convenient, reliable, affordable and safe alternatives to the usual pattern of private passenger cars, is especially interesting in this context. Shared vehicles with high utilisation rates will likely favour powertrains with lower operational and maintenance costs, offering interesting opportunities for an increased uptake of EVs.18 In the Nordic region, Finland has recently implemented legislation aiming to situate the country as a global leader in transforming how mobility services are provided, specifically towards MaaS.
Box 2.4 • Finland’s Transport Services Act: a crucial step towards MaaS
The Finnish Transport Services Act (LVW, 2017), which goes into force in July 2018, establishes common rules for all providers of mobility services. Under the act, all public and private transport service providers will be required to open access to essential data such as routes, timetables, actual location and projected itinerary, prices and other accessibility information. Ticketing and payment systems will become increasingly open, online and inter-operable. For example, they will be required to be opened to Application Programming Interfaces and third-party service providers, allowing users the opportunity to purchase entire trips, regardless of whether these consist of a single-leg by one mode or are multistage and multimodal.
MaaS expands the priorities of public transport agencies beyond simply providing public transport services, to the role of a partner and facilitator, exploring and exploiting new business opportunities and facilitating demonstration projects. Public authorities could work in concert with private
18 The higher capital costs of EVs could be more quickly amortised by fleets with high annual mileage and therefore positively affected by the low operational cost of EVs.

© OECD/IEA 2018 Nordic EV Outlook 2018 Insights from leaders in electric mobility
Page | 33
Page | 33
Page | 33
Page | 33
Page | 33
Page | 33
Page | 33
Page | 33
Page | 33
Page | 33
Page | 33
Page | 33
Page | 33
Page | 33
Page | 33
Page | 33
Page | 33
Page | 33
Page | 33
Page | 33
Page | 33
Page | 33
Page | 33
Page | 33
Page | 33
Page | 33
Page | 33
Page | 33
companies on a wide range of projects, including to develop station districts as transport nodes to improve standards in travel chains and mobility services and to create automatic transport development areas in urban areas (Finnish Ministry of Economic Affairs and Employment, 2018). Public agencies will nonetheless maintain an important role in establishing minimum standards, for example, for safety, security and data privacy.
MaaS can also promote aggressive electrification in tandem with a shift to other ultra-low and zero-emission fuels to help Finland achieve its goal of decarbonising transport (Skytte, 2018). For example, plans for the continued build-out of recharging infrastructure will benefit from the data-driven approach enabling MaaS, facilitating strategic location and timing of infrastructure build-out and use.
While the focus of the first phase of the Transport Services Act has focussed on road transport, Finland envisions an expansion of MaaS to integrate all modes of transport, including road, rail, shipping and aviation.
Indirect impacts Fleet electrification can also stimulate the uptake of the electric car market beyond the boundaries of the fleet itself. The electrification of fleets is accompanied by the deployment of charging infrastructure, and this roll out may have positive spill over effects on the availability of chargers beyond the need of the fleets directly served. Copenhagen provides an example, where the electric car-sharing company “DriveNow” and the charging point operator “E.ON” created a partnership to apply for funds to extend the charging infrastructure required to power the fleet (Sørensen, 2017).
Based on this type of consideration, including the positive fall back on the deployment of destination chargers, the Icelandic Energy Agency is currently developing a policy framework to induce hotels and tourist facilities to adopt electric cars for their transport services.
Rental cars
Rental car fleets are another area that Nordic countries are targeting for electrification. Being driven by numerous people, rental cars are a potential amplifier of consumer awareness. Given the good consumer perception of the driving experience with these vehicles, as shown by the Norwegian survey of electric car owners, this exposure can exert an upward pressure on the chances for consumers to use and eventually purchase electric cars (Norsk Elbilforening, 2017).
In Iceland, rental cars account for 9% of the total car stock (Icelandic Transport Authority, 2017). Following their initial use, rental cars are generally sold into the second-hand vehicle market. The interest in the electrification of rental cars is also driven by growing demand for leasing arrangements in the Nordic region. This is especially relevant for electric vehicles, as it helps to overcome uncertainties related to their depreciation profile. In Denmark, where leasing is gaining ground as a way to acquire or use an electric car, the Capital Region of Denmark has, in collaboration with the Danish Energy Agency, supported, among others, the rental company “Sixt” to purchase several Renault ZOEs for short- and long-term leasing (Sørensen, 2017). Moreover, collaborations and partnerships between local authorities and private companies, as well as funding from the Danish Energy Agency, enhanced the coverage and quality of electric car-sharing services in Copenhagen (Box 2.5).

Nordic EV Outlook 2018 © OECD/IEA 2018 Insights from leaders in electric mobility
Page | 34 Page | 34 Page | 34 Page | 34 Page | 34 Page | 34 Page | 34 Page | 34 Page | 34 Page | 34 Page | 34 Page | 34 Page | 34 Page | 34 Page | 34 Page | 34 Page | 34 Page | 34 Page | 34 Page | 34 Page | 34 Page | 34 Page | 34 Page | 34 Page | 34 Page | 34 Page | 34 Page | 34
Box 2.5 • Electric car-sharing schemes in Denmark
Denmark hosts several electric car-sharing services. The main ones include DriveNow, GreenMobility and LetsGo.
DriveNow operates in many European countries, but Copenhagen is the only city where the DriveNow fleet is 100% electric. The service started in 2015 and now includes some 400 BMW i3s that can be booked via an app. The pricing models offered to customers include rates per minute, daily rates or monthly subscriptions (DriveNow, 2017).
GreenMobility operates in Copenhagen and the surrounding region. It started in late 2016 and includes more than 400 Renault ZOEs. The pricing models include rates per minute, daily rates or monthly subscriptions. These cars can be booked and accessed via an app (GreenMobility, 2017).
LetsGo operates in several cities of Denmark. It is a non-profit organisation founded in 2004. Initially, the car stock was entirely made up of ICE cars, but currently has 30 electric cars, representing 15% of the total fleet. LetsGo differs from the other car-sharing schemes in Denmark as it is a membership-based organisation, with dedicated parking. Customers pay based on time and distance travelled (LetsGo, 2017).
DriveNow and GreenMobility are commercial enterprises without continuous public funding. Nevertheless, partnerships with the public sector, such as funding in the Capital Region of Denmark for the deployment of charging infrastructure, have helped to expand the operational zone of these schemes, for example to serve hospitals.
Lessons from the Nordic experience on electric car uptake
The analysis of the electric car market development in the Nordic region provides interesting insights on the successes and lessons learned in the recent history of electric vehicle policy support instruments. These insights have a wide range of applicability, well beyond the Nordic case:
• Policy support has been the main driver of electric car adoption.
• Several policy choices in Nordic economies suggest that vehicles taxes differentiatedbased on environmental performance have a positive impact on the uptake of electriccars, especially if they bring the purchase price of low- and zero-emission vehicles to thelevel of ICE cars.
• Reducing the purchase price proved to be the main driver of the high electric caradoption rate, followed by waivers or partial exemptions on use and circulation taxes orcharges and other local policy incentives, such as free parking or access to bus lanes.
• Between BEVs and PHEVs, the electric vehicle technology option with the lowestpurchase price – after the application of incentives – tends to achieve the highest salesshare in each of the Nordic countries.
• Nordic choices – and in particular the Swedish decision to move to a bonus/malus systemfor the vehicle registration – suggest that vehicle purchase taxes can be designed toprovide adequate revenues to finance low- or zero-emission vehicles, to avoid beingeconomically unsustainable for governments.
• OEMs are producing BEVs for the small and mid-size car segments; there are almost noPHEVs in the small car segment. The absence of hybridisation witnessed in the small carmarket is explained by a limited benefit of increasing the complexity and cost of thepowertrain, while small ICE cars already come with relatively low fuel use per km.
• The case of Norway, with BEV cars steadily accounting for about 20% of the market sharein the past three years and the remaining increase coming from PHEVs, provides

© OECD/IEA 2018 Nordic EV Outlook 2018 Insights from leaders in electric mobility
Page | 35 Page | 35 Page | 35 Page | 35 Page | 35 Page | 35 Page | 35 Page | 35 Page | 35 Page | 35 Page | 35 Page | 35 Page | 35 Page | 35 Page | 35 Page | 35 Page | 35 Page | 35 Page | 35 Page | 35 Page | 35 Page | 35 Page | 35 Page | 35 Page | 35 Page | 35 Page | 35 Page | 35
important insights on the need to widen powertrain options to cover PHEVs, so that the electric car offer can serve a broad range of market segments to enable continued growth of the electric car market.
• Both the level of ambition and stability in the policy environment are important. This isregarded as a key characteristic for the successful deployment of electric cars in Norway.On the other hand, the discrepancy between initial announcements and followingadjustments in Denmark is seen as one of the factors that hampered the market'sdynamics after the decision to revise vehicle registration taxes in 2016.
• Fleets can play an important role in supporting the electrification of mobility because ofthe economic case stemming from the high rate of capital utilisation of fleet vehicles. TheFinnish leadership on MaaS could be a case providing strong positive signals for furtherdevelopment and replication.


© OECD/IEA 2018 Nordic EV Outlook 2018 Insights from leaders in electric mobility
Page | 37
Page | 37
Page | 37
Page | 37
Page | 37
Page | 37
Page | 37
Page | 37
Page | 37
Page | 37
Page | 37
Page | 37
Page | 37
Page | 37
Page | 37
Page | 37
Page | 37
Page | 37
Page | 37
Page | 37
Page | 37
Page | 37
Page | 37
Page | 37
Page | 37
Page | 37
Page | 37
Page | 37
3. Electric vehicle supply equipment This section provides an overview of the status of electric vehicles charging infrastructure in the Nordic countries, highlighting EVSE deployment and policy support to date. It also looks at actors that have been contributing to the development of charging infrastructure, recognising that a number of stakeholders are exploring business models for various EVSE types and new companies are regularly entering the market.
Standards and types of chargers
The Global EV Outlook 2017 provided an overview of the various international standards and types of chargers (IEA, 2017a). This section presents further insights on the status of European standards and charger types, focusing on conductive charging (Table 3.1).1
Table 3.1 • Characteristics of EVSE in the Nordic region
Current Level Power Mode Connector type
Devices installed in households, the primary purpose of which is not to recharge electric vehicles
AC Level 1 ≤ 3.7 kW Mode 1-2 Type G (Iceland) and Type C
(other countries)
Slow EV chargers (private or public)
AC Level 2 ≥ 3.7 kW and
Mode 2-3
IEC 62196 Type 2 (7-22 kW); Commando (7-22 kW)
≤ 22 kW Tesla connector
Fast EV chargers (publicly available)
AC, tri-phase
Level 2 > 22 Kw
Mode 3 IEC 62196-2 Type 2 and ≤ 43.5 kW
DC Level 3
> 22 kW
Mode 4
CCS Combo 2 Connector (IEC 62196-3 Type 2) (50 kW)
and ≤ 150 kW
CHAdeMO (IEC 62196-3 Type 4) (50 kW)
Tesla (120 kW)
Ultra-fast/high-power EV chargers (intended for public use, but not yet deployed)
DC Level 3
> 150 kW
Mode 4
CCS Combo 2 (IEC 62196-3) (150 – 350 kW) and CHAdeMO (150 - 350 kW)
and ≤ 350 kW
Notes: kW = kilowatt; AC = alternating current; DC = direct current; CCS = Combined Charging System, CHAdeMO = Charge de Move. Type 2 IEC 62196-2 and 62196-3 (CCS Combo 2) connectors are mandated by the EU 2014/94 Directive.
Note that in Norway it is not legal to continuously charge at 3.7 kW from a Type C, normally limited at 2.9 – 3.4 kW (Figenbaum, 2018).
Sources: IEA (2017a); IEC (2014a); IEC (2014b); IEC (2016); ABB (2017b); and Ionity (2017).
Key point: Power output, sockets and connectors of EVSE used in the Nordic region are aligned with European standards and practices.
1 Most of current EVSE in the Nordic region is based on conductive charging. There are some experiments with inductive charging (wireless) (Unplugged, 2015), though there has been no large-scale rollout.

Nordic EV Outlook 2018 © OECD/IEA 2018 Insights from leaders in electric mobility
Page | 38 Page | 38 Page | 38 Page | 38 Page | 38 Page | 38 Page | 38 Page | 38 Page | 38 Page | 38 Page | 38 Page | 38 Page | 38 Page | 38 Page | 38 Page | 38 Page | 38 Page | 38 Page | 38 Page | 38 Page | 38 Page | 38 Page | 38 Page | 38 Page | 38 Page | 38 Page | 38 Page | 38
The three main EVSE characteristics that differentiate chargers from one another include:
• Level, describing the power output range of the EVSE outlet.
• Type, referring to the socket and connector being used for charging.
• Mode, which describes the communication protocol between the vehicle and the charger.
These characteristics help accommodate the charging capabilities of the various electric car models available on the European market.
The Nordic region closely aligns with standards and practices adopted in other European countries and many homes already accommodate some electrical infrastructure due to the wide use of block heaters. Common standards in the Nordic countries are:
• Standards regarding plugs, socket/outlets, vehicle connectors and vehicle inlets for the conductive charging of electric vehicles (Level 2 and 3 chargers) are those developed by the International Electrochemical Commission (IEC): IEC 62196-1 (general requirements), IEC 62196-2 (AC charging, level 2) and IEC 62196-3 (AC and DC charging, level 3).2
• Many charging points also work with a Charge de Move (CHAdeMO) technology. This is especially relevant for electric cars from Japanese manufacturers.
• Tesla uses its own standards and connectors for its proprietary charging infrastructure.
Table 3.1 includes the ultra-fast/high-power chargers category, which are not yet available. Currently, none of the available electric car models can use high-power chargers. This reflects announcements by E.ON, CLEVER and Ionity3 in the course of 2017 that show the interest of the private sector (utilities and OEMs) for EVSE that could fully recharge long-range electric cars in less than half an hour. These newly announced high-power chargers make use of Combined Charging System (CCS) Combo 2 connectors (Ionity, 2017).
Status of EVSE deployment
The number of power outlets used for the supply of electricity for electric cars in the Nordic region was close to 264 000 in 2017, of which more than 16 000 are publicly accessible (Figure 3.1 and Figure 3.2).4, 5 More than 94% of all power outlets used for electric car charging are installed in homes or workplaces. This matches the importance of private charging expressed in consumer preferences (Figure 3.4).
Growth rates of all types of EVSE have been falling in the past year, despite remaining in the double-digit range. The decline was strongest for fast charging points. For the first time in 2017, growth was stronger in publicly accessible slow chargers (including destination chargers) than of fast chargers (Figure 3.1). All Nordic countries have developed fast charging
2 The IEC is one the main global standard setting organisation for electrical, electronic and related technologies. 3 Joint venture of BMW group, Daimler AG, Ford Motor Company and the Volkswagen Group. 4 The cold climate in the Nordic countries led to extensive deployment of engine block heaters and other power outlets (primarily Level 1 outlets) to ensure that ICE cars can be effectively used during the winter. This infrastructure, which accounts for more than 600 000 outlets in Sweden (Wikström, 2018), is not included in the assessment made here for private chargers. 5 Private chargers are estimated assuming that each electric car is coupled with a private charger, either at home or at the workplace. As a growing number of electric cars are sold in urban areas where opportunities for private parking and charging may be limited, the assumption of one private charger per EV may need to be revised in the future. Recent Norwegian electric car owner survey data indicates that there are only around 90 home EVSE outlets per 100 EVs (Norsk Elbilforening, 2017). However, the same survey also indicates that approximately 20% charge their EV every day at work (another 15% do so weekly), indicating the existence of a certain number of workplace private chargers that, combined with home chargers, broadly validate the assumption of one private charger per electric car.

© OECD/IEA 2018 Nordic EV Outlook 2018 Insights from leaders in electric mobility
Page | 39 Page | 39 Page | 39 Page | 39 Page | 39 Page | 39 Page | 39 Page | 39 Page | 39 Page | 39 Page | 39 Page | 39 Page | 39 Page | 39 Page | 39 Page | 39 Page | 39 Page | 39 Page | 39 Page | 39 Page | 39 Page | 39 Page | 39 Page | 39 Page | 39 Page | 39 Page | 39 Page | 39
corridors (with one EVSE outlet every 50-60 kilometres), although only Denmark and Iceland reached full country coverage (EC, 2017b; Friðleifsson, 2017). Further expansion is expected with higher electric car uptake.
Figure 3.1 • Number of charging outlets in the Nordic region, 2010-17
Notes: Private chargers are estimated assuming that each electric car is coupled with a private charger (level 1 or level 2), either at home or at the workplace. Chargers (especially fast chargers) can come with different connectors, but they can typically be used by one vehicle at a time. It is not possible to charge DC CCS and CHAdeMO simultaneously, but Type 2 AC and one DC type can (with some exceptions due to power capacity constraints). This assessment attempts to account for the number of chargers potentially accessible simultaneously. Fast chargers with multiple DC connectors coupled with a single parking space are only accounted here as one charging point.
Denmark and Finland only include deployment numbers until September 30 2017.
Sources: IEA analysis based on Nordic country submissions, complemented by EAFO (June 2017) and Flader (2017).
Key point: EVSE deployment increased across all types of chargers in 2017. For the first time the growth of publicly available slow chargers outpaced that of fast chargers in 2017.
Figure 3.2 • Electric car stock and publicly available EVSE outlets, by type of charger and country, 2017
Sources: IEA analysis based on Nordic country submissions, complemented by EAFO (2017) and Nobil (2018).
Key point: Norway dominates public charging infrastructure deployment in the region, though at a lower level than electric car penetration levels would suggest.
The number of chargers and their characteristics (publicly accessible or not, slow or fast) differ across the Nordic region, partly reflecting the gaps in terms of the number of electric vehicles circulating in each country, and partly influenced by country-specific factors.
• Norway is leading public chargers deployment in absolute terms, with more than9 000 charging points available in 2017. Over the 2011-17 period, the average annualgrowth rate was 20%, well above the 12% increase in 2017. This suggests that Norway isnow experiencing a decline in the ratio of EVSE outlet per electric car (Figure 3.2).
0%
50%
100%
150%
200%
250%
300%
0
50
100
150
200
250
300
2010 2011 2012 2013 2014 2015 2016 2017
Year
-on-
year
gro
wth
rat
e
Char
ging
out
lets
(tho
usan
ds)
Private chargers
Publicly available fastchargers
Publicly available slowchargers
Growth rate of publiclyavailable fast chargers
Growth rate of publiclyavailable slow chargers
Growth rate of privatechargers
4% 3% 2%
71%
20%
Electric car stock247 000
12% 5%0.6%
58%
25%
Publicly available slow chargers14 000 outlets
15%
7%1%
51%
26%
Publicly available fast chargers2 300 outlets
Denmark
Finland
Iceland
Norway
Sweden

Nordic EV Outlook 2018 © OECD/IEA 2018 Insights from leaders in electric mobility
Page | 40 Page | 40 Page | 40 Page | 40 Page | 40 Page | 40 Page | 40 Page | 40 Page | 40 Page | 40 Page | 40 Page | 40 Page | 40 Page | 40 Page | 40 Page | 40 Page | 40 Page | 40 Page | 40 Page | 40 Page | 40 Page | 40 Page | 40 Page | 40 Page | 40 Page | 40 Page | 40 Page | 40
• Sweden has the second-highest number of public EVSE outlets in the Nordic region with almost 4 100 at end-2017. Large-scale public charging deployment started later than in Norway, but the number of chargers has increased rapidly, with an average annual growth rate of 54% in the 2015-17 period.
• Denmark, with around 2 000 public EVSE outlets, has seen a high growth rate (around 70%) in 2014 and 2015, followed by a slowdown to around 10% growth in 2016-17, in conjunction with the decline in sales of new electric cars. Denmark is also the Nordic country with the highest EVSE outlet per electric car ratio (Figure 3.3). This is consistent with continued policy support of the Danish government for the deployment of EVSE outlets, despite mixed signals coming from the vehicle taxation structure. Additionally, the dynamic development of electric car-sharing services requires a greater availability of publicly accessible chargers.
• Finland saw rapid EVSE development in the 2013-16 period, but a limited increase in the number of publicly accessible chargers in 2017. The country still has a relatively high share of chargers per electric car compared to its neighbours, which indicates that there is further growth potential in the electric car market with the charging infrastructure already in place.
• Iceland had no publicly accessible chargers before 2014. EVSE deployment grew from just 8 public EVSE outlets in 2014 to more than 110 in 2017. However, Iceland still has the lowest publicly accessible EVSE per electric car ratio of all Nordic countries. The low ratio is mostly driven by concentrated geographical distribution of population and quickly accelerating electric car uptake.
When looking across the whole Nordic region, there is also no clear correlation between the number of public charging points and the growth in electric cars (Figure 3.3).
Figure 3.3 • Ratio of publicly accessible EVSE outlets per electric car in the Nordic region, 2017
Note: Data for Denmark and Finland are updated until 30 September 2017. Sources: IEA analysis based on country submissions, complemented by EAFO (2017) and Flader (2017).
Key point: Ratios of publicly accessible EVSE outlets per electric car vary significantly: Norway and Iceland, the countries with the most advanced electric car markets, show the lowest ratios.
Publicly accessible charging infrastructure is instrumental to ensure accessibility and build trust in electric mobility, but it is not critical to determine the extent of the electric car uptake, at least initially (see, for instance, Lorentzen et al., 2017). Depending on the size of the country and the housing stock or urbanisation rate, optimal charging infrastructure ratios may fluctuate:
• In Norway, the number of public charging outlets has not kept up with the rapid growth in electric car sales, resulting in a declining ratio of EVSE outlets per electric car. This suggests that, even if publicly accessible charging infrastructure needs to cover the
0%
2%
4%
6%
8%
10%
0.00
0.05
0.10
0.15
0.20
0.25
Den
mar
k
Finl
and
Icel
and
Nor
way
Swed
en
BEV
shar
e in
sto
ck
EVSE
/ele
ctri
c ca
r
EVSE/Electric car(total)
EVSE/Electric car(slow)
EVSE/Electric car(fast)
BEV share in PLDVstock
EU 2020 target (left-axis)

© OECD/IEA 2018 Nordic EV Outlook 2018 Insights from leaders in electric mobility
Page | 41
Page | 41
Page | 41
Page | 41
Page | 41
Page | 41
Page | 41
Page | 41
Page | 41
Page | 41
Page | 41
Page | 41
Page | 41
Page | 41
Page | 41
Page | 41
Page | 41
Page | 41
Page | 41
Page | 41
Page | 41
Page | 41
Page | 41
Page | 41
Page | 41
Page | 41
Page | 41
Page | 41
requirements of electric car drivers to ensure the availability of a recharging possibility – especially in early stages of market development when consumer trust needs to be built – the demand for such chargers does not necessarily need to grow at the same pace as the electric car stock.
• At the city level, Oslo has among the highest share of public chargers per million inhabitants, surpassing the 2 000 mark and rivalled only by cities in the Netherlands. Bergen, Norway has installed public EVSE outlets at only half of Oslo’s rate, while their electric car market share has been at a similar level (ICCT, 2017).
Charging behaviour: Lessons from Norway and Sweden
This section provides insights on charging behaviour, building primarily from surveys which analyse consumer behaviour for electric car charging practices. It focuses primarily on Norway and Sweden, the countries accounting for the vast majority of electric vehicles in the Nordic region. Similar research suggests that electric car charging practices are largely similar in Denmark (Hug, 2015).
Norway
Surveys of Norwegian BEV and PHEV owners suggest that electric car drivers most frequently charge their vehicles at home or at work, relying on slow chargers (Figenbaum, Kolbenstvedt and Elvebakk, 2014; Figenbaum and Kolbenstvedt, 2016 and Norsk Elbilforenung, 2017). In Norway, 63% of private home chargers are ordinary plugs without additional functionalities, while 19% are chargers with a 3.7 kilowatt (kW) wall box, 12% with a 7-22 kW wall box, 3% with a Tesla charger and 3% did not specify (Norsk Elbilforenung, 2017).
The preference for using private home chargers matches the fairly limited number of long-distance trips of electric cars, which are mostly used for commuting (92%) to work and common day trips (57%) (Norsk Elbilforening, 2017). Home charging has also proven to be reliable for most households: almost 90% of Norwegian electric car owners have never experienced issues with it (Nordic Elbilforening, 2017). This has positive implications in containing the costs of home charging.
The third most frequent charging choice (after home and workplace) is publicly available slow chargers, followed by chargers located at commercial and leisure facilities (charging at a destination) such as supermarkets, hotels or restaurants. The predominant use of slow chargers is consistent with the preference of Norwegian electric car owners to typically drive 20-40 km/day (Norsk Elbilforening, 2017), as this leads to fairly limited amount of energy and time needed for daily recharges (less than 1.5 hours with a 6 kW charger, with 40 km and 0.2 kWh/km).
Fast charging is not used frequently, and it primarily takes the form of planned stops for long-distance trips (Figenbaum and Kolbenstvedt, 2016). Consumers that use fast charging stations have had limited problems with queues (Figenbaum, Kolbenstvedt and Elvebakk, 2014). This indicates that the deployment speed of fast chargers can handle the needs of the existing electric car stock.
A comparison of survey results since 2014 indicates that publicly accessible fast chargers are used more frequently, while relatively fewer people use publicly accessible slow chargers (Figure 3.4). This could partly be explained by the improved coverage of fast charging networks. Work charging and home charging have been used less frequently since 2014, possibly reflecting the increase in battery capacity and electric car drive ranges.

Nordic EV Outlook 2018 © OECD/IEA 2018 Insights from leaders in electric mobility
Page | 42 Page | 42 Page | 42 Page | 42 Page | 42 Page | 42 Page | 42 Page | 42 Page | 42 Page | 42 Page | 42 Page | 42 Page | 42 Page | 42 Page | 42 Page | 42 Page | 42 Page | 42 Page | 42 Page | 42 Page | 42 Page | 42 Page | 42 Page | 42 Page | 42 Page | 42 Page | 42 Page | 42
Figure 3.4 • Frequency of charging by EVSE category in Norway, 2014-17
Notes: The surveys used to develop this graph have wide coverage of electric car owners. However, the 2017 data do not cover the same group of participants as the 2014 and 2016 data. The survey questions also varied slightly over time. Location categories have been harmonised here to: publicly accessible fast (average use in winter and summer period), publicly accessible slow, workplace and home chargers – including garage, carport (open-air parking place). Weighting factors for detached houses and apartment buildings were based on the 2017 distribution. The time categories are harmonised to daily (every day, three-five times per week), weekly (once or twice a week), monthly (less frequent, 1-2 days per month, infrequent) and never.
Sources: IEA elaboration based on results from Figenbaum et al. (2014); Figenbaum and Kolbenstvedt (2016); and Norsk Elbilforening (2017).
Key point: Electric car owners charge their vehicles most frequently at home or the workplace. Frequent users of publicly accessible fast charging have increased, while those of publicly accessible slow charging have decreased since 2014.
The preference for home and workplace charging matches fairly well the fact that Norwegian electric car owners are only modestly satisfied with the publicly available charging infrastructure (Norsk Elbilforening, 2017). In practice, only 4% of electric car owners have experienced an empty battery and less than a quarter experienced a “close call”. In addition, electric car owners also saw charging time as the second-largest disadvantage of owning an electric car, following range limitations (Figenbaum, Kolbenstvedt and Elvebakk, 2014). Almost 20% of electric car owners in Norway did not use their electric car on several occasions due to the lack of chargers and more than 10% due to long charging times (Norsk Elbilforening, 2017). This is in line with the findings of a recent survey which shows that in Norway the perceived lack of charging infrastructure, either at home or while driving, is the single largest reason why consumers are not considering the purchase of an electric car (Norsk Elbilforening, 2018).
Sweden
In Sweden, up to 80% of electric car users live in individual houses (Granström et al., 2017), compared to around 50% for the general population (SCB, 2014).6 The higher availability of private charging options is a likely explanation for the difference.
Swedish survey results broadly confirm the key observations on charging habits observed in from consumer behaviour in Norway (Granström et al., 2017):
• Home charging dominates other forms of charging and more than two-thirds of respondents use the regular Type C socket and plug.
6 Around 40% of BEV owners and 30% of PHEV owners live in towns with a population of less than 10 000 inhabitants.
0%
10%
20%
30%
40%
50%
60%
70%
80%
90%
100%
2014 2016 2017 2014 2016 2017 2014 2016 2017 2014 2016 2017
Publicly accessiblefast
Publicly accessibleslow
Work Home
Never
Monthly
Weekly
Daily

© OECD/IEA 2018 Nordic EV Outlook 2018 Insights from leaders in electric mobility
Page | 43
Page | 43
Page | 43
Page | 43
Page | 43
Page | 43
Page | 43
Page | 43
Page | 43
Page | 43
Page | 43
Page | 43
Page | 43
Page | 43
Page | 43
Page | 43
Page | 43
Page | 43
Page | 43
Page | 43
Page | 43
Page | 43
Page | 43
Page | 43
Page | 43
Page | 43
Page | 43
Page | 43
• Most home charging takes place at the residence. Very few electric car owners charge their car at a publicly available street parking place near the house. Charging at work is also relatively common: 35-40% of people surveyed claim to do so daily or weekly.
Charging when parked at shopping centres and other commercial or leisure destinations is not very common: 65-70% of electric car owners never or seldom use that option. Other public charging, including fast charging on highways, is used more frequently: nearly half of BEV owners claim to charge on highway fast chargers at least on a monthly basis (and very few on a daily basis). The reliance on publicly available chargers is also lower for PHEV than for BEV owners (Granström et al., 2017).
Overall, this suggests that Swedish electric car users charge mostly overnight, use their vehicle during the day without any detours for charging, and charge again at the end of the day at home. This charging behaviour is the most common among both private users and professional fleets. The need for intermediate charging during the day is in general very low and, if it occurs on an everyday basis, it is typically taking the form of workplace charging, or it is the case for transport-intense businesses such as taxis or couriers (Wikström, 2018).
In the city of Stockholm, the first EVSE deployment focused on the public parking company to facilitate charging in their garages, and specifically enable charging for their tenants. A second EVSE deployment phase focused on public charging and studied different established locations and included a comprehensive user survey, looking at when, where and why did electric car owners use public charging (City of Stockholm, 2015; City of Stockholm, 2016). Results from this survey, which looked at more than 300 electric car users, identify two distinct user groups of public charging. The first group used normal charging only when they knew that they would be parked for several hours. Typically, during a workday at a parking place near the workplace or at public transport node. The second group almost only used fast charging. Users in both these groups resist changing their charging behaviour, since any other option was perceived as not worth the effort. The study shows that different types of public charging infrastructure serve various user needs. The findings suggest a need for good understanding of the location options and anticipated user behaviour in planning and prior to investments in EVSE (City of Stockholm, 2016). Following this survey, one of the actions carried out in Stockholm to promote the equivalent to home charging for potential electric car adopters without access to a parking place is the establishment of “charging streets” that cluster parking spaces with EVSE facilities (including fast charging) in groups of ten or more on targeted public streets. To ensure overnight charging, flexible parking regulations have also been applied. The maximum stay during the daytime is three hours (City of Stockholm, 2018).
EVSE ecosystem
The successful integration of EVSE in the broad electricity network requires a careful look into the operational aspects of the charging infrastructure value chain (Figure 3.5).
In its simplest form, the EVSE value chain consists of customers purchasing electricity for EV charging from a power retailer via a charge point operator (CPO) or via an e-mobility service provider (EMSP) (except for general private household charging). A CPO is responsible for the maintenance and operation of a charging point, while an EMSP mostly deals with communication and billing of electric car users. In many cases, CPOs and EMSPs are the same organisation, but the distinction between the two is made, because EMSPs also address access to charging points of other CPOs (ELaad, 2016).
A CPO is a business actor, buying energy from power suppliers and delivering it to end-users (electric car users). Electric utilities or their subsidiaries are typical examples of CPOs, suggesting

Nordic EV Outlook 2018 © OECD/IEA 2018 Insights from leaders in electric mobility
Page | 44 Page | 44 Page | 44 Page | 44 Page | 44 Page | 44 Page | 44 Page | 44 Page | 44 Page | 44 Page | 44 Page | 44 Page | 44 Page | 44 Page | 44 Page | 44 Page | 44 Page | 44 Page | 44 Page | 44 Page | 44 Page | 44 Page | 44 Page | 44 Page | 44 Page | 44 Page | 44 Page | 44
that there is a case for charging point operations to be directly linked to retail electricity. The largest CPOs are generally energy companies or entities owned by energy companies.7 Fortum was one of the first energy companies extensively stepping into the EVSE market and is still a major player in Norway, Sweden and Finland. Several others followed, e.g. E.ON in Denmark and Vattenfall in Sweden. CLEVER, a Danish EVSE company, is owned by groups of medium-size energy companies that decided to collaborate to be able to compete with larger utilities. Similarly, the EVSE service company Virta is owned by groups of smaller energy companies in Finland.
Figure 3.5 • Stakeholders and competencies in the EVSE value chain
Note: Dark blue stakeholders are part of the simple value chain and light blue stakeholders are part of the extended value chain.
Sources: IEA analysis complemented by ELaad (2016) and WBS (2017).
Key point: The value chain of charging infrastructure stretches from car makers to the electricity grid and involves a large number of stakeholders.
CPOs require the EVSE installation to operate and interact with EVSE hardware manufacturers and software providers,8 as well as a land owner9 on whose land the charger will be installed, to ensure that they can operate.10 Other players in the EVSE value chain include:
• Regulators designing and managing electricity tariffs, setting rules to ensure the reliability and robustness of the grid by ensuring the financial health of utilities and defining the conditions to renew or upgrade infrastructure.
• A clearinghouse ensuring that transactions and payment are automatically processed, following a set of check and validation rules in a system that is setup mostly by overarching institutions.
A number of businesses operating in the Nordic EVSE value chain offer cross-border charging services, which demonstrates that there are business opportunities operating across the Nordic
7 The clear rationale for the interest in the operation of charging points for utilities is the possibility to reach a new market segment for electricity sales and provide additional services to existing customers. 8 Examples of Nordic hardware suppliers for electric vehicle charging systems are Ensto (Finland), GARO (Sweden) and Chargestorm (Sweden). 9 This can either be public land (e.g. managed by the municipality) or private land (e.g. shopping mall or a petrol station). For commercial domain owners, there is a business case in offering free electric charging to attract more customers. Examples are grocery stores such as Lidl, which co-operates with ABB for the installation and operation of fast chargers at several of their stores (ABB, 2016) and Swedish supermarket ICA chain which currently has 15 charging stations available (ICA, 2017). McDonalds, which offers electric car charging in co-operation with Fortum in Norway, Sweden and Finland, is another example. 10 Location is considered by many businesses as one of the prime factors that determines the success of charging (Palola, 2017).
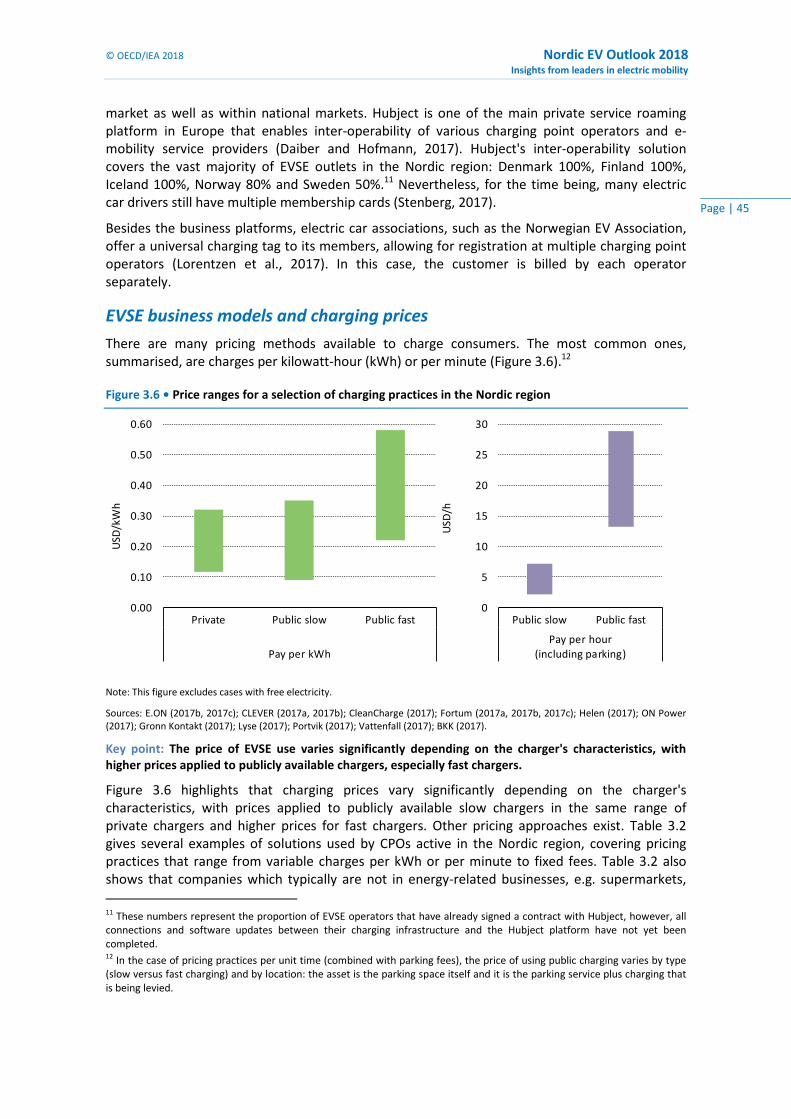
© OECD/IEA 2018 Nordic EV Outlook 2018 Insights from leaders in electric mobility
Page | 45
Page | 45
Page | 45
Page | 45
Page | 45
Page | 45
Page | 45
Page | 45
Page | 45
Page | 45
Page | 45
Page | 45
Page | 45
Page | 45
Page | 45
Page | 45
Page | 45
Page | 45
Page | 45
Page | 45
Page | 45
Page | 45
Page | 45
Page | 45
Page | 45
Page | 45
Page | 45
Page | 45
market as well as within national markets. Hubject is one of the main private service roaming platform in Europe that enables inter-operability of various charging point operators and e-mobility service providers (Daiber and Hofmann, 2017). Hubject's inter-operability solution covers the vast majority of EVSE outlets in the Nordic region: Denmark 100%, Finland 100%, Iceland 100%, Norway 80% and Sweden 50%.11 Nevertheless, for the time being, many electric car drivers still have multiple membership cards (Stenberg, 2017).
Besides the business platforms, electric car associations, such as the Norwegian EV Association, offer a universal charging tag to its members, allowing for registration at multiple charging point operators (Lorentzen et al., 2017). In this case, the customer is billed by each operator separately.
EVSE business models and charging prices There are many pricing methods available to charge consumers. The most common ones, summarised, are charges per kilowatt-hour (kWh) or per minute (Figure 3.6).12
Figure 3.6 • Price ranges for a selection of charging practices in the Nordic region
Note: This figure excludes cases with free electricity.
Sources: E.ON (2017b, 2017c); CLEVER (2017a, 2017b); CleanCharge (2017); Fortum (2017a, 2017b, 2017c); Helen (2017); ON Power (2017); Gronn Kontakt (2017); Lyse (2017); Portvik (2017); Vattenfall (2017); BKK (2017).
Key point: The price of EVSE use varies significantly depending on the charger's characteristics, with higher prices applied to publicly available chargers, especially fast chargers.
Figure 3.6 highlights that charging prices vary significantly depending on the charger's characteristics, with prices applied to publicly available slow chargers in the same range of private chargers and higher prices for fast chargers. Other pricing approaches exist. Table 3.2 gives several examples of solutions used by CPOs active in the Nordic region, covering pricing practices that range from variable charges per kWh or per minute to fixed fees. Table 3.2 also shows that companies which typically are not in energy-related businesses, e.g. supermarkets, 11 These numbers represent the proportion of EVSE operators that have already signed a contract with Hubject, however, all connections and software updates between their charging infrastructure and the Hubject platform have not yet been completed. 12 In the case of pricing practices per unit time (combined with parking fees), the price of using public charging varies by type (slow versus fast charging) and by location: the asset is the parking space itself and it is the parking service plus charging that is being levied.
0.00
0.10
0.20
0.30
0.40
0.50
0.60
Private Public slow Public fast
Pay per kWh
USD
/kW
h
0
5
10
15
20
25
30
Public slow Public fast
Pay per hour(including parking)
USD
/h
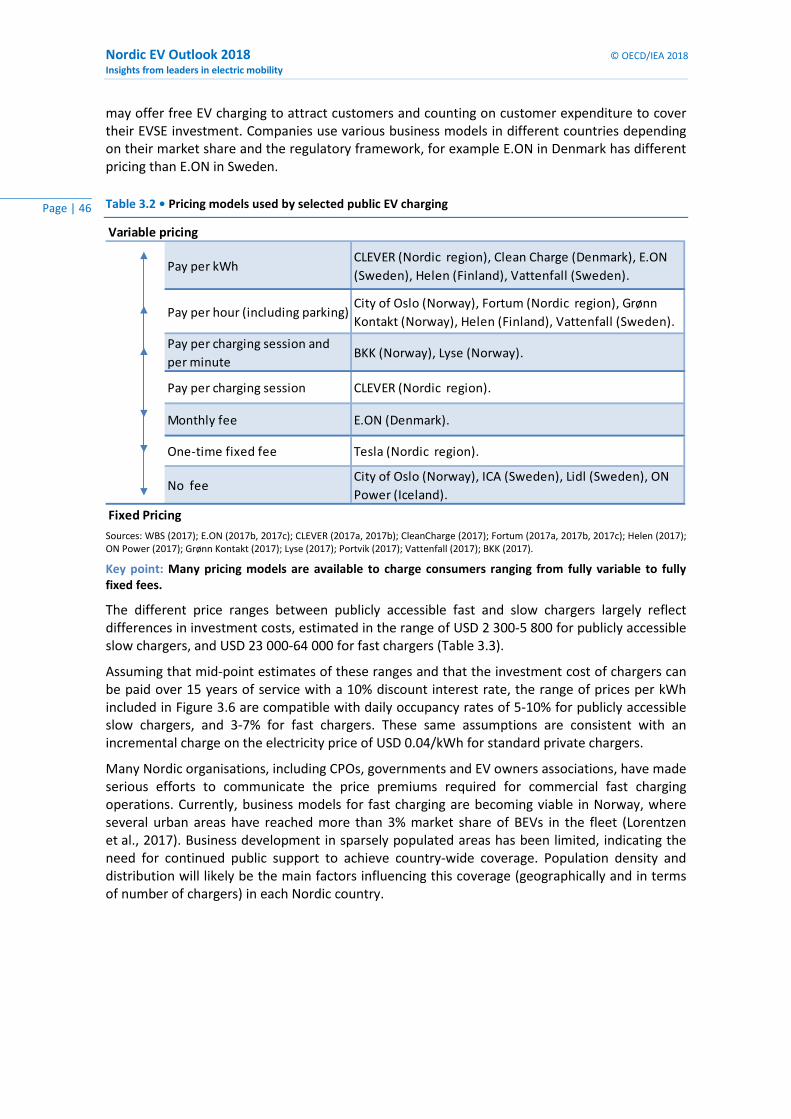
Nordic EV Outlook 2018 © OECD/IEA 2018 Insights from leaders in electric mobility
Page | 46 Page | 46 Page | 46 Page | 46 Page | 46 Page | 46 Page | 46 Page | 46 Page | 46 Page | 46 Page | 46 Page | 46 Page | 46 Page | 46 Page | 46 Page | 46 Page | 46 Page | 46 Page | 46 Page | 46 Page | 46 Page | 46 Page | 46 Page | 46 Page | 46 Page | 46 Page | 46 Page | 46
may offer free EV charging to attract customers and counting on customer expenditure to cover their EVSE investment. Companies use various business models in different countries depending on their market share and the regulatory framework, for example E.ON in Denmark has different pricing than E.ON in Sweden.
Table 3.2 • Pricing models used by selected public EV charging
Sources: WBS (2017); E.ON (2017b, 2017c); CLEVER (2017a, 2017b); CleanCharge (2017); Fortum (2017a, 2017b, 2017c); Helen (2017); ON Power (2017); Grønn Kontakt (2017); Lyse (2017); Portvik (2017); Vattenfall (2017); BKK (2017).
Key point: Many pricing models are available to charge consumers ranging from fully variable to fully fixed fees.
The different price ranges between publicly accessible fast and slow chargers largely reflect differences in investment costs, estimated in the range of USD 2 300-5 800 for publicly accessible slow chargers, and USD 23 000-64 000 for fast chargers (Table 3.3).
Assuming that mid-point estimates of these ranges and that the investment cost of chargers can be paid over 15 years of service with a 10% discount interest rate, the range of prices per kWh included in Figure 3.6 are compatible with daily occupancy rates of 5-10% for publicly accessible slow chargers, and 3-7% for fast chargers. These same assumptions are consistent with an incremental charge on the electricity price of USD 0.04/kWh for standard private chargers.
Many Nordic organisations, including CPOs, governments and EV owners associations, have made serious efforts to communicate the price premiums required for commercial fast charging operations. Currently, business models for fast charging are becoming viable in Norway, where several urban areas have reached more than 3% market share of BEVs in the fleet (Lorentzen et al., 2017). Business development in sparsely populated areas has been limited, indicating the need for continued public support to achieve country-wide coverage. Population density and distribution will likely be the main factors influencing this coverage (geographically and in terms of number of chargers) in each Nordic country.
Pay per kWhCLEVER (Nordic region), Clean Charge (Denmark), E.ON (Sweden), Helen (Finland), Vattenfall (Sweden).
Pay per hour (including parking)City of Oslo (Norway), Fortum (Nordic region), Grønn Kontakt (Norway), Helen (Finland), Vattenfall (Sweden).
Pay per charging session and per minute
BKK (Norway), Lyse (Norway).
Pay per charging session CLEVER (Nordic region).
Monthly fee E.ON (Denmark).
One-time fixed fee Tesla (Nordic region).
No feeCity of Oslo (Norway), ICA (Sweden), Lidl (Sweden), ON Power (Iceland).
Variable pricing
Fixed Pricing

© OECD/IEA 2018 Nordic EV Outlook 2018 Insights from leaders in electric mobility
Page | 47
Page | 47
Page | 47
Page | 47
Page | 47
Page | 47
Page | 47
Page | 47
Page | 47
Page | 47
Page | 47
Page | 47
Page | 47
Page | 47
Page | 47
Page | 47
Page | 47
Page | 47
Page | 47
Page | 47
Page | 47
Page | 47
Page | 47
Page | 47
Page | 47
Page | 47
Page | 47
Page | 47
Table 3.3 • Overview of investment cost for chargers in Sweden, USD 2017
Type Year Charging point (USD thousand)
Installation (USD thousand)
Grid upgrade (USD thousand)
Total (USD thousand)
Home (2.4 to 6.4 kW) 2017
0.6 - 1.4
Publicly accessible slow (3.7-11 kW)
2017 0.6 0.8 - 2.3
Publicly accessible slow (6.4 kW)
2014 1.1 - 1.2 0.6 - 1.2
1.8 - 2.1
Publicly accessible slow (22 kW)
2017 2.3 - 5.8
Publicly accessible fast (43-50 kW)
2017 18 - 29 2.3 - 18 3.5 - 18 23 - 64
High power (350 kW) (Europe-wide)
2017 225
Sources: Emobility Sweden (2017); City of Stockholm (2016); Autoblog (2017).
Key point: Investment costs vary widely across charger types, with much higher investment required for publicly available chargers, especially fast chargers.
Inter-operability
From a business perspective, increasing access through inter-operability leads to higher revenues for CPOs due to higher utilisation rates. Services from roaming platforms and EMSP allow for more visibility and reliability of the EVSE network. For example, Hubject provides its customers a map of all connected charging points and their status. Hubject charges the CPO around USD 25 per activated EV user per year. E-mobility service provides pay a fixed one-time fee and a yearly variable fee depending on the charging points they want to connect to the platform (Daiber and Hofmann, 2017). The variety of hardware standards and the availability of various software protocols to enable charging also add a layer of complexity to electric vehicle charging.
Grid usage charges
Another challenge for CPOs is the current pricing structure used by distribution system operators (DSOs). Most DSOs charge a flat tariff, regardless of the time of the day. Fast charging often has peak effects during evenings (NVE, 2016a). These peaks are expensive and since the volume of kWh used in sparsely populated areas is relatively low, the actual grid cost per kWh can be over EUR 1/kWh (USD 1.13/kWh) (Ihle, 2017). Historically, grid customers (consumers or CPOs) that experience high peaks also have high energy use, leading to relatively low grid cost per kWh, e.g. EUR 0.05/kWh (USD 0.06/kWh). However, the costs of handling demand at peak times are 20-times lower than for some fast charging sessions in sparsely populated areas where similar peak demand will occur due to electric car charging. Depending on the regulatory framework, DSOs and/or CPOs determine who carries the burden of these additional costs.
Policy and regulations supporting EVSE deployment
Publicly accessible EVSE deployment is relevant as an instrument to ensure charging service availability, building trust and reducing “range anxiety”. This led to the development of a broad range of policy instruments aiming to stimulate its deployment. This section reviews existing policy support distinguishing between fiscal policies (such as public funding and investments) and regulatory measures. Policies are also clustered here according to their geographical scope of
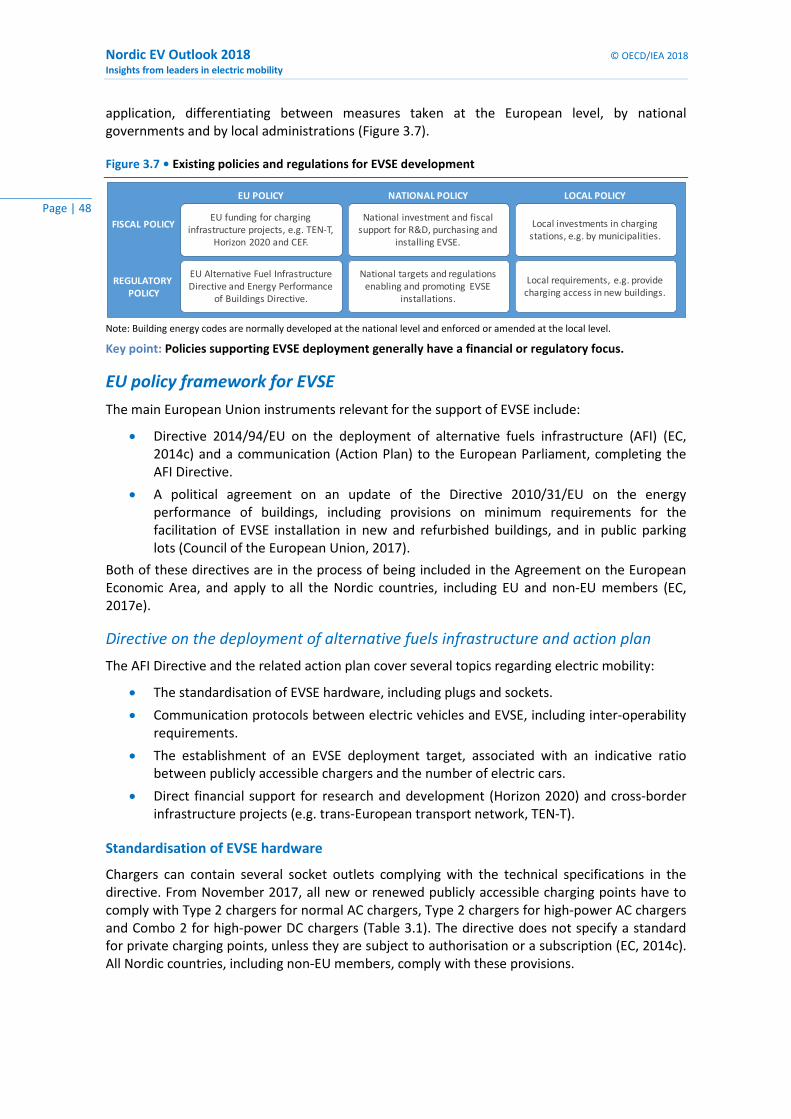
Nordic EV Outlook 2018 © OECD/IEA 2018 Insights from leaders in electric mobility
Page | 48 Page | 48 Page | 48 Page | 48 Page | 48 Page | 48 Page | 48 Page | 48 Page | 48 Page | 48 Page | 48 Page | 48 Page | 48 Page | 48 Page | 48 Page | 48 Page | 48 Page | 48 Page | 48 Page | 48 Page | 48 Page | 48 Page | 48 Page | 48 Page | 48 Page | 48 Page | 48 Page | 48
application, differentiating between measures taken at the European level, by national governments and by local administrations (Figure 3.7).
Figure 3.7 • Existing policies and regulations for EVSE development
Note: Building energy codes are normally developed at the national level and enforced or amended at the local level.
Key point: Policies supporting EVSE deployment generally have a financial or regulatory focus.
EU policy framework for EVSE
The main European Union instruments relevant for the support of EVSE include:
• Directive 2014/94/EU on the deployment of alternative fuels infrastructure (AFI) (EC, 2014c) and a communication (Action Plan) to the European Parliament, completing the AFI Directive.
• A political agreement on an update of the Directive 2010/31/EU on the energy performance of buildings, including provisions on minimum requirements for the facilitation of EVSE installation in new and refurbished buildings, and in public parking lots (Council of the European Union, 2017).
Both of these directives are in the process of being included in the Agreement on the European Economic Area, and apply to all the Nordic countries, including EU and non-EU members (EC, 2017e).
Directive on the deployment of alternative fuels infrastructure and action plan
The AFI Directive and the related action plan cover several topics regarding electric mobility:
• The standardisation of EVSE hardware, including plugs and sockets.
• Communication protocols between electric vehicles and EVSE, including inter-operability requirements.
• The establishment of an EVSE deployment target, associated with an indicative ratio between publicly accessible chargers and the number of electric cars.
• Direct financial support for research and development (Horizon 2020) and cross-border infrastructure projects (e.g. trans-European transport network, TEN-T).
Standardisation of EVSE hardware
Chargers can contain several socket outlets complying with the technical specifications in the directive. From November 2017, all new or renewed publicly accessible charging points have to comply with Type 2 chargers for normal AC chargers, Type 2 chargers for high-power AC chargers and Combo 2 for high-power DC chargers (Table 3.1). The directive does not specify a standard for private charging points, unless they are subject to authorisation or a subscription (EC, 2014c). All Nordic countries, including non-EU members, comply with these provisions.
National investment and fiscal support for R&D, purchasing and
installing EVSE.
National targets and regulations enabling and promoting EVSE
installations.
Local investments in charging stations, e.g. by municipalities.
Local requirements, e.g. provide charging access in new buildings.
NATIONAL POLICY LOCAL POLICY
FISCAL POLICY
REGULATORY POLICY
EU funding for charging infrastructure projects, e.g. TEN-T,
Horizon 2020 and CEF.
EU Alternative Fuel Infrastructure Directive and Energy Performance
of Buildings Directive.
EU POLICY

© OECD/IEA 2018 Nordic EV Outlook 2018 Insights from leaders in electric mobility
Page | 49
Page | 49
Page | 49
Page | 49
Page | 49
Page | 49
Page | 49
Page | 49
Page | 49
Page | 49
Page | 49
Page | 49
Page | 49
Page | 49
Page | 49
Page | 49
Page | 49
Page | 49
Page | 49
Page | 49
Page | 49
Page | 49
Page | 49
Page | 49
Page | 49
Page | 49
Page | 49
Page | 49
Inter-operability and communication protocols
Successful penetration of electric vehicles requires compatible charging infrastructure across charging stations and across borders. The AFI Directive requires that all EU countries ensure that EVSE is usable by consumers affiliated with any CPO without pre-registration (this includes cross-border interoperability), but it does not provide a definitive answer on software inter-operability. The 2017 communication on the directive states that the Sustainable Transport Forum developed a set of recommendations on inter-operability (EC, 2017b):
• Ability to uniquely identify e-mobility actors (charging points, stations and e-mobility users).
• Requirement to have smooth, inter-operable e-mobility payment services that should be based on open protocols. A public consultation was held at the end of 2017. Depending on the outcome, new legislative action likely will be taken.
• Costs of charging need to be predictable, supported by access to information on prices and fees.
Roaming tariffs for electric vehicles are not regulated currently on a European level and they may not be necessary. CPOs have to provide open access, but they are allowed to set their own prices for external customers.13
EVSE deployment targets
The AFI Directive and its Action Plan give an indication of the number of publicly accessible charging points to be deployed in the long term (EC, 2017c). (More detail is provided in the section on long-term charging infrastructure needs and challenges.)
Infrastructure
The European Commission (EC) has several large funding programmes for research and development, and direct support for infrastructure, including EVSE: Trans-European Transport Networks (TEN-T), Connection Europe Facility (CEF) and Horizon 2020. So far, EUR 50 million (USD 56 million) of the TEN-T project rounds between 2007 and 2013 have been allocated to electric mobility. Initial funding went mostly to research to develop cost-efficient fast charging networks, followed by installing fast charging stations at key highway corridors.
There are several EU projects involving Nordic countries. For example, ELECTRIC (2014-15), Greening Northern European Road Corridors (2014-2015), Greening European Transportation Infrastructure for Electric Vehicles (2010-12) and Green Regions with Alternative Fuels for Transport (2015-19) were co-developed by Nordic countries. The funding totals more than EUR 31 million (USD 34 million).14 It supported the deployment of almost 400 fast charging outlets in Denmark and Sweden (EC, 2015a, 2015b, 2015c and 2015d). Recently, new projects have been announced to install high-power charging along main European corridors as well (E.ON, 2017a). New flagship projects under the TEN-T corridor will be announced in early 2018 (EC, 2017b).
13 In some cases, this has led to unfavourable tariffs for this specific group of users that could create barriers for a network-wide use of EVSE by all customers. The enforcement of the AFI Directive should ensure that this will no longer be the case, since the legal text includes a requirement to ensure reasonable, easily and clearly comparable, transparent and non-discriminatory prices. 14 Not all of the EU funding was used to purchase EVSE. Part of the funding was used to finance research and development and feasibility studies.

Nordic EV Outlook 2018 © OECD/IEA 2018 Insights from leaders in electric mobility
Page | 50 Page | 50 Page | 50 Page | 50 Page | 50 Page | 50 Page | 50 Page | 50 Page | 50 Page | 50 Page | 50 Page | 50 Page | 50 Page | 50 Page | 50 Page | 50 Page | 50 Page | 50 Page | 50 Page | 50 Page | 50 Page | 50 Page | 50 Page | 50 Page | 50 Page | 50 Page | 50 Page | 50
Provisional agreement of the directive on the energy performance of buildings
The European institutions have agreed on an update of the Energy Performance of Buildings Directive. The current agreement considers making parking spots “EV ready”15 and mandates the installation of an EVSE outlet (Council of the European Union, 2017). Specifically, it states that new non-residential buildings and non-residential buildings undergoing major renovations must install one recharging point and must provide ducting infrastructure at a level of one for each five parking places. In addition, member states are asked to set up a requirement for a minimum number of recharging points to be installed in all buildings with more than 25 parking spaces (Council of the European Union, 2017).
National EVSE policy support
National support for EVSE in the Nordic countries has ramped up in recent years. Table 3.4 provides an overview of the current EVSE policies. Support for public charging infrastructure is widespread, while policies for private charging (building regulations and subsidies) are less prevalent. The budget allocated to national EVSE support schemes has been much lower than the amount of resources used to support the purchase of electric cars through fiscal incentives. This is influenced by the much lower cost of private and publicly available slow chargers than vehicles, and that there is not a high number of available fast chargers on a per electric car basis.
Most national EVSE support programmes in the Nordic countries have budgets of less than USD 15 million per programme. Depending on the type of infrastructure, policy support per EVSE outlet ranges from around USD 1 000 (private charger) to USD 3 500 (publicly accessible slow chargers) and USD 30 000-55 000 (publicly accessible fast chargers) (Lorentzen, 2017; Naturvårdsverket, 2017; EC, 2015b). Hence, with average EVSE/electric car ratios (0.06 for slow and 0.01 for fast) in the Nordic region, EVSE support equates to about USD 200 (slow) to USD 600 (fast) per electric car for public charging and around USD 1 000 per electric car for private charging.
Table 3.4 • Overview of EVSE policies in Nordic countries
Sources: Nordic country submissions; IEA HEV TCP (2017) and EAFO (2017).
Key point: Support for public charging infrastructure is widespread in the Nordic countries, while policies for private charging (building regulations and subsidies) are not.
15 By including the necessary elements such as conduits for EVSE cables and grid connection to newly built parking spaces.
Policy type Denmark Finland Iceland Norway Sweden
Deployment target 4 4
Building regulations 1 4
Publicly accessible chargers 4 3 4 4 4
Private chargers 4 1 4
Research & development 4 4 4
Publicly accessible chargers 4
Private chargers 4 4
Legend: 0 No policy1 Local policy4 Nationwide policy
Regulations
Direct Investment
Fiscal advantages

© OECD/IEA 2018 Nordic EV Outlook 2018 Insights from leaders in electric mobility
Page | 51
Page | 51
Page | 51
Page | 51
Page | 51
Page | 51
Page | 51
Page | 51
Page | 51
Page | 51
Page | 51
Page | 51
Page | 51
Page | 51
Page | 51
Page | 51
Page | 51
Page | 51
Page | 51
Page | 51
Page | 51
Page | 51
Page | 51
Page | 51
Page | 51
Page | 51
Page | 51
Page | 51
The Nordic countries approach financial support for EVSE infrastructure development in various manners. In Norway, the Enova support program, allowing for up to 100% coverage of installation costs, is focussed on highways and employs a competitive tender approach (Enova, 2017). Earlier programmes were limited by EU state aid limitations to less than 50% of investment cost. Finland’s support measure covers only 30-35% per installed charger in order to spur private investment (Government of Finland, 2017b). In Sweden, support can cover up to 50% of investment costs support (Government of Sweden, 2017c).
Denmark
Incentives for EVSE deployment
As part of Denmark's involvement in European projects connecting the Nordic region to Western Europe, the Danish Road Directorate procured public fast EVSE outlets along the main highway corridors. These were developed by E.ON and CLEVER, two of the four major e-mobility service providers (the others being Tesla and CleanCharge) (IEA HEV TCP, 2017). The goal is to upgrade these fast chargers from 50 kW to 150-350 kW in the coming years (E.ON, 2017a).
In Denmark, publicly accessible charging points pay 50% less for their power connection fees. Denmark is also the only Nordic country that has used fiscal rebates on EVSE installations: homeowners that install an EVSE outlet can deduct the installation cost from their income tax. An important private charging support measures is that consumers that charge at home receive a tax rebate of DKK 0.94/kWh (USD 0.14/kWh), cutting electricity costs almost in half (valid until 2020) (Government of Denmark, 2017).
Denmark has played an active role to connect the Nordic region with Western Europe. Denmark received the largest share of EU funding for EVSE deployment in the Nordic region, participating in projects that total more than EUR 47 million (USD 53 million) and developed more than 150 public charging points (EC, 2015a, 2015b, 2015c, 2015d and 2015e).
Continued support for EVSE contributed to Denmark’s high EVSE per electric car ratio (0.2) compared with Sweden (0.08) and Norway (0.06), as well as the growth of fast EVSE outlets.
Regulations
Denmark has had limited success in ensuring inter-operability of publicly accessible chargers. Most EVSE outlets are not using open protocols, so EV car owners need a variety of membership cards to access the outlets of the three main CPOs. The Danish government has discussed a policy framework to address this, but there have been no concrete implementation steps to date.
Finland
A relatively low level of EVSE has been deployed in Finland so far. Along with a renewed ambition on EV uptake, Finland is now moving from a policy focus on research and development towards more direct support of EVSE deployment.
Incentives for EVSE deployment
Finland provides some direct financial support for EVSE deployment. Tekes’ (Finnish Funding Agency for Innovation) Electric Vehicle Systems (EVS) programme (2011-15), set up by the Ministry of Employment and the Economy, allocated EUR 10 million (USD 11 million) in 2012 to support procurement of EVs and investment in charging points in order to collect related data in a real operating environment. Only companies could apply for funding (Tekes, 2016). The support limit was set at 35% of the charging equipment costs. This support grant scheme proved to be complicated for applicants and the communication strategy did not reach the right actors since it

Nordic EV Outlook 2018 © OECD/IEA 2018 Insights from leaders in electric mobility
Page | 52 Page | 52 Page | 52 Page | 52 Page | 52 Page | 52 Page | 52 Page | 52 Page | 52 Page | 52 Page | 52 Page | 52 Page | 52 Page | 52 Page | 52 Page | 52 Page | 52 Page | 52 Page | 52 Page | 52 Page | 52 Page | 52 Page | 52 Page | 52 Page | 52 Page | 52 Page | 52 Page | 52
took some time for companies to start applying (Korkiakoski, 2017). Most of the funding went to research and development efforts, such as Arctic testing facilities (Tekes, 2016).
Regulations
Finland has not modified its building codes to mandate EVSE readiness in new or existing buildings. However, its existing building regulations related to block heaters (used for vehicles in cold winter conditions) facilitate EVSE installation.
Iceland
Incentives for EVSE deployment
Iceland’s government started to invest in charging infrastructure only in 2017. Yet by the end of the year, it had deployed fast charging outlets across the entire country, demonstrating that fast charging infrastructure can be rolled out at a relatively rapid pace.
Iceland has a fast charging corridor with a station every 50 km around the island, totalling 26 charging points. For 2017, the corridor project cost about ISK 67 million (USD 0.6 million), equating to about ISK 3.5 million (USD 33 000) for each fast EVSE outlet (RúV, 2017). Iceland’s 2016-18 EVSE support package has a budget of ISK 200 million (USD 1.9 million). It aims to deploy an additional 70 EVSE outlets, most of which will be slow chargers. An important driver of this rapid increase in EVSE outlets is the opportunity that utilities see to compensate for lower revenues arising from energy efficiency improvements in buildings and appliances.
Norway
Incentives for EVSE deployment
Norway has been one of the first movers in the Nordic region to support EVSE deployment, with policy measures starting in 2010. The national government’s main instrument for EVSE deployment is the Enova (formerly Transnova) enterprise, owned by the Ministry of Petroleum and Energy. Established in 2001, it is financed through government funding in addition to a NOK 0.01/kWh (USD 0.001/kWh) tax on electricity to consumers. Its 2017 budget is around NOK 2.5 billion (USD 0.3 billion). In 2010, Transnova’s deployment of EVSE outlets started through a NOK 50 million (USD 6 million) support programme that subsidised charging points up to NOK 30 000 (USD 3 600) per charging point (Lorentzen et al., 2017). Another Transnova programme in 2013 supported fast charging infrastructure with NOK 6 million (USD 720 000) (Tietge et al., 2016). These programmes fund 100% of the installation costs.16 Earlier programmes where limited by EU state aid limitations to less than 50% of investment cost (EFTA, 2017b). More recently, Enova provides up to 40% of eligible costs for municipalities without fast chargers (Enova, 2017b).
Support for fast charging corridors in Norway has been prioritised in recent years. Enova established an incentive scheme to deploy a publicly available fast charger at least every 50 km on the highway network (Lorentzen et al., 2017).17 Construction started in 2015 and nearly all highways were served by the end of 2017. However, even with 100% funding of the installations, no companies have bid on Enova’s fourth tender round to build charging stations in the far north of the country and the Lofoten Islands (Figenbaum, 2018).
16 The support can be 100% of the investment costs with an upwards limit of 300 000 kroner for each triple standard charger. Operating costs are not included (Enova, 2017). 17 Within a maximum distance of 1 km from the highway.

© OECD/IEA 2018 Nordic EV Outlook 2018 Insights from leaders in electric mobility
Page | 53
Page | 53
Page | 53
Page | 53
Page | 53
Page | 53
Page | 53
Page | 53
Page | 53
Page | 53
Page | 53
Page | 53
Page | 53
Page | 53
Page | 53
Page | 53
Page | 53
Page | 53
Page | 53
Page | 53
Page | 53
Page | 53
Page | 53
Page | 53
Page | 53
Page | 53
Page | 53
Page | 53
Norway’s increase in the market share of EVs is also stimulating the commercial deployment of public charging infrastructure. Nonetheless, policy support is likely to be required to have adequate infrastructure in sparsely populated areas (Lorentzen et al., 2017).
Building regulations
Currently, Norway allows the installation of charging points in existing buildings without consent of the housing unit board. There are no specific national building regulations that mandate charging infrastructure, but a proposal going in that direction was evaluated by the Norwegian parliament at the end of 2017. (The details of the regulation are described in the market and policy outlook section.) Many new apartment buildings already provide charging points for all parking spaces, even without regulatory mandates as the availability of a charging point increases the value of the parking garage (Hovland, 2017).
Sweden
In Sweden, a wide set of policies has been developed to stimulate EVSE deployment, ranging from short-term investments to long-term planning.
Incentives for EVSE deployment
In September 2015, the Swedish government launched “Klimatklivet” (Climate Leap), a general investment support scheme based on the principle of granting support to measures with the most effective climate change related features. Some support has been directed to EVSE deployment.18 In the 2015-20 period, the budget is set at SEK 3.2 billion (USD 374 million) of which SEK 113 million (USD 13 million) had been awarded to EVSE as of end-2017 (Naturvårdsverket, 2017). So far, Klimatklivet has granted investment support to over 12 000 charging points. Most are slow charging points, both private19 and publicly accessible, and the scheme has also successfully granted support to fast chargers along several key highways. The Klimatklivet now provides 50% for EVSE investments.
Sweden also provided support for several research and development projects to improve EVSE deployment. An example is Green Charge Sydost (Green Charge Southeast), which laid the foundation for comprehensive EVSE deployment in the south-eastern parts of Sweden and successfully engaged public actors into extensive EV usage.
Building regulations
Currently, Sweden has no national requirements for charging infrastructure in building permits, but municipalities can require the installation of charging infrastructure or pre-cabling for parking facilities for more cost-effective future installations of charging points.
Regional/local policy and regulation
Several cities in the Nordic countries have been pursuing their own EVSE deployment policies, complementary to national efforts. In general, cities are responsible for allocating locations where EVSE outlets can be installed in the public space. Box 3.1 focuses on the case of Oslo and its comprehensive EVSE deployment strategy. A few examples of local initiatives supporting the deployment of chargers in cities are outlined below.
18 The Swedish Energy Agency co-ordinates the EVSE deployment in Sweden under the Klimatklivet framework. 19 This includes parking companies and private fleets. Private households cannot be granted investment support through Klimatklivet, but tenant-owned co-operatives are allowed to apply.

Nordic EV Outlook 2018 © OECD/IEA 2018 Insights from leaders in electric mobility
Page | 54 Page | 54 Page | 54 Page | 54 Page | 54 Page | 54 Page | 54 Page | 54 Page | 54 Page | 54 Page | 54 Page | 54 Page | 54 Page | 54 Page | 54 Page | 54 Page | 54 Page | 54 Page | 54 Page | 54 Page | 54 Page | 54 Page | 54 Page | 54 Page | 54 Page | 54 Page | 54 Page | 54
• The Norwegian cities of Oslo, Bergen, Haugesund and Stavanger have been the most active. In 2015, infrastructure company BKK, Hordaland County Council and Bergen City Council built a fast charging station that can charge up to 21 electric cars (ABB, 2015). In addition, at least 20% of all new public parking spaces need to be equipped with EVSE outlets (ICCT, 2016).
• In Sweden, the City of Stockholm procured and installed more than 110 EVSE outlets in 2014, double this amount in 2017 and set a target to have 500 on-street charging points by 2020 (City of Stockholm, 2016; Eltis, 2017). The City of Gothenburg currently has about 70 public charging points. The public power company Göteborg Energi, has been granted support through Klimatklivet to build 1 500 private charging points and 15 fast chargers between 2016 and 2018 (Göteborg Energi, 2015).
• In Iceland, the City of Reykjavik procured 15 fast EVSE outlets in 2017 through Reykjavik Energy (94% owned by the City of Reykjavik) (ABB, 2017a). Electric vehicles and chargers are mentioned in the City of Reykjavik’s climate policy plan (City of Reykjavik, 2016).
• In Finland, Helsinki invested in fast charging stations for buses in 2017 (HSL, 2017).
Box 3.1 • EVSE deployment strategy in Oslo
The city of Oslo has been very active in all aspects of EVSE development, e.g. creating its own CPO and installing more than 1 300 public charging stations since 2008 (Portvik, 2017).
Nevertheless, the number of publicly accessible chargers increased less than the number of electric cars. This led to a shift in policy focus towards the installation of fast chargers and parking garages equipped with EVSE outlets. The EVSE deployment target for 2018 is to install three-times the average annual number of 200 publicly accessible EVSE. Of the 600 planned for 2018, 200 will be slow chargers and 400 will be fast chargers (22 kW fast chargers). The municipality further incentivises EVSE installation in sport clubs, commercial centres and parking (50% of the installation costs).
Oslo also adopted a measure in 2017 to strengthen the availability of private charging infrastructure. This regulation mandates that new buildings must have at least 50% of the parking facilities equipped for electric car charging. The grid capacity must also be designed to charge at 3.6 kW all of the vehicles in the building without any need for smart charging to prevent local power shortages.
Key implications
As in the case of the electric car uptake, the analysis of the deployment of EVSE in the Nordic countries provides insights on the focal areas of policy support instruments employed, their effectiveness, lessons learned and applicable to replication in other areas. Key insights identified include:
• Policy support for EVSE deployment effectively complements measures targeting the reduction of acquisition and usage cost for electric cars. Nevertheless, consumer surveys suggest that EVSE policies are not as critical as measures that provide economic incentives to drive decisions on the purchase of electric cars.
• Private charging (home and workplace) is the most important means of charging for electric car drivers in the Nordic region. The share of private chargers has grown relative to public chargers in the last few years.
• The strong consumer preference for home charging suggests that EVSE policies should create favourable conditions that ensure that electric car owners have access to parking

© OECD/IEA 2018 Nordic EV Outlook 2018 Insights from leaders in electric mobility
Page | 55
Page | 55
Page | 55
Page | 55
Page | 55
Page | 55
Page | 55
Page | 55
Page | 55
Page | 55
Page | 55
Page | 55
Page | 55
Page | 55
Page | 55
Page | 55
Page | 55
Page | 55
Page | 55
Page | 55
Page | 55
Page | 55
Page | 55
Page | 55
Page | 55
Page | 55
Page | 55
Page | 55
equipped with a charging point. So far, building regulations that support EVSE deployment have not been widespread in the Nordic countries, possibly because of the work being developed at the EU level on the topic. Norway has progressed the most towards mandates for EVSE in new construction at a national and local level (Oslo).
• Even though it is rudimentary, the infrastructure developed in the Nordic region for engine block heaters provides an excellent foundation for the cost-effective installation of charging points, both at private houses and public parking lots. This is a unique characteristic of the Nordic countries, largely related to the cold winter climate.
• Even though the use of the publicly accessible charging infrastructure is fairly low, it should be viewed as an important component of the ecosystem of charging infrastructure. Publicly accessible EVSE ensures inter-regional access and is essential for electric car owners that do not have access to a reserved parking place.
• New players and new business models are emerging in the market to provide charging services at publicly available outlets. Many of the services differentiate prices based on the level of charging power. Fast charging can be up to three-times more expensive than slow charging. Higher prices for fast charging reflect higher installation costs and lower levels of use currently.
• To date, the ratios of publicly accessible chargers per electric car vary significantly across countries in the Nordic region. It is not indicative of an optimal ratio. Nevertheless, the Nordic country EVSE/EV ratios indicate that those with higher electric car shares in the vehicle stock (Iceland, Norway and Sweden) have a comparatively lower amount of publicly accessible of chargers per vehicle in circulation than the countries with lower proportions of electric cars.
• The cases of Norway and Iceland, both characterised by large market shares for electric cars and both having ensured wide availability of publicly accessible fast chargers, suggest that the nationwide availability of fast chargers could have a positive impact on the uptake of electric cars.


© OECD/IEA 2018 Nordic EV Outlook 2018 Insights from leaders in electric mobility
Page | 57
Page | 57
Page | 57
Page | 57
Page | 57
Page | 57
Page | 57
Page | 57
Page | 57
Page | 57
Page | 57
Page | 57
Page | 57
Page | 57
Page | 57
Page | 57
Page | 57
Page | 57
Page | 57
Page | 57
Page | 57
Page | 57
Page | 57
Page | 57
Page | 57
Page | 57
Page | 57
Page | 57
4. EVs and the power grid
Nordic power market
The main stakeholders involved in the Nordic power system linking to the end-users (either a CPO or an electric car owner charging the car at home) are shown in Figure 4.1.
Figure 4.1 • Stakeholders in the Nordic power sector
Notes: This graphic represents the situation in Denmark, Norway, Sweden and Finland, which are participants in the Nordic power market organised by Nord Pool. Iceland has an isolated power system.
Key point: Four Nordic countries are pooled in a single power market, Nord Pool, which strengthens reliability of electricity supply at relatively low prices.
Regulated actors
Transmission system operators (TSOs) and DSOs operate the high- and low-voltage grids, respectively, and are responsible for ensuring that adequate electricity reaches consumers and is always available on demand. System operators also procure a number of ancillary services, including frequency response and operating reserves. Their role in the transition towards electric mobility is significant. The TSO’s responsibility is to ensure security of supply and electrical stability on the high-voltage transmission grids. The TSO is a non-commercial entity that operates the grid in a regulated regime. The Nordic TSOs are: Landsnet (Iceland), Energinet (Denmark), Statnett SF (Norway), Svenska Kraftnät (Sweden) and Fingrid (Finland). DSOs are responsible for the link between the transmission network and the end-user. They ensure that consumers have adequate connections to the grid and take care of grid upgrades such as the replacement of transformers or cables/power connections to neighbourhoods and homes. Every DSO operates under permit that provides exclusive rights and obligations to build and serve a distribution network in a defined area.
Power market participants
Power market participants organise the sales of electricity between the power generators and consumers. Their role is relevant because prices can influence behaviour of consumers

Nordic EV Outlook 2018 © OECD/IEA 2018 Insights from leaders in electric mobility
Page | 58 Page | 58 Page | 58 Page | 58 Page | 58 Page | 58 Page | 58 Page | 58 Page | 58 Page | 58 Page | 58 Page | 58 Page | 58 Page | 58 Page | 58 Page | 58 Page | 58 Page | 58 Page | 58 Page | 58 Page | 58 Page | 58 Page | 58 Page | 58 Page | 58 Page | 58 Page | 58 Page | 58
and may therefore present an instrument to ensure grid reliability. Specifically, it can be used for load shifting, to influence the timing of electricity demand to match supply, for example by using smart charging.1
Nord Pool
Today, Nord Pool operates the market place for physical power trading and supplies the transmission network in four Nordic countries (Iceland has its own network). Today, Nord Pool is the only energy exchange in the region, but European legislation is opening opportunities for competition between power exchanges. Nord Pool operates a day-ahead spot market with regional hourly prices and an intra-day market with continuous power trading up to one hour prior to delivery (Nord Pool, 2017). The participants in the markets are power producers, suppliers, traders and large end-users. The profit margin that Nord Pool is allowed is regulated by the Norway’s Water Resources and Energy Directorate (NVE).
Power retailers
Power retailers buy electricity through Nord Pool, or directly from the producer, and then sell electricity to the consumers. There is high competition between power retailers and they can offer various types of contracts, e.g. fixed or variable price contracts. Variable pricing based on time of use or maximum power capacity demanded may offer an incentive to the consumer to delay charging from peak times to when system electricity demand is low.
Authorities (regulators)
The regulators establish the rules for TSOs and DSOs operations, as they have monopoly positions in defined areas. Regulators define levels of maximum profit for TSOs and DSOs, which aim to ensure that stable and reasonable prices are maintained. Regulators also have authority for allowing participation in the short-term and system services markets. This is a relevant determinant for whether business models for ancillary services can contribute to load shaping and improving grid reliability and cost-effectiveness. (The implications for electric vehicles and their integration in the power system are discussed in the reducing grid impacts and seizing opportunities section.)
Power generation mix
The Nordic countries have a relatively low-carbon electricity system compared with the global average and high shares of renewables for electricity generation (Figure 4.2).
• Denmark has the largest share of thermal power use in the Nordics, but wind makes up around 50% of its power generation on average, a higher proportion than any other country in the world.
• Finland relies on a diversified energy mix, including a major share of nuclear power and a sizeable contribution from electricity co-generated in biomass-driven combined heat and power plants.
• In Iceland, power generation is primarily based on hydro power and geothermal energy.
• In Norway, almost all electricity is generated by hydro power.
• Sweden uses primarily a mix of hydro, biomass, wind and nuclear power.
1 Smart charging measures include delaying or expediting the time of charging to periods of low power demand, stopping or starting it, speeding it up or slowing it down.

© OECD/IEA 2018 Nordic EV Outlook 2018 Insights from leaders in electric mobility
Page | 59
Page | 59
Page | 59
Page | 59
Page | 59
Page | 59
Page | 59
Page | 59
Page | 59
Page | 59
Page | 59
Page | 59
Page | 59
Page | 59
Page | 59
Page | 59
Page | 59
Page | 59
Page | 59
Page | 59
Page | 59
Page | 59
Page | 59
Page | 59
Page | 59
Page | 59
Page | 59
Page | 59
Given the generally low-carbon profile of the region’s power generation, electric vehicles in Nordic markets have a significantly lower climate change impact compared with ICE vehicles (Box 4.1).
Figure 4.2 • Power generation mix and CO₂ emissions per kWh by country and EU average, 2015
Sources: IEA (2017d) and IEA (2017e).
Key point: The carbon intensity of electricity generation in all Nordic countries, which is largely based on renewables, is far below the EU average.
Box 4.1 • Carbon intensity of electric cars
With zero-tailpipe emissions, the primary energy sources used for electricity generation largely determine the GHG intensity of electric vehicles. The combination of low-carbon electricity and improved energy efficiency of electric engines allows EVs to have a significantly lower climate impact compared with ICEs (Figure 4.3). All Nordic countries perform better than the EU average. The well-to-wheel GHG emissions from EVs in Iceland already have reached nearly zero emissions. Norway and Sweden have low emission levels at 7 and 9 grammes of CO2 equivalent emitted per kilometre, respectively. Electric cars in Denmark have the highest GHG emissions per km of all Nordic countries, reflecting the larger share of thermal power generation in Denmark (Figure 4.2).
Figure 4.3 • Well-to-wheel GHG intensity of a BEV compared to an ICE by country and EU, 2017
Notes: WTW = well-to-wheel. For this analysis, a BEV is assumed to use 19.2 kWh of electricity per kilometre. Sources: IEA analysis based on Moro and Lonza (2017) and IEA (2017e).
Key point: Electric cars have lower GHG emissions per kilometre driven compared with ICE cars. In Iceland, electric car use has almost no climate change impact.
0
50
100
150
200
250
300
350
0%
10%
20%
30%
40%
50%
60%
70%
80%
90%
100%
Denmark Finland Iceland Norway Sweden EU
gCO
2/kW
h
Biofuels and waste
Solar/wind/other
Geothermal
Hydro
Nuclear
Natural gas
Oil products
Coal and coalproductsgCO₂/kWh
0
20
40
60
80
100
120
140
160
180
200
Denmark Finland Iceland Norway Sweden EU average
gCO
2-eq
/km
WTW GHGemissions BEV
WTW GHGemissions gasoline
WTW GHGemissions diesel

Nordic EV Outlook 2018 © OECD/IEA 2018 Insights from leaders in electric mobility
Page | 60 Page | 60 Page | 60 Page | 60 Page | 60 Page | 60 Page | 60 Page | 60 Page | 60 Page | 60 Page | 60 Page | 60 Page | 60 Page | 60 Page | 60 Page | 60 Page | 60 Page | 60 Page | 60 Page | 60 Page | 60 Page | 60 Page | 60 Page | 60 Page | 60 Page | 60 Page | 60 Page | 60
Electricity prices
The Nord Pool wholesale electricity price has been frequently among the lowest in Europe (EC, 2016a). Though, the wholesale price accounts for less than 20% of the end-user price in the Nordic region (Fortum, 2016). The main reasons include the cost of power transmission and distribution services, energy subsidies and taxation. The level of these cost components, as well as the design of electricity contracts and tariffs differ by country. In Norway, households pay the lowest price for electricity in the region (Figure 4.4). Denmark, where taxes make up around 60% of the total price of electricity for households, is at the opposite end of the spectrum.
Figure 4.4 • Household electricity prices, including taxes, Q4 2016
Note: The electricity price for Iceland, portrays the average level of Q3 and Q4 2016 (Eurostat, 2016).
Sources: IEA (2017c); Eurostat (2017).
Key point: Household electricity prices vary in the region; in Denmark they are more than double the price paid by households in Norway.
The level of electricity prices and the tariff design can provide signals to influence efficient utilisation and development of the grid, as well as influencing demand shifting to off-peak times. If households have a smart meter (this is already the case for most households2), power retailers in the Nordic markets can offer the option of a contract where customers are charged at variable rates.3 This means that the electricity rate can vary by hour. Hourly prices are determined by Nord Pool’s day-ahead market.4 Nevertheless, a low share of disposable income spent on electricity and the large gap between wholesale prices and end-user prices limits the possibilities for end-users to notice changes in wholesale prices, which consequently reduces opportunities for demand response (Fortum, 2016). In the case of Finland, only 7% of the consumers have opted for hourly electricity pricing to date (Paananen, 2017).
2 All households in Finland and Sweden have an installed smart meter. Norway and Denmark are expected to have a full roll out of smart meters by 2020 (JRC, 2017 and NVE, 2016a). 3 Iceland has a simplified electricity billing system. Consumers pay a fixed rate per year for distribution services and a fixed energy consumption charged per kWh (Rarik, 2017). 4 For example, as of November 2017, Denmark introduced a voluntary billing mechanism where the electricity price is raised during evening peak hours (17:00 and 20:00) and lowered during off-peak hours (Hansen, 2017).
0 50 100 150 200 250 300 350
Sweden
Norway
Iceland
Finland
Denmark
Electricity price for households (USD/MWh)
Energyconsumption
Tax

© OECD/IEA 2018 Nordic EV Outlook 2018 Insights from leaders in electric mobility
Page | 61 Page | 61 Page | 61 Page | 61 Page | 61 Page | 61 Page | 61 Page | 61 Page | 61 Page | 61 Page | 61 Page | 61 Page | 61 Page | 61 Page | 61 Page | 61 Page | 61 Page | 61 Page | 61 Page | 61 Page | 61 Page | 61 Page | 61 Page | 61 Page | 61 Page | 61 Page | 61 Page | 61
Electricity demand from EVs
In 2017 in the Nordic region, electricity demand from EVs (electric cars, light commercial vehicles and buses) was 500 gigawatt-hours (GWh) and had little effect on total electricity demand (Total electricity consumption for EVs in the Nordic countries, 2017). 94% of the electricity used by EVs was for electric cars, with electric light commercial vehicles and buses being responsible for the remaining 6%. In 2015 (most recent year for data availability), the electricity demand from EVs equated to less than 0.1% of the total electricity demand in the Nordic countries. In Norway, hosting the region’s highest concentration of electric cars, electricity demand from EVs accounted for only 0.14% of the country’s annual electricity demand.5
Figure 4.5 • Total electricity consumption for EVs in the Nordic countries, 2017
Notes: GWh = gigawatt-hours. This figure represents electricity demand from electric passenger cars (PC), light commercial vehicles (LCV), buses and minibuses. Around 90% of this is related to the use of electric cars. Vehicle stock data are calculated from country submissions.
The following assumptions are used : - Fuel economy: 19.2 kWh/100 km (PC), 26.2 kWh/100 km (LCV), 110 kWh/100 km (buses and minibuses) (including 10% to account for charging losses and EVSE own energy use). - Annual mileage PC: 14 600 km (Denmark, Finland, Sweden), 12 500 km (Iceland, Norway).- Annual mileage LCV: 17 900 km (Denmark, Finland, Sweden), 16 500 km (Iceland, Norway).- Annual mileage buses and minibuses: 44 800 km (all countries).- Share of electric driving for PHEVs: 48% of the annual mileage.
Key point: More than two-thirds of the power for EVs in 2017 was used in Norway. Across the Nordic countries, the amount of electricity used for EVs accounted for less than 0.1% of total power demand in 2015.
Are electric cars impacting the power grid?
Current status
As electric car stock shares are still low in the Nordic countries (1.9%), it is too early to see any major effects from EVs on the grid. Most Nordic countries have strong electricity networks, as they are built to serve relatively high electricity demand, especially during the cold winters. At the transmission level, no impacts from EV uptake have been reported. Distribution grids, so far, have proven able to serve the levels of electric cars without significant difficulties. Yet, as the share of electric vehicles increased, the case of Norway shows that distribution infrastructure experienced a few issues. This occurred in densely populated urban environments and
5 If all of Norway’s 2.7 million passenger light-duty vehicles were to be electrified it would increase demand by about 6.5 TWh, about 6% of the current electricity demand.
6%2%
2%
71%
19%
Denmark
Finland
Iceland
Norway
Sweden
500 GWh

Nordic EV Outlook 2018 © OECD/IEA 2018 Insights from leaders in electric mobility
Page | 62 Page | 62 Page | 62 Page | 62 Page | 62 Page | 62 Page | 62 Page | 62 Page | 62 Page | 62 Page | 62 Page | 62 Page | 62 Page | 62 Page | 62 Page | 62 Page | 62 Page | 62 Page | 62 Page | 62 Page | 62 Page | 62 Page | 62 Page | 62 Page | 62 Page | 62 Page | 62 Page | 62
recreational regions that experienced a large influx of visitors during holidays and weekends (Spilde and Skotland, 2017; Klingenberg, 2017; Hovland, 2017).
For most detached houses in the Nordic countries, the power connections are substantial and range 9-15 kW. For apartments, a typical connection is around 6 kW, but most apartments do not have access to private parking or they park in a parking garage. To compare, the average power connection to a house in a southern European country such as Italy is around 3.3 kW per household and in Spain it is around 5 kW (Endesa, 2017).
Home chargers of the newest electric car models, with a power rating that is typically 3-7 kW, add a significant load to the electricity consumption of a household (Figure 4.6). Unless this is properly managed (e.g. through smart charging), the growth in electricity demand due to electric car charging may lead to exceeding the maximum power available in the distribution grid. This is a more pressing issue during peak hours and cold days, when the grid utilisation rate is closer to its capacity, and in rural areas, where the network resilience is lower.
Looking at the micro-level, some EV owners in Norway have experienced some problems when charging at home (Figenbaum and Kolbenstvedt, 2016). The most frequent issue is the absence of sufficient power, experienced by 17% of BEV owners and 31% of PHEV owners followed by damaged vehicle cables (14% of BEV owners and 25% of PHEV owners). About 2% of respondents had experienced a “burned charge socket” (a burned charge socket potentially could escalate to a fire) (Figenbaum and Kolbenstvedt, 2016).
Figure 4.6 • Peak electricity demand in Norwegian houses (detached) with home charging
Note: On-board charging capacity for both a typical BEV and a PHEV are in line with characteristics of the newest version of today’s two most popular models in the region: Volkswagen Passat GTE (PHEV) and Volkswagen e-Golf (BEV).
Sources: IEA analysis based on Kipping and Trømborg (2016).
Key point: Chargers can add significant loads to household power demand, particularly during peak hours and very cold days. Increasing levels of demand for charging electric cars could stress distribution grids unless properly managed.
Insufficient household capacity requires an upgrade of the power connection, while overloading from a set of EV chargers within the distribution area may involve grid upgrades, including the replacement of distribution transformers and cables, or the adoption of demand-side management. Norwegian Water Resources and Energy Directorate (NVE) indicates that currently in Norway a few percent of the transformers are already overloaded and estimates that an increase in average power consumption of 1-2 kW per household would lead to overload in nearly 10% of the transformers (NVE, 2016b). With an average increase of 5 kW, over 30% of the transformers would be overloaded. NVE also estimates that the proportion of high-voltage cables that would need to be replaced is lower than the transformers (just over 10% with an increase in
0
2
4
6
8
10
12
14
Summer day Winter day Extra cold day (-13°C)
kW
Typical BEV onboardcharger
Typical PHEV onboardcharger
Typical household peakpower demand
Power connection typicallarge home
Power connection typicalsmall home

© OECD/IEA 2018 Nordic EV Outlook 2018 Insights from leaders in electric mobility
Page | 63
Page | 63
Page | 63
Page | 63
Page | 63
Page | 63
Page | 63
Page | 63
Page | 63
Page | 63
Page | 63
Page | 63
Page | 63
Page | 63
Page | 63
Page | 63
Page | 63
Page | 63
Page | 63
Page | 63
Page | 63
Page | 63
Page | 63
Page | 63
Page | 63
Page | 63
Page | 63
Page | 63
power of 5 kW), but overloading of cables can be significantly more expensive than replacing transformers, especially for underground networks, given the need to add new cables to the distribution network.
A study measured the effects of slow and fast charging of electric vehicles on the distribution networks for six operators in Norway (Seljeseth, Taxt and Solvang, 2013). The objective was to identify large voltage deviations due to electric vehicle charging. Measurements were carried out for five different vehicles and a pool of 15 vehicles charging simultaneously. Neither slow or fast charging seemed to cause significant issues other than flicker appearing as a disturbance in the garage where a vehicle was being charged. Around 70% of the low-voltage distribution system in Norway is type 230 Volt (V), unlike the more common 400 V elsewhere. This results in higher currents and voltage drops when electric vehicles are plugged into the network.
Future prospects
Even though today’s EV stock shares are small in most Nordic countries and the networks can manage high peak loads, regulators and grid operators are cautiously following developments. Today, charging points in houses are mostly of the slow type (single-phase charging up to 3 kW), but the newest models of BEVs can handle higher charging power (at least 7 kW). In addition, a growing number of fast chargers (up to 150 kW) and high-power chargers (350 kW) are being deployed, and fast chargers can be deployed in clusters with multiple outlets. This requires strengthened local grid capacities and potentially higher loads at the transmission level when the EV stock share expands significantly. Denmark estimates that its network can handle 100 000 EVs, translating to a stock share of 5%, after which grid reliability issues may start to arise (Hansen, 2017). According to IEA projections, Denmark might reach this level between 2020 and 2025 (Figure 5.1). Another Danish report suggests that the grid impact of a 20% electric car penetration (400 000 electric cars) in the stock, coupled with dedicated 6 kW chargers, could cause widespread overloading of all grids and an under-voltage situation on 400 V grids (Wu et al., 2012).
NVE, the electricity market regulator in Norway, has considered a scenario with 1.5 million EVs in circulation in 2030 and concluded that this may increase total electricity consumption by around 4 TWh per year (NVE, 2016b). NVE analysis suggests that adding an average of 1 kW to the household peak load could cause about 4% of distribution transformers to be overloaded, while a 5 kW peak load increase could result in more than 30% of overloads (NVE, 2016b). In low-density areas, the voltage quality may deteriorate in the event of high levels of EV charging, but the extent is difficult to predict. On average, the NVE analysis suggests that the grid is in good shape to cope with a transition towards electric, but in local areas with lower grid capacity (such as holiday cottage areas), problems could occur.
In Iceland, four-fifths of the total electricity consumption is used in the aluminium industry, which operates day and night, making the Icelandic load curve quite flat compared to most countries. As the residential sector only accounts for around one-fifth of electricity demand, the overall load curve is not likely to be significantly affected by the uptake of electric cars (Friðleifsson, 2017), though local grid capacity issues may emerge. Iceland also has a fixed electricity tariff, providing limited incentives for delayed charging and peak shaving.
Impact from superchargers and high-power chargers
The uptake of public chargers constitutes an extra load for the grid. Slow chargers are generally built in already dense urban areas, while fast charging and ultra-fast charging networks also are being developed in remote areas and on highways. Fast chargers are also expected to become more powerful in the coming years. For example, while most fast chargers today do not exceed

Nordic EV Outlook 2018 © OECD/IEA 2018 Insights from leaders in electric mobility
Page | 64 Page | 64 Page | 64 Page | 64 Page | 64 Page | 64 Page | 64 Page | 64 Page | 64 Page | 64 Page | 64 Page | 64 Page | 64 Page | 64 Page | 64 Page | 64 Page | 64 Page | 64 Page | 64 Page | 64 Page | 64 Page | 64 Page | 64 Page | 64 Page | 64 Page | 64 Page | 64 Page | 64
50 kW, Ionity is currently developing a European wide network of high-power chargers that charge at 350 kW (Ionity, 2017). Scaling up the availability of these chargers on a wide scale is likely to require advanced solutions such as in-situ electricity storage to avoid disruptions to the power grid.
While it is likely that adoption of high-power charging has certain consequences for the local grid, networks are unlikely to be largely affected at the national level. In principle, fast charging offers little flexibility to modulate power demand. Nevertheless, most EV owners currently do not use fast charging options on a frequent basis. In Norway, only 1% of EV owners use a fast charger every day (Norsk Elbilforening, 2017). If the same fraction of electric car owners continued to adopt this behaviour in 2030, charging between 17:00–19:00 and fully refilling their batteries, the national added capacity would be close to 60 megawatts (MW) during this period.6 This corresponds to 0.2% of the total capacity currently installed in Norway.
Reducing grid impacts and seizing opportunities
Impacts on electricity networks from increasing load related to “fuelling” electric vehicles can be anticipated and alleviated. In addition, EVs can provide flexibility options for network management, reliability and cost-effectiveness. An example is the possibility to use EVs for the modulation of power demand (load shifting). This section outlines a number of key actions to prepare for bigger EV stock shares and highlights some of the steps already taking place in the Nordic countries.
Demand-side management
Demand-side management (DSM) is increasingly considered an important instrument that can help reduce the impact of EVs on electricity networks and help to delay or avoid expensive grid upgrades, as well as to facilitate the smooth integration of variable renewables-based energy generation into the grid. DSM can be defined as a combination of two activities: activities to manage bulk load shifting through market mechanisms (explicit DSM), and consumer response to price signals (implicit DSM).
The least-cost DSM solution related to EVs is the timing of charging the vehicles, e.g. to shift loads and provide ancillary services such as frequency response and balancing services. Bulk load shifting, in particular, is a potential opportunity that may arise from increasing proportions of EVs in the overall vehicle stock.
DSM measures related to EVs include delaying or expediting the time of charging to periods of low power demand, stopping or starting it, speeding it up or slowing it down.7 Bulk load shifting could be achieved by taking actions that modulate the charging time and profiles of several vehicles simultaneously, within the bounds of individual requirements such as having a target time for a full recharge. If such demand management occurs in a co-ordinated manner, it allows for larger numbers of EVs to use electricity service at a given capacity compared to a situation of uncoordinated charging. Within a short time frame, electric vehicles also may be an opportunity for providing frequency response services for grid reliability and cost-effectiveness, using electric vehicles as distributed energy storage to provide back-up capacity and flexibility at the minute-to-millisecond level.
6 This calculation assumes that the charging events would be evenly spread across a period of two hours and takes into account that every event is coupled with a 35 kWh recharge, lasting six minutes. 7 The ability of EVs (and storage, more generally) to increase as well as decrease consumption distinguishes them somewhat from other more traditional forms of demand response, which typically takes the form of demand reduction.

© OECD/IEA 2018 Nordic EV Outlook 2018 Insights from leaders in electric mobility
Page | 65
Page | 65
Page | 65
Page | 65
Page | 65
Page | 65
Page | 65
Page | 65
Page | 65
Page | 65
Page | 65
Page | 65
Page | 65
Page | 65
Page | 65
Page | 65
Page | 65
Page | 65
Page | 65
Page | 65
Page | 65
Page | 65
Page | 65
Page | 65
Page | 65
Page | 65
Page | 65
Page | 65
DSM can also lead to a reduction of CO2 emissions by reducing the need for generation in peak periods. The profile of generation for peaking purposes in the Nordic countries can be more CO2-intensive than in baseload generation. EV charging, to some degree, can be encouraged in periods when low-carbon power generation is available.
An area where DSM can be particularly effective in the short term is the possibility to accommodate a larger amount of home chargers in areas that have experienced bottlenecks in local grids. Such solutions are already employed, for example in condominiums or apartment buildings in Norway with significant EV ownership rates. This can help to delay or avoid the need to perform grid upgrades. In Norway, such costs are often charged to the first customer who requests a capacity increase (e.g. due to purchasing an EV) that exceeds the capacity of the existing transformer and this stimulates the adoption of alternative solutions. Several condominiums in Norway have adopted an EV charge management system that recharges the EVs in sequence or at reduced power rates in order to limit the overall power requirement. Similar equipment is commercially available in Sweden. The business models for these power management systems are still unclear, but they are evolving rapidly (Hovland, 2017).
Aggregators
Explicit DSM can be a more effective instrument for grid reliability and cost-effectiveness if there is an oversight party, such as an aggregator that combines and steers demand-side actions from multiple consumers. An aggregator is a service provider who gathers a set of flexible demand units, such as EVs, to sell the flexibility of electric loads available from these units in electricity markets. In order to be able to do this, aggregators need to negotiate agreements with industrial, commercial and residential electricity consumers to aggregate their loads (SECD, 2017). Power retailers sometimes take on the role of aggregator.
Aggregators are also important to address a number of barriers to market response, including the lack of knowledge and experience by consumers to identify their potential for flexibility, or the limited potential for individual responses, given that the costs recovered with demand management may be too little to mobilise the interest from individual electric car owners.8 Using aggregators to steer smart charging may become relevant in regions where electricity prices are low and in regions where consumers spend only a very small fraction of their disposable income on electricity.
It is unlikely that aggregators will engage in such activities in the absence of a compelling business case; such business model opportunities currently are relatively weak in the Nordic countries. Demand for flexibility from TSOs and DSOs is limited, as Nordic grids are relatively strong and have large capacity reserve due to hydropower reservoir reserves in Norway that serve Nord Pool operations (SEDC, 2017). As a result, prices for flexibility services are low. Nevertheless, with increasing amounts of variable renewable energy sources and the uptake of EVs, demand for these services may increase.
The design of national regulatory frameworks largely affect the extent to which business models for explicit demand response solutions can be pursued and be effective. Small consumers and aggregators, in particular, are subject to barriers to enter the short-term and system services markets set by market participation rules. A revision of the prequalification rules for market participation may be necessary to allow the presence of a pool of demand-side resources
8 This is illustrated by the case of Finland, where such contracts are available, but only 7% of households have signed up for the variable electricity contract with hourly rates (Paananen, 2017).

Nordic EV Outlook 2018 © OECD/IEA 2018 Insights from leaders in electric mobility
Page | 66 Page | 66 Page | 66 Page | 66 Page | 66 Page | 66 Page | 66 Page | 66 Page | 66 Page | 66 Page | 66 Page | 66 Page | 66 Page | 66 Page | 66 Page | 66 Page | 66 Page | 66 Page | 66 Page | 66 Page | 66 Page | 66 Page | 66 Page | 66 Page | 66 Page | 66 Page | 66 Page | 66
(e.g. through aggregators) or individual players in these markets.9 Today, only a few countries allow the participation of aggregators in such markets. Whereas regulatory barriers in Denmark, Norway and Sweden still hinder explicit DSM actions and market participation, Finland stands out as it allows independent aggregation in certain programmes in ancillary services (SEDC, 2017). Furthermore, the DSO monopoly system, and its being subject to revenue cap regulations, limits the business development of DSM solutions. DSOs are also not allowed to have a direct relation with end-consumers in most Nordic countries (Thorbjørnsen, 2017).
The roll out of smart metering systems is essential for DSM, because a core aspect is the temporal dimension: it is important to be able to know when and how much energy is actually consumed. The Nordic countries already have progressed quite far in this regard.10 This is in line with the EU Directive 2014/94/EU on the deployment of alternative fuels infrastructure, which states that “the recharging of electric vehicles at recharging points should, if technically and financially reasonable, make use of intelligent metering systems” (EC, 2014c).
Dynamic electricity pricing
Dynamic pricing (implicit DSM) is key to influence the shape of the average demand profile of small consumers to better fit with system needs and capabilities. With dynamic pricing, flexible prices for electricity are set, for example based on time of use or maximum power demand. The idea is to discourage consumers from using electricity when the grid is stressed or when generation capacity is tight, and as a result dynamic pricing can be an instrument to encourage peak shaving and shifting. It can contribute to alleviating congestion on the local grid. Time-based pricing is in place in Sweden, Finland, Norway and Denmark on a voluntary basis, supported by the widespread installation of smart meters.
In addition to time-based prices, Norway is planning to introduce a new pricing mechanism based on capacity utilisation, starting in 2019 (NVE 2016a).11 The tariff charged will correspond to the highest power capacity demanded in a given timeframe, and therefore provides a direct incentive to avoid the charging of EVs during peak hours. NVE has reasoned that demand for capacity during peak hours is a main cost driver in the grid and wants to reflect this in the tariff (NVE, 2016a).
Vehicle-to-grid
Vehicle-to-grid (V2G) refers to using the EV battery capacity to transfer electricity back to the grid in case of need (IEA HEV TCP, 2017), for example by supplementing back-up generation power or by providing ancillary services such as frequency response measures. This can be seen as an evolution of explicit DSM solutions.
V2G may contribute to energy cost reduction by means of enabling energy arbitrage and increasing on-site renewable energy generation capacity. It is currently being investigated through pilot projects and business models globally and in the Nordic region (IEA HEV TCP, 2017).
A number of barriers could hinder the deployment of V2G technologies. First, EVSE would need to allow bi-directional charging. Second, V2G requires separate metering. Third, it necessitates real-time communication between EVSE, EV and power retailers to control the charging of EVs. V2G also faces challenges that are similar to those of other explicit DSM solutions that require 9 Examples of prequalification rules are a maximum peak demand limit or voltage control. Small participants such as individual EV owners are normally not allowed to participate in these markets. 10 All households in Finland and Sweden already have a smart meter. Full coverage in Norway and Denmark is expected by 2020 (JRC, 2017 and NVE, 2016a). 11 The capacity charge, already in place for large consumers, will be applied to small consumers in 2019.

© OECD/IEA 2018 Nordic EV Outlook 2018 Insights from leaders in electric mobility
Page | 67
Page | 67
Page | 67
Page | 67
Page | 67
Page | 67
Page | 67
Page | 67
Page | 67
Page | 67
Page | 67
Page | 67
Page | 67
Page | 67
Page | 67
Page | 67
Page | 67
Page | 67
Page | 67
Page | 67
Page | 67
Page | 67
Page | 67
Page | 67
Page | 67
Page | 67
Page | 67
Page | 67
aggregators to facilitate its adoption because it only provides limited incentives for consumers to engage. Today, the price of a bi-directional charger is about four-times higher than that of a conventional charger, and compensation schemes for grid services to small consumers are not yet clearly defined (Thorbjørnsen, 2017).
Network investments and planning
In addition to actions on the demand side, network operators can undertake actions to prepare the grid for additional load related to the increased uptake of EVs.
Grid upgrades
In many places EV stock shares are still limited and so are the impacts on electrical grids, yet anticipating rising EV numbers with regular maintenance and replacement of aged infrastructure may bear fruits in the future. For example, NVE has assessed that many of the current transformers and power lines in the distribution grids will need to be replaced by 2030, due to their age (NVE, 2016b). Network companies therefore are recommended to consider installing cables and transformers with higher capacity to prepare for increased loads. The regulator’s assessment indicates that the TSOs and DSOs could consider making new investments earlier than otherwise necessary. NVE estimates that NOK 33 billion (USD 4 billion) will be invested in the high-voltage distribution and NOK 15 billion (USD 2 billion) in low-voltage distribution grids in the period 2016-25.
Stationary storage
The Nordic countries are also looking into the use of stationary batteries for grid balancing services. Such solutions are costly and not yet in operation in the Nordic countries; nevertheless, companies are testing the concept. For example, Lyse AS, a conglomerate, which includes a utility business and a DSO among other enterprises, in Stavanger and Sandnes is running a pilot project that includes 11 chargers with battery packs and a solar system on the roof. Stavanger is also one of the five pilot sites of the EU-funded INVADE project (INVADE, 2017). The project considers how batteries will affect the grid and potential business models that could arise from this. For stationary battery systems to provide a meaningful contribution to grid reliability these systems will likely need to be leveraged by an aggregator.


© OECD/IEA 2018 Nordic EV Outlook 2018 Insights from leaders in electric mobility
Page | 69
Page | 69
Page | 69
Page | 69
Page | 69
Page | 69
Page | 69
Page | 69
Page | 69
Page | 69
Page | 69
Page | 69
Page | 69
Page | 69
Page | 69
Page | 69
Page | 69
Page | 69
Page | 69
Page | 69
Page | 69
Page | 69
Page | 69
Page | 69
Page | 69
Page | 69
Page | 69
Page | 69
5. Market and policy outlook This section looks at the future of the electric car market in the Nordic countries and their plans to catalyse growth by sustaining and adapting consumer incentives. Based on current market observations and announced government targets, our projections for EV and EVSE uptake to 2030 are presented below. For the longer term, this section considers issues of urban mobility and taxation of transport in a way that can ensure that EVs fully contribute to a sustainable transportation system.
Plans and targets for electric vehicles and decarbonisation
All five Nordic countries are signatories of the 2015 Paris Agreement on climate change which set an objective of limiting the global average temperature rise (UNFCCC, 2017). Countries tabled their pledges in Nationally Determined Contributions in Paris. In their pledges, each of the Nordic countries have committed to ambitious energy system decarbonisation targets, most of them going beyond the ambitions voiced by the EU 2030 climate and energy framework (EC, 2017d) and the EU Energy Roadmap 2050 (EC, 2011). Norway and Finland have set national targets for the deployment of electric vehicles in the 2025-30 period. All of the Nordic countries have announced the continuation or adaptation of financial incentives schemes for electric vehicles for the next one to five years (Table 5.1).
Table 5.1 • Decarbonisation goals, EV deployment targets and announced policies as of end-2017
Country/ region
Energy system decarbonisation goals
EV deployment targets Announced electric car policies
European Union
40% GHG emissions reduction by 2030 (EC, 2017d), and 80-95% GHG emissions reduction by 2050 (from 1990 levels) (EC, 2011).
CO2 performance standards for new cars and LCVs, aiming to achieve a 30% reduction in CO2 emissions/km between 2021 and 2030, including a CO2 credit for OEMs achieving 15% zero- and low-emission vehicles (equivalent to FCEVs, BEVs and PHEVs) sales by 2025, and 30% by 2030 (EC, 2017a).
Denmark
Fossil fuel-free goal by 2050 (Danish Energy Agency, 2017a).
No official electric car deployment target (EC, 2017c).
In response to low electric car sales in 2016-17, delay of the phase-in of the full registration tax for electric cars: it will be maintained at 20% of the full registration tax rate until 2019 (instead of 2017) or until 5 000 new registrations. Full tax to be gradually phased in: 40% in 2020, 65% in 2021, 90% in 2022, 100% in 2023 (Regeringen, 2017).

Nordic EV Outlook 2018 © OECD/IEA 2018 Insights from leaders in electric mobility
Page | 70 Page | 70 Page | 70 Page | 70 Page | 70 Page | 70 Page | 70 Page | 70 Page | 70 Page | 70 Page | 70 Page | 70 Page | 70 Page | 70 Page | 70 Page | 70 Page | 70 Page | 70 Page | 70 Page | 70 Page | 70 Page | 70 Page | 70 Page | 70 Page | 70 Page | 70 Page | 70 Page | 70
Country/ region
Energy system decarbonisation goals
EV deployment targets Announced electric car policies
Finland 50% GHG emissions reduction from transport by 2030 from 2005 level (EVI, 2017).
80% GHG emissions reduction across all sectors by 2050 from 1990 level (Finlex, 2017).
More than 250 000 electric vehicles by 2030 (EVI, 2017 and EC, 2017c). Finland supports the EVI's EV30@30 campaign, which sets a collective aspirational goal to reach 30% sales share for electric vehicles by 2030 (EVI, 2017).
From 2018 and for at least three years, BEVs will benefit from an acquisition discount at sale or leasing of EUR 2 000 (USD 2 300) for cars priced below EUR 50 000 (USD 56 000) (including VAT and registration tax). Additionally, the registration tax rate for zero-emission vehicles will decline in four steps from 4.4% in 2016 to 2.7% in 2019.
Iceland
50-75% GHG emissions reduction by 2050, from 1990 level (Icelandic Ministry for the Environment, 2007). This target is currently under revision.
No official EV deployment target (Friðleifsson, 2017).
No change announced for the registration tax scheme based on CO₂ emission levels or the VAT exemption for BEVs and PHEVs.
Norway 80-95% GHG emissions reduction by 2050 from 1990 level (Norwegian Ministry of Climate and Environment, 2017).
The National Transport Plan (NTP) 2018-29 states that "after 2025, all new light-duty vehicles, city buses and light commercial vans should be zero-emission vehicles" (Avinor et al., 2016).
Extension of the VAT exemption scheme for BEVs and FCEVs to 2020 and of the differentiated registration tax scheme (Regjeringen, 2017 and EFTA Surveillance Authority, 2017).
Sweden
70% GHG emissions reduction from domestic transport by 2030, from 2010 level, and net-zero GHG emissions across all sectors by 2045 (Government of Sweden, 2017a).
No official electric car deployment target (IEA, 2016b and EC, 2017c). Nevertheless, Sweden supports the EVI's EV30@30 campaign, which sets a collective aspirational goal to reach 30% sales share for electric vehicles by 2030 (EVI, 2017).
Replacement of the super green car rebate in 2018 by a cost neutral bonus-malus scheme. Bonus for low emissions cars (< 60 gCO₂/km) to be set at SEK 10 000 (USD 1 200) and bonus for zero emission cars to be set at SEK 60 000 (USD 7 000). The malus will take the form of a higher circulation tax, instead of a higher purchase tax. (Government of Sweden, 2017b).
Key point: The Nordic countries have announced ambitious plans to cut GHG emissions in the period to 2050, which are at least as ambitious as the EU targets, complemented by national EV deployment targets for Finland and Norway. They also defined financial incentive strategies for the short to medium term.
In addition, a number of cities in the Nordic countries have announced intentions to take measures to restrict vehicle access in selected urban areas that do not comply with certain environmental parameters. For example, Sweden plans to widen its national legal framework to define the characteristics of a set of environmental zones, allowing cities to adopt them in different parts of their urban area (Box 5.1). The mayor of Copenhagen announced the intention to ban new diesel ICEs from entering the city’s environmental zone as from January 2019

© OECD/IEA 2018 Nordic EV Outlook 2018 Insights from leaders in electric mobility
Page | 71
Page | 71
Page | 71
Page | 71
Page | 71
Page | 71
Page | 71
Page | 71
Page | 71
Page | 71
Page | 71
Page | 71
Page | 71
Page | 71
Page | 71
Page | 71
Page | 71
Page | 71
Page | 71
Page | 71
Page | 71
Page | 71
Page | 71
Page | 71
Page | 71
Page | 71
Page | 71
Page | 71
(Lindtoft, 2017). This is intended as a signal to future buyers of diesel vehicles while not impacting owners of cars purchased before the measure is implemented. A wider implementation of access restrictions to key urban zones is likely to affect the EV market by increasing the attractiveness of electric car models over ICEs, e.g. by impacting the rate of depreciation of each of these technologies, inducing faster depreciation for ICE cars than for electric cars. These effects could potentially be witnessed even prior to the effective implementation of such zones, thereby steering purchase choices towards technologies that are best suited to comply with the announced policy requirements.
Box 5.1 • Sweden's Environmental Zones Programme
Environmental zones started at the municipal level in 1996 to reduce noise and air pollution in urban centres. They targeted heavy-duty trucks and buses. In 2006, the access restrictions to such zones were harmonised under a single national framework: trucks and buses less than six-year old could enter restricted zones, with exceptions for older vehicles meeting the EURO IV or EURO V standards (at first registration or via a retrofit) (DieselNet, 2017). In 2016, the Swedish Transport Board (Transport Styrelsen) proposed to extend this national framework to include light-duty vehicles via the creation of two additional classes of environmental zones: Class 2 zones would be opened to cars compliant with the Euro 5 (Euro 6 for diesel cars) standard, while Class 3 zones would be restricted to zero-emission cars and hybrid heavy-duty vehicles complying with the Euro VI standard only (Transport Styrelsen, 2016). The city of Stockholm is considering the implementation of such zones post-2020, after the national framework enters into force.
Plans and targets for EVSE deployment
Table 5.2 • Overview of announced EVSE-related policy instruments in the Nordic countries and the European Union
Country/ region
Policy instrument and objective
Description Current status
European Union (applicable to all Nordic countries, as members of the EEA)
Alternative fuels infrastructure (AFI) Directive 2014/94 Action Plan (EC, 2017b).
The AFI Directive and the Action Plan propose an indicative target of 440 000 publicly accessible charging points of by 2020 (EC, 2014c and EC, 2017b).
With a cumulative target of 200 000 publicly accessible charging points by 2020 in the national policy frameworks submitted in 2016, it falls short of the target set by the European Commission.
Connecting Europe Facility (CEF) for Transport blend of grants and loans1 (EC, 2017b).
Upgrade of the CEF budget in 2018 to USD 394 million, aiming to leverage USD 2 billion in total.
Original budget of USD 170 million.
Energy performance of buildings EPB Directive (Council of the European Union, 2017).
Expanded requirements on charging infrastructure in new and existing buildings.
Political agreement has been reached; the outcomes now have to be approved by the European Parliament and the European Council.
1 A mix of financial instruments, combining non-repayable grants with repayable debt finance tools.
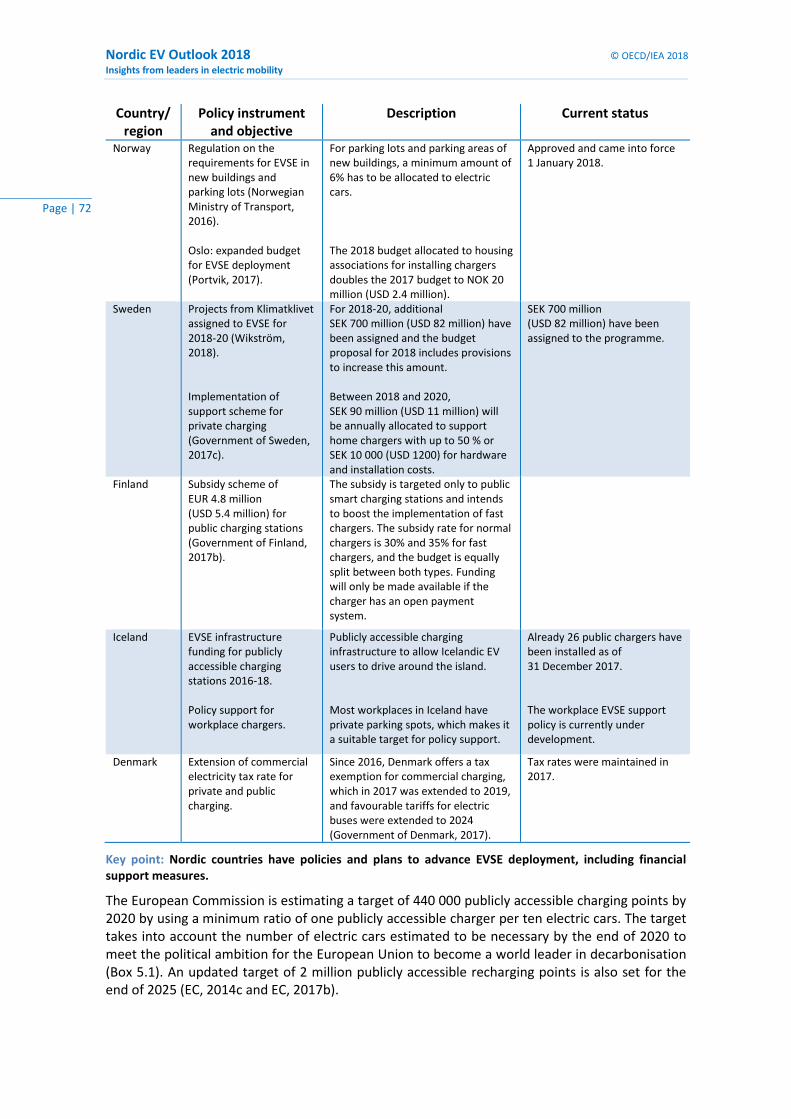
Nordic EV Outlook 2018 © OECD/IEA 2018 Insights from leaders in electric mobility
Page | 72 Page | 72 Page | 72 Page | 72 Page | 72 Page | 72 Page | 72 Page | 72 Page | 72 Page | 72 Page | 72 Page | 72 Page | 72 Page | 72 Page | 72 Page | 72 Page | 72 Page | 72 Page | 72 Page | 72 Page | 72 Page | 72 Page | 72 Page | 72 Page | 72 Page | 72 Page | 72 Page | 72
Country/ region
Policy instrument and objective
Description Current status
Norway Regulation on the requirements for EVSE in new buildings and parking lots (Norwegian Ministry of Transport, 2016). Oslo: expanded budget for EVSE deployment (Portvik, 2017).
For parking lots and parking areas of new buildings, a minimum amount of 6% has to be allocated to electric cars. The 2018 budget allocated to housing associations for installing chargers doubles the 2017 budget to NOK 20 million (USD 2.4 million).
Approved and came into force 1 January 2018.
Sweden Projects from Klimatklivet assigned to EVSE for 2018-20 (Wikström, 2018). Implementation of support scheme for private charging (Government of Sweden, 2017c).
For 2018-20, additional SEK 700 million (USD 82 million) have been assigned and the budget proposal for 2018 includes provisions to increase this amount. Between 2018 and 2020, SEK 90 million (USD 11 million) will be annually allocated to support home chargers with up to 50 % or SEK 10 000 (USD 1200) for hardware and installation costs.
SEK 700 million (USD 82 million) have been assigned to the programme.
Finland Subsidy scheme of EUR 4.8 million (USD 5.4 million) for public charging stations (Government of Finland, 2017b).
The subsidy is targeted only to public smart charging stations and intends to boost the implementation of fast chargers. The subsidy rate for normal chargers is 30% and 35% for fast chargers, and the budget is equally split between both types. Funding will only be made available if the charger has an open payment system.
Iceland EVSE infrastructure funding for publicly accessible charging stations 2016-18. Policy support for workplace chargers.
Publicly accessible charging infrastructure to allow Icelandic EV users to drive around the island. Most workplaces in Iceland have private parking spots, which makes it a suitable target for policy support.
Already 26 public chargers have been installed as of 31 December 2017. The workplace EVSE support policy is currently under development.
Denmark Extension of commercial electricity tax rate for private and public charging.
Since 2016, Denmark offers a tax exemption for commercial charging, which in 2017 was extended to 2019, and favourable tariffs for electric buses were extended to 2024 (Government of Denmark, 2017).
Tax rates were maintained in 2017.
Key point: Nordic countries have policies and plans to advance EVSE deployment, including financial support measures.
The European Commission is estimating a target of 440 000 publicly accessible charging points by 2020 by using a minimum ratio of one publicly accessible charger per ten electric cars. The target takes into account the number of electric cars estimated to be necessary by the end of 2020 to meet the political ambition for the European Union to become a world leader in decarbonisation (Box 5.1). An updated target of 2 million publicly accessible recharging points is also set for the end of 2025 (EC, 2014c and EC, 2017b).

© OECD/IEA 2018 Nordic EV Outlook 2018 Insights from leaders in electric mobility
Page | 73
Page | 73
Page | 73
Page | 73
Page | 73
Page | 73
Page | 73
Page | 73
Page | 73
Page | 73
Page | 73
Page | 73
Page | 73
Page | 73
Page | 73
Page | 73
Page | 73
Page | 73
Page | 73
Page | 73
Page | 73
Page | 73
Page | 73
Page | 73
Page | 73
Page | 73
Page | 73
Page | 73
National governments established their own targets and submitted them to the European Commission by late 2016 (EC, 2014c). The review of these frameworks led to the observation that the level of ambition and detail of national policy frameworks related to EV deployment varies considerably among EU members (EC, 2017b). The national plans indicated a cumulative total of about 200 000 public accessible recharging points by 2020 – short of the target set by the Commission.
Among the Nordic countries in 2017, Sweden was closest to the ratio of one publicly accessible charger per ten electric cars set by the European Commission. This ratio is lowest in Norway and Iceland, which have the highest stock share of electric cars in the region, while the ratio is the highest in Denmark and Finland which have the lowest share of electric cars in their vehicle stock. The assessment of the national policy frameworks submitted under Article 10(2) of the AFI Directive shows that Finland proposed both a short-term and long-term target, while Denmark only proposed a 2020 EVSE deployment target (Table 5.3). Sweden did not specify any EVSE deployment target in their national policy framework, but new budget allocation rounds of the Klimaklivet suggests that that EVSE deployment will continue apace with the uptake of electric cars (Wikström, 2018).
Table 5.3 • National targets for EVSE deployment in the Nordic countries that are members of the European Union
Country
Target for publicly accessible charging infrastructure
(number of charging points) Network coverage (charging point every 60 km)
2020 2025 2030
Denmark 3 000 NA NA Yes
Finland 2 000 NA 25 000 NA
Sweden NA NA NA NA
European Union 440 000 2 million NA NA
Source: EC (2017c).
Key point: Of the three Nordic countries which are EU members, Denmark and Finland provided EVSE deployment targets for 2020 and only Finland has set a target for 2030.
Electric vehicle deployment prospects
Electric car outlook to 2030
The stock of electric cars could grow to 4 million in the Nordic region by 2030 (Figure 5.1) under projections accounting for the current status of the electric car market in each Nordic country, the level of ambition for GHG emission reductions and announcements made for the future of electric mobility (Table 5.1).

Nordic EV Outlook 2018 © OECD/IEA 2018 Insights from leaders in electric mobility
Page | 74 Page | 74 Page | 74 Page | 74 Page | 74 Page | 74 Page | 74 Page | 74 Page | 74 Page | 74 Page | 74 Page | 74 Page | 74 Page | 74 Page | 74 Page | 74 Page | 74 Page | 74 Page | 74 Page | 74 Page | 74 Page | 74 Page | 74 Page | 74 Page | 74 Page | 74 Page | 74 Page | 74
Figure 5.1 • Deployment scenario for the stock of electric cars by country to 2030
Key point: Based on current market development, announced policies and climate ambitions in the five Nordic countries, the electric car stock is projected to reach 4 million units by 2030.
The electric car deployment represented in Figure 5.1 depicts a scenario in which decarbonisation goals and EV deployment targets are met, despite significant policy challenges.
Such development implies more than a 15-fold growth of the electric car stock in the region from 2017 levels. Norway and Sweden lead, accounting for 80% of the electric car stock in the region in 2030. This reflects the relative size of their car markets (65% of the region’s PLDV stock is in Norway and Sweden), as well as Norway's stated ambition to have only zero-emission car sales after 2025 (Avinor et al., 2016), in addition to Sweden’s goal to reduce GHG emissions by 70% compared with 2010 (Government of Sweden, 2017a).
In the projections, in terms of market share, Norway experiences rapid developments to 2030 and reaches 92% market share of electric cars in that year. This reflects the stated ambitions of Norway’s government (see previous paragraph) and the strong market uptake already characterising the Norwegian market.2 Denmark, Finland and Sweden, which had comparatively lower market shares in 2017 (no more than 12%), also witness strong market growth to reach a market share close to 35% in 2030. This puts these countries roughly in line with the EV30@30 target which has an objective of a 30% market share of electric vehicles for all passenger cars, light commercial vehicles, buses and trucks by 2030 among all EVI member countries. The EV30@30 target is itself aligned with the climate objectives set by the 2015 Paris Agreement on climate change (IEA, 2017a). Finland, Sweden and Norway committed to the EV30@30 target in June 2017 (EVI, 2017). In the case of Finland, this matches the target of 250 000 electric cars on the road by 2030. The 35% market share in these countries also ensures they are at the forefront of the 30% objective set in the update of the fuel economy regulation for cars and light commercial vehicles recently proposed by the European Commission (EC, 2017a).
In 2030, of the 4 million electric cars projected by the outlook Figure 5.1, slightly more than one-third are PHEVs. This proportion comes to 85% BEVs in Norway, due to their ambition to achieve 100% zero-emission vehicle sales after 2025. As the electric car market grows and gradually
2 This intends to reflect the possibility for other technologies to fulfil the remainder of Norway's zero-emissions sales target by 2025.
0.0
0.5
1.0
1.5
2.0
2.5
3.0
3.5
4.0
4.5
2010 2015 2020 2025 2030
Elec
tric
car
s (m
illio
ns)
Sweden
Norway
Iceland
Finland
Denmark

© OECD/IEA 2018 Nordic EV Outlook 2018 Insights from leaders in electric mobility
Page | 75
Page | 75
Page | 75
Page | 75
Page | 75
Page | 75
Page | 75
Page | 75
Page | 75
Page | 75
Page | 75
Page | 75
Page | 75
Page | 75
Page | 75
Page | 75
Page | 75
Page | 75
Page | 75
Page | 75
Page | 75
Page | 75
Page | 75
Page | 75
Page | 75
Page | 75
Page | 75
Page | 75
displaces the conventional vehicle market, electric cars will need to cover all user needs, from short distance commuting to long-distance trips, hence a technology diversification between BEVs and PHEVs. This diversification is also reflected in the greater model availability seen today in the larger car segments for PHEVs and in the small car segment for BEVs. However, the PHEV versus BEV distribution rate in the electric car stock is likely to vary in each Nordic country depending on the degree of differentiation in policies and incentives towards BEVs and PHEVs. Notably, the pollution and CO2 benefits stemming from vehicle electrification will largely depend on PHEV owners' driving choices to use their car in electric mode rather than the internal combustion engine. Fuel and circulation policies will strongly influence this choice. For example, fuel price signals or the mandated use of the zero-emission capability of PHEVs in city centres will increase the share of electric driving. In this projection, PHEVs operate in electric mode for 80% of their annual mileage in 2030.
Electric car charging infrastructure projections to 2030
On average in 2017 there was one publicly accessible charger for 15 electric cars in the Nordic region. By country, the ratio was varied: Denmark and Finland, the smallest electric car markets in terms of market share, have a significantly higher ratio of chargers per electric car than the regional average, which can be viewed as the EVSE deployment being ahead of electric car sales uptake. Conversely, Norway and Iceland have a lower ratio of publicly accessible chargers per electric car. Iceland has the lowest ratio with only one charger for 45 electric cars.
Taking into account these current ratios and given the projected increase in the number of electric cars, the number of publicly accessible chargers in the Nordic region could range from 210 000 to 400 000 units by 2030 (Figure 28). Our central scenario projects 290 000 chargers by 2030. This assumes that the countries with the highest market shares of electric cars (Norway, Iceland and Sweden) maintain their 2017 ratios of chargers to electric cars throughout the period to 2030, while Denmark and Finland progressively move to a ratio of one charger per ten electric cars, which is compliant with the AFI Directive.
In the future, additional publicly accessible charging infrastructure will be needed as electric car adoption reaches all car owner categories, including those living in dense urban centres in apartment buildings with no private charging options. If the Nordic region as a whole advanced its EVSE deployment such that each country converged to a ratio of one charger for ten electric cars, as suggested by the AFI Directive, more than 380 000 chargers would be installed over the next 12 years (Figure 5.2, upper range).
A more conservative EVSE deployment trajectory for the region, is based on the current case of Norway, the region's most developed electric car market although with a comparatively low ratio of publicly available chargers per electric car. Using Norway’s current ratio of one charger for 19 electric cars across the region, around 210 000 chargers would be installed by 2030 (Figure 5.2, lower range).
Projections using the region's 2017 ratios of one publicly accessible slow charger for 18 electric cars and one publicly accessible fast charger for 106 electric cars per suggest that, if they remain unchanged over time, the 2030 EVSE stock will be split between roughly 250 000 publicly accessible slow chargers and 40 000 publicly accessible fast chargers in the central scenario. However, if high-power chargers (up to 450 kW) were deployed at a large scale over the next decade (see for example projects Ultra-E [EC, 2016b], FastCharge" [BMW, 2017] and Ionity [2017]), the total number of chargers could be lower than suggested in Figure 5.2, and the ratios of fast chargers to slow chargers may evolve significantly. This is because a major shift of charging infrastructure services towards high-power charging, including in urban areas, could correspond to a model where charging in publicly accessible areas is decoupled from parking and could be

Nordic EV Outlook 2018 © OECD/IEA 2018 Insights from leaders in electric mobility
Page | 76 Page | 76 Page | 76 Page | 76 Page | 76 Page | 76 Page | 76 Page | 76 Page | 76 Page | 76 Page | 76 Page | 76 Page | 76 Page | 76 Page | 76 Page | 76 Page | 76 Page | 76 Page | 76 Page | 76 Page | 76 Page | 76 Page | 76 Page | 76 Page | 76 Page | 76 Page | 76 Page | 76
closer to that of petrol stations with rapid refuelling. Reservations on the successful deployment of this approach are primarily related to costs of the charging installations and the need for local grid upgrades or significant use of stationary storage.
Figure 5.2 • Deployment scenario for publicly accessible charging outlets to 2030
Sources: IEA analysis based on electric car projections suggested in Figure 5.1 and a ratio of 15 electric cars per publicly accessible charger, as observed in 2017 in the Nordic countries (18 electric cars per slow charger and 106 per fast charger). The projections based on the EU Alternative Fuels Infrastructure Directive assume ten electric cars per publicly accessible charger.
Key point: Based on current electric car market development, announced policies and climate ambitions in the Nordic countries, as well as current and recommended electric car per charger ratios, the number of publicly accessible charging outlets could range between 210 000 and 400 000 by 2030.
Electricity use and GHG emission savings
Electricity use
The electric car deployment scenario presented in Figure 5.1 suggests an increase in electricity consumption related to car use in each of the Nordic countries. For the Nordic region this is estimated to be close to 9 TWh in 2030, compared to 470 GWh in 2017 (Figure 5.3). This would represent 2-3% of the total electricity consumption of the Nordic countries in 2030 (IEA, 2017b).
This shows that, despite being sizeable, the increase in electricity demand from electric cars should not pose major threats of a shortage of generation capacity. This projected demand increase from electric cars (9 TWh) would occur in an overall context where 15 additional TWh of electricity demand could stem from the services sector while energy efficiency measures in the household sector could reduce demand by 12 TWh (IEA, 2017b).
0
50
100
150
200
250
300
350
400
450
2017 2018 2019 2020 2021 2022 2023 2024 2025 2026 2027 2028 2029 2030
Num
ber
of c
harg
ers
(tho
usan
ds)
Alternative Fuels Directive (upper range) and conservative scenario (lower range)Publicly accessible fast chargersPublicly accessible slow chargersPublicly accessible chargers - Central deployment scenario

© OECD/IEA 2018 Nordic EV Outlook 2018 Insights from leaders in electric mobility
Page | 77
Page | 77
Page | 77
Page | 77
Page | 77
Page | 77
Page | 77
Page | 77
Page | 77
Page | 77
Page | 77
Page | 77
Page | 77
Page | 77
Page | 77
Page | 77
Page | 77
Page | 77
Page | 77
Page | 77
Page | 77
Page | 77
Page | 77
Page | 77
Page | 77
Page | 77
Page | 77
Page | 77
Figure 5.3 • Total electricity consumption attributable to electric cars in the Nordic countries, 2017 and 2030
Notes: GWh = gigawatt-hours. TWh = terawatt-hours. The following assumptions are used for the electricity consumption calculations in 2030: - Fuel economy: 17.6 kWh/100 km (including 10% to account for charging losses and EVSE own energy use). - Annual mileage: 14 600 km (Denmark, Finland, Sweden), 12 500 km (Iceland, Norway). - Share of PHEVs in the total of electric cars: 45% (Denmark, Finland, Sweden), 51% (Iceland), 85% (Iceland, Norway). - Share of electric driving for PHEVs: 80% of the annual mileage.
Source: IEA analysis based on projected electric car stock (shown in Figure 5.1).
Key point: The projected stock of electric cars in the Nordic countries could increase electricity demand from 470 GWh in 2017 to 9 TWh in 2030, which would represent 2-3% of the region’s electricity consumption in 2030.
Greenhouse gas emissions savings
Even if climate change mitigation is not an intrinsic feature of electric mobility due to its upstream emissions (complementing its zero emissions at the tailpipe), the climate mitigation potential of electric vehicles in the Nordic region is very significant. A number of facts support this potential:
• Electric cars are two-to-four-times more energy efficient than their ICE counterparts, meaning that electric cars can cover longer distances than ICEs for the same amount of final energy used.
• Power generation in the Nordic countries generally has a low-carbon profile. The CO2 intensity of power generation in Iceland, Norway and Sweden typically does not exceed 50 gCO2/kWh and that of Denmark and Finland is below the EU average.
• The Nordic countries have pledged to reduce the CO2 intensity of the electricity networks over the coming years. Both Denmark and Finland have signed an agreement to phase out coal from their power generation mixes by 2030 (Energi-sverige.se, 2017). Currently, Iceland, Norway and Sweden do not produce any electricity using coal.
Figure 5.4 shows that the 4 million electric cars projected to enter the Nordic market would emit as little as 0.2 MtCO2-eq in 2030 – 40 times less than emissions from an equivalent number of ICE cars (which would lead to 8.4 Mt CO2-eq). In the case of a more CO2 intensive electricity generation mix, for example, the average for the EU which is projected to more than halve its CO2 intensity before 2030, the projected electric car penetration would still represent over 6 Mt CO2-
eq savings and be five-times lower than a case with ICE cars in 2030. If the carbon intensity of the EU average for electricity generation did not decrease over the projection period, electric cars would be responsible for 2.3 MtCO2-eq more emissions in 2030 than with a lower carbon intensity of the power generation mix. However, close to 4 MtCO2-eq are being saved compared
12%
6%
2%
41%
39%
2030: 9.0 TWh
Denmark
Finland
Iceland
Norway
Sweden
2017: 470 GWh

Nordic EV Outlook 2018 © OECD/IEA 2018 Insights from leaders in electric mobility
Page | 78 Page | 78 Page | 78 Page | 78 Page | 78 Page | 78 Page | 78 Page | 78 Page | 78 Page | 78 Page | 78 Page | 78 Page | 78 Page | 78 Page | 78 Page | 78 Page | 78 Page | 78 Page | 78 Page | 78 Page | 78 Page | 78 Page | 78 Page | 78 Page | 78 Page | 78 Page | 78 Page | 78
with a case where electric cars do not penetrate the market at all. The Nordic grid already has a significantly lower CO2 intensity than the EU average, leading to no more than 0.8 MtCO2-eq emissions from electric cars by 2030, even under the assumption that the Nordic grid does not decarbonise further to 2030. These scenarios show the combined effects of electrification and power sector decarbonisation. They thereby demonstrate the need to take action both in terms of moving to low-carbon power generation (particularly in Denmark and Finland, for the Nordic region) as well as deploying electric mobility. Sizeable additional GHG benefits can also be harvested by 2030 from electrifying other transport modes, such as buses (Box 5.2).
The 247 000 electric cars operating in the Nordic region in 2017 already delivered GHG emission savings. If those cars were ICEs, they would have emitted around 760 000 more tonnes of CO2 in 2017, i.e. 2-3% of the total CO2 emissions from the transport sector in the region (IEA, 2017b).
Figure 5.4 • GHG emissions from electric cars compared with ICEs in the Nordic countries, 2017-30
Notes: 2017 numbers are estimated as an interpolation between 2015 and 2020. The following assumptions are used for the CO2-eq emissions calculations under the different scenarios: - Grid CO2 intensity 2015 (gCO2/kWh): Denmark 367, Finland 207, Iceland 1, Norway 37, Sweden 46, EU 432. - Grid CO2 intensity 2030 (gCO2/kWh): Denmark 110, Finland 62, Iceland 0.2, Norway 11, Sweden 14, EU 181. - Gasoline ICE fuel economy 2015 (lge/100km): 8.27 (Denmark, Finland, Sweden); 8.97 (Iceland, Norway). - Gasoline ICE fuel economy 2030 (lge/100km): 5.44 (Denmark, Finland, Sweden), 5.90 (Iceland, Norway). - Diesel ICE fuel economy 2015 (lge/100km): 6.87 (Denmark, Finland, Sweden), 6.78 (Iceland, Norway). - Gasoline ICE fuel economy 2030 (lge/100km): 4.89 (Denmark, Finland, Sweden), 4.83 (Iceland, Norway).
Source: IEA analysis based on projected electric car stock.
Key point: The projected 4 million electric cars in the Nordic countries could help offset 8 MtCO2-eq in 2030, equivalent to 27% of the greenhouse gas emissions from the region’s passenger vehicles in 2017.
Box 5.2 • Impacts of bus electrification on electricity use and GHG emissions
A number of Nordic countries and cities voiced ambitious intentions to transition to electric bus fleets over the next 10-15 years (see Box 2.3 and Table 5.1). Electrifying buses and minibuses could substantially magnify the impact on the region's electricity consumption and GHG emissions. If the 40 000 buses and minibuses expected on urban roads by 2030 across the Nordic region were to be fully electric, regional power demand would increase by 1.8 TWh. Figure 5.5 shows that this represents 17% of the total electricity needed to power the electric fleet of 4 million cars and 40 000 buses and minibuses projected for 2030.
0
1
2
3
4
5
6
7
8
9
2017 2018 2019 2020 2021 2022 2023 2024 2025 2026 2027 2028 2029 2030
GH
G e
mis
sion
s (M
t CO
₂eq)
GHG emissions - All-ICEpenetration scenario
GHG emissions from electriccars - EU grid scenario(without decarbonisation)
GHG emissions from electriccars - EU grid scenario (withdecarbonisation)
GHG emissions from electriccars - Nordic grid scenario(without decarbonisation)
GHG emissions from electriccars - Nordic grid scenario(with decarbonisation)

© OECD/IEA 2018 Nordic EV Outlook 2018 Insights from leaders in electric mobility
Page | 79
Page | 79
Page | 79
Page | 79
Page | 79
Page | 79
Page | 79
Page | 79
Page | 79
Page | 79
Page | 79
Page | 79
Page | 79
Page | 79
Page | 79
Page | 79
Page | 79
Page | 79
Page | 79
Page | 79
Page | 79
Page | 79
Page | 79
Page | 79
Page | 79
Page | 79
Page | 79
Page | 79
Figure 5.5 • Share of electricity demand by mode (cars, buses and minibuses) and GHG emissions of electric or diesel powered buses and minibuses, in 2030
Notes: The following assumptions are used for the electricity consumption calculations in 2030: - Electric bus and minibus fuel economy: 100 kWh/100 km (including 10% to account for charging losses and EVSE own energy use). - Annual mileage: 44 800 km. The following assumptions are used for the CO2-eq emissions calculations in 2030: - Grid CO2 intensity 2030 in the Nordic region (gCO2/kWh): 32. - Diesel bus and minibus fuel economy in 2030 (lge/100km): 34 Source: IEA analysis based on 40 000 BEV buses and minibuses.
Key point: The deployment of 40 000 electric buses and minibuses in the Nordic region's urban areas could increase electricity consumption by close to 2 TWh and avoid the emission of 1.8 Mt CO2-eq from diesel use in 2030.
The full replacement of buses and minibuses by 2030 across the Nordic region would also significantly reduce GHG emissions. Electric buses and minibuses would emit roughly 60 000 tCO2-eq in 2030, far less than the 1.8 Mt CO2eq that would be emitted without any electrification (Figure 5.5, right). This comes on top of the 8 Mt CO2eq emissions mitigation resulting from the 4 million electric cars added to the Nordic roads in the same year (Figure 5.4)
Policy strategies for a successful transition
The technology deployment needed to meet the Nordic decarbonisation goals and EV deployment targets will have to build on the successful examples of policies reviewed in this report, but the scenario outlined in Figures 5.1 and 5.2 is also likely to require policies that are yet to be developed. This section elaborates on key aspects of this point.
Transitioning EV support mechanisms and vehicle taxation
The link between government support (national and local) and the uptake of electric cars is particularly notable in the Nordic countries (see the electric car market section of this report and the Global EV Outlook 2017 (IEA, 2017a). Measures that reduce the purchase price of an electric car are effective and emerged as key policy instruments to stimulate their uptake in the market. Such economic incentives are indispensable, particularly in the early market deployment phase. Impacts on government budgets can be minimised by balancing spending on the incentives with other revenue streams, for example by applying higher tax levels on vehicles that exceed certain emission levels. For the longer term, it appears evident that governments will need to ensure
17%
83%
2030 electricity consumption: 10.7 TWh
Buses and minibuses Cars
0.0
0.2
0.4
0.6
0.8
1.0
1.2
1.4
1.6
1.8
2.0
2030G
HG
em
issi
ons
(Mt C
O₂e
q)GHG emissions - electric urban buses and minibusesGHG emissions - ICE urban buses and minibuses

Nordic EV Outlook 2018 © OECD/IEA 2018 Insights from leaders in electric mobility
Page | 80 Page | 80 Page | 80 Page | 80 Page | 80 Page | 80 Page | 80 Page | 80 Page | 80 Page | 80 Page | 80 Page | 80 Page | 80 Page | 80 Page | 80 Page | 80 Page | 80 Page | 80 Page | 80 Page | 80 Page | 80 Page | 80 Page | 80 Page | 80 Page | 80 Page | 80 Page | 80 Page | 80
balanced budgets and sustainable tax revenues in order to be able to finance good quality and clean transportation systems.
The Nordic countries already are taking actions in this regard and show a willingness to facilitate the large-scale transition of electrification of vehicles that they anticipate over the next decade:
• In Denmark, a concern that reducing the tax on registration for electric cars would have a detrimental effect on government tax revenue led to an initiative to apply the full level of tax on registration for electric cars in a gradual phase with defined levels and dates (Table 5.1).
• In Sweden, a need to consolidate electric vehicle support while avoiding tax revenue losses was addressed by switching from a rebate for the super green car to the technology-neutral bonus-malus scheme. This approach taxes vehicles with poor environmental performance and uses the revenue to provide incentives for the most environmentally friendly vehicles (Table 5.1). The bonus-malus scheme aims to be cost neutral, i.e. neither generating net revenues nor losses (Wikström, 2018).
• In Iceland, electric cars are exempt from registration taxes and from the VAT (with a ceiling). While economic incentives to support EV deployment in general enjoys political consensus in Iceland, the energy authority acknowledges the need to adjust the tax scheme in order avoid a decline in revenue from vehicle taxes (Friðleifsson, 2017).3
• With a booming electric car market supported by economic incentives, Norway’s vehicle tax revenues are lower than they would be in the absence of the incentives.4 The government has estimated losses from vehicle and fuel tax revenues for the future.5 So far, the only policy measure to limit losses is a national rule, applicable in 2018, that allows local authorities to introduce parking fees for electric vehicles, provided that they remain at least 50% lower than for ICE vehicles (Fridstrøm, 2017a). The government’s proposal to reintroduce purchase tax for large BEVs (with a curb weight above 2 tonnes) from 2018 was turned down in the parliament (Fridstrøm, 2018).
Mobilising private investments The Nordic countries public sector, by providing both economic and non-financial policy measures, aims to provide encouraging signals for the private sector to invest in the emerging EV market and with a view that public support will not be needed as the market matures. Clear government objectives, timelines and open communication on policy goals help the private sector to define its path, mobilise investment and innovate.
Moving from financial support to regulatory instruments
Public investment in supporting the uptake of electric mobility, e.g. – via tax breaks, cannot be sustained over the long term. They should be conceived as transitional measures helping to
3 The CO₂/km thresholds for differentiated tax rates were established in 2010 and have not been subsequently revised. 4 Estimates of foregone tax revenue on account of the 2017 VAT exemption (NOK 3.2 billion, USD 36 million), waivers from road tolls (NOK 700-800 million, USD 88-100 million), the exemption from the registration tax (NOK 700 million, USD 83 million) and other measures granted to electric cars are available in the Norwegian notification to the EFTA Surveillance Authority (Finansdepartementet Norge, 2017b) and in the reply of the authority on the matter of tax reductions on zero emission vehicles (EFTA Surveillance Authority, 2017a). 5 In its white paper on long-term economic perspectives, the Norway’s Ministry of Finance predicts that the annual revenue from vehicle and fuel taxes could fall from around NOK 50 billion (USD 6 billion) in 2017 to less than NOK 20 billion (USD 2.5 billion) by 2030 (assuming that the target for the market uptake of zero-emission vehicles in 2025 is reached, while the tax rates remain unchanged in real terms) (Finansdepartementet Norge, 2017a).

© OECD/IEA 2018 Nordic EV Outlook 2018 Insights from leaders in electric mobility
Page | 81
Page | 81
Page | 81
Page | 81
Page | 81
Page | 81
Page | 81
Page | 81
Page | 81
Page | 81
Page | 81
Page | 81
Page | 81
Page | 81
Page | 81
Page | 81
Page | 81
Page | 81
Page | 81
Page | 81
Page | 81
Page | 81
Page | 81
Page | 81
Page | 81
Page | 81
Page | 81
Page | 81
bridge the cost gap for electric vehicles while cost savings can be achieved through technology development, technology learning and increased scale.
To move beyond early market development, financial support should be complemented and progressively replaced by regulatory measures de-risking investment to scale up technologies, foster cost reductions and enable energy and emissions savings once the initial demand has been triggered. These instruments include progressively tightened fuel-economy regulations (as in the recent proposal of the European Commission for 2030 [EC, 2017a]), mandates for zero-emission vehicles and access restrictions for vehicles that do not meet performance-based environmental criteria.
Supporting and managing the transition to MaaS in cities
Today, the total cost of ownership per kilometre for a BEV is competitive with conventional cars if operated in fleets with intensive use, such as buses, taxis, ride-hailing services and shared cars. Public policies supporting and managing the transition of urban mobility to a greater reliance on a range of integrated services, including public transport and ride-hailing (as opposed to individual vehicle ownership), are also likely to encourage the adoption of electric mobility. Continuous progress on vehicle automation could be accelerating this transition by reducing the cost of MaaS.6
Long-term implications
Electric cars
In the long run, a higher stock share of electric cars will have an impact on fuel taxation revenues due to a shift from liquid fuels to electricity purchases, leading to significant reductions in government revenues from fuel taxation. Policy strategies for transiting to electric cars need to factor in the necessity to adapt the taxation regime for transportation.
When electric vehicles claim a major share of the car fleet, revenues collected from conventional fuel taxes will shrink. Maintaining governmental revenues currently derived from fuel taxes is likely to require an alternative mechanism for taxing transportation. Road pricing, consisting of charges applied on a vehicle-kilometre basis (ideally covering infrastructure costs and reflecting the marginal costs of travelling, including environmental externalities and time loss due to congestion) is the most prominent alternative. Examples of road pricing mechanisms range from congestion charges in urban areas and charges applied for the use of transport infrastructure (e.g. tolls), to network-wide road pricing (charging the total vehicle-kilometres travelled). The latter has been considered in the Netherlands since 2010 (Meurs et al. 2013), but has not yet been implemented. The IEA Energy Technology Perspectives 2017 report, suggests that the implementation of an average road-pricing rate of USD 0.08/km per car in the European countries would raise roughly equivalent revenues as from fuel taxes in 2016 (IEA, 2017b). Such distance-based rates may also be differentiated by type of vehicle driven and, as more advanced information and communication technologies develop, by location (e.g. distinguishing between high/low circulation density areas), time (peak/off-peak periods) and even made fully dynamic to reflect real-time driving conditions on all parts of the road network.
The relevance and opportunity to develop road pricing schemes at a lower or higher degree of complexity will need to be carefully anticipated by policy makers by fairly balancing the scope of the scheme, its implementation costs and time, public acceptance and privacy guarantees. 6 Automation is also likely to place an upward pressure on average mileages, favouring EVs over competing technologies because of their greater efficiency and lower operational costs.

Nordic EV Outlook 2018 © OECD/IEA 2018 Insights from leaders in electric mobility
Page | 82 Page | 82 Page | 82 Page | 82 Page | 82 Page | 82 Page | 82 Page | 82 Page | 82 Page | 82 Page | 82 Page | 82 Page | 82 Page | 82 Page | 82 Page | 82 Page | 82 Page | 82 Page | 82 Page | 82 Page | 82 Page | 82 Page | 82 Page | 82 Page | 82 Page | 82 Page | 82 Page | 82
Charging infrastructure
The increasing availability of publicly accessible chargers, largely dependent on initiatives receiving public support, is helping to reduce range limitation concerns for BEVs. However, in some instances, low utilisation rates pose an issue to the cost recovery potential of publicly accessible charging infrastructure.
As the share of electric cars grows and the market matures, the deployment of publicly accessible chargers will need to target high utilisation rates and close the gap with full cost recovery. Full cost recovery can be facilitated by the availability of additional revenue streams that can be effectively recovered, such as parking fees or the income derived from attracting customers to commercial facilities that offer EV charging. Business models that enable the installation, operation and maintenance of EVSE to make it viable without subsidies are essential to ensure that electrification can be economically sustainable in the long term.
Given the need to maintain the publicly accessible charging infrastructure across the whole road network, it is possible that targeted support for some EVSE installations will be needed for cases where full cost recovery conflicts with the need to ensure the provision of adequate charging options. Useful instruments could include regulatory requirements for CPOs, allowing for the cross-subsidisation from charging points with higher rates of utilisation, and/or the use of public service contracts, driven by public service obligations (already being employed in Norway).

© OECD/IEA 2018 Nordic EV Outlook 2018 Insights from leaders in electric mobility
Page | 83
Page | 83
Page | 83
Page | 83
Page | 83
Page | 83
Page | 83
Page | 83
Page | 83
Page | 83
Page | 83
Page | 83
Page | 83
Page | 83
Page | 83
Page | 83
Page | 83
Page | 83
Page | 83
Page | 83
Page | 83
Page | 83
Page | 83
Page | 83
Page | 83
Page | 83
Page | 83
Page | 83
Statistical annex This annex presents the electric car and EVSE time series data for the five Nordic countries covered in this report. These data are the basis for the analysis and graphs. The main data sources are submissions from the Nordic Electric Vehicle Outlook country partners, statistics and indicators available from the European Alternative Fuels Observatory (EAFO, 2017) and information provided by stakeholders (ACEA, 2017a and 2017b; EEA, 2017; Insero, 2017; OICA, 2017; and Autoalan tiedotuskeskus, 2017).
Electric car stock
Table A.1: Electric car stock (BEV and PHEV) by country, 2005-17
Table A.2: Battery electric car stock by country, 2005-17
Table A.3: Plug-in hybrid electric car stock by country, 2005-17
2005 2006 2007 2008 2009 2010 2011 2012 2013 2014 2015 2016 2017
Denmark 31 79 501 1 005 1 316 2 740 7 992 8 932 9 959
Finland 929 1 587 3 285 6 340
Iceland 12 12 12 12 12 14 14 40 143 366 918 2 073 5 098
Norway 12 255 400 796 2 634 7 148 15 672 35 439 69 165 114 053 176 310
Sweden 4 182 1 110 2 657 7 324 15 911 29 326 49 671
Total 12 12 24 267 443 893 3 331 9 303 19 788 46 798 95 573 157 670 247 379
2005 2006 2007 2008 2009 2010 2011 2012 2013 2014 2015 2016 2017
Denmark 31 59 481 974 1 279 2 616 7 509 8 267 8 747
Finland 169 360 614 844 1 346
Iceland 12 12 12 12 12 14 14 31 111 305 691 1 066 1 910
Norway 12 255 400 794 2 631 6 812 15 013 33 103 58 882 83 104 116 129
Sweden 4 182 448 880 2 119 5 081 8 032 12 391
Total 12 12 24 267 443 871 3 308 8 265 17 452 38 503 72 777 101 314 140 524
2005 2006 2007 2008 2009 2010 2011 2012 2013 2014 2015 2016 2017
Denmark 20 20 31 37 124 483 665 1 212
Finland 296 569 973 2 441 4 994
Iceland 9 32 61 227 1 007 3 188
Norway 2 3 336 659 2 336 10 283 30 949 60 181
Sweden 662 1 777 5 205 10 830 21 294 37 280
Total 22 23 1 038 2 801 8 295 22 796 56 356 106 855

Nordic EV Outlook 2018 © OECD/IEA 2018 Insights from leaders in electric mobility
Page | 84 Page | 84 Page | 84 Page | 84 Page | 84 Page | 84 Page | 84 Page | 84 Page | 84 Page | 84 Page | 84 Page | 84 Page | 84 Page | 84 Page | 84 Page | 84 Page | 84 Page | 84 Page | 84 Page | 84 Page | 84 Page | 84 Page | 84 Page | 84 Page | 84 Page | 84 Page | 84 Page | 84
New electric car sales
Table A.4: New electric car sales (BEV and PHEV) by country, 2005-17
2005 2006 2007 2008 2009 2010 2011 2012 2013 2014 2015 2016 2017
Denmark
31 48
497 501 1 592 4 471 1 867 1 240
Finland
30 179 218 440 685 1 430 3 055
Iceland
2
26 103 224 553 1 155 3 028
Norway
12 243 145 396 1 838 4 514 8 524 19 767 33 726 44 888 62 257
Sweden
4 178 928 1 547 4 667 8 587 13 415 20 345
Total
12 243 176 450 2 046 6 144 10 893 26 690 48 022 62 755 89 925
Table A.5: New battery electric car sales by country, 2005-17
2005 2006 2007 2008 2009 2010 2011 2012 2013 2014 2015 2016 2017
Denmark 31 28 422 486 495 1 508 4 239 1 218 693
Finland
30 51 50 183 243 223 502
Iceland 2 17 80 195 387 375 847
Norway
12 243 145 394 1 837 4 181 8 201 18 090 25 779 24 222 33 025
Sweden 4 178 266 432 1 239 2 962 2 951 4 359
Total 12 243 176 428 2 467 5 001 9 258 21 215 33 610 28 989 39 426
Table A.6: New plug-in hybrid electric car sales by country, 2005-17
2005 2006 2007 2008 2009 2010 2011 2012 2013 2014 2015 2016 2017
Denmark 20 11 6 84 232 649 547
Finland
128 168 257 442 1 207 2 553
Iceland 9 23 29 166 780 2 181
Norway
2 1 333 323 1 677 7 947 20 666 29 232
Sweden 662 1 115 3 428 5 625 10 464 15 986
Total 22 1 1 143 1 635 5 475 14 412 33 766 50 499

© OECD/IEA 2018 Nordic EV Outlook 2018 Insights from leaders in electric mobility
Page | 85
Page | 85
Page | 85
Page | 85
Page | 85
Page | 85
Page | 85
Page | 85
Page | 85
Page | 85
Page | 85
Page | 85
Page | 85
Page | 85
Page | 85
Page | 85
Page | 85
Page | 85
Page | 85
Page | 85
Page | 85
Page | 85
Page | 85
Page | 85
Page | 85
Page | 85
Page | 85
Page | 85
Market share of electric cars
Table A.7: Market share of electric cars (BEV and PHEV) by country, 2005-17 (%)
Table A.8: Market share of battery electric cars by country, 2005-17 (%)
Table A.9: Market share of plug-in hybrid electric cars by country, 2005-17 (%)
2005 2006 2007 2008 2009 2010 2011 2012 2013 2014 2015 2016 2017
Denmark 0.03 0.03 0.25 0.28 0.27 0.84 2.15 0.83 0.56
Finland 0.02 0.16 0.21 0.41 0.63 1.20 2.58
Iceland 0.06 0.31 1.28 2.14 3.65 5.56 11.71
Norway 0.22 0.15 0.31 1.33 3.27 6.00 13.71 22.38 29.03 39.24
Sweden 0.05 0.31 0.53 1.44 2.37 3.41 6.28
Total 0.04 0.03 0.06 0.32 0.84 1.50 3.45 5.69 6.88 10.59
2005 2006 2007 2008 2009 2010 2011 2012 2013 2014 2015 2016 2017
Denmark 0.03 0.02 0.25 0.28 0.27 0.80 2.04 0.54 0.31
Finland 0.02 0.05 0.05 0.17 0.22 0.19 0.42
Iceland 0.06 0.20 1.00 1.87 2.55 1.81 3.27
Norway 0.22 0.15 0.31 1.33 3.03 5.77 12.54 17.11 15.67 20.82
Sweden 0.05 0.09 0.15 0.38 0.82 0.75 1.34
Total 0.04 0.03 0.06 0.32 0.69 1.27 2.74 3.98 3.18 4.64
2005 2006 2007 2008 2009 2010 2011 2012 2013 2014 2015 2016 2017
Denmark 0.01 0.04 0.11 0.29 0.25
Finland 0.12 0.16 0.24 0.41 1.01 2.15
Iceland 0.11 0.29 0.28 1.09 3.76 8.43
Norway 0.24 0.23 1.16 5.27 13.37 18.43
Sweden 0.22 0.38 1.06 1.55 2.66 4.93
Total 0.16 0.22 0.71 1.71 3.70 5.95

Nordic EV Outlook 2018 © OECD/IEA 2018 Insights from leaders in electric mobility
Page | 86 Page | 86 Page | 86 Page | 86 Page | 86 Page | 86 Page | 86 Page | 86 Page | 86 Page | 86 Page | 86 Page | 86 Page | 86 Page | 86 Page | 86 Page | 86 Page | 86 Page | 86 Page | 86 Page | 86 Page | 86 Page | 86 Page | 86 Page | 86 Page | 86 Page | 86 Page | 86 Page | 86
EVSE stock
Table A.10: Publicly accessible EVSE stock (slow and fast) by country, 2005-17
Note: Denmark and Finland only include deployment numbers until 30 September 2017.
Table A.11: Publicly accessible slow EVSE stock by country, 2005-17
Table A.12: Publicly accessible fast EVSE stock by country, 2005-17
2005 2006 2007 2008 2009 2010 2011 2012 2013 2014 2015 2016 2017
Denmark 452 552 931 1 618 1 831 1 996
Finland 250 380 606 797 867
Iceland 8 18 62 114
Norway 2 801 3 123 3 746 4 655 5 434 6 858 8 285 9 246
Sweden 505 1 020 1 165 1 520 2 162 4 071
Total 2 801 3 123 4 703 6 477 7 918 10 620 13 137 16 294
2005 2006 2007 2008 2009 2010 2011 2012 2013 2014 2015 2016 2017
Denmark 449 496 813 1 345 1 539 1 655
Finland 250 357 491 647 706
Iceland 2 12 52 87
Norway 2 800 3 105 3 688 4 511 5 185 6 160 7 233 8 049
Sweden 500 1 000 1 065 1 251 1 737 3 456
Total 2 800 3 105 4 637 6 257 7 422 9 259 11 208 13 953
2005 2006 2007 2008 2009 2010 2011 2012 2013 2014 2015 2016 2017
Denmark 3 56 118 273 292 341
Finland 23 115 150 161
Iceland 6 6 10 27
Norway 1 18 58 144 249 698 1 052 1 197
Sweden 5 20 100 269 425 615
Total 1 18 66 220 496 1 361 1 929 2 341

© OECD/IEA 2018 Nordic EV Outlook 2018 Insights from leaders in electric mobility
Page | 87
Page | 87
Page | 87
Page | 87
Page | 87
Page | 87
Page | 87
Page | 87
Page | 87
Page | 87
Page | 87
Page | 87
Page | 87
Page | 87
Page | 87
Page | 87
Page | 87
Page | 87
Page | 87
Page | 87
Page | 87
Page | 87
Page | 87
Page | 87
Page | 87
Page | 87
Page | 87
Page | 87
References ABB (2017a), “ABB boosts Iceland’s electric vehicle infrastructure with 15 new fast chargers”,
www.abb.com/cawp/seitp202/48DF6D8E0BAA35AAC12581CD00327716.aspx.
– (2017b), “ABB launches new high-power 150-350 kW electric chargers”, https://electrek.co/2017/10/03/abb-high-power-150-350-kw-electric-car-chargers/.
– (2016), “Lidl satsar på ABB:s snabbladdare” [Lidl is investing in ABB's quick chargers], http://new.abb.com/se/om-abb/aktuell-lasning/lidl-satsar-pa-abbs-snabbladdare-abb.
– (2015), “ABB delivering to world’s largest fast charging park”, www.abb.com/cawp/seitp202/08b743ed5421d7a9c1257df6005d439f.aspx.
ACEA (European Automobile Manufacturers Association) (2017a), “Alternative fuel vehicle registrations”, www.acea.be/statistics/tag/category/electric-and-alternative-vehicle-registrations, (accessed 11 December 2017).
– (2017b), “Consolidated registration figures”, www.acea.be/statistics/tag/category/consolidated-figures, (accessed 20 November 2017).
– (2017c), “Tax guide 2017”, www.acea.be/publications/article/acea-tax-guide.
– (2017d), “Overview of tax incentives for electric vehicles in the EU”, www.acea.be/publications/article/overview-of-incentives-for-buying-electric-vehicles, (accessed 8 November 2017).
– (2015), “Tax guide 2015”, www.acea.be/uploads/news_documents/ACEA_TAX_GUIDE_2015.pdf, (accessed 8 November 2017).
Autoalan tiedotuskeskus (2017), “Long-term Statistics”, www.aut.fi/en/statistics/long-term_statistics, (accessed 7 November 2017).
Autoblog (2017), “BMW, Daimler, Ford, VW plan Ionity EV charging network across Europe”, www.autoblog.com/2017/11/03/ionity-ev-charging-network-europe-bmw-daimler-ford-vw/.
Avinor AS, Norwegian National Rail Administration (Jerbaneverket), Norwegian Coastal Administration (Kystverket) and the Norwegian Public Roads Administration (Statens Vegvesen ), (2016), "National Transport Plan 2018-2029", www.ntp.dep.no/English/_attachment/1525049/binary/1132766?_ts=1571e02a3c0.
Bilastaedasjodur (2017), “Visthæfar skífur” [Editable parking disks], www.bilastaedasjodur.is/gjaldskylda/visthaefar-skifur, (accessed 13 December 2017).
BilSweden (2017), “Incentives for green cars”, www.bilsweden.se/miljo-sakerhet/miljobilar/stimulanser-for-miljobilar#, (accessed 5 December 2017).
Bjergbakke, L. (Danish Ministry for Energy, Utilities and Climate) (2018), personal communications in period November 2017 to January 2018.
BKK (Bergenshalvøens Kommunale Kraftselskap) (2017), “ABB delivering to world’s largest fast charging park”, www.abb.com/cawp/seitp202/08b743ed5421d7a9c1257df6005d439f.aspx.
BMW (2017), “FastCharge" research project evaluates fast-charging technologies at the boundaries of what is technically feasible”, BMWi Corporate Communications, Munich; https://www.press.bmwgroup.com/global/article/detail/T0276823EN/fastcharge-research-project-evaluates-fast-charging-technologies-at-the-boundaries-of-what-is-technically-feasible, (accessed 16 February 2017).

Nordic EV Outlook 2018 © OECD/IEA 2018 Insights from leaders in electric mobility
Page | 88 Page | 88 Page | 88 Page | 88 Page | 88 Page | 88 Page | 88 Page | 88 Page | 88 Page | 88 Page | 88 Page | 88 Page | 88 Page | 88 Page | 88 Page | 88 Page | 88 Page | 88 Page | 88 Page | 88 Page | 88 Page | 88 Page | 88 Page | 88 Page | 88 Page | 88 Page | 88 Page | 88
BNEF (Bloomberg New Energy Finance) (2017), Electric Vehicle Data Hub, BNEF, London.
City of Reykjavik (2016), “City of Reykjavik’s Climate Policy”, http://reykjavik.is/sites/default/files/reykjavik_action_plan_carbon_neutral_by_2040_2.pdf.
City of Stockholm (2018), “Laddgator i Stockholm” [Charging stations in Stockholm], www.stockholm.se/laddgator, (accessed January 26 2018).
– (2016), “Experiences from setting up public charging facilities for electric vehicles in Stockholm”, Stockholm: City of Stockholm.
– (2015), “På väg mot fler elbilar i Sverig” [On the road to more electric cars in Sweden], City of Stockholm, www.elbilsupphandling.se/wp-content/uploads/Elbilsupphandling-slutrapport-mars-2015-6-mb.pdf.
CleanCharge (2017), personal communication, Claus Bildsøe Astrup, 8 December 2017.
CLEVER (2017a), “Laddkort” [Charging map], https://clever.nu/laddkort/, (accessed 6 December 2017).
– (2017b), “Køb ladekort” [Charging tariffs], https://clever.dk/opladning-hjemme-og-paa-farten/koeb-ladekort, (accessed December 1 2017).
Council of the European Union (2017), “Energy efficient buildings – Presidency secures provisional deal with European Parliament”, www.consilium.europa.eu/en/press/press-releases/2017/12/19/energy-efficient-buildings-presidency-secures-provisional-deal-with-european-parliament/, (accessed 17 January 2018).
Danish Ecological Council (2015), “Fact Sheet: The Danish motor vehicle taxes”, Danish Ecological Council, www.ecocouncil.dk/documents/andet/1733-150417-motor-vehicle-taxation.
Daiber, T. and Hofmann, J. (2017), personal communication, Hubject (Germany), 31 November 2017.
Danish Energy Agency (2017a), “Danish climate policies”, https://ens.dk/en/our-responsibilities/energy-climate-politics/danish-climate-policies, (accessed 31 October 2017).
– (2017b), “Documentation of Interact”, https://ens.dk/en/our-services/projections-and-models/models/documentation-interact, (accessed 11 November 2017).
Danish EV Alliance (2017), “Statistik”, www.danskelbilalliance.dk/Statistik.aspx, (accessed 4 December 2017).
DieselNet (2017), "Emissions Standards – Sweden: Environmental Zones Program", www.dieselnet.com/standards/se/zones.php, (accessed 25 October 2017).
DriveNow (2017), “DriveNow in Copenhagen”, www.drive-now.com/dk/en/copenhagen, (accessed 15 November 2017).
EAFO (European Alternative Fuel Observatory) (2017), “Countries (Denmark, Finland, Iceland, Norway, Sweden”, www.eafo.eu/countries, (accessed 20 November 2017).
– (2018), “e-bus city overview”, www.eafo.eu/vehicle-statistics/buses/cities, (accessed 15 January 2018).
EC (European Commission) (2017a), “Proposal for a Regulation of the European Parliament and of the Council setting emission performance standards for new passenger cars and for new light commercial vehicles as part of the Union's integrated approach to reduce CO2 emissions from light-duty vehicles and amending Regulation (EC) No 715/2007 (recast)”, https://ec.europa.eu/info/law/better-regulation/initiatives/com-2017-676_en.

© OECD/IEA 2018 Nordic EV Outlook 2018 Insights from leaders in electric mobility
Page | 89
Page | 89
Page | 89
Page | 89
Page | 89
Page | 89
Page | 89
Page | 89
Page | 89
Page | 89
Page | 89
Page | 89
Page | 89
Page | 89
Page | 89
Page | 89
Page | 89
Page | 89
Page | 89
Page | 89
Page | 89
Page | 89
Page | 89
Page | 89
Page | 89
Page | 89
Page | 89
Page | 89
– (2017b), “Communication from the Commission to the European Parliament, the Council, the European Economic and Social Committee, and the Committee of the Regions towards the broadest use of alternative fuels - an Action Plan on Alternative Fuels Infrastructure under Article 10(6) of Directive 2014/94/EU, including the assessment of national policy frameworks under Article 10(2) of Directive 2014/94/EU, COM(2017) 652 final }”, http://eur-lex.europa.eu/legal-content/EN/TXT/PDF/?uri=CELEX:52017DC0652&from=EN.
– (2017c), “Commission Staff Working Document: Detailed Assessment of the National Policy Frameworks Accompanying the document Communication from the Commission to the European Parliament, the Council, the European Economic and Social Committee and the Committee of the Regions towards the broadest use of alternative fuels - an Action Plan on Alternative Fuels Infrastructure under Article 10(6) of Directive 2014/94/EU, including the assessment of national policy frameworks under Article 10(2) of Directive 2014/94/EU {SWD(2017) 365 final}”, Part 3/3, Brussels, European Commission, http://eur-lex.europa.eu/resource.html?uri=cellar:d80ea8e8-c559-11e7-9b01-01aa75ed71a1.0001.02/DOC_1&format=PDF.
– (2017d), "2030 Climate and Energy Framework", https://ec.europa.eu/clima/policies/strategies/2030_en.
– (2017e), “Proposal for a COUNCIL DECISION on the position to be adopted, on behalf of the European Union, within the EEA Joint Committee concerning an amendment to Annex XIII (Transport) to the EEA Agreement”, Brussels, European Commission, http://eur-lex.europa.eu/legal-content/EN/TXT/PDF/?uri=CELEX:52017PC0711&from=EN.
– (2016a), “REPORT FROM THE COMMISSION TO THE EUROPEAN PARLIAMENT, THE COUNCIL, THE EUROPEAN ECONOMIC AND SOCIAL COMMITTEE AND THE COMMITTEE OF THE REGIONS Energy prices and costs in Europe {COM(2016) 769 final}”, Brussels, European Commission.
– (2016b), "ULTRA-E, 2015-EU-TM-0367-S, Baltic-Adriatic, North Sea-Baltic, North Sea-Mediterranean, Rhine-Alpine, Rhine-Danube and Scandinavian-Mediterranean corridors", https://ec.europa.eu/inea/en/connecting-europe-facility/cef-transport/projects-by-country/multi-country/2015-eu-tm-0367-s, (accessed 16 February 2017).
– (2015a), “European Long-distance Electric Clean Transport Road Infrastructure Corridor (ELECTRIC)”, https://ec.europa.eu/inea/sites/inea/files/fichenew_2013-eu-92043-s_final.pdf, (accessed 18 October 2017).
– (2015b), “Greening NEAR - Greening Northern European Road Corridors”, https://ec.europa.eu/inea/sites/inea/files/fichenew_2013-dk-92032-s_final.pdf, (accessed 18 October 2017).
– (2015c), “Greening European Transportation Infrastructure for Electric Vehicle”, https://ec.europa.eu/inea/sites/inea/files/download/project_fiches/multi_country/fichenew_2010eu91117p_final_1.pdf, (accessed 18 October 2017).
– (2015d), “GREAT (Green Region for Electrification and Alternatives fuels for Transport)”, https://ec.europa.eu/inea/sites/inea/files/fiche_2014-eu-tm_-0477-s_final.pdf, (accessed 12 December 2017).
– (2015e), “Multimodal e-mobility connectivity for the öresund Region (MECOR)”, https://ec.europa.eu/inea/sites/inea/files/fiche_2014-eu-tm-0213-m_final.pdf, (accessed 12 December 2017).
– (2014a), “Regulation (EU) No 333/2014 of the European Parliament and the Council of 11 March 2014 amending Regulation (EC) No 443/2009 to define the modalities for reaching

Nordic EV Outlook 2018 © OECD/IEA 2018 Insights from leaders in electric mobility
Page | 90 Page | 90 Page | 90 Page | 90 Page | 90 Page | 90 Page | 90 Page | 90 Page | 90 Page | 90 Page | 90 Page | 90 Page | 90 Page | 90 Page | 90 Page | 90 Page | 90 Page | 90 Page | 90 Page | 90 Page | 90 Page | 90 Page | 90 Page | 90 Page | 90 Page | 90 Page | 90 Page | 90
the 2020 target to reduce CO2 emissions from new passenger cars”, http://eur-lex.europa.eu/legal-content/EN/TXT/?uri=uriserv:OJ.L_.2014.103.01.0015.01.ENG.
– (2014b), “Regulation (EU) No 253/2014 of the European Parliament and the Council of 26 February 2014 amending Regulation (EU) No 510/2011 to define the modalities for reaching the 2020 target to reduce CO2 emissions from new light commercial vehicles, Text with EEA relevance”, http://eur-lex.europa.eu/legal-content/EN/TXT/?uri=uriserv:OJ.L_.2014.084.01.0038.01.ENG.
– (2014c), “Directive 2014/94/EU of the European Parliament and the Council of 22 October 2014 on the deployment of alternative fuels infrastructure”, http://eur-lex.europa.eu/legal-content/EN/TXT/PDF/?uri=CELEX:32014L0094&from=EN.
– (2011), "Energy Roadmap 2050", COM(2011) 885 final, http://eur-lex.europa.eu/legal-content/EN/TXT/PDF/?uri=CELEX:52011DC0885&from=EN.
EEA (European Environment Agency) (2017), “Monitoring of CO2 emissions from passenger cars - Regulation 443/2009”, www.eea.europa.eu/data-and-maps/data/co2-cars-emission-12.
European Free Trade Association (EFTA) Surveillance Authority (2017a), ”Tax reductions on zero emission vehicles – Decision No 228/17/COL ”, www.eftasurv.int/da/DocumentDirectAction/outputDocument?docId=4073.
– (2017b), “State aid guidelines”, www.eftasurv.int/state-aid/legal-framework/state-aid-guidelines/, (accessed 17 January 2018).
– (2015), "EFTA SURVEILLANCE AUTHORITY DECISION of 21 April 2015 on the State aid measures in favour of electric vehicles", www.eftasurv.int/media/press-releases/College-Decision---electric-cars-.pdf.
ELaad NL (2016), “EV related protocol study”, www.elaad.nl/research/ev-related-protocol-study/.
Eltis (2017), “Stockholm: implementing a public electric vehicle charging network (Sweden)”, www.eltis.org/discover/case-studies/stockholm-implementing-public-electric-vehicle-charging-network-sweden.
Emobility Sweden (2017), “Vad kostar laddstationer?” [How much do charging stations cost?], http://emobility.se/startsida/laddstationsguiden/upphandling/vad-kostar-laddstationer/, (accessed 24 November 2017).
Endesa (2017), “Qué potencia eléctrica necesita mi casa?” [What is the electrical potential of my home?], www.endesaclientes.com/blog/que-potencia-necesita-mi-casa.
Energi-sverige.se (2017), “Denmark and Finland phase out coal by 2030”, www.energi-sverige.se/vaara-nyheter/nyheter/marknadsnyheter-2017/11/denmark-and-finland-phase-out-coal-by-2030.
Enova SF (2017), “Utlysningstekst for ladeinfrastruktur - 2.runde” [Outline text for charging infrastructure - 2nd round], www.enova.no/bedrift/landtransport/stotte-til-infrastruktur/hurtiglading/arkiv/dokumenter-fra-2utlysningsrunde/utlysningstekst-for-ladeinfrastruktur---2runde/, (accessed 18 January 2018).
– (2017b), “Infrastruktur i kommunale og fylkeskommunale transporttjenester” [Infrastructure in municipal and county municipal transport services], www.enova.no/bedrift/landtransport/stotte-til-infrastruktur/infrastruktur-i-kommunale-og-fylkeskommunale-transporttjenester/, (accessed 18 January 2018).
© OECD/IEA 2018 Nordic EV Outlook 2018 Insights from leaders in electric mobility
Page | 91
Page | 91
Page | 91
Page | 91
Page | 91
Page | 91
Page | 91
Page | 91
Page | 91
Page | 91
Page | 91
Page | 91
Page | 91
Page | 91
Page | 91
Page | 91
Page | 91
Page | 91
Page | 91
Page | 91
Page | 91
Page | 91
Page | 91
Page | 91
Page | 91
Page | 91
Page | 91
Page | 91
E.ON (2017a), “E.ON and Clever co-operate on ultra-fast charging e-Mobility”, www.eon.com/en/about-us/media/press-release/2017/eon-and-clever-co-operate-on-ultra-fast-charging-e-mobility.html, (accessed 18 November 2017).
– (2017b), “Betala lättast med E.ON laddkort” (Costs for E.ON charging), www.eon.se/privat/for-bilen/koera-pa-el/betalsaett-och-priser.html, accessed 5 December 2017.
(2017c), “ICA-kunders elbilar laddas genom nytt samarbete med E.ON” (ICA customers electric cars are charged through new cooperation with E.ON), www.eon.se/nyheter/ica-kunders-elbilar-laddas-genom-nytt-samarbete-med-e-on.html, (accessed 13 November 2017).
European Union (2014), “Directive 2014/94/EU of the European Parliament and the Council of 22 October 2014 on the deployment of alternative fuels infrastructure”, European Parliament and the Council of the European Union, Brussels.
Eurostat (2017), “Eurostat database, Energy statistics – prices of natural gas and electricity”, version 22/11/2017, http://ec.europa.eu/eurostat/data/database, (accessed 5 December 2017).
EVI (Electric Vehicles Initiative) (2017), "CEM-EVI EV30@30 Campaign", OECD/IEA, www.iea.org/media/topics/transport/3030CampaignDocumentFinal.pdf.
– (2016), “Government Fleet Ddeclaration”, OECD/IEA, www.iea.org/media/topics/transport/EVI_Government_Fleet_Declaration.pdf.
Figenbaum E. and M. Kolbenstvedt (2016), “Learning from Norwegian Battery Electric and Plug-in Hybrid Vehicle Users: Results from a survey of vehicle owners”, TØI Report 1492, Institute of Transport Economics, Oslo.
– (2015), Pathways to Electromobility: Perspectives based on Norwegian Experiences, TØI Report 1420, Institute of Transport Economics, Oslo.
Figenbaum, E., Kolbenstvedt, M. and Elvebakk B. (2014), Electric Vehicles: Environmental, economic and practical aspects, TØI Report 1329, Institute of Transport Economics, Oslo.
Figenbaum, E. (2018), personal communication, Transport Institute of Norway, 3 January 2018.
Figenbaum, E. (2017), “Perspectives on Norway’s supercharged electric vehicle policy”, Environmental Innovation and Societal Transitions, V. 25: 14-34, http://dx.doi.org/10.1016/j.eist.2016.11.002.
–Finlex (Finland's Ministry of Justice) (2017), “Klimatlag” [Climate Change], www.finlex.fi/sv/laki/ajantasa/2015/20150609?search%5Btype%5D=pika&search%5Bpika%5D=klimatlag.
Finansdepartementet Norge (Ministry of Finance Norway) (2017a), “Meld. St. 29 (2016-2017) Perspektivmeldingen 2017” (Perspective messages), www.regjeringen.no/no/dokumenter/meld.-st.-29-20162017/id2546674/.
– (2017b). “Notification of tax measures for electric vehicles (06.11.2017)”, www.regjeringen.no/contentassets/7b86180aaa8c4980ac60700c5ded97cd/notifikasjon.pdf.
Finnish Ministry of Economic Affairs and Employment (2018), “Transport sector growth programme”, http://tem.fi/julkaisu?pubid=URN:ISBN:978-952-327-288-0, (accessed 18 January 2018).
Flader, L. (2017), personal communication, Dansk Elbil Alliance, 2 November 2017.
http://www.finlex.fi/sv/laki/ajantasa/2015/20150609?search%5Btype%5D=pika&search%5Bpika%5D=klimatlag

Nordic EV Outlook 2018 © OECD/IEA 2018 Insights from leaders in electric mobility
Page | 92 Page | 92 Page | 92 Page | 92 Page | 92 Page | 92 Page | 92 Page | 92 Page | 92 Page | 92 Page | 92 Page | 92 Page | 92 Page | 92 Page | 92 Page | 92 Page | 92 Page | 92 Page | 92 Page | 92 Page | 92 Page | 92 Page | 92 Page | 92 Page | 92 Page | 92 Page | 92 Page | 92
Fortum (2017a), “Hita laddstolpar” [Find charging points], www.fortum.com/countries/se/privat/charge-drive/hitta-laddstolpar/pages/default.aspx, (accessed 6 December 2017).
– (2017b), “Elbil-lading – Vare priser” [EV charging – product prices], www.fortum.no/privat/chargedrive/priser-for-lading-av-elbil/, (accessed 6 December 2017).
– (2017c), “Charge & Drive”, https://map.chargedrive.com/, (accessed 5 December 2017).
– (2016), “Nordic Power Market”, http://apps.fortum.fi/corporaterelations/Nordic_power_market_12_2016.pdf.
Friðleifsson, S. (2017), personal communication, Icelandic Energy Agency, 6 November 2017.
Fridstrøm, L. (Institute of Transport Economics TØI) (2018), personal communications in period November 2017 to January 2018.
– (2017a) “From innovation to penetration: calculating the energy transition time lag for motor vehicles”, Energy Policy, V. 108, 487-502.
– (2017b), “Satelittbasert veiprising må utredes” [Satellite-based road pricing must be investigated], Oslo, Open seminar on generalized road pricing (19 October 19 2017).
Government of Denmark (2017), “Aftale mellem regeringen (V, LA, K), Socialdemokratiet og Radikale Venstre om justering af aftalen om de fremtidige afgiftsvilkår for elbiler og brændselscellebiler af 9. oktober 2015 (nye lempelser for elbiler)” [Agreement between the Government (V, LA, K), Social Democracy and Radical Left on the adjustment of the agreement on future tax conditions for electric cars and fuel cell cars of 9 October 2015 (new easing for electric cars)], www.regeringen.dk/media/3286/aftale-om-elbiler.pdf.
Government of Finland (2017a), “Alternative transport fuels infrastructure Finland’s National Plan”, Ministry of Transport and Communications, Helsinki.
– (2017b), “LIITE Energiakärkihankkeet – I Kierros” [Energy Projects – Round I], https://tem.fi/documents/1410877/2132296/Energiak%C3%A4rkihankkeet-2017-liite/3b3c3aeb-3f9d-4479-8d6e-2efc31a60cfb?version=1.0.
Government of Norway (2017a), “Avgiftssatser 2017” [Tax rates], www.regjeringen.no/no/tema/okonomi-og-budsjett/skatter-og-avgifter/avgiftssatser-2017/id2514838/, (accessed 15 December 2017).
– (2017b), “Notification of tax measures for electric vehicles”, www.regjeringen.no/contentassets/7b86180aaa8c4980ac60700c5ded97cd/notifikasjon.pdf.
Government of Sweden (2017a), “The Climate Policy Framework”, www.government.se/articles/2017/06/the-climate-policy-framework/, (accessed 13 December 2017).
– (2017b), "Bonus-Malus and Alternative Fuel Vehicles", www.regeringen.se/artiklar/2017/09/bonus-malus-och-branslebytet/.
– (2017c), “Regulation (2017: 1318) on contributions to private individuals for installation of charging points to electric vehicles”, www.riksdagen.se/sv/dokument-lagar/dokument/svensk-forfattningssamling/forordning-20171318-om-bidrag-till_sfs-2017-1318, (accessed 18 January 2017).
Granström et al. (2017), “Användarnas beteende och syn på laddbara bilar” (User behaviour and view of rechargeable cars), TRUM-Rapport 2017:01, www.trum.umu.se/digitalAssets/197/197609_self2017.pdf.

© OECD/IEA 2018 Nordic EV Outlook 2018 Insights from leaders in electric mobility
Page | 93
Page | 93
Page | 93
Page | 93
Page | 93
Page | 93
Page | 93
Page | 93
Page | 93
Page | 93
Page | 93
Page | 93
Page | 93
Page | 93
Page | 93
Page | 93
Page | 93
Page | 93
Page | 93
Page | 93
Page | 93
Page | 93
Page | 93
Page | 93
Page | 93
Page | 93
Page | 93
Page | 93
GreenMobility (2017), “Pricing”, https://greenmobility.com/en/pricing/, (accessed 15 December 2017).
Grønn Kontakt (2017), “Ofte stilte sporsmal” (Frequently asked questions), https://gronnkontakt.no/ofte-stilte-sporsmal/, accessed 5 December 2017.
Göteborg Energi (2015), “Nya laddningsmöjligheter för elbilar i Göteborg” [New charging possibilities for electric cars in Gothenburg], www.goteborgenergi.se/Om_oss/Pressrum/Nyheter?DisplayNewsItem=26590079.
Hagman et al. (2016), “Total cost of ownership and its potential implications for battery electric vehicle diffusion”, Energy Policy, V.11-17.
Hansen, P. (2017), personal communication, Dansk Energi, 31 October 2017.
Haugneland, P., Bu, C. and Hauge, E. (2016), “The Norwegian EV success continues”, EVS29 Symposium, Montreal, 19 – 22 June, 2016.
Haugneland, P., Lorentzen, E., Bu, C., Hauge, E. (2017), “Put a price on carbon to fund EV incentives – Norwegian EV policy success”, EVS30 Symposium, Stuttgart, Germany, 9-11 October 2017.
Helen (2017), “Julkisen latauksen hinnat” [Public charge rates], Helen LTD, www.helen.fi/sahko/taloyhtiot/sahkoautojen-lataus/latauspisteiden-hinnat/.
Hovland, J. (2017), personal communication, Hafslund AS, 23 October 2017.
Hoy, K. and Weken, H. (2017), “I-CVUE final results”, 5th E-Mobility Stakeholder Forum, Brussels, http://icvue.eu/webtools.
HSL (The Helsinki Regional Transport Authority) (2017), “Helsinki’s first fully electric bus to hit the road in January”, www.hsl.fi/en/news/2017/helsinkis-first-fully-electric-bus-hit-road-january-9590.
HSL (Helsingin seudun liikenne) (2015), “Vuosikertomus” [Annual Report], www.hsl.fi/sites/default/files/hsl_vuosikertomus_fi_2015_aukeamat_1.pdf.
Hug, V. (2015), “Business Case for EV Charging on the Motorway Network in Denmark”, Electric Vehicle Business Models, Springer, pp.67-87.
ICA (Inköpscentralernas aktiebolag) Group (2017), “More efficient transport reduces emissions” www.icagruppen.se/en/sustainability/sustainability-work/greener-transport/, accessed 13 December 2017.
ICCT (International Council on Clean Transportation) (2017), “Electric vehicle capitals of the world: What markets are leading the transition to electric?” ICCT, Washington DC.
– (2016), “Comparison of leading electric vehicle policy and deployment in Europe”, ICCT, Berlin.
Icelandic Ministry for the Environment (2007), “Iceland’s Climate Change Strategy”, https://sustainabledevelopment.un.org/partnership/?p=2161.
Icelandic Transport Authority (2017), “Statistics”, www.icetra.is/, (accessed 19 December 2017).
IEA (International Energy Agency) (2017a), “Global EV Outlook 2017: Two million and counting”, www.iea.org/publications/freepublications/publication/GlobalEVOutlook2017.pdf.
– (2017b), Energy Technology Perspectives 2017: Catalysing Energy Technology Transformations, www.iea.org/etp/etp2017/.
– (2017c), “End-use energy prices and taxes”, IEA Statistics, (accessed 22 November 2017).

Nordic EV Outlook 2018 © OECD/IEA 2018 Insights from leaders in electric mobility
Page | 94 Page | 94 Page | 94 Page | 94 Page | 94 Page | 94 Page | 94 Page | 94 Page | 94 Page | 94 Page | 94 Page | 94 Page | 94 Page | 94 Page | 94 Page | 94 Page | 94 Page | 94 Page | 94 Page | 94 Page | 94 Page | 94 Page | 94 Page | 94 Page | 94 Page | 94 Page | 94 Page | 94
– (2017d), “World Energy Balances”, IEA Statistics, (accessed 21 December 2017).
– (2017e), “CO2 Emissions per kWh”, IEA Statistics, (accessed 21 December 2017).
– (2016a), Nordic Energy Technology Perspectives 2016, www.nordicenergy.org/wp-content/uploads/2016/04/Nordic-Energy-Technology-Perspectives-2016.pdf.
– (2016b), "Global EV Outlook 2016: beyond one million electric cars", OECD/IEA, www.iea.org/publications/freepublications/publication/Global_EV_Outlook_2016.pdf.
– (2013), Nordic Energy Technology Perspectives, www.iea.org/publications/freepublications/publication/NETP.pdf.
IEA HEV TCP (IEA Technology Collaboration Programme on Hybrid and Electric Vehicles) (2017), “Hybrid and Electric Vehicles: The Electric Drive Chauffeurs”, www.ieahev.org/news/annual-reports/ .
IEC (International Electrotechnical Commission) (2016), “Plugs, socket-outlets, vehicle connectors and vehicle inlets – Conductive charging of electric vehicles – Part 2: Dimensional compatibility and interchangeability requirements for a.c. pin and contact-tube accessories”, IEC 62196-2:2016, https://webstore.iec.ch/publication/24204.
– (2014a), “Plugs, socket-outlets, vehicle connectors and vehicle inlets - Conductive charging of electric vehicles - Part 1: General requirements”, IEC 62196-1:2014, https://webstore.iec.ch/publication/6582.
– (2014b), “Plugs, socket-outlets, vehicle connectors and vehicle inlets - Conductive charging of electric vehicles - Part 3: Dimensional compatibility and interchangeability requirements for d.c. and a.c./d.c. pin and contact-tube vehicle couplers”, IEC 62196-3:2014, https://webstore.iec.ch/publication/6584.
Ihle, J. H. (2017), personal communication, Ionity (Germany) and Fortum (Finland), 15 November 2017.
IHS (Information Handling Services) Polk (2016), “Vehicle registrations and other characteristics at model level (database)”, IHS Markit.
Insero (2018), personal communications with J. Høj, M. Andersen and N. Frees in period November 2017 to January 2018.
– (2017), “Insero Quarterly, Q4, 2017”, https://insero.com/media/4366/iq-2017-q2-final.pdf.
INVADE (2017), “The INVADE project”, http://h2020invade.eu/the-project/, (accessed 21 December 2017).
Ionity (2017), “Fast charging station network starts to take shape: Site partners for 18 European countries secured”, Ionity, Munich.
JRC (Joint Research Center) (2017), “Smart electricity systems and interoperability”, http://ses.jrc.ec.europa.eu/smart-metering-deployment-european-union, (accessed 22 November 2017).
Kipping, A. and Trømborg E. (2016), “Modelling and disaggregating hourly electricity consumption in Norwegian dwellings based on smart meter data”, Energy and Buildings, V. 118, www.sciencedirect.com/science/article/pii/S0378778816301001.
Klingenberg, M. (2017), “Nettet overbelastes, lamper blinker og sikringer ryker: Elbilen pekes ut som syndebukk” [The network is overloaded, lights are flashing and fuses are raising: the electric car is pointed out as a scapegoat], Teknisk Ukeblad, 4 October 2017,
© OECD/IEA 2018 Nordic EV Outlook 2018 Insights from leaders in electric mobility
Page | 95
Page | 95
Page | 95
Page | 95
Page | 95
Page | 95
Page | 95
Page | 95
Page | 95
Page | 95
Page | 95
Page | 95
Page | 95
Page | 95
Page | 95
Page | 95
Page | 95
Page | 95
Page | 95
Page | 95
Page | 95
Page | 95
Page | 95
Page | 95
Page | 95
Page | 95
Page | 95
Page | 95
www.tu.no/artikler/nettet-overbelastes-lamper-blinker-og-sikringer-ryker-elbilen-pekes-ut-som-syndebukk/408789.
Korkiakoski, M. (2017), personal communication, Tekes (Finland), 3 November 2017.
LetsGo (2017), “Membership and prices”, https://letsgo.dk/en/membership-and-prices/.
Lindtoft, C. (2017), “Frank Jensen will ban new diesel cars in Copenhagen from 2019”, Politiken, https://politiken.dk/indland/art6151778/Frank-Jensen-vil-forbyde-nye-dieselbiler-i-K%C3%B8benhavn-fra-2019.
Lorentzen, E. et al. (2017), “Charging infrastructure experiences in Norway – the worlds most advanced EV market”, EVS30 Symposium, Stuttgart, Germany, https://wpstatic.idium.no/elbil.no/2016/08/EVS30-Charging-infrastrucure-experiences-in-Norway-paper.pdf.
Lyse (2017), “Nåa er det enklere åa lade elbilen” [Now it’s easier to leave the electric car], www.lyse.no/bil/elbil/, accessed 5 December 2017.
LVW (Finnish Ministry of Transport and Communications) (2017), “Public Transport in the Act on Transport Services”, Factsheet 58/2017, www.lvm.fi/documents/20181/937315/Factsheet+58-2017+Public+transport+in+the+Act+on+Transport+Services.pdf/672409b0-d98a-4d7d-8a57-96a33eb72ec3.
Mercedes Benz (2017), “E-Klasse sedan - Plug-in hybrid”, www.mercedes-benz.no/content/norway/mpc/mpc_norway_website/no/home_mpc/passengercars/home/new_cars/models/e-class/w213/facts/drivetrain/alternativetransmission.html, (accessed 13 December 2017).
Meurs, H., Haaijer, R. and Geurs, K. (2013), “Modelling the effects of environmentally differentiated distance-based car-use charges in the Netherlands”, Transportation Research Part D, V.22, 1-9.
Miljö- och energidepartementet (Ministry of the Environment and Energy Sweden) (2016), “Regulation (2016: 836) on electric bus premium”, www.riksdagen.se/sv/dokument-lagar/dokument/svensk-forfattningssamling/forordning-2016836-om-elbusspremie_sfs-2016-836.
Niss, K. M. (2017), “Københavns ønske om elbusser” [Copenhagen’s desire for electric buses], www.moviatrafik.dk/media/5738/koebenhavns-oenske-om-el-busser.pdf.
Moro, A. and Lonza, L. (2017), “Electricity carbon intensity in European Member States: Impacts on GHG emissions of electric vehicles”, Transportation Research Part D: Transport and Environment, www.sciencedirect.com/science/article/pii/S1361920916307933?via%3Dihub#b0085.
Naturvårdsverket (2017), “Resultat för Klimatklivet” [Results for the Climate Plan], www.naturvardsverket.se/Stod-i-miljoarbetet/Bidrag/Klimatklivet/Resultat-for-Klimatklivet/, (accessed 12 December 2017).
NKL (Netherlands Knowledge Platform for Charging Infrastructure) (2017), “Open Charge Point Interface OCPI”, http://en.nklnederland.nl/projects/our-current-projects/open-charge-point-interface-ocpi/, (accessed 11 December 2017).
Nobil, (2018), “Charging station database”, ENOVA and Nordic EV Association, http://info.nobil.no/index.php/english, (accessed 10 January 2018).
Nordic EV Outlook 2018 © OECD/IEA 2018 Insights from leaders in electric mobility
Page | 96 Page | 96 Page | 96 Page | 96 Page | 96 Page | 96 Page | 96 Page | 96 Page | 96 Page | 96 Page | 96 Page | 96 Page | 96 Page | 96 Page | 96 Page | 96 Page | 96 Page | 96 Page | 96 Page | 96 Page | 96 Page | 96 Page | 96 Page | 96 Page | 96 Page | 96 Page | 96 Page | 96
– (2012), “The Norwegian charging station database for electromobility (NOBIL)”, Oslo, http://info.nobil.no/images/downloads/nobilbrosjyre.pdf.
Nord Pool (2017), “Nord Pool”, www.nordpoolgroup.com/, (accessed 21 November 2017).
Norsk Elbilforening (Nordic Electric Vehicle Association) (2018), “Nordic EV Barometer 2018”, http://elbilbarometere.no (accessed 25 January 2018).
– (2017), “Norwegian EV owner survey 2017”, Norsk Elbilforening, https://elbil.no/om-elbilisten-2017/.
– (2016), “Elbilisten 2016” [EV owners survey], Oslo, Nordic EV Association.
– (2013), “Brukerundersøkelsen” [User survey], Oslo, Nordic EV association.
Norwegian Ministry of Climate and Environment (2017), “Prop. 77 L (2016–2017): Lov om klimamål” [Love for climate], www.regjeringen.no/no/dokumenter/prop.-77-l-20162017/id2546463/sec1.
Norwegian Ministry of Transport (2016), “Forskrift om vilkårsparkering for allmennheten og håndheving av private parkeringsreguleringer (parkeringsforskriften)” [Regulations on parking conditions for the public and enforcement of private parking regulations], https://lovdata.no/dokument/LTI/forskrift/2016-03-18-260, (accessed 18 January 2018).
NVE (Norwegian Water Resources and Energy Directorate) (2016a), “Status of NVE’s work on network tariffs in the electricity distribution system”, http://publikasjoner.nve.no/rapport/2016/rapport2016_62.pdf.
– (2016b), “Hva betyr elbiler for strømnettet?” (What do electric cars mean for power lines?), www.nve.no/Media/4720/elbil_str%C3%B8mnett_rapport.pdf.
OECD (Organisation for Economic Co-operation and Development) (2017), “Exchange rates”, https://data.oecd.org/conversion/exchange-rates.htm, (accessed 22 January 2018).
OICA (Organisation Internationale des Constructeurs d’Automobiles) (2017), “Sales statistics”, www.oica.net/category/sales-statistics/, (accessed 25 October 2017).
ON Power (2017), “Products and services”, www.onpower.is/products-and-services, (accessed 5 December 2017).
Paananen, A. (2017), “Energy Authority Finland presentation for International Energy Agency in-depth energy policy review”, November 29 2017.
Palola, J. (2017), personal communication, Virta (Finland), 24 October 2017.
Portvik, S. (2017), personal communication, City of Oslo, 27 October 2017.
Rarik (2017), “Reikningar útskýrðir” [Bills Explained], www.rarik.is/reikningar-og-innheimta/reikningar-og-innheimta/reikningar-utskyrdir, (accessed 11 December 2017).
Regeringen (2017), “Aftale om elbiler” [Agreement on electric cars], 18 April 2017, www.regeringen.dk/publikationer-og-aftaletekster/aftaletekst-aftale-om-registreringsafgift-paa-elbiler.
Ruter (2018), “Fossilfri 2020” [Fossil free 2020], https://ruter.no/om-ruter/prosjekter/fossilfri2020/, (accessed 10 January 2018).
RúV (Ríkisútvarpið) (2017), “Tæplega 200 nýjar hleðslustöðvar á 3 árum” [Almost 200 new charging stations in 3 years], www.ruv.is/frett/taeplega-200-nyjar-hledslustodvar-a-3-arum.

© OECD/IEA 2018 Nordic EV Outlook 2018 Insights from leaders in electric mobility
Page | 97
Page | 97
Page | 97
Page | 97
Page | 97
Page | 97
Page | 97
Page | 97
Page | 97
Page | 97
Page | 97
Page | 97
Page | 97
Page | 97
Page | 97
Page | 97
Page | 97
Page | 97
Page | 97
Page | 97
Page | 97
Page | 97
Page | 97
Page | 97
Page | 97
Page | 97
Page | 97
Page | 97
SCB (Statistics Sweden) (2014), www.scb.se/sv_/Hitta-statistik/Artiklar/Villa-vanligaste-boendeformen/, (accessed 15 November 2017).
Seljeseth, H., Taxt, H. and Solvang, T. (2013), “Measurements of network impact from electric vehicles during slow and fast charging“, 22nd International Conference and Exhibition on Electricity Distribution, Stockholm, DOI: 10.1049/cp.2013.1197.
SEDC (Smart Energy Demand Coalition) (2017), “Explicit demand response in Europe: Mapping the markets 2017”, www.smartenergydemand.eu/wp-content/uploads/2017/04/SEDC-Explicit-Demand-Response-in-Europe-Mapping-the-Markets-2017.pdf.
SKAT (the Danish Customs and Tax Administration) (2018), “Betaling af og satser for registreringsafgift” [Payment and registration fees], http://skat.dk/skat.aspx?oid=2234529 (accessed 24 January 2018).
Skytte, K. and Bramstoft, P. R. (2018), "Decarbonising the Finnish Transport Sector by 2050: Electricity or Biofuels?". The Nexus: Energy, Environment and Climate Change. Springer; pp. 3-22. (Green Energy and Technology), DOI: 10.1007/978-3-319-63612-2_1
Sørensen, H.R. (2017), personal communication, Capital Region of Denmark, 31 October 2017.
Spilde, D. and Skotland, C. (2017), personal communication, Norwegian Water Resources and Energy Directorate, 30 October 2017.
Statistics Denmark (2017), “Population figures from the census by national part and time”, www.statbank.dk/statbank5a/default.asp?w=1920, (accessed 15 October 2017).
Statistics Finland (2017), “Population”, www.stat.fi/til/vrm_en.html, (accessed 15 October 2017).
Statistics Iceland (2017), “Population key figures”, www.statice.is/statistics/population/inhabitants/overview/, (accessed 15 October 2017).
Statistics Norway (2017a), “Population count”, www.ssb.no/en/befolkning?de=Population+count&fane=nokkeltallside, (accessed 15 October 2017).
– (2017b), “Electricity prices”, www.ssb.no/en/energi-og-industri/statistikker/elkraftpris, (accessed 10 November 2017).
Statistics Sweden (2017), “Population”, www.scb.se/en/finding-statistics/statistics-by-subject-area/population, (accessed 15 October 2017).
Stenberg, J. (2017), personal communication, Ensto (Finland), 11 November 2017.
Sverige Riksdag (2009), “Förordning (2009:1) om miljö- och trafiksäkerhetskrav för myndigheters bilar och bilresor, Näringsdepartementet” [Regulation (2009: 1) on environmental and road safety requirements for government cars and car trips, Ministry of Enterprise and Industry], RST, 1 August 2009.
Tesla (2017), “Model S specifications”, www.tesla.com/support/model-s-specifications, (accessed 12 August 2017).
Tekes (The Finnish Funding Agency for Innovation) (2016), “EVE – Electric Vehicle Systems 2011-2015”, Helsinki, Tekes.
Thorbjørnsen, T. (2017), personal communication, Lyse AS, 24 October 2017.
Tietge, U. et al. (2016), “Comparison of Leading Electric Vehicle Policy and Deployment in Europe”, International Council on Clean Transportation White Paper, Berlin.
Transport and Environment (2017), “Carmakers failing to hit their own goals for sales of electric cars”, www.transportenvironment.org/publications/carmakers-failing-hit-their-own-goals-sales-electric-cars.

Nordic EV Outlook 2018 © OECD/IEA 2018 Insights from leaders in electric mobility
Page | 98 Page | 98 Page | 98 Page | 98 Page | 98 Page | 98 Page | 98 Page | 98 Page | 98 Page | 98 Page | 98 Page | 98 Page | 98 Page | 98 Page | 98 Page | 98 Page | 98 Page | 98 Page | 98 Page | 98 Page | 98 Page | 98 Page | 98 Page | 98 Page | 98 Page | 98 Page | 98 Page | 98
Transport Styrelsen, Sweden (2016), “Nya miljözoner kan ge renare luft i städerna” [New environmental zones can provide cleaner air in cities], www.transportstyrelsen.se/sv/Nyhetsarkiv/nya-miljozoner-kan-ge-renare-luft-i-staderna/.
UNFCCC (United Nations Framework Convention on Climate Change) (2017), "Paris Agreement – Status of ratification", http://unfccc.int/paris_agreement/items/9444.php, (accessed 14 December 2017).
Unplugged (2015), “Wireless charging for Electric Vehicles”, http://unplugged-project.eu/wordpress/, (accessed 21 December 2017).
Vattenfall (2017), “Hitta laddstationer I Sverige och Europa” [Find charging stations in Sweden and Europe], www.vattenfall.se/ladda-elbilen/hitta-laddstationer/, (accessed 6 December 2017).
Virta (2017), “Public bidirectional EV charging point installed to Finland”, www.virta.global/news/the-first-public-bidirectional-ev-charging-point-to-finland, (accessed 25 October 2017).
Volkswagen (2017a), “Ny Volkswagen Golf – Kundepriser per 02.10.2017”, [New Volkswagen Golf – Customer Prices as of 02.10.2017] www.volkswagen.no/content/dam/vw-ngw/vw_pkw/importers/no/bilmodeller/brosjyrer-og-priser/golf/Volkswagen%20Golf%20prisliste.pdf/_jcr_content/renditions/original./Volkswagen%20Golf%20prisliste.pdf, (accessed 21 November 2017).
–(2017b), “Ny Volkswagen e-Golf – Kundepriser per 01.09.2017” [New Volkswagen e-Golf – Customer Prices as of 01.09.2017] www.volkswagen.no/content/dam/vw-ngw/vw_pkw/importers/no/bilmodeller/brosjyrer-og-priser/e-golf/Volkswagen%20e-Golf%20elbil%20prisliste.pdf/_jcr_content/renditions/original./Volkswagen%20e-Golf%20elbil%20prisliste.pdf, (accessed 21 November 2017).
–(2017c), “Den nye Volkswagen Golf – Brosjyre med tekniske data og utstyr” [New Volkswagen e-Golf – Customer Prices] www.volkswagen.no/no/h/brosjyrer-og-priser/brosjyrer-og-priser.html, (accessed 21 November 2017).
–(2017d), “Den nye Volkswagen e-Golf – Brosjyre med tekniske data og utstyr” [New Volkswagen e-Golf – Customer Prices as of 01.09.2017], www.volkswagen.no/content/dam/vw-ngw/vw_pkw/importers/no/bilmodeller/brosjyrer-og-priser/e-golf/Volkswagen%20e-Golf%20elbil%20tekniske%20data.pdf/_jcr_content/renditions/original./Volkswagen%20e-Golf%20elbil%20tekniske%20data.pdf, (accessed 21 November 2017).
–(2017e), “Den nye Volkswagen Golf GTE – Brosjyre med tekniske data og utstyr” [New Volkswagen e-Golf – Customer Prices], ), www.volkswagen.no/content/dam/vw-ngw/vw_pkw/importers/no/bilmodeller/brosjyrer-og-priser/e-golf/Volkswagen%20e-Golf%20elbil%20tekniske%20data.pdf/_jcr_content/renditions/original./Volkswagen%20e-Golf%20elbil%20tekniske%20data.pdf, (accessed 21 November 2017).
WBS (Warwick Business School) (2017), “Who will charge for charging – Market development and business opportunities in the Swedish electric vehicle infrastructure market” (dissertation), WBS, Warwick.
Wikström, M. (2018), personal communications, Swedish Energy Agency, November 2017 to January 2018.
Wu, Q. et al. (2012), “EV Portfolio Management and Grid Impact Study, Edison project: deliverable 2.4, 2.5 and 2.6”, www.edison-net.dk/Project%20Details/Grid%20Impact.aspx.

© OECD/IEA 2018 Nordic EV Outlook 2018 Insights from leaders in electric mobility
Page | 99
Page | 99
Page | 99
Page | 99
Page | 99
Page | 99
Page | 99
Page | 99
Page | 99
Page | 99
Page | 99
Page | 99
Page | 99
Page | 99
Page | 99
Page | 99
Page | 99
Page | 99
Page | 99
Page | 99
Page | 99
Page | 99
Page | 99
Page | 99
Page | 99
Page | 99
Page | 99
Page | 99
Acronyms, abbreviations and units of measure
Acronyms and abbreviations AC Alternating current ACEA European Automobile Manufacturers Association AFI Alternative fuels infrastructure BEV Battery electric vehicle CCS Combined charging system CEF Connection Europe Facility CHAdeMO Charge de Move CO2 Carbon dioxide CPO Charge point operator DC Direct current DKK Danish Krone DSM Demand-side management DSO Distribution system operator EAFO European Alternative Fuels Observatory EC European Commission EEA European Environment Agency EFTA European Free Trade Association EMSP E-mobility service provider ETP Energy Technology Perspectives EU European Union EUR Euro EV Electric vehicle, i.e. BEV, PHEV or FCEV EVI Electric Vehicles Initiative EVS Electric vehicle system EVSE Electric vehicle supply equipment FCEV Fuel-cell electric vehicle GEVO Global electric vehicle outlook GHG Greenhouse gas HEV Hybrid vehicle ICE Internal combustion engine IEA International Energy Agency ISK Icelandic Krona LCV Light commercial vehicle NEVO Nordic electric vehicle outlook NOK Norwegian Krone OEM Original equipment manufacturer PC Passenger car PHEV Plug-in hybrid vehicle PLDV Passenger light-duty vehicle SEK Swedish Krona TCO Total cost of ownership TCP Technology collaboration programme TEN-T Trans-European Transport Networks TSO Transmission system operator USA United States of America

Nordic EV Outlook 2018 © OECD/IEA 2018 Insights from leaders in electric mobility
Page | 100 Page | 100 Page | 100 Page | 100 Page | 100 Page | 100 Page | 100 Page | 100 Page | 100 Page | 100 Page | 100 Page | 100 Page | 100 Page | 100 Page | 100 Page | 100 Page | 100 Page | 100 Page | 100 Page | 100 Page | 100 Page | 100 Page | 100 Page | 100 Page | 100 Page | 100 Page | 100 Page | 100
USD US Dollar V2G Vehicle-to-grid VAT Value-added tax WTW Well-to-wheel ZEV Zero-emissions vehicle
Units of measure gCO2 grammes of carbon dioxide gCO2/km grammes of carbon dioxide per kilometre Gt gigatonne GW gigawatt GWh gigawatt-hour kW kilowatt kWh kilowatt-hour Lge litres of gasoline equivalent MtCO2-eq million tonnes of CO2 equivalent MW megawatt tCO2-eq tonnes of CO2 equivalent V volt

Onl
in
e bookshopPDF versions at 20%
discountw
ww
.iea
.org/books
Inte
rnat
iona
l Energy Agency
Secure Sustain
able T
oget
her
World Energy Outlook series
World Energy
Investment series
Energy Statistics series
Energy Policiesof IEA
Countriesseries
Energy Technology
Perspectives series
E-mail: books@
iea.org
Market ReportSeries
Oil
Coal
RenewableEnergy Energy
Efficiency
Gas
Global Gas Security series
EnergyPolicies
Beyond IEA Countriesseries

This publica�on reflects the views of the IEA Secretariat but does not necessarily reflect those of individual IEA member countries. The IEA makes no representa�on or warranty, express or implied, in respect of the publica�on’s contents (including its completeness or accuracy) and shall not be responsible for any use of, or reliance on, the publica�on.
Unless otherwise indicated, all material presented i��gures and tables is derived from IEA data and analysis.
This publica�on and any map included herein are without prejudice to the status of or sovereignty over any territory, to the delimita�on of interna�onal fron�ers and boundaries and to the name of any territory, city or area.
IEA/OECD possible corrigenda on: www.oecd.org/about/publishing/corrigenda.htm
IEA Publica�onsInterna�onal Energy Agency
Website: www.iea.orgContact information: www.iea.org/about/contact
Typeset in France by IEA - Mars 2017 Cover design: IEA; Photo credits: © GraphicObsession

This map is without prejudice to the status of or sovereignty over any territory, to the delimitation of international frontiers and boundaries, and to the name of any territory, city or area.
The Nordic region is at the forefront of the global growth of electric mobility. The Nordic Electric Vehicle Outlook (NEVO) aims to identify and discuss recent developments of electric mobility in the five Nordic countries: Denmark, Finland, Iceland, Norway and Sweden. The report assesses the current status of the electric car market, the deployment of charging infrastructure, and the integration with the electricity grid at country level. It analyses the role of European, national, and local policy frameworks in supporting these developments. The analysis also provides insights on consumer behaviour and includes an outlook on the progress of electric mobility in the Nordic region up to 2030.
NEVO has been developed in co-operation between the International Energy Agency (IEA) and Nordic Energy Research. It builds on the long-standing IEA engagement in the area of electric mobility, including the co-ordination of the Electric Vehicles Initiative (EVI) and the hosting of the Hybrid and Electric Vehicle Technology Collaboration Programme.
Nordic EV Outlook 2018
Member countries of the Nordic Council, covered in this report: