Nordic Consumer Sector Salary Survey 2016
21
Nordic Consumer Sector Salary Survey 2016 What are you worth?
-
Upload
nigel-wright-group -
Category
Recruiting & HR
-
view
118 -
download
1
Transcript of Nordic Consumer Sector Salary Survey 2016

Nordic Consumer Sector Salary Survey 2016
What are you worth?

Welcome to Nigel Wright Group’s Nordic Consumer Sector Salary Survey 2016, which is specifically designed to provide you with an insight into the salaries commanded by professionals within this sector. Nigel Wright Group has earned a strong reputation within the consumer sector across Europe for providing a high quality recruitment service that is built upon our industry knowledge. We consider it important to continue to bring you relevant, useful information that you can use, in an accessible format.
Introduction
This survey has been compiled from the responses of over 1,500 respondents who completed our online questionnaire in the final quarter of 2015/2016 as well as data from our own extensive database of candidates.
The survey represents a cross-section of respondents with the following profile:
• Location: Sweden (44%), Denmark (40%), Norway (16%);
• Consumer sub-sector: Food & Drink, Health & Beauty, Consumer Electronics, DIY, Fashion and Apparel, Household Products, Luxury Goods, OTC pharmaceuticals, Leisure & Entertainment, Media and Publishing, Retail and E-commerce and Travel;
• Male 71%, female 29%;
• Average age 41;
• 81% of respondents are educated to degree level or above (52% have a Master’s degree);
• 39% work for companies that employ 250 people or less and 43% work for companies employing over 1,000;
• 18% have been in their current position less than one year; 21% for between one and three years, 30% for between three and five years and 31% for more than five years.
The first three parts of the survey focuses on some general points of interest, such as levels of satisfaction, respondents’ motivation to change jobs as well as attitudes towards skill shortages and the qualities needed to succeed in the industry. This is followed by discipline-specific analyses of salaries.
For further information or to discuss your recruitment requirements please contact us via the contact details below and you will be directed to a consultant specialising in your area. For more information on our services please visit www.nigelwright.com.
Denmark: +45 7027 8601Norway: +47 23 89 77 73Sweden: +46 (0)8 400 264 35

04 Nordic Consumer Sector Salary Survey 2016 05Nordic Consumer Sector Salary Survey 2016
Respondents’ ProfileContents
71%MALE
BASE:
1500+PLUS DATABASE
Average age: 41
81%Are educated to
degree level or above
40%DENMARK
16%NORWAY
44%SWEDEN
29%FEMALE
1. Non-monetary indicators 06
1.1 Weekly hours worked 06
1.2 Job satisfaction by job level 07
1.3 Job satisfaction by discipline 08
1.4 Job satisfaction by country 09
1.5 Factors influencing a change of roles 10
1.6 Factors influencing a change of roles by country 11
1.7 Methods used to search for a new role 12
2. Salaries, benefits and bonuses 13
2.1 Average percentage of salary increase received and expected by level 14
2.2 Average percentage of salary increase received and expected by discipline 15
2.3 Average percentage of salary increase received and expected by country 16
2.4 Importance of benefits as part of a remuneration package 17
2.5 Importance of benefits as part of a remuneration package by gender 18
2.6 Benefits and bonus entitlement by country 19
2.7 Comparison of bonus rates by country 20
2.8 Flexible working options 21
3. Skills and attitudes 22
3.1 Skill shortages by country 23
3.2 Qualities needed to be successful by country 24
4. Analysis of salaries in relation to discipline 25
4.1 Executive 26
4.2 Marketing 27
4.3 Sales 30
4.4 Operations 33
4.5 Finance & HR 36
5. Contact information 37

06 Nordic Consumer Sector Salary Survey 2016 Nordic Consumer Sector Salary Survey 2016 07
0
5
10
15
20
25
30
35
40
Level of satisfaction
% o
f re
spo
nd
ents
executive
management
non-management
very s
atisfie
d
moderate
ly sa
tisfie
d
satis
fied
moderate
ly d
issatis
fied
very d
issatis
fied
1. Non-monetary indicators
1.1 Weekly hours worked
This section presents information from respondents from all disciplines and levels of the consumer sector, on their working hours, levels of satisfaction and the factors that motivate them to change roles.
On average respondents work 46 hours per week. 48% of respondents work between 41-50 hours per week and a further 21% work between 51-60 hours per week.
The results show a fairly satisfied workforce in the consumer sector. Although there are variations between the strength of respondents’ satisfaction, over 82% of respondents at each level of their organisations rated themselves as being between satisfied and very satisfied. This is encouraging for HR professionals and managers alike. The challenge, then, is to find out why the other 18% is dissatisfied and what can be done to change this, whilst ensuring that the satisfaction level of the rest of the workforce is maintained.
1.2 Job satisfaction by job level
Respondents were asked to rate their level of job satisfaction on the following five-point scale:
1 = very dissatisfied
2 = moderately dissatisfied
3 = satisfied
4 = moderately satisfied
5 = very satisfied
40
41
42
43
44
45
46
47
48
49
denmark
swed
en
norway
Avg
. N
o.
Ho
urs
08 Nordic Consumer Sector Salary Survey 2016 Nordic Consumer Sector Salary Survey 2016 09
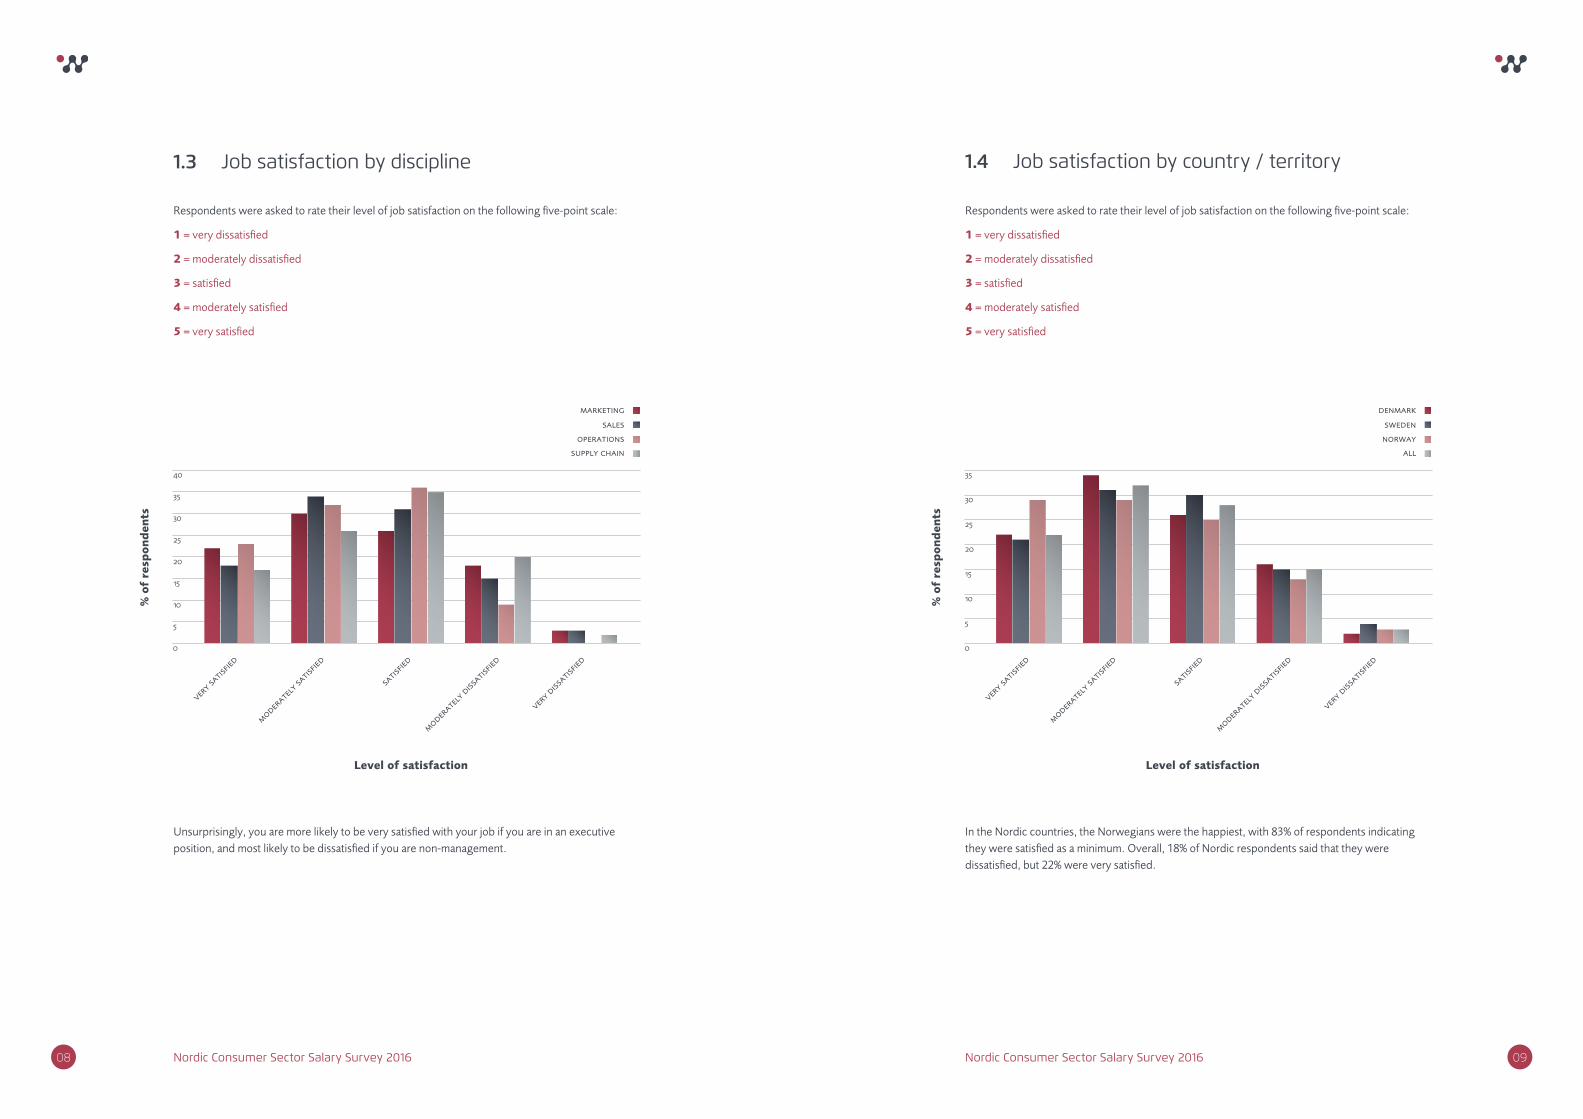
Unsurprisingly, you are more likely to be very satisfied with your job if you are in an executive position, and most likely to be dissatisfied if you are non-management.
In the Nordic countries, the Norwegians were the happiest, with 83% of respondents indicating they were satisfied as a minimum. Overall, 18% of Nordic respondents said that they were dissatisfied, but 22% were very satisfied.
Respondents were asked to rate their level of job satisfaction on the following five-point scale:
1 = very dissatisfied
2 = moderately dissatisfied
3 = satisfied
4 = moderately satisfied
5 = very satisfied
Respondents were asked to rate their level of job satisfaction on the following five-point scale:
1 = very dissatisfied
2 = moderately dissatisfied
3 = satisfied
4 = moderately satisfied
5 = very satisfied
1.3 Job satisfaction by discipline 1.4 Job satisfaction by country / territory
0
5
10
15
20
25
30
40
35
Level of satisfaction
% o
f re
spo
nd
ents
very s
atisfie
d
moderate
ly sa
tisfie
d
satis
fied
moderate
ly d
issatis
fied
very d
issatis
fied
marketing
sales
operations
supply chain
0
5
10
15
20
25
30
35
Level of satisfaction
% o
f re
spo
nd
ents
very s
atisfie
d
moderate
ly sa
tisfie
d
satis
fied
moderate
ly d
issatis
fied
very d
issatis
fied
denmark
sweden
norway
all

10 11Nordic Consumer Sector Salary Survey 2016 Nordic Consumer Sector Salary Survey 2016
change locatio
n
increa
sed rem
uneratio
n0
10
20
30
40
50
60
70
80
Factors
% o
f re
spo
nd
ents
internal
external
new chall
enges
promotio
n
gain n
ew sk
ills
achieve a
n impr
oved w
ork-life
balance
differ
ent e
nvironment/
culture
flex
ible w
orking
change disc
iplin
e
Respondents were asked to select the top three factors that would motivate them to change jobs, both within their current company (internally) and to another organisation (externally). In the Nordic region, although money is important, the opportunity to experience new challenges is a more persuasive factor for employees considering their next move. Interestingly, 20% of people will be influenced to move within their current company in order to change their working environment/culture.
There were marginal differences between the three countries. Promotion is slightly less important to the Norwegians, who put a greater emphasis on gaining new skills and remuneration, and the Danes indicated they are more motivated by new challenges than those in the other countries.
1.5 Changing jobs Factors influencing a change of roles internally, that is within your current company, or externally to another organisation.
1.6 Changing jobs by country / territory (internal & external combined).
differ
ent e
nvironment/
culture
increa
sed rem
uneratio
n0
10
20
30
40
50
60
70
80
Factors
% o
f re
spo
nd
ents
all
new chall
enges
promotio
n
gain n
ew sk
ills
achieve a
n impr
oved w
ork-life
balance
flex
ible w
orking
change disc
iplin
e
change locatio
n
denmark
sweden
norway

12 Nordic Consumer Sector Salary Survey 2016
Respondents were asked to select all methods that they would utilise when looking for a new role. As the respondents surveyed were mainly people already known to Nigel Wright Recruitment, it is no surprise that our website is ranked highly. Social networking is also an increasingly important method for job seekers. Using Social Networking sites to identify job opportunities now surpasses the use of traditional media such as newspapers and magazines. Whilst the three Nordic countries show similarities, one key difference is that 19% of Norwegians say that they would use regional or local newspapers to search for a new role. The Norwegians are also more inclined to use online job boards than the Danes and the Swedes.
1.7 Methods used to search for a new role
0
10
20
30
40
50
60
Methods
% o
f re
spo
nd
ents
nigel
wrig
ht group w
ebsit
e
social n
etworkin
g site
s
direct a
pproaches
to em
ploye
rs
online j
ob boards
other
recruitm
ent c
onsult
ancies
inte
rnal bull
etin
boards/em
ploye
r intr
anets
other
regio
nal or lo
cal new
spape
rs
trade m
agazines
all
denmark
sweden
norway
3.
Nordic Consumer Sector Salary Survey 2016
Salary, benefits and bonuses
This section presents information from respondents from all disciplines and levels of the consumer sector on their salaries, benefits and bonuses.

14 15Nordic Consumer Sector Salary Survey 2016 Nordic Consumer Sector Salary Survey 2016
At their last salary review, executives received a marginally higher increase than other levels. However, non-management are anticipating the highest increase.
2.1 Average percentage of salary increase received and expected by level
0
1
2
3
4
5
6
Level
% o
f sa
lary
incr
ease
received
expected
exec
utive
managemen
t
non-managem
ent
When we consider salary increase by discipline, on average, those working in sales received and expect a slightly higher increase than those working in marketing or operations.
2.2 Average percentage of salary increase received and expected by discipline
0
1
2
3
4
5
Discipline
% o
f sa
lary
incr
ease
received
expected
sale
s
marketin
g
operatio
ns
16 17Nordic Consumer Sector Salary Survey 2016 Nordic Consumer Sector Salary Survey 2016
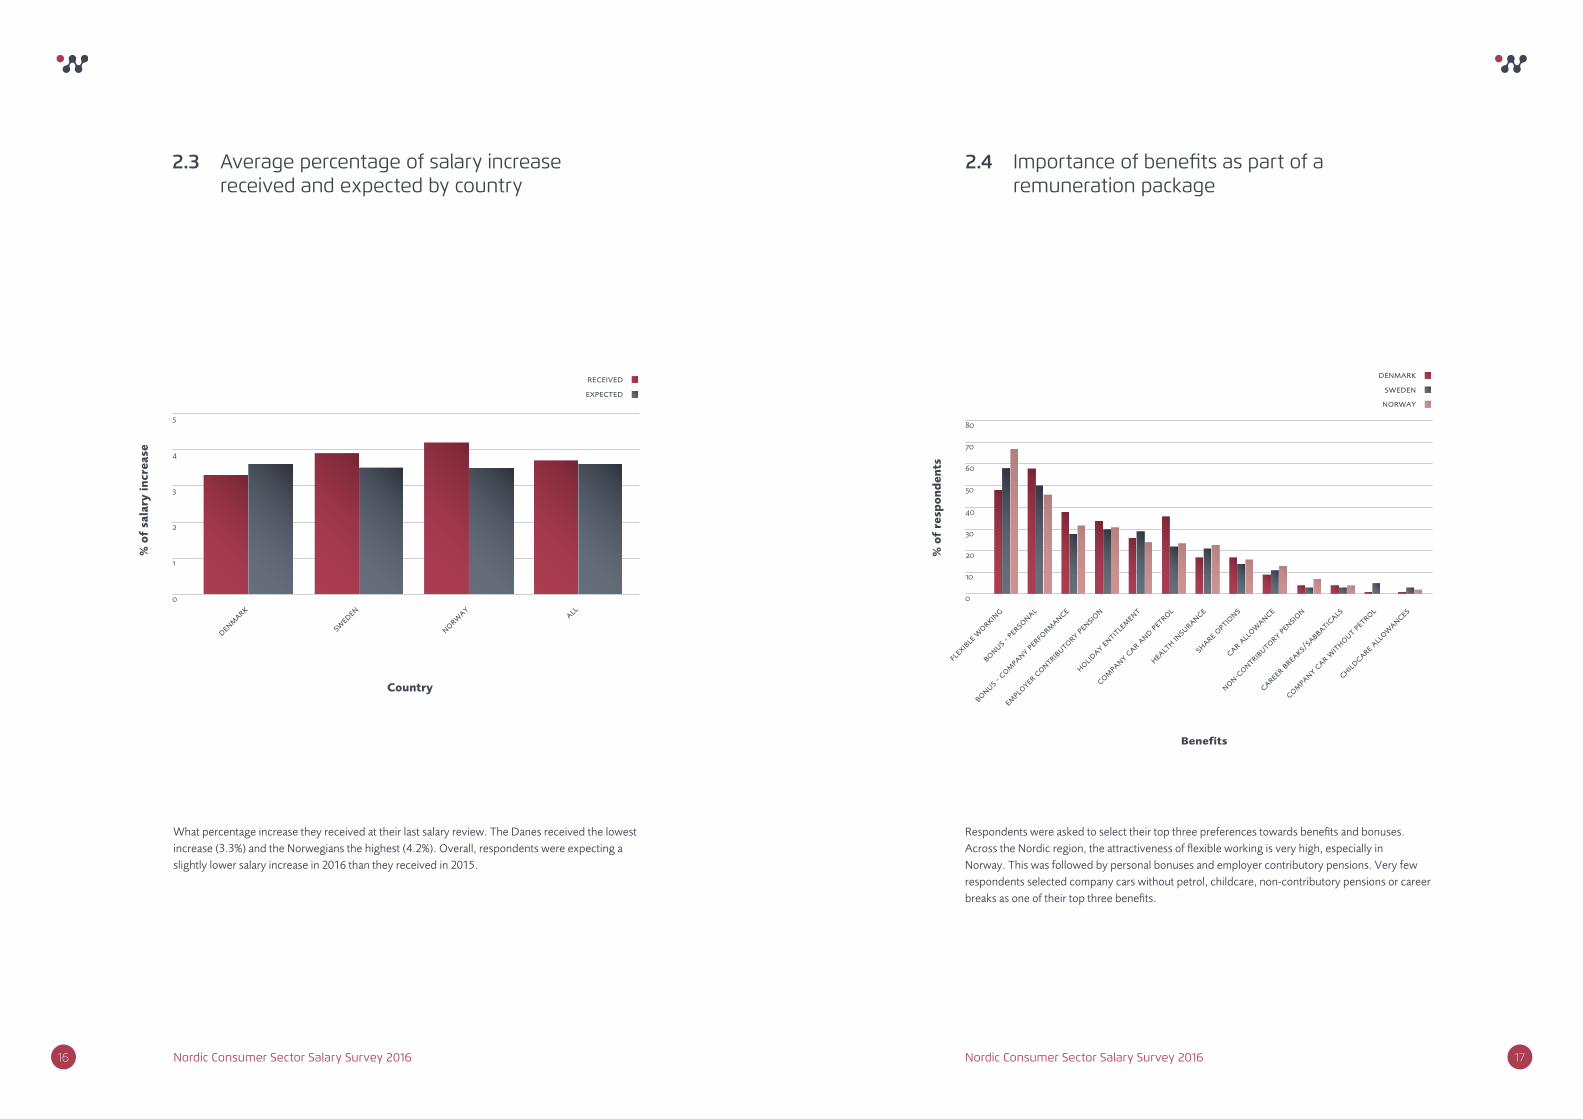
What percentage increase they received at their last salary review. The Danes received the lowest increase (3.3%) and the Norwegians the highest (4.2%). Overall, respondents were expecting a slightly lower salary increase in 2016 than they received in 2015.
2.3 Average percentage of salary increase received and expected by country
0
1
2
3
4
5
Country
% o
f sa
lary
incr
ease
received
expected
denmark
swed
en
norwayall
Respondents were asked to select their top three preferences towards benefits and bonuses. Across the Nordic region, the attractiveness of flexible working is very high, especially in Norway. This was followed by personal bonuses and employer contributory pensions. Very few respondents selected company cars without petrol, childcare, non-contributory pensions or career breaks as one of their top three benefits.
2.4 Importanceofbenefitsaspartofa remuneration package
empl
oyer contr
ibutory p
ensio
n
0
10
20
30
40
50
60
70
80
% o
f re
spo
nd
ents
Benefits
flex
ible w
orking
bonus - pe
rsonal
company c
ar and petr
ol
bonus - compa
ny per
formance
healt
h insu
rance
holiday e
ntitle
ment
share o
ptio
ns
car allowance
non-contr
ibutory p
ensio
n
career brea
ks/sa
bbaticals
company c
ar with
out pet
rol
childcare a
llowances
denmark
sweden
norway
18 19Nordic Consumer Sector Salary Survey 2016 Nordic Consumer Sector Salary Survey 2016
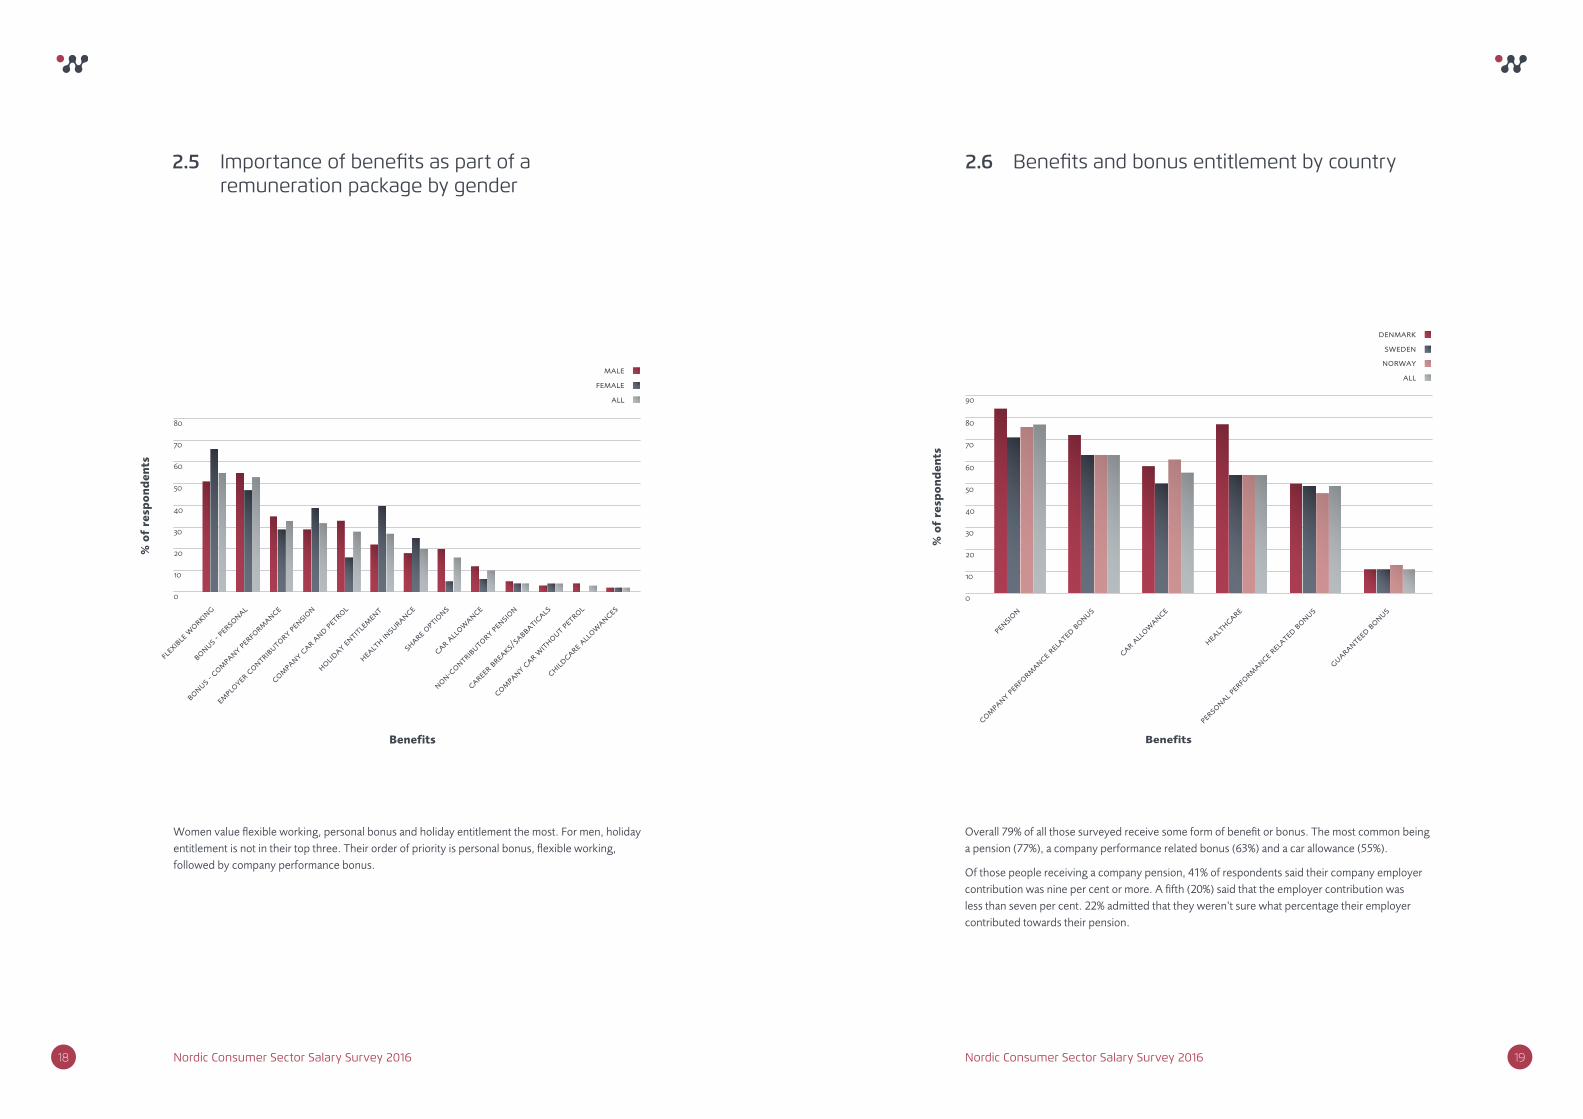
Women value flexible working, personal bonus and holiday entitlement the most. For men, holiday entitlement is not in their top three. Their order of priority is personal bonus, flexible working, followed by company performance bonus.
2.5 Importanceofbenefitsaspartofa remuneration package by gender
healt
h insu
rance
career brea
ks/sa
bbaticals
holiday e
ntitle
ment
empl
oyer contr
ibutory p
ensio
n
flex
ible w
orking
0
10
20
30
40
50
60
70
80
% o
f re
spo
nd
ents
all
Benefits
bonus - pe
rsonal
company c
ar and petr
ol
bonus - compa
ny per
formance
share o
ptio
ns
car allowance
non-contr
ibutory p
ensio
n
company c
ar with
out pet
rol
childcare a
llowances
male
female
Overall 79% of all those surveyed receive some form of benefit or bonus. The most common being a pension (77%), a company performance related bonus (63%) and a car allowance (55%).
Of those people receiving a company pension, 41% of respondents said their company employer contribution was nine per cent or more. A fifth (20%) said that the employer contribution was less than seven per cent. 22% admitted that they weren’t sure what percentage their employer contributed towards their pension.
2.6 Benefitsandbonusentitlementbycountry
perso
nal per
formance r
elate
d bonus
car allowance
0
10
20
30
40
50
60
70
80
90
% o
f re
spo
nd
ents
Benefits
pensio
n
healt
hcare
company p
erfo
rmance rel
ated bonus
guaranteed
bonus
denmark
sweden
norway
all
20 21Nordic Consumer Sector Salary Survey 2016 Nordic Consumer Sector Salary Survey 2016
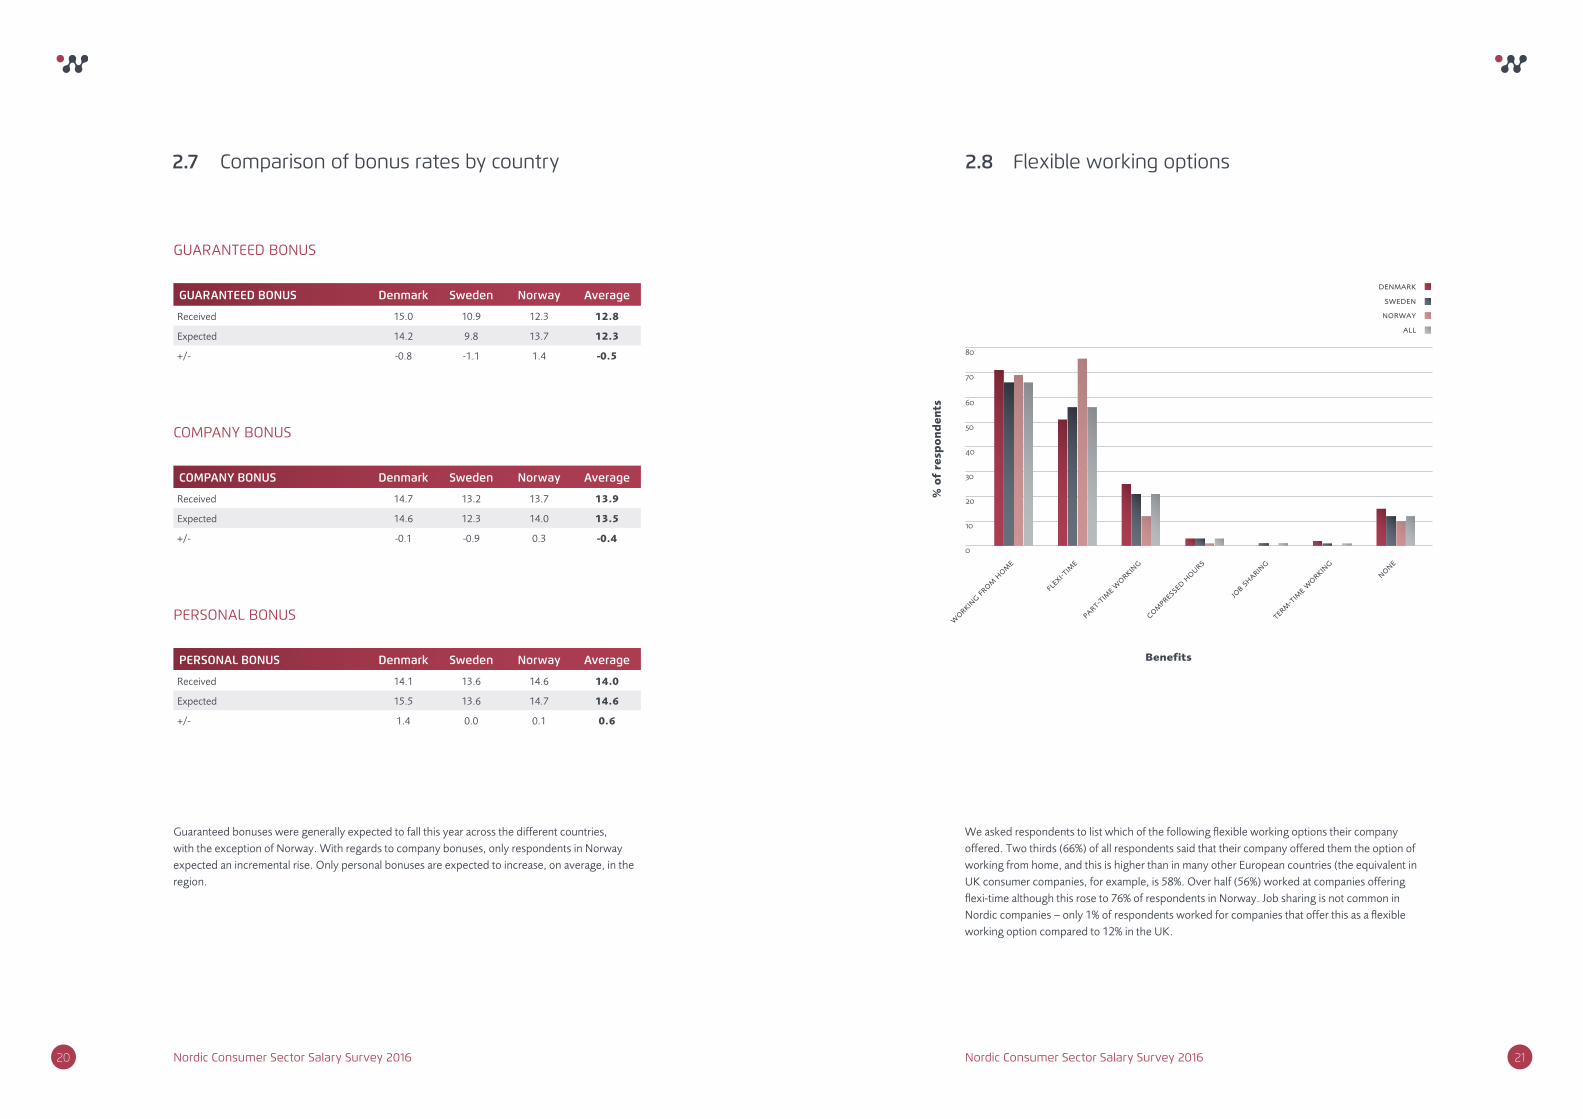
GUARANTEED BONUS Denmark Sweden Norway Average
Received 15.0 10.9 12.3 12.8
Expected 14.2 9.8 13.7 12.3
+/- -0.8 -1.1 1.4 -0.5
Guaranteed bonuses were generally expected to fall this year across the different countries, with the exception of Norway. With regards to company bonuses, only respondents in Norway expected an incremental rise. Only personal bonuses are expected to increase, on average, in the region.
2.7 Comparison of bonus rates by country
We asked respondents to list which of the following flexible working options their company offered. Two thirds (66%) of all respondents said that their company offered them the option of working from home, and this is higher than in many other European countries (the equivalent in UK consumer companies, for example, is 58%. Over half (56%) worked at companies offering flexi-time although this rose to 76% of respondents in Norway. Job sharing is not common in Nordic companies – only 1% of respondents worked for companies that offer this as a flexible working option compared to 12% in the UK.
2.8 Flexible working options
job sh
aring
part-t
ime w
orking
0
10
20
30
40
50
60
70
80
% o
f re
spo
nd
ents
Benefits
working fr
om home
compres
sed h
ours
flex
i-tim
e
term-ti
me workin
gnone
denmark
sweden
norway
all
GUARANTEED BONUS
COMPANY BONUS
PERSONAL BONUS
COMPANY BONUS Denmark Sweden Norway Average
Received 14.7 13.2 13.7 13.9
Expected 14.6 12.3 14.0 13.5
+/- -0.1 -0.9 0.3 -0.4
PERSONAL BONUS Denmark Sweden Norway Average
Received 14.1 13.6 14.6 14.0
Expected 15.5 13.6 14.7 14.6
+/- 1.4 0.0 0.1 0.6

23Nordic Consumer Sector Salary Survey 2016
Skills and attitudesNordic Consumer Sector Salary Survey 2016
Respondents were asked to select which skills they thought were lacking in their industry. Overall, having the right attitude and personality (39%), communication skills (34%) and commercial acumen (33%) were selected the most often across the different countries.
We also asked people if their company had taken any action to address skills shortages in their own company. A quarter (24%) said that their company had recruited from other industries or professions to address a skills shortage and a fifth (19%) reported that their company had increased their internal training budgets. Only 11% said that their employer had no skills shortages.
3.1 Skills shortages by country
indust
ry knowle
dge and ex
perien
ce
profe
ssio
nal/in
dustry q
ualificatio
ns0
10
20
30
40
50
Skills
% o
f re
spo
nd
ents
right a
ttitu
de/pe
rsonalit
y
profe
ssio
nal manner
communication sk
ills
commercial a
cumen
liter
acy and n
umeracy s
kills
none
denmark
sweden
norway
all
This section presents information from respondents on skill shortages and what qualities they believe are needed to be successful in their industry.

24 Nordic Consumer Sector Salary Survey 2016
Respondents were asked to select what behaviours are needed to be a successful within their career. Being action oriented (65%), flexible and adaptable (61%) and having professional knowledge (60%) were considered the most significant, followed by communication expertise (56%).
3.2 Qualities needed to be successful by country
great n
etworker
confiden
t/se
lf-a
ssured
self
-suff
icient/
indep
enden
t
excel
lent c
ommunicator
0
10
20
30
40
50
60
70
Skills
% o
f re
spo
nd
ents
action o
riente
d
flex
ible/a
daptable
profe
ssio
nal knowle
dge
self
-starte
r
cope w
ell u
nder fi
nancial inse
curity
denmark
sweden
norway
all
Analysis of salaries in relation to discipline
Nordic Consumer Sector Salary Survey 2016
The Nigel Wright Nordic salary review is based on the details we hold on our database. Whilst we make every possible attempt to ensure the data we provide is accurate, it should be noted that salary levels can vary depending on company size, industry sector and the availability of candidates in a specific discipline.

26 27Nordic Consumer Sector Salary Survey 2016 Nordic Consumer Sector Salary Survey 2016
SWEDEN (SEK) Average Minimum Maximum
Chief Executive Officer 1,400,000 900,000 3,000,000
Managing Director 1,200,000 800,000 3,000,000
Chief Operating Officer 1,020,000 720,000 2,400,000
Chief Financial Officer 1,080,000 780,000 2,300,000
General Manager 1,050,000 800,000 1,500,000
4.1 Executive
DENMARK (DKK) Average Minimum Maximum
Chief Executive Officer 2,000,000 1,200,000 2,500,000
Managing Director 1,500,000 1,000,000 2,000,000
Chief Operating Officer 1,500,000 1,000,000 1,850,000
Chief Financial Officer 1,500,000 1,000,000 1,700,000
General Manager 1,200,000 1,000,000 1,500,000
NORWAY (NOK) Average Minimum Maximum
Chief Executive Officer 1,600,000 900,000 2,700,000
Managing Director 1,400,000 850,000 2,000,000
Chief Operating Officer 1,030,000 750,000 1,750,000
Chief Financial Officer 1,090,000 700,000 1,700,000
General Manager 960,000 800,000 1,500,000
4.2 Marketing
DENMARK (DKK) Average Minimum Maximum
Marketing Director 1,210,000 800,000 1,670,000
Head of Marketing 1,090,000 720,000 1,060,000
Marketing Manager 800,000 600,000 1,000,000
Nordic Marketing Manager 1,000,000 720,000 1,100,000
International Marketing Manager 1,080,000 600,000 1,000,000
Category Manager 910,000 660,000 960,000
Sales & Marketing Manager 1,090,000 720,000 1,200,000
Trade Marketing Manager 720,000 600,000 880,000
Online Marketing Manager 720,000 600,000 800,000
Junior Marketing Manager 350,000 290,000 450,000
Marketing Co-ordinator 430,000 330,000 660,000
Brand Director 1,000,000 720,000 1,200,000
Senior Brand Manager 710,000 600,000 800,000
Nordic Brand Manager 720,000 680,000 800,000
Brand Manager 690,000 480,000 780,000
Junior Brand Manager 480,000 420,000 600,000
Product Director 1,000,000 720,000 1,000,000
Nordic Product Manager 750,000 480,000 820,000
Senior Product Manager 810,000 480,000 900,000
Product Manager 720,000 330,000 800,000
Junior Product Manager 600,000 350,000 700,000
PR & Communication Manager 720,000 360,000 900,000
Digital Marketing Director 950,000 600,000 1,200,000
Digital Marketing Manager 950,000 600,000 1,200,000
Digital Marketing Specialist 460,000 180,000 780,000

28 29Nordic Consumer Sector Salary Survey 2016 Nordic Consumer Sector Salary Survey 2016
NORWAY (NOK) Average Minimum Maximum
Marketing Director 1,150,000 870,000 1,500,000
Head of Marketing 880,000 800,000 1,100,000
Marketing Manager 745,000 650,000 1,200,000
Trade Marketing Manager 630,000 500,000 800,000
Nordic Marketing Manager 710,000 600,000 900,000
International Marketing Manager 880,000 800,000 1100,000
Category Manager 700,000 500,000 950,000
Online Marketing Manager 650,000 500,000 800,000
Marketing Co-ordinator 420,000 360,000 550,000
Senior Brand Manager 700,000 550,000 950,000
Nordic Brand Manager 610,000 450,000 700,000
Brand Manager 590,000 400,000 650,000
Junior Brand Manager 450,000 350,000 480,000
Product Director 940,000 800,000 1,000,000
Nordic Product Manager 690,000 550,000 890,000
Senior Product Manager 690,000 550,000 890,000
Product Manager 520,000 490,000 690,000
Junior Product Manager 480,000 400,000 550,000
PR & Communication Manager 600,000 450,000 800,000
Digital Marketing Director 800,000 690,000 1100,000
Digital Marketing Manager 740,000 600,000 930,000
Digital Marketing Specialist 530,000 480,000 700,000
SWEDEN (SEK) Average Minimum Maximum
Marketing Director 860,000 600,000 1,732,500
Head of Marketing 790,000 600,000 1,200,000
Marketing Manager 600,000 480,000 1,400,000
Nordic Marketing Manager 590,000 480,000 900,000
International Marketing Manager 580,000 420,000 900,000
Online Marketing Manager 550,000 420,000 720,000
Category Manager 550,000 400,000 864,000
Trade Marketing Manager 510,000 370,000 720,000
Sales & Marketing Manager 510,000 400,000 660,000
Junior Marketing Manager 370,000 300,000 500,000
Marketing Co-ordinator 380,000 260,000 650,000
Brand Director 720,000 480,000 1,200,000
Senior Brand Manager 550,000 420,000 720,000
Nordic Brand Manager 530,000 300,000 720,000
Brand Manager 490,000 330,000 660,000
Junior Brand Manager 390,000 280,000 504,000
Product Director 900,000 600,000 1,200,000
Nordic Product Manager 570,000 400,000 800,000
Senior Product Manager 600,000 450,000 720,000
Product Manager 480,000 360,000 660,000
Junior Product Manager 380,000 320,000 420,000
PR & Communication Manager 510,000 360,000 750,000
Digital Marketing Director 620,000 500,000 720,000
Digital Marketing Manager 530,000 360,000 840,000

30 31Nordic Consumer Sector Salary Survey 2016 Nordic Consumer Sector Salary Survey 2016
4.3 Sales
DENMARK (DKK) Average Minimum Maximum
Sales Director 1,010,000 690,000 2,200,000
International Sales Director 1,290,000 650,000 1,500,000
Head of Sales 950,000 640,000 1,300,000
Nordic Sales Manager 860,000 550,000 1,350,000
Country Manager 1,200,000 780,000 1,350,000
Business Development Manager 750,000 420,000 1,000,000
Sales Manager 850,000 460,000 1,500,000
Export Manager 830,000 390,000 1,000,000
Regional Sales Manager 990,000 360,000 1,200,000
Field Sales Manager 790,000 360,000 1,000,000
Area/District Sales Manager 670,000 400,000 950,000
Sales Executive 710,000 300,000 1,000,000
Retail Sales Manager 730,000 360,000 990,000
Project Manager 790,000 420,000 1,200,000
Store Manager 470,000 300,000 1,100,000
Senior KAM 810,000 550,000 1,000,000
Nordic KAM 740,000 450,000 900,000
KAM 680,000 350,000 900,000
Account Manager/NAM 660,000 350,000 900,000
Junior KAM 500,000 360,000 570,000
SWEDEN (SEK) Average Minimum Maximum
Sales Director 860,000 600,000 2,500,000
International Sales Director 830,000 600,000 1,110,000
Head of Sales 690,000 480,000 1,200,000
Nordic Sales Manager 640,000 420,000 1,300,000
Country Manager 800,000 600,000 1,200,000
Business Development Manager 560,000 400,000 870,000
Sales Manager 600,000 420,000 1,000,000
Export Manager 610,000 420,000 830,000
Regional Sales Manager 580,000 360,000 1,140,000
Field Sales Manager 510,000 360,000 780,000
Area/District Sales Manager 470,000 300,000 820,000
Sales Executive 410,000 240,000 720,000
Retail Sales Manager 570,000 360,000 1,250,000
Project Manager 500,000 300,000 960,000
Store Manager 530,000 300,000 1,200,000
Senior KAM 650,000 460,000 960,000
Nordic KAM 600,000 400,000 760,000
KAM 520,000 360,000 780,000
Account Manager/NAM 500,000 320,000 960,000
Junior KAM 370,000 300,000 530,000

32 33Nordic Consumer Sector Salary Survey 2016 Nordic Consumer Sector Salary Survey 2016
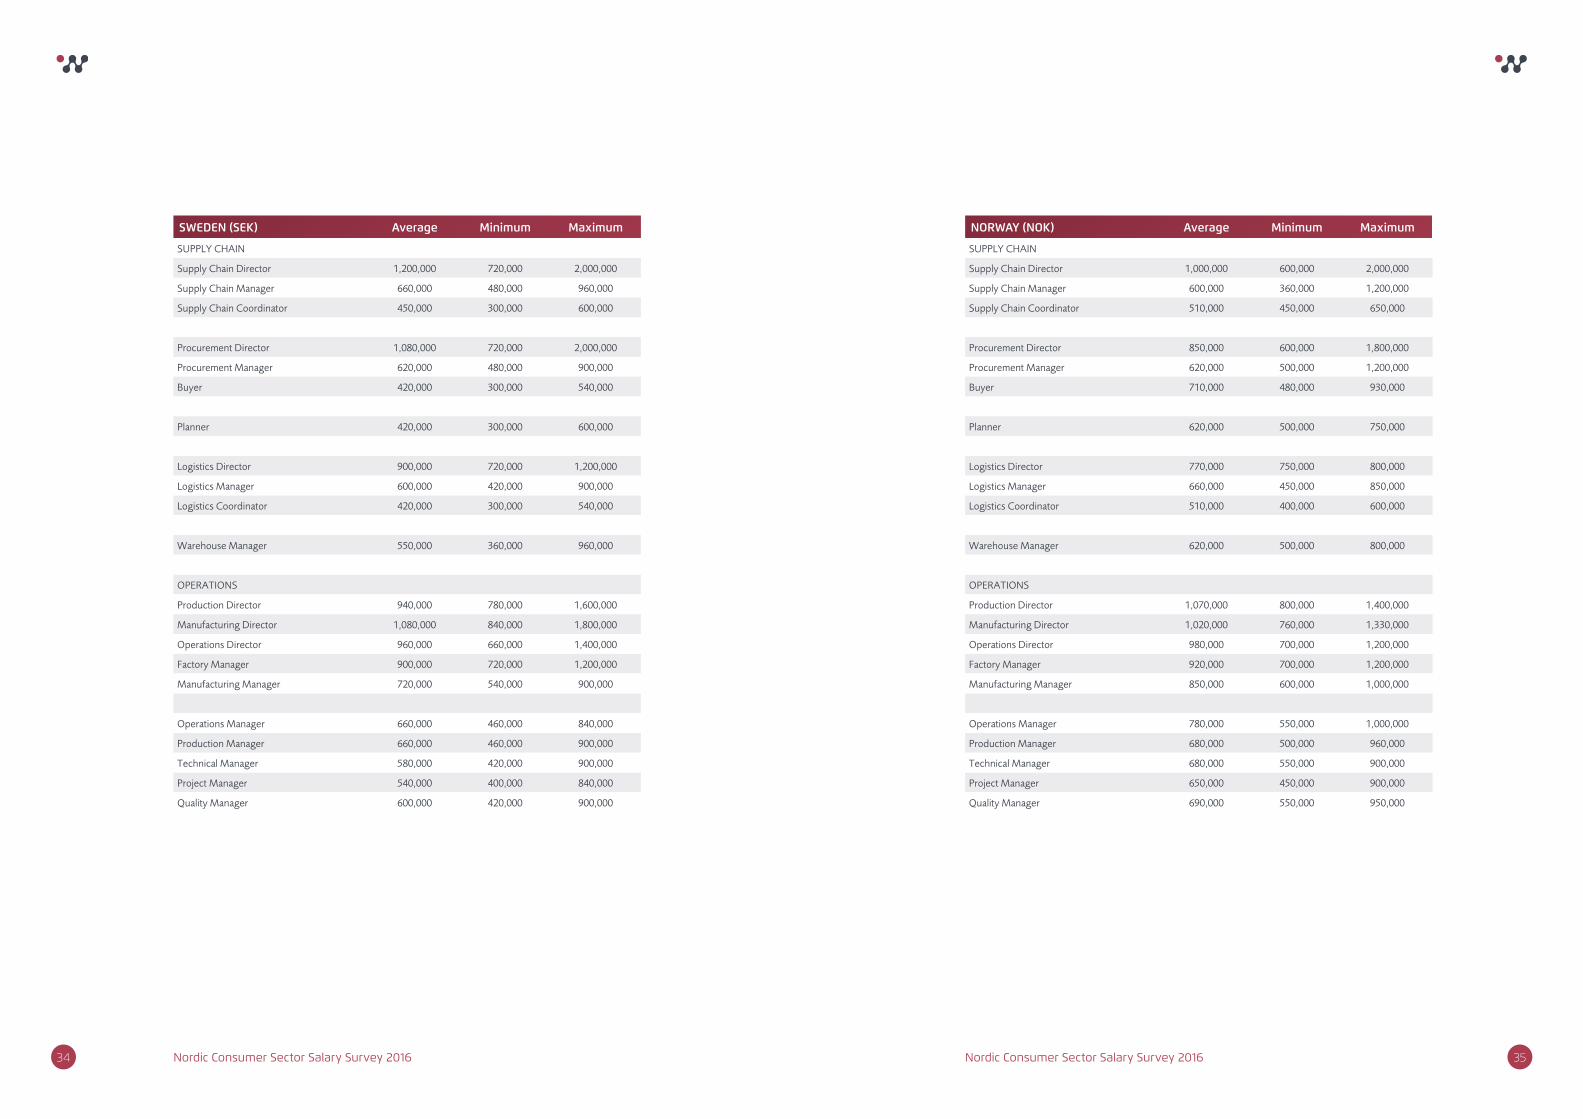
4.4 Operations
NORWAY (NOK) Average Minimum Maximum
Sales Director 990,000 800,000 2,000,000
International Sales Director 990,000 800,000 2,000,000
Head of Sales 735,000 550,000 950,000
Nordic Sales Manager 735,000 550,000 1,100,000
Country Manager 810,000 540,000 1,500,000
Business Development Manager 640,000 400,000 1,000,000
Sales Manager 610,000 550,000 1,000,000
Export Manager 600,000 450,000 750,000
Regional Sales Manager 690,000 580,000 900,000
Field Sales Manager 670,000 550,000 750,000
Area/District Sales Manager 620,000 500,000 700,000
Sales Executive - - -
Retail Sales Manager 400,000 350,000 650,000
Project Manager 590,000 480,000 1,200,000
Store Manager 400,000 360,000 800,000
Senior KAM 800,000 550,000 1,200,000
Nordic KAM 800,000 600,000 1,100,000
KAM 750,000 500,000 950,000
Account Manager/NAM 735,000 400,000 800,000
Junior KAM 500,000 400,000 600,000
DENMARK (DKK) Average Minimum Maximum
SUPPLY CHAIN
Supply Chain Director 1,230,000 600,000 2,000,000
Supply Chain Manager 840,000 460,000 900,000
Supply Chain Coordinator 530,000 480,000 600,000
Procurement Director 980,000 540,000 1,300,000
Procurement Manager 730,000 390,000 1,080,000
Buyer 730,000 350,000 900,000
Planner 580,000 290,000 660,000
Logistics Director 990,000 840,000 1,140,000
Logistics Manager 740,000 400,000 950,000
Logistics Coordinator 510,000 420,000 700,000
Warehouse Manager 690,000 450,000 840,000
OPERATIONS
Production Director 1,310,000 610,000 1,360,000
Manufacturing Director 950,000 600,000 1,300,000
Operations Director 980,000 720,000 1,300,000
Factory Manager 840,000 450,000 1,100,000
Manufacturing Manager 790,000 500,000 1,100,000
Operations Manager 770,000 500,000 900,000
Production Manager 780,000 400,000 900,000
Technical Manager 650,000 590,000 800,000
Project Manager 650,000 340,000 1,000,000
Quality Manager 890,000 500,000 1,000,000
34 35Nordic Consumer Sector Salary Survey 2016 Nordic Consumer Sector Salary Survey 2016
NORWAY (NOK) Average Minimum Maximum
SUPPLY CHAIN
Supply Chain Director 1,000,000 600,000 2,000,000
Supply Chain Manager 600,000 360,000 1,200,000
Supply Chain Coordinator 510,000 450,000 650,000
Procurement Director 850,000 600,000 1,800,000
Procurement Manager 620,000 500,000 1,200,000
Buyer 710,000 480,000 930,000
Planner 620,000 500,000 750,000
Logistics Director 770,000 750,000 800,000
Logistics Manager 660,000 450,000 850,000
Logistics Coordinator 510,000 400,000 600,000
Warehouse Manager 620,000 500,000 800,000
OPERATIONS
Production Director 1,070,000 800,000 1,400,000
Manufacturing Director 1,020,000 760,000 1,330,000
Operations Director 980,000 700,000 1,200,000
Factory Manager 920,000 700,000 1,200,000
Manufacturing Manager 850,000 600,000 1,000,000
Operations Manager 780,000 550,000 1,000,000
Production Manager 680,000 500,000 960,000
Technical Manager 680,000 550,000 900,000
Project Manager 650,000 450,000 900,000
Quality Manager 690,000 550,000 950,000
SWEDEN (SEK) Average Minimum Maximum
SUPPLY CHAIN
Supply Chain Director 1,200,000 720,000 2,000,000
Supply Chain Manager 660,000 480,000 960,000
Supply Chain Coordinator 450,000 300,000 600,000
Procurement Director 1,080,000 720,000 2,000,000
Procurement Manager 620,000 480,000 900,000
Buyer 420,000 300,000 540,000
Planner 420,000 300,000 600,000
Logistics Director 900,000 720,000 1,200,000
Logistics Manager 600,000 420,000 900,000
Logistics Coordinator 420,000 300,000 540,000
Warehouse Manager 550,000 360,000 960,000
OPERATIONS
Production Director 940,000 780,000 1,600,000
Manufacturing Director 1,080,000 840,000 1,800,000
Operations Director 960,000 660,000 1,400,000
Factory Manager 900,000 720,000 1,200,000
Manufacturing Manager 720,000 540,000 900,000
Operations Manager 660,000 460,000 840,000
Production Manager 660,000 460,000 900,000
Technical Manager 580,000 420,000 900,000
Project Manager 540,000 400,000 840,000
Quality Manager 600,000 420,000 900,000

36 37Nordic Consumer Sector Salary Survey 2016 Nordic Consumer Sector Salary Survey 2016
SWEDEN (SEK) Average Minimum Maximum
HR Director 1,010,000 720,000 3,000,000
HR Manager 600,000 540,000 900,000
HR Consultant 480,000 360,000 600,000
HR Coordinator 360,000 300,000 420,000
Finance Director 980,000 720,000 1,440,000
Finance Manager 780,000 600,000 900,000
Finance Controller 540,000 420,000 780,000
Finance Assistant 540,000 420,000 780,000
4.5 Finance & HR
For more information on the Nordic Consumer Sector Salary Survey 2016, please contact Nigel Wright Group via the details below:
5. Contact detailsDENMARK (DKK) Average Minimum Maximum
HR Director 850,000 500,000 2,000,000
HR Manager 620,000 320,000 1,140,000
HR Consultant 550,000 360,000 720,000
HR Coordinator 440,000 360,000 600,000
Finance Director 970,000 790,000 1,500,000
Finance Manager 670,000 340,000 1,040,000
Finance Controller 550,000 350,000 750,000
Finance Assistant 370,000 280,000 450,000
NORWAY (NOK) Average Minimum Maximum
HR Director 780,000 580,000 1,600,000
HR Manager 650,000 500,000 940,000
HR Consultant 570,000 450,000 800,000
HR Coordinator 500,000 440,000 650,000
Finance Director 900,000 700,000 1,400,000
Finance Manager 710,000 500,000 980,000
Finance Controller 620,000 450,000 960,000
Finance Assistant 450,000 450,000 450,000
NEWCASTLE UPON TYNELLOYDS COURT78 GREY STREETNEWCASTLE UPON TYNENE1 6AF
T: +44 (0)191 222 0770
TEESSIDEESHTON SUITE, OFFICE 2WYNYARD PARK HOUSE,WYNYARD AVENUE,WYNYARD,TS22 5TB
T: +44 (0)1740 661000
LONDON20 ST DUNSTAN’S HILL,LONDON,EC3R 8HL
T: +44 (0)207 405 3921
LAUSANNERUE CAROLINE 21003 LAUSANNESWITZERLAND
T: +41 (0)21 311 2376
AMSTERDAM
PARNASSUSWEG 819 1082 LZ AMSTERDAM THE NETHERLANDS
T: +31 (0)20 799 7730
PARIS29 RUE DE BASSANO 75008 PARISFRANCE
T: +33 1 76 73 29 80
DÜSSELDORFKÖNIGSALLEE 2B5TH FLOOR40212 DÜSSELDORFGERMANY
T: +49 211 882 42 364
MADRIDPALACIO DE MIRAFLORESCARRERA DE SAN JERÓNIMO, 15 - 2ª28014 MADRIDSPAIN
T: +34 91 788 3172
COPENHAGENHAVNEGADE 39 1058 COPENHAGEN KDENMARK
T: +45 7027 8601
ÅRHUSVÆRKMESTERGADE 2, 17. ETAGE8000 AARHUS CDENMARK
T: +45 7027 8601
STOCKHOLMGREV TUREGATAN 3, 4 TR 114 46 STOCKHOLMSWEDEN
T: +46 (0)8 400 264 35
MALMÖHIGH COURT,MALMÖHUSVÄGEN 1,211 18 MALMÖ,SWEDEN
T: +46 (0)8 400 264 35
OSLODRONNING EUFEMIAS GATE 160191 OSLONORWAY
T: +47 238 97 773
HELSINKIBULEVARDI STREET 700120 HELSINKIFINLAND
T: +46 8 400 264 35
GOTHENBURGWORLD TRADE CENTER,MÄSSANS GATA 18,P.O BOX 5243,402 24 GOTHENBURG
T: +46 (0)8 400 264 35

38 Nordic Consumer Sector Salary Survey 2016