Nordic Consumer Sector Salary Survey 2015
34
Nordic Consumer Sector Salary Survey 2015 What are you worth?
-
Upload
nigel-wright-group -
Category
Career
-
view
28 -
download
5
Transcript of Nordic Consumer Sector Salary Survey 2015

Nordic Consumer Sector Salary Survey 2015
What are you worth?


Welcome to Nigel Wright Group’s Nordic Consumer sector Salary Survey 2015, which is specifi cally designed to provide you with an insight into the salaries commanded by professionals within this sector in the region. Nigel Wright Group has earned a strong reputation within the consumer sector across Europe for providing a high quality recruitment service that is built upon our industry knowledge. We consider it important to continue to bring you relevant, useful information that you can use, in an accessible format.
Introduction
This survey has been compiled from the responses of over 1,500 respondents who completed
our online questionnaire in the fi nal quarter of 2014/2015 as well as data from our own extensive
database of candidates.
The survey represents a cross-section of respondents with the following profi le:
• Location: Sweden (41%), Denmark (40%), Norway (19%);
• Consumer sub-sector: Food & Drink, Health & Beauty, Consumer Electronics, DIY, Fashion and
Apparel, Household Products, Luxury Goods, OTC pharmaceuticals, Leisure & Entertainment,
Media and publishing, Retail and E-commerce and Travel;
• Male 76%, female 24%;
• Average age 40;
• 83% of respondents are educated to degree level or above;
• 25% have been in their current position less than one year; 44% for between one and three
years, 20% for between three and fi ve years and 11% for more than fi ve years.
The fi rst three sections of the report focus on some general points of interest, such as levels of
satisfaction, respondents’ motivation to change jobs as well as attitudes towards skill shortages
and the qualities needed to succeed in the industry. This is followed by discipline-specifi c analyses
of salaries.
For further information or to discuss your recruitment requirements please
contact us on +45 7027 8601 and you will be directed to a consultant
specialising in your area. For more information on our services please visit
www.nigelwright.com.

04 Nordic Consumer Sector Salary Survey 2015
Contents
1. Non-monetary indicators 06
1.1 Weekly hours worked by country 06
1.2 Job satisfaction by job level 07
1.3 Job satisfaction by discipline 08
1.4 Job satisfaction by country 09
1.5 Factors infl uencing a change of roles 10
1.6 Factors infl uencing a change of roles by country 11
1.7 Methods used to search for a new role 12
1.8 Methods used to search for a new role by country 13
2. Salaries, benefi ts and bonuses 14
2.1 Average percentage of salary increase received and expected by level 15
2.2 Average percentage of salary increase received and expected by discipline 16
2.3 Average percentage of salary increase received and expected by country 17
2.4 Importance of benefi ts as part of a remuneration package 18
2.5 Importance of benefi ts as part of a remuneration package by gender 19
2.6 Importance of benefi ts as part of a remuneration package by country 20
2.7 Benefi ts and bonus entitlement by country 21
2.8 Comparison of bonus rates by country 22
3. Skills and attitudes 24
3.1 Skill shortages by country 25
3.2 Qualities needed to be successful by country 26
4. Analysis of salaries in relation to discipline 27
4.1 Executive 28
4.2 Marketing 29
4.3 Sales 30
4.4 Operations 31
5. Contact information 32

05Nordic Consumer Sector Salary Survey 2015
Respondent’s Profi le
76%MALE
BASE:
1500+PLUS DATABASE
Average age: 40
83%Are educated to
degree level or above
40%DENMARK
19%NORWAY
41%SWEDEN
24%FEMALE
06 Nordic Consumer Sector Salary Survey 2015
1. Non-monetary indicators
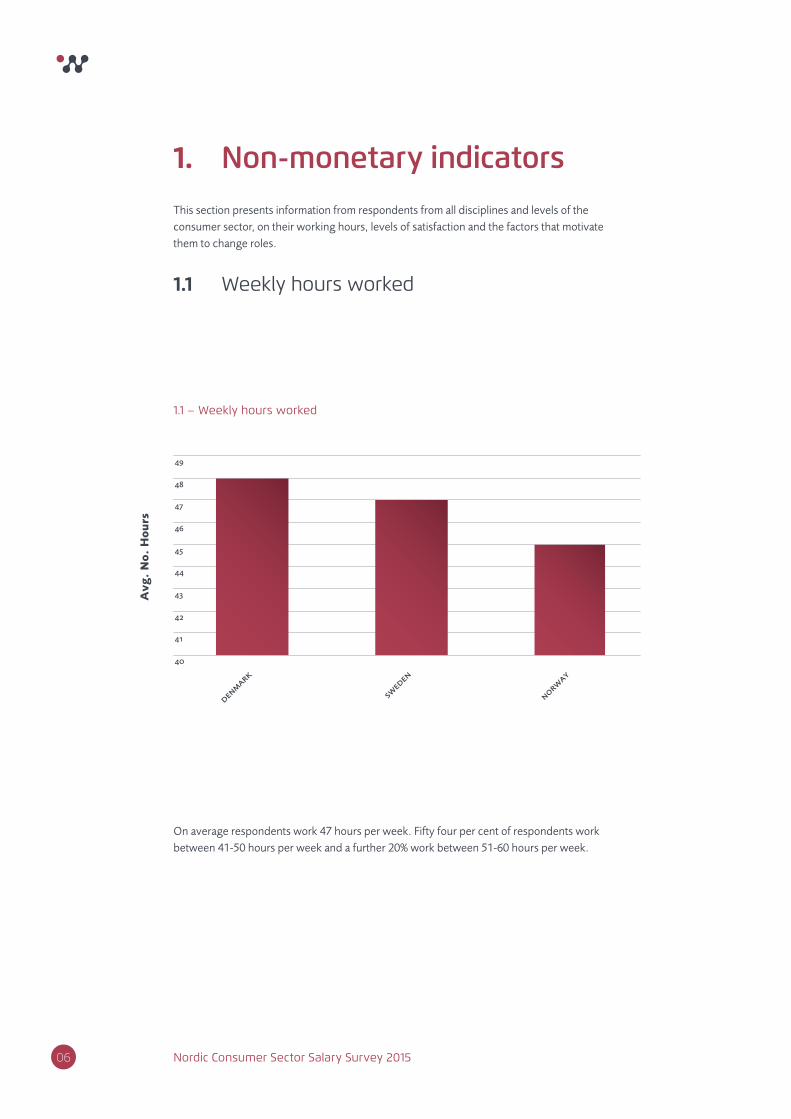
1.1 Weekly hours worked
This section presents information from respondents from all disciplines and levels of the
consumer sector, on their working hours, levels of satisfaction and the factors that motivate
them to change roles.
On average respondents work 47 hours per week. Fifty four per cent of respondents work
between 41-50 hours per week and a further 20% work between 51-60 hours per week.
1.1 – Weekly hours worked
40
41
42
43
44
45
46
47
48
49
denmark
swed
en
norway
Avg
. N
o.
Ho
urs

Nordic Consumer Sector Salary Survey 2015 07
The results show a fairly satisfi ed workforce in the Nordic consumer sector. Although there are
variations between the strength of respondents’ satisfaction, over 75% of respondents at each
level of their organisations rated themselves as being between satisfi ed and very satisfi ed. This is
encouraging for HR professionals and managers alike. The challenge, then, is to fi nd out why the
other 25% is dissatisfi ed and what can be done to change this, whilst ensuring that the satisfaction
level of the rest of the workforce is maintained.
1.2 Job satisfaction by job level
1.2 – Job satisfaction by job level
Respondents were asked to rate their level of job satisfaction on the following fi ve-point scale:
1 = very dissatisfi ed
2 = moderately dissatisfi ed
3 = satisfi ed
4 = moderately satisfi ed
5 = very satisfi ed
0
5
10
15
20
25
30
35
40
Level of satisfaction
% o
f re
spo
nd
en
ts
executive
management
non management
very s
atisfie
d
moderate
ly sa
tisfie
d
satis
fied
moderate
ly d
issatis
fied
very d
issatis
fied

8 Nordic Consumer Sector Salary Survey 2015
Interestingly, respondents working within sales and operations seem to have similar levels of
satisfaction, with 80% and 81% respectively, rating themselves as satisfi ed to very satisfi ed in their
jobs. Marketing respondents are slightly less satisfi ed, with 74% rating themselves as satisfi ed
and above.
Respondents were asked to rate their level of job satisfaction on the following fi ve-point scale:
1 = very dissatisfi ed
2 = moderately dissatisfi ed
3 = satisfi ed
4 = moderately satisfi ed
5 = very satisfi ed
1.3 Job satisfaction by discipline
1.3 – Job satisfaction by discipline
0
5
10
15
20
25
30
35
40
Level of satisfaction
% o
f re
spo
nd
en
ts
marketing
sales
operations
very s
atisfie
d
moderate
ly sa
tisfie
d
satis
fied
moderate
ly d
issatis
fied
very d
issatis
fied

9Nordic Consumer Sector Salary Survey 2015
In the Nordic countries, the Norwegians were the happiest, with 83% of respondents indicating
they were satisfi ed as a minimum. Danes and Swedes had an equal level of satisfaction, with 78%
of respondents from both countries saying they were satisfi ed or above.
Respondents were asked to rate their level of job satisfaction on the following fi ve-point scale:
1 = very dissatisfi ed
2 = moderately dissatisfi ed
3 = satisfi ed
4 = moderately satisfi ed
5 = very satisfi ed
1.4 Job satisfaction by country / territory
1.4 – Job satisfaction by country / territory
0
5
10
15
20
25
30
35
40
Level of satisfaction
% o
f re
spo
nd
en
ts
denmark
sweden
norway
very s
atisfie
d
moderate
ly sa
tisfie
d
satis
fied
moderate
ly d
issatis
fied
very d
issatis
fied

10 Nordic Consumer Sector Salary Survey 2015
Respondents were asked to select the top three factors that would motivate them to change jobs,
both within their current company (internally) and to another organisation (externally). In the
Nordic region, although money is important, promotion, the opportunity to gain new skills and
experience new challenges are more persuasive factors for employees considering their
next move.
1.5 Changing jobs Factors infl uencing a change of roles internally or externally to another organisation.
1.5 – Factors infl uencing a change of roles
0
10
20
30
40
50
60
70
80
Factors
% o
f re
spo
nd
en
ts
internal
external
new c
hallen
ges
promotio
n
gain n
ew sk
ills
incre
ased re
muneratio
n
achieve a
n impr
oved w
ork-li
fe ba
lance
differ
ent e
nvironmen
t/cult
ure
flex
ible w
orkin
g
change disc
iplin
e
change locatio
n
11Nordic Consumer Sector Salary Survey 2015
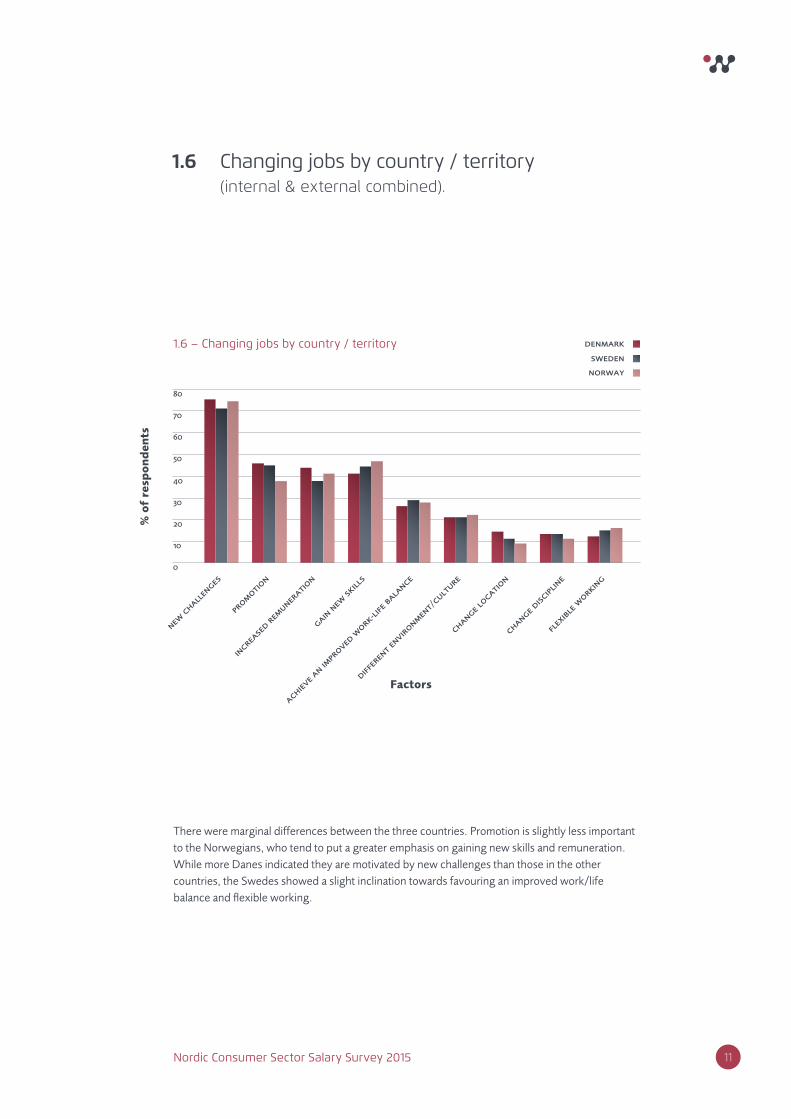
There were marginal differences between the three countries. Promotion is slightly less important
to the Norwegians, who tend to put a greater emphasis on gaining new skills and remuneration.
While more Danes indicated they are motivated by new challenges than those in the other
countries, the Swedes showed a slight inclination towards favouring an improved work/life
balance and fl exible working.
1.6 Changing jobs by country / territory (internal & external combined).
1.6 – Changing jobs by country / territory
0
10
20
30
40
50
60
70
80
Factors
% o
f re
spo
nd
en
ts
denmark
sweden
norway
new c
hallen
ges
promotio
n
gain n
ew sk
ills
incre
ased re
muneratio
n
achieve a
n impr
oved w
ork-li
fe ba
lance
differ
ent e
nvironmen
t/cult
ure
flex
ible w
orkin
g
change disc
iplin
e
change locatio
n

012 Nordic Consumer Sector Salary Survey 2015
Respondents were asked to select all methods that they would utilise when looking for a new role.
As the respondents surveyed were mainly people already known to Nigel Wright Recruitment, it
is no surprise that our website is ranked highly. Social networking is also an increasingly important
method for Nordic job seekers. Using Social Networking sites to identify job opportunities now
surpasses the use of traditional media such as newspapers and magazines.
1.7 Methods used to search for a new role
1.7 – Methods used to search for a new role
0
10
20
30
40
50
60
70
80
Methods
% o
f re
spo
nd
en
ts
nigel
wrig
ht rec
ruitm
ent w
ebsit
e
socia
l net
work
ing si
tes
direct a
ppro
aches to
empl
oyers
online j
ob board
s
recru
iters
inte
rnal b
ullet
in bo
ards/
empl
oyer i
ntranet
s
other
regio
nal or l
ocal new
spape
rs
trade m
agazines

Nordic Consumer Sector Salary Survey 2015 013
It is interesting to see the cultural differences in the methods used by job seekers from the
different Nordic countries. Using job boards, for example, is a more popular job search method
in Norway than it is in Denmark and Sweden. The Swedes and Danes are more likely to make
direct approaches to prospective employers, while the Norwegians and Swedes rely more on
social networking.
1.8 Methods used to search for a new role by country / territory
1.8 – Methods used to search for a new role by country / territory
0
10
20
30
40
50
60
70
80
Methods
% o
f re
spo
nd
en
ts
denmark
sweden
norway
nigel
wrig
ht rec
ruitm
ent w
ebsit
e
socia
l net
work
ing si
tes
direct a
ppro
aches to
empl
oyers
online j
ob board
s
recru
iters
inte
rnal b
ullet
in bo
ards/
empl
oyer i
ntranet
s
other
regio
nal or l
ocal new
spape
rs
trade m
agazines

Nordic Consumer Sector Salary Survey 2015
Salary, benefi ts and bonuses

15Nordic Consumer Sector Salary Survey 2015
This section presents information from respondents from all disciplines and levels of the consumer
sector on their salaries, benefi ts and bonuses.
As part of their last salary review respondents received, on average, a 4.1% increase. Overall,
respondents were expecting slightly less (4.0%) in their next salary review.
2.1 Average percentage of salary increase received and expected by level
2.1 – Average percentage of salary increase received and expected by level
0
1
2
3
4
5
6
Level
% o
f sa
lary
in
cre
ase
received
expected
exec
utive
managemen
t
non-managem
ent

16 Nordic Consumer Sector Salary Survey 2015
When we consider salary increase by discipline, on average, those working in Operations roles
experienced a slightly lower rate than those working in Sales and Marketing.
2.2 Average percentage of salary increase received and expected by discipline
2.2 – Average percentage of salary increase received and expected by discipline
0
1
2
3
4
5
6
Discipline
% o
f sa
lary
in
cre
ase
received
expected
sale
s
market
ing
opera
tions

17Nordic Consumer Sector Salary Survey 2015
The Danes aren’t expecting much fl uctuation in their annual remuneration review this year.
Norwegians indicated they were slightly positive about their next review, with an anticipated 0.3%
average increase. Swedes, on the other hand, are expecting a slight decline of around 0.5%.
2.3 Average percentage of salary increase received and expected by country
2.3 – Average percentage of salary increase received and expected by country
0
1
2
3
4
5
6
Country
% o
f sa
lary
in
cre
ase
received
expected
denmark
swed
en
norway

18 Nordic Consumer Sector Salary Survey 2015
Respondents were asked to select their top three preferences towards benefi ts and bonuses.
Across the Nordic region, the attractiveness of fl exible working is very high, with 62% of
respondents’ selecting it in their top three most important benefi ts. This was followed by personal
bonuses (59%) and employer contributory pensions (37%).
2.4 Importance of benefi ts as part of a remuneration package
2.4 – Importance of benefi ts as part of a remuneration package
0
10
20
30
40
50
60
70
80
Benefits
% o
f re
spo
nd
en
ts
flex
ible w
orkin
g
bonus -
pers
onal
empl
oyer c
ontribu
tory
pensio
n
company c
ar and pe
trol
bonus -
compa
ny per
form
ance
healt
h insu
rance
holiday e
ntitle
ment
share
opt
ions
car all
owance
non-contr
ibuto
ry pe
nsion
career
brea
ks/sa
bbatic
als
company c
ar with
out pet
rol
childcare
all
owances

19Nordic Consumer Sector Salary Survey 2015
Men value bonuses, share options and a company car as important factors in their overall
benefi ts package while women tend to see greater value in benefi ts such as fl exible working
and healthcare.
2.5 Importance of benefi ts as part of a remuneration package by gender
2.5 – Importance of benefi ts as part of a remuneration package by gender
0
10
20
30
40
50
60
70
80
% o
f re
spo
nd
en
ts
male
female
Benefits
flex
ible w
orkin
g
bonus -
pers
onal
empl
oyer c
ontribu
tory
pensio
n
company c
ar and pe
trol
bonus -
compa
ny per
form
ance
healt
h insu
rance
holiday e
ntitle
ment
share
opt
ions
car all
owance
non-contr
ibuto
ry pe
nsion
career
brea
ks/sa
bbatic
als
company c
ar with
out pet
rol
childcare
all
owances

20 Nordic Consumer Sector Salary Survey 2015
This table highlights the variations in the preferences of employees across the different countries
towards benefi ts and bonuses. Although, generally, there is a great deal of consistency in
respondents’ preferences, the key differences included: pensions being more important to Danes
than they are to Norwegians and Swedes; company bonuses being a bigger factor for Norwegians
than anywhere else and Swedes favouring holiday allowances more so than their Nordic peers.
2.6 Importance of benefi ts as part of a remuneration package by country
2.6 – Importance of benefi ts as part of a remuneration package by country
0
10
20
30
40
50
60
70
80
% o
f re
spo
nd
en
ts
Benefits
flex
ible w
orkin
g
bonus -
pers
onal
empl
oyer c
ontribu
tory
pensio
n
company c
ar and pe
trol
bonus -
compa
ny per
form
ance
healt
h insu
rance
holiday e
ntitle
ment
share
opt
ions
car all
owance
non-contr
ibuto
ry pe
nsion
career
brea
ks/sa
bbatic
als
company c
ar with
out pet
rol
childcare
all
owances
denmark
sweden
norway

21Nordic Consumer Sector Salary Survey 2015
Overall 82% of those surveyed receive some form of benefi t or bonus. The most common being a
pension (81%), a company performance related bonus (65%) and healthcare (59%).
2.7 Benefi ts and bonus entitlement by country
2.7 – Benefi ts and bonus entitlement by country
0
10
20
30
40
50
60
70
80
90
% o
f re
spo
nd
en
ts
Benefits
pensio
n
healt
hcare
company b
onus
pers
onal bonus
car all
owance
guarante
ed bo
nus
denmark
sweden
norway
22 Nordic Consumer Sector Salary Survey 2015
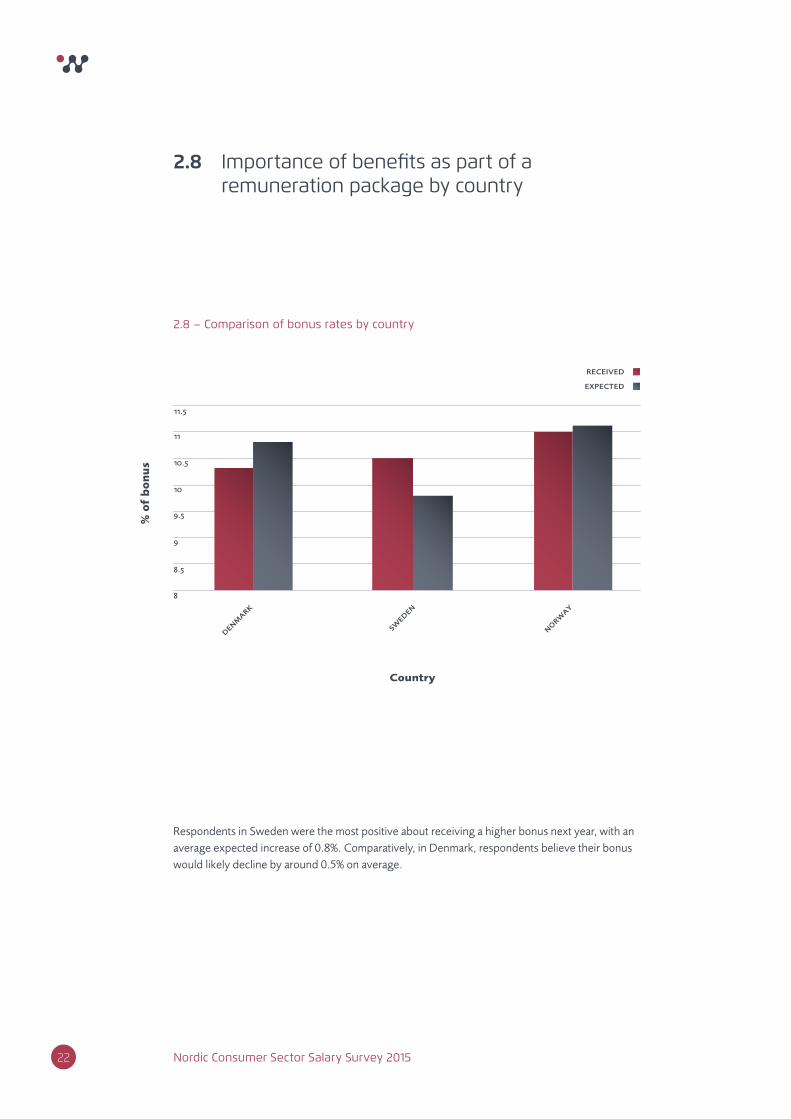
Respondents in Sweden were the most positive about receiving a higher bonus next year, with an
average expected increase of 0.8%. Comparatively, in Denmark, respondents believe their bonus
would likely decline by around 0.5% on average.
2.8 Importance of benefi ts as part of a remuneration package by country
2.8 – Comparison of bonus rates by country
8
8.5
9
9.5
10
10.5
11
11.5
% o
f b
on
us
Country
denmark
swed
en
norway
received
expected

23Nordic Consumer Sector Salary Survey 2015
Guaranteed bonuses were generally expected to rise this year across the different countries,
with the exception of Denmark. With regards to company bonuses, respondents are confi dent
of incremental gains in all countries. Only personal bonuses are expected to decline on average
in the region, with particularly big anticipated falls in Denmark and Norway. The Swedes are
the exception, with respondents indicating that they feel positive about bonus increases across
all categories.
GUARANTEED BONUS
COMPANY BONUS
PERSONAL BONUS
GUARANTEED BONUS Denmark Sweden Norway Average
Received 12.1 10.4 12.0 11.5
Expected 12.0 12.2 12.2 12.1
+/- -0.1 1.8 0.2 0.6
COMPANY BONUS Denmark Sweden Norway Average
Received 10.6 9.9 10.6 10.4
Expected 10.8 10.1 10.7 10.5
+/- 0.2 0.2 0.1 0.2
PERSONAL BONUS Denmark Sweden Norway Average
Received 9.8 8.8 10.8 9.8
Expected 8.1 9.1 10.0 9.1
+/- -1.7 0.3 -0.8 -0.7

Skills and attitudesNordic Consumer Sector Salary Survey 2015
25Nordic Consumer Sector Salary Survey 2015
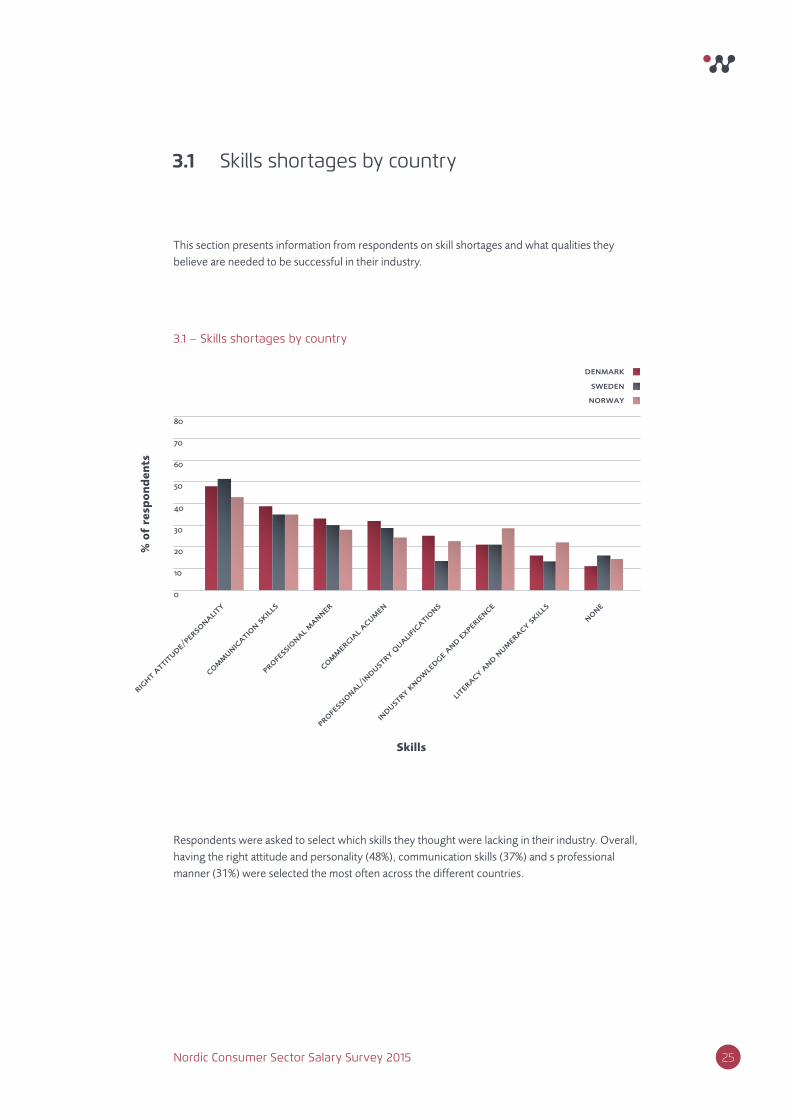
This section presents information from respondents on skill shortages and what qualities they
believe are needed to be successful in their industry.
Respondents were asked to select which skills they thought were lacking in their industry. Overall,
having the right attitude and personality (48%), communication skills (37%) and s professional
manner (31%) were selected the most often across the different countries.
3.1 Skills shortages by country
3.1 – Skills shortages by country
0
10
20
30
40
50
60
70
80
Skills
% o
f re
spo
nd
en
ts
denmark
sweden
norway
right a
ttitu
de/pe
rsonalit
y
profe
ssio
nal manner
communicatio
n skill
s
commercia
l acumen
profe
ssio
nal/in
dustry
qualif
icatio
ns
indust
ry k
nowle
dge and ex
perie
nce
liter
acy and n
umeracy s
kills
none

26 Nordic Consumer Sector Salary Survey 2015
Again, respondents were asked to select what qualities they felt were the most important for those
working in the consumer sector. Being fl exible and adaptable (65%) and action oriented (65%)
were considered the most signifi cant, followed by professional knowledge (62%).
3.2 Qualities needed to be successful by country
3.2 – Qualities needed to be successful by country
0
10
20
30
40
50
60
70
80
Skills
% o
f re
spo
nd
en
ts
denmark
sweden
norway
action o
riente
d
flex
ible/
adaptabl
e
excel
lent c
ommunicato
r
profe
ssio
nal know
ledge
confiden
t/se
lf-a
ssure
d
self
-start
er
self
-suff
icien
t/in
depen
dent
great n
etw
orker
cope w
ell u
nder fi
nancial i
nsecurit
y

Analysis of salaries in relation to discipline
Nordic Consumer Sector Salary Survey 2015
The Nigel Wright Nordic salary review is based on the details we hold on our database and is supplemented
with the information we have collected as part of this survey. Whist we make every possible attempt to
ensure the data we provide is accurate it should be notes that salary levels can vary depending on company
size, industry sector and the availability of candidates in a specifi c discipline.
28 Nordic Consumer Sector Salary Survey 2015
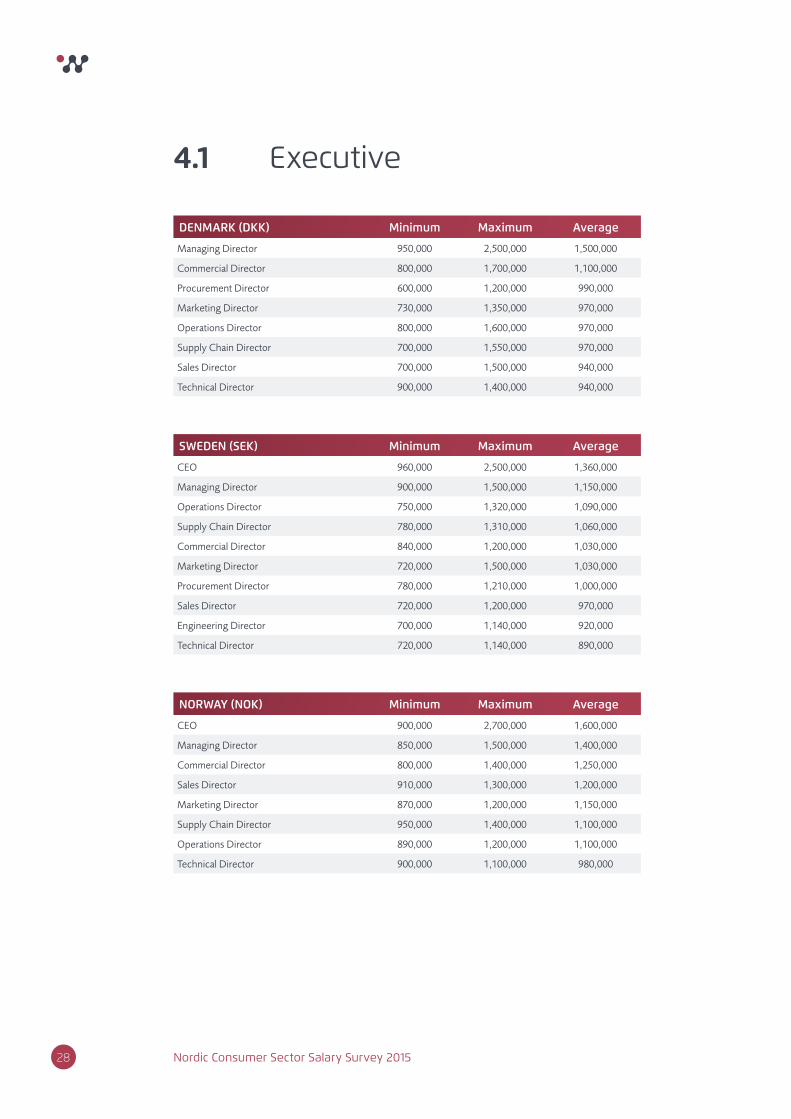
4.1 Executive
DENMARK (DKK) Minimum Maximum Average
Managing Director 950,000 2,500,000 1,500,000
Commercial Director 800,000 1,700,000 1,100,000
Procurement Director 600,000 1,200,000 990,000
Marketing Director 730,000 1,350,000 970,000
Operations Director 800,000 1,600,000 970,000
Supply Chain Director 700,000 1,550,000 970,000
Sales Director 700,000 1,500,000 940,000
Technical Director 900,000 1,400,000 940,000
SWEDEN (SEK) Minimum Maximum Average
CEO 960,000 2,500,000 1,360,000
Managing Director 900,000 1,500,000 1,150,000
Operations Director 750,000 1,320,000 1,090,000
Supply Chain Director 780,000 1,310,000 1,060,000
Commercial Director 840,000 1,200,000 1,030,000
Marketing Director 720,000 1,500,000 1,030,000
Procurement Director 780,000 1,210,000 1,000,000
Sales Director 720,000 1,200,000 970,000
Engineering Director 700,000 1,140,000 920,000
Technical Director 720,000 1,140,000 890,000
NORWAY (NOK) Minimum Maximum Average
CEO 900,000 2,700,000 1,600,000
Managing Director 850,000 1,500,000 1,400,000
Commercial Director 800,000 1,400,000 1,250,000
Sales Director 910,000 1,300,000 1,200,000
Marketing Director 870,000 1,200,000 1,150,000
Supply Chain Director 950,000 1,400,000 1,100,000
Operations Director 890,000 1,200,000 1,100,000
Technical Director 900,000 1,100,000 980,000
29Nordic Consumer Sector Salary Survey 2015
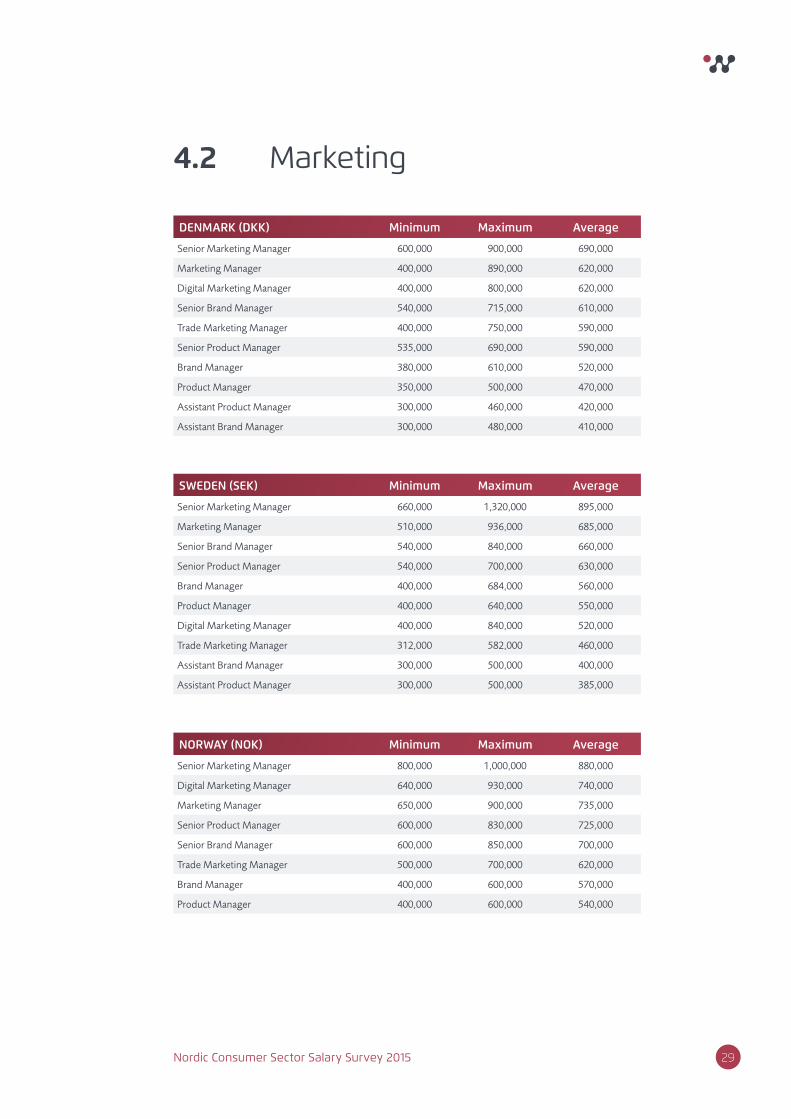
4.2 Marketing
SWEDEN (SEK) Minimum Maximum Average
Senior Marketing Manager 660,000 1,320,000 895,000
Marketing Manager 510,000 936,000 685,000
Senior Brand Manager 540,000 840,000 660,000
Senior Product Manager 540,000 700,000 630,000
Brand Manager 400,000 684,000 560,000
Product Manager 400,000 640,000 550,000
Digital Marketing Manager 400,000 840,000 520,000
Trade Marketing Manager 312,000 582,000 460,000
Assistant Brand Manager 300,000 500,000 400,000
Assistant Product Manager 300,000 500,000 385,000
NORWAY (NOK) Minimum Maximum Average
Senior Marketing Manager 800,000 1,000,000 880,000
Digital Marketing Manager 640,000 930,000 740,000
Marketing Manager 650,000 900,000 735,000
Senior Product Manager 600,000 830,000 725,000
Senior Brand Manager 600,000 850,000 700,000
Trade Marketing Manager 500,000 700,000 620,000
Brand Manager 400,000 600,000 570,000
Product Manager 400,000 600,000 540,000
DENMARK (DKK) Minimum Maximum Average
Senior Marketing Manager 600,000 900,000 690,000
Marketing Manager 400,000 890,000 620,000
Digital Marketing Manager 400,000 800,000 620,000
Senior Brand Manager 540,000 715,000 610,000
Trade Marketing Manager 400,000 750,000 590,000
Senior Product Manager 535,000 690,000 590,000
Brand Manager 380,000 610,000 520,000
Product Manager 350,000 500,000 470,000
Assistant Product Manager 300,000 460,000 420,000
Assistant Brand Manager 300,000 480,000 410,000
30 Nordic Consumer Sector Salary Survey 2015
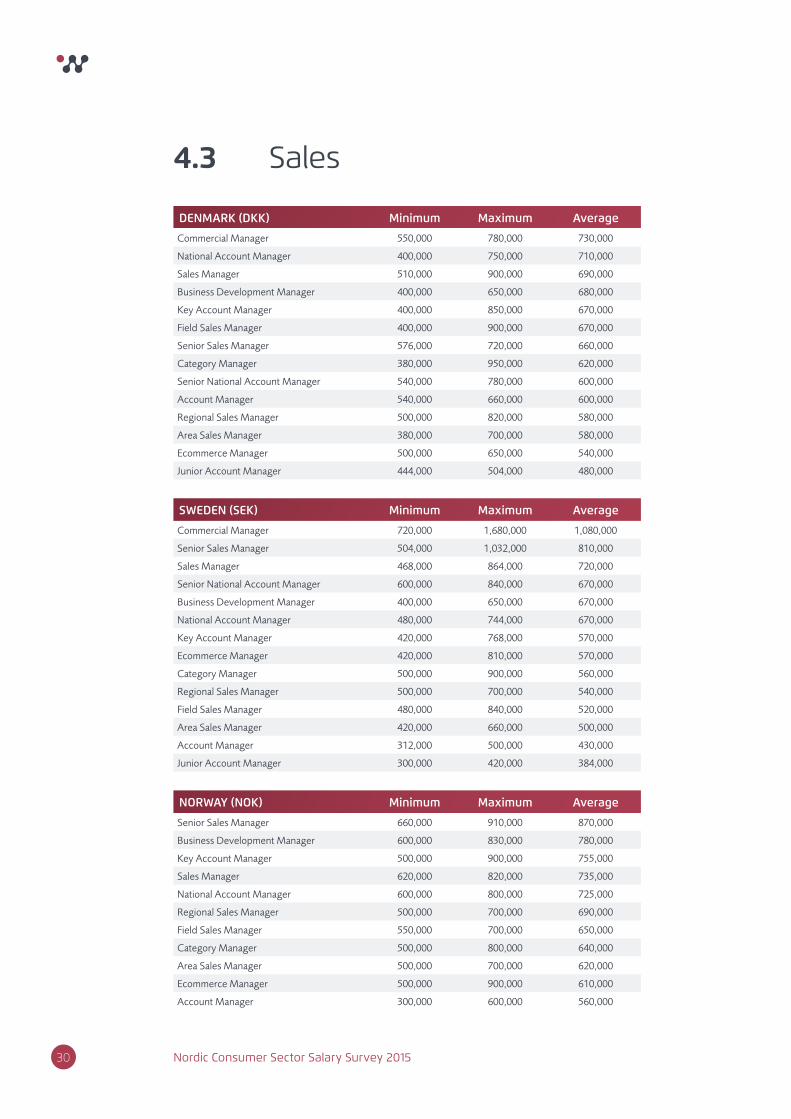
4.3 Sales
DENMARK (DKK) Minimum Maximum Average
Commercial Manager 550,000 780,000 730,000
National Account Manager 400,000 750,000 710,000
Sales Manager 510,000 900,000 690,000
Business Development Manager 400,000 650,000 680,000
Key Account Manager 400,000 850,000 670,000
Field Sales Manager 400,000 900,000 670,000
Senior Sales Manager 576,000 720,000 660,000
Category Manager 380,000 950,000 620,000
Senior National Account Manager 540,000 780,000 600,000
Account Manager 540,000 660,000 600,000
Regional Sales Manager 500,000 820,000 580,000
Area Sales Manager 380,000 700,000 580,000
Ecommerce Manager 500,000 650,000 540,000
Junior Account Manager 444,000 504,000 480,000
SWEDEN (SEK) Minimum Maximum Average
Commercial Manager 720,000 1,680,000 1,080,000
Senior Sales Manager 504,000 1,032,000 810,000
Sales Manager 468,000 864,000 720,000
Senior National Account Manager 600,000 840,000 670,000
Business Development Manager 400,000 650,000 670,000
National Account Manager 480,000 744,000 670,000
Key Account Manager 420,000 768,000 570,000
Ecommerce Manager 420,000 810,000 570,000
Category Manager 500,000 900,000 560,000
Regional Sales Manager 500,000 700,000 540,000
Field Sales Manager 480,000 840,000 520,000
Area Sales Manager 420,000 660,000 500,000
Account Manager 312,000 500,000 430,000
Junior Account Manager 300,000 420,000 384,000
NORWAY (NOK) Minimum Maximum Average
Senior Sales Manager 660,000 910,000 870,000
Business Development Manager 600,000 830,000 780,000
Key Account Manager 500,000 900,000 755,000
Sales Manager 620,000 820,000 735,000
National Account Manager 600,000 800,000 725,000
Regional Sales Manager 500,000 700,000 690,000
Field Sales Manager 550,000 700,000 650,000
Category Manager 500,000 800,000 640,000
Area Sales Manager 500,000 700,000 620,000
Ecommerce Manager 500,000 900,000 610,000
Account Manager 300,000 600,000 560,000

31Nordic Consumer Sector Salary Survey 2015
4.4 Operations
DENMARK (DKK) Minimum Maximum Average
Factory General Manager 750,000 1,200,000 900,000
Operations Manager 700,000 1,000,000 850,000
Engineering Manager 700,000 950,000 800,000
Production Manager 600,000 950,000 800,000
Supply Chain Manager 600,000 1.000,000 800,000
Procurement Manager 550,000 950,000 750,000
Lean Manager 650,000 800,000 750,000
Quality Manager 550,000 850,000 700,000
Technical Manager 550,000 850,000 700,000
Logistics Manager 550,000 900,000 700,000
Senior Buyer 600,000 800,000 700,000
Maintenance Manager 550,000 750,000 650,000
Shift Manager 500,000 700,000 650,000
Planning Manager 600,000 750,000 650,000
PTA Manager 500,000 750,000 650,000
Buyer 500,000 700,000 600,000
Factory Controller 500,000 750,000 600,000
SWEDEN (SEK) Minimum Maximum Average
Factory General Manager 720,000 1,200,000 840,000
Procurement Manager 540,000 840,000 720,000
Supply Chain Manager 420,000 700,000 680,000
Operations Manager 600,000 900,000 670,000
Engineering Manager 560,000 800,000 670,000
Production Manager 480,000 700,000 660,000
Logistics Manager 420,000 800,000 620,000
Technical Manager 420,000 720,000 580,000
Senior Buyer 400,000 660,000 580,000
Quality Manager 420,000 780,000 540,000
Maintenance Manager 380,000 660,000 540,000
Shift Manager 400,000 600,000 500,000
Buyer 300,000 500,000 445,000
NORWAY (NOK) Minimum Maximum Average
Factory General Manager 780,000 1,200,000 940,000
Production Manager 600,000 900,000 880,000
Operations Manager 700,000 900,000 830,000
Senior Buyer 580,000 1,100,000 820,000
Technical Manager 590,000 870,000 710,000
Buyer 480,000 930,000 710,000
Quality Manager 550,000 750,000 690,000
Procurement Manager 530,000 830,000 680,000
Supply Chain Manager 500,000 800,000 670,000
Engineering Manager 540,000 830,000 640,000
Logistics Manager 450,000 650,000 630,000

32 Nordic Consumer Sector Salary Survey 2015
For more information on the Nordic Consumer Sector Salary Survey 2015, please contact the Marketing department at Nigel Wright Recruitment on the details below:
Nigel Wright RecruitmentLloyds Court78 Grey StreetNewcastle upon TyneNE1 6AF
T: +44 (0)191 222 0770E: [email protected]: www.nigelwright.com
5. Contact details
NEWCASTLE UPON TYNELLOYDS COURT78 GREY STREETNEWCASTLE UPON TYNENE1 6AF
T: +44 (0)191 222 0770
LONDONPALLADIA CENTRAL COURT25 SOUTHAMPTON BUILDINGSLONDONWC2A 1AL
T: +44 (0)207 405 3921
ABERDEENRIVERSIDE HOUSERIVERSIDE DRIVEABERDEENAB11 7LHSCOTLAND
T: +44 (0)1224 224 830
COPENHAGENHAVNEGADE 39 1058 COPENHAGEN KDENMARK
T: +45 7027 8601
AARHUSINGE LEHMANNS GADE 10, 6. SAL8000 AARHUS CDENMARK
T: +45 7027 8601
STOCKHOLMGREV TUREGATAN 3, 4 TR 114 46 STOCKHOLMSWEDEN
T: +46 (0)8 400 264 35
MALMÖKÄRLEKSGATAN 2A211 45 MALMÖSWEDEN
T: +46 (0)8 400 264 35
OSLODRONNINGEUFEMIAS GATE 160191 OSLONORWAY
T: +47 238 97 773
HELSINKIBULEVARDI STREET 700120 HELSINKIFINLAND
T: +45 7027 8601
PARIS29 RUE DE BASSANO 75008 PARISFRANCE
T: +33 1 76 73 29 80
DÜSSELDORFGRAF-ADOLF PLATZ 1540213 DÜSSELDORFGERMANY
T: +49 211 882 42 364
MADRIDPALACIO DE MIRAFLORESCARRERA DE SAN JERÓNIMO, 15 - 2ª28014 MADRIDSPAIN
T: +34 91 788 3172