Nonpolar chemically bonded stationary phases in liquid ... · Liquid Chromatography", Boston, USA,...
151
Nonpolar chemically bonded stationary phases in liquid chromatography : synthesis and application to solvophobic and ion-pair systems Citation for published version (APA): van de Venne, J. L. M. (1979). Nonpolar chemically bonded stationary phases in liquid chromatography : synthesis and application to solvophobic and ion-pair systems. Technische Hogeschool Eindhoven. https://doi.org/10.6100/IR106510 DOI: 10.6100/IR106510 Document status and date: Published: 01/01/1979 Document Version: Publisher’s PDF, also known as Version of Record (includes final page, issue and volume numbers) Please check the document version of this publication: • A submitted manuscript is the version of the article upon submission and before peer-review. There can be important differences between the submitted version and the official published version of record. People interested in the research are advised to contact the author for the final version of the publication, or visit the DOI to the publisher's website. • The final author version and the galley proof are versions of the publication after peer review. • The final published version features the final layout of the paper including the volume, issue and page numbers. Link to publication General rights Copyright and moral rights for the publications made accessible in the public portal are retained by the authors and/or other copyright owners and it is a condition of accessing publications that users recognise and abide by the legal requirements associated with these rights. • Users may download and print one copy of any publication from the public portal for the purpose of private study or research. • You may not further distribute the material or use it for any profit-making activity or commercial gain • You may freely distribute the URL identifying the publication in the public portal. If the publication is distributed under the terms of Article 25fa of the Dutch Copyright Act, indicated by the “Taverne” license above, please follow below link for the End User Agreement: www.tue.nl/taverne Take down policy If you believe that this document breaches copyright please contact us at: [email protected] providing details and we will investigate your claim. Download date: 09. Feb. 2021
Transcript of Nonpolar chemically bonded stationary phases in liquid ... · Liquid Chromatography", Boston, USA,...

Nonpolar chemically bonded stationary phases in liquidchromatography : synthesis and application to solvophobicand ion-pair systemsCitation for published version (APA):van de Venne, J. L. M. (1979). Nonpolar chemically bonded stationary phases in liquid chromatography :synthesis and application to solvophobic and ion-pair systems. Technische Hogeschool Eindhoven.https://doi.org/10.6100/IR106510
DOI:10.6100/IR106510
Document status and date:Published: 01/01/1979
Document Version:Publisher’s PDF, also known as Version of Record (includes final page, issue and volume numbers)
Please check the document version of this publication:
• A submitted manuscript is the version of the article upon submission and before peer-review. There can beimportant differences between the submitted version and the official published version of record. Peopleinterested in the research are advised to contact the author for the final version of the publication, or visit theDOI to the publisher's website.• The final author version and the galley proof are versions of the publication after peer review.• The final published version features the final layout of the paper including the volume, issue and pagenumbers.Link to publication
General rightsCopyright and moral rights for the publications made accessible in the public portal are retained by the authors and/or other copyright ownersand it is a condition of accessing publications that users recognise and abide by the legal requirements associated with these rights.
• Users may download and print one copy of any publication from the public portal for the purpose of private study or research. • You may not further distribute the material or use it for any profit-making activity or commercial gain • You may freely distribute the URL identifying the publication in the public portal.
If the publication is distributed under the terms of Article 25fa of the Dutch Copyright Act, indicated by the “Taverne” license above, pleasefollow below link for the End User Agreement:www.tue.nl/taverne
Take down policyIf you believe that this document breaches copyright please contact us at:[email protected] details and we will investigate your claim.
Download date: 09. Feb. 2021


NONPOLAR CHEMICALLY BONDED STATIONARY PHASES IN LIQUID CHROMATOGRAPHY
SYNTHESIS AND APPLICATION TO SOL VOPHOBIC AND ION-PAIR SYSTEMS
PROEFSCHRIFT
TER VERKRIJGING VAN DE GRAAD VAN DOCTOR IN DE TECHNISCHE WETENSCHAPPEN AAN DE TECHNISCHE HOGESCHOOL EINDHOVEN, OP GEZAG VAN DE RECTOR MAGNIFICUS, PROF. IR. J. ERKELENS, VOOR EEN COMMISSIE AANGEWEZEN DOOR HET COLLEGE VAN DEKANEN IN HET OPENBAAR TE VERDEDIGEN OP
VRIJDAG 14 SEPTEMBER 1979 TE 16.00 UUR
DOOR
JOANNES LANDRICUS MARIA VAN DE VENNE
GEBOREN TE ECHT
© 1979 by J.L.M. van de Venne, Eindhoven, lhe Netherlands
ORUK: WIBRO HELMONO

Dit proefschrift is goedgekeurd
door de promotoren
Prof.Dr.Ir. C.A.M.G. Cramers
en
Prof.Dr. J.F.K. Huber

aan Selma

to the cover:
Irregular microporous silica grain,
used as support material for the
nonpolar chemically bonded stationary
phase.
magnification: ± 10,000 X

The work described in this thesis was financially
supported by DSM Research, Geleen, the Netherlands.

Author's publications, dealing with subjects describe~ in
this thesis:
J.L.M. van de Venne, J.L.H.M. Hendrikx, R.S. Deelder;
"Retention behaviour of carboxylic acids in reversed phase
column liquid chromatography".
presented at the "12th International Symposium on
Chromatography", Baden-Baden, september 1978.
J . Ch r omatogr. 167 (1978) 1.
R.S. Deelder, H.A.J. Linssen, A.P. Konijnendijk, J.L.M.
van de Venne; "A study on the retention mechanism in
reversed phase ion-pair chromatography of amines and
amino acids on bonded phases".
presented at the "4th International Symposium on Column
Liquid Chromatography", Boston, USA, may 1979.
d. Chrorratogr. (1979) , in press.
A.P. Konijnendijk, J.L.M. van de Venne;
"Evaluation of ion-pair mechanisms in reversed phase
liquid chromatography by a recycling system".
to be presented at the "14th International Symposium
Advances in Chromatography", Lausanne, september 1979.
J. Chromatogr. (1979), in press.
J.L.M. van de Venne, J.P.M. Rindt, G.J.M.M. Coenen;
"Characterization of a thermally and chemically modified
silica surface by infrared spectroscopy using the mull
technique" .
J . Coll. and I nter face Sci ., submitted for publication.
J.L.M. van de Venne, J.P.M. Rindt, G.J.M.M. Coenen,
C.A.M.G. Cramers; "Synthesis of a nonpolar chemically
bonded stationary phase with low residual hydroxyl group
content".
Chromatographia , submitted for publication.

Contents
GENERAL INTRODUCTION
Literature
CHAPTER 1 CONCENTRATION AND CONFIGURATION OF
HYDROXYL GROUPS ON SILICEOUS SURFACES,
A LITERATURE SURVEY
1.1 Introduction
1.2 Determination of the surface
hydroxyl group concentration
Dehydr ation o f the s ilica
Che mical convers i on o f silano l
group s
I s otope exchange methods
1.3 The surface hydrox yl group
configuration
1.4 Literature
CHAPTER 4 CHARACTERIZATION OF A THERMALLY AND
CHEMICALLY l10DIF I ED SILICA SURFACE
BY INFRARED SPECTROSCOPY USING
THE MULL TECHNIQUE
2 . 1 Introduction
2.2 Experimental
Ma te rial s and Equipment
Sample modification
I n frared sample preparation
2.3 Results and Discussion
Ev aluation of t he pressed dis k
11
16
19
19
21
23
23
26
27
28
31
31
3 4
34
34
35
36
tec hnique 36
The mull technique 39
Dehydr ation of the silica su r face 40
Estimation of the numbe r of
unattainab le s i lano l gr oups by
deuterium exchang•
2.4 Conclusions
2.5 Literature
42
44
46
7

CHAPTER 3 SYNTHESIS OF A NONPOLAR CHElHCJI.LLY BONDED STATIONARY PHASE NITH LOW
RESIDUAL HYDROXYL GROUP CONTENT 49
3.1 Introduction 49
3.2 Alkylsilane modified silica supports 52
3.3 Experimental 56
Chemical s and Mat e ri als 56
Silanizat ion proc edure 57
Cha r acte r iza ti on of the modified
silica 58
3.4 Results and Discussion 59
Specific sur face and por e st r uc t ur e 59
Su r fa ce coverag e 62
Residual hydroxy l gr oup concentration 68
3.5 Conclusions 69
3.6 Literature 69
CHAPTER 4 RETENTION BEHAVIOUR OF CARBOXYLIC ACIDS IN
REVERSED PHASE SOLVOPHOBIC CHROMATOGRAPHY 73
8
4.1 Introduction 73
4.2 Theory 75
I oni c equilibri a 75
I nfluence of t he ionic strength on
pKa value s 79
I nfluence of methanol on pH and
p Ka values 80
4.3 Experimental 83
Apparatus 83
Chemicals 85
Pr oc e dures 85
4.4 Results and Discussion 86
Influence of p H* and me t hanol c ontent
of the mobile p ha s e
Influe nce of the ion i c strength
Influenc e of the temperature
4.5 Conclusions
4. 6 Literature
86
95
98
101
101

CHAPTER 5 THE RETENTION MECHANISM OF CARBOXYLIC
ACIDS AND AMINES IN REVERSED PHASE
ION-PAIR CHROMATOGRAPHY 103
5.1 Introduction 103
5.2 Theory 106
I on - pair partition systems 106
I on - pai r ads orption systems 107
5. 3 Experimental 113
Appa ratus 113
Ch e micals 113
Proce dures 115
5.4 Results and Discussion 117
Influence of t he concentration o f
amphiphilic ions and buffer
constituents in the mobi l e phase 117
The adso r ption isotherms 123
Evaluation of experimental r esults 123
Rec yc l ing expe r iments 129
De t e rmination of ion - pai r complex
s tability constants in t h e aqueous
p hase 139
Appli cation o f expe r imental data to
other ion - pair concepts
5.5 Conclusions
5.6 Literature
SUMMARY
SAMENVATTING
CURRICULUM VITAE
DANKHOORD
140
142
143
147
149
151
152
9

General introduction
At the present time amorphous highly porous silica is
the most versatile adsorbent in liquid chromatography.
Its characteristics like inertness, hardness, high sample
capacity and cheapness make it advantageous above other
available adsorbents 1• The surface silanol groups give
the silica favourable adsorptive properties. Silica can
serve either as a stationary phase itself or as a support
for physically coated stationary phases or chemically
bonded stationary phases. Silica has been used as a
stationary phase for a long time (liquid-solid adsorption
chromatography) . To enlarge the application of the micro
porous silica, it has been coated with liquid stationary
phases of different polarity (liquid-liquid partition
chromatography) 2-
4•
As early as 1950 Howard and Martin realized the
necessity of permanently modifying the siliceous support
in liquid chromatography 5• The original work, however,
remained unnoticed for a long time. Only during the last
five years have chemically bonded stationary phases
superseded the use of liquid-liquid partition systems.
The latter were limited in their scope and inconvenient
in practice because of the mutual solubility of the
mobile and the stationary phases.
Nowadays a variety of organic molecules of different
polarity have been bonded chemically to the silica
11

surface by a reaction with the surface silanol groups 6•
These stationary phases are insoluble in most solvents
unless extreme conditions are chosen. They are
mechanically stable. Gradient elution is entirely
feasible over the total range of solvent polarities with
a fast return to original conditions. Many reviews have
been published about the preparation and application of
these chemically bonded stationary phases 7-
9• A wide
range of chemically bonded phases have been commercially
available ever since 10 .
Despite the reactivity of the modifying reagents the
surface silanol groups cannot be converted quantitative
ly11,12. Owing to steric hindrance between bulky reagents
or unaccessibility of silanol groups in micropores,
roughly half of the original present silanol groups can
be converted. The residual hydroxyl groups at the base of
the bonded organic moiety give the modified silica
surface a bifunctional character. Depending on the phase
systems and the functionality of the sample solutes, the
column efficiency can be adversely affected. A drawback
of the commercially available materials is the presence
of these residual hydroxyl groups. The surface coverage of
bonded organic molecules varies considerably among the
various suppliers 10 .
In this study we have tried to decrease the residual
hydroxyl group concentration. At the same time it is
tried to keep the concentration of bonded organic
molecules constant. We have studied the influence of a
partial condensation of surface silanol groups, prior to
the surface modification, on the final residual hydroxyl
group concentration and the concentration of bonded
organic molecules. From the average space requirement of
the modifier molecules it can be concluded that no
surface density can be reached equal to the original
hydroxyl group density. As long as the surface hydroxyl
group density exceeds the maximum attainable concen
tration of bonded organic molecules, no remarkable
decrease in the surface carbon content should be found.
12

At the same time a decrease in the residual polarity can
be expected from the partial dehydration procedure as
presumed before 13•
In chapter 1 a literature survey is given on the con
centrations and configurations of hydroxyl groups on
silica surfaces. Methods used to determine the silanol
group density are discussed. The hydroxyl group concen
tration is needed to calculate the degree of conversion
of the surface modification.
Infrared spectroscopy has proved to be a valuable tool
in studying adsorbed and chemisorbed species at solid
surfaces 14•
15• We have applied this technique to follow
the dehydration process of the silica surface and to
control the bonding of the organic modifier and the
residual hydroxyl group concentration. As we are dealing
with chromatographic adsorbents in a particle range of
5 - 10 ~m some problems are encountered in the sample
preparation. Generally applied sampling techniques could
not be used owing to a severe scattering and sample
distortion. In chapter 2 a description is given of a
modified mull sample preparation. This mull technique
appeared to be preferable to the frequently used pressed
disk technique.
Chapter 3 describes the modification of a siliceous
chromatographic adsorbent into a hydrophobic adsorbent.
Octyldimethylchlorosilane and octylmethyldichlorosilane
are chemically bonded to the silica surface. The effect
of a thermal treatment prior to the modification is
systematically studied. The surface coverages have been
calculated from elemental analysis. The influence on the
pore structure is given. The amount of residual hydroxyl
groups is given by infrared spectroscopy. A comparison
with commercial materials is made.
Nonpolar chemically bonded stationary phases are
generally used with water-methanol or water-acetonitrile
mixtures as mobile phases. Special selectivities can be
achieved by adding small amounts of tetrahydrofuran,
dimethylsulfoxide or some other water soluble solvents 16 •
13

1hese phase systems are referred to as "reversed phase"
systems. Nonpolar as well as polar compounds can be
separated in reversed phase systems. The separation of
ionogenic sample solutes was restricted to ion-exchange
chromatography. The efficiency of ion-exchange columns,
however, is substantially lower than the efficiency of
silica or modified silica packed columns, owing to, the
polymer matrix of the i6n-exchange resins. Chemically
bonded ion-exchange stationary phases on siliceous
supports are little used. Consequently phase systems have
been developed for the separation of ionogenic compounds
with nonpolar chemically bonded stationary phases.
In this study the retention behaviour of weak acids
and bases is studied. Most samples belong to the phenyl
alanine metabolism. In clinical chemistry there is a great
interest in these classes of compounds.
Two essentially distinct forms of reversed phase liquid
chromatography are . extremely popular today. In the more
conventional form an aqueous buffer which may contain a
highly water-soluble solvent is used as the mobile phase.
Chapter 4 deals with these so-called "hydrophobic" or
"solvophobic" chromatographic systems 17 ' 18 • The retention
is due to nonpolar interactions between the sample solute
and the nonpolar stationary phase. This interaction can be
influenced by a great number of parameters resulting in
various tools to change the retention and the selectivity.
Ionic equilibria play an important part in these systems.
When the pKa value of the sample solutes lies between the
pH range applicable to the stationary phase (2<pH<8), the
pH is the first parameter to be chosen to change the
solute retention. In case the sample solutes have differ
ent pKa values, great variations in selectivity can be
accomplished. For most samples consistent effects are
achieved by variations in the ratio of water versus
organic solvent of the mobile phase. Smaller effects are
achieved by variations in ionic strength and the tempera~
ture . The retention behaviour of carboxylic acids is
studied in these systems. Since the amines studied have
14

pK values greater than 8, the influence of the pH is of a minor interest.
Recently it has been demonstrated that the retention
of ionized solutes on nonpolar chemically bonded statio
nary phases can be substantially increased by adding a
amphiphilic ion to the aqueous mobile phase19 . This new
branch of reversed phase liquid chromatography will be
treated in chapter 5. The method is referred to as ion
pair chromatography 20 , paired-ion chromatography 21 , soap
chromatography 22 , solvent generated ion-exchange chroma
tography23 and, recently, haeteric chromatography 24 .
This idea followed that of ion-pair liquid-liquid
partition chromatography introduced by Schill and co
workers25. They' were the first to apply t heir ion-pair
extraction techniques to modern liquid chromatography.
Here, the charged solute in the polar aqueous phase
combines with a lipophylic ion and is extracted as an
ion-pair to a nonpolar or moderately polar organic phase.
However, some doubts exist on the retention mechanism
for reversed phase ion-pair chromatography on alkyl
modified silicas 26 . Several authors state that com
plexation of the charged solute with a amphiphilic ion
of opposite charge in the mobile phase is the leading
mechanism. The neutral complex is retarded by the
stationary phase by nonpolar interactions20 124 . A second
theory starts with the explanation that an adsorption o f
the amphiphilic ion preceeds the complexat ion wi t h the
sample solute. Thereby the stationary phase can act as
an ion-exchanger and the retention is mainly due to
ionogenic interactions 221 23 ' 27128 . The retention
behaviour of carboxylic acids and amines in reversed
phase ion-pair chromatography with neat aqueous buffers
is studied. The influence of the amphiphilic ion con
centration and the ionic strength is examined.
Ex periments are described to discriminate between the
postulates mentioned.
15

LITERATURE
,1. L.R. Snyder; Principles of Adsorption Chromatography,
Marcel Dekker, New York, 1968.
2. J.J. Kirkland (ed.); Modern Practice of Liquid
Chromatography, Wiley Interscience, New York, 1971.
3. L.R. Snyder, J.J. Kirkland; An Introduction to Modern
Liquid Chromatography, Wiley Interscience, New York,
1975.
4. Z. Deyl, K. Macek, J. Janak (eds.); Liquid Column
Chromatography, A Survey of Modern Techniques and
Applications, Elsevier, Amsterdam, 1975.
5. G .A. Howard, A. J.P. Martin; Biochem. J. 46 (1950:)
532.
6. E~ Grushkal €ed.); Bonded Stationary Phases; in Cllrz:eoma
tography; Ann Arbor Science, Ann Arbor, M&~h, USA,
1974.
7. V. RehAk, E~ Smolkova; Chromatographia ! (1976) 219.
8. E. Grushka, E.J. Kikta; AnaL Chem . .!2_ (1~]:17) 100l4A.
9. H. Colin, G .. Guiochon; J. Chromatogr. 141 (1977) 289.
10. R.E. Majors; J. Chromatogr. Sci . .!_2 (1977} 334.
11. P .A. Bristow'; Liquid Chromatography in PPactice, HETP,
Handforth, Cheshike, UK, 197;6,, page 65-66.
12. P. Roumeliotis, K.K. Unger; J •. Chromatogr. 149 (1978)
211.
13. R.P.W. Scott, P. Kucera; J. Chromatogr. Sci. 13 (1975}
337.
14. L.H. Littl.e; Infrared Spectra of Adsorbed Species,
Academic Press, London, 1966.
15. M.L. Hair;; Infrared Spectroscopy in Surface Chemistry,
Marcel Dekker, New York, 1967.
16. S.R. Bakalyar, R.Mcilwrick, E. Roggendorf; J.
Chromatogr. 142 (1977) 353.
17. C. Horvath, W. Melander, I. Molnar; Anal. Chern. 49
( 1977) 142.
18. C. Horvath, W. Melander; J. Chromatogr. Sci. 15 (1977)
393.
16

19. D.P. Wittmer, N.O. Nuessle, W.G. Haney; Anal. Chern .
.!2 (1975) 1422.
20. D. Westerlund, A. Theodorsen; J. Chromatogr. 125
(1976) 89.
21. Paired Ion Chromatography; Waters Associates Inc.
Millford, Mass~ USA, 1975.
22. J.H. Knox, G.R. Laird; J. Chromatogr. 122 (1976) 17.
23. J.C. Kraak, K.M. Jonker, J.F.K. Huber; J. Chromatogr.
142 (1977) 671.
24. C. Horvath, W. Melander, I. Molnar, P. Molnar; Anal.
Chern. 49 (1977) 2295.
25. S. Eksborg, G. Schill; Anal. Chern. i2 (1973) 2092.
26. R. Gloor, E.L. Johnson; J. Chromatogr. Sci. 15 (1977)
413.
27. P.T. Kissinger; Anal. Chern. ~ (1977) 883.
28. J.L.M. van de Venne, J.L.H.M. Hendrikx, R.S. Deelder;
J. Chromatogr. 167 (1978) 1.
17

CHAPTER 1
Concentration and configuration of hydroxyl groups on siliceous surfaces, a literature survey
1.1 INTRODUCTION
The si l ica sur face exhibit s free i
vicinal and geminal hydroxyl
gr oups , part ly hydr oge n bonded .
Expe r i me n tal techniqu e s f or
det~rmining the sur f ace s ilanol
group concentr ation ar e discus s ed . - 2 A value of 4.8 OH nm i s adopted .
S tudie s abou t the hydroxy l group
configura ti on are still c ontra
dicto ry.
Siliceous adsorbents for liquid chromatography are
usually prepared by polycondensation and precipitation
from solutions of orthosilicic acid, metalsilicate s or
alkoxysilicates 1-
3• Pyrogenic silicas prepared by flame
hydrolysis of silicon halides are rarely ~sed as ad
sorbents in liquid chromatography. Particle size, specif
ic surface and pore size distribution can be determined
by variations in the poly condensation and precipitation
steps. The amorphous silicas, used in liquid chromato
graphy, vary in specific surface from 500 - 10 m2 with
mean pore size diameters of 5 - 500 nm. The adsorption
characteristics, however, are mainly determined by the
number, the distribution and reactivity of the surface
19
silanol groups. The nature of silicas has been discussed
in many reviews and publications 4-
6•
Three modifications of crystalline silica exist:
quartz, tridymite and cristobalite. Although the latter
two are metastable at temperatures below 800°C they are
found because the modifications are hardly intercon
vertible. According the crystallographic modification and
the crystal surface orientation the surface density of -2 hydroxyl groups varies from 4.6 - 9.6 nm
(8- 16 ~mole m- 2 ) 7 •
The noncrystalline materials are characterized by a
partially random packing of silicon atoms, tetrahedrally
surrounded by four oxygen atoms. Amorphous silicas are
mostly compared with a distorted S-tridymite or S
cristobalite structure 8-
10• Depending on the hydration
degree of the silica surface hydroxyl groups (= silanol
groups) and siloxane bridges are found at this surface.
They determine the adsorption properties together with
the pore structure.
An enormous growth in the understanding of the silica
surface is caused by the application of infrared
spectroscopy 11• Since amorphous silica can be easily
pressed into thin transparant pellets, transmission
spectroscopy has been applied. These studies demonstrate
that the surface contains, firstly, free vibrating
hydroxyl groups without interactions with other surface
molecules. These hydroxyl groups are referred to as "free
hydroxyl groups" or "isolated hydroxyl groups". Secondly,
hydroxyl groups adjacent to each other are found at the
surface as well. They are denominated either "vicinal
hydroxyl groups", if one surface silicon atom carries one
hydroxyl group, or "geminal hydroxyl groups" if one
surface silicon atom carries two hydroxyl groups. If a
surface silicon atom is not bonded to any hydroxyl group
it will be linked to another silicon atom by a "siloxane
bridge".
The surface silanol groups can also be subdivided into
free vibrating hydroxyl groups and hydrogen bonded
20

hydroxyl groups. This hydrogen binding can exist between
adjacent hydroxyl groups or between a silanol group and
an adsorbed water molecule. Owing to its hygroscopic
properties under atmospheric conditions, silica is always
covered with a layer of adsorbed water molecules. The
different hydroxyl group configurations are compiled in
figure 1.1.
A
B
FREE
H I
0
FREE
VICINAL
~ --0 I
H I
0 I
H I
·o
H H I I 0 0 ' /
GEMINAL
/
H ·---- 0
H
I ' 0 H I
HYDROGEN BONDED
0 / '
SILOXANE BRIDGE
Figuur 1.1. Sur f ace hydroxyl group configurations
subdivided a) according their bond with surface silicon
atoms , b) according a possible hydrogen bonding wi th
adjacent hydroxyl groups or physisorbed water .
Once the silica surface is chemically modified by
coupling organic molecules to the silanol groups, the
surface hydroxyl group concentration must be known to
calculate the degree of conversion of the origina lly
present hydroxyl groups. Various methods, used to
determine the silanol group density, will be discussed.
No definite configuration of the silanol groups is given.
1.2 DETERMINATION OF THE SURFACE HYDROXYL GROUP
CONCENTRATION
The concentration of surface hydroxyl groups can be
determined by theoretical considerations about crystal
structures 7• As we are dealing with amorphous silica, a ny
crystal structure will be distorted and only a rough
21

estimate can be made from this point of view. Therefore,
chemical and physical methods have been applied in the
past. Different results are obtained depending on the
methods that are used and the pore structure of the
silica under investigation. However, when the results of
the different authors are evaluated, it is possible to
come to an acceptable value of 4.5 - 5 OH-groups per
square nanometer. This value rests on several methods.
Dehydration, conversion of the silanol groups and iso
tope exchange have been applied. Most methods have one
problem in common. The layer of adsorbed water molecules
should be removed from the hygroscopic silica surface as
water molecules are indistinguishable from surface silanol
groups.
Neither with thermal gravimetric analysis nor with
differential thermal analysis does any point indicate a
temperature at which all physically adsorbed water is
evaporated while all surface hydroxyl groups are retained 12
• De Boer et a~ . 13 state that silica, dried at 120°C
under atmospheric conditions, has lost all physisorbed
water and still contains all the surface silanol groups.
Using a modified Karl-Fischer titration method Gallei 14
has shown that after heating at 200°C under vacuum the
silica sample still containes about 1 w/w% of physisorbed
water. Fripiat and Uytterhoeven 12 have pointed out a
temperature of 300°C for the removal of physisorbed water.
In the infrared method which they used, the distinction
between physisorbed water and surface silanol groups is
rather difficult. One can discriminate between physisorbed
water and structural hydroxyl groups in the near infrared
region. Wistuba 1 5 has found that all molecular water is
desorbed after heating the silica sample at 200°C under
vacuum. Anderson and Wickersheim 16 derived from their
near infrared spectra that physisorbed water is removed
at about 180°C.
We may conclude from the literature that a temperature
between 150 - 200°C is accepted as a drying temperature to
evaporate physisorbed water.
22

De hydration of th e sili c a After removal of all physisorbed water an annealing
temperature of 1000 - 1200°C is sufficient to condense
all surface and bulk hydroxyl groups under formation of
siloxane bridges. The total water content is a measure of
the original amount of hydroxyl groups.
A simple way to measure the water content is a gravi
metric analysis. Scott and Kucera 17 have measured the
silanol group concentration in this way as a function of
the annealing temperature . From their experiments a
hydroxyl group density of 5.6 nm- 2 has been found at
200°C. However, they have made no correction for internally
bonded hydroxyl groups which will be removed by this
procedure as well. Hence, this value will be too high. By
the same method Lowen and Broge 1 8 derived a linear
relationship between the hydroxyl group concentration and
the inverse of the absolute dehydration temperature. De
Boer et al . 8 have described a gravimetric method of
determining only the surface silanol group density. First,
samples were annealed at l000°C and rehydrated at ambient
temperature. Then the silica was dried and again annealed
at 1000°C. They found a limiting silanol group density of
4.6 nm- 2 . It should be noted, however, that all
originally present hydroxyl groups do not need to be
restored during the rehydration process especially when
one silicon atom carries two hydroxyl groups.
The surface silanol group concentrations of the dry
silica as found by various authors will be listed in
table I.l. In figure 1.2 the hydroxyl group concentrat ion
is given as function of the temperature. The Lowen-Broge
relation is incorporated in it.
Ch emical conve rsion of silanol groups
The surface silanol group concentration can be
determined through conversion by a suitable reagent.
Obviously, all surface hydroxyl groups must be attainable
for the reagent. In contradiction with a dehydration
method no interfere nce occurs with internally bonded
23

~ Table I.1. The hydroxyl group concentration of a silica surface, dried at 150 - 200°C.
method
Dehydration with
gravimetric analysis:
Chemical reactions:
with Ca(OH) 2 SOC1 2 Diazomethane
Alcohols
CH3Li
CH3Li
Isotope exchange:
with o2o 020
026
HTO
surface concentration -2 -2 OH ~mole m OH nm
9.3 5.6
7.7 4.6
13.3 8
4.85 2.91
5.16 3.1
4.6 2.76
4.8 2.88
7 4.2
8 4.8
6.6-11.7 4-7
7.7 4 ;-6---
4.8-9.6 3-6
8 4.8
reference comments
17 no correction for
bulk OH groups
8,13
18 no correction for
bulk OH groups
19 incomplete conversion
12 microporous sample
22
23 with mass spectrometric
24 analys-is-
15 with gravimetric analysis
14,22 liquid scintillation
counting

pmole m 2
7
10
Temperature
Figure 1.2. The surface hydr oxyl group concentr ation as
function o f the annealing temperature as dete rmi ned by
a) Zhuravlev et al. 20'
21 by isotope exchange and chemical
conversion, b) Berg and Unger 2 5 by chemical conversion,
c) Lowen and Broge 18 by thermogravimetric analysis.
hydroxyl groups. Boehm and Schneider 1 9 have described
reactions with calciumhydroxide, alcohols, diazomethane
and thionylchloride. The results are summarized in table
I.l. Wistuba 15 has proved that silica chlorinated with
thionylchloride still contained an equal concentration
of hydroxyl groups as bonded chloride atoms. Gallei 1 4 ,
however, reached a conversion degree of 80% with thionyl
chloride.
Higher conversion ratios can be obtained with organa
metal compounds, CH 3Li and CH 3MgLi. Fripiat and
Uytterhoeven 12 have used these reagents together with
infrared spectroscopy. For dry silica they derived a value -2 of 4.2 OH nm . Davydov et al . 2 0
'2 1 have compared Fripiats
results with the deuterium exchange method. They also
found values between 4- 5 OH nm- 2 . Unger and Gallei 14 12 2
have tried to answer the question whether a chemical
conversion of silanol groups, i.e. the use of methyl
lithium, is applicable to microporous silice ous
25

adsorbents. They have shown that hydroxyl groups located
in micropores, diameter < 10 nm, cannot be converted
quantitatively by methyllithium. For silica samples with -2
pore diameters of d > 10 nm a value of 4.8 - 5.4 OH nm
was found. For smaller pore size diameters the measured
hydroxyl group density decreased gradually.
Isotope exchange met hods
Zhuravlev et al . 2 3 have described a quantitative
determination of surface hydroxyl groups by deuterium
exchange followed by mass-spectrometric analysis. A known
amount of deuteriumoxide is brought into contact with the
silica sample. When equilibrium is reached, the ratio of
hydrogen and deuterium in the water vapour is determined.
Depending on the silica specimen, hydroxyl densities of -2 -2 4 - 7 nm are found. An average value of 4.8 OH nm is
given 24 • Wistube used the deuterium exchange method while
the sample was placed on a microbalance. After completed
exchange of hydrogen by deuterium, the weight difference
is a measure of the surface hydroxyl group concentration.
Depending on the type of silica, values from 3 - 6 OH nm-2
are found 1 5•
The most sophisticated method developed up to now is
described by Unger and Gallei 1 4'
22• An isotope exchange
reaction between the protons of the hydroxyl groups and
tritium of tritiated water is used. After equilibrium is
reached between a silica surface and an equivalent amount
of tritiated water, the water vapour and the silica are
separated and from both phases the activity is determined
in a liquid scintillation counter. Within experimental
error the direct and indirect measurements yield the same
value. For wide and medium pore silica a hydroxyl group -2 -2 density of~ 8 ~mole m = 4.8 nm is found, equal to the
values they determined with methyllithium. For microporous
silica with 5 nm < d < 10 nm the isotope exchange method -2 gives still a silanol group density of 4.8 nm . For
microporous silica with d < 5 nm even the tritium exchange
method gives a surface silanol group density substantially
26

lower than 4.8 nm- 2
The silica we have used as adsorbent or carrier for
chemically bonded stationary phases in liquid chromato
graphy is microporous. The pore size distribution is
given in chapter 3, figures 3.4 and 3.5. The average pore
size diameter is 15 rum. Unger and Gallei have performed
experiments with a similar type of adsorbent. As their
values seems most reliable and are in accordance with the
results of other investigators, we shall use a value of -2 -2 8 ~mole m 4.8 OH nm throughout this work.
1.3 THE SURFACE HYDROXYL GROUP CONFIGURATION
In addition to the determination of the hydroxyl group
density by chemical conversion, analytical measuremen ts
of surfa ce reactions with polyfunct ional reagents should
give more insight into the conformation of the surface
hydroxyl groups. The question whether the silica surface
exhibits mainly free hydroxyl groups or paired hydroxyl
groups is generally discussed. From the stoichiometry of
a polyfunctional reaction one has tried to disting uish
between the two forms. The results in this field, however,
are still contradictory.
Peri and Hensley have postulated the concept of paired
hydroxyl groups 9• The silica surface they studied
contained predominantly vicinal or geminal hydroxyl
groups. This concept was supporte d by the bifunc t ional
reaction of SiCl4 or AlCl 3 with surface silanol groups.
Free hydroxyl groups are to much apart to allow a bi
functional reaction. Even after drying at 400°C or 600°c
more than 85 % of all hydroxyl groups were paired. In a
simila r t ype of study the surface silanol group con
centrat ion of a silic a sample is determined before and
after reactions with several chlorosilanes 25 • The results
indicate clearly that trichlorosilanes had reacted mainly
bifunctional, which is only possible if the surface
cont ains a high degree of close-se t hydroxyl groups.
Dichlorosilanes, howe ver, exhibite d a monofunctiona l
27

reaction.
These results are not in agreement with the work of
Davydov et al. 24 • According to their experiments silica
contains an equal amount of free and paired hydrogen
bonded hydroxyl groups. Infrared spectroscopy has
indisputably shown the existence of both free and bonded
hydroxyl groups 11 • When silica is heated above 400°C, the
silica surface exhibits merely free hydroxyl groups (see
chapter 2). Spectroscopic investigations are in direct
contradiction with Peri's description of a silica
surface 9 •
The total surface hydroxyl group cbncentration of 4.8
nm- 2 has been explained either by a 8-cristobalite
structure with partially condensed geminal hydroxyl
groups 9 , or by a 8-tridymite structure with ruptured
Si-0-Si links 10 • De Boer et al. 8 pointed out that from
the silica density and the surface hydroxyl group con
centration no discrimination could be made between the
several crystal structures. Armistead et al. 26 have
demonstrated that fully hydroxylated silica surfaces
carry two distinct types of surface hydroxyl groups which
suggest that the surface corresponds to an array of
different crystal planes. We can conclude that up to now
the hydroxyl group configuration is not yet established
definitive.
1.4 LITERATURE
l. H.W. Kohlschiitter, U. Mihm; Kolloid-Z. z. Polym.
243 (1971) 148.
'2. K. Unger, J. Schick-Kalb, K.-F. Krebs; J. Ch~omatogr.
83 (1973) 5.
3. K. Unger, J. Schick-Kalb, B. Straube; Coll. and
Polymer Sci. 253 (1975) 658.
4. R.K. Iler; The colloid chemistry of silica and
silicates, Cornell University Press, New York, 1955.
5. C. Okkerse; in B.G. Linsen (ed): Physical and Chemical
Aspects of Adsorbents and Catalysts, Academic Press,
28

London, 1970, chapter 5.
6. K. Unger; Angew. Chemi e ~ (1972) 331.
7. H.-P. Boehm; Angew. Chemie 78 (1966) 617.
8. J.H. de Boer, J.M. Vleeskens; Proc. K. Ned. Akad .
~let. Se r. B. 61 (1958) 2.
9. J.B. Peri, A.L. Hensley; J. Phys. Chem . 2I (1968)
2926.
10. G.E. Berendsen, L. de Galan; J. Liquid Chromatogr . 1
(1978) 403.
11. See references chapter 2.
12. J.J. Fripiat, J. Uytterhoeven; J. Phys . Ch em. 66
( 1962) 800.
13. J.H. de Boer, M.E.A. Herman, J.M. Vleeskens; Proc .
K. Ned . Akad . Wet. Ser. B. 60 (1957) 44.
14. E. Gallei; Thesis , University of Technology,
Darmstadt, 1969.
15. H. Wistuba; Thesis, Ruprecht-Karl University,
Heidelberg, 1967.
16. J.H. Anderson, K.A. Wickersheim; Surface Scienc e 2
(1964) 252.
17. R.P.W. Scott, P. Kucera; J. Chromatogr . Sci . !l (1975)
337.
18. W.K. Lowen, E.C. Broge; J. Phys. Chem . ~ (1961) 16.
19. H.-P. Boehm, H. Schneider; Z. Anorg . u . A llg . Chemie
301 ( 1959) 226.
20. V.Ya. Davydov, A.V. Kiselev, L.T. Zhuravlev; Tran s.
Faraday Soc . ~ (1964) 2254.
21. L.T. Zhuravlev, A.V. Kiselev; Russ. J . Phys. Chem .
39 (1965) 235.
22. K. Unger, E. Gallei; Ko l loid- Z. Z. Pol ym.
237 (1970) 358.
23. L.T. Zhuravlev, A.V. Kiselev, V.P. Naidina, A.L.
Polyakov; Russ. J. Phys. Chern . l2 (1963) 1113, 1216.
24. V.Ya. Davydov, L.T. Zhuravlev, A.V. Kiselev;
Russ. J. Phys. Ch em. ~ (1964) 1108.
25. K. Berg, K. Unger; Kolloid- Z. Z. Po lyrn . 246 (1971 )
682.
26. C.G. Armistead, A.J. Tyler , F.H. Hamble ton, S.A.
Mitchell, J.A. Hockey; J . Phys. Chern . 73 (1969) 3947.
29

CHAPTER 2
Characterization of a thermally and chemically modified silica surface by infrared spectroscopy using the mull technique
2.1 INTRODUCTION
For character ization o f siliceou s
adsorbent s with d = 5- 10 ~m t he p
mu ll tec hnique appeared superior
to the press ed- dis k techniq~e . as
proved by SEM. Contr olled a tmo s
phe re cells are not needed . By
heating the silica up to 60 0°C
t he surface hydroxy l group con
cen trat ion decreases wi th a
pr efer ence for loss o f hydrogen
bonded hy dr ox yl gr oups . The
techn ique is eminent ly s uitable
f or chemically modified silicas .
Many infrared spectroscopic investig ations have been
carried out to elucidate the structure and properties of
silica surfaces 1-
8• Most measurements were performed in
the 4000-2000 cm- 1 region, because the silica backbone
interferes with absorption frequencies in the region of
1300-400 cm- 1 . These investigations have led to the
picture that the silica contains free hydroxyl groups -1
(3750 em ) and paired hydrogen bonded hydroxyl groups
(3650-3200 cm- 1 ), either geminal or vicinal (see figure
31

Table II.1. Infrared absorption frequencies of interest
-1 frequency em assignment literature
3750
3700-3600
3600-3400
3500-3000
2700-2725
2600-2400
2000
1875
1640
1640-1620
1640-1620
2960
2875
2925
2855
free (isolated) hydroxyl groups
weak hydrogen bonded hydroxyl
groups
strongly hydrogen bonded
hydroxyl groups
physisorbed water
free deuterium oxide groups
bonded deuterium oxide groups
sceletal Si-0 combination
sceletal Si-0 combination
sceletal Si-0 overtone
overtone physisorbed water
1-3,6,7
1-3
1-3
1-3
13,28
13,28,29
13
13
13
2,8,13
bonded geminal hydroxyl groups 2
asymetric stretching of -CH 3 group 30
symetric stretching of -CH 3 group 30
asymetric stretching of -CH2- group 30
symetric stretching of -CH2- group 30
1.1). Some frequencies of interest are given in table II.1.
Snyder 4 especially mentioned reactive hydroxyl groups
consisting of an adjacent pair of strongly hydrogen bonded
hydroxyl groups. Under atmospheric conditions molecular
water is adsorbed on the polar surface (wide band around
3400 cm- 1). Zhuravlev et al.5 - 7 have shown that an appre
ciable concentration of bulk hydroxyls, i.e. hydroxyl
groups not attainable for o2o, are normally present in
silicas (band around 3650 cm- 1). The ratio between the
surface hydroxyl group concentration and the bulk hydroxyl
group concentration depends on the pretreatment of the
sample and the porosity of the sample particles. Fripiat
et al. 8 found the same results in analogous experiments.
Organochlorosilicon compounds react with the hydroxyl
groups and create a hydrophobic silica surface 9110 •
Residual polarity is always found at the modified surface
32

as will be discussed in chapter 3 .
Infrared studies of thermally treated silica have
been performed before1'
2'
8• Most studies concerned pure,
fumed silica or silica precipitated from metalsilicate
solutions, with particle diameters of less than one
micron. Different experimental techniques are used. In
most investigations it is essential that the surface is
accessible for adsorption or desorption processes. There
fore controlled atmosphere cells with the possibility of
sample heating are needed 11'
15• Usually the silica is
pressed to thin pellets 11 2 '4
-8
• To avoid scattering in
the 4000-2000 cm- 1 region, the sample must consist of
particles smaller than 1 ~m. As we are interested in
silica with a particle diameter of 5 or 10 ~m, some
limitations occur because the surface geometry should not
be changed during the sample preparation.
A method used in the literature to avoid compression
is the depositing of the silica on an infrared trans
mitting plate either by using a slurry and evaporating
the slurry solvent or by a spray technique 1 3• The sample
can also be sandwiched between two trans parant plates to
avoid contact with any slurry liquid 1 5'
1 6• Because of the
particle size of our silica these techniques are not
applicable either. No transparant samples could be
obtained because too much silica has to be deposited on
the plates to obtain absorption bands from surface
hydroxyl groups or adsorbed water.
As a surface phenomenon is the subject of investigation
internal total reflexion methods can be taken into con
sideration. However, even when a multiple totally refecting
plate was used there was insufficient contact between
the silica particles and the multiple reflexion crystal
to obtain any spectrum. Gallei et al . 1 7 could hardly
obtain an interpretable spectrum in a similar type of
investigation, although they used 1.2 ~m a -quartz
particles.
We have developed an easy infrared sampling technique
to characterize thermally and chemically modified silica
33

with an average particle diameter of 5 or 10 pm, used as
adsorbent in liquid chromatography. Distortion of the
surface geometry is avoided. We have compared the
applicability of the pressed-disk and the mull technique.
The effect of the drying temperature and drying time on
the residual polarity of the chemically modified silica
is examined.
2.2 EXPERIMENTAL
MatePials and equipment
A chromatographic adsorbent, LiChrosorb Si-100, with
an average particle size of 5 or 10 pm and a specific 2 -1 surface of 300 m g is used (Merck, Darmstadt, G.F.R.).
Chemical modification of the silica is performed by a
reaction with monochlorodimethyloctylsilane; Deuterium
oxide, used in the isotope exchange experiments, is of
Uvasol quality, 99,75% (Merck). Polychlorotrifluoro
ethylene oil, PCTFE, (D~ 0 = 1.94, n~ 0 = 1.394) is used as
mull agent (Merck) .
The infrared spectra are recorded by means of a Hitachi
model EPI-G2 grating spectrophotometer (Hitachi, Japan). 2 Glovebags (X-17-17, I R, Cheltenham, Penn, USA) are used
to prepare infrared mull samples in a controlled atmos
phere.
Sample modification
In our study the following treatments are examined. The
silica is thermally treated at 100°C, 200°C, 400°8 and
600°C during 2, 4 and 16 hours. A vacuum of ~1 Pa is
applied. For infrared investigations 40 mg silica is
placed in a small glass tube, connected to the vacuum
system and mounted in a thermostatted oven. After the
thermal treatment the glass tube is cooled to room
temperature and, still under vacuum, placed in the glove
bag.
The attainable surface silanol groups are converted to
deuterium oxide groups by a r epeated saturation to the
34

silica surface with deuterium oxide. After heating of the
silica at 200°C, 400°C or 600°C under vacuum, the silica
containing tube was placed in liquid nitrogen and brought
in contact with deuterium oxide vapour for 60 minutes.
Then the system is evacuated and placed in the oven
at the previously fixed temperature again for 60 minutes.
The procedure is repeated 4 times, and a spectrum is
recorded. When repeating the procedure another 5 times,
no difference in the recorded spectra was observed.
Infrared sample preparation
(i) pressed- di sk technique : the silica, LiChrosorb
Si-100, is pressed to thin pellets with a diameter of -2 13 mm and a weight of 10 mg em at pressures between
50-750 kPa, in an evacuable die. It appears that
evacuation of the die does not influence the pellet
quality. Therefore in later experiments the evacuation is
deleted. For recording the spectra the pellets are placed
in a brass holder, the sample compartment being purged
with dry nitrogen. If necessary an attenuator is placed
in the reference beam.
(i i) mull technique: when using the mull technique
40 mg silica is mixed with 200 ~1 polychlorotrifluoro
ethylene. To avoid a change in the particle geometry no
grinding is applied. The mull is pressed between two
potassiumbromide crystals. The distance between the
crystals is kept constant at 0.2 mm by a Teflon spacer.
This procedure ensures a constant amount of silica in the
infrared beam, and the absorption intensities of different
samples can be compared. Ideally, the mull oil should be
transparant in the 4000-1400 cm- 1 region. Tetrachloro
ethylene, hexachlorobutadiene and polychlorotrifluoro
ethylene oil are all transparant in the region of interest
PCTFE is chosen because of its optimal refractive index
and high boiling point. During the mull preparation
evaporation of the mull agent does not occur and a con
stant ratio of silica versus mull oil (we ight vs. volume)
results. Owing to the t hick mull layer an absorption peak
35

appeares around 2300 cm- 1 A mull oil sample is placed in
the reference beam to partially offset this absorption
band. To prepare the mull under dry conditions, two
glovebags are folded one into the other. Thermally treated
silica, still kept under vacuum, is placed in the glove
bag. First the glovebag is purged with dry nitrogen
( < 25 ppm H2o) several times. Then the glass tube is
opened and the mull oil is added to the silica. Further,
to avoid any contamination of the mull, it is put between
the potassiumbromide windows in the glovebag. During
exposure of the sample to the laboratory atmosphere no
water vapour can reach the silica anymore and the sample
can be placed in the sample compartment of the
spectrophotometer.
2.3 RESULTS AND DISCUSSION
EvaZution o f the p~ess ed-disk techn i que
First, the applicability of the pressed-disk technique
was examined. Nonmodified silica has been pressed to thin
pellets at different pressures. The spectra recorded under
atmospheric conditions are represented in figure 2.1. It
is clear that pellets prepared at low pressures show bad
transparancy in the low wavelength region, which is due to
scattering. The appearance of the pellets was opalescent.
It turned out to be necessary to apply pressures of
50 - 750 kPa in the particle range o f interest to
decrease the scattering in the 4000 - 2000 cm-1 region.
At these high pressures there is every possibility that
the surface structure will be altered. Therefore, the
surface structure of the pressed disks is studied by
scanning electron microscopy. The results are given in
figure 2.2. The orginal particle contours can be recog
nized in figure 2.2a and 2.2b. However, at a pressure
needed to obtain a trans parant pellet, no particle
boundaries can be observed any more, s ee figure 2.2c .
In this case the silica particles grow together and the
structure is clearly changed. It is likely that a
36

c: 0
"' "' E "' c: <U .. 1-...
100
4000 3000 2000 1500
Wavenumber, cm-1
Figure 2.1. Pressed-disk transmission
sorb Si-100, d = 5 ~m, pellet weight p
spectra of LiChro-2 = 10 mg em The
pellets have been prepared at different pressures:
1 = 50 kPa, 2 = 100 kPa, 3 = 250 kPa, 4 = 500 kPa,
5 = 750 kPa. No attenuator was used in the reference
beam.
desorption of physically bonded water or chemically bonded
hydroxyl groups is limited by the structure distortion
because the surface hydroxyl groups can be converted into
bulk hydroxyl groups. When the ratio of bulk and surface
hydroxyl groups is determined by isotope exchange or
chemical reactions at pressed-disks, errors can easily be
introduced. By determining this ratio on silica,deposited
on a transparant plate, Benesi and Jones 13 located all
hydroxyl groups on the surface. It has been noticed that
after compression of silica particles the free hydroxyl
group concentration decreases 1• Therefore we conclude
that this technique is less suitable to study the surface
properties.
When it was tried to obtain a pellet pressed with
octyldimethylchlorosilane modified silica, a second
drawback showed up. Because of the nonpolar character of
the silica particles they repel each other so that even
37

a a
b b
38

at high pressures no suitable pellets were obtained. The
same problems have been encountered elsewhere 18119•
As pointed out in section 2.1 the avoidance of pres
sure by sprinkling the sample on a transparant window is
not applicable because of the particle size of our
materials. The slight contact between an internal totally
reflecting plate and the surface studied prohibited the
application of the multiple total reflexion technique. In
the techniques concerned, controlled atmosphere and heat
able cells are needed to study the dehydration process.
The mull technique
We felt it to be experient to look for another tech
nique in which the thermal and chemical modifications can
be performed without the intervention of special sample
cells and separately from the spectrophotometer. The mull
technique, analogous to the sample preparation used in
near-infrared studies of the silica surface 20 - 22 , seemed
to be very promising. The scattering can be diminished by
choosing a mull agent with a refractive index in the same
region as silica. Furthermore once the modified silica is
embedded in the mull oil and the mull is placed between
the transparant plates under controlled conditions, the
silica surface is not attainable any more to atmospheric
contaminations, i.e. moisture.
Figure 2.3 shows a transmission spectrum obtained from
a nonmodified silica mull. The strong absorption band of
physically bonded water (3500 - 3000 cm-1 ) dominates the
absorption bands of the surface hydroxyl groups. The
absorption of free hydroxyl groups shows a maximum at
3700 cm- 1 . Owing to the adsorption of the mull agent, a
slight shift is observed with respect to the absorption
Figure 2.2. Scanning electron mi croscope (SEM, 1 00 x 100
~m, 10 x 1 0 ~m) photographs of pressed disks prepared at
different pressures . a = 50 kPa, b = 250 kPa, c = 750 k Pa.
"S te r eo s can", (Cambri dge Instruments, Cambridge , Great
Bri tain ).
39

c 0
Ill
100
Ill 50
E Ill c I'C
.= ...
3000 2000 1500
Wavenumber, cm·1
Figure 2.3. Infr ared spectr um of a mu ll s ample of sil ica,
LiChro s or b Si -1 00 , d = 10 ~m . A r atio of 40 mg sil ica to p
200 ~ l polychlorotrifluoroeth y lene oil was ap plied . La yer
thickness= 0 . 2 mm , no grinding .
of free hydroxyl groups in a pressed-disk sarnple 23• The
absorption band around 2300 cm- 1 originates from the
required thick mull layer, and is not completely
compensated for by mull oil in the reference beam . The
spectrum has the same appearance as the spectra of pressed
disks prepared at a high pressure, for instance, spectrum
5 in figure 2 .1.
Dehydration of th e silica surface
To examine the dehydration process of the silica sample
(LiChrosorb Si-100), we applied a thermal treatment at
100°C, 200°C, 400°C and 600°C, each during 2,4 and 16
hours. The results are shown in figure 2.4. The spectra
reveal the disappearance of the broad band around 3400
cm- 1 already after heating at 100°C during 2 hours
(compare figures 2.3 and 2.4). A new maximum at 3550 cm- 1
becomes visible. The 3550 cm- 1 absorption peak decreases
gradually by heating at higher temperatures. Assignment of
40

c 0
~
~
Ill
100
E 101
" c
"' ~ .. ..
IDD
"
2 hr.
400"c-
3010 Uti
4 hr. U hr.
IIID Ull Jill litO 3010 2:001 liDO
Wavenumber, cm-1
Figure 2.4. I nfluence of the drying tempe ra t ure and drying
time on the chemically b onded surface hydroxyl group con
centration of LiChrosorb Si-100. Conditions a s in figur e 2 . 3 .
the various absorption frequencies o f water and surface
hydroxyl groups has been studied by various workers . The
assignments of the 3700 (3750) cm-1 frequency to the free
hydroxyl groups and of the broad band around 3400 cm- 1 to
physically adsorbed water are generally accepted. Some
41

disagreement exists about the assignment in the 3600 -
3400 cm- 1 region. Hockey 2 and McDonald 1 have assigned the
3550 cm- 1 frequency to strongly hydrogen bonded silanol
groups. Fripiat et aZ . 8 have stated that this absorption
is due to physically adsorbed water, because of
correlation with the 1620 cm- 1 frequency. However, the -1
1620 em frequency can be assigned to geminal hydroxyl
groups as well (see table II.1). Among others our
experiments suggest the correlation of the 1620 cm- 1 band
with the 3400 cm- 1 band of adsorbed water. Snyder 4 has -1
tried to prove the assignment of the 3500 - 3600 em
absorption region to bulk hydroxyl groups only.
To find more evidence for the assignment of the -1
absorption frequency of 3550 em to hydrogen bonded
surface hydroxyl groups, we heated our silica sample
during 2 hours at 650°C. After cooling to approximately
22°C, the sample was brought into contact with water
saturated air at that temperature. Then the sample was
heated at 200°C during 4 hours and a spectrum was recorded.
The result, like that obtained by Hockey 2, is given in
figure 2 . 5 . If the absorption at 3550 cm- 1 should be
assigned to physically bonded water, there is no reason
that this absorption band should disappear after the given
treatment, since silica heated up to 650°C still contains
enough hydroxyl groups to adsorb water again. If, however,
the absorption is caused by hydrogen bonded surface
hydroxyl groups, the assignment is in accordance with the
results of de Boer and coworkers 24• The dehydration
process is not completely reversible and after treatment
above 600°C especially the number of hydrogen bonded
hydroxy l groups, geminal or vicinal, will be decreased.
For these reasons we support the assignment of the 3550 -1
em absorption frequency to hydrogen bonded hydroxyl
groups.
Estimation of the numb e r of unattainab Ze si ZanoZ gr ou ps
b y deuterium exchange
Finally we must discuss the attribution of "bulk "
42

100
c 0
"' 50
"' E "' c Cll ...
1-...
4000 3000 zooo 1500
Wavenumber. cm-1.
Figure 2.5. Infrared s pe etrum of Li Chr o s orb Si-10 0 , fi r st
annea l ed a t 6 50°C in va e uum, th en eooled and expose d to
water satura ted air and fi nally dried in vaeuum at 200°C
for 4 hours. Conditions as in figure 2.3.
hydroxyl groups to the recorded spectra. Both Davydov e t
al. 6 ' 7 and Fripiat e t al. 8 have shown that the silicas,.
they investigated, contained substantial amounts of bulk
hydroxyl groups. They denoted a hydroxyl group as a "bulk
hydroxyl group" when it was not attainable for deuterium
oxide or methyllithium. According to their results, these
bulk hydroxyl groups evolve through a temperature range
of 100°C - 1000°C. A maximum water evolution was found in
the range of 500°C - 700°C. However, Unger and Gallei 25
have shown that surface hydroxyl groups in micropores
cannot be determined quantitatively, not even by the
methyllithium method (pore diameter < 10 nm) or by the
isotope exchange method (pore diameter < 5 nm) . The
surface of the silica used by Fripiat et al . 6 is for about
50% located in pores with a diameter of less than 6 nm
(reference 8 figure 1) . If we notice that the investiga
tions of the authors 11 2 1 4 -8 mentioned were performed on
pressed-disk silica samples it is possible that originally
attainable surface hydroxyl groups are incorporated in a
43

distorted silica structure.
From these observations we conclude that an appreciable
number of the so-called bulk-hydroxyl groups are in fact
surface hydroxyl groups in micropores. As we are working
with a non-distorted high surface area silica with an
average pore diameter of 10 nm, bulk hydroxyl groups will
play a minor part in spectra recorded.
To confirm this, we have applied the deuterium exchange
method with infrared spectroscopy to examine the role of
"non-attainable" hydroxyl groups in the interpretation of
figure 2.4. Deuterium oxide groups exhibit a similar type
of absorption as hydroxyl groups. The absorption frequency
around 2700 cm- 1 can be attributed to free deuterium oxide
groups. The absorption frequency of deuterium bond.ed
groups is shifted towards 2600-2500 cm- 1 13 , 28 , 2 9 as shown
in table 11.1. A silica sample is dried at 200°C, 400°C
and 600°C before the protons are exchanged by deuterium
atoms. Results are given in figure 2.6. The number of non
attainable silanol groups decreases equally with the total
number of surface silanol groups. From comparison of
figure 2.4 with 2.6 it can be seen that only a minor part
of the surface hydroxyl groups, left after drying at high
temperatures, is unattainable for deuterium oxide.
2.4 CONCLUSIONS
By increasing the drying temperature, the concentration
of hydrogen bonded hydroxyl groups decreases with
preference for loss. of hydrogen bonded groups. At 600°C
only free hydroxyl groups, the most reactive ones in
silanizing procedures 6 ' 2 8, are left at the surface. From
our experiments it appears that the drying time has a
negligible influence on the surface hydroxyl group con
centration. This is in accordance with the results of de
Boer and co~orkers 24 • At 100°C physisorbed water is eva
porated already, as shown by figures 2.3 and 2.4.
With the results obtained above .the surface hydroxyl
group concentration is studied after chemical modification
44

100
50
200°C
100
1: 0
Ul Ul
E Ul 1:
:.! ~ ...
400°C
100
600°C
3000 zooo 1500
Wavenumber, cm -1
Fig. 2.6. I nfrared spectra o f deuterated silica samples
visualizing the amount of unattainable silanol groups as
a function of the drying t emperature .
45

of the surface with alkylchlorosilanes. A detailed des
cription is given in chapter 3 (figures 3.7 and 3.8). One
example is given in figure 2.7. The same sampling proce
dure is applied . From figures 2.6 and 2.7 it is clear that
the infrared absorption of the residual hydroxyl groups
cannot be attributed to unattainable hydroxyl groups. The
infrared absorption of the unattainable groups is sub
stantially less than the absorption of the residual
hydroxyl groups of a silica sample dried at the same
temperature before modification.
Finally, we can state that the infrared mull technique,
as applied by us, appeares to be very useful to study
modified silica surfaces. Problems encountered in infrared
methods used elsewhere 1 8'
1 9'
2 7 have been avoided.
c 0
Ill II) ,
E Ill c ~
1-...
100
400°C
3000 2000 1500
Wavenumber, cm-1.
Figure 2.7. InfPaP ed speatPum o f mull sampl e of LiChposorb
Si -1 00 , silanized wi t h oatyldime thylahlorosil ane after
drying a t 400°C. This f igur e is part of figur e 3.7.
Condition s a s in fi gure 2.3 .
2.5 LITERATURE
1. R.S. McDonald; J . Phys .Chem . ~ (1958) 1168.
2 . J.A. Hockey; Chern . and I ndutry , Lo n don~ (1965) 57.
3. J.B. Peri; J. Phys. Chern . 2Q (1966) 2937.
4. L.R. Snyder, J.W. Ward; J . Ph y s . Chern. 2Q (1966) 3941.
46

5. L.T. Zhuravlev, A. V. Kiselev, V.P. Naidina, A.L.
Polyakov; Russ. J . Phys. Chern. 37 (1963) 1216.
6. V.Ya. Davydov, L.T . Zhuravlev, A.V. Kiselev;
Rus s . J. Phys. Chern . 38 (1964) 1108.
7. V.Ya. Davydov, A.V. Kiselev, L.T. Zhuravlev; Tr an s.
Fa r aday Soc . 60 (1964) 2254.
8. J.J. Fripiat, J. Uytterhoeven; J . Phy s . Chern. 66 (1962)
800.
9. E. Grushka (ed.); Bonde d Station ary Pha ses in Chroma
t ography , Ann Arbor Science Publ., Michigan, 1974.
10. See ch apte r 3 .
11. L.H. Little; I n fr a r e d Spec tra of Ads or bed Spec i es ,
Academic Press, London, 1966.
12. M.L. Hair; Infrar ed Spec troscopy i n Surface Chemis t r y ,
Marcel Dekker, New York, 1967.
13. H.A. Benesi, A.C. Jones; J . Phy s . Chern . 63 (1959) 179.
14. H. Knotzinger, H. Stolz, H. Buhl, c. Clement, w. Meye;
Chemie In g . Tech. 42 (1970) 548.
15. E. Gallei, E. Schadow; Re v. Sci. I nst . 45 (1974) 1504 .
16. A. Ahmed, E. Gallei; Be r. Bunsenges. Phy s . Chern.
79 (1975) 66.
17. E. Gallei; Be r. Bunsenge s. Phy s. Chern . 77 (1973)
81.
18 . R.E. Majors, H.J. Hopper; J . Ch r omatogr. Sc i. 12 (197~
767.
19. G.E. Berendsen, L. de Galan; J. Liquid Chromatogr. 1
(1978) 561.
20. M.L. Hair, I.D. Chapmann; J . Phys. Chern. ~ (1965)
3949.
21. G. Wirzing; Natur Wis sen s cha f ten ~ (1964) 211.
22. J. Erkelens, B.G. Linsen; J . Co~~. an d I nterface Sci.
29 ( 1969) 464.
23. M.R. Basila in E.G. Brame (ed.); App~i ed Spect r os cop i c
Review s , Vol. 1, Marcel Dekker, New York, 1968.
24. J.H. de Boer, M.E.A. Hermans, J.H. Vleeskens; Proc .
K. Ne d. Aka d. Wet . S r e . B. 60 (1957) 45, 61 (1958) 2,
61 (1958) 85.
47

25. K. Unger, E. Gallei; Ko~ ~oid- Z . Z. Po ~yrn. 237 (1970)
358.
26. G.E. Berendsen, L. de Galan; J . Liquid Chrornatogr . 1
( 1978) 403.
27. H. Hemetsberger, W. Maasveld, H. Rieken; Chrornato
graphia ~ (1976) 303.
28. F.H. Hambleton, J.A. Hockey, J.A.G. Taylor; Trans .
Faraday Soc. 62 (1966) 801.
29. M. Hino, T. Sato; Bu~ Z. Chern . Japan 44 (1971) 33.
30. A. Ahmed, E. Gallei, K. Unger; Ber• Buns enge s. Phy s.
Chern. 79 (1975) 6671.
48

CHAPTER 3
Synthesis of a nonpolar chemically bonded stationary phase with low residual hydroxyl group content
3.1 INTRODUCTION
Nonpola r modified siliceous
s uppo r t s still contain too many
res idual hydroxyl groups . A partial
c ondensation of surface silanol
gro ups by drying at over 200°C ,
pri o r t o the chemical modification ,
decr ease s the residual hydroxyl
group concentration, whereas the
concentration o f bonded alkyl
chains re mains virtually constant
up to 40 0°C . Owing to
silani za t ion , the speci f ic su r face
decr eases 15- 20% , the pore volume
dec r eases 25% .
The development of chemically bonded stationary phases
on siliceous supports for column packing material in high
performance liquid chromatography marks an important
breakthrough. Especially n-alkyl bonded phases meet an
enormous popularity. Over 60 % of liquid chromatographic
separations are carried out on these packing materials
nowadays.
Chemically bonded stationary phases originate from gas
chromatography 1-
3• In the late sixties, Steward and Perry 4
modified a silica surface for liquid chromatographic
49
applications converting the silanol groups with trichloro
silanes. Halasz and Sebastian 5 have pioneered in this
field using esterification with alcohols.
The preparation of chemically bonded phases can be
classified in several ways 6 • The organic molecules are
bonded to the silica surface either as a polymeric layer
or as a so-called "brush" or "bristle", a monolayer of
molecules more or less perpendicular to the silica
surface 7 • Unger et aZ . 8 prepared bulk modified stationary
phases by co-~ondensation of tetra-alko~ysilanes with
organotri-ethoxysilanes. The alkyl chains become part of
the bulk phase as well as of the surface.
Polymeric chemically bonded stationary phases have been
discussed extensively by Kirkland 911 0 • Because of slow
mass transfer in the polymeric layer, brush-type bonded
phases are preferred 7 • Owing to steric hindrance between
the reactants, not all silanol groups can be converted.
But generally over 50% is derivatized 11•
A second classification can be made according to the
type of reaction for derivatizing the silica surface (i)
esterification with alkohols, :si-o-c: bond, (ii)
chlorination of the silanol groups with a subsequent
reaction with organometalic or organonitrogen compounds,
:Si-C: bond and :Si-N= bond, (iii) silanization with
organochlorosilanes or organoalkoxysilanes, ::Si-0-Si-C:
bond. Several reviews have dealt with these reactions 12 ' 13 •
Diez-Cascon et aZ . 14 compared some bonding reactions. The
yield of bonded organic molecules depended on the type of
reaction employed: grignard < organolithic < amines <
silanes. Organochlorosilanes and organoalkoxysilanes are
generally used. The :Si-0-Si=c: bond was found to be
stable under most conditions applied in liquid chromato
graphy.
Whatever reaction path will be chosen to modify the
silica surface, a residual hydroxyl group concentration will
always remain. These residual hydroxyl groups, together
with hydrolytically formed hydroxyl groups, influence the
characteristics of the modified silica. The nonpolar
50

organic molecules and the polar hydroxyl groups give the
surface a bifunctional character. Although these hydroxyl
groups will be deactivated by a polar eluent, their
influence cannot be excluded. With nonpolar eluents their
influenqe is clearly shown15 , 16 •
In this chapter we shall describe experiments leading
to a decrease in the residual hydroxyl group concentration
with. maintenance of the concentration of bonded organic
molecules. The influence of a thermal treatment of the
silica before the modification is examined. For ·the
surface silanol group concentration of dry silica we -2 accepted a value of 8 ~mole m , see chapter 1. About
50% of these silanol groups can be silanized. Thus, as
long as the surface hydroxyl group concentration exceeds -2 4-5 ~mole m after the thermal treatment, no remarkable
decrease in the surface carbon content should be found,
while a decrease in the residual hydroxyl group con~
centration may be expected as mentioned by Scott and
Kucera 17 • When the residual hydroxyl groups are located
in micropores, unattainable for the reagent, desorption -2 of surface hydroxyl groups up to 4-5 ~mole m would
result in an attainable silanol group concentration of <
4 ~mole m- 2 . In thi.s case a decrease in the bonded
carbon content will be found, too.
The influence of residual hydroxyl groups is most
pronounced wi.th nonpolar bonded phases. As mentioned
above, these phases meet enormous popularity. Therefore,
we used nonpolar reagents, octyldimethylmonochlorosilane
and octylmethyldi.chlorosilane, in this study. The octyl
chain is a compromise between the totally bonded carbon
content and a limited accessibility of the alkyl chain to
micropores . After silanization, no attempts were made to
decrease the influence of residual hydroxyl groups with a
subsequent treatment with, for example, trimethylchloro
silane.
51

MONOFUNCTIONAL REAGENT
l 51-0-H
l 51-0-.H
l
~H3 + CI-51-R
I CH3
BIFUNCTIONAL REAGENT
• 51-0-lf
• 51-0-H
• +
Cl I
CI-Si -R I
CH3
TRIFUNCTIONAL REAGENT
51-0-H
Si-0-H
•
Cl I
+ CI-51-R I
Cl
l 9HJ 51-0 -Si-R
I I CH3
51-0-H
•
Cl I
51-0-51- R
• ~HJ Si-0-H
•
Cl I
51-0-Si- R
• c~ Si
l 9H Si-0-51-R
H~ I l CH3
5 1-0-H
•
OH I
H20 51-0-51-R
• I OH
51-0:-H
• H20
51, R 0 / • ;:s;
Si-'0 ' OH
• Figure 3.1. Sch ematic representation of a sili~a surface
modification with mono-, di- and . trifunctional chlor o
silanes under dry conditions and with a wa shing procedure
including water afterwards .
3.2 ALKYLSILANE MODIFIED SILICA SUPPORTS
The coupling o.f alkyl chains to the silica surface can
be performed with tri-, di-, and monoch lorosilanes.
Generally, the first two are used. Figure 3.1 summarizes
the stoichiometry of a surface reaction with the various
chlorosilanes. These reactions have been studied
extensively 11'
18• To avoid any polymerization the reaction
mixture must be completely dry. After the silanization
procedure the modified silica will be washed with a number
52

BIFUCTIONAL REAGENT
R I
SI-0-SI-OH I
CH3
SI-0-H
l
+ Cl I
CI-SI-R I
CH3
~RIFUNCTIONAL REAGENT
Sl, R Cl 0 / I
l ~SI + Cl- Si-R 0 ' I
Si' OH Cl
l
l ! ~ SI-0751-0.;.H
' I ' l \CH3 fn Si -OH
l
Figure 3.2. Sc hematic representation o f a silica s urface
modificati on with di - and trichlorosilane s u nder wet
condition s ; cau sing polymerization .
of solvents, including water. Then the nonreacted
chloride atoms will be converted to hydroxyl groups .
Figure 3.1 illustrates that trifunctional chlorosilanes
have an adverse influence on the residual hydroxyl
group concentration. It is also shown that over 50% of a
dichlorosilane should react bifunctionally if it is to be
preferred to a monochlorosilane. Monofunctional as well
as bifunctional reactions have been found to occur when
using a dichlorosilane 1 9 • If traces of water are present
in the reaction mixture, the hydrolysis of chloride atoms
will proceed during silanization and, subsequently,
silane molecules can be bonded to .earlier bonded molecules
as illustrated in figure 3. 2. ~'Vhen a polymeric layer is
bonded to a silica surface traces of water are added on
purpose 20 •
To show the generally attainable conversion degree,
coverages of a number of alkylchlorosilane modified
supports are presented in table III.!. Gathering these
values, the discrepancy in calculating methods of the
surface density, as recently mentioned 2 1 , manifested
itself clearly. The surface coverage should be expressed
53

Table III.l: Surface density of alkylsilanes obtained by variou s aut hor s , in
references
sililating reagent 8 11 15,16 21 22
trimethylchlorosilane 4.5 3.37 3.87 dimethyldichlorosilane 4.75 (8.7) allyldimethylchlorosilane 3.34 t-butyldimethylchlorosilane 1. 90 butyldimethylchlorosilane 3.6 2.97 dibutyldichlorosilane 2.76 (4. 9) phenyldimethylchlorosilane 2.6 3.94 octyldimethylchlorosilane 3.8 2.35 octylmethyldichlorosilane 2.40 octyltrichlorosilane 2.35 3.74 decylmethyldichlorosilane 4.08 (3. 5) undecylmethyldichlorosilane undecyltrichlorosilane 3.52 dodecyldimethylchlorosilane 2.20 tridecyltrichlorosilane 3.59 pentadecylmethyldichlorosilane pentadecyltrichlorosilane 3.47 hexadecyldimethylchlorosilane 3.4 2.36 octadecylmethyldichlorosilane 3. 77 (2.6) octadecyltrichlorosilane 4.31 (2. 9) 3.44 heneicosyltrichlorosilane 3.55
).l mole - 2 m
23
3.51 (3. 84)
3.20 (3.77)
2.88 (3.04)
3.14 ( 3. 24)

as the number of attached si.lane molecules instead of
using the number of attached alkyl chains 15116• The
carbon atom of a methyl group attached to the silicon
atom in mono- and dichlorosilanes should not be forgotten
in the evaluation of elemental analysis data 23• The
-2 surface concentration is generally cited as )lmole m
Calculating this value from elemental analysis figures,
one should correct for the weight increase of the support by
modification, otherwise the author will wrong himself 1 5'
16 Especially when long chain alkylsilanes are bonded to
the silica support, approximately 30% of the total weight
(for octadecylsilane 20% C) must be attributed to the
bonded stationary phase.
lve have used the expression given by Berendsen et aZ. 2 1
and Hemetsberger et aZ . 23 for calculating the alkylsilane
density from carbon content data found in the literature.
%C 10 6
[Si] 100 n 12 SBET(1 - 0.01% wt)
-2 [ ]lmole m ]
%C weight percentage of bonded carbon
% wt
n
weight percentage of bonded stationary phase
carbon atom number of the alkylsilane
SBET the specific surface of the bare silica
(1 - 0.01% wt) gives the correction for the weight
increase of the modified silica. % wt is calculated
according
M %C % wt
n 12
3.1
3.2
M is the molecular weight of the bonded organosilane
molecule, for a monofunctional reagent given by
-Si(CH3 J2-(cH2 )nCH3
, for di- and trifunctional silanes
given by =SiX-(CH 2 )nCH3 or -SiOHX-(CH2 )nCH3 with X = CH3
for a dichlorosilane and X = OH for a trichlorosilane.
The last two are supposed to react for 50% monofunctional
ly and for 50% bifunctionally. Equation 3.2 can be
55

substituted in equation 3 . 1.
[Si) (100 n 12 - %C M) SBET
-2 [~mole m ]
The surface coverages, as given in table III.1, are
calculated according to this equation. If the values
given in the articles referred to deviate, then these
values are given in brackets.
3.3
Table III.1 shows that the surface coverages obtained -2 vary between 2-4 ~mole m . The surface hydroxyl group
concentration was found to be 8 ~mole m- 2 • Therefore the
statement " ... use a fully hydroxylated silica with the
highest population of hydroxyl groups as possible ... "
to achieve a dense monolayer of bonded molecules 11, is
doubtful. A study about the effect of a partial
dehydration of the silica surface prior to the silaniza
tion seems worthwhile.
3.3 EXPERIMENTAL
Chemicals and Materials
Three mixed 100g batches of LiChrosorb Si-100, dp
10 ~m (Merck, batch EH23 charge 7518609, batch EH12
charges 7489111 and 7442231) are used as a support for
the preparation of the chemically bonded stationary
phases. Octyldimethylchlorosilane and octylmethyldi
chlorosilane are used as silanizing reagents. Because
they were not commercially available, they were prepared
by hydrosililation of 1-octene (Merck) and methyldi
chlorosilane (Fluka, Buchs, Switzerland) with potassium
chloroplatinate as catalyst 24-
2 6• After fractional
distillation the reaction product was stored in closed
glass ampules. Although isomers, n-octylsilane and
1-methylheptylsilane, can be formed during the reaction,
only the former silane appeared to be synthesized as
proved by NMR 2 7 • Toluene was used as dispersion medium,
pyridine was added to the solution to accelerate the
56

silanization. Both solvents were of pro analyse grade
(Merck). Hexane, aceton and methanol, ·used to wash the
modified silica were chemically pure and filtered over a
0.5 ~m Fluoropore filter (Millipore, Bedford, Mass. USA)
before use. Water was distilled and deionized by a
Millipore-Q-system. The infrared sampling procedure is
described in chapter 2.
The self made chemically bonded stationary phases are
compared with several commercial materials, SAS-Hypersil
and ODS-Hypersil (Shandon, Runcorn, UK), Partisil ODS
(Whatman, Clifton, N.J., USA) 1 LiChrosorb RP-8 and RP-18
(Merck) and Spher~sorb ODS (Phase Separ~tions,
Queensferry, UK).
Si lani zation procedure
No pretreatment is given to the bare silica, except
the drying procedure, to avoid any change in the pore
structure. Alkylchlorosilanes can be bonded to the silica
surface either in the gas phase 28 or in the liquid phase.
We have applied dispersion of the silica in a nonpolar
solvent analogously to the procedure of Hemetsberger 22•
Toluene was used as dispersion liquid.
15 mg batches of silica are placed in a two-neck round
bottom flask. At first the silica is dried for 4 hours
at a vacuum of - 1 Pa. Then 150 ml sodium dry toluene is
added to the silica before exposure to nitrogen, dried
over 5 ~ activated mol-sieve, to exclude the silica from
any moisture. Subsequently, a reflux cooler is placed on
the flask, 10 ml potassiumhydroxide dried pyridine and
20 ml octylchlorosilane are added to the silica suspension
and the mixture is refluxed for 4 hours. The percentages
of bonded carbon as a function of the reaction time is
measured. The result is given in figure 3.3. Owing to
the influence of the added pyridine, the reaction was
completed within a few hours. To avoid formation of
polysiloxanes, the reaction mixture is kept under dry
nitrogen.
57

10
6
4
2
2 3 4
time,hours -
Figure 3.3. Weight percentage of bonded carbon as .function
of the reaction time during a silanization procedure with
octyldimethylch l orosi lane
After completion of the reaction, the reaction mix ture
is filtered an.d washed over a 4G glass filter with
successively n-hexane, aceton, methanol, a 1:1 water
methanol mixture and again methanol. The final product is
dried at 150°C overnight.
Characterization of the modified silica
The bare silica and the silanized silicas are
characterized by several methods.
-Specific surface measurements are performed by nitrogen
adsorption at -196°C according to the BET method. A
Strohlein Area meter was used (Strohlein, Dusseldorf,GFR).
-The pore size distributions and pore volumes are
calculated from nitrogen adsorption/desorption isotherms
using a modified Kelvin equation 29 130 • The isotherms
were obtained with a Sorptomatic model 1826 (Carlo Erba,
Milan, Italy).
-Elemental analysis is applied to measure the carbbn
content after modification of the siliceous support. Home
made equipment was used.
58

-Infrared spectra of the modified silicas are recorded
with a Hitachi model EPI-G2 spectrophotometer (Hitachi,
Japan). The samples are prepared according the procedure
described in chapter 2.
3.4 RESULTS AND DISCUSSION
The effect of the drying temperature on the pore
structure, the carbon content and the residual hydroxyl
group concentration is discussed. . 0 0 0
Drying temperatures of 200 C, 400 C and 600 C were
applied. The hydroxyl group density at these temperatures
has already been shown in the previous chapter (figure 2.4).
Twelve batches of octylsilane modified silica were
prepared. Numbers
monochlorosilane;
400°C and 600°C,
duplicates of 1,
1-6 were silanized with
batches 1, 2 and 3 were
respectively, batches 4,
2, and 3. Numbers 7 - 12
octyldimethyl-
dried at 200°C,
5 and 6 are
were silanized
with octylmethyldichlorosilane. Analogously to the first
series, batches 10, 11 and 12 are duplicates of batches 7,
8 and 9, dried at 200°C, 400°C and 600°C, respectively.
Specific su~face and pore structure
As LiChrosorb Si-100 is a microporous silica, a change
in specific surface is likely to occur by covering the
surface with an organic layer. Results of specific
surface determinations are given in table III.2. The
specific surface of LiChrosorb Si-100 is 290 ~ 5 m2g-1 ,
in accordance with. the suppliers' data. By silanization
with octylchlorosilane the specific surfaces decreased by
about 15-20%. The differences between the various batches
are not significant. The BET surfaces derived from the
adsorption isotherms are somewhat lower. The specific
surface decrease is partially due to the weight increase
by silanization, partially due to the filling up of
micropores by the organic molecules. The decrease cannot
be attributed to a surface reduction owing to a
temperature effect, since the specific surface of the
59

Table III. 2: Specific surface and pore structure of bare
and octylsilane modified s ilica
adsorbent 8BET v p rp dV dr
2 -1 cm3 -1 m g g nm nm
LiChrosorb Si-100 290+5 280a 1. 04 7.5 7.5 LiChrosorb Si-100 dried at 6oooc 290 Modified silica batch 1 243 240 a 0.77 6.5 6.5
2 230 230a 0.78 7.0 7.0 3 245 245a 0.84 7.0 7.0 4 230 5 246 6 240 7 246 255a 0.78 6.0 6.5 8 242 240a 0.78 6.5 6.5 9 250 260a 0.82 6.5 6.5
10 252 11 255 12 246
aderived from adsorption iso therms
bare silica remained unchanged after drying at 600°C.
More insight is given by data about the pore structure.
The nitrogen adsorption/desorption isotherms on LiChrosorb
Si-100 and a modified silica, batch 1, are given in
figure 3.4. The figures resemble a type IV isotherm. From
v 12 a
crrt1.o 0.8
0.6
0.4
Q2
0 0.2
A B
0.4 0.6 Q8
PfPo-
Figure 3.4. Nitrogen adsorpti on and de s orp tion isotherms
o f A) the bare silica support LiChr osorb Si-'- 100, and B)
an octyldimethylmonochlorosilane modified silica sample ,
batch 1.
60

A B Vcum
cm3 Vcum
1.0 1. Vcum
~~~~~~~~::::::::1;00::=:~~t-~~~~~~~~~~~100~-===~ pore radius nm pore radius nm
Figure 3.5. P~ot o f the cumu ~ative pore vo~ume V and c um
t he po r e size dist r ib ution of A) the bare si~i ca support
LiChrosorb Si -1 00 and B) a modified si~ica , batch 1 , both
de r ived f r om the desorptio n i s othe r ms .
these isotherms specific surface, pore volume and pore
size distribution can be calculated 2 9t
30• In figure .3.5
the cumulative pore volume and pore size distribution are
depicted . More data are given in table III.2. The .
repeatability of the equipment, used to measure the iso
therms, is 3-4%. The variations between the data of .the
modified silicas are slightly higher but they are not so
significant that conclusions from differences between the
three drying temperatures or the silanizing agents .can be
drawn. The LiChrosorb Si-100, which we used, had an
average pore radius of 7. 5 run. Table III. 2 shows that after
silanization the pore volume has been decreased about 25%.
Consequently, the average pore radius decreased from
7.5 nrn to 6.5 nm.
This slight decrease in pore size will not change the
chromatographic properties. l'lhen using an octadecysilane
as modify ing reagent, the pore size reduction will be
more severe 8• Therefo~e, a microporous silica like
LiChrosorb Si-60 with an average pore radius of 3 run
according the supplier, should not be used as starting
material for chemically bonded stationary phases.
61

Table III.3. CaPbon content and suPface density of aZkyZ
siZanes of the modified silica suppoPt s
modifier
octyldimethylchlorosilane
octylmethyldichlorosilane
SuPface covePage
batch
1 2 3 4 5 6
7 8 9
10 11 12
drying
temperature
200°C 400 600 200 400 600
200°C 400 600 200 400 600
%C
9.7+0.1 9.4 7.6 9.8 9.5 8.2
9.2+0.1 9.1 7.6 9.2 8.8 7.3
[Si] -2 11mole m
3.23 3.12 2.45 3.27 3.16 2.67
3.41 3.37 2.74 3.41 3.24 2.62
In table III.3 the weight percentages of bonded carbon
and the subsequent alkylsilane densities are listed.
Conversion rates are not given as the stoichiometry of
reactions with bifunctional silanes is not yet clearly
established . The surface concentration of bonded ~ilane
molecules is in accordance with the value given in table
III.1. Equation 3.3 is applied. The elemental analysis
data are accurate within 2%. The repeatability of the
silanizing procedure appears to be good. Drying of the
siliceous support at 400°C has not led to a significant
decrease in the carbon coverage . There were enough
attainable silanol groups left at the surface to achieve
the maximally attainable conversion. As could be expected
from figure 2.4, drying at 600°C induced a decrease in
the carbon coverage. A reduction of 15-20% is found. But
even this decrease is rather sma ll since from figure 1.2
it can be estimated that the sila nol group d ensity
decreases from 8 11mole m - 2 to 2. 3 11mole m - 2 after drying at
600°C. Therefor;e, we can conclude that the major part of
the hydroxyl groups is not only attainable for o1o, figure 2.6, but also for octylmethylchlorosilane~. The
differences between octyldimethylchlorosilane and
62
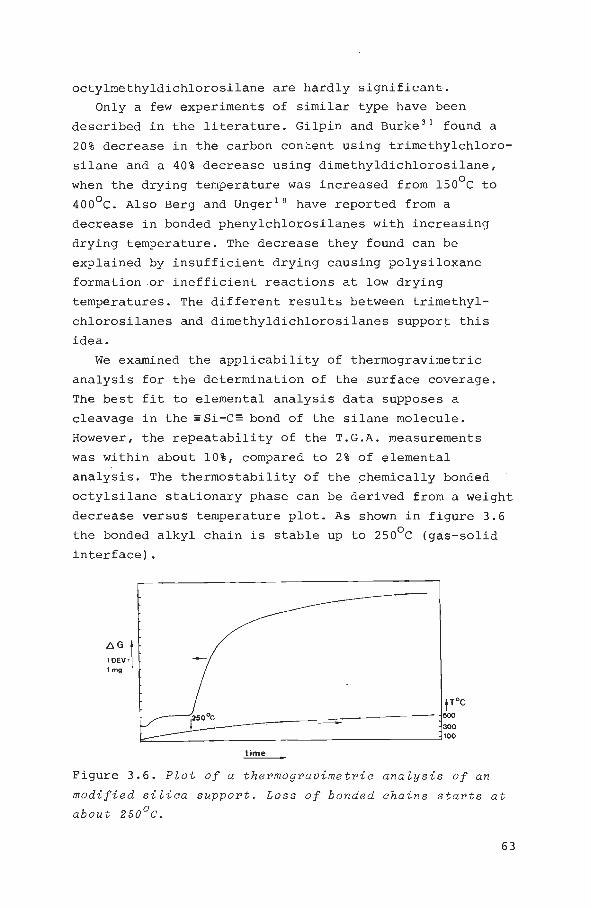
octylmethyldichlorosilane are hardly significant.
Only a few experiments of similar type have been
described in the literature. Gilpin and Burk~3 1 found a
20% decrease in the carbon concent using trimethylchloro
silane and a 40% decrease using dimethyldichlorosilane,
when the drying temperature \vas increased f.rom 150°C to
400°c. Also Berg and Unger 18 have reported from a
decrease in bonded pheny lchlorosilanes with increasing
drying temperature. The decrease they found can be
explained by insufficient drying causing polysilox ane
formation or inefficient reactions at low drying
temperatures. The different results between trimethy l
chlorosilanes and dimethy ldichlorosilanes support this
idea.
~ve examined the applicability of thermogravimetric
analysis for the d e termination o f the surface coverage .
The best fit to elemental analysis data supposes a
cleavage in the :si-c= bond of the silane molecule.
However, the repeatability of the T.G. A. measurements
was within about 10%, compared to 2 % o f elemental
analysis. The thermostability of the chemically bonded
octylsilane stationary phase can be derived from a weight
decrease versus temperature plot. As shown in figure 3.6
the bonded alkyl chain is stable up to 250°C (gas-solid
interface).
tToC
500
300
~~--------------------------------------~100 time
Figure 3.6 . Plot of a thermogr avimetri c analysis of an
modified silica suppor t . Loss of bonded chains s t ar t s at
abou t 250°C.
63

100
200°C
100
<: 0
"' "' E "' <: 10 ..
1-.. 400°C
·IOU
so
600°C
3000 2000 1500
Wavenumber, cm- 1.
Figure 3.7. Infrared spectra of octyldimethy l monoc h lo r o
silane modified supports , dried at different tempe r atures
prior to t h e modifications , visualizing the r esidual
hydroxyl gr oup concentration .
64

c: 0 Cl) Cl)
E
100
100
~ so cv ..
..... '""
100
lOOO zooo 1SOO
Wavenumber , cm-1
Figure 3.8. Inf~a~ed spect~a of octyZmethyZdichZo~osi Zane
modified suppo~ts , dried at diffe~ent t empe~atu~es p~io~
to the modification, visualizing the ~e sidua Z hyd~oxy Z
g~o up concent~ati on.
65

c 0 ., ., E
100
100
~ 50 tv ..
1-...
100
LICHROSORB RP-8
LICHROSORB RP-18
SPH ER IS ORB ODS
3000 2000 1500
Wavenumber, cm·1
Figure 3.9. Infrared spectra of a number of commercially
avail able alkylsilane chemically bonded stationary phases,
dried at 200°C prior to embedding them in the mull oil.
66
c 0 Ill Ill
IDO
IDO
E 50 Ill c ., .= ...
IDO
SAS HYPERSIL
ODS HYPERSIL
PARTISIL ODS
3000 2000 1500
Wavenumber . cm-1
67

Residua l hydroxy l group concentration
The residual hydroxyl group concentration has been
visualized by infrared spectroscopy, using the mull tech
nique as described in chapter 2. From batches 1,2 and 3
and 7,8 and 9 mull samples were prepared and infrared . 0
spectra were recorded. The samples were dried at 200 C
during 4 hours prior to embedding them in the mull oil.
Thereby all physisorbed water was evaporated. Results
are given in the figures 3.7 and 3.8. The spectra of both
octyldimethylchlorosilane modified silicas and octylmethyl
dichlorosilane modified silicas reveal that the residual
hydroxyl group concentration markedly decreases with in
creasing drying temperature. The infrared adsorption of
the residual hydroxyl groups cannot be attributed
entirely to unattainable hydroxyl groups. Deuterium
exchange experiments, section 2.3, have shown that the
concentration of unattainable hydroxyl groups after drying
at the various temperatures is much smaller.
A slight difference can be noticed between figures 3.7
and 3.8. The shoulders in the OR-adsorption band around
3550 cm- 1 are somewhat broader for the dichlorosilane
modified packings, owing to formation of new hydroxyl
groups by hydrolysis of nonreacted chloride atoms~ These
hydroxyl groups can be hydrogen bonded to silanol groups
of the silica surface.
For comparison, infrared spectra were recorded from a
number of commercially available alkylsilane modified
packing materials. The spectra are represented in figure
3.9. The modified silicas are dried at 200°C, prior to
embedding them in the mull oil. Unfortunately it is
unknown whether these packing materials have been treated
with a s mall reactive sililating agent, like trime thyl
chlorosilane, to decrease the residual hydroxyl group
concentration. The spectra visualize the number of
residual hydroxyl groups. Most modified silicas exhibit
a more or less equal residual hydroxyl group concentration.
Differences in the absorption frequency around 3550 cm- 1
are most p ronounce d. Partisil ODS contains more residual
68

hydroxyl groups, which can be explained by its low carbon
content of 5%. The Hypersil materials contain fewer
residual hydroxyl groups. Our samples driedat 40Q°C and
600°C exhibit a smaller hydroxyl group concentration as
compared to most of the packing materials shown in figure
3. 9.
3.5 CONCLUSIONS
Drying of the silica sample at such a temperature that
not only all physisorbed water is desorbed but also part
of the surface silanol groups are condensed, has a
favourable effect on the residual hydroxyl group con
centration. If the concentration of bonded alkyl chains
is to be constant, a temperature of 400°C seems
appropriate. In case a small lessening in the carbon content
is allowed, the drying temperature can be further
increased. Monochlorosilanes are advantageous compared to
dichlorosilanes.
Owing to th.e modification, the specific surface and
the pore size decrease by 15% and 25%, respectively. The
drying temperature has no influence on the specific
surface and the pore structure of the modified packing
materials.
Chromatographic measurements in reversed phase systems
and normal phase systems will give additional information
on the influence of residual polarity of nonpolar modified
supports.
3. 6 LITERATURE
1. E.W. Abel, F.H. Pollard, P.C. Uden, G. Nickless;
J. Chromatogr. ~ (1966) 23.
2. W.A. Aue, C.R. Hastings; J. Chromatogr. 42 (1969)
319.
3. I. Halasz, I. Sebastian; J. Chromatogr. Sci. 12 (1974)
161.
4. H.N.M. Stewart, S.G. Perry; J. Chromatogr. 37 (1968)
97.
69

5. I. Halasz, I. Sebastian; Ang . Chemie ~ (1969) 464.
6. I. Sebastian, I. Halasz; in c. Giddings (ed.):
Advan oe s in Chromatogr aphy, Volume 14, Marcel Dekker,
New York, 1976.
7. R.E. Majors, M.J. Hopper; J . Chromatogr. Soi . ~
(1974) 767.
8. K.K. Unger, N. Becker, P. Roumeliotis; J • . Chromatogr.
125 (1976) ll5.
9. J.J Kirkland, J.J. DeStefano; J . Ch roma t ogr. Soi .
.§. (1970) 309 .
10. J.J. Kirkland; J . Chroma togr. Soi . 1 (1971) 206.
11. P. Roumeliotis, K.K. Unger; J. Ch r oma t ogr. 149 (1 978)
221.
12. D.C. Locke; J . Chromatogr. Soi . ll (1973) 120, and
references herein.
13. v. Rehak, E. Smolkova ; Chromatographia 1 (1976) 219,
and references herein.
14. A. Diez-Cascon, A. Serra, J . Pascual, M. Gassiot;
J. Chromatogr. Soi . ~ (1974) 559.
15. K. Karch, I. Sebastian, I. Halasz; J . Chromatogr .
122 (1976) 3.
16. K. Karch; Thesis , University of Saarbrlicken, 1974.
17. R.P.W. Scott, P. Kucera; J. Ch r omatogr. S oi . ~3 (1975)
337.
18. K. Berg, K. Unger; Ko ZZo id- Z . Z. Po Zym. 246 (1971)
682.
19. M.L. Ha ir, J. CoZZ. and Interfaoe Soi . ~ (1977) 154.
20 . R.K. Gilpin, J.A. Korpi, C.A. Janicki; AnaZ . Chern .
fl (1975) 1498.
21. G.E. Berendsen, L. de Galan; J. Liqui d Chromatogr.
~ (1978) 561.
22. H. Heme tsberger, W. Maasveld , H. Rie ken; Chromatogra
phia 1 (1976) 303 .
23. H. Hemetsberger, M. Kellermann, H. Rieken; Ch r omato
gr aphia !Q (1977) 726 .
24. E.W. Pietrusza, L. H. Sommer, E.C. l'i'hitmore; J. Am .
Chern . Sao . 2Q (1 947) 484.
25 . P. Tar rant, G.W. Dyckes, R. Dunmi r e , G.B. Butler ;
70

J. Am. Chern . Soc. ~ (1957) 6536.
26. E.Y. Lukevits, M.G. Voronkov; Organic Inserti on
Reactions of Group IV Elements, New York, 1966.
27. G.J.M.M. Coenen, Graduation Report, Eindhoven
University of Technology, 1979.
28. K. Unger, K. Berg, E. Gallei; Kolloid- Z . Z. Po lym .
234 (1969) 1108.
29. S.J. Gregg, K.S.W. King; Adsorption , Surface Area and
Porosity , Academic Press, New York, 1967.
30. J.C.P. Broekhoff, B.G. Linsen; in B.G. Linsen (ed.):
Physica l and Chemical Aspects of Adsorbents and
Catalysts , Academic Press, New York, 1970, chapter 1.
31. R.K. Gilpin, M.F. Burke; Anal . Chern . 45 (1973) 1383.
71

CHAPTER 4
Retention behaviour of carboxylic acids in reversed phase solvophobic chromatography
Th e influe nce of ionic equilibria
on the diBtr ibution process is
studie d. pH* an d pK~ value s are
use d to interpr et the ionic
equilibr ia in water- methanol
mixture s. The effe c t of
increa s ed ioni c stre ngth can be
exp laine d b y ionic interactions.
pK shift s are taken into account . a
4 . 1 INTRODUCTION
The t emperatur e effect is in
acc or dan c e with th e Van ' t Hoff
equat i on .
Until recently the separation of ionic compounds, such
as acids and amines by liquid chromatography, was carried
out almost exclusively on ion-exchange columns 1• The
performance of these columns, however, is adversely
affected by the properties of the polymer matrix of the
ion-exchanger. Mass transfer rates are relatively low in
the gel; moreover, the compressibility of the soft gel
does not allow for high pressure drops to be applied.
Therefore, these materials are less suitable for rapid
separations.
Adsorption chromatography on silica columns is not
suitable for the separation of ionic compounds owing to
73

the strong interaction of the sample solute with the
polar silica surface. Schill and coworkers 2 have intro
duced normal phase ion-pair chromatography by applying
the concept of ion-pair extraction to liquid chromato
graphy. Separations of ionic compounds, based on liquid
liquid partition systems on polar supports, have qeen
accomplished.
Over the past several years reversed phase chromato
graphy on silica with chemically bonded alkyl chains has
turned out to be a valuable alternative for separating
polar ionic compounds 3• In the more conventional form, an
aqueous buffer, which may contain a highly water soluble
solvent, is used as the mobile phase. The retention
behaviour of polar ionic compounds in these so-called
"solvophobic" or "hydrophobic" chromatographic systems
has been extensively investigated.
Karger et al.~ examined the role of hydrophobic effects
in reversed phase liquid chromatography. The selectivity
in hydrophobic systems is approximated by a new , index,
the molecular connectivity, which takes account of the
solute surface area. This index is shown to be propor
tional t9 the surface area of the cavity, necessary to
accommodate the solute between the highly ordered water
clusters. Horvath et al. 5'
5 have shown that the retention
mechanism can be explained by the so-called "solvtiphobic
theory", initially developed by Sinanoglu and coworkers
(references in ref. 5,6). The main eluent parameters
involved are the surface tension and the dielectric
constant; the solute parameters of interest are the
surface area and the dipole moment. The solvophobic
interactions originate from the repulsion between the
polar solvent and the nonpolar part of the sample solute
enclosed in a solvent cavity. Solute retention is
attributed to a reversible association of the hydro
carbonaceous surface area of the solutes with the non
polar modified silica surface. Association of the solute
with the nonpolar stationary phase is .favo:ured by the
decrease in the hydrocarbonaceous surface area in contact
74

with the polar solvent. Linear relationships are found
between the logarithm of the capacity factors and the
nonpolar surface in contact with the polar solvent.
Instead of using alkyl modified silica supports,
Pietrzyk eta~. 7 - 11 have studied the retention of ionized
solutes on polystyrene-divinylbenzene resins (XAD-2, XAD-
4) and a acrylic ester copolymer (XAD-7). The XAD co
polymers act as stationary phases similar to the nonpolar
bonded phases. Ionic equilibria are applied to explain
the retention behaviour of acids, bases and ampholytes
as function of the pH of the eluent and the pK values of
the solutes8110 •
Although the solvophobic theory was applied first bo
non-ionized solutes 5 it was extended to ionized solutes
afterwards 6 • Retention data have been interpreted
according to the given theory and a treatment of the
ionic equilibria as given by Pietrzyk8110 • A drawback of
the approaches of Pietrzyk and Horvath is the negligence
of the influence of the ionic strength and organic
solvents on pH and pK values. When organic solvents are
added to an aqueous buffered eluent, corrected pH and pK
values should be introduced. The influence of the ionic
strength cannot be described merely by changes in elu~nt
parameters. Especially when partially ionized solutes are
concerned, the influence of the ionic strength on the
ionization degree of the solute may not be neglected.
Therefore in this chapter we shall discuss the
retention behaviour of carboxylic acids in water-methanol
systems only in terms of ionic equilibria. Special
attention will be paid to shifts in pH and pK values.
The effect of the ionic strength will be discussed with
regard to complex formation between the solute and ionic
mobile phase constituents.
4.2 THEORY
Ionic equi~ibria
Ionic equilibria involved in the retention mechanism of
75

weak organic ac·ids in reversed phase liquid chromato
graphy are given in figure 4.1.
HX
ll
r------------------------1 I I 1
HB :buffer
H : : M+ + e-.=MB 1..------------ ...
+ ' + '
+ : H+ : I I I I '------ -------}
mobile phase
Figure 4.1. Ioni c equi~ibria involved in the r etention
mechanism of weak acids in reversed phase s o lvophobic
chromatography. HX is sample solute, MB/HB is buffering
agent .
The overall partition coefficient K of a weak organic acid
between a buffered aqueous mobile phase and a hydrophobic
alkyl modified silica can be considered as the sum of two
different processes.
4.1
The first term of the right hand side, 6KHX' describes
the contribution of the undissociated acid to the overall
partition between the mobile phase and the organic layer
o~ the silica surface. The partition coefficient of the
undissociated acid KHX and the acid-dissociation constant
Ka are given by
76
(HX]
[HX] 4.2

4.3
Combining equations 4.2 and 4.3 we derive
K 1 + a
[H+]
4.4
Concentrations given without subscripts are referred to + - .
the mobile phase. [HX], [H ] and [X ] .are the concen-
trations of the undissociated acid, the solvated proton
and the dissociated acid in the mobile phase respectively.
Concentrations denoted by a bar are referred to the
stationary phase, i.e. [HX] is the concentration of the
undissociated acid at the stationary phase.
Adsorption of the dissociated acid X ~s described by the
second term on the right hand side of equation 4.1. This
adsorption should coincide with an increased concen
tration of cations from the buffered solution near the
stationary surface layer in order to compensate for the
negative charges of the anions X . However KX is
generally described by 6'
7- 10
4.5
~fuen the adsorption of the dissociated acid is given by
-[X l Kx
[X -l
4.6
L'IKX is described by
L'IKX Kx
[H+] 1 +
4.7
-K-a
77

The total partition coefficient is given by combining
equations 4.4 and 4.7.
K
K a KHX + KX +
[H J 4.8
Similar equations have been derived for diprotic acids,
monoprotic and diprotic bases and amino acids 6 ' 8 ' 1 0 •
Especially when the ionic strength is varied, the
influence of cationic eluent constituents on ~KX should
be considered. In aqueous buffered solutions adsorbed
anions are partially associated with cations M+ from the
buffer salt. If we denote by (MX] the adsorbed anion
concentration associated with M+, the total concentration
of adsorbed anions is given by (X ]total = (X ] + (MX].
The partition coefficients of X- and MX are given by KX
and ~ respectively
K -X
[MX]
By combining equations 4.9 and 4.10, the overall
partition coefficient ~KX is given by
[X) + [MX]
(HX] + (X-]
K -X
1 +
4.9
4.10
4.11
It should be noted that variation of pH or [M+] is
generally associated with a variation of the total ionic
strength of the buffer solution. With increasing ionic
strength activity coefficients should be introduced and
equation 4.11 can be rewritten as
78

Partition coefficients K can be replaced by capacity
factors k' because k' is related to K by
k' = <!>K
4.12
4.13
where <!> , the phase ratio, is constant for a given column.
Combining equations 4.4, 4.12 and 4.13 we can derive
k' 4.14 K
1 +_a __ .....,.._
yH+ [H+]
Only when diluted buffer solutions (<D.01 M) are used,
can the activity coefficients be omitted in equations
4 . 12 and 4.14 . A sigmoidal curve of K or k' versus pH
will result as has been pointed out by other workers 6 ' 8 , 1 2•
The limiting values are k' = k'Hx for pH << pKa and
k' = k'x- + yM+ k'Mx [M+] for pH » pKa. When the cation
concentration is increased at pH >> pKa' a linear
relationship should be found between k' and yM+ [M+ ] as
can be concluded from equation 4 .1 4.
Influ ence of the i oni c s t r eng t h on pK val u e s a As the pKa value plays an important part in equation
4.14 the influence of the ionic strength on the pK value a
may not be neglected. For low ionic strength,I,the Davies
equation 1 3 , i.e. a modified Debye-Huckel equation, can be
used t o evaluate t h e dependence of pK on I 14 • a
pK' a
pKO -a
( 2n - 1)
1 + + 0. 1 ( 2n - 1) I
4.15
79

pK' and p K0 are the p K values at given ionic strength and a a
the zero ionic strength respectively for the nth stage of
the ionization of the acid. A is a constant and is known
to be 0 . 51 2 at 25°C. For the separation of weak organic
acids with average pK values of 3-4 the buffering a capacity must be derived from acids with pKa > 5. The
second protolysis of an a cid is genera lly used, for
instance, monophosphate-diphosphate. I n figure 4.2 a p lot
0.5
0.4
0.2 0.4. 0.6 0 .8 1.0
ionic strength
Figure 4.2. The i nfluence of th e ionic stren gth on the
pK values of weak acids . The ~pK value is given for the a a fi r st and second proto ly sis o f phosphate acco r ding the
Davies-equation .
is given of ~pKa versus I, for the first and the second
protolysis of the phosphate buffer in aqueous solutions
according to equation 4.15. In methanol-water mixtures
a more complica ted e q u a tion should b e used, see Gronwall
et al. 15•
I n f luence o f methanol on pH and pKa values
The measure for the acidity in protic solvents, i . e .
the pH value, is define d by
4 .16
80

where ~+ is the proton molality and yH+ is the proton
acitivity coefficient 16 • To determine the acidity of an
unknown aqueous solution, the operational pH definition
is generally used.
4.17
where pH and pH t are the unknown pH value of the test X S
solution and the known pH value of the standard buffer
solution, respectively. Ex and Est are the e.m.f. values
measured in the test and standard solutions.
In the methanol-water mixtures the same procedure is
applicable 17 • The pH is defined by
4.18
The determination of the pH* of hydro-organic mixtures
according to this equation is rather complicated. An
electrometric procedure has been described by the Ligny
and coworkers17 •
If standard buffer solutions of the same solvent
composition as the hydro-organic test solvent are
available, the same operational definition, equation 4.17,
can be used. pHX and pHst are replaced by pH~ and pH:t•
Since preparing standard buffer solutions for different
hydro-organic mixtures is rather time consuming, aqueous
standard buffer solutions are generally used.
4.19
* SymboZs marked with an asterisk refer to water-methanoZ
mixtures to distinguish them from the same symboZs
referring to ne~t aqueous standard soZutions.
81

Happ · h b P 1s t e o served pH value of the hydro-organic
mixture related to an aqueous standard solution. However,
a correction should be made for differences between liquid
junction potentials and glass electrode potentials in
aqueous and methanolic solvents 17 , 18 • The observed e.m.f.
values are given by
E X
E - E0 +E. ref gl,st J,St
= Eref - E*,O + E~ gl,x J,X
Substracting equation 4.20 from equation 4.21, the
operational definition is given by
pH* X
E~ -E. E0 * -E0
J,X ],st + gl,x gl,st
0.05916 0.05916
4.20
4.21
4.22
Eref is the electrode potential of the reference electrod~
E~ and E. t are the liquid junction potentials across J ,X ) 1 S
the interface of test and standard solutions and the
aqueous saturated KCl solution of the reference electrode.
E0 * and E0 are the standard potentials of the glass gl,x gl,st
electrode referring to methanol-water and neat aqueous
solvents. Comparison of the equations 4.17 and 4.22 gives
the following correction factor
E~ - E. J 1 X ] 1 St
EO* - Eo gl;x gl,st 4.23
0.05916 0.05916
If o values are known, aqueous standards can be used for
pH* determination in methanol-water mixtures.
Experimentally found o values of Bates19, de Ligny 20 and
Gelsema 18 are compiled in figure 4.3. The last term of
equation 4. 22 and 4. 23 appeared to be \'li thin experimental
error 21 and can be neglected.
Once a pH* scale is available, pK: values can be
determined by a potentiometric method. When one uses
standard solutions, one actually measures the mixed-
82

mode dissociation constant p~22 , pKm* is calculated with
the appropiate 6 value. The activity dissociation con
stant pK0 * can be calculated using the Gronwall a ·
equation 1 5 or the experimental values of activity
coefficients in water-methanol mixtures at different
ionic strength as found in the literature 2 3•
•0.5
6
-0.5
-tO
-15
-2.0
0 20 40 60 %W:THANOL
80 100
Figure 4.3. Co rrection facto r 6 = p H~pp - pH; plotted
ve r s us t he methano l content o f t he solvent mixture .
Value s a r e take n f rom e Ba t es 19, • de Li gny 20 and A
Gels ema 1 8•
4.3 EXPERIMENTAL
Apparatus
Th.e chromatographic equipment comprised a Waters model
M-6000 A and a Spectra Physics model 740 B pump; a Valco
type 700~ psi and a Rheodyne type 70-10 injection valve;
and a Zeiss PM2A and a Pye LC-3 UV-spectrophotometer. The
columns are home-made with 6.4 rom 0.0. x 4.6 mm I . D.
stainless steel tubing with zero dead volume fittings.
Column lengths of 100 mm and 150 mm are used. All columns
83

00 Table List carb oxylic acids ol>- IV .1. o f us e d
Name Structure Functional groups Abbreviation
R2 R3 R4 R5 R6 R7
I I
~~2 benzoic acid R4 0 COOH H H H H H BA
salicylic acid R5 Rs
OH H H H H SA
25-dihydroxybenzoic acid OH H H OH H 25-DOBA
35-dihydroxybenzoic acid H OH H OH H 35-DOBA
24-dihydroxybenzoic acid OH H OH H H 24-DOBA
246-trihydroxybenzoic acid OH H OH H OH 246-TOBA
246-trimethoxybenzoic acid OCH3 H OCH3 H OCH3 246-TMBA
vanillic acid H OCH3 OH H H VA
R3 R2 R
mandelic acid R4~f-cooH H H H H H OH MA
4-hydroxymandelic acid R5 Rs H
H H OH H H OH MOMA
34-dihydroxymandelic acid H OH OH H H OH DOMA
vani-llilmandelic acid H OCH3
OH H H OH VMA
homovanillic acid H OCH3 OH H H H HVA
phenylacetic acid H H H H H H PAC
34-dihydroxyphenylacetic acid H OH OH H H H DO PAC

are packed, using a balanceJ density slurry packing tech
nique. Titration curves are obtained with a Mettler DV/DK
titration system.
Chemicals
Columns are packed with a nonpolar chemically bonded
stationary phase, LiChrosorb RP-18, mean particle size
5 ~m or 10 ~m (Merck, Darmstadt, G.F.R.). Distilled and
Millipore-Q-reagent grade water (Millipore Corp. Bedford,
Mass., USA) are used for the aqueous buffers. Methanol p.a.
(Merck) is used as organic modifier of the mobile phase.
Phosphoric acid, 85%, and Titrisol-!N-sodiumhydroxide
(Merck) are used to establish the desired pH. Unless
otherwise stated p.a. grade sodiumsulfate (Merck) is used
to establish the desired ionic strength.
The sample solutes have been purchased from Sigma
(St. Louis, USA), Aldrich (Beerse, Belgium) and Merck. In
table IV.! all sample solutes are listed with the
abbreviations used in this study.
Procedur e s
Capacity factors are evaluated from the retention time
of the sample solute, tR, and the retention time of an
unretained component tR . A buffer solution of sligcytly ,o '-':
different concentration as in the mobile phase is used ~o /
mark the tR time. In eluents of low ionic strength / ,o water is used. Small inorganic salts like sodiumnitrate
or potassiurnbichromate are not used because they are
partially excluded from the micropores of the hydrophobic
packing material. Throughout this study phosphate is used
as buffer component. Even for the measurements of k' vs. * pH in the region of pH 3- 5, whe re the buffer index of
phosphate systems is unfavourably low, phosphate is used
because different buffers will influence the capacity
factors as well. pK0 * values are determined by evaluation a
of titration curves. Activity coefficients in methanol-
water mixtures are taken from Oiwa 23 in accordance with
the Gronwall- equation. The sodium activity coefficient
85

in aqueous solutions is calculated according to Bromley 2 4•
From figure 4.3 8 values are taken. A UV-wavelength of
240 nm is used throughout all measurements.
4.4 RESULTS AND DISCUSSION
Influe nce o f pH* and me thanol co n t ent o f the mobile phase
Nonpolar stationary phases are eminently suitable for
the separation of carboxylic acids with buffered water
methanol solutions as mobile phases. The capacity factors
can be shifted either by changing the pH* or by changing
the methanol content of the eluent. The dependence of k'
upon pH* at different methanol contents is measured for
the solutes listed in table IV.l. The capacity factors
are given in table IV.2. ~oth pH and pH* are given. Some
results appear in figure 4.4. The mobile phase consists
of an 0.05 M phosphate solution kept at a constant ionic
strength of 0.2 with sodiumsulfate. Owing to the properties
* of the siliceous support, the pH range is limited and no
complete sigmoidal curve was found for compounds with a
* pKa < 3.5. However, in general the curves follow the
ionic dissociation curve, as is found elsewhere 6 - 1 2 , and
obey equation 4.14. Pietrzyk et al. could use the entire
pH range because of the application of the resins 7 - 11 •
Complete sigmoidal curves have been obtained.
The capacity factors decrease with increasing methanol
content as is generally met with reversed phase chromato
graphy. In figure 4.5, k' versus the methanol content is
plotted for some acids. According to the solvophobic
theory as treated by Horvath et al . 6, capacity factors
should decrease because of the lessening of the surface
tension of the eluent.
Although it is generally ne glecte d, the influ~nce of
the methanol should be examined at constant pH* when
ionic solutes are the subject of investigation. In case
a constant aqueous pH value is used, the ionization degree
of the sample solute will vary with the methanol percen
tage owing to a change in the a c idity of the eluent (see
figure 4.3).
86

15
10
SA
BA
5 PAC
~MA~--~···:.::~=~~~-~lpH ~~2~~~~~~--~--~H*
SA
15
10
~~~;:::~~~H ~~~~~~L-~L-~L-~-PH*
Figure 4. 4 . The e ffect of the
pH on the capacit y f actor s of
diff e r ent carb oxy lic acids
f or s e v e r al elu e n t compo s i ~
t i ons. The up pe r pH~scale i s
r e f erre d to an aqueous stan~
dard solution , the lower pH*
scale is refe rred to a stan~
dard s olution with the mob i le
pha se compo s ition , f or data
s ee tab le IV . 2 . Col umn :
LiChro s orb RP~ 18 , 10 )Jm ,
column l~ngth 100 mm . Eluent :
0 . 05 M phosphate so l ution ,
with Na 2so 2 kept at I = 0 . 2 .
87

Table IV .2. Depe ndenc e of the caJ?aci t y f acto r o f carboxy-
l-ie acids on the mobile phas e compo s ition and pH*.
100% water
Solutes pH 2.0 3.0 4. 0 5.0 6.0 7.0
BA 16.35 6.50 3.68 SA 15.24 10.85 9.50 8.48
25-DOBA 13.28 3.51 3.15 3.06 2.74 25-DOBA 17.33 12.53 6.50 l. 28 0.50 0.39 24-DOBA 10.0 4.91 2.32 l. 91 l. 68
246-TOBA 15.91 7.50 7.28 6.69 6.87 6.03 246-TMBA 17.22 11.81 8.23
VA 26.6 7.03 2.37 l. 06 MA 17.48 9.47 3.28 l. 77 l. 44 l. 29 MOMA 5.88 3 . 24 l. 28 0.66 0.56 0.52 DOMA l. 24 0.59 0.23 0.09 0.06 0.06 VMA 5.27 3.06 l. 22 0.60 0.50 0.48 HVA 47.8 10.78 3.97 2.84 PAC 17.46 8.06 5.90 DOPAC 22.33 21.31 12.84 3.28 l. 25 0.90
90% water 10% methanol
pH = 2.0 3.0 4.0 5.0 6.0 7.0
* pH = 2.0 3.0 4 . 0 5.0 6.0 7.0
BA 22 . 27 4.94 2.24 1.80 SA 7.99 4.54 4.18 4.17
25-DOBA 9.00 4.18 l. 71 1.12 l. 03 l. 03 35-DOBA 3.90 3.33 2.08 0.38 0.15 0.14 24-DOBA 12.89 7.65 2.44 0.81 0.64 0.63
246-TOBA 2.82 2.06 2.05 l. 92 l. 82 l. 83 246-TMBA 42.0 35.3 18.20 4.32 2.91 2.75
VA 13.54 12.50 10.00 2.17 0.67 0.42 MA 6.57 4.70 2.20 0.97 0.85 0.85 MOMA 2.09 l. 42 0.66 0.31 0.26 0.26 DOMA 0.42 0.30 0.11 0.03 0.02 0.02 VMA 1.36 0.97 0.45 0.20 0.15 0.17 HVA 17.85 16.80 13.14 3.30 l. 55 l. 28 PAC 22.20 6.70 3.48 3.15 DO PAC 5.21 4.78 3.40 0.91 0.39 0.32
88

80% water 20% methanol
pH = 2.5 3.0 4.0 5.0 6.0 7.0
pH*= 2.5 3.0 4.0 5.0 6.0 7.0
BA 20.20 18.80 11.64 4.76 1. 60 1.14 SA 19.70 8.94 3.48 2.74 2.26 2.26
25-DOBA 3.08 1. 45 0.67 0.56 0.50 0.50 35-DOBA 1. 51 1. 21 0.69 0.29 0.10 0.07 24-DOBA 5.09 2.70 0.97 0.44 0.32 0.29
246-TOBA 0.97 0.82 0.75 0.75 0.74 0.74 246-TMBA 11.21 10.24 5.74 2.44 1. 37 1.29
VA 5.26 5.07 3. 72 1. 68 0.40 0.20 MA 3.24 2.27 1. 24 0.72 0.56 0.56 MOMA 0.91 0.55 0.31 0.21 0.20 0.17 DOMA 0.18 0.12 0.06 0.01 o.oo 0.00 VMA 0.55 0.39 0.16 0.12 0.10 0.09 HVA 5.95 5.63 3.78 1. 06 0.71 0.54 PAC 16.20 14.78 11.03 5.70 2.20 1. 83 DO PAC 2.05 1. 91 0.97 0.65 0.23 0.14
70% water 30% methanol
pH = 2.5 3.0 4.0 5.0 6.0 7.0
pH*= 2.47 2.97 3.97 4.97 5.97 6.97
BA 11.0 10.58 8.55 2.76 1. 06 0.76 SA 13.05 9.58 3.46 1. 37 1. 26 1. 27
25-DOBA 2.03 1. 55 0.54 0.28 0.26 0.25 35-DOBA 0.68 0.68 0.54 0.17 0.06 0.04 24-DOBA 2.91 2.33 1. 00 0.26 0.19 0.16
246-TOBA 0.55 0.39 0.33 0.26 0.34 0.34 246-TMBA 4.75 4.62 3.41 1.18 0.76 0.73
VA 2.50 2.45 2.04 0 . 88 0.25 0.12 MA 1. 94 1. 84 1.12 0.48 0.38 0.39 MOMA 0.53 0.48 0.28 0.14 0.10 0.10 DOMA 0.11 0.10 0.04 0.02 o.oo 0.00 VMA 0.38 0.29 0.16 0.06 0.06 0.04 HVA 2.39 2.42 2.07 0.88 0.38 0.28 PAC 8.80 8.42 7.10 4.08 1.41 1.15 DO PAC 0.94 0.94 0.80 0.32 0.12 0.10
89

60%
pH = 2.5 3.0
pH*= 2.42 2.92
BA 5.85 5.76 SA 6.75 6.35
25-DOBA l. 29 l. 03 25-DOBA 0.44 0.43 24-DOBA l. 80 l. 56
246-TOBA 0.30 0.24 246-TMBA 2.10 2.00
VA l. 32 l. 24 MA l. 20 1.12 MOHA 0.36 0.29 DOHA 0.11 0.06 VMA 0.22 0.16 HVA l. 25 1.15 PAC 4.65 4.59 DO PAC 0.57 0 . 47
24-008 A 20
15
k'
10
5
OL_~~--22~~L 0 10 20 30 40
%methanol
water 40% methanol
4.0 5.0 6.0 7.0
3.92 4.92 5.92 6.92
5.21 0.94 0.52 0.41 2.73 0.83 0.69 0.73 0.42 0.15 0.13 0.11 0.36 0.04 0.01 0.01 0.85 0.11 0.08 0.06 0.18 0.18 0.17 0 .16 l. 82 0.55 0.41 0.39 1.18 0.28 0.08 0.04 0.88 0.32 0.27 0.28 0.23 0.08 0.07 0.07 0.06 o.oo o.oo o.oo 0.14 0.04 0.03 0.01 1.12 0.28 0.15 0.09 4.21 1.17 0.80 0.55 0.50 0.11 0.06 0.01
10
SA
k' PAC
5 BA
HVA
%methanol
Figure 4.5. Th e eff ect of t h e meth ano l content on the
capacity fac t o r o f some car boxylic acids at constant pH*.
Conditions as in Figur e 1 .
90

In addition to this effect the ionization degree of the
sample solute will vary as well,owing to the influence of
the methanol on the sample dissociation constant pK*. pK* a a values can be obtained from the inflexi:m points of the
sigmoidal curves given in figure 4.4. As the curves were * constructed from only 6 measured points the evaluated pKa
are only little accurate. In table IV.3 some values are
compared with pK* values determined by potentiometric a
Table IV.3. pK* values o f carb oxylic acids in wat er-a . methanol mixtures evaluated by titration and chromato -
graphically.
solvent composition
100% I 0% 80% I 20% 60% I 40%
Ko Ko pKO* Ko* KO* KO* p a p a a p a p a p a
titr chrom. titr. chrom. titr. c hrom.
BA 4.20 4.37 4.4 4.78 4.8
SA 3.00 3.17 3.2 3.38 3.6
MA 3.30 3.69 3.5 4.03 4.4
24-DOBA 3.25 3.2 3.44 3.3 3.75 3.9
titration at the given methanol-water ratio. In both
methods an increase of at least 0.5 pK value is found by
the addition of maximal 40% methanol to an aqueous eluent.
The influence of changes in the eluent acidity or
sample pK: values on the capacity factor are negligible
in case pH• >> pK* or pH* << pK*. However when pH* ~ oK* a a ' ~ a
these influences should be taken into account. If, for * * * * example, the pK value increases from pK = pH to pKa =
* a a pH + 0.5 at constant pH*, the ionization degree will
decrease from 50% to 24%; this means the capacity factor
increases with 0.26 times the difference between the
limiting capacity factors as can be concluded from
equation 4.14.
* Recapitulating we can say that the increase in the pK a
91

I I I 115
I I I I I I I 110 I I I I I I I I I
:s I I
% METHANOL
' ' I I I I
:7 pH* 0
Figure 4.6. Retention behaviour of homovanillic acid
illustrating the increase in the p~ val ue by increasing
methanol content . Valu es t aken fr om table IV.2.
value by the addition of methanol to the aqueous buffer
is a retention enhancement effect in contradiction t o the
retention lessening owing to the change in eluent para
meters, i.e. the surface tension. This increase in the
pK: value i s visualized for homovanilli c acid in figure
4.6. The position of the inflexion points shows the
increase as indicated by t he smal l arrow heads. It appears
92

Table IV .4. Influence of the pK* increase on the capacity a
factors of homovanillic acid at pH* = 4 for various
methanol-water mixtures
% methanol k~x k' X
pK* k'a k'b % methanol0
a)
0 % 2.8
10 % 18 1.3
20 % 6 0.54
30 % 2. 4 0.28
40 % 1.3 0.09
calculated according
pK* and pH*= 4. a
to
a
4. 2 sod
4. 3 12.45 11.53 8
4.4 4.45 3.88 15
4.5 1. 89 1. 57 20
4.6 1. 06 0.83 27
equation 4.14 from k kx• kfe
b) calculated according to equation 4.14 from kHX' kx,
pK = 4.2, assumed to be constant, and pH*= 4. a b
c) retention enhancement of k''a compared to k'' .
d) taken from table IV.2 ..
%
%
%
%
that the solute parameter , i.e. the protonation degree,
is an effect which may not be neglected in case pH* - 2
< pK* < pH*+ 2. For purpose of comparison, table' IV.4 a
shows capacity factors of homovanillic acid, calculated
according equation 4.14, either with the increasing pK:
values or with a constant pKa value of 4.2 at pH* = 4.
The methanol content is varied from 0% up to 40%. The pK:
values are estimated from figure 4.6. For the mobile phase
containing 40% methanol a retention enhancement effect of
27% is found.
In figure 4.7 the effect of the pH* and the methanol
percentage is compiled in four chromatograms. It can be
concluded that a variation in the methanol content mainly
influences the retention. With a variation in the pH*,
greater selectivity effects can be achieved. For the weak
acids we have studied, mobile phases with a low methanol
content (< 20%) and a pH*> pK: seemed optimal.
..93

5
6
lo.oosAU
70% H:P , pH~ 7 .fl6
30%CHpH
[o.o<is AU
-TIME, min.
70% H20 . pH~3 JO%CH30H
6
I o.oos AU
! . L 0 8 12 16 20 24 28 12 16 20 24 28
TIME , min-:--- TIME , mln. -
[o.oosAU
16 20 24 28 3 2 36 40 44 48 52 .56 60 64 68
TIME, min. -
Figure 4.7. Chromatograms showing t he influence of the
pH* and the methanol c ontent of the mobile phas e .
Col umn: Li Chros orb RP-1 8 , d = 5 ~m, column length = p
150 mm. Eluent : 0.05 M phosphate buffer , I= 0 . 2 .
1 = DOMA, 2 = MOMA, 3 = MA, 4 = 24 - DOBA , 5 = 25 - DOBA ,
6 = BA , 7 = SA . Tempera t'IA.re : ambient . Flow = 1 ml/min .
94

In f luenc e o f th e i onic s t Pength
The influence of the ionic strength is studied in neat
aqueous buffers. Augmenting the concentration of the
buffer or addition of indifferent salts. may influence .the
ionic equilibria involved.
First, the influence of the ionic strength is studied
at pH = 2.2. In figure 4.8A the capacity factor k' is
plotted against the ionic strength for an 0.1 M phosphate
buffer to which increasing amounts of sodiumsulfate are
added. For most acids no significant influence of the
ionic strength has been observed. However, for 25-DOBA
the capacity factor decreases with increasing ionic
strength. At pH = 2.2 most sample solutes are completely
protonized and k' = ~kHx· The pK~ for 25-DOBA is about
2.9, so this acid will be partially ionized. The augmen
ting ionic strength will cause an increase of ~pKa' see
equation 4.15. In contradiction to the effect of adding
methanol, the pKa value will decrease, the degree of
ionization will increase, hence the capacity factor will
decrease. In table IV.5 th~ capacity factor of 25-DOBA.
Table IV.5. In fluence of t he ionic stPength on the
capac ity facto P of 25-DO BA a t pH = 2 . 2
Ionic strength pK a ~k~x ~k' k'
0 2.9 30 1 25.2
0.1 2.8 30 2.5 24.4
1.0 2.7 30 4 23.6
is given as a function of the ionic strength for estimated
values of ~kHX and ~~· According to equation 4.14, a
d e crease in k' is found with incre asing ionic s tre ngth.
Our results are not in agreement with the solvopho b ic
theory. According to Horvath's treatment the retention of
non-ionized solutes should substantially increase with
increasing ionic strength (i.e. surface tension) 6 •
However, he teste d his theory for non-ionize d solute s
95

20
Lk.:.X 15
10
• A
25-DO BA
~3~- DOBA
5 f-<;:~:=::::s:==:z=~~ MOMA 1-.. VMA
o~~~~~~~~~~--0.2 0.6 1.0
ionic strength
8
10
5
ionic strength
HVA
25 -0 0 BA
24 ·DO B A MA
OOMA
Figure 4.8 A . Capac ity factor s of undissociated acids
pZot ted ve r sus t he ionic stre ngth . CoZumn: Li Chr osorb
RP- 1 8, d = 10 ~m. EZ uen t: 0.01 M a queous p hosphate buf-p
fe r at pH= 2 .2; i on i c strength i n c re ase d by addi ng Na2so
4.
Figure 4.8 B. Cap acity fa c tors of dis s o c ia t ed acids
pZot t ed vers us t h e ionic str ength . CoZumn : see 4 . 8 A.
EZ uent : aq u eous p h o s phate buffer a t pH ~ 7. 2 ; ioni c
stre ng t h i ncreased b y incr easi n g phosp hate conc e ntr a t ion.
with carboxylic acids at pH= 4 (see figure 1 1 ,refer ence
6). According table III of the same article the components
used are partially ionized. For e xample, vanillilmandelic
acid, pKa = 3.35 at high ionic strength, is ionized for
80-90 %. Therefore, they should follow more or less the
behaviour of ionized acids as we shall discuss below. The
interpretation of his data is even more doubtful because
of changes in the ionization degree due to pKa changes as
p Ka - 1 < pH < pKa + 1 . Similar to our results Pietrzyk
e t aZ . have mentioned that the retention of neutral
96

solutes remained virtually constant for eluents containing
0 - 0. 5 I-1 NaCl 8• Addition of a salt will affect the adsoro
tion of the solutes only when the acids are in the
dissociated form 11 •
Secondly at pH= 7.2 all acids are completely ionized.
Here, a strong influence of the ionic strength on k' was
observed. The ionic strength was increased by augmenting
the sodiumphosphate concentration. The results are given
in figure 4.8B. The retention enhancement for ionized
solutes supposes ionic interaction. With increasing ionic
strength the cation concentration [Na+] increases as well,
and the adsorption at the modified silica surface will be
facilitated. In figure 4.8B a deviation from linear
relationship is found owing to the influence of the
10
Ak . . x
•
• •
HVA
•
•
MA
Figure 4.9. Influence of the cation concentration on the
capacity factors of mandelic acid and homovanillic acid
with correction for the activity coefficients. Column:
see figure 4.8 A. Eluent:re; 0.1 M sodiumphosphate buffer
at pH= 7.0; ionic strength increased by adding Na SO, 2 4
(•J sodiumphosphate buffer at pH= 7.2; ionic strength
increased by increasing sodiumphosphate concentratidn.
97

activity coefficient in accordance with the propounded + theory. In figure 4.9, k' is plotted versus yNa+(Na ] for
homovanillic acid and mandelic acid. The ionic strength
is increased either by adding sodiumsulfate to a sodium
phosphate buffer or by increasing the sodiumphosphate
concentration itself. At equal values for yNa+(Na+] the
mobile phases have different ionic strength. Nevertheless,
both systems have given the same results. Activity
coefficients for Na+ were calculated according to Bromley 2 4 • The linear relationship is in agreement with
equation 4.12. The positive intercept suggests that both
free and complexated anions are adsorbed at the stationary
phase. Puon and Cantwell 2 5 have found the same behaviour
for a cation on a XAD-2 resin. They also suggested a
mixed retention mechanism with ion~pair formation as one
of the components. We have not enough experimental data
to exclude any salting out effect. However, the experimen
tal data fit perfectly well to the assumption of an ionic
interaction.
Influence of the temperature
Some attention is given to the influence of the tem
perature in reversed phase hydrophobic chromatography.
The capacity factors of a number of ionized acids are
measured at 20°C, 25°C, 30°C and 40°C in an aqueous 0.05
M sodiumphosphate buffer at pH= 7. The effect of the
temperature on the separation is twofold: the capacity
factors of all sample solutes decrease and the elution
order is changed. Owing to the pH of the mobile phase the
influence of the temperature on the pK values may be a neglected. As the partition coefficient in a chromato-
graphic process is given by
ln K liH liS
+-RT R
4.24
the partial molar adsorp tion enthalpy can be calculated
from
98

-2.0 ------------~----------~--OOMA
3.2 3.4
Figure 4.10. Van ' t Ho ff plo ts of s ome capacity f actor s
of c arb oxyli c acids. Column: s ee fi gure 4 . 7. Eluent :
0 .05 M phosphate bu ffe r, pH= 7 . 0 .
R dlnk' -liH 4.25
liH is the adsorption enthalpy of a solute transferred
from the mobile to the stationary phase; liS is the molar
entropy of the adsorption process, T is the absolute
temperature and R is the gas constant. I n figure 4.10 lnk'
is plotted versus 1/T.103 . Linear relationships are
obtained. The adsorption enthalpy, calculated by linear
regression of the data given in figure 4.10, vary from -3
up to -30 kjoule/mole (-0.7 up to -7 kcal/mol e ) . Adsorp
tion enthalpies of the same order are found elsewhere for
solvophobic phase systems 5 • Because of the great
differences in the adsorption enthalpy the selectivity
changes greatly when the temperature is varied. In figure
4.11 the separation of some acids is given at the
.99

6
4
7
8 2
5
3
I 0 .005AU
TIME , min--
1 4
6 2
3
5
4
TIME,min
8 7
I 0 .005AU
16
4
2
5 3
2 3
4
6
5
TIME , mln
8 7
I 0.005 AU
8 6
7 I 0 .005AU
Figure 4.11. Chromatograms o f carboxy~ic acids at varying
temperatures . Conditions as i n f i gure 4 . 10 . Flow = 1 m~/min .
1 = DOMA, 2 = 35 - DO BA, 3 = MOMA , 4 = MA , 5 = 24 - DOBA ,
6 = 25 - DOBA , 7 = HVA .
100

temperatures mentioned. The separation cannot be speeded
up unlimited as at high temperatures the resolution gets
lost. As shown thermostatting is necessary for
reproducible results.
4. 5 CONCLUSIONS
The retention of carboxylic acids can be varied
greatly by changes in pH and the methanol content. The
capacity factors are maximal at a pH* << pK*. An increase a of the pH of the eluent causes a decrease in the retention
along a sigmoidal curve, according the acid dissociation
degree. The retention can also be lessened by adding
methanol to the eluent, whereby the increase of pK* is a a retention enhancement effect. While the pH influences
both the selectivity and the retention, the methanol con
tent influences mainly the retention. If methanol is
added to an aqueous eluent, pH and pKa values must be
corrected to interpret the results in terms of ionic
equilibria.
The buffer concentration has a negligible influence on
the retention of nonioniz~d acids. Howeve~, the retention
of ionized acids is increased by increasing ionic strength.
This increase can be explained by complexation with buffer
constituents of opposite sign.
The retention can be lessened by .an increase in the
column temperatures. Special selectivity effects can also
be achieved in this way.
4.6 LITERATURE
1. P. Jandera,
2. s. Eksborg,
Ch romatogr.
3. c. Horvath,
393.
J. Churacek; J. Chromatogr . 86 (1973) 351.
P.O. Lagerstrom, R. Modin, G. Schill; J .
83 (1973) 99.
W. Melander; J. Chromatogr. Sci . 15 (1977)
4. B.L. Karger, J.R. Gant, A. Hartkopf, P.H. Weiner; J .
Chromatogr. 128 (1976) 65.
101

5. C. Horvath, W. Melander, I. Molnar; J. Chromatogr.
125 (1976) 129.
6. C. Horvath, W. Melander, I. Molnar; Anal. Chern . 49
(1977) 142.
7. c.-H. Chu, D.J. Pietrzyk; Anal. Ch ern. 46 (1974) 330.
8. D.J. Pietrzyk, c.-H. Chu; Anal . Chern. 49 (1977) 757.
9. D.J. Pietrzyk, c.-H. Chu; Anal. Chern. 49 (1977) 860.
10. D.J. Pietrzyk, E.P. Kroeff, T.D. Rotsch; Anal. Che rn.
~ (1978) 497.
11. E.P. Kroeff, D.J. Pietrzyk; Anal. Chern. 50 (1978) 502.
12. J. J. Kippling; J. Chern. Soc . ( 1948) 1483.
13. C.W. Davies; J. Chern. Soc. (1938) 2093.
14. D.O. Perrin, B. Dempsey; Buffers f or pH and metal ion
control, Chapmam and Hall, London, 1974.
15. T.H. Gronwall, V.K. LaMer, K. Sandved; Phyzik . Z. 29
(1928) 358.
16. R.G. Bates; Determination of pH, Wiley, New York,
1964 . .
17. C.L. de Ligny, P.F.M. Luykx, M. Rehbach, A.A. Wieneke;
Rec. Trav . Chim . 21 (1960) 699, ibid 713.
18. W.J. Gelsema, C.L. de Ligny, A.G. Remijse, H.A.
Blijleven; Rec. Trav . Chim . 85 (1966) 647.
19. R.G. Bates, M. Paabo, R.G.A. Robinson; J. Phys. Chem.
67 (1963) 1833.
20. C.L. de Ligny, M. Rehbach; Rec. Trav. Chim. 79 (1960)
727.
21. W.J. Gelsema, C.L. de Ligny, H.A. Blijleven; Rec .
Trav. Chim. 86 (1967) 852.
22. D.B. Rorabacher, W.J. MacKeller, F.R. Shu, M. Bonavita;
Anal. Ch ern. il (1971) 561.
23. I.T. Oiwa; J . Phys. Chern . iQ (1956) 754.
24. L.A. Bromley; AIChE J. !1 (1973) 313.
25. S. Puon, F.F. Cantwell; Anal. Chern. 49 (1977}: 1256.
102

CHAPTER 5
The retention mechanism of carboxylic acids and amines in reversed phase ion-pair chromatography
5.1 INTRODUCTION
In r e vers ed phase ion-pair chr o
matography adsorption of the amphi
philic ion precede s the complexa
tion wi th the sample solutes. A
strong adsorption o f this ion-pair
forming ion at the stationar y
phas e is obse r ved in absence of
any sample s olute . Adsorpti on o f
th e sample solutes does not coin
cide with an increase in adsorb~d
amphiphilic ions. An ion-exchan ge
mechanism is clear ly operative.
In the field of chromatographic techniques applicable
to the separation of ionic or ionizable components, there
is a growing interest in ion-pair chromatography. This
supplements the possibilities of the solvophobic phase
systems as described in chapter 4. For strong ac ids or
strong bases the pH cannot be u sed to regulate the r eten
tion owing to limitations of the siliceous support. In
many cases an ion-pair technique can. Furthermore, ion
pair chromatography can be used instead of ion-exchange
chromatography .
.In general, t he sample component is partitioned
between a n aqueous and an organic phase by add ing an
103

extracting ion to the aqueous phase. The ionic sample
solute partially remains in the aqueous phase as a free
ion, partially it is extracted to the organic phase as an
ion-pair. The partition of the ionic component between an
aqueous and an organic phase can be achieved in different
ways. One can choose either between liquid-solid (ad
sorption) chromatography and liquid-liquid (partition)
chromatography or between normal phase and reversed phase
chromatography.
The development of ion-pair chromatography can be
attributed to Schill and his coworkers. They applied their
ion-pair extraction techniques 1 to liquid-liquid partition
chromatography. This technique has been reviewed recently 2 13 • At first polar silica or cellulose columns were
coated with an aqueous phase and the sample solutes were ,
eluted as ion-pair in the organic phase 4 - 10 • A high
sensitivity was obtained by using strongly UV-absorbing
extracting ions 9 - 10 • After the introduction of nonpolar
modified silica supports, Wahlund developed reversed
phase ion-pair partition systems 11- 1 4 • The nonpolar
stationary phase was coated by an organic phase,
1-pentanol or butyronitrile. The solutes were eluted as
free ions in the aqueous phase. Compared to normal phase
systems, retention of the sample solute was more easily
regulated. Aqueous samples can be applied directly. The
degre e of complexation can be influenced by varying the
pH of the mobile phase 15•
Instead of adding an extracting ion to the aqueous
phase, phase systems have been described wherein the
liquid stationary phase is the ion-pair forming reagent
itself 1 6 - 1 7 •
Inde pendently of each other, Haney 1 8 - 1 9 and Knox 20 have
found that the retention of ionized solutes in reversed
phase adsorption chromatography can be increased
considerably by adding a s urfactant to the aqueous mobile
phase. Especially this t ype of ion-pair chromatograp hy is
use d e v e r more for a wide range of ionizable substances.
Severa l names a r e used t o characterize the se phase s y stems
104

as mentioned in the general introduction21-
24• The
surfactants used can be denoted as amphiphilic ions since
they consist of a nonpolar alkyl chain with a terminal
ionic group. The retardation of the sample solutes can be
changed easily by variations in the type and concentration
of the amphiphilic ion, pH, ionic strength and percentage
of organic modifier. Complicated separations can be
optimized with these parameters.
The theory of ion-pair partition chromatography is
straightforward following the equations derived for ion
pair extraction techniques 1 • However, the mechanism for
ion-pair chromatography on alkyl modified silica has not
yet been clearly established 25•
A strong adsorption of a long chain quarternary
ammonium salt, trimethylcetylammonium bromide, has been
reported by Knox 22 • Kissinger 2 6 suggested that the
amphiphilic ions are adsorbed at the hydrophobic packing
material which thereupon may act as a dynamically coated
ion-exchanger. The same mechanism was also proposed by
Kraak e t al . 23 for explaining the retention behaviour of
amino acids in buffered mixtures of water and organic
solvents, containing anionic surfactants. However, they
did not investigate the correlation between the retention
and the amount of surfactant adsorbed, which could have
been an additional proof of the ion-exchange mechanism
proposed. Recently we have shown that the retention of
ionized solutes is proportional to the concentration of
the amphiphilic ion at the stationary phase. Adsorption
isotherms of commonly used surfactants have been measured
in a number of reversed phase systems 27 • 28 • The retention
is owing to ionic interactions with the modified
stationary phase.
A different mechanism has been proposed by Horvath et
al . 24• They state that ion-pairs between the ionized
solutes and the amphiphilic ion are formed in the mobile
phase. The adsorption is due to nonpolar interactions
between the neutral ion-pair and the hydrophobic
stationary phase. Their main argument for this idea is
105
that the bonding of the surfactant to the surface is
negligible. However, the adsorption of the amphiphilic
ion was not measured directly but merely estimated from
the relation between the capacity factor and the amphi
philic ion concentration in the mobile phase.
Westerlund 2 1 has supposed ion-pair formation in the
mobile phase together with adsorption of the free ion. He
derived constants for ion-pair extraction and ion-pair
formation in the mobile phase following the theory of
ion-pair partition systems.
In our experiments we have found that the quantity of
amphiphilic ions, adsorbed at the stationary phase, ex
ceeds by far that of amphiphilic ions in the mobile phase.
We felt that at least for these systems an ion-exchange
mechanism could be clearly operative. In the present study
we confi ne ourselves to aqueous eluents containing a long
chain amine or long chain sulfonates . The retention
behaviour of carboxylic acids and catecholamines is
discussed. Recycling experiments with ion-pair systems
will discriminate between comple xation in the mobile phase
and complexation at the stationary phase. Finally we shall
apply some of our data to the models of Westerlund 21 and
Horvath 2 4 • Their concepts will be shown to be in con
tradiction with our experimental results.
5 . 2 THEORY
Ion - pair partition s y stems
The theory of ion-pair partition chromatography is
based on liquid-liquid partition of an ionized solute.
A quantitative expression for the extraction of a sample
cation RNH; (amine) from an aqueous phase with an
extracting ion S- (sulfonate) to an organic phase is given
by:
106
fRNH 3S] org + -
fRNH 3 ] [S ] aq aq
5.1

where [RNH3S] is the concentration of the ion-pair in
org + _ the organic phase and [RNH3 ] and [S ] are the con-aq aq centrations of the protonated amine and the sulfonate,
respectively,in the mobile phase. As the partition
coefficient K is given by the total · cioncentration of the
amine in the stationary phase divided by the total con
centration of the amine in the mobile phase, K can be
derived for a normal phase system as
(RNH;] 1 K 5.2
(RNH3S] ERNH3
S (S ]
and for a reversed phase system as
K (RNH3S]
ERNH3
S IS-) (RNH;)
5.3
A bar denotes the concentration of the respective ions or
complexes at the stationary phase. Concentrations without
a bar are referred to the mobile phase.
Fransson e t al . 2 9 have shown that rather different
extraction constants, i.e. different extracting ions and
organic phases, are needed in normal phase and reversed
phase systems. In case side reactions occur, as
dissociation of the ion-pair in the organic phase,
conditional extraction constants have to be derived 5 • 11 •
Ion-pair adsorption systems
As noted before. different theories have been presented.
In figure S.l se~e~al possibilities of solute-retention
in a reversed phase adsorption system are given.
Westerlund et al . 2 1 used the concept of partition systems
in their description of the retention mechanism of acids,
X-, with quaternary ammonium compounds Q+, as amphiphilic
ions on a nonpolar stationary phase with buffered aqueous
eluents. They assumed that the retention is partially due
to ion-pair extraction and partially to adsorption. If we
.. 107

® ® © @
mobile RNHi RNH; + 5 - RNH; RNHi Na•
phase
1! 11 + + +
Figure 5 . 1. Equilibr ia i nvolved in reversed phase ion
pair systems as proposed in the literatur e . A ) Adsorp tion
of noncomplexed sample ions . B) Complexation in the
mobile phase whereafter ads orption of t he neutral ion
pair . C) Complexat i on at the stationary phase with
previously adsorbed amphip hilic ions . D) I on- exchange
with buffer ions at adsorbed amphiphilic ions .
convert their equations into our notation; viz. sample
RNH; and counterion S , they derived:
k'
where k' is the total capacity factor, k~ the term for
the amphiphilic ion independent, retention, <I> the phase
ratio and ERNH + the conditional extraction constant.
When the condi~ional e xtraction constant ERNH~S' the . 3
stoichiometric extraction constant E~NH 8 and the i on-
pair formation constant K are given by3
a
108
5.4
5.5
5.6
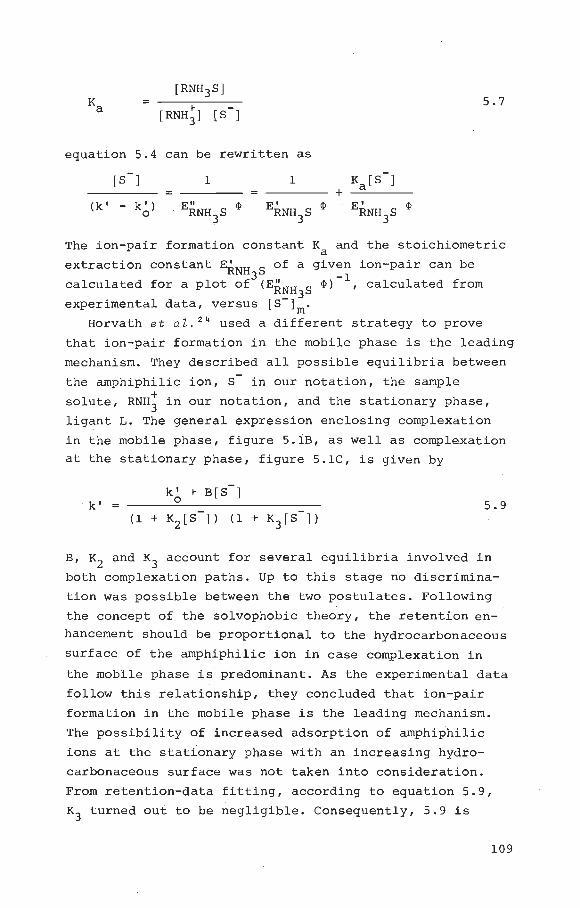
[RNH 3S] Ka
[RNH;] (S-J 5.7
equation 5.4 can be rewritten as
- -l Ka[S l [S 1 1
+ (k' - k I)
ERNH3S <I> ERNH3S <I> ERNH3S <I> 0
The ion-pair formation constant Ka and the stoichiometric
extraction constant ERNH S of a given ion-pair can be 3 -1
calculated for a plot of (ERNH S <I>) , calculated from . - 3
exper~mental data, versus [S lm·
Horvath e t al . 24 used a different strategy to prove
that ion-pair formation in the mobile phase is the leading
mechanism. They described all possible equilibria between
the amphiphilic ion, S in our notation, the sample
solute, RNH; in our notation, and the stationary phase,
ligant L. The general expression enclosing complexation
in the mobile phase, figure 5.iB, as well as complexation
at the stationary phase, figure 5.1C, is given by
k' 5.9
B, K2 and K3
account for several equilibria involved in
both complexation paths. Up to this stage no discrimina
tion was possible between the two postulates. Following
the concept of the solvophobic theory, the retention en
hancement should be proportional to the hydrocarbonaceous
surface of the amphiphilic ion in case complexation in
the mobile phase is predominant. As the experimental data
follow this relationship, they concluded that ion-pair
formation in the mobile phase is the leading mechanism.
The possibility of increased adsorption of amphiphilic
ions at the stationary phase with an increasing hydro
carbonaceous surface was not taken into consideration.
From retention-data fitting, according to equation 5.9,
K3 turned out to be negligible. Consequently, 5.9 is
109

simplified to
k' k~ + K2K4 [S
1 + K2
[S-] 5.10
K2 is the ion-pair formation constant equal to Ka'
equation 5.7, K4 describes the adsorption of the ion-pair
at the stationary phase. K3
describes the adsorption of
the surfactant at the stationary phase.
5.11
5.12
Note that K2 .K4 is equal to E~NH 5 in Westerlund's
approach. In case k' << k' equation 5.8 can be rewritten 0
as
k' E~NH3S [S-]
1 + Ka [S-]
5.8 appears similar to equation 5.10 with
5.13
Equation
E~NH 3 S 4.5 we
K2
K4
and Ka = K2
as described above. In section
shall apply both concepts of complexation in the
mobile phase, equations 5.8 and 5.9, to our experimental
results. Equation 5.11 will be applied to our adsorption
isotherms.
As stated in the introduction, the adsorption of
amphiphilic ions at the stationary phase is ignored by the
previous authors. Further, the influence of the buffer
constituents is neglected in most approaches. In our
opinion, complexation of the sample solute with an
amphiphilic ion, previously adsorbed at the stationary
phase, gives a more realistic description of the retention
mechanism in reversed phase adsorption chromatography. At
110

a pH where all sample solutes are completely ionized, the
partition process may be thought of as the combination of
adsorption of the free ion and an ion-exchange mechanism
(figure 5.1 A and D). As most of our systems are dealing
with catecholamines as sample solutes and alkylsulfonates
as the amphiphilic ion, the total partition coefficient
is given by
K 5.14
with
5.15
5.16
Because in most systems it appeared that KRNH! <<
~KRNH S' ~KRNH+ will be omitted in the following equations. 3 3
The long chain alkylsulfonates are strongly adsorbed at
the stationary phase. The negative charge of the adsorbed
sulfonates is compensated by an increased concentration + of cations, Na , from the buffered eluent near the surface
layer. l'li th the sample ions RNH; an ion-exchange
equilibr~um can be written as
+ ----- + NaS + RNH3 • RNH3S + Na
The ion-exchange equilibrium is described by an
equilibrium constant K . e
(RNH3
S) (Na +]
(NaS] [RNH;)
5.17
5.18
Using capacity factors instead of partition coefficients,
equation 5.14 can be rewritten as
111

k' [NaS]
<PKe + [Na ]
5.19
Equation 5.19 predicts a linear relationship between the --- +
capacity factor k' and [NaS]/[Na ]. Once the adsorption
isotherm is measured this relation can be verified.
Analogous expressions can be derived for cationic
surfactants with anionic sample solutes. For carboxylic
acids with hexylamine as amphiphilic ion we have derived
previously27
k' + ¢/K e
5.20
[Q2B] represents hexylarnine, adsorbed at the stationary
phase and neutralized by phosphate. [B2-] is the divalent
phosphate concentration in the mobile phase. Although the
mobile phase contains monophosphate as well as diphosp hate
ions, the exponent ~ is introduced because from ion
exchange chromatography 3 0 and extraction experiments 31
it is known that divalent ions are bonded more strongly
than monovalent ions.
If we want to use an expression of k' versus the con
centrations of the amphiphilic ion and buffer constituents,
related only to the mobile phase, the equation for the
adsorption isotherm should be substituted in equation
5.19. For a nonbuffered system, Knox 22 has found that the
adsorption of a long chain amine from an aqueous eluent
at the nonpolar stationary phase could be described by a
Freundlich-type isotherm.
5.21
In a previous study we have found the same relationship 27 •
A more detailed study of adsorption isotherms has revealed
that the adsorption of the surfactants depends. on the
buffer concentration as well. Therefore, the adsorption
of a lkyl sulfonates can be described by
112

5.22
Combining equations 5.19 and 5.22 and using a logarithmic
scale we can derive
- + log k' = C + alog [S ] - (1 - Sl log [Na ] 5.23
A similar equation can be given for carboxylic acids with
hexylamine as amphiphilic ion
log k' + 2-c + alog [Q ] - (~ - ~ Sl log [B ] 5.24
5.3 EXPERIMENTAL
Apparatus
The chromatographic equipment used has been described
in chapter 4. For breakthrough curves a Waters type
M-6000A pump and a Siemens type SR 210 differential
refractometer are used.
The recycling system comprises a Waters type M-6000A
pump, a 100 or 30 mro column, and a mixing reservoir. For
minimum dilution the column is connected to the pump
directly after the two pump heads, and narrow-bore tubing
is used for the several connections.
If necessary the column and the mixing reservoir can
be thermostatted by water jackets. A block diagram is
given in figure 5.2. The void volumes of pump and column
are 1.13 and 1.10 ml, respectively. The volume of the
solution in the mixing reservoir varies between 5 and
25 ml. For isotachophoretic analysis home made equipment,
developed and built by Everaerts et al. 32 is used.
Maximum values for complex stability constants are
measured with the same equipment.
Chemicals
Columns are packed with a nonpolar chemically bonded
stationary phase, either LiChrosorb RP-18 (Merck) or
113

; - - --- - - --- - --- -------------------..,
servoir
'
~ ' '
,_....._.~ ... 1---,--~- ---l
stirrer I : __ l ____ j __
1 thermostat
' L.---------
Figure 5.2. Bloc k diagram o f t he recyc le system.
Partisil-ODS (Whatman, Clifton, N.Y., U.S.A.). The buffers
are prepared as de s cribed in section 4.3. In some cases
propanol p.a. (Merck) is used as organic modifier.
Hexylamine (Fluka, Buchs, Switzerland) and alkylsulfonates
(Merck, Eastman Kodak) are used as amphiphilic ions. The
sample solutes are for biochemical use, purchased from
several suppliers. The carboxylic acids and the
catecholamines are listed in table IV.l and V.l,
Table V.l. Li st of catecholamine s used .
name functional groups abbreviation
Rl R2 R3
~RH R I 2 I I 3 HO 0 C-C-N
I 0 \
H H H H H
octopamine OH H OCT noradrenaline OH OH H nor-ADR adrenaline OH OH CH
3 ADR normetanephrine OCH3 OH H nor-META metanephrine OCH3 OH CH3 META dopamine OH H H DOP tyramine H H H TYR 3-methoxytyramine OCH3 H H 3M-TYR
114

Table V.2. Operational sys tem for anionic separatio ns b y
isotachophor e s is .
Anion
Concentration
Counter ion
pH
Additive
Electrolyte
Leading
Cl
0.01 N
Histidine
6
0.05% Polyvinyl
alcohol (Mowiol)
a MES b
Tris
2(N-morfolino)ethanosulfonic acid
Tris (hydroxymethyl)-aminomethane
Terminating
MES- a
Ca. 0.01 N Tris+ b
Ca. 6
None
Table V.3. Operational system for cationic separati ons by
i sotachophoresis.
Electrolyte
Leading Terminating
Cation K+ GABA+ a
Concentration 0.01 N Ca. 0.01 N
Counter ion _ Acetate Cl
pH 5 Ca. 4
Additive None None
a GABA = y-aminobuteric acid
respectively. The composition of the operational systems
used for the isotachophoretic analysis are given in
tables V.2 and V.3.
Procedures
Capacity factors are calculated as described in sec
tion 4.3. A UV-wavelength of 240 nm is used throughout
all measurements. Adsorption isotherms of the amphiphilic
ions are measured by means of breakthrough curves. After
rinsing the column with a buffered eluent without the
amphiphilic ion, the pump entrance is switched to the
115

amphiphilic ion containing eluent. The quantity of
surfactant adsorbed at the stationary phase is calculated
from the net retention volume of the amphiphilic ion and
its concentration in the eluent.
To calculate quantities of the several solutes in the
different parts of the recycling system from measured
concentrations in the mixing reservoir, void volumes of
all parts of the system must be known. The void volume of
the column, Vc' is calculated from the column weight,
packed and filled with solvents of different density:
v c 5.25
w1 and w2 are the total column weights, filled with
solvents 1 and 2, p1
and p 2 are the densities of solvents
1 and 2. This measurement was performed in triplicate
using tetra, ethanol and iso-octane as solvents. Vc could
be determined accurately to within 1%. The quantity of
stationary phase in the column is calculated from the
total column weight. The pump volume including the narrow
bore tubes is calculated from a concentration decrease in
a phosphate solution in the reservoir after recycling
without column, when the pump system is initially filled
with distilled water. The volumes of the solution in the
mixing reservoir are determined by weight.
During a recycling experiment pump and column are
initially filled with phosphate buffer, while the
reservoir contains an aqueous solution of amphiphilic surfactant in phosphate buffer. Concentrations of all
ionic species are measured by isotachophoresis, the proton
concentration by pH measurement. After the first recycling
procedure a known quantity of sample solute is added to
the reservoir. For more accuracy the volume in the
reservoir is decreased. Then the mobile phase is recycled
again until equilibrium is reached.
The influence of complex formation on the effective
mobility of ions is used to examine ion-pair formation
in the mobile phase.
116

5.4 RESULTS AND DISCUSSION
I n f lu e ;J'J e o f t he uoncen tY'at ion of amphiehi li c i on s and
b u ffe;· _-,>n st i "C. u ent; s.
The retention of carboxylic acids and catecholamines is
increased considerably by adding amphiphilic ions to t h e
aqueous buffered eluent. Especially in neat aqueous
eluents at moderate temperatures (20-25°C) only low con
centrations of the surfactant are needed to achieve the
desired effect. Two bonded phases have been used in this
study, mainly varying in their carbon content: LiChrosorb
RP-18, with 19-20% C, and Partisil ODS, with 5% C. Figure
5.3 shows the retention enhancement effect on LiChrosorb
RP-18 for a number of amphiphilic ions. The retention of
carboxylic acids is increased by adding hexylaroine to an
aqueous sodiumphosphate buffer, 0.05 M phosphate, pH= 7.
The retention of catecholamines is augmented by adding
sodium salts of butylsulfonate, hexylsulfonate and cetyl
sulfonate to an aqueous sodiumphosphate buffer, 0.05 M
sodium, pH= 2.7. The measurements are performed at
ambient temperature, - 22°C. The concentration of the
amphiphilic ions is limited owing to their poor solubility
in the neat aqueous eluent. The capacity factors would
increase too much as well.
According to the ion-exchange mechanism, the con
centration of the buffer constituents also plays an
important part. The influence of the phosphate
concentration in hexylamine containing eluents and the
influence of the sodium concentratjon in sulfonate con
taining eluents has been studied in similar systems 27, 33 •
Some results are given in figure 5.4. Because the
retention of dissociated carboxylic acids (figure 4.8B)
is strongly dependent on the buffer concentration, the
overall capacity factors have been corrected for the
capacity factor ~k~. The buffer concentration exhibits a
negligible influence on the retention of protonated
catecholamines in the ranqe we have measured. Therefore
117

15 MA
10
MOMA
-'J5· DOBA
~001MA 2 4 6 8 10 12
[hexylamine] mmole r1
TYR
40
k '
m ·TVR
META
nor-A DR
2 4 6 8 10 [butylsulfonate] mmole r1
META
nor · META
AOR
0.2 0.4 0.6 0.~ 1.0 1 [octylsulfonatej mmole r
Figure 5.3. Effe ct of the surfactant concentration in the
mobil e phase on the capacity factors of acids and amine s.
S t ationa ry phase: LiChrosorb RP- 18 . Eluent : for he xy l
amine : n e at aqueous sodiumphosphate buffer , 0 . 05 M
phosphate , pH = 7 , for sulfonate s: neat aqueous sodium
phosphat e b u ffer, 0 . 05 M sodium , pH = 2 . 7 . Temperature
'\, 2 2°C .
118

@ @ 20
nor·AOR
0.1 Q2 Q3 [phosphate]mole 1·1
0.1 0.2 Q3 [Na•] mole 1·1
Figure 5.4. Effect of the buffer concentration.
Stationary phase: LiChrosorb RP- 18 . Eluent : A) 9.2 mM
hexylamine in neat aqueous sodi um phosphate buffer, pH =
7; B) 0.1 mM o c tylsul f onate i n neat aqueous s o di um phos
phate buffer, p H= 2.7 . Tempera t ure- 22°C .
150 TYR
10
5 10 15 [octylsulfonate] mmole 1·1
1 2 3 4 [dodecylsulfonate] mmole 1·1
Figure 5.5. Effec t of surfactant concentPc tio n in th e
mobile p hase on t he capacity facto r of catecho l amines.
Stationary pha s e: Par t isil ODS . Eluent: aqueo~ s s odium
phosphate buffer con t~ining 2v/v% propanol - ~ , 0 . 01 M
s odi um + sodium f rom sodium s ul fonate salt, p H = 3.
Te mperatur e 40°C .
119

no correction has been applied to these data. In
accordance with an ion-exchange mechanism a strong
d~crease in the capacity factors was observed.
In figure 5.5 k' is plotted versus t he concentration
of octylsulfonate and dodecylsulfonate for catesholamines
on Partisil ODS. Owing to the higher temperature, the
lower carbon content of the packing material and a small
addition of 2-propanol, the sulfonate concentration could
be varied within a broader range. In t he se systems the
addition of the sulfonates to t he 0.01 M sodiumphosphate
buffer brings about a significant increase in the total
sodium concentration in the eluent.
The retention enhancement of the ion-pair forming
surfactants is illust rated with some c hromatograms. In
figure 5.6 the influence of hexylamine on the re t ention
of some carboxylic acids is given. Analogously to figure
4.11, the influence of the temperature is shown in figure
5.7. The increase ink' at lower temperatures is due to
1 4
2
3 0
L 0 2 4 6 T1ME,min -
2
3
4
TIME. min
2
10.0025 AU
6
5
TIME , m ln
3
I 0 .0025 AU
4
6
5
Figure 5 .6. In f lue nce of hexyZamin e on the separation o f
c: .!•'L ,· X?Ii f- ~ , , ,_, .: dr: . CoZumn: LiChrosorb RP- 18 , d = 5 ~m, L = p
.' ·I J mrn . E Z.I .lr<i:: : aaueous s odiumphosphat e buffer, 0.05 M
p~ospha t a , pH= 7 . A = no hexyZamine , B = + 2 . 5 mM, C =
+ " mM he xy lamine . F Zow = 1 mZ mi n- 1 . Tempe rature = ambi ent .
DOMA, 2 = 35 - DOBtl , 3 = MOMA, 4 = VA, 5 = MA ,. 6 = 24 - DOBA
120

TIME ,min-
3
5
0 4 TIME. min
12
L 16
TIME . min
3
2 5 1 2 ' 4
6 I 0 .005 AU r 0 .005 AU 6
4
0 · TIME , min
Figure 5.7. Chromatograms illustr ating the influence of
the temp e rature on th e s epa ra tio n of carboxylic acids in
an ion - pair system . Column : LiChros or b RP- 18 , d = 5 ~m , p
L = 150 mm. Eluent: aqueous sodiumphos phate buffer, 0 . 05 M
phosphat e + 5 mM hexylamine , pH= ? . FZow = 1 ml min - 1 .
1 = DOMA , 2 = 35 - DOBA, 3 = VMA , 4 = MOMA , 5 = VA , 6 = 24 - DOBA .
121

4
23 0 ® 4
23
5
r0.005 AU 5
r0.005AU
TIME, min- TIME, min
2 3 4 I 0.005 AU Jo.005AU
2 5 3
0 TIME, min TIME, min
Figure 5.8. Chrom atograms showing the effeot of butylsul
f onate , hexylsulfonate and ootylsulfonate on the
separation of oateoholamines, when added to the eluen t at
equal oonoentrat ions . Column : LiChrosorb RP-18, d = 5 ~m, p
L = 100 mm . Eluent: aqueous sodiumphosphate buffer,
0.05 M sodium, pH = 2 . 7. A = no sulfonate, B = + 1 mM
butyZsuZfonate, c = + 1 mM hexy ZsuZfonate , D = + 1 mM
ooty ZsuZfonate. Flow = 1 mZ min -1 Temperature ambient. = 1 = no r-ADR, 2 = OCT , 3 = ADR, 4 = nor-META, 5 = DOP.
122

the combined influence of enhanced adsorption of hexyl
aroine and an increase in the ion-exchange equilibrium
constant K . The influence of K predominates. The e · e difference in effect of equal concentrations of butyl-,
hexyl- and octylsulfonate on the retention of some aroine s
is illustrated in figure 5.8. The adsorption onto the
stationary phase augments, causing increased retention
enhancement.
The adsorption isotherms
The adsorption isotherms of the various amphiphilic
ions at the nonpolar bonded phases must be known both as
a function of their concentration in the mobile phase and
as a function of the buffer concentration. Equations 5.19
and 5.20 can be verified with these data. The adsorption
isotherms depicted in figure 5.9 are measured at a
constant buffer concentration of 0.05 M phosphate or
sodium. According to figure 5.4 the adsorption of the
surfactants is measured as a function of the phosphate
and sodium concentration, respectively, -at constant
surfactant concentration. As shown in figure 5.10, an
increase with increasing ionic strength is observed. This
behaviour is in agreement with the results obtained in
chapter 4, figure 4.8B. Using Partisil ODS, see figure
5.11, both the surfactant concentrations and the sodium
concentration are increased as fair quantities of sodium
sulfonates are added to an 0.01 M sodiumphosphate buffer.
All isotherms obey the Freundlich equation as given in
equations 5 .2 1 and 5.22. The slopes calculated from the
measured isotherms are listed in table V.4.
Evaluation of e x perimental resu lts
Once the adsorption isotherms are known, the --!.; 2-!.;
dependence of the capacity factors, k', upon [Q2B] /[B ]
and [NaS]/[Na+], respectively, can be investigated. As
shown in figure 5.12 the relationships between k' and the
concentration of the amphiphilic ion in the mobile phase
(figure 5.3) are in good agreement with equations 5.19 and
123

300
';" Cll
Ql100 0 E :;j_50
300
124
5
0.1 Q5 10 5 10 [surfactantlmob jJmole mr1
10 100 500 [counterionj mob mmole r1
Q5 1.0 [surfactant] mob
2
5 10 jJmole mr1
Figure 5.9. Adsorpt ion iso
therms of amphiphilic ions on
LiChrosorb RP-18. Eluent :
neat aqueou s sodium phosphate + buffer; 1- 4: 0 . 05 M Na , pH =
2.7 ; 5 : 0 . 05 M phosphate , pH
= 7; 1 = butylsulfonate , 2 =
hexylsu lfonate, 3 = octyl
sulfonate , 4 = dodecyl - .
sulfonate , 5 = hexylamine .
Temperature - 22°C .
Figure 5.10. Effect of buff er
concentration on the adsorp
tion of surfactants on
LiChr osorb RP-18. Elue nt:
neat aqueous sodium phosphate
buffe r. 1 : 0 . 01 - 0.2 M
sodium + 0.1 mM octylsulfonate ,
pH = 2 . 7, 2: ibid e x cept 1 mM
octyl s ulfonate , 3: 0. 025 - 0. 2
M phosphate + 10 mM hexylamine ,
pH = 7 . Temperature - 2 2° C.
Figure 5.11. Adsorption iso
therms of alkylsulfonate s on
Partisi l ODS . Eluent: aqueous
sodium phosphate buffer,
2v/v% propanol- 2, 0 . 01 M
sodium + sodium from sodium
sulfonates , pH = 3. 1 = octyl
sulfonate , 2 = dodeayl - ·
sulfonate . Temperature 40°C .

Table V.4: a and S values of adsorption isotherms
according equations 5.21 and 5.22.
Stationary phasea amphiphilic ion a s
LiChrosorb RP-18 butylsulfonate 0.74
hexylsulfonate 0.55 II octylsulfonate 0.46
dodecylsulfonate 0.19
hexylamine 0.59 0.19
Partisil ODS octylsulfonate 0. 72
dodecylsulfonate 0. 72
afar mobile phases see legends figures 5.9, 5.10 and 5.11
bat 0.1 mM octylsulfonate
cat 1.0 mM octylsulfonate
5.20. The slopes of the straight lines are equal to ¢/K e and ¢Ke' respectively. The value of the phase ratio was
estimated from the weight of the packing in the column
and the liquid hold up as described in the previous
section. K values have been calculated with linear e regression. Results are listed in table V.5. It appears
that the Ke values of the sulfonates increase markedly
Table V.5: Ion-exchange equilibrium constants
Stationary phase a amphiphilic ion solute K e
LiChrosorb RP-18 hexylamine MOMA 5.8 II II MA 14.1 II hexylsulfonate ADR 13.1
II nor-META 19.7 II octylsulfonate ADR 23.8 II II nor-META 37.5
Partisil ODS octylsulfonate ADR 2.1 II DOP 3.4
dodecylsulfonate ADR 4.0
DOP 8.3
a for mobile phases see legends figures 5. 3 and 5. 5
125

k~Ll.k~
10 ®
5
k"
10
5
@
02 __ OA
[NaS] ml g-1 [Na•]
MA
nor META
40
30
20
10
©
05 1.0 [NaS] ml g-1 [Na•]
nor META
ADR
1.5
Figure 5-12. Influence of the surfactant concentration at
the stationary phase plotted according to equations 5.19
and 5.20. Conditions as in figure 5.3. Surfactants: A=
hexylamine, B = hexylsulfonate, C = octylsulfonate.
with increasing chain length. A similar effect has been
observed by Plaisance et al. 34 for ion-exchange phenomena
in detergent films at the air-water interphase. This means
that the retention depends not solely on the number of
sulfonate groups adsorbed at the nonpolar surface, but
also on the length of the alkyl chain.
126

10
5
MA
k'
20 @
0.5 __ 10 [NaS] mlg-1 [Na•]
rMETA
1.5
Figure 5.13. I nfluence of the buffer concentration in the
mobile phase plotted according to equations 5 . 19 and 5 . 20.
Conditions as in fi gure 5 . 4 . Surfactants: A= hexy l amine ,
B = octylsul f onate.
The relationships as given in figure 5.4 are treated
likewise. The results are shown in figure 5.13. Once
again, straight lines are obtained. According to equations
5.19 and 5.20 the data points, found with varying
amphiphilic ion concentration and with varying buffer
concentrations, must coincide. However, the slopes in
figure 5.12 and 5.13 differ. This discrepancy is not yet
understood. Probably another mechanism of minor importance
plays a part in the retention mechanism. Recently,
Terwey-Groen et al. 35 published an analogous study about
ion-pair systems. In it a discrepancy was also found
between the influence of the amphiphilic ion concentration
and the bromide concentration. Even no common figures were
found for the two variations. In a recent study on amino
acids, variation of the surfactant concentration and
variation of the buffer concentration have yielded figures
which coincide 28 perfectly.
Using Partisil ODS as stationary phase, the sulfonate
concentrations were varied from 0 to 16 ~mole 1-1 .
127

15
10
5
®
to __ 20 [NaS] ml g-1 [Na•]
TYR
DOP
3.0
k"
200
150
100
50
®
5 10 [Nasl ml g-1 [Na•]
TYR
Figure 5.14: Influence of the sulfonate concentration at
the stationary phase and the sodium concentration in the
mobile phase plotted according to equation 5.19. Conditions
as in figure 5.5. A= octylsulfonate. B = dodecylsulfonate.
Combining the results of figures 5.5 and 5.11, equation
5.19 holds for these systems too as illustrated in figure
5.14. The Ke values are given in table V.5. It appeared
once again that the value of Ke increases with increasing
alkyl chain length of the sulfonates.
In table V.4 we have listed the values of the slopes
of the various adsorption isotherms. Plotting the capacity
factors of carboxylic acids and catecholamines (figures
5.3 and 5.4) according to equations 5.23 and 5.24, we
found mean values of a = 0.6 + 0.05 and B = 0.1 + 0.05
for hexylamine as amphiphilic ion, and a = 0.59 + 0.05
and B = 0.67 + 0.05 for octylsulfonate. The relationships
between the capacity factors of a number of carboxylic
acids and .the amphiphilic ion concentration and buffer
concentration according to equation 5.24 are presented in
figure 5.15.
Furthermore from the data presented in the various
figures it can be concluded that significant changes in
the chromatographic selectivity factor for a solute pair,
a 1 , 2 , occur as a result of a changing coverage of the
128

log (k'-Ak)()
1.0 1.0
0.0 0.0
-1.0 -1.0
-3.0 -2.0 -2.0 -1.0 log [hexylamine] mole 1-1 log (phosphate] mole 1-1
Figure 5.15. Infl uence of the hexylamine concentration
in the mobile phase and the buffer concentration on the
capacity factors of carboxylic acids, plotted according
to equation 5.24. Condition s as in figure 5,3 and 5.4.
nonpolar stationary phase by the amphiphilic ion.
Although some minor deviations are found, in general
we can conclude that the experimental results follow the
ion-exchange mechanism such as proposed in the
theoretical part.
Recycling experiments
As stated by Horvath et al . 2 4, the dependence of the
capacity factor on the concentration of the amphiphilic
ion in the mobile phase cannot lead to distinguishing
between the two ion-pair mechanisms mentioned in the
theoretical part. Although the previously described
e xperiments have shown that the ion-exchange mechanism
fits into the relationships obtained, we felt it
advantageous to look for another method of studying the
ion-pair mechanism. Therefore we adopted a recycling
system, which Kraak described previously for determin ing
partition coefficients in liquid-liquid systems 3 5 • The
experimental set-up has been given in figure 5.2.
129

A buffered mobile phase, containing known quantities
of an amphiphilic ion, w~s brought into equilibrium with
the stationary phase. Then a sample component of opposite
charge was added to the mobile phase, and recycling was
continued. Between several stages of the experiment, the
concentrations of all ionic species were measured by
isotachophoresis. Thus the adsorption and desorption of
the various components with respect to the stationary
phase were calculated.
In figure 5.1 are summarized the several possibilities
of solute retention. If ion-pair formation in the mobile
phase is predominant, 5.1B, adsorption of the sample
component should coincide with an equal adsorption of
surfactant, i.e. the decrease in the sample component
concentration in the mobile phase should equal the
decrease in the surfactant concentration in the mobile
phase. In case complexation of the sample ion with
previously adsorbed surfactant is the leading mechanism,
5.1C, the surfactant concentration should be virtually
constant upon adsorption of the sample ion. An anion
exchange-like mechanism would imply a desorption of buffer
counterions as a result of sample ion adsorption, :5.10.
Four similar experiments were carried out in a .sodium
phosphate buffer of 0.01 M sodium. A representative
result is given in table V.6. For the sake of
surveyability, only the absolute quantities of solutes
in the several parts of the recycling system have been
listed. All solutes except phosphate were totally ionized.
The net charge of the phosphate ions can be calculated
from the pH values. The reservoir contained 10.1 ml of a
buffered solution of octylsulfonate in sodiumphosphate,
0.01 M Na+, pH= 2.8, while column and pump were filled
with phosphate buffer, 0.01 M sodium, pH = 2.8 (state 1).
State 2 corresponds to the situation after recycling.
Most of the octylsulfonate is adsorbed at the stationary
phase. However, only about 70% of the adsorbed cetyl
sulfonate is neutralized by sodium ions. The surplus of
14- equivalents at the stationary phase is partly
130

Table v .6. Results of an adrenaline - octylsu lfonate recycling experiment, at low buffer capacity of the eluent, 0.01 M Na + - pho sphate
state 1 state 2 state 3 state 4
Column, stationary phase:
Octylsulfonate 42.3 + 0.5 42.3 + 0.5 43.0 + 0.5 - -Na + 28.4 + l 28.4 + 1 21.2 + 1
Adrenaline + 11.3 + 0.5 -H+ ? ? ?
Column, mobile phase:
Octylsulfonate 0.9 + 0.1 0.9 + 0.1 0.8 + 0.1 - - -Phosphate 15.4 4.7 + 0.2 4.7 + 0.2 3.0 + 0.2
Na + 11.0 9.1 + 0.1 9.1 + 0.1 10.1 + 0.1 - - -Adrenaline + 0.5 + 0 . 05 - · H+ 1.7 1.1 + 0.1 1.1 + 0.1 0.6 + 0.05 -
Reservoir , pump and capillaries:
Octylsulfonate 52.1 9.0 + 0.5 5.7 + 0.5 5.1 + 0.5 - -Phosphate 93.4 104.1 + 1 66.3 + 1 68.0 + 1 - -Na + 119.2 92.7 + 1 59.2 + 1 65.3 + 1 -Adrenaline + 15.0 + 0.5 3.2 + 0 .5 - -H+ 14.4 10.7 + 0.5 1.1 + 0.1 3.7 + 0.5 - -
1-' w The figures denote quantities of components in 11moles 1-'

compensated by a net positive charge of 5+ equivalents in
the mobile phase.
In their study on polysoap monolayers on aqueous
solutions, Plaisance et a l . 34 described the same situation:
"The counterion (Na+ in our case) may neutralize the
ionized groups in two ways. A fraction of the counterion
is found in the Stern layer and forms ion-pairs with the
ionized groups. The other part is located in the Gouy
diffuse layer and neutralizes the net charge of the
monolayer". A surplus of 9- equivalents in the column
remains. However, as a result of phosphate exclusion from
part of the stagnant mobile phase, no buffer capacity
remains. Because of the high concentration of strong
acidic ions at the stationary phase, a pH shift is likely
to occur.
In state 3 only the situation in the reservoir is
changed. Adrenaline is added and the volume is decreased
to 6.0 ml. Note that the pH in the reservoir increased.
State 4 refers to the situation after the second
recycling. Adrenaline is complexed with previously
adsorbed octylsulfonate. A minor, but reproducible
increase in octylsulfonate at the stationary phase is
observed, owing to increased total cation concentration.
With the adsorption of adrenaline a desorption of sodium
is observed, supporting the ion-exchange concept. The
number of desorbed sodium equivalents is less than the
number of adsorbed adrenaline equivalents. It is like ly
that a minor part of the adrenaline is bonded to
previously protonized sulfonate as the pH may change as
well.
Figure 5.16 shows isotachopherograms, depicting the
results in the anionic operational system. Figure 5. 16A
corresponds to the reservoir composition in state 1. In
figure 5.16B (state 2) the adsorption of the sulfonate
is shown. Owing to dilution of the octylsulfonate in the
reservoir with phosphate buffer in the other parts, only
an 18% decrease in the zone length would be expected. The
phosphate exclusion is incorporated in the phosphate zone
132

MES -@
~
s-
PHOSPHATE
t R ~ -
-time
MES
@
PHOSPHATE
~ -
____ __]'---' c_ ___________ ...J'---t:-olm-e
MES
©
PHOSPHATE
-time
Figure 5.16. Isotachopherograms depicting the concentration
of phosphate and sulfonate in the reservoir. Operational
system: Table V.2. Zone height characterizes the component,
zone length characterizes the sample component concentra
tion. The differential signal is used for accurate
measurement of zone lengths. A) equals the composition in
the reservoir at state 1, B) refers to state 2 and C)
refers to state 4.
133

GABA - @
-4- time
GABA
®
-time
Figure 5.17. Is otachopherograms depicting the concentra
tion of s odium and adrenaline . Operational system: Table
V.3 . A) equals t he compos ition in th e reservoir at state
3, B) refers to state 4 .
length increase owing to the same mixing. After adsorption
of adrenaline, an increase in the sulfonate zone length is
hardly observed, 5.16C.
The adsorption of adrenaline at the stationary phase is
demonstrated in figure 5.17. From both isotachopherograms
the ion-exchange effect can be deduced.
As we are interested in the exclusion of phosphate and
the neutralization of adsorbed octylsulphonate, as a
function of the buffer concentration, two identical
experiments were performed with an initial sodium con
centration of 0.025 M. The results are presented in
table V.7. Initially the volume of the reservoir wa s
134

10.0 ml. In state 3 it was decreased to 5 ml. As a result
of the higher sodium concentration, the quantity of
adsorbed octylsulfonate increased slightly. Again, the
stationary phase exhibits a negative charge, only partly
compensated by a net positive charge of the mobile phase
in the column. The increased buffer capacity does not
change the ratio of adsorbed octylsulfonate and sodium
ions. The adsorption of adrenaline and desorption of
sodium proceeds analogous to those in the previous
experiments. Owing to the increased buffer capacity minor
pH changes are observed.
The data reveal that complexation of adrenaline with
previously adsorbed sulfonate is predominant, according
to the ion-exchange concept. However, one can reject this
conclusion for a chromatographic system, since there was
not enough sulfonate available in the mobile phase to
allow complexation with all adrenaline ions.
Therefore, in a final experiment with the adrenaline
octylsulfonate solute pair, the initial volume of the
octylsulfonate solution in the reservoir was increased
to 25.4 ml. The results are presented in table V.8. The
volume increase resulted in an enhanced octylsulfonate
adsorption, but the number of octylsulfonate equivalents
in the mobile phase increased more than proportionally.
An excess of octylsulfonate compared to adrenaline
remained in the reservoir. In this situation too,
complexation o f adrenaline with previously adsorbed
octylsulfonate prevails.
An analogous recycling experiment was carried out with
hexylamine as surfactant and mandelic acid as sample
component. As we are working around pH= 7, the proton
concentration is negligible. Initially, pump, column and
capillaries were filled with a 0.034 M phosphate buffer,
pH = 6.9. The reservoir was filled with a sodiumphosphate
hexylamine mixture, 0.033 M phosphate, pH = 6.85. The
volume of the reservoir was 7.23 ml. The results are
listed in table V.9.
.135

r-- v. 7. Results of adrenaline octylsulfonate recycling expe riment, increased w Table an - at "' + buffer capacity of the eluent, 0.025 M Na -phosphate
state 1 state 2 state 3 state 4
Column, stationary phase:
Octylsulfonate 43.8 + 0.5 43.8 + 0.5 45.6 + o~5 - -Na + 29.3 + 2 29.3 + 2 21.5 + 2 - -Adrenaline + 10.2 0.5 + -H+ ? ? ?
Column, mobile phase:
Octylsulfonate 0.6 + 0.05 0.6 + 0.05 0.3 + 0.05 - -Phosphate 36.1 22.6 + 0.5 22.6 + 0.5 25.5 + 0.5 - - -Na + 27.5 24.4 0.2 + 24.4 + 0.2 25.6 + 0.2 - - -Adrenaline + 0.8 + 0.05 -H+ 1.9 2.0 + 0.1 2.0 + 0.1 1.1 + 0.1 - - -Reservoir, pump and capillaries:
Octylsulfonate 50.6 6. 2 + 0.5 3.4 + 0.5 1.9 + 0.5 - -Phosphate 298 311 + 2 171 + 2 168 + 2 - - -Na +
-.?.7..4 247 + 2 136 + 2 142 + 2 - - -Adrenaline + 15.5 + 0.5 4. 5 + 0.5 -H+ 20.3 20.3 + 1 6. 3 + 0.5 4. 8 + 0.5 - -
The figures denote quantities of components in ]lmoles

Table v .8. Results of an adrenaline - octylaulfanate recycling experiment~ at increased
total octylsulfonate con tent~ buffer + 0.025 M Na + -phosphate
state l E;ti'lt~ 2 state 3 state 4
Column~ stationary phase:
Octylsulfonate - 76.8 1 76.8 1 80.1 + + + 1 -Na + 55.0 + 4 55.0 + 4 44.3 + 4
Adrenaline + 11.5 + 1 -H+ ? ? ?
Column~ mobile phase:
Octylsulfonate 2.0 + 0.1 2.0 + 0.1 1.9 + 0.1 -Phosphate 36.2 25.1 + 0.5 25.1 + 0.5 28.6 + 0.5 - -Na + 27.5 24.1 + 0.2 24.1 + 0.2 24.6 + 0.2 -Adrenaline + 0.4 + 0.05 -H+ 1.9 1.8 + 0.2 1.8 + 0.2 1.6 + 0.2
Reservoir~ pump and capillaries:
Octylsulfonate 128 49.2 + 0.5 45.5 + 0.2 42.3 + 0.5
Phosphate 682 693 + 4 641 + 4 637 + 4 - -Na + 634 582 + 4 538 + 4 549 + 4
Adrenaline 21.7 + 1 9.8 + 0.5 H+ 46.1 44.0 + 2 37.3 + 2 35.5 + 2
...... . w The figures denote quantities of components in )Jmoles -..J

0 :rabl_e ,,v .•. ,Q,. ~,, If 1'?,,8, !A-, z~~cs pj,. ~
a: .r:'t,9fl/{e t,ic JI,qf-~d \:- . .. ':z .,€!fYl ami n_e r,e cycling experiment
- -------- -- ·- - · ·--- --·· ····-·· ... ~ · -··-~-•.•
c s;t:at!e 1 .pta:te~· 2" 1'-ta:te~ 3 • sta.te· 4 , . ) ·-~
l· --~ . . : ; -~ ~ :_: ~:
Column, stationary phase:
Hexylamine + 70.7 1 70.7 1 73.8 1 + + + -Phosphate 34.7 + 2 34.7 + 2 29.7 + 2 - - -Mandelic acid 14.4 + 0. 5
Column, mobile phase:
Hexylamine + 8.9 0 .1 8.9 + 0.1 8.4 + 0 .1 + -Na + 49.5 30.9 + 0.5 30.9 + 0.5 33.0 + 0.5 -Phosphate 37.4 32.6 + 0.3 32.6 + 0.3 33.3 + 0. 3 -Mandelic acid 0.7 + 0.05
Reservoir, pump and capillaries:
Hexylamine + 147 67.7 1 51.3 1 48.7 1 + + + -Na + 235 254 + 2 192 + 2 190 + 2 -Phosphate 278 248 + 2 188 + 2 192 + 2 -Mandelic acid 19.4 + 0.5 4.3 + 0.5 - -The figures denote quantities of components in !lm oles

State 2 shows a strong adsorp tion of hexylamine. By
supposing that the pH near the stationary phase is
increased, all hexylamine is neutralized by divalen t
phosphate ions. Otherwise a surplus of positive charge
results, as found before .
In state 3 mandelic acid is added to the reservoi r
and the volume is decreased to 5. 2 ml. Af ter recycl1ng
(state 4), exchange of mandelic acid with divalent
phosphate i ons is observed.
Compiling the results of these experi ments we may
state that the concept of ion-pair formation in the
mobile phase is not applicable to our system. The ion
exchange model closely explains the experimental r e sults.
De t ermination o f i on - pair c omp lex stabi l ity c onstants i n
the aque ous phas e
The effective mobility of ionic solutes can be deter
mined by electrophoretic methods. Complex stability
constants can be calculated from accurate mobility deter
minations as the effective mobility is, among others, a
function of the dissociation or complexation degree of a
solute. The stability constant of a complex is defined
by its concentration, divided by the concentrations of
the separate ions, equal to Ka equation 5.7. Hence we can
derive
m 1 (_9. - 1) 5.26 m
m0
is the effective mobility of a sulfonate at [RNH;] = 0;
m is the effective mobility of a sulfonate at [RNH~] > 0.
According to equation 5 .26, the minimum value of Ka' which
can be determined, depends on the reproducibility of the
mobility determination and the amine concentration allowed.
Experiments are performed with the adrenaline cetyl
sulfonate solute pair. Neither b y isotachophoresis nor by
moving boundary electrophoresis a significant change in
the effective mobility of octylsulfonate was measured
13 9

after replacing part of the buffering cation (see table
V.2) by adrenaline. As the reproducibility of our mobility
determination was within 2 % and (RNH;) = 10-3 M in the
isotachophoretic system applied, the stability constant of
a possible octylsulfonate-adrenaline complex must be < 20.
Using moving boundary electrophoresis, ~m = 0.6% has been
observed. But the experimental error of the method is of
the same order. From an octylsulfonate mobility= 24.10 5
2 -1 + em sec and (RNH3 ) = 0.015 can be concluded that the
stability constant is~ 5. Both results reveal that a
complexation in the mobile phase is negligible.
Application o f expe r imental data to othe r i on - pair concept s
Westerlund et al . 2 1 supported the concept of ion-pair
formation in the mobile phase. They calculated the ion
pair formation constant, K , and the stoichiometric a extraction constant, ERNH S' according to equation 5.8.
3 We applied this equation to our data of adrenaline and
dopamine on LiChrosorb RP-18 (data figure 5.3) and on
Partisil ODS (data figure 5.5). In table V.10 are listed
the calculated extraction constants and ion-pair formation
constants.
Table V.10. Ion - pai r formation constant and e x t r action
con s tant according Westerlund et al . 21
Stationary phasea amphiphilic ion solute K ~RNH3 s a
LiChrosorb RP-18 butylsulfonate ADR 84 468
hexylsulfonate ADR 437 6290
octylsulfonate ADR 1943 70422
Partisil ODS octylsulfonate DOP 176 1997
octylsulfonate ADR 224 1430
afor mobi le p hases see l egends figures 5.3 and 5. 5
Although equation 5.8 can be applied to our experimental
results, the obtained values are not in agreement with
direct measurements of ion-pair formation constants. The
140

increase in K with increasing chain length of the a
sulfonates seems rather large.
Horvath 24 used equation 5.9 to illucidate the retention
mechanism in ion-pair chromatography. From data fitting,
the adsorption of the surfactants appeared negligible,
see K3
, equation 5.11. With [L] = [L]0
+ [LRNH 3 ] equation
5.11 can be rewritten as
1 5.27
[S ]
analogously to the derivation of a Langmuir adsorption
isotherm as given by Snyder 37 • Equation 5.27 was applied
to some adsorption isotherms. K3
values are listed in
table V.11. Evidently these values are far from negligible.
Table V.11. K3
values accoPding HoPvath 24, equation 5.11.
Stationary phasea amphiphilic ion K3
LiChrosorb RP-18 hexylsulfonate 1000
octylsulfonate 3500
dodecylsulfonate 10000
Partisil ODS octylsulfonate 175 II dodecylsulfonate 300
afoP mobile phases see legends figuPes 5.9 and 5.11
Then equation 5.9 was applied to the octylsulfonate
adrenaline solute pair on Partisil ODS, a set-up rather
similar to Horvath's system, and on LiChrosorb RP-18.
Equation 5.9 can be rewritten as
k~ - k I ( 1 + K3 [ s ] ) 5.28
From all k' versus [S ] figures a set of equations
similar to xB + yK2 = z is obtained, and B and K2 can be
calculated with multiple linear regression. Results are
given in table V.12. When these values are applied to
141

Table V.12. Equilibrium cons tants for the octy l su l fona te
adrenaline ion-pair ca lcula ted according equat ions 5 . 9
and 5 .11
Stationary phase a B K2 K3
Partisil ODS 1745 18 175
LiChrosorb RP-18 84865 -254 3500
afor mobile phas e s see l egends figur e s 5 .3 and 5.5
equation 5.9, the capacity factors can be recalculated.
These calculated capacity factors equal the capacity
factors observed within 10%. Apparently, equation 5.9,
and not 5.10, fits the experimental results. However, we
have found that K2 must be ~ 5. Negative K2 values cannot
exist.
5.5 CONCLUSIONS
The retention of ionic compounds is greatly increased
by adding amphiphilic ions to the mobile phase. A
subsequent increase in the buffer concentration h~s an
opposite effect. Although these effects have been
explained both by ion-pair formation in the mobil~ phase
and by ion-exchange at the stationary phase, we state
that for aqueous systems ion-exchange is the leading
mechanism.
Adsorption isotherms and recycling experiments have
shown a strong adsorption of arophiphilic ions onto the
stationary phase. The adsorption of surfactants is deter
mined not only by their concentration in the mobile phase
but also by the buffer concentration.
Recycling experiments confirm the complexation of
sample ions with adsorbed surfactants and a simultaneous
desorption of buffer constituents.
The chromatographic data obey the relations derived
for the ion-exchange concept.
142

Ion-pair formation in the mob.ile phase is proved to be
negligible from electrophoretic mobility determinations.
Application of the concept of ion-pair formation in the
mobile phase to the capacity factors observed leads to
erroneous equilibrium constants.
5. 6 LITERATURE
1. G. Schill; in J.A. Marinsky, Y. Marcus (eds.), Ion
Exchange and Solvent Extraction , Vol 6, Marcel Dekker,
New York, 1974, chapter 1.
2. G. Schill, R. Modin, K.O. Borg, B.-A. Persson; in
E.R. Garrett and J.L. Hirtz (eds.), Drug Fate and
Metab olism: Meth ods and Te chniques , Vol 1, Marcel
Dekker, New York, 1977, chapter 4.
3. G. Schill, K.O. Borg, R. Medin, B.-A. Persson; in
J.W. Bridges and L.F. Chasseaud (eds.), Progress in
Drug Metabolism, Vol. 2, Wiley, New York, 1977, chapter
5.
4. S. Eksborg, P.O. Lagerstrom, R. Medin, G. Schill; J.
Chromatogr. 83 (1973) 99.
5. S. Eksborg, G. Schill; Anal . Chern . ~ (1973) 2092.
6. B.-A. Persson, P.O. Lagerstrom; J. Chromatogr. 122
(1976) 305.
7. P.O. Lagerstrom. B.-A. Persson; J . Chromatogr . 149
(1978) 331.
8. S.C . Su, A.V. Hartkopf, B.L. Karger; J . Ch r omatogr .
119 ( 1976) 523.
9. W. Santi, J.M. Huen, R.W. Frei; J. Chromatogr. 115
(1975) 423.
10. J. Crommen, B. Franssen, G.Schill; J . Chromat ogr . 142
(1977) 283.
11. K.-G. Wahlund; J. Chromatogr . 115 (1975) 411.
12. K.-G. ~vahlund, U. Lund; J. Chromatogr . 122 (1976)
269.
13. K.-G. Wahlund, I. Beijersten; J . Chromatogr . 149
(1978) 313.
14. I.M. Johansson, K.-G. Wahlund, G. Schill; J . Chromatogr .
143

149 (1978) 281.
15. I.M. Johansson, K.-G. Wahlund; Acta Pharm . Su~cica
l.i (1977) 459.
16. J.C. Kraak, J.F.K. Huber; J . Chromatogr . 102 (1974)
333.
17. C.P. Terwey-Groen, J.C. Kraak; J. Chromatogr. 138
(1977) 245.
18. D.P. Wittmer, N.O. Nuessle, W.G. Haney; Anal. Chern .
!I (1975) 1422.
19. S.P. Sood, L.E. Sartori, D.P. 1-vittmer, vl.G. Haney;
Anal . Chern. 48 (1976) 796.
20. J.H. Knox, J. Jurand; J . Chromatogr . 125 (1976) 89.
21. D. Westerlund, A. Theodorsen; J . Chromat ogr. 144
(1977) 23.
22. J.H. Kno x , G.R. Laird; J. Chromatog r. 122 (1976) 17.
23. J.C. Kraak, K.M. Jonker, J.F.K. Huber; J . Chromatogr .
142 (1977) 671.
24. C. Horvath, W. Melander, I. Molnar, P. Molnar; Anal .
Chern . i1 (1977) 2295.
25. R. Gloor, E.L. Johnson; J . Chromato gr. Sci. 15 (1977)
413.
26. P.T. Kissinger; Anal. Chern. i1 (1977) 883.
27. J.L.M. van de Venne, J.L.H.M. Hendrikx, R.S. Deelder;
J . Chromatogr . 167 (1978) 1.
28. R.S. Deelder , H.A.J. Linssen, A.P. Konijnendijk,
J.L.M. van de Venne; presented at the 4th Internatio
nal Symposium on Column Liquid Chromatography; Boston,
May 1979: J . Chromatogr._ (1979), in press.
29. B. Franssen, K.-G. Wahlund, I.M. Johansson, G. Schill;
J. Chroma togr . 125 0976) 327.
30. F. Helfferich; I onenaustauscher, Band 1, Grundlage n ~
Structur - Herstellung - Theorie , Verlag Chemie, Weinheim,
1959.
31. T. Sato, J . Appl. Chern . __!2 (1965) 10.
32. F.M. Everaerts, J.L. Beckers, Th.P.E.M. Verheggen;
I s otachophoresis , Th e ory Instrum entation and Ap p li
ca tion. J. Chrom. Library, Vol. 6, Elsevier, Amsterdam,
1976.
144

33. H.J.G. Beckers; Graduation repo r t , Eindhoven University
of Technology, 1979.
34. M. Plaisance, L. Ter-Minassian-Sagara; J. Co~~ . and
Interface Sci ; ~ (1976) 33.
35. C.P. Terwey-Groen, S. Heemstra, J.C. Kraak; J .
Chromatog r. 161 (1978) 69.
36. J.C. Kraak; Thesis, University of Amsterdam, 1974.
37. L. Snyder; Princip~e s of Adsorp tion Chromatography ;
Marcel Dekker, New York, 1968, page 56-57.
145

Summary
The development of nonpolar chemically bonded s t ationary
phases on siliceous supports has brough t about a significant
increase in the application of liquid chromatography to the
separation of water soluble substances. This thesis reports
on the synthesis of a nonpolar chemically bonded stationary
phase and the application of these type phases to aqueous
phas e systems.
In chapter 1, the hydroxyl group concentration and con
figuration of siliceous supports are discussed. Free,
vicinal and geminal hydroxyl groups, partly hydrogen
bonded, occupy the silica surface. A general accepted con
figuration for the surface silanol groups is not described
in the literature. In the present work, a total surface -2 -2 concentration of 4.8 OH nm , = 8 ~mole m , is adopted.
Infrared spectroscopy has proved to be a useful tech
nique to study the dehydration process of a silica surface
and to e x amine the hydroxyl group concentration after
silaniz ation of the polar support , as described in chapter
2. In order to characterize siliceous adsorbents wi t h
d = 5 ~m or 10 ~m, we found the mull technique to be !?
superior to the pressed-disk technique. Moreover, the mull
technique appears eminently suitable for nonpolar chemical
ly modified silicas as compared with the pressed-disk tech
nique. By heating a silica surfa ce up to 600°C , the surfa ce
silanol group concentration decreases with a preference
for loss of hydrogen bonded hydroxyl groups.
Chapter 3 describes the silaniz ation of a microporous
silica support with octyldimethylchlorosilane and octyl
methyldichloros ilane. The repeatability of the s ila ni z ation
proce dure was wi t hin 2% . Par t i a l condensati o n of surface
silanol groups at a drying temperature >200°C, prior to
the chemical modification, decreases the residual h ydroxyl
group concentration; with respect to this residual polari
ty, monochlorosilane s appear to be favourable, both as
found by the infrare d _technique described in ch9p ter 2 .
147

The concentration of bonded octyl chains remains virtually
constant up to a drying temperature of 400°C. Owing to
silanization, the specific surface decreases by 15 - 20 %,
whereas the pore volume decreases by 25 %.
Chapter 4 deals with the retention behaviour of car
boxylic acids on nonpolar chemically bonded stationary
phases with aqueous buffered eluents. The influence of
ionic equilibria on the partition process is described.
The capacity factors follow a sigmoidal curve along the
pH scale, according to the acid dissociation degree. The
retention is lessened by adding methanol to the eluent.
For these systems, the increase in pK: counteracts this
retention decrease. An adjusted pH scale is used to inter
pret the results in terms of ionic equilibria.
rhe retention enhancement of ionized acids with ,increas
ing ionic strength is explained by ionic interactions. The
buffer concentration exhibits a negligible influence on
the retention of non-ionized acids. pK shifts are taken a
into account. A column temperature enhancement causes a
retention decrease, according to the Van 't Hoff equation.
The retention of ionized carboxylic acids and catechol
amines is increased considerably by adding amphiphilic
ions, such as alkylamines or alkylsulfonates, to the
aqueous eluent. The underlying retention mechanism is dis
cussed in chapter 5. The capacity factors follow the
equations derived for an ion-exchange mechanism. This
mechanism is confirmed by recycling experiments. In these
ion-pair systems, adsorption of the amphiphilic ion on to
the stationary phase precedes complexation with sample
solutes . A strong adsorption of amphiphilic ions at the
stationary phase is observed, according to a Freundlich
adsorption isotherm. Adsorption of sample solutes doesnot
coincide with an increase in adsorbed amphiphilic ions.
Complexation in the mobile phase appears to be negligible.
The concept of ion-pair formation in the mobile phase,
as proposed in the literature, leads to erroneous equili
brium constants, when applied to our observed capacity
factors.
148
Samenvatting
Door de ontwikkeli ng van apolaire chemisch gebonden
stationaire fasen wordt vloeistofchromatografie steeds
meer toegepast bij de scheiding van f)Olaire in water oplos
bare stoffen. Dit proefschrift behandelt de synthese van
een apolaire chemisch gebonden stationaire fase en de toe
passing van dit type stationaire fasen op waterige fasen
systemen.
In hoofdstuk 1 worden de hydroxylgroep-concentratie en
configuratie aan een silica-oppervlak besproken. Het
oppervlak is bezet met vrije, vicinale en geminale
hydroxylgroepen, deels een waterstofbrug vormend met nabu
rige silanolgroepen .. of • met geadsorbeerd water. Ten aanzien
van de hydroxylgroep-configuratie bestaat geen eensgezind
heid in de literatuur. In dit onderzoek wordt een hydroxyl--2 -2
groep-concentratie van 4.8 OH nm 8 ~mol m ,
aangenomen.
Infrarood-spectroscopie is zeer bruikbaar voor de be
studering van het ontwateringsverloop van een silica-opper
vlak en voor een onderzoek naar de hydroxylgroep- concentra
tie na silanisatie van de polaire drager, zoals wordt
beschreven in hoofdstuk 2. De mulltechniek blijkt aanzien
lijk beter geschikt dan de pressed-disktechniek om silica
deeltjes van d = 5 ~m of 10 ~m te karakteriseren. Ook p
krijgt de mulltechniek de voorkeur bij de bestudering "an
apolaire chemisch gemodificeerde silica. Bij verhitting
van de silicadrager tot 600°C neemt de hydroxylgroep-con
centratie aan het oppervlak sterk af waarbij waterstofbrug
vormende hydroxylgroepen als eerste desorberen.
Hoofdstuk 3 beschrijft de silanisatie van een micro
poreuze silicadrager met octyldimethylchloorsilaan en
octylmethyldichloorsilaan. De reproduceerbaarheid van deze
procedure ligt binnen 2 %. Met de beschreven infraroodtech
niek wordt aangetoond dat de residuele hydroxylgroep - c on
centratie verlaagd wordt door een gedeeltelijke condensatie
van oppervlakte-hydroxylgroepen bij een droogtemperatuur
149

0 . > 200 C voorafgaand aan de chemische modificatie; mono-
chloorsilanen verdienen de voorkeur als silileringsreagens.
De concentratie van gebonden alkylketens blijft nagenoeg
constant tot een droogtemperatuur van 400°C. Na modificatie
is het specifiek oppervlak met 15 - 20 % afgenomen en het
porievolume met 25 % afgenomen.
Hoofdstuk 4 behandelt het retentiegedrag van carbonzuren
op een apolaire stationaire fase met waterige gebufferde
eluenten. De invloed van ionogene evenwichten op het ver
delingsproces wordt beschreven. De capaciteitsfactoren v61-
gen een sigmoidale curve als functie van de pH, overeen
komstig de dissociatiegraad van het zuur. De retentie neemt
af bij toevoeging van methanol aan het eluent. Hierbij
werkt de pK*-toename de retentie-afname tegen. Een aange-a
paste pH-schaal wordt gebruikt.
De retentietoename van gedissocieerde zuren bij toenemen
de ionsterkte is verklaard met behulp van ionogene inter
acties. De ionsterkte vertoont een verwaarloosbaar effect
op de retentie van niet-geioniseerde zuren. Met pKa-waarde
verschuivingen is rekening gehouden. Een temperatuurverho
ging van de kolom veroorzaakt een retentie-afname overeen
komstig de Van 't Hoffvergelijking.
De retentie van geioniseerde carbonzuren en catecholami
nes neemt aanzienlijk toe bij toevoeging van amfifiele
iorien, zoals alkylamines en alkylsulfonaten, aan de waterige
mobiele fase. Hoofdstuk 5 behandelt het er aan ten grondslag
ligge nde retentiemechanisme. Een sterke adsorptie van amfi
fiele ionen aan de stationaire fas e wordt waargenomen, over
eenkomstig een Freundlich-adsorptie-isoterm. Een ion-wisse
lingsmechanisme verklaart de verkregen capaciteitsfactoren.
Met behulp van een rondpompsysteem wordt de geldigheid van
dit mechani s me bevestigd . Adsorp tie van amfifiele ionen aan
de sta tionaire fase gaat vooraf aan comp lexe ring met mon
stercomponenten. Ion-paarvorming in de mobiele fase is ver
waarloosbaar. Het concept van ion-paarvorming in de mobiele
fase, zoals voorgesteld in de li teratuur, leidt tot irre(He
evenwichtsconstanten, indien toegepast op onze meetwaarden.
150

Curriculum vitae
De schrijver van dit proefschrift werd geboren op
8 december 1950 te Echt. Na het behalen van het diploma
Gymnasium f3 aan het Bisschoppelijk College te Roermond
werd in september 1969 begonnen met de studie Scheikundige
Technologie aan de Technische Hogeschool te Eindhoven.
Het ingenieursexamen werd met lof behaald op 29 oktober
1975 na een afstudeeronderzoek betreffende isotachoforese
bij de vakgroep Instrumentele Analyse onder leiding van
wijlen Prof.Dr.Ir. A.I.M. Keulemans.
Van 1 februari 1976 tot 1 augustus 1979 was de auteur
werkzaam als wetenschappelijk ambtenaar in bovengenoemde
vakgroep. In deze periode is het onderzoek verricht dat
tot dit proefschrift heeft geleid.
Vanaf 1 augustus 1979 is hij verbonden als wetenschap
pelijk medewerker aan het Philips Natuurkundig Laborato
rium te Eindhoven.
151

Dankwoord
Aan het totstandkomen van dit proefschrift hebben velen
een bijdrage geleverd.
De directie van DSM Research, Geleen, ben ik zeer
erkentelijk voor het verleende promotiestipendium, zonder
welk dit onderzoek niet uitgevoerd had kunnen worden.
Dr.Ir. R.S. Deelder, DSM Research, wil ik in het bijzonder
danken voor het starten van het project, de stimulerende
dis~ussies en zijn waardevolle suggesties.
Binnen de vakgroep Instumentele Analyse ben ik veel
dank verschuldigd aan mijn voorgangers Dr.Ir. J.H.M. van
den Berg en Ir. P.J.M.W. Claassen, die mij vertrouwd
hebben gemaakt met de vele aspecten van hoge druk vloei
stofchromatografie. Ir. A.P. Konijnendijk ben ik veel dank
verschuldigd voor zijn inzet en enthousiasme bij de uit
voering van vele ion-paar experimenten. Niet in de laatste
plaats ben ik mijn afstudeerders Ir. J.P.M. Rindt,
Ir. J.L.H.M. Hendrikx, Ir. G.J.M.M. Coenen en Ir. H.J.G.
Beckers en de stagiair G. van de Loop zeer erkentelijk
voor hun enthousiaste medewerking qan de in dit proef
schrift beschreven onderwerpen.
Voorts gaat mijn dank uit naar Mw. B.A.M. Berk-Schel
lekens voor het zorgvuldig typen van het manuscript, naar
Dhr. A.C.G.M. van Rijsewijk voor het verzorgen van vele
tekeningen en naar Dhr. H.J.A. van Beckum voor de taal
kundige correctie van het manuscript.
Tenslotte dank aan alle leden van de vakgroep Instru
mentele Analyse voor hun collegialiteit en de fijne sfeer
waarin ik heb kunnen werken.
152

Stellingen
1 Rfizicka en Hansen maken in hun definitie voor dispersie
in "flow injection analysis" technieken ten onrechte geen
onderscheid tussen verdunning en verblijftijdspreiding.
J. Rfizicka, E.H. Hansen; Anal . Chi m. Ac t a 106 (1979) 207.
2 De toepasbaarheid van Snyder's adsorptiemodel voor de
standaardisatie en selectiviteitsbepaling van een met
octadecylsilaan gemodificeerde silica is alleen verklaar
baar door een hoge residuele hydroxylgroup concentratie
van het gesynthetiseerde materiaal.
W.E. Hammers, R.H.A.M. Janssen, A.G. Baars, C.L. de
Ligny; J. Chroma togr. 167 (1978) 273.
L.R. Snyder; P r i nciples of A.dsorption Chromatogra phy ,
~arcel Dekker, New. York, 1968.
3 In reversed phase vloeistofchromatografie moet het
gebruik van anorganische zuurrestionen te~ bepaling van
capaciteitsfactoren vermeden worden.
G.E. Berendsen, L. de Galan; J . Liquid Chromatogr . 1
(1978) 561.
C. Horvath, W. Melander, I. Molnar; Ana l. Chern .
49 (1977) 142, .!2. (1977) 2295.
4 De toepassingsmogelijkheden voor een microgeleidbaar
heidsdetector in de hoge druk vloeistofchromatografie
verdienen meer aandacht.
5 Bij rhet vervaardigen van kolommen met behulp van de
"balanced density" slurry-pakmethode is het vervangen van
tetrachloorkoolstof door tetrachloorethyleen aanvechtbaar.
C.L. Guillemin, J.P. Thomas, S. Thiault, J.P. Bounine;
J. Ch roma to gr. 142 (1977) 321.
6 Het toekennen van een geleidbaarheid aan afzonderlijke
ionen is principieel onjuist.
H~ndbook of Chemistry and Physics; 5th edition, CRC Press
Inc., Cleveland, Ohio, 1976, pag. D-153.
Landolt BBrnstein Zahlenwerte und Functi onen; II Band,
Teil 7, Springer Verlag, Berlin, 1960, pag. 257.
7 De asymetrische piekvorm, optredend bij de scheiding van
antidepressiva met behulp van een reversed phase i on-paar
vloeistofverdelingssysteem, moet verklaard worden door
interactie van genoemde stoffen met niet gesilaniseerde
hydroxylgroepen van het dragermateriaal.
K.-G. Hahlund, A. Sokolowski; J . Chromatogr .
151 (1978) 299.
8 In eindex amenopgaven V .1-¥'. 0. zouden slechts dan nieuwe
begrippen geintroduceerd mog€m worden indien deze door
de samenstellers op de juiste wij z e geformuleerd worden .
Eindexamen Scheikunde V.W.O. 1979, opgave II,
Staatsdrukkerij, Den Haag.
9 Economische belangen zullen een ruime toepassing v an
alternative geneeswijze belemmeren.
Eindhoven, 14 september 1979 J.L.M. van de Venne