Nonpharmacologic Interventions for Treatment-Resistant ... file©Institute for Clinical & Economic...
66
©Institute for Clinical & Economic Review, 2011 Page 1 The New England Comparative Effectiveness Public Advisory Council Public Meeting – December 9, 2011 Nonpharmacologic Interventions for Treatment-Resistant Depression: Supplementary Data and Analyses to the Comparative Effectiveness Review of the Agency for Healthcare Research and Quality FINAL MEETING REPORT – December 22, 2011 Completed by: The Institute for Clinical and Economic Review
Transcript of Nonpharmacologic Interventions for Treatment-Resistant ... file©Institute for Clinical & Economic...
copyInstitute for Clinical amp Economic Review 2011 Page 1
The New England Comparative Effectiveness Public Advisory Council
Public Meeting ndash December 9 2011
Nonpharmacologic Interventions for
Treatment-Resistant Depression Supplementary Data and Analyses to the Comparative Effectiveness Review of the
Agency for Healthcare Research and Quality
FINAL MEETING REPORT ndash December 22 2011
Completed by
The Institute for Clinical and Economic Review
copyInstitute for Clinical amp Economic Review 2011 Page 2
Table of Contents
Introduction 3
1 Background 4
2 Clinical Guidelines 8
3 Medicare National and New England Private Insurer Coverage Policies 11
4 New Evidence Following AHRQ Review 15
5 Analysis of Comparative Value 18
51 Methods 18
5 2 Results 24
53 Conclusions 32
54 Comparison of ICER Analysis to Published Cost-Effectiveness Analyses 33
6 Questions and Discussion 34
7 Public Comment 42
References 43
Appendix A 51
Appendix B 61
copyInstitute for Clinical amp Economic Review 2011 Page 3
Introduction
To make informed healthcare decisions patients clinicians and policymakers need to consider many different kinds of information Rigorous evidence on the comparative clinical risks and benefits of alternative care options is always important but along with this information decision-makers must integrate other considerations Patients and clinicians must weigh patientsrsquo values and individual clinical needs Payers and other policymakers must integrate information about current patterns of utilization and the impact of any new policy on access equity and the overall functioning of systems of care All decision-makers at one level or another must also consider the costs of care and make judgments about how to gain the best value for every healthcare dollar The goal of this initiative is to provide a forum in which all these different strands of evidence information and public and private values can be discussed together in a public and transparent process Initially funded by a three-year grant from the federal Agency for Healthcare Research and Quality (AHRQ) and backed by a consortium of New England state policy makers the mission of the New England Comparative Effectiveness Public Advisory Council (CEPAC) is to provide objective independent guidance on how information from adapted AHRQ evidence reviews can best be used across New England to improve the quality and value of health care services CEPAC is an independent body of 19 members composed of clinicians and patient or public representatives from each New England state with skills in the interpretation and application of medical evidence in health care delivery Representatives of state public health programs and of regional private payers are included as ex-officio members of CEPAC The latest information on the project including guidelines for submitting public comments is available online cepacicer-revieworg The Institute for Clinical and Economic Review (ICER) is managing CEPAC and is responsible for developing adaptations of AHRQ reviews for CEPAC consideration ICER is an academic research group based at the Massachusetts General Hospitalrsquos Institute for Technology Assessment ICERs mission is to lead innovation in comparative effectiveness research through methods that integrate evaluations of clinical benefit and economic value By working collaboratively with patients clinicians manufacturers insurers and other healthcare stakeholders ICER develops tools to support patient decisions and medical policy that share the goals of empowering patients and improving the value of healthcare services More information about ICER is available at wwwicer-revieworg ICER has produced this set of complementary analyses to provide CEPAC with information relevant to clinical and policy decision-makers in New England This supplement is not meant to revisit the core scientific findings and conclusions of the AHRQ review on ldquoNonpharmacologic Interventions for Treatment-Resistant Depression in Adultsrdquo but is intended to supplement those findings with 1) updated information on the patient management options for treatment-resistant depression published since the AHRQ review 2) regional and national data on prevalence utilization and existing clinical guidelines as well as payer coverage policies and 3) the results of budgetary impact and cost-effectiveness analyses developed to support discussion of the comparative value of different management options This report is part of an experiment in enhancing the use of evidence in practice and policy and comments and suggestions to improve the work are welcome
copyInstitute for Clinical amp Economic Review 2011 Page 4
1 Background
11 The Condition Major depressive disorder (MDD) is a common and debilitating condition on an annual basis it is estimated that nearly 14 million Americans will have at least one episode of MDD (Kessler 2003) The impact of MDD is varied and complex it has been found to negatively affect physical functioning quality of life productivity and interpersonal relationships often in an inter-related fashion (Klerman 1992) MDD is also considered a major risk factor for Type 2 diabetes and coronary heart disease (von Knorring 1996) and has been found to complicate the management and worsen the severity of many chronic conditions such as HIVAIDS Parkinsonrsquos disease and multiple types of cancer (Cassano 2002) For many patients a cornerstone of treatment for MDD is the use of antidepressant medications such as selective serotonin reuptake inhibitors (SSRIs) and serotoninnorepinephrine reuptake inhibitors (SNRIs) typically in combination with a form of psychotherapy While medications are effective at reducing depressive symptoms in a significant number of patients nonresponse to medications is common The rate of nonresponse to one or more medication attempts has been estimated to range from 30-50 among patients presenting with a first episode of MDD (Cadieux 1998 Thase 1997) While definitions of so-called ldquotreatment-resistantrdquo depression (TRD) vary this generally refers to patients with persistent depression after attempted management with two or more medications The heterogeneity of patient populations with MDD the complexities involved in managing these patients and the lack of a universally-effective treatment all combine to make MDD one of the most significant contributors to growing healthcare costs The total burden of depression has been estimated at over $80 billion dollars annually in the US (Greenberg 2003) nearly two-thirds of which is a consequence of lost work productivity due to depressive symptoms The burden is most pronounced among patients with TRD A recent study estimated total annual costs among employees with TRD to be nearly $15000 per employee which was more than twofold higher than costs among depressed employees without TRD (Greenberg 2004) Evaluated costs included direct medical costs and indirect costs such as disability and absenteeism Given the failure of repeated treatment efforts to evoke a clinically-significant and lasting response for many patients along with the costs and system impacts associated with managing these patients there is significant interest on the part of patients clinicians policymakers and other stakeholders in exploring different management options for TRD This supplementary report builds on the conclusions of the AHRQ review by describing recommendations and payer coverage policies for selected nonpharmacologic management options for TRD identifying any new evidence on these options published since the AHRQ review and finally developing a simulation model to use findings from the AHRQ review to quantify the potential clinical and economic impact to the New England region of changes in the use of nonpharmacologic therapy for TRD
copyInstitute for Clinical amp Economic Review 2011 Page 5
12 Management Options for TRD The management options of interest for this evaluation include electroconvulsive therapy (ECT) repetitive transcranial magnetic stimulation (rTMS) vagus nerve stimulation (VNS) and two alternative forms of psychotherapy cognitive-behavioral therapy (CBT) and interpersonal therapy (IPT) These interventions are described in more detail below Electroconvulsive Therapy (ECT) ECT formerly known as ldquoelectroshock therapyrdquo has been available for use in the US for over 70 years and has been used for depression as well as other psychiatric conditions including schizophrenia catatonia and mania (Greenhalgh 2005) ECT involves passing an electric current through the brain to produce a brief convulsion or seizure These seizures are thought to produce immediate changes in brain chemistry that reverse symptoms of certain mental illnesses During the procedure electrodes are placed at the bifrontal bilateral or right unilateral positions on the head The procedure is performed under general anesthesia Muscle relaxants also may be used to prevent violent seizures and a mouth guard may also be used depending on the patientrsquos previous reactions to ECT The seizures induced by ECT typically last 30-60 seconds each and are measured by EEG monitoring The entire procedure lasts approximately 10-15 minutes A course of ECT typically involves sessions 3 times a week for 2-4 weeks depending on depressive severity and the patientrsquos tolerance for the procedure (Mayo Clinic 2011) Immediate risks of ECT and anesthesia may include nausea headache jaw pain and muscle stiffness and soreness Patients also frequently report confusion immediately following the procedure which may last from a few minutes to several hours Of most concern is memory loss which may involve periods of time before ECT during ECT treatment or even after treatment has stopped (Mayo Clinic 2011) however these symptoms appear to dissipate over time (OrsquoConnor 2003) Relapse rates greater than 50 after ECT have been reported particularly among patients without maintenance medication therapy (UK ECT Review Group 2003) In response to this some practitioners have recently begun performing ldquocontinuation ECTrdquo in which patients receive ECT at a reduced frequency (eg once per week once per month) but for a longer overall treatment duration (ie for one year or longer) (van Waarde 2010) Because ECT was introduced prior to US Food and Drug Administration (FDA) device regulation it was not subjected to formal review and approval as a device It is classified as a high-risk ldquoclass IIIrdquo device indicating that insufficient information exists to provide reasonable assurance of its safety and effectiveness Earlier this year the agencyrsquos Neurological Devices Panel advised the FDA that ECT should retain its class III designation despite calls from the psychiatry community to change this categorization given its longstanding use (Lowry 2011) Repetitive Transcranial Magnetic Stimulation (rTMS) rTMS involves the placement of a small wire coil on the scalp that conducts a varied and powerful electric current through it creating a magnetic field through the tissues of the head (Wassermann 1998) The current elicited by the electromagnetic coil is thought to stimulate nerve cells in the region of the brain involved in mood regulation and depression (Walter 2001)
copyInstitute for Clinical amp Economic Review 2011 Page 6
The procedure is performed in an office setting without anesthesia Once the coil is placed the electric current is turned on and off repeatedly at various locations on the head to find the optimal location (a process called ldquomappingrdquo) When the current is on a series of loud click or taps can be heard the patient may be given earplugs to reduce the effects of these clicks Once the optimal location is found the physician will increase the magnetic dose until the patientrsquos fingers or hands twitch (known as the ldquomotor thresholdrdquo) (Mayo Clinic 2011) This is the dose that will be used for the session Sessions are typically 40 minutes in length after which the patient can usually resume normal activities Treatment is typically administered daily (excluding weekends) for 2-6 weeks (Mayo Clinic 2011) Immediate side effects of rTMS include headache or scalp discomfort from the procedure tingling spasms or twitches in the facial muscles lightheadedness and hearing discomfort from the procedure noise Most of these effects are transient and improve throughout the course of treatment (Mayo Clinic 2011) Rarely rTMS has been reported to invoke seizures and may also produce mania in patients with bipolar disorder hearing loss from procedure noise also has been reported (Belmaker 2003) Other forms of electromagnetic therapy have begun to emerge Recently a novel coil known as the ldquoH-coilrdquo has been developed to enable stimulation of deeper brain regions (ie ldquodeep TMSrdquo) (Rosenberg 2010) In addition magnetic seizure therapy (MST) has also been developed in which magnetic energy is used to induce therapeutic seizures In contrast to ECT these seizures are focal and limited to the prefrontal cortex in an attempt to limit any deleterious effects on cognition or memory (Kayser 2011) The FDA first approved rTMS in October 2008 it is indicated for the treatment of MDD in adults who have failed to achieve satisfactory improvement from at least one prior antidepressant medication used at or above the minimum effective dose and duration (US FDA 510(k) documentation 2008) Vagus Nerve Stimulation (VNS) VNS involves the surgical implantation of electrodes around the left vagus nerve and repeated stimulation of the nerve by electrical pulses Originally studied as a means to reduce seizure activity in patients with epilepsy the VNS device was found to improve mood and depressive symptoms in these patients (Lulic 2009) The procedure involves the implantation of a stopwatch-sized pulse generator in the upper left side of the chest and guiding of the lead wires under the skin to the neck where the electrodes are then attached to the left vagus nerve through a second incision Surgery is done on either an outpatient basis or with an overnight hospital stay Following recovery from surgery the pulse generator is switched on during an office visit and programmed Stimulation is tested at various levels but typically occurs every 5 minutes and each occurrence lasts for 30 seconds (Mayo Clinic 2011) Patients are given a handheld device that allows the generator to be turned off for certain situations (eg public speaking exercise) The device typically remains implanted for 10 weeks but can be left in for longer or shorter durations depending on patient response
copyInstitute for Clinical amp Economic Review 2011 Page 7
Risks of VNS include those associated with any surgical procedure (eg pain infection reactions to anesthesia) as well as those specific to the surgical location such as temporary paralysis of the vocal cords (George 2005 Rush 2009) Other side effects may include voice alteration cough neck pain difficulty swallowing tingling sensations and shortness of breath (Rush 2009) The FDA approved VNS for TRD in July 2005 with a specific indication for ldquoadjunctive long-term treatment of chronic or recurrent depression for patients 18 years of age or older who are experiencing a major depressive episode and have not had an adequate response to four or more adequate antidepressant treatmentsrdquo (US FDA PMA suppl 2005) Cognitive-Behavioral TherapyInterpersonal Therapy (CBTIPT) Use of cognitive-behavioral techniques for psychotherapy first became popular in the 1960s It is a structured form of psychotherapy that aims to modify negative andor inaccurate thinking and is used for a wide variety of conditions including depression The cognitive model involves four key steps (1) identification of troubling situations or conditions (2) awareness of the patientrsquos thoughts emotions and beliefs about these conditions (3) identification of negative andor inaccurate thinking or behavior in relation to these beliefs and finally (4) challenging of identified negative thoughts or beliefs (DeRubeis 1990) With regard to depression there is an emphasis on negatively distorted thinking and deficits in learning and memory (DeRubeis 1990) While the duration of treatment varies by condition and severity a course of CBT typically involves 10-20 one-on-one treatment sessions with a trained therapist lasting 45-60 minutes each (Mayo Clinic 2011) In contrast IPT was developed as a treatment modality specifically for depression in the 1970s and 1980s This approach is modeled on the identification of four key problem areas (1) grief after the loss of a loved one or a relationship (2) role disputes involving differing expectations for the patient and another involved in a relationship with the patient (3) role transitions involving a change from an old to new role in the workplace or other setting and (4) interpersonal deficits involving communication issues social isolation and other concerns (Swartz 1999) Patients and their therapists may choose to explore all or only some of these problem areas The stages of treatment typically progress from definitive diagnosis and identification of problem areas to creation of a ldquotreatment contractrdquo involving defined expectations for both therapist and patient (Weissman 2006) While duration of treatment varies based on the problem areas identified IPT is typically a focused short-term approach employing weekly sessions over a 12 to 16-week treatment duration (Markowitz 2004) Neither CBT nor IPT are associated with any inherent harms However these approaches are intended to explore painful feelings and experiences which may make patients emotionally uncomfortable at times (Mayo Clinic 2011)
copyInstitute for Clinical amp Economic Review 2011 Page 8
2 Clinical Guidelines
21 Electroconvulsive Therapy (ECT)
American Psychiatric Association (APA) (2010) httpwwwpsychiatryonlinecompracGuidepracGuideTopic_7aspx
ECT is recommended for patients with severe MDD particularly with associated psychotic or catatonic features or suicidal tendencies Initial and maintenance ECT is also recommended in patients whose symptoms have not responded sufficiently to psychotherapy or pharmacotherapy in patients who prefer ECT have a previous positive response to ECT or have functional impairment Continuation therapy with ECT may be considered with patients responding acutely to ECT NOTE APArsquos Task Force on ECT is in the process of updating the specific recommendations from the grouprsquos report in 2001
National Institute for Health and Clinical Excellence (2009)
httpguidanceniceorgukCG90GuidancepdfEnglish
In patients with life-threatening severe depression or when other therapies have failed ECT is a therapeutic option ECT may be considered in patients with moderate depression whose disease is unresponsive to multiple medications and psychotherapy For patients unresponsive to ECT a subsequent trial may be undertaken after complete evaluation of the previous course along with alternative therapies Specific considerations should be given to use of unilateral or bilateral modalities as well as assessment of effects on cognitive function For continuousmaintenance therapy with ECT there are no current recommendations
Institute for Clinical Systems Improvement (2011) httpwwwicsiorgdepression_5depression__major__in_adults_in_primary_care_3html ECT is effective for treatment of acute phase MDD as well as for maintenance therapy ECT may be appropriate in depressed patients with resistance or intolerance to antidepressant medications previous positive response to ECT psychotic or melancholic symptoms catatonia suicidal ideation concurrent pregnancy as well as in geriatric patients and those with Parkinsonism-associated depression
Department of Veterans Affairs Department of Defense (2009)
httpwwwhealthqualityvagovMajor_Depressive_Disorder_MDD_Clinical_Practice_Guidelineasp For treatment of severe MDD ECT may be considered in patients with the following characteristics intolerance or inadequate response to multiple antidepressants catatonia or psychotic symptoms suicidality previous positive response to ECT or patient preference Significant co-morbidities such as recent myocardial infarction or detached retina may preclude patients from receiving ECT Continued ECT may be considered There are insufficient data to recommend or reject ECT for the elderly
copyInstitute for Clinical amp Economic Review 2011 Page 9
22 Repetitive Transcranial Magnetic Stimulation (rTMS)
American Psychiatric Association (2010)
httpwwwpsychiatryonlinecompracGuidepracGuideTopic_7aspx
Data are insufficient to recommend rTMS as initial therapy in MDD TMS may be an option for patients with inadequate response to pharmacotherapy
National Institute for Health and Clinical Excellence (2007)
httpguidanceniceorgukIPG242 Due to lack of sufficient data regarding clinical efficacy rTMS should be utilized in research studies only to provide further analysis of factors such as treatment duration and frequency and intensity of application No major safety concerns have been identified with the use of TMS in severe depression
Institute for Clinical Systems Improvement (2011)
httpwwwicsiorgdepression_5depression__major__in_adults_in_primary_care_3html While rTMS is recognized as an emerging therapeutic intervention in TRD no specific recommendations are provided Patients should be referred to specialists in psychiatry for evaluation
23 Vagus Nerve Stimulation (VNS)
American Psychiatric Association (2010) httpwwwpsychiatryonlinecompracGuidepracGuideTopic_7aspx
VNS is not recommended as initial therapy in MDD For patients not responding to at least four trials of antidepressants andor ECT VNS may be considered as an alternative therapeutic choice Maintenance therapy with VNS is appropriate for patients who have responded to this therapy
National Institute for Health and Clinical Excellence (2009)
httpguidanceniceorgukIPG330 VNS may only be used in patients with treatment-resistant depression and only after special arrangement for clinical governance consent and audit or research Utilization should involve multidisciplinary evaluation and management of the patient
Institute for Clinical Systems Improvement (2011)
httpwwwicsiorgdepression_5depression__major__in_adults_in_primary_care_3html While VNS is recognized as an emerging therapeutic intervention in TRD no specific recommendations are provided Patients should be referred to specialists in psychiatry for evaluation
copyInstitute for Clinical amp Economic Review 2011 Page 10
Department of Veterans Affairs Department of Defense (2009) httpwwwhealthqualityvagovMajor_Depressive_Disorder_MDD_Clinical_Practice_Guidelineasp There has been insufficient evidence on the efficacy and safety of VNS to recommend its routine use in treatment-resistant depression
24 Cognitive Behavioral Therapy (CBT) or Interpersonal Psychotherapy (IPT)
American Psychiatric Association (2010) httpwwwpsychiatryonlinecompracGuidepracGuideTopic_7aspx
For patients with mild to moderate depression CBT or IPT is an appropriate initial therapeutic option In patients with moderate to severe MDD the combination of CBTIPT with pharmacotherapy may be used CBT and IPT may be used as continuous and maintenance therapies
National Institute for Health and Clinical Excellence (2009)
httpguidanceniceorgukCG90GuidancepdfEnglish
For patients with mild to moderate depression or persistent subthreshold depressive symptoms who lack adequate response to low-intensity psychosocial intervention CBT or IPT may be appropriate interventions Combination therapy with CBT or IPT and antidepressant medication may be indicated for patients with moderate to severe depression In patients without adequate response to pharmacotherapy or psychotherapy combination therapy with CBT and an antidepressant may be considered Patients at risk for relapse may also consider CBT
Institute for Clinical Systems Improvement (2011)
httpwwwicsiorgdepression_5depression__major__in_adults_in_primary_care_3html Psychotherapy (including CBT and IPT) is effective in mild to moderate depression and may lower relapse rates Psychotherapy may prevent relapse in patients with major depression and maintenance therapy may assist with management of chronic MDD For patients not responding to medication psychotherapy may be considered as an alternative option
Department of Veterans Affairs Department of Defense (2009)
httpwwwhealthqualityvagovMajor_Depressive_Disorder_MDD_Clinical_Practice_Guidelineasp First-line therapies for uncomplicated major depression include CBT and IPT delivered by specifically-trained providers They are also first-line therapies for pregnant and post-partum women with depression CBT is a treatment option for severe depression particularly with a history of suicide risk Combination therapy with CBT and pharmacotherapy is recommended in recurrent or chronic major depression IPT and CPT may be combined with pharmacotherapy for treatment in patients who are refractory to a single form of treatment
copyInstitute for Clinical amp Economic Review 2011 Page 11
3 Medicare National and New England Private Insurer Coverage Policies
31 Electroconvulsive Therapy National Payers
Centers for Medicare and Medicaid Services (CMS) Medicare has not made a national coverage decision for ECT in depression No local coverage determinations have been made in New England although a local coverage decision has been made in Wisconsin where ECT is considered medically necessary when at least one of the following conditions is met
o Major depressive episode andor major depressive disorder o Rapid resolution of depression is necessary (eg acute suicide risk or agitation) o Unresponsiveness to pharmacological therapy or inability to medically tolerate
medication maintenance medication or medication side effects o Bipolar illness with either mania or depression where medications are ineffective or
not tolerated or severe mania presenting a safety risk to the patient or to others o When continuation of ECT is necessary to sustain remission or improvement
ECT is not covered for depression when a patient is responsive to antidepressants when there is no evidence of ECT effectiveness in patients who have been treated previously in patients tolerant to antidepressants and not at immediate risk of suicide or in those whose treatment andor primary diagnosis is related to alcoholism httpswwwcmsgovmedicare-coverage-databasedetailslcd-detailsaspxLCDId=30493ampContrId=47ampver=8ampContrVer=1ampSearchType=AdvancedampCoverageSelection=BothampNCSelection=NCA|CAL|NCD|MEDCAC|TA|MCDampArticleType=Ed|Key|SAD|FAQampPolicyType=Finalamps=AllampKeyWord=Electroconvulsive+therapyampKeyWordLookUp=TitleampKeyWordSearchType=Exactampkq=trueampbc=IAAAABAAAAAAamp
Aetna Aetna considers ECT medically necessary for treatment of major depression or
mania when a patient is at least 12 years of age and one of the following conditions is met o Member is unresponsive to pharmacological therapy or unable to tolerate effective
medications or has a medical condition for which medication is contraindicated o Member has had favorable responses to ECT in the past o Rapid response is required for patient or othersrsquo safety o Member is experiencing severe mania or depression during pregnancy o Member prefers ECT as a treatment option in consultation with the psychiatrist
httpwwwaetnacomcpbmedicaldata400_4990445html (NOTE No published policies on ECT were found for other national payers including CIGNA UnitedHealthcare and WellpointAnthem)
copyInstitute for Clinical amp Economic Review 2011 Page 12
Regional Payers
Blue Cross Blue Shield of Massachusetts BCBSMA covers outpatient ECT when administered by a BCBSMA network-credentialed psychiatrist in a qualified acute care general hospital or contracted acute care psychiatric hospital when at least one of the following conditions is met
o Severe depression or mania that is unresponsive to pharmacotherapy especially with acute suicide risk extreme agitation andor catatonia
o Intolerance to antidepressant or neuroleptic medications or their side effects or inability to medically tolerate maintenance medication
o Rapid resolution of depression is necessary
ECT is only covered after receiving informed consent in writing from the patient or legal guardian and if the patient has reasonable accommodations for transportation and assistance Patients receiving ECT should not require inpatient medical or psychiatric treatment
BCBSMA does not cover outpatient ECT when a patient is responsive to mood stabilizers or is able to tolerate antidepressant or neuroleptic medications and is not at risk of suicide when there is no evidence of ECT effectiveness in patients who have been treated previously when pharmacotherapy was previously effective for maintenance when treatment is related to alcoholism or when there is no evidence of catatonia mania acute suicide risk or extreme agitation httpwwwbluecrossmacomcommonen_USmedical_policies31920Outpatient20Electroconvulsive20Therapy20prnpdfpage=1
Blue Cross Blue Shield Rhode Island ECT is covered in both the outpatient and inpatient settings when provided by a psychiatrist or other licensed physician httpswwwbcbsricomBCBSRIWebpdfmedical_policiesBehavioralHealthServicespdf
(NOTE No published policies on ECT were found for other regional payers including Harvard Pilgrim Health Care Tufts Health Plan ConnectiCare BCBSVT HealthNet Neighborhood Health Plan of RI and MVP Health Care)
copyInstitute for Clinical amp Economic Review 2011 Page 13
32 Repetitive Transcranial Magnetic Stimulation National Payers
Centers for Medicare and Medicaid Services (CMS) Medicare has not made a national coverage decision on rTMS No local coverage determinations have been made in New England although local coverage decisions have been made in Mid-Atlantic States not to cover rTMS for depression as it is considered investigational and not medically necessary
CIGNA Aetna and WellpointAnthem do not cover rTMS for the treatment of depression because its value and effectiveness are not considered to be established
Regional Payers
BCBSMA Harvard Pilgrim Health Care Tufts Health Plan and BCBSRI do not cover rTMS for depression because it is considered experimental investigational or unproven
(NOTE No published policies on transcranial magnetic stimulation were found for other regional payers including ConnectiCare BCBSVT HealthNet Neighborhood Health Plan of RI and MVP Health Care)
33 Vagus Nerve Stimulation National Payers
The Centers for Medicare and Medicaid Services (CMS) CMS has made a national coverage decision not to cover VNS for depression because it is considered experimental or investigational and therefore is not medically necessary httpswwwcmsgovmedicare-coverage-databasedetailsncd-detailsaspxNCDId=230ampncdver=2ampCoverageSelection=NationalampKeyWord=vagus+nerve+stimulationampKeyWordLookUp=TitleampKeyWordSearchType=Andampbc=gAAAABAAAAAAamp
CIGNA Aetna UnitedHealthcare and WellpointAnthem do not cover VNS for depression because it is considered experimental or investigational
Regional Payers
BCBSMA Harvard Pilgrim Health Care Tufts Health Plan BCBSRI and HealthNet do not cover VNS for depression because it is considered experimental or investigational
copyInstitute for Clinical amp Economic Review 2011 Page 14
ConnectiCare The efficacy of VNS for the treatment of depression has not been demonstrated and all requests for this service require prior authorization httpwwwconnecticarecomproviderPDFsNew20Technology20Guidancepdf
(NOTE No published policies on VNS were found for other regional payers including BCBSVT Neighborhood Health Plan of RI and MVP Health Care)
34 Cognitive Behavioral TherapyInterpersonal Therapy No published polices on CBT or IPT were found for any national or regional payer
copyInstitute for Clinical amp Economic Review 2011 Page 15
4 New Evidence Following AHRQ Review
41 Updated search We conducted a systematic literature search of MEDLINE Cochrane Central Register of Controlled Trials EMBASE and PsycInfo utilizing the search criteria defined by the AHRQ review The search timeframe spanned from January 1 2010 to October 11 2011 We identified 221 records after removal of duplicates (Figure 1) Any citations already included in the AHRQ review were removed The remaining abstracts were screened using parameters designated by the AHRQ review (ie study type patient population treatment intervention and outcomes evaluated) Following initial screening full-text review was performed on 54 retrieved articles Forty-four of these were excluded for a variety of reasons most commonly inappropriate study populations (eg more than 20 bipolar patients without treatment-resistant disease) (Figure 1 p18) Ten articles were evaluated for new evidence (Appendix A) No randomized controlled trials (RCTs) were identified most of the studies were small single-center case series of relatively poor quality For example one series provided no details on the location intensity and conditions of ECT therapy (Oulis 2011) while another did not specify the duration of follow-up (Sperling 2011) Patient populations were heterogeneous with respect to the definition of treatment resistance disease severity and duration of current depressive episode Outcomes focused on examination of potential mechanisms of action of the different nonpharmacologic interventions or assessment of predictors of response to the interventions Two studies described in more detail below explored safety and quality of life (QoL) in TRD patients (Berlim 2011 Oulis 2011)
42 ECT The AHRQ review identified four reports of two studies examining specific adverse events associated with ECT (Pridmore 2000 McLoughlin 2007 Eranti 2007 Knapp 2008) One concern is the potential for ECT to cause changes in cardiac repolarization and increase the risk of arrhythmia as measured by a lengthened QT interval Psychotropic medications such as antidepressants and atypical antipsychotics have been shown to have this effect and a similar phenomenon is suspected with ECT (Tezuka 2010) While baseline prolonged QTc may not preclude patients with TRD from receiving ECT consideration of cardiac risk factors is an important part of the clinical evaluation prior to administration of therapy (Pullen 2011) A small case series assessing ECTrsquos impact on the QT interval has recently been published (Oulis 2011) In this study six female patients with concomitant atypical antipsychotic and antidepressant medication therapy (at least four medications in total) underwent ECT for resistant depression Over 63 sessions of ECT the corrected QT (QTc) interval was lengthened in all patients changes were considered to be within normal limits There were no reports of any arrhythmias or other major cardiac adverse events As these findings represent a very small patient population any conclusions drawn from these results must be done cautiously
copyInstitute for Clinical amp Economic Review 2011 Page 16
43 rTMS In general health-related quality of life (QoL) is under-evaluated in TRD patients The AHRQ review identified six studies that assessed QoL and only three of these evaluated patients undergoing rTMS New observational data regarding QoL among patients receiving rTMS became available after publication of the AHRQ review In a recent case series 15 patients with treatment-resistant moderate to severe MDD who maintained concurrent therapy with psychotropics underwent high frequency-rTMS therapy over a four-week period (Berlim 2011) Patients experienced significant improvement in their depressive symptoms as measured with the HAM-D21 (p=0035) Patients also experienced significant improvement in the World Health Organizationrsquos Quality of Life Measure ndash Brief Version (WHOQOL BREF) overall score (p=0017) as well as in physical and psychological domain scores This study provides limited evidence regarding improved QoL in patients with TRD but due to the inherent biases within a case series the results should be interpreted with care
44 VNS No studies have been published since the AHRQ review that provide significant new information about the impact of VNS on clinical economic andor safety outcomes among patients with TRD
45 CBTIPT No studies have been published since the AHRQ review that provide significant new information
about the impact of CBT andor IPT on clinical economic andor safety outcomes among patients
with TRD
copyInstitute for Clinical amp Economic Review 2011 Page 17
Figure 1 PRISMA flow diagram of included and excluded studies from updated literature search
Titles and abstracts identified in MEDLINE Cochrane EMBASE and
PsycInfo databases
N=273
Records after duplicates removed
N=221
Records screened
N=221
Records included in AHRQ review
N=88
Full-text articles assessed for eligibility
N=54
Records excluded through abstract review
N=79
Full-text articles excluded
N=44
Reasons for exclusion gt20 bipolar patients n=18 Mixed psychiatric diagnosis n=5 Patients not uniformly refractory n=20 No specific outcome measures described n= 1
Articles included in ICER qualitative synthesis
N=10
copyInstitute for Clinical amp Economic Review 2011 Page 18
5 Analysis of Comparative Value
51 Methods An economic model was developed to evaluate the comparative value of nonpharmacologic therapies for use in patients with TRD The comparative value of these strategies was considered in two ways the budget impact to public andor private payers of changing coverage policy (and the associated distribution of management options utilized) and the cost-effectiveness of a given management option vs a comparator option Budget impact was analyzed on a population basis and considered the impact of changes in coverage resource utilization and cost among Medicaid beneficiaries and members of the three largest private payers in each New England state Cost-effectiveness was evaluated in a hypothetical cohort of 1000 patients and considered the outcomes and costs associated with each modeled treatment ldquopathwayrdquo
Management Options Only nonpharmacologic interventions demonstrating sufficient evidence of effectiveness and safety in the AHRQ evaluation were considered in the economic analyses (see Table 1 on the following page) The budget impact analyses considered scenarios in which varying percentages of use of ECT and rTMS are assumed in a population of patients with TRD Evidence for vagus nerve stimulation was found to be insufficient in the AHRQ review (Gaynes 2011) thus it is not considered in the comparative value assessment Psychotherapy (CBTIPT) was also excluded as it was not possible to sufficiently differentiate resource use and costs in comparison to ldquousual carerdquo (ie traditional psychotherapy andor medication) given that all forms of psychotherapy share the same billing codes for individual sessions In addition neither the AHRQ review nor this supplementary analysis found any studies reported in which CBTIPT was compared directly to ECT or rTMS Analyses of cost-effectiveness were limited to a comparison of rTMS to usual care as this was the only comparison in the AHRQ review demonstrating sufficient evidence of a difference in net clinical benefit (Gaynes 2011) Key treatment parameter estimates may be found in Table 1 on the following page Estimates for treatment response and remission were obtained from meta-analyses conducted in the AHRQ review Estimates of response and remission for ECT and rTMS were obtained directly from head-to-head data reported in Table 11 of the AHRQ review (Gaynes 2011) These rates are assumed equal for ECT and rTMS given the conclusions drawn in the comparative effectiveness review that there are no significant differences in changes in depressive severity response or remission between these two options Estimates of the risk of relapse were also assumed to be equal based on the findings reported in Table 35 of the review (Gaynes 2011) The corresponding usual care inputs were derived by applying the inverse of the meta-analyzed relative risk of these outcomes for rTMS vs usual care (Figures 13 and 14 and Table 37 for response remission and relapse in the AHRQ review) As there were no data differentiating management alternatives in terms of relapse rates a uniform monthly risk was assumed across all options
copyInstitute for Clinical amp Economic Review 2011 Page 19
Table 1 Treatment parameters
Unit Item Usual Care ECT rTMS Unit
Response to treatment 271 591 591 Course of therapy
Remissiondagger on treatment 249 591 591 Course of therapy
20-50 change on depression scale
daggerHAM-D17 lt 8 HAM-D21 lt 10 or MADRS lt 8
Source Gaynes B et al AHRQ Comparative Effectiveness Review Number 33 Demographic characteristics of patients with TRD as well as estimates of resource use and payment under conditions of typical practice were obtained from regional benchmark information provided by the proprietary LifeLinktrade Health Plan Claims Database (IMS Health Danbury CT) which is comprised of 794 million privately-insured individuals from 79 health plans nationwide and includes 67 billion medical and pharmacy claims generated from 2001 to the present The population was restricted to patients aged 20-64 years who were located in the Northeast US Census region and had one or more claims with a diagnosis of depression in 2008 Utilization and cost data were generated for calendar year 2009
Clinical and Economic Model The model framework considers the outcomes of a population consisting of 30 men between the ages 20 and 64 years with a mean age of 45 years across the entire population The age range was selected because (a) the AHRQ review focused on adults only and (b) the population of most interest for decision-makers in each New England state was felt to include Medicaid and privately-insured patients only Medicare patients were therefore excluded from consideration Population characteristics were consistent with those of the IMS database as described above All patients were assumed to carry a diagnosis TRD consistent with that used in the AHRQ report (ie depression that is non-responsive to two or more trials of drug therapy) All costs and payments are reported in 2010 US dollars unless otherwise specified
Key Model Assumptions about TRD Management Options (Budget Impact and Cost-Effectiveness Analyses)
The primary measure of clinical impact is the proportion of treated patients with a ldquopositive treatment responserdquo Definitions of response varied by study but generally are based on improvement of 20-50 on a standardized depression scale such as the Hamilton Rating Scale for Depression (HAM-D)
Remission rates were applied in accordance with the definitions used in the AHRQ review in which patients who reached a minimum threshold score (ie HAM-D17 lt 8 HAM-D21 lt 10 or MADRS lt 8) were felt to have achieved full remission
All patients under all treatment scenarios were assumed to continue with usual care (eg therapy visits prescription medications) regardless of the outcome of nonpharmacologic intervention
copyInstitute for Clinical amp Economic Review 2011 Page 20
Rates of effectiveness and harm were assumed to be identical for ECT and rTMS based on findings from head-to-head trials reported in the AHRQ review
rTMS was assumed to be more effective than usual care consistent with the AHRQ reviewrsquos meta-analysis of the rTMS vs sham trials
Based on the reported range of course of therapy reported in the AHRQ review ECT was assumed to involve twice-weekly sessions of 3-4 hours each over a total of four weeks while rTMS was assumed to involve daily sessions (five days per week) of 40 minutes each over a total of four weeks Total estimated cost for each course of therapy was assumed to be approximately $3500 and $4400 for ECT and rTMS respectively including the costs of planning visits treatment delivery and anesthesia (ECT only)
Key Model Assumptions about TRD Management Options (Cost-Effectiveness Analysis Only)
The patient group with a positive treatment response to nonpharmacologic intervention is assumed to benefit from fewer emergency department (ED) and inpatient admissions
Changes in resource use associated with a positive treatment response or relapse are applied over the course of 6 months corresponding to the model cycle length
Risk of relapse is applied in the second 6-month cycle and thereafter
For patients that suffer a relapse it is assumed that resource use for ED and inpatient admissions returns to the higher frequency associated with TRD
Among the group of patients who relapse 50 of those previously on ECT or rTMS are assumed to retry the same nonpharmacologic strategy following relapse whereas 100 of all patients who relapse on usual care are assumed to retry usual care
In calculating the impact on lost wages in the cost-effectiveness analysis the distribution of employment status was assumed to be employed full-time (71) part-time (16) unemployed (8) or receiving disability (5)
Key Assumptions about TRD
Major assumptions regarding the course of TRD and its treatment can be found below detailed input parameter estimates can be found in Table 2 on the following page
Population The age and gender distribution was assumed from the data provided by IMS Health Accordingly 70 of TRD patients aged 20-64 years were assumed to be female and 60 were assumed to be aged 45-64 years
Prevalence The prevalence of TRD in the private payer population was estimated to be 20 based on a published epidemiologic estimate (Ivanova 2010) for males and females irrespective of age The corresponding prevalence among Medicaid recipients was derived by applying a relative risk of 169 from a study comparing depression prevalence by socioeconomic status (Lorant 2003) to the prevalence of TRD in the private payer population resulting in an estimated prevalence of 34
copyInstitute for Clinical amp Economic Review 2011 Page 21
Table 2 General model input parameters
Unit Item Input Unit Frequency Unit
Population Characteristics Male patients 30 Mean age MaleFemale 455454 Years Employment Status
Full-Time 7110 Part-Time 1560
Unemployed 810 Disability 510
Payment Items ndash Private Outpatient Visits $584 per visit 24 per year Office Visits $115 per visit 137 per year Emergency Department $1089 per visit 03 per year Pharmacy $60 per script 312 per year ECT $$43358 per session 8 per course of therapy rTMS planning $246 per session 1 per course of therapy rTMS delivery $206 per session 20 per course of therapy Inpatient Facility Admission $11296 per admission 01 admissions per year Inpatient Professional Visit $330 per visit 47 visits per admission
Indirect Cost Items Regional employment wage $2357 per hour Regional disability benefit $96258 per month
Reason for Productivity Loss General depression overall 512 Days lostyear ndash Medically-related 135 Days lostyear ndash Disability 377 Days lostyear Usual care 0 Additional days lostyear rTMS treatment 11 Days lostcourse of therapy
Utility Items Duration Baseline TRD - Male 0708 Annual Baseline TRD ndash Female 0708 Annual Death 0 Annual Change due to ndash Aging -000251 Annual ndash ECT 0 Per course ndash rTMS 0 Per course ndash Usual care 0 Per course ndash Response 00625 Per response ndash Remission 0125 Per remission ndash Relapse -00625 Per relapse ndash Serious Adverse Event -01 Per event
copyInstitute for Clinical amp Economic Review 2011 Page 22
Mortality Overall age and gender-specific mortality was obtained from the 2007 US life tables (Arias 2011) Hazard ratios from a published study on the association between major depression and all-cause mortality (Zheng 1997) were applied to these data to estimate the increased risk of death among men and women with TRD Adjusted hazard ratios of 31 for males and 17 for females were applied to the gender-specific risks in the general population The resulting risk of death for patients with TRD was approximately 33 per year for males and 18 per year for females
Loss of Productivity and Wages Lost wages were estimated using data from the 2009 US Census data for residents of the Northeast US (US Census Bureau 2009) The proportion of patients receiving disability benefits (51) and average benefit paid ($963month) was derived from regional New England data (Office of Retirement and Disability Policy 2009) Average hourly wages ($2357) were obtained from the Bureau of Labor Statistics (Bureau of Labor Statistics 2010) and used to derive a mean estimate for New England Days of work lost due to disability or medically- related issues was obtained from a published study (Ivanova 2010) Work loss due to the time required for ECT and rTMS treatment was assumed based on the typical course of therapy reported in the AHRQ review Specifically rTMS was assumed to involve four hours of work loss for each session
Utility Estimates Weights to adjust for changes in quality of life were obtained from the literature The utility for men and women suffering from TRD was set to 0708 based on data from an epidemiologic study (Sullivan 2006) Adjustments were made to account for the general impact of aging remission and relapse Payments and Resource Utilization The average paid amount for each resource use item was derived from the IMS LifeLink database as previously-described and was used as the model input to represent the direct cost to a private payer (Table 3 page 23) Medicaid payments were assumed to be 60 of those received by private payers Because patients with TRD were assumed to have more severe symptoms routine resource use for patients with general depression was adjusted using a literature-based resource-specific factor (Ivanova 2010) to estimate likely resource consumption among patients with TRD Payment estimates from prior years were inflated to 2010 using the overall medical inflation component of the consumer price index for the Northeast US (Bureau of Labor Statistics 2010) All resulting payment and frequency inputs are presented in Table 2 on page 21
Budget Impact The budget impact analysis estimates the regional impact of introducing coverage for rTMS in New England as determined by the number of insured adult lives covered under Medicaid and by the three largest private payers in each of the six New England states (Table 3 on the following page) The total number of patients with TRD is calculated using separate prevalence estimates for the private payer and Medicaid populations This may be further specified by population age category and gender Use of ECT and rTMS in the TRD population before and after introduction of a new coverage decision is specified as the percentage of patients treated with each option
copyInstitute for Clinical amp Economic Review 2011 Page 23
Table 3 Estimated number of enrollees in budget impact analyses by state and payer type
State Medicaiddagger (n) Private PayerDagger (n)
CT 163800 1383791
ME 135700 807396
MA 690900 2396386
NH 35500 341054
RI 78100 1246212
VT 63700 270755 Kaiser Family Foundation State health facts Adult covered lives with Medicaid 2008-2009 daggerKaiser Family Foundation State health facts Age Distribution of Medicaid Enrollees FY 2007 DaggerUS News amp World Report LP httphealthusnewscomhealth-plans
The payments associated with ECT and rTMS treatment routine care for depression adverse events related to treatment and resource use as a result of relapse are estimated at baseline and over multiple scenarios evaluating increased use of rTMS Findings are reported on an annual basis In addition 50 of patients who relapse are assumed to retry the same strategy again within the year Over the one-year time horizon the model estimates the total number of patients with TRD the proportion treated using ECT or rTMS the subset of treated patients who would be expected to have a positive response and the corresponding resources consumed and associated payments Payments are reported as total payments per patient with TRD annual plan payments for all patients with TRD annual payments for all services for all members and payments per member per month (PMPM) for all members At baseline 20 of TRD patients are assumed to be receiving ECT In the first modeled scenario (Scenario 1) one-half of the patients receiving ECT are assumed to switch to rTMS In the second scenario (Scenario 2) the percentage of patients receiving ECT is assumed to remain constant at 20 and an additional 10 of TRD patients are assumed to undergo rTMS treatment rather than continue with usual care for TRD Each scenario is considered separately for Medicaid beneficiaries privately-insured patients and a combination of the two groups over the entire region In addition state-specific analyses are presented in Appendix B for the combined Medicaidprivate population
Cost-Effectiveness The cost-effectiveness analysis considers the experience of a cohort of 1000 hypothetical patients diagnosed with TRD who are treated with either rTMS or usual care over the course of five years During this time patients may respond to treatment and are at risk for early treatment withdrawal adverse events hospitalization relapse among those in remission death from any cause and TRD- related death (ie suicide and other excess mortality from depression) in six-month cycles The payments associated with these outcomes and treatment accumulate over five years yielding the estimated total direct medical cost of using rTMS vs usual care in patients with TRD In addition the indirect costs associated with lost productivity due to treatment and TRD in general are taken into account providing a broader perspective Lost wages and disability payments are estimated for patients and summed over the period of analysis The present value of all costs accrued in the future is estimated using an annual discount rate of 35 consistent with typical practice in long-term economic evaluations
copyInstitute for Clinical amp Economic Review 2011 Page 24
Total time alive or life years is estimated by summing the total number of patients alive at each time point This outcome is weighted to estimate the total quality-adjusted life years (QALYs) which accounts for changes in quality of life determined by the experiences of the patient group and the duration over which they occur Specifically the amounts of time patients are in remission relapsed in hospital and dead are multiplied by the ldquoweightrdquo associated with each of these states and summed over the population Effectiveness outcomes are presented for each strategy in terms of the numbers of patients with a positive treatment response or remission relapse inpatient stay or death total life years and QALYs are also reported for each cohort Costs associated with each of these categories are presented as the total cost and by component for each strategy Cost-effectiveness results are presented as incremental cost-effectiveness ratios (ICERs) for rTMS relative to usual care Measures of interest included cost per life-year gained (LYG) cost per QALY gained and cost per additional positive treatment response
5 2 Results
Estimated Region-wide Budget Impact ndash All Payers The distribution of patients represented by Medicaid and private payers in this analysis is shown by New England state in Table 4 below along with the estimated prevalence and resulting number of patients with TRD Table 4 Estimated TRD population by payer type
Shifting 10 of patients from ECT to rTMS in Scenario 1 resulted in no change in the number of patients having a positive treatment response relative to baseline (see Table 5 on the following page) due to the underlying assumption of equivalent efficacy for ECT and rTMS In Scenario 2 in which 10 of the population receiving usual care at baseline was assumed to begin rTMS an additional 32 of patients overall are estimated to have a positive treatment response
Overall
n n
New England State Distribution
CT 163800 11 1383791 89 1547591
ME 135700 14 807396 86 943096
MA 690900 22 2396386 78 3087286
NH 35500 9 341054 91 376554
RI 78100 6 1246212 94 1324312
VT 63700 19 270755 81 334455
Proportion of patients by payer () 15 85
Covered Populations
Total membership (n) 1167700 6445594 7613294
Prevalence of TRD 34 20 22
Patients with TRD (n) 39468 128912 168380Note that uninsured patients are not represented in this analys is as there is no direct impact to a third party payer
Medicaid Private Payer
copyInstitute for Clinical amp Economic Review 2011 Page 25
Table 5 Estimated clinical impact of ECT and rTMS in an insured population
The uptake of rTMS in Scenarios 1 and 2 resulted in a net economic impact of 11 and 31 respectively relative to baseline due to the increased cost of rTMS therapy corresponding to an increase in total payments of approximately $19 million in Scenario 1 and $535 million in Scenario 2 across the region (see Table 6 on the following page) Total cost per patient treated with nonpharmacologic therapy ranged from $10101 ndash $10419 annually depending on the uptake of rTMS Annual payments are estimated to increase $93 - $318 per patient given a 10 uptake of rTMS depending on the scenario (Table 6 on the following page) On an overall basis the PMPM was estimated to increase by $021 and $059 for scenarios 1 and 2 respectively
Baseline Scenario 1dagger
Net Change vs
Baseline Scenario 2Dagger
Net Change vs
Baseline
Summary of Covered Population
Total membership (n) 7613294 7613294 7613294
Patients with TRD (n) 168380 168380 168380
Patients with TRD receiving ECT andor
TMS (n) 33676 33676 50514
As a proportion of all members 04 04 07
As a proportion of patients with TRD 200 200 300
Outcomes amp Resource Use
Positive Treatment Response (n) 56421 56421 0 61807 5386
Positive Treatment Response () 335 335 367Note This analys is i s from the point of view of a third party payer therefore a l l patients are assumed to be covered
daggerScenario 1 cons is ts of 10 of patients treated with ECT 10 with rTMS and 80 under usual care
DaggerScenario 2 cons is ts of 20 of patients treated with ECT 10 with rTMS and 70 under usual care
copyInstitute for Clinical amp Economic Review 2011 Page 26
Table 6 Estimated economic impact of ECT and rTMS use in an insured population
Estimated Region-wide Budget Impact ndash Medicaid Only Table 7 below shows the absolute number of patients represented in the Medicaid-only analysis Uptake of rTMS among patients receiving Medicaid resulted in a 26-46 increase in payments for all patients with TRD Total cost per patient treated with nonpharmacologic therapy ranged from $6688 ndash $6995 annually depending on the uptake of rTMS (Table 8 on the following page) Table 7 Estimated clinical impact of ECT and rTMS use in the Medicaid population
Baseline Payments
Net Change vs
Baseline Payments
Net Change vs
Baseline
Payments per patient with TRD (n=168380)
ECT andor TMS $668 $781 $113 $1115 $447
Outpatient Management amp ER $7767 $7767 $0 $7718 ($49)
Inpatient admissions $1666 $1666 $0 $1586 ($80)
Total per patient $10101 $10214 $113 $10419 $318
Annual payments for all patients with TRD $1700807456 $1719880131 $19072676 $1754373736 $53566280
11 31
Plan payments for Covered Population (n=7613294)
Annual payments for all services (all patients) $27013330265 $27032402940 $19072676 $27066896545 $53566280
Payment per member per month - overall (PMPMo) $29568 $29589 $021 $29627 $059
Scenario 1dagger Scenario 2Dagger
TMS and ECT are assumed to have equiva lent efficacy therefore no cost offset i s cons idered due to improved response
daggerScenario 1 cons is ts of 10 of patients treated with ECT 10 with rTMS and 80 under usual care
DaggerScenario 2 cons is ts of 20 of patients treated with ECT 10 with rTMS and 70 under usual care
Baseline Scenario 1dagger
Net Change vs
Baseline Scenario 2Dagger
Net Change vs
Baseline
Summary of Covered Population
Total membership (n) 1167700 1167700 1167700
Patients with TRD (n) 39468 39468 39468
Patients with TRD receiving ECT andor
TMS (n) 7893 7893 11840
As a proportion of all members 07 07 10
As a proportion of patients with TRD 200 200 300
Outcomes amp Resource Use
Positive Treatment Response (n) 13225 13225 0 14488 1263
Positive Treatment Response () 335 335 367Note This analys is i s from the point of view of a third party payer therefore a l l patients are assumed to be covered
daggerScenario 1 cons is ts of 10 of patients treated with ECT 10 with rTMS and 80 under usual care
DaggerScenario 2 cons is ts of 20 of patients treated with ECT 10 with rTMS and 70 under usual care
copyInstitute for Clinical amp Economic Review 2011 Page 27
Table 8 Estimated economic impact of ECT and rTMS use in the Medicaid population
Estimated Region-wide Budget Impact ndash Private Payer On a percentage basis the increases in payments for private payers managing treatment of patients with TRD (Table 9 on the following page) were predicted to be incrementally less than predicted for Medicaid (ranging from 09 - 29 in total) given the assumed lower prevalence of TRD among private payer populations (Table 10 on the following page) Total cost per patient treated with nonpharmacologic therapy ranged from $11146 ndash $11467 annually depending on the uptake of rTMS
Baseline Payments
Net Change vs
Baseline Payments
Net Change vs
Baseline
Payments per patient with TRD (n=039468)
ECT andor TMS $442 $614 $172 $835 $393
Outpatient Management amp ER $5142 $5142 $0 $5110 ($32)
Inpatient admissions $1103 $1103 $0 $1050 ($53)
Total per patient $6688 $6860 $172 $6995 $308
Annual payments for all patients with TRD $263949131 $270732493 $6783361 $276085572 $12136441
26 46
Plan payments for Covered Population (n=1167700)
Annual payments for all services (all patients) $2648406478 $2655189839 $6783361 $2660542918 $12136441
Payment per member per month - overall (PMPMo) $18900 $18949 $048 $18987 $087
Scenario 1dagger Scenario 2Dagger
TMS and ECT are assumed to have equiva lent efficacy therefore no cost offset i s cons idered due to improved response
daggerScenario 1 cons is ts of 10 of patients treated with ECT 10 with rTMS and 80 under usual care
DaggerScenario 2 cons is ts of 20 of patients treated with ECT 10 with rTMS and 70 under usual care
copyInstitute for Clinical amp Economic Review 2011 Page 28
Table 9 Estimated clinical impact of ECT and rTMS use in a private payer population
Table 10 Estimated economic impact of ECT and rTMS use in a private payer population
Cost-Effectiveness of TRD Management Strategies
rTMS is associated with a 136 increase in the number of positive treatment responses over usual care over five years in addition the number of full remissions was 159 higher under the rTMS strategy (Table 11 on page 30) Note that a reference copy of Table 2 (model input parameters) follows this table (page 31) to assist in the interpretation of Table 11
Baseline Scenario 1dagger
Net Change vs
Baseline Scenario 2Dagger
Net Change vs
Baseline
Summary of Covered Population
Total membership (n) 6445594 6445594 6445594
Patients with TRD (n) 128912 128912 128912
Patients with TRD receiving ECT andor
TMS (n) 25782 25782 38674
As a proportion of all members 04 04 06
As a proportion of patients with TRD 200 200 300
Outcomes amp Resource Use
Positive Treatment Response (n) 43196 43196 0 47320 4124
Positive Treatment Response () 335 335 367Note This analys is i s from the point of view of a third party payer therefore a l l patients are assumed to be covered
daggerScenario 1 cons is ts of 10 of patients treated with ECT 10 with rTMS and 80 under usual care
DaggerScenario 2 cons is ts of 20 of patients treated with ECT 10 with rTMS and 70 under usual care
Baseline Payments
Net Change vs
Baseline Payments
Net Change vs
Baseline
Payments per patient with TRD (n=128912)
ECT andor TMS $737 $832 $95 $1201 $464
Outpatient Management amp ER $8571 $8571 $0 $8516 ($54)
Inpatient admissions $1839 $1839 $0 $1750 ($88)
Total per patient $11146 $11241 $95 $11467 $321
Annual payments for all patients with TRD $1436858324 $1449147639 $12289314 $1478288164 $41429840
09 29
Plan payments for Covered Population (n=6445594)
Annual payments for all services (all patients) $24364923787 $24377213101 $12289314 $24406353627 $41429840
Payment per member per month - overall (PMPMo) $31501 $31517 $016 $31554 $054
Scenario 1dagger Scenario 2Dagger
TMS and ECT are assumed to have equiva lent efficacy therefore no cost offset i s cons idered due to improved response
daggerScenario 1 cons is ts of 10 of patients treated with ECT 10 with rTMS and 80 under usual care
DaggerScenario 2 cons is ts of 20 of patients treated with ECT 10 with rTMS and 70 under usual care
copyInstitute for Clinical amp Economic Review 2011 Page 29
The cumulative discounted cost associated with managing patients with TRD treated with rTMS is estimated to be $35550 per patient over five years compared with $31296 for patients under usual care This is driven entirely by treatment costs and represents a 136 increase in payments associated with managing TRD When indirect non-medical costs are considered these estimates increase to $70205 and $76530 for rTMS and usual care respectively A cost per life-year gained could not be estimated as survival is assumed to be the same for each strategy Quality adjusted life years differed by a factor of 05 favoring rTMS and yielding a costQALY gained of $216468 per patient based on discounted direct medical costs (Table 11 page 30) Improvements in treatment response with rTMS resulted in a cost per additional treatment response gained of $11803 for rTMS When indirect costs were taken into consideration the cost per QALY gained increased to $321880 and the cost per additional treatment response increased to $17551 While the improved treatment response with rTMS resulted in faster return to work for those employed the increased time away from the workplace required when undergoing rTMS treatment itself shifted the balance toward higher indirect costs in the rTMS cohort Threshold analyses (based on direct medical costs only) were calculated to determine at what cost per-session of rTMS therapy must be priced to achieve cost neutrality and a costQALY gained of $100000 At $104 per session the costQALY gained is equal to $100000 this per-session cost is approximately one-half of that estimated in the primary analysis ($206 per session) The difference in total costs of usual care and rTMS was zero at an estimated rTMS cost per session of $16 In each analysis all other parameters were held constant
copyInstitute for Clinical amp Economic Review 2011 Page 30
Table 11 Cost-effectiveness of rTMS vs usual care in patients with TRD over 5 years
Usual Care rTMS
Difference TMS
relative to Usual Care
Clinical Outcomes for 1000 patients
Positive Treatment Response 2632 2993 360
Remissiondagger2421 2806 385
Deaths 69 69 00
Life years 4855 4855 00
Quality adjusted life years (QALYs) 3621 3640 196
Cumulative Costs for 1000 patients
rTMS therapy $0 $4918352 $4918352
Outpatient amp ER costs $43320644 $42787610 ($533033)
Inpatient costs $9668104 $9285806 ($382299)
Total Direct Medical Costs onlyDagger $31296246 $35549730 $4253483
Indirect Non-Medical costssect $17216215 $19537966 $2321751
Total including Indirect costs $70204963 $76529734 $6324770
Total cost per Patient
Including Indirect costs $70205 $76530 $6325
Direct Medical Costs $31296 $35550 $4253
Life years per patient 485 485 000
QALY per patient 362 364 002
Cost-Effectiveness
CostLYG NA
CostQALY (direct costs only) $216468
CostQALY (including indirect costs) $321880
CostAdditional Treatment Response (direct costs only) $11803
CostAdditional Treatment Response (including indirect costs) $17551 20-50 change on depress ion sca le
daggerHAM-D17 lt 8 HAM-D21 lt 10 or MADRS lt 8DaggerTotal di rect medica l costs i s not equal to the sum of the components as i t i s discounted whereas the components are
undiscountedsectIndirect costs include lost wages and payments from disabi l i ty insurance
copyInstitute for Clinical amp Economic Review 2011 Page 31
Table 2 (reference copy) General model input parameters
Unit Item Input Unit Frequency Unit
Population Characteristics Male patients 30 Mean age MaleFemale 455454 Years Employment Status
Full-Time 7110 Part-Time 1560
Unemployed 810 Disability 510
Payment Items ndash Private Outpatient Visits $584 per visit 24 per year Office Visits $115 per visit 137 per year Emergency Department $1089 per visit 03 per year Pharmacy $60 per script 312 per year ECT $43358 per session 8 per course of therapy rTMS planning $246 per session 1 per course of therapy rTMS delivery $206 per session 20 per course of therapy Inpatient Facility Admission $11296 per admission 01 admissions per year Inpatient Professional Visit $330 per visit 47 visits per admission
Indirect Cost Items Regional employment wage $2357 per hour Regional disability benefit $96258 per month
Reason for Productivity Loss General depression overall 512 Days lostyear ndash Medically-related 135 Days lostyear ndash Disability 377 Days lostyear Usual care 0 Additional days lostyear rTMS treatment 11 Days lostcourse of therapy
Utility Items Duration Baseline TRD - Male 0708 Annual Baseline TRD ndash Female 0708 Annual Death 0 Annual Change due to ndash Aging -000251 Annual ndash ECT 0 Per course ndash rTMS 0 Per course ndash Usual care 0 Per course ndash Response 00625 Per response ndash Remission 0125 Per remission ndash Relapse -00625 Per relapse ndash Serious Adverse Event -01 Per event
copyInstitute for Clinical amp Economic Review 2011 Page 32
53 Conclusions A 10 uptake in coverage of rTMS is projected to impact payer expenditures by 11 - 31 across New England depending on whether rTMS replaces a portion of ECT use or is additive On a per member per month (PMPM) basis the impact ranges from $021 - $059 or a relatively modest 007 - 02 increase Higher PMPM estimates were observed for the Medicaid-only population (03 - 05) but remained modest While actual decisions regarding whether to provide coverage for rTMS will require consideration of the tradeoffs involved by individual public and private payers in each state the overall analysis presented here and the state-specific analyses shown in Appendix B should be of some assistance In trials and in this economic evaluation rTMS therapy is associated with improved clinical outcomes relative to usual care The estimated cost of a course of rTMS is $4366 per patient which is projected to be partially offset by a reduction in resource use associated with improved outcomes Achievement of a costQALY below $100000 requires a projected 50 decrease in the cost of each rTMS treatment session relative to the base case estimate Cost neutrality cannot be achieved with a singular change in payments unless one is willing to accept a 97 decrease in the cost of each rTMS session These results are subject to the assumptions underlying the model and must be interpreted with care The AHRQ review (Gaynes 2011) determined that in general existing evidence is still insufficient to draw conclusions regarding the comparative effectiveness of nonpharmacologic therapies such as rTMS and ECT The outcomes associated with these strategies and with usual care were determined by data from the relatively few studies that were feasible to quantitatively analyze in the AHRQ review (Gaynes 2011) The strongest evidence was for the relative outcomes of rTMS compared with usual care based on the meta-analyzed data in the report In the budget impact analysis data were too sparse to draw meaningful inferences about the relative outcomes thus ECT and rTMS are assumed to be equivalent on response remission and relapse Another limitation of the model is that the long-term data to inform the subsequent course of therapy following treatment success or failure with ECT and rTMS are generally unavailable so many assumptions were required to predict outcomes beyond the first 6-12 months following treatment Moreover management of TRD is often complex and highly variable across patients and even the definition of TRD itself was inconsistent across studies leading to significant challenges in defining the course of patients over time Finally the underlying resource use and payments were determined from a population of insured patients diagnosed with depression in the Northeastern US while these data are somewhat relevant they may not be completely generalizable to each statersquos target population or to a more severe cohort of patients with TRD Taken as a whole the model results provide an estimate of the impact of introducing rTMS therapy for CEPAC consideration Specific point estimates should not be interpreted as absolute rather as a guide for consideration of various scenarios that would involve the introduction of coverage for rTMS
copyInstitute for Clinical amp Economic Review 2011 Page 33
54 Comparison of ICER Analysis to Published Cost-Effectiveness Analyses A single published study compared the cost-effectiveness rTMS to usual care (or ldquoshamrdquo) with results ranging from an rTMS strategy resulting in overall cost savings to a cost per QALY gained of US$36551 (Simpson 2009) Results were highly dependent on the source of effectiveness data ndash randomized control trial vs open-label study ndash and the inclusion of indirect productivity costs The primary reason for differences between these results and ours is that Simpson and colleagues had access to primary patient level data from which to derive more specific patient response categories (ie category of improvement in depression score) and other key inputs as well an estimation of model outcomes over a one-year time horizon compared with our five-year perspective The mean cost of rTMS therapy in this study was US$7792 as compared to our estimated cost of $4366 This is likely due to the longer rTMS duration assumed by Simpson and colleagues Other published studies (McLoughlin 2007 Knapp 2008) compared the cost-effectiveness of ECT to rTMS As these were conducted from the perspective of the health system in the United Kingdom it is difficult to draw meaningful comparisons to their estimates given the inherent differences in health-system dynamics and cost
copyInstitute for Clinical amp Economic Review 2011 Page 34
6 Questions and Discussion
CEPAC members voted on questions concerning the comparative clinical effectiveness of the four treatment options discussed 1) repetitive transcranial magnetic stimulation (rTMS) 2) electroconvulsive therapy (ECT) 3) vagus nerve stimulation and 4) cognitive behavioral therapyinterpersonal therapy (CBTIPT)
Comparative clinical effectiveness rTMS vs usual care
For patients who have TRD is the evidence adequate to demonstrate that rTMS provides a net
health benefit equivalent or superior to usual care (ie general supportive psychotherapy with
or without continued use of antidepressant medication)
CEPAC Vote 10 Yes 5 No
a If yes
Is rTMS equivalent or superior to usual care
5 Equivalent 5 Superior
b If no is this due to
Inadequate evidence with which to judge comparative net health benefit
5 Yes
Adequate evidence of an inferior net health benefit
0 Yes
Comments
CEPAC desired greater clarity on the ideal number of treatment failures required before rTMS is used since standard practice differs from the FDA label (one failed trial of antidepressants)
Although the majority of CEPAC voted that the evidence is adequate to suggest that rTMS is more effective than usual care comments from some CEPAC members noted the need for more data on which patients are ideal candidates for rTMS
Some members expressed concern about the potential for overutilization of rTMS without a standard definition of the ideal patient population
Many CEPAC members who voted that the evidence was inadequate to determine if rTMS is as effective or better than usual care cited the dearth of evidence on the benefits of rTMS beyond the initial 4-6 week treatment phase
copyInstitute for Clinical amp Economic Review 2011 Page 35
Comparative clinical effectiveness rTMS vs ECT
For patients who have TRD is the evidence adequate to demonstrate that rTMS provides a net
health benefit equivalent or superior to ECT
CEPAC Vote 9 Yes 6 No
a If yes
Is rTMS equivalent or superior to ECT
9 Equivalent 0 Superior
b If no is this due to
Inadequate evidence with which to judge comparative net health benefit
6 Yes
Adequate evidence of an inferior net health benefit
0 Yes
Comments
CEPAC emphasized the need to identify the subpopulations that would benefit more from each therapy Some CEPAC members suggested the need to establish target subpopulations for each treatment with more severe patients receiving ECT and less severe patients receiving rTMS
Comparative clinical effectiveness ECT vs usual care
For patients who have TRD is the evidence adequate to demonstrate that ECT provides a net
health benefit equivalent or superior to usual care (ie general supportive psychotherapy with
or without continued use of antidepressant medication)
CEPAC Vote 3 Yes 11 No 1 Abstain
a If yes
Is ECT equivalent or superior to usual care
0 Equivalent 3 Superior
b If no is this due to
Inadequate evidence with which to judge comparative net health benefit
11 Yes
Adequate evidence of an inferior net health benefit
0 Inferior
copyInstitute for Clinical amp Economic Review 2011 Page 36
Comments
Several CEPAC members qualified their ldquonordquo vote on the evidence for ECT with recognition that ECT is an older treatment adopted in an era with far lower standards for evidence on clinical effectiveness CEPAC members acknowledged that ECT is accepted broadly as standard of care for patients with severe depression who need immediate treatment due to features including catatonia psychosis active suicidal ideation and serial failure to respond to drug treatment
The one abstention vote was predicated on the lack of data regarding the appropriate patient population to receive ECT
Comparative clinical effectiveness VNS vs usual care
For patients who have TRD is the evidence adequate to demonstrate that VNS provides a net health benefit equivalent or superior to usual care (ie general supportive psychotherapy with or without continued use of antidepressant medication) CEPAC Vote 0 Yes 15 No
a If yes NA
b If no is this due to
Inadequate evidence with which to judge comparative net health benefit 15 Yes
Adequate evidence of an inferior net health benefit 0 Yes
Comparative clinical effectiveness CBTIPT vs usual care For patients who have TRD is the evidence adequate to demonstrate that CBTIPT provides a net health benefit equivalent or superior to usual care (ie general supportive psychotherapy with or without continued use of antidepressant medication) CEPAC Vote 6 Yes 9 No
a If yes
Is CBTIPT equivalent or superior to usual care 6 Equivalent 0 Superior
b If no is this due to
Inadequate evidence with which to judge comparative net health benefit 9 Yes
Adequate evidence of an inferior net health benefit 0 Yes
copyInstitute for Clinical amp Economic Review 2011 Page 37
Comparative Value When a majority of CEPAC votes that the evidence is adequate to demonstrate that an intervention produces patient outcomes equivalent or superior to a reference option the Council members are also asked to vote on whether the intervention represents a ldquohighrdquo ldquoreasonablerdquo or ldquolowrdquo value The value ldquoperspectiverdquo that members of CEPAC are asked to assume is that of a state Medicaid program that must make resource decisions within a fixed budget for care While information about hypothetical budget tradeoffs are provided CEPAC is not given prescribed boundaries or thresholds for budget impact PMPM changes or incremental cost-effectiveness ratios to guide its judgment of high reasonable or low value For each vote on comparative value Council members are asked to complete a multi-criteria decision analysis scoring sheet to make more transparent how they weighed different criteria in their ultimate judgment of comparative value Only those CEPAC members who vote that the evidence is adequate to demonstrate equivalent or superior clinical effectiveness are asked to vote on comparative value
Votes on Comparative Value In response to public comment provided in advance of the December 9 meeting an additional analysis was conducted prior to voting The comment suggested that a more relevant comparison might be the use of rTMS as an adjunct to usual care vs usual care with another adjunctive therapy (eg CBT adding an antipsychotic drug) A simple calculation was made to address this by adding the median cost of antipsychotic therapy observed in a TRD cohort study (Ivanova 2010) and applying it to the cost-effectiveness model no change in effectiveness was assumed Over 5 years this change would be estimated to increase the direct cost of usual care to approximately $3370 per patient thereby decreasing the incremental cost of rTMS to approximately $1900 and the resulting cost per QALY gained to $98000 1 rTMS vs usual care Based on reimbursement levels provided with this report would you judge the comparative value of rTMS to be of 1) high value 2) reasonable value or 3) low value compared to usual care CEPAC Vote 4 Low 6 Reasonable Multi-criteria decision analysis voting was done by all voting CEPAC members in order to describe their judgment and weighting of several criteria potentially relevant to an overall rating of comparative value The results for the vote on rTMS vs usual care is shown in the table below on the following page
copyInstitute for Clinical amp Economic Review 2011 Page 38
Table of Multi-criteria decision analysis votes
Possible Factors in Your Judgment of ldquoComparative Valuerdquo
Rating from lowest to highest (0 ndash 5) of each factor for this intervention
Rating of how important this factor was in overall judgment of
comparative value
Vote Average Vote Range Vote Average Vote Range
Magnitude of the net clinical benefit compared with other available options
28 0 ndash 5 4 3 ndash 5
Confidence in the evidence on comparative clinical benefit
22 0 - 5 41 3 -5
Magnitude of improvement in safety and tolerability
27 0 -5 34 0 -5
Confidence in the evidence on improvement of safety and tolerability
29 1 - 5 29 0 ndash 4
Magnitude of the incremental cost-effectiveness ratio (ICER)
24
0 -4 31 1 ndash 5
Confidence in the accuracy of the ICER 26 1 ndash 5 26 1 ndash 5
Budget impactopportunity cost (other potential uses for $$)
32 1 ndash 5 34 1 ndash 5
Other reasonable treatment options are available
21 0 ndash 5 36 0 ndash 5
Severity of the condition 38 1 ndash 5 34 0 - 5
Ability of the intervention to address healthcare disparities
15 0 ndash 5 16 0 ndash 5
Support for the intervention from clinicians 23 0 ndash 5 20 0 ndash 5
Special (vulnerable) population 35 1 ndash 5 34 1 ndash 5
Risk of overuse or misuse 32 1 ndash 5 28 1 ndash 5
2 rTMS vs ECT Based on reimbursement levels provided with this report would you judge the comparative value of rTMS to be of 1) high value 2) reasonable value or 3) low value compared to ECT CEPAC Vote 5 Low 3 Reasonable 1 High Multi-criteria decision analysis results for the comparative value votes on rTMS vs ECT are shown in the table on the following page
copyInstitute for Clinical amp Economic Review 2011 Page 39
Table of multi-criteria decision analysis votes
Possible Factors in Your Judgment of
ldquoComparative Valuerdquo Rating from lowest to highest (0 ndash 5) of
each factor for this intervention Rating of how important this factor
was in overall judgment of comparative value
Vote Average Vote Range Vote Average Vote Range
Magnitude of the net clinical benefit compared with other available options
25 0 ndash 5 3875 1 ndash 5
Confidence in the evidence on comparative clinical benefit
16 1 ndash 4 35 1 ndash 5
Magnitude of improvement in safety and tolerability
31 0 -5 325 0 ndash 5
Confidence in the evidence on improvement of safety and tolerability
25 0 ndash 4 3125 0 ndash 5
Magnitude of the incremental cost-effectiveness ratio (ICER)
20
0 ndash 5 25 1 ndash 5
Confidence in the accuracy of the ICER 24 1 ndash 5 3125 1 ndash 5
Budget impactopportunity cost (other potential uses for $$)
24 0 ndash 5 275 0 ndash 5
Other reasonable treatment options are available
31 0 ndash 5 35 0 ndash 5
Severity of the condition 36 0 ndash 5 425 3 ndash 5
Ability of the intervention to address healthcare disparities
23 0 ndash 5 2286 0 ndash 4
Support for the intervention from clinicians 28 0 ndash 5 275 0 ndash 5
Special (vulnerable) population 28 0 ndash 5 275 0 ndash 5
Risk of overuse or misuse 27 0 ndash 5 3286 0 ndash 5
Social value considerations for policymakers The final question of the meeting explored broader considerations of public health equity and access
Are there any considerations related to public health equity disparities in access or outcomes for specific patient populations or other social values that should be considered in medical policies related to the use of rTMS ECT VNS or CBTIPT
CEPAC voiced concern that with no third party reimbursement for rTMS only patients who can afford to pay out-of-pocket can obtain treatment Therefore there may be concerns over equity in access to rTMS for certain populations
copyInstitute for Clinical amp Economic Review 2011 Page 40
Roundtable Discussion Following the CEPAC votes and deliberation of the evidence CEPAC engaged in a roundtable discussion with a panel composed of two representatives from the clinical expert community and two representatives of regional private health plans The goal of the roundtable was to explore the implications of CEPAC votes for clinical practice and payer policies The topics discussed included Future Research Panelists outlined the gaps in current evidence and outlined future research needs to support future coverage decisions including evidence of the long-term health benefit and duration of effect for rTMS Panelists also indicated their concern for the shortage of funding for these types of clinical trials Coverage considerations Payer representatives and CEPAC discussed the prospect of using specific medical policies for rTMS such as coverage with evidence development patient registries and limited networks with centers of excellence but voiced concern for the practicalities of each Payers at the table cautioned that with such a significant population in need of interventions to treat resistant-depression that centers of excellence and limited networks may not be able to accommodate the demand for these services and that payers will have to be able to prioritize which patients receive treatment if coverage becomes available Payers also stressed their concerns for indication creep if rTMS became available for everyone to use highlighting that without further evidence on the specifics of treatment duration maintenance therapy and selection in the appropriate patient population that rTMS could be used inappropriately Policy Implications Physician Specialty Societies
Professional societies should lead the effort in establishing training and practice standards and promote the development of registries to monitor outcomes of patients receiving treatment for TRD that can be used to guide quality improvement
Professional societies should develop clinical guidelines for TRD that include recommendations for 1) the appropriate subpopulations to receive treatment with rTMS and ECT 2) treatment duration and frequency for rTMS 3) maintenance therapy requirements and 4) the threshold for previously failed treatments required before considering rTMS
Hospitals and other clinical providers
Each hospital providing treatment for TRD should participate in registries to gather data on the short and long-term outcomes of patients undergoing ECT or rTMS The data derived from these registries should be used to guide internal quality improvement and inform the
copyInstitute for Clinical amp Economic Review 2011 Page 41
appropriateness of each therapy for various subpopulations as well as an evaluation of the long-term outcomes for patients receiving treatment for TRD
Payers
If payers elect to cover rTMS they should consider limiting coverage to patients with ge 2 failed drug treatments during the most recent episode of depression a higher threshold than that included in the FDA license In addition payers should consider options for limiting coverage to designated centers of excellence perhaps with an additional requirement for continued evidence generation through a national registry to be organized by professional societies These limitations would be useful to assure the following 1) consistent rigorous training standards are established for providers and 2) coverage will support rather than hinder efforts to gather further evidence to help guide future patient provider and payer decisions regarding appropriate patient selection for both rTMS and ECT Payers on the roundtable voiced concerns for the feasibility and practicality of a centers of excellence approach for coverage of rTMS due to the large number of patients potentially eligible for this service and the consequent difficulty of assuring equitable access All participants on the roundtable agreed that it is difficult to find funding to support large effective registries
copyInstitute for Clinical amp Economic Review 2011 Page 42
7 Public Comment
Members of the public were invited to submit public comment on the draft supplementary report during the period of November 16 2011 to December 21 2011 The following organizations submitted andor presented public comments
David G Brock MD Medical Director Neuronetics Inc
Jeffrey C Fetter MD and Paul Holzheimer MD Executive Council to the New Hampshire Psychiatric Society
Patricia R Recupero JD MD President and CEO and colleagues Butler Hospital
Linda Carpenter MD Butler Hospital The complete statements provided to CEPAC can be accessed via the CEPAC website
copyInstitute for Clinical amp Economic Review 2011 Page 43
References
1 Aetna Clinical policy bulletin Vagus nerve stimulation httpwwwaetnacomcpbmedicaldata100_1990191html Accessed October 2011
2 Aetna Clinical policy bulletin Transcranial magnetic stimulation and cranial electrical
stimulation httpwwwaetnacomcpbmedicaldata400_4990469html Accessed October 2011
3 Aetna Clinical policy bulletin Electroconvulsive therapy
httpwwwaetnacomcpbmedicaldata400_4990445html Accessed October 2011 4 American Psychiatric Association Practice guideline for the treatment of patients with major
depressive disorder third edition httpwwwpsychiatryonlinecompracGuidepracGuideTopic_7aspx Accessed October 2011
5 Anthem Medical policy Vagus nerve stimulation (SURG00007)
httpwwwanthemcommedicalpoliciespoliciesmp_pw_a053286htm Accessed October 2011
6 Anthem Medical policy Transcranial magnetic stimulation for depression and other
neuropsychiatric disorders httpwwwanthemcommedicalpoliciespoliciesmp_pw_a047769htm Accessed October 2011
7 Arias E United States life tables 2007 National Vital Statistics Report 9(59) Accessed
September 28 2011 8 Azuma H Yamada A Shinagawa Y et al Ictal physiological characteristics of remitters during
bilateral electroconvulsive therapy Psychiatry Res 2011185(3)462-464 9 Baeken C De Raedt R Bossuyt A et al The impact of HF-rTMS treatment on serotonin(2A)
receptors in unipolar melancholic depression Brain Stimul 20114(2)104-111 10 Belmaker B Fitzgerald P George MS et al Managing the risks of repetitive transcranial
stimulation CNS Spectr 20038(7)489 11 Berlim MT McGirr A Beaulieu M- Turecki G High frequency repetitive transcranial magnetic
stimulation as an augmenting strategy in severe treatment-resistant major depression A prospective 4-week naturalistic trial J Affective Disord 2011130(1-2)312-317
copyInstitute for Clinical amp Economic Review 2011 Page 44
12 Blue Cross Blue Shield of Massachusetts Behavioral health policy Vagal nerve stimulation for depression (policy 038) httpswwwbluecrossmacomcommonen_USmedical_policies038 Vagal Nerve Stimulation for Depression prnpdf Accessed October 2011
13 Blue Cross Blue Shield of Massachusetts Behavioral health policy Outpatient electroconvulsive
therapy and transcranial magnetic stimulation (policy 319) httpwwwbluecrossmacomcommonen_USmedical_policies319 Outpatient Electroconvulsive Therapy prnpdfpage=1 Accessed October 2011
14 Blue Cross Blue Shield of Rhode Island Medical coverage policies Vagus nerve stimulation
httpswwwbcbsricomBCBSRIWebpdfmedical_policiesVagusNerveStimulationpdf Accessed October 2011
15 Blue Cross Blue Shield of Rhode Island Medical coverage policies Transcranial magnetic
stimulation as a treatment of depression and other psychiatricneurologic disorders httpswwwbcbsricomBCBSRIWebpdfmedical_policiesTranscranialMagneticStimulationasaTreatmentofDepressionandOtherPsychiatricNeurologicDisorderspdf Accessed October 2011
16 Blue Cross Blue Shield of Rhode Island Medical coverage policies Behavioral health services httpswwwbcbsricomBCBSRIWebpdfmedical_policiesBehavioralHealthServicespdf Accessed 2011 October
17 Bureau of Labor Statistics US Department of Labor State and metro area employment hours
amp earnings table 4 Average hours and earnings of all employees on private nonfarm payrolls by state httpwwwblsgovsaeeetablessae_annavg410pdf Accessed October 2011
18 Bureau of Labor Statistics US Department of Labor Consumer price index table 1A Consumer price index for all urban consumers (CPI-U) US city average by expenditure category and commodity and service group httpstatsblsgovcpicpid10avpdf Accessed 2011 October
19 Cadieux RJ Practical management of treatment-resistant depression Am Fam Physician 199858(9)2059-2062
20 Cassano P Fava M Depression and public health An overview J Psychosom Res 200253(4)849-857
21 Cigna Cigna medical coverage policy Vagus nerve stimulation (VNS)
httpwwwcignacomcustomer_carehealthcare_professionalcoverage_positionsmedicalmm_0350_coveragepositioncriteria_vagus_nerve_stimulationpdf Accessed October 2011
22 Cigna Medical coverage policy Transcranial magnetic stimulation httpwwwcignacomcustomer_carehealthcare_professionalcoverage_positionsmedicalmm_0383_coveragepositioncriteria_transcranial_magnetic_stimulationpdf Accessed October 2011
copyInstitute for Clinical amp Economic Review 2011 Page 45
23 ConnectiCare New technology guidance httpwwwconnecticarecomproviderPDFsNew Technology Guidancepdf Accessed October 2011
24 Department of Veterans Affairs Department of Defense VADoD clinical practice guideline for management of major depressive disorder (MDD) httpwwwhealthqualityvagovMajor_Depressive_Disorder_MDD_Clinical_Practice_Guidelineasp Accessed October 2011
25 DeRubeis RJ Evans MD Hollon SD Garvey MJ Grove WM Tuason VB How does cognitive
therapy work Cognitive change and symptom change in cognitive therapy and pharmacotherapy for depression J Consult Clin Psychol 199058(6)862-869
26 Domschke K Zavorotnyy M Diemer J et al COMT val158met influence on electroconvulsive therapy response in major depression Am J Med Genet Part B Neuropsychiatr Genet 2010153(1)286-290
27 Ectorg Electroconvulsive therapy httpwwwectorgresourcesapahtml Accessed October 2011
28 Eranti S Mogg A Pluck G et al A randomized controlled trial with 6-month follow-up of
repetitive transcranial magnetic stimulation and electroconvulsive therapy for severe depression Am J Psychiatry 2007164(1)73-81
29 Gaynes BN Lux L Lloyd S et al Nonpharmacologic interventions for treatment-resistant
depression in adultscomparative effectiveness review no33 Rockville MD Agency for Healthcare Research and Quality 201111-EHC056-EF
30 George MS Rush AJ Marangell LB et al A one-year comparison of vagus nerve stimulation with treatment as usual for treatment-resistant depression Biol Psychiatry 200558(5)364-373
31 Greenberg P Corey-Lisle PK Birnbaum H Marynchenko M Claxton A Economic implications of
treatment-resistant depression among employees Pharmacoeconomics 200422(6)363-373
32 Greenberg PE Kessler RC Birnbaum HG et al The economic burden of depression in the United States How did it change between 1990 and 2000 J Clin Psychiatry 200364(12)1465-1475
33 Greenhalgh J Knight C Hind D Beverley C Walters S Clinical and cost-effectiveness of
electroconvulsive therapy for depressive illness schizophrenia catatonia and mania Systematic reviews and economic modelling studies Health Technol Assess 20059(9)1-156 iii-iv
34 Harvard Pilgrim Health Care Medical policy Vagus nerve stimulation httpswwwharvardpilgrimorgplsportaldocsPAGEPROVIDERSMEDMGMTSTATEMENTSVAGUS_NERVE_STIM_1210PDF Accessed October 2011
copyInstitute for Clinical amp Economic Review 2011 Page 46
35 Harvard Pilgrim Health Care Medical policy Transcranial magnetic stimulation httpswwwharvardpilgrimorgplsportaldocsPAGEPROVIDERSMEDMGMTSTATEMENTSTRANSCRAN_MAG_STIM_0911PDF Accessed October 2011
36 HealthNet National medical policy Vagus nerve stimulation (policy number NMP236)
httpswwwhealthnetcomstaticgeneralunprotectedpdfsnationalpoliciesVagus_Nerve_Stimulation_Apr_11pdf Accessed October 2011
37 Holtzheimer PE3rd McDonald WM Mufti M et al Accelerated repetitive transcranial magnetic stimulation for treatment-resistant depression Depress Anxiety 201027(10)960-963
38 Institute for Clinical Systems Improvement Health care guideline Major depression in adults in primary care httpwwwicsiorgdepression_5depression__major__in_adults_in_primary_care_3html Accessed October 2011
39 Ivanova JI Birnbaum HG Kidolezi Y Subramanian G Khan SA Stensland MD Direct and indirect
costs of employees with treatment-resistant and non-treatment-resistant major depressive disorder Curr Med Res Opin 201026(10)2475-2484
40 Jhanwar VG Bishnoi RJ Singh L Jhanwar MR Utility of repetitive transcranial magnetic
stimulation as an augmenting treatment method in treatment-resistant depression Indian J Psychiatry 201153(2)145-148
41 Kayser S Bewernick BH Grubert C Hadrysiewicz BL Axmacher N Schlaepfer TE Antidepressant
effects of magnetic seizure therapy and electroconvulsive therapy in treatment-resistant depression J Psychiatr Res 201145(5)569-576
42 Kessler RC Berglund P Demler O et al The epidemiology of major depressive disorder Results from the national comorbidity survey replication (NCS-R) JAMA 2003289(23)3095-3105
43 Kito S Hasegawa T Koga Y Neuroanatomical correlates of therapeutic efficacy of low-frequency right prefrontal transcranial magnetic stimulation in treatment-resistant depression Psychiatry Clin Neurosci 201165(2)175-182
44 Klerman GL Weissman MM The course morbidity and costs of depression Arch Gen Psychiatry 199249(10)831-834
45 Knapp M Romeo R Mogg A et al Cost-effectiveness of transcranial magnetic stimulation vs electroconvulsive therapy for severe depression A multi-centre randomised controlled trial J Affect Disord 2008109(3)273-285
46 Lisanby SH Pallanti S Schlaepfer TE FDA considers classification of ECT CNS Spectr
200914(12)668-670
copyInstitute for Clinical amp Economic Review 2011 Page 47
47 Lorant V Deliege D Eaton W Robert A Philippot P Ansseau M Socioeconomic inequalities in depression A meta-analysis Am J Epidemiol 2003157(2)98-112
48 Lowry F FDA panel wants electroconvulsive therapy to retain high-risk class III status httpwwwmedscapecomviewarticle736697 Accessed October 2011
49 Lulic D Ahmadian A Baaj AA Benbadis SR Vale FL Vagus nerve stimulation Neurosurg Focus
200927(3)E5
50 Markowitz JC Weissman MM Interpersonal psychotherapy Principles and applications World Psychiatry 20043(3)136-139
51 Mayo Foundation for Medical Education and Research Tests and procedures Electroconvulsive therapy (ECT) httpwwwmayocliniccomhealthelectroconvulsive-therapyMY00129 Accessed October 2011
52 Mayo Foundation for Medical Education and Research Tests and procedures Transcranial
magnetic stimulation httpwwwmayocliniccomhealthtranscranial-magnetic-stimulationMY00185 Accessed October 2011
53 Mayo Foundation for Medical Education and Research Diseases and conditions Vagus nerve
stimulation for depression httpwwwmayocliniccomhealthvagus-nerve-stimulationMY00183 Accessed October 2011
54 Mayo Foundation for Medical Education and Research Tests and procedures Cognitive behavioral therapy httpwwwmayocliniccomhealthcognitive-behavioral-therapyMY00194 Accessed October 2011
55 McLoughlin DM Mogg A Eranti S et al The clinical effectiveness and cost of repetitive transcranial magnetic stimulation versus electroconvulsive therapy in severe depression A multicentre pragmatic randomised controlled trial and economic analysis Health Technol Assess 200711(24)1-54
56 Minelli A Zanardini R Abate M Bortolomasi M Gennarelli M Bocchio-Chiavetto L Vascular
endothelial growth factor (VEGF) serum concentration during electroconvulsive therapy (ECT) in treatment resistant depressed patients Prog Neuro-Psychopharmacol Biol Psychiatry 201135(5)1322-1325
57 National Institute for Health and Clinical Excellence (NICE) Depression The treatment and management of depression in adults (updated edition) httpguidanceniceorgukCG90GuidancepdfEnglish Accessed October 2011
58 National Institute for Health and Clinical Excellence (NICE) Transcranial magnetic stimulation for severe depression httpguidanceniceorgukIPG242 Accessed October 2011
copyInstitute for Clinical amp Economic Review 2011 Page 48
59 National Institute for Health and Clinical Excellence (NICE) Vagus nerve stimulation for treatment-resistant depression httpguidanceniceorgukIPG330 Accessed October 2011
60 OConnor M Brenninkmeyer C Morgan A et al Relative effects of repetitive transcranial magnetic stimulation and electroconvulsive therapy on mood and memory A neurocognitive risk-benefit analysis Cogn Behav Neurol 200316(2)118-127
61 Office of Retirement and Disability Policy US Social Security Administration Annual statistical report on the social security disability insurance program 2009 httpswwwsocialsecuritygovpolicydocsstatcompsdi_asr2009sect01html Accessed 2011 October
62 Oulis P Florakis A Markatou M Tzanoulinos G Masdrakis VG Corrected QT interval changes during electroconvulsive therapy- antidepressants-atypical antipsychotics coadministration Safety issues J ECT 201127(1)e4-e6
63 Pridmore S Substitution of rapid transcranial magnetic stimulation treatments for
electroconvulsive therapy treatments in the course of electroconvulsive therapy Depress Anxiety 200012(3)118-123
64 Rosenberg O Shoenfeld N Zangen A Kotler M Dannon PN Deep TMS in a resistant major
depressive disorder A brief report Depress Anxiety 201027(5)465-469
65 Rush AJ Siefert SE Clinical issues in considering vagus nerve stimulation for treatment-resistant depression Exp Neurol 2009219(1)36-43
66 Shuchman M Approving the vagus-nerve stimulator for depression N Engl J Med 2007356 (16)1604-1607
67 Simpson KN Welch MJ Kozel FA Demitrack MA Nahas Z Cost-effectiveness of transcranial magnetic stimulation in the treatment of major depression A health economics analysis Adv Ther 200926(3)346-368
68 Sperling W Biermann T Spannenberger R et al Changes in gustatory perceptions of patients
with major depression treated with vagus nerve stimulation (VNS) Pharmacopsychiatry 201144(2)67-71
69 Sullivan PW Ghushchyan V Preference-based EQ-5D index scores for chronic conditions in the
United States Med Decis Making 200626(4)410-420 70 Swartz H Interpersonal therapy In Hersen M Bellack AS eds Handbook of Comparative
Interventions for Adult Disorders 2nd ed New York John Wiley amp Sons Inc 1999139-159
71 Tezuka N Egawa H Fukagawa D et al Assessment of QT interval and QT dispersion during electroconvulsive therapy using computerized measurements J ECT 201026(1)41-46
copyInstitute for Clinical amp Economic Review 2011 Page 49
72 Thase ME Rush AJ When at first you dont succeed Sequential strategies for antidepressant nonresponders J Clin Psychiatry 199758 Suppl 1323-29
73 The Kaiser Family Foundation statehealthfactsorg Data source Medicaid coverage rates for the nonelderly by age states (2008-2009) US (2009) httpwwwstatehealthfactsorgcomparetablejsptyp=1ampind=159ampcat=3ampsub=42 Accessed September 2011
74 The Kaiser Family Foundation statehealthfactsorg Distribution of Medicaid enrollees by enrollment group FY2008 httpwwwstatehealthfactsorgcomparemaptablejsptyp=1ampind=200ampcat=4ampsub=52 Accessed September 2011
75 Tufts Health Plan Medical necessity guidelines Vagus nerve stimulation (document ID 2101520) httpwwwtuftshealthplancomproviderspdfmngVagus_Nerve_Stim_7111pdf Accessed October 2011
76 Tufts Health Plan Medical necessity guidelines Statements of non coverage (document ID 2122376) httpwwwtuftshealthplancomproviderspdfstatements_of_non_coveragepdf Accessed October 2011
77 UK ECT Review Group Efficacy and safety of electroconvulsive therapy in depressive disorders A systematic review and meta-analysis Lancet 2003361(9360)799-808
78 US Census Bureau 2009 American community survey 1-year estimates Health insurance
coverage status (S2701) httpfactfindercensusgovservletSTTable_bm=yamp-state=stamp-context=stamp-qr_name=ACS_2009_1YR_G00_S2701amp-ds_name=ACS_2009_1YR_G00_amp-tree_id=309amp-_caller=geoselectamp-geo_id=02000US1amp-format=amp-_lang=en Accessed October 2011
79 US Department of Health amp Human Services Centers for Medicare amp Medicaid Services National coverage determination (NCD) for vagus nerve stimulation (VNS) (16018) httpswwwcmsgovmedicare-coverage-databasedetailsncd-detailsaspxNCDId=230ampncdver=2ampCoverageSelection=Nationalampbc=gAAAABAAAAAAamp Accessed October 2011
80 US Department of Health amp Human Services Centers for Medicare amp Medicaid Services Local coverage determination (LCD) for ELECTROCONVULSIVE THERAPY (ECT) (L30493) httpswwwcmsgovmedicare-coverage-databasedetailslcd-detailsaspxLCDId=30493ampContrId=47ampver=8ampContrVer=1ampSearchType=AdvancedampCoverageSelection=BothampNCSelection=NCA|CAL|NCD|MEDCAC|TA|MCDampArticleType=Ed|Key|SAD|FAQampPolicyType=Finalamps=AllampKeyWord=Electroconvulsive+therapyampKeyWordLookUp=TitleampKeyWordSearchType=Exactampkq=trueampbc=IAAAABAAAAAAamp Accessed October 2011
81 US Food and Drug Administration Center for Devices and Radiological Health Premarket
approval application (PMA) supplement VNS therapy system (Cyberonics Inc)
copyInstitute for Clinical amp Economic Review 2011 Page 50
httpwwwaccessdatafdagovcdrh_docspdfp970003s050apdf Accessed October 2011 82 US Food and Drug Administration US Department of Health amp Human Services 510(k)
premarket notification summary Neurostar(R) TMS therapy system httpwwwaccessdatafdagovcdrh_docspdf8K083538pdf Accessed October 2011
83 US News amp World Report LP The top 10 health insurance companies in Connecticut httphealthusnewscomhealth-plansconnecticut Accessed September 2011
84 US News amp World Report LP The top 10 health insurance companies in Maine httphealthusnewscomhealth-plansmaine Accessed September 2011
85 US News amp World Report LP The top 10 health insurance companies in Massachusetts httphealthusnewscomhealth-plansmassachusetts Accessed September 2011
86 US News amp World Report LP The top 10 health insurance companies in New Hampshire httphealthusnewscomhealth-plansnew_hampshire Accessed September 2011
87 US News amp World Report LP The top 10 health insurance companies in Rhode Island httphealthusnewscomhealth-plansrhode_island Accessed September 2011
88 US News amp World Report LP The top 10 health insurance companies in Vermont httphealthusnewscomhealth-plansvermont Accessed September 2011
89 van Waarde JA Wielaard D Wijkstra J Verwey B van der Mast RC Retrospective study of continuation electroconvulsive therapy in 50 patients J ECT 201026(4)299-303
90 von Knorring L Depression--a serious lifelong but treatable illness Nord Med 1996111(8)259-263
91 Walter G Martin J Kirkby K Pridmore S Transcranial magnetic stimulation Experience knowledge and attitudes of recipients Aust N Z J Psychiatry 200135(1)58-61
92 Wassermann EM Risk and safety of repetitive transcranial magnetic stimulation Report and suggested guidelines from the International Workshop on the Safety of Repetitive Transcranial Magnetic Stimulation June 5-7 1996 Electroencephalogr Clin Neurophysiol 1998108(1)1-16
93 Weissman MM A brief history of interpersonal psychotherapy Psychiatr Ann 200636(8)553-557
94 Zheng D Macera CA Croft JB Giles WH Davis D Scott WK Major depression and all-cause mortality among white adults in the United States Ann Epidemiol 19977(3)213-218
copyInstitute for Clinical amp Economic Review 2011 Page 51
Appendix A
Study Citation Research Objective
Study Characteristics Patient Population Study Outcomes Adverse Events Quality of Life
Author Year Azuma H et al 2011 Research Objective Evaluation of the association of ictal peak HR and ictal EEG markers with the efficacy of ECT
Study Design Case series N=53 Study Duration 20 days (10 days before and after an ECT session) Intervention ECT Location bilaterally to fronto-temporal region Intensity minimum seizure duration of 20 sec if missed or abortive (lt20 sec) increased pulse wave stimuli by 10 up to 100 for a maximum of 3 stimulations per session Medications Allowed Antidepressants which remained unchanged throughout study benzodiazepines antipsychotics antiparkinson medications and antihypertensives allowed lithium and anti-epileptics discontinued
Depressed in-patients who had not responded to at least 4 weeks of pharmacotherapy Mean age 496 years Gender 31 males 22 females Diagnosis MDD 49 BD 4 Mean duration of current episode 210 months Mean number of previous episodes 17 Mean pre-treatment GRID-HAMD score 202
Mean post-treatment GRID-HAMD score 102 (plt0001) Remitters (50 reduction of baseline GRID-HAMD score and score le 7 points on post-treatment GRID-HAMD score) N=16 (302) Responders (50 reduction of baseline GRID-HAMD score) N=26 (491) Peak HR and postictal suppression index were associated with therapeutic efficacy in remitters with adequate seizures
No assessment conducted
copyInstitute for Clinical amp Economic Review 2011 Page 52
Study Citation Research Objective
Study Characteristics Patient Population Study Outcomes Adverse Events Quality of Life
Author Year Baeken C et al 2011 Research Objective Assessment of impact of HF rTMS therapy on post-synaptic 5-HTA2A receptor binding indices
Study Design Prospective matched cohort N=42 Study Duration At least 4 weeks (unspecified washout period followed by 2 week period without antidepressants or psychotropic medications then a 2 week period of rTMS sessions) Intervention Group 1 HF-rTMS Location left and right DLPFC Frequency 10 Hz Intensity 110 of patientrsquos resting motor threshold Number of trains 40 Length of trains 39 sec Inter-train interval 261 sec Number of sessions 10 daily over 2 week Medications Allowed Benzodiazepines all antidepressants and psychotropic agents were discontinued Group 2 No intervention
Group 1 Unipolar depressed patients of melancholic subtype For current depressive episode all patients had at least 2 unsuccessful trials of SSRISNRI medications and 1 failed trial of TCA therapy Overall mean age 453 years Overall gender 8 males 13 females Group 2 Healthy age-and sex-matched individuals with no history of depression Overall mean age 421 years Overall gender 8 males 13 females
Group 1 Responders (50 reduction of baseline HDRS) Mean baseline HDRS score 2667 Mean post HDRS score 911 Non-responders Mean baseline HDRS score 2475 Mean post HDRS score 2125 Compared with the control group depressed patients had less baseline 5-HTA2A receptor binding indices in the DLPFC and higher 5-HTA2A receptor binding indices in the left hippocampus Better outcomes with HF-rTMS were associated with a decrease in the right hippocampal 5-HTA2A receptor binding and positively correlated with bilateral 5-HTA2A receptor binding indices in the DLPFC
No assessment conducted
copyInstitute for Clinical amp Economic Review 2011 Page 53
Study Citation Research Objective
Study Characteristics Patient Population Study Outcomes Adverse Events Quality of Life
Author Year Berlim M et al 2011 Research Objective Evaluation of HF-rTMS as an augmenting therapy over a broad range of clinical and subjective outcomes in treatment-resistant MDD
Study Design Case series N=15 Study Duration 4 weeks Intervention HF rTMS Location left DLPFC Frequency 10 Hz Intensity 120 of resting motor threshold Number of trains 75 Length of trains 4 sec Inter-train interval 26 sec Number of sessions 5 daily per week for a total of 20 sessions Medications Allowed Current stable doses of psychotropic medications and benzodiazepines which were titrated as needed
Patients with moderate to severe MD and current diagnosis of a moderate current major depressive episode Patients had failed to respond to at least 3 courses of antidepressants from at least 2 different classes during current episode Mean age 47 years Gender 7 males 8 females Mean duration of current episode 68 months Mean number of previous episodes 153 Mean pre-treatment HAM-D21 2987 Mean pre-treatment WHOQOL-Bref ndash physical QOL 3285 Mean pre-treatment WHOQOL-Bref ndash psychological QOL 2861
Mean post-treatment HAM-D21 2527 (p=0035) Significant reductions were also measured in the IDS-SR30 HAM-A BAI and CGI-S scales
1 patient withdrew because of scalp pain Mean post-treatment WHOQOL-Bref ndash physical QOL 3912 (p=0028) Mean post-treatment WHOQOL-Bref ndash psychological QOL 2861 (p=0041) Significant improvement was seen in the WHOQOL-Bref ndashoverall QOL No significant changes were noted in the social and environmental domains of the WHOQOL-Bref
copyInstitute for Clinical amp Economic Review 2011 Page 54
Study Citation Research Objective
Study Characteristics Patient Population Study Outcomes Adverse Events Quality of Life
Author Year Domschke K et al 2010 Research Objective Analysis of the effects on ECT response in TRD patients with the COMT val158met genotypic polymorphism
Study Design Case series N=104 Study Duration Ranging from a mean of 76 to 84 weeks Intervention ECT Location right unilateral (6 patients switched to bilateral therapy due to insufficient response) Intensity minimum seizure duration of 25 sec restimulation included dosage elevation in 5-10 steps Medications Allowed Antidepressants neuroleptics and anxiolytics
Patients with current major depression with pharmacologically treatment-resistant disease having failed at least 2 courses of antidepressant therapy Mean age 566 years Gender 33 males 71 females Mean number of previous episodes 37 Mean pre-treatment HAM-D21 229
Mean post-treatment HAM-D21 91 (plt 00005) Responders (gt50 reduction of HAM-D) 67104 Non-responders (le 50 decrease in HAM-D) 37104 The more active allele of COMT 158val was significantly associated with pre-ECT severity of depression particularly in female patients these carriers also responded significantly better to ECT therapy
No analysis conducted
copyInstitute for Clinical amp Economic Review 2011 Page 55
Study Citation Research Objective
Study Characteristics Patient Population Study Outcomes Adverse Events Quality of Life
Author Year Holtzheimer PE et al 2010 Research Objective Evaluation of the safety and efficacy of accelerated rTMS (aTMS) in depressed patients
Study Design Case series N=14 Study Duration 6 weeks Intervention aTMS Location left DLPFC Frequency 10 Hz Intensity 100 of motor threshold Number of trains 20 per hour-long session Length of trains 5 sec Inter-train interval 25 sec Number of sessions 5 consecutive sessions on Day 1 10 consecutive sessions on Day 2 Medications Allowed No specific restrictions patients needed to maintain stable dosing throughout study
Depressed patients in a current major depressive episode with le 3 adequate medication failures in current episode Median age 51 years (range 20-74) Gender 9 males 5 females Diagnosis MDD 13 BD 1 Median duration of current episode 9 months (range 3-96) Median number of previous episodes 4 (range 2-8) Mean baseline HDRS24 score 246
At 6 weeks (n=9) Mean HDRS24 111 (plt 0001) Responders (ge 50 decrease in baseline HDRS24) 514 Remitters (HDRS24 le 10) 414 Significant decreases were noted in HAM-A RBANS and BDI
1 patient discontinued the trial due to increased suicidal ideation 1 patient required a decrease in stimulation intensity due to tolerability and subsequently dropped out of the trial No seizures occurred
copyInstitute for Clinical amp Economic Review 2011 Page 56
Study Citation Research Objective
Study Characteristics Patient Population Study Outcomes Adverse Events Quality of Life
Author Year Jhanwar VG et al 2011 Research Objective Assessment of the safety and efficacy of augmenting therapy with rTMS in patients with MDD who do not respond to a standard antidepressant
Study Design Case series N= 21 Study Duration 4 weeks Intervention rTMS Location left DLPFC Frequency 10 Hz Intensity 110 of patientrsquos motor threshold Number of trains 25 Length of trains 5 sec Inter-train interval 25 sec Number of sessions 20 sessions over 4 weeks Medications Allowed No specific restrictions except no changes were allowed after inclusion into the study
Patients with MDD without psychotic features with at least 2 adequate trials of antidepressants Mean age 38 years Gender 13 males 8 females Mean duration of current episode 3657 months Mean baseline HAM-D17 score 3080
Mean post-treatment HAM-D17 score 1900 (plt 0001) A significant decrease in CGI-C was also noted
No study dropouts were due to adverse events 4 patients reported headache and pain over left scalp during treatment that ceased with termination of rTMS No patients developed new onset of seizures There were no patient reports of memory or cognitive side effects There was no impact of rTMS on blood pressure or heart rate during treatment
copyInstitute for Clinical amp Economic Review 2011 Page 57
Study Citation Research Objective
Study Characteristics Patient Population Study Outcomes Adverse Events Quality of Life
Author Year Kito S et al 2011 Research Objective Analysis of changes in cerebral blood flow following low-frequency right prefrontal stimulation (LFRS) and neuroanatomical correlates of therapeutic efficacy in patients with TRD
Study Design Case series N=26 Study Duration 5 weeks Intervention rTMS Location right DLPFC Frequency 1 Hz Intensity 100 of resting motor threshold Number of trains 5 Length of trains 60 sec Inter-train interval 60 sec Number of sessions 12 sessions over 3 weeks Medications Allowed No specific restrictions however no changes allowed 4 weeks prior to and throughout study
Patients diagnosed with MDD (unipolar) with failed response to a minimum of 2 courses of antidepressants from different classes in the current episode Mean age 4619 years Gender 14 males 12 females Mean duration of current episode 1142 months Mean number of previous episodes 312 Mean baseline HDRS score 2265
Mean post-treatment HDRS score 1192 (plt 0001) Responders (50 reduction in HDRS from baseline) 1126 Remitters (HDRS lt8) 411 responders Non-responders 1526 No areas with significantly increased cerebral blood flow were identified following LFRS Significant decreases were seen in regional cerebral blood flow with correlation to therapeutic efficacy of LFRS in areas such as the right prefrontal cortex and the bilateral orbitofrontal cortex
No analysis conducted
copyInstitute for Clinical amp Economic Review 2011 Page 58
Study Citation Research Objective
Study Characteristics Patient Population Study Outcomes Adverse Events Quality of Life
Author Year Minelli A et al 2011 Research Objective Evaluation of impact of ECT on VEGF serum levels in TRD patients
Study Design Case series N=19 Study Duration 1 month Intervention ECT Location bilateral frontotemporal region Intensity NR Conditions Max charge 504 mC Current 09 A Frequency 30-70 Hz Pulse width 1 ms Max duration 8 sec Medications Allowed Concurrent medications maintained for 3 weeks prior to and throughout study
Patients with TRD MDD (unipolar) with failure to respond to at least 2 adequate trials of 2 or more antidepressants classes and to an adequate trial of a TCA Mean age 5484 years Gender 4 males 15 females Mean baseline MADRS 3432
Mean post-treatment MADRS 742 (plt 0001) VEGF serum concentrations significantly increased from baseline to the end of the study A significant correlation was found between the increase in VEGF at 1 month and the decrease in MADRS score
No analysis conducted
copyInstitute for Clinical amp Economic Review 2011 Page 59
Study Citation Research Objective
Study Characteristics Patient Population Study Outcomes Adverse Events Quality of Life
Author Year Oulis P et al 2011 Research Objective Investigation of QTc interval changes associated with concomitant ECT and atypical antipsychoticantidepressant therapy
Study Design Case series N=6 Study Duration 10 to 11 sessions Intervention ECT Location bilateral application location NR Intensity NR Medications Allowed All patients received antidepressant therapy along with low doses of atypical antipsychotics
Patients with MDD and resistant to combination therapy with antidepressant and atypical antipsychotic medications Mean age 50 years Gender 6 females
QTc interval changes remained within normal limits just prior to and throughout ECT administration (up to 10 minutes afterwards)
No adverse cardiac events occurred in patients including arrhythmias such as torsade de pointes
copyInstitute for Clinical amp Economic Review 2011 Page 60
Study Citation Research Objective
Study Characteristics Patient Population Study Outcomes Adverse Events Quality of Life
Author Year Sperling W et al 2011 Research Objective Assessment of gustatory and olfactory perception during VNS therapy in patients with refractory depression
Study Design Case series N=9 Study Duration NR Intervention VNS Intensity 125 mA Frequency 20 Hz Pulse width 500 μs On mode 30 sec on 5 min off Off mode 30 min off Medications Allowed No concurrent medications allowed 2 weeks prior to and throughout study
Therapy-resistant patients with a major depressive episode Mean age 516 years Gender 6 males 3 females Mean baseline HAM-D17 score 1089
No statistically significant changes assessed during on and off mode VNS therapy Significant changes in the intensity of taste perception were demonstrated during the on mode of VNS particularly with ldquosweetrdquo and ldquobitterrdquo
No analysis conducted
Abbreviations 5-HTA2A a serotonin receptor A amps aTMS accelerated repetitive transcranial magnetic stimulation BAI Beck Anxiety Inventory BD bipolar disorder BDI Beck Depression Inventory-2 CGI-C Clinical Global Impression - change subscae CGI-S Clinical Global Impression-severity subscale COMT catechol-O-methyltransferase DLPFC dorsolateral pre-frontal cortex ECT electroconvusive therapy EEG electroencephalogram GRID-HAMD standardized administration and scoring of the HAMD HAM-A Hamilton Anxiety Rating Scale HAMD Hamilton Depression Rating Scale HDRS Hamilton Depression Rating Scale HF high frequency HR heart rate Hz herz IDS-SR30 30 item Inventory of Depressive Symptomatology LFRS low-frequency right pre-frontal stimulation MADRS Montgomery and Asberg Depression and Rating Scale mC milliCoulomb MDD or MD major depressive disorder ms millisecond NR not reported QOL quality of life QTc corrected QT interval RBANS Repeatable Battery for the Assessment of Neuropsychological Status rTMS repetitive transcranial magnetic stimulation TCA tricyclic antidepressant TRD treatment-resistant depression VEGF vascular endothelial growth factor VNS vagus nerve stimulation WHOQOL World Health Organizationrsquos quality of life measure brief version
copyInstitute for Clinical amp Economic Review 2011 Page 61
Appendix B
Budget Impact by State
Connecticut
Table B1 Connecticut Estimated Clinical Impact of ECT and TMS in an Insured Population
Table B2 Connecticut Estimated Economic Impact of ECT and TMS Use in an Insured Population (2010 US dollars)
Overall
n n
Covered Populations
Total membership (n) 163800 11 1383791 89 1547591
Prevalence of TRD 34 20 21
Patients with TRD (n) 5536 27676 33212Note that uninsured patients are not represented in this analys is as there is no direct impact to a third party payer
Medicaid Private Payer
Baseline Scenario 1dagger
Net Change vs
Baseline Scenario 2Dagger
Net Change vs
Baseline
Summary of Covered Population
Total membership (n) 1547591 1547591 1547591
Patients with TRD (n) 33212 33212 33212
Patients with TRD receiving ECT andor
TMS (n) 6642 6642 9963
As a proportion of all members 04 04 06
As a proportion of patients with TRD 200 200 300
Outcomes amp Resource Use
Positive Treatment Response (n) 11129 11129 0 12191 1062
Positive Treatment Response () 335 335 367Note This analys is i s from the point of view of a third party payer therefore a l l patients are assumed to be covered
daggerScenario 1 cons is ts of 10 of patients treated with ECT 10 with rTMS and 80 under usual care
DaggerScenario 2 cons is ts of 20 of patients treated with ECT 10 with rTMS and 70 under usual care
Baseline Payments
Net Change vs
Baseline Payments
Net Change vs
Baseline
Payments per patient with TRD (n=033212)
ECT andor TMS $688 $796 $108 $1140 $452
Outpatient Management amp ER $7999 $7999 $0 $7949 ($50)
Inpatient admissions $1716 $1716 $0 $1634 ($82)
Total per patient $10403 $10511 $108 $10722 $319
Annual payments for all patients with TRD $345501751 $349091659 $3589908 $356098685 $10596933
10 31
Plan payments for Covered Population (n=1547591)
Annual payments for all services (all patients) $5602361390 $5605951298 $3589908 $5612958323 $10596933
Payment per member per month - overall (PMPMo) $30167 $30186 $019 $30224 $057
Scenario 1dagger Scenario 2Dagger
TMS and ECT are assumed to have equiva lent efficacy therefore no cost offset i s cons idered due to improved response
daggerScenario 1 cons is ts of 10 of patients treated with ECT 10 with rTMS and 80 under usual care
DaggerScenario 2 cons is ts of 20 of patients treated with ECT 10 with rTMS and 70 under usual care
copyInstitute for Clinical amp Economic Review 2011 Page 62
Maine
Table B3 Maine Estimated Clinical Impact of ECT and TMS in an Insured Population
Table B4 Maine Estimated Economic Impact of ECT and TMS Use in an Insured Population (2010 US dollars)
Overall
n n
Covered Populations
Total membership (n) 135700 14 807396 86 943096
Prevalence of TRD 34 20 22
Patients with TRD (n) 4587 16148 20735Note that uninsured patients are not represented in this analys is as there is no direct impact to a third party payer
Medicaid Private Payer
Baseline Scenario 1dagger
Net Change vs
Baseline Scenario 2Dagger
Net Change vs
Baseline
Summary of Covered Population
Total membership (n) 943096 943096 943096
Patients with TRD (n) 20735 20735 20735
Patients with TRD receiving ECT andor
TMS (n) 4147 4147 6221
As a proportion of all members 04 04 07
As a proportion of patients with TRD 200 200 300
Outcomes amp Resource Use
Positive Treatment Response (n) 6948 6948 0 7611 663
Positive Treatment Response () 335 335 367Note This analys is i s from the point of view of a third party payer therefore a l l patients are assumed to be covered
daggerScenario 1 cons is ts of 10 of patients treated with ECT 10 with rTMS and 80 under usual care
DaggerScenario 2 cons is ts of 20 of patients treated with ECT 10 with rTMS and 70 under usual care
Baseline Payments
Net Change vs
Baseline Payments
Net Change vs
Baseline
Payments per patient with TRD (n=020735)
ECT andor TMS $672 $784 $112 $1120 $448
Outpatient Management amp ER $7812 $7812 $0 $7763 ($49)
Inpatient admissions $1676 $1676 $0 $1595 ($81)
Total per patient $10160 $10272 $112 $10478 $318
Annual payments for all patients with TRD $210659418 $212987121 $2327703 $217259446 $6600028
11 31
Plan payments for Covered Population (n=0943096)
Annual payments for all services (all patients) $3359804248 $3362131951 $2327703 $3366404276 $6600028
Payment per member per month - overall (PMPMo) $29688 $29708 $021 $29746 $058
Scenario 1dagger Scenario 2Dagger
TMS and ECT are assumed to have equiva lent efficacy therefore no cost offset i s cons idered due to improved response
daggerScenario 1 cons is ts of 10 of patients treated with ECT 10 with rTMS and 80 under usual care
DaggerScenario 2 cons is ts of 20 of patients treated with ECT 10 with rTMS and 70 under usual care
copyInstitute for Clinical amp Economic Review 2011 Page 63
Massachusetts
Table B5 Massachusetts Estimated Clinical Impact of ECT and TMS in an Insured Population
Table B6 Massachusetts Estimated Economic Impact of ECT and TMS Use in an Insured Population (2010 US dollars)
Overall
n n
Covered Populations
Total membership (n) 690900 22 2396386 78 3087286
Prevalence of TRD 34 20 23
Patients with TRD (n) 23352 47928 71280Note that uninsured patients are not represented in this analys is as there is no direct impact to a third party payer
Medicaid Private Payer
Baseline Scenario 1dagger
Net Change vs
Baseline Scenario 2Dagger
Net Change vs
Baseline
Summary of Covered Population
Total membership (n) 3087286 3087286 3087286
Patients with TRD (n) 71280 71280 71280
Patients with TRD receiving ECT andor
TMS (n) 14256 14256 21384
As a proportion of all members 05 05 07
As a proportion of patients with TRD 200 200 300
Outcomes amp Resource Use
Positive Treatment Response (n) 23885 23885 0 26165 2280
Positive Treatment Response () 335 335 367Note This analys is i s from the point of view of a third party payer therefore a l l patients are assumed to be covered
daggerScenario 1 cons is ts of 10 of patients treated with ECT 10 with rTMS and 80 under usual care
DaggerScenario 2 cons is ts of 20 of patients treated with ECT 10 with rTMS and 70 under usual care
Baseline Payments
Net Change vs
Baseline Payments
Net Change vs
Baseline
Payments per patient with TRD (n=071280)
ECT andor TMS $640 $761 $120 $1081 $441
Outpatient Management amp ER $7447 $7447 $0 $7400 ($47)
Inpatient admissions $1598 $1598 $0 $1521 ($77)
Total per patient $9685 $9806 $120 $10002 $317
Annual payments for all patients with TRD $690377139 $698959694 $8582555 $712961042 $22583903
12 33
Plan payments for Covered Population (n=3087286)
Annual payments for all services (all patients) $10625552550 $10634135105 $8582555 $10648136452 $22583903
Payment per member per month - overall (PMPMo) $28681 $28704 $023 $28742 $061
Scenario 1dagger Scenario 2Dagger
TMS and ECT are assumed to have equiva lent efficacy therefore no cost offset i s cons idered due to improved response
daggerScenario 1 cons is ts of 10 of patients treated with ECT 10 with rTMS and 80 under usual care
DaggerScenario 2 cons is ts of 20 of patients treated with ECT 10 with rTMS and 70 under usual care
copyInstitute for Clinical amp Economic Review 2011 Page 64
New Hampshire
Table B7 New Hampshire Estimated Clinical Impact of ECT and TMS in an Insured Population
Table B8 New Hampshire Estimated Economic Impact of ECT and TMS Use in an Insured Population (2010 US dollars)
Overall
n n
Covered Populations
Total membership (n) 35500 9 341054 91 376554
Prevalence of TRD 34 20 21
Patients with TRD (n) 1200 6821 8021Note that uninsured patients are not represented in this analys is as there is no direct impact to a third party payer
Medicaid Private Payer
Baseline Scenario 1dagger
Net Change vs
Baseline Scenario 2Dagger
Net Change vs
Baseline
Summary of Covered Population
Total membership (n) 376554 376554 376554
Patients with TRD (n) 8021 8021 8021
Patients with TRD receiving ECT andor
TMS (n) 1604 1604 2406
As a proportion of all members 04 04 06
As a proportion of patients with TRD 200 200 300
Outcomes amp Resource Use
Positive Treatment Response (n) 2688 2688 0 2944 257
Positive Treatment Response () 335 335 367Note This analys is i s from the point of view of a third party payer therefore a l l patients are assumed to be covered
daggerScenario 1 cons is ts of 10 of patients treated with ECT 10 with rTMS and 80 under usual care
DaggerScenario 2 cons is ts of 20 of patients treated with ECT 10 with rTMS and 70 under usual care
Baseline Payments
Net Change vs
Baseline Payments
Net Change vs
Baseline
Payments per patient with TRD (n=008021)
ECT andor TMS $693 $800 $107 $1146 $453
Outpatient Management amp ER $8058 $8058 $0 $8007 ($51)
Inpatient admissions $1729 $1729 $0 $1646 ($83)
Total per patient $10479 $10586 $107 $10798 $319
Annual payments for all patients with TRD $84052590 $84909076 $856487 $86613724 $2561134
10 30
Plan payments for Covered Population (n=0376554)
Annual payments for all services (all patients) $1369730640 $1370587126 $856487 $1372291774 $2561134
Payment per member per month - overall (PMPMo) $30313 $30332 $019 $30370 $057
Scenario 1dagger Scenario 2Dagger
TMS and ECT are assumed to have equiva lent efficacy therefore no cost offset i s cons idered due to improved response
daggerScenario 1 cons is ts of 10 of patients treated with ECT 10 with rTMS and 80 under usual care
DaggerScenario 2 cons is ts of 20 of patients treated with ECT 10 with rTMS and 70 under usual care
copyInstitute for Clinical amp Economic Review 2011 Page 65
Rhode Island
Table B9 Rhode Island Estimated Clinical Impact of ECT and TMS in an Insured Population
Table B10 Rhode Island Estimated Economic Impact of ECT and TMS Use in an Insured Population (2010 US dollars)
Overall
n n
Covered Populations
Total membership (n) 78100 6 1246212 94 1324312
Prevalence of TRD 34 20 21
Patients with TRD (n) 2640 24924 27564Note that uninsured patients are not represented in this analys is as there is no direct impact to a third party payer
Medicaid Private Payer
Baseline Scenario 1dagger
Net Change vs
Baseline Scenario 2Dagger
Net Change vs
Baseline
Summary of Covered Population
Total membership (n) 1324312 1324312 1324312
Patients with TRD (n) 27564 27564 27564
Patients with TRD receiving ECT andor
TMS (n) 5513 5513 8269
As a proportion of all members 04 04 06
As a proportion of patients with TRD 200 200 300
Outcomes amp Resource Use
Positive Treatment Response (n) 9236 9236 0 10118 882
Positive Treatment Response () 335 335 367Note This analys is i s from the point of view of a third party payer therefore a l l patients are assumed to be covered
daggerScenario 1 cons is ts of 10 of patients treated with ECT 10 with rTMS and 80 under usual care
DaggerScenario 2 cons is ts of 20 of patients treated with ECT 10 with rTMS and 70 under usual care
Baseline Payments
Net Change vs
Baseline Payments
Net Change vs
Baseline
Payments per patient with TRD (n=027564)
ECT andor TMS $709 $811 $103 $1166 $457
Outpatient Management amp ER $8242 $8242 $0 $8190 ($52)
Inpatient admissions $1768 $1768 $0 $1683 ($85)
Total per patient $10719 $10822 $103 $11039 $320
Annual payments for all patients with TRD $295460710 $298290462 $2829752 $304282619 $8821908
10 30
Plan payments for Covered Population (n=1324312)
Annual payments for all services (all patients) $4887928208 $4890757960 $2829752 $4896750116 $8821908
Payment per member per month - overall (PMPMo) $30758 $30775 $018 $30813 $056
Scenario 1dagger Scenario 2Dagger
TMS and ECT are assumed to have equiva lent efficacy therefore no cost offset i s cons idered due to improved response
daggerScenario 1 cons is ts of 10 of patients treated with ECT 10 with rTMS and 80 under usual care
DaggerScenario 2 cons is ts of 20 of patients treated with ECT 10 with rTMS and 70 under usual care
copyInstitute for Clinical amp Economic Review 2011 Page 66
Vermont
Table B11 Vermont Estimated Clinical Impact of ECT and TMS in an Insured Population
Table B12 Vermont Estimated Economic Impact of ECT and TMS Use in an Insured Population (2010 US dollars)
Overall
n n
Covered Populations
Total membership (n) 63700 19 270755 81 334455
Prevalence of TRD 34 20 23
Patients with TRD (n) 2153 5415 7568Note that uninsured patients are not represented in this analys is as there is no direct impact to a third party payer
Medicaid Private Payer
Baseline Scenario 1dagger
Net Change vs
Baseline Scenario 2Dagger
Net Change vs
Baseline
Summary of Covered Population
Total membership (n) 334455 334455 334455
Patients with TRD (n) 7568 7568 7568
Patients with TRD receiving ECT andor
TMS (n) 1513 1513 2270
As a proportion of all members 05 05 07
As a proportion of patients with TRD 200 200 300
Outcomes amp Resource Use
Positive Treatment Response (n) 2536 2536 0 2778 242
Positive Treatment Response () 335 335 367Note This analys is i s from the point of view of a third party payer therefore a l l patients are assumed to be covered
daggerScenario 1 cons is ts of 10 of patients treated with ECT 10 with rTMS and 80 under usual care
DaggerScenario 2 cons is ts of 20 of patients treated with ECT 10 with rTMS and 70 under usual care
Baseline Payments
Net Change vs
Baseline Payments
Net Change vs
Baseline
Payments per patient with TRD (n=007568)
ECT andor TMS $653 $770 $117 $1097 $444
Outpatient Management amp ER $7595 $7595 $0 $7547 ($48)
Inpatient admissions $1629 $1629 $0 $1551 ($78)
Total per patient $9878 $9995 $117 $10195 $317
Annual payments for all patients with TRD $74755847 $75642119 $886271 $77158221 $2402374
12 32
Plan payments for Covered Population (n=0334455)
Annual payments for all services (all patients) $1167953229 $1168839501 $886271 $1170355603 $2402374
Payment per member per month - overall (PMPMo) $29101 $29123 $022 $29161 $060
Scenario 1dagger Scenario 2Dagger
TMS and ECT are assumed to have equiva lent efficacy therefore no cost offset i s cons idered due to improved response
daggerScenario 1 cons is ts of 10 of patients treated with ECT 10 with rTMS and 80 under usual care
DaggerScenario 2 cons is ts of 20 of patients treated with ECT 10 with rTMS and 70 under usual care
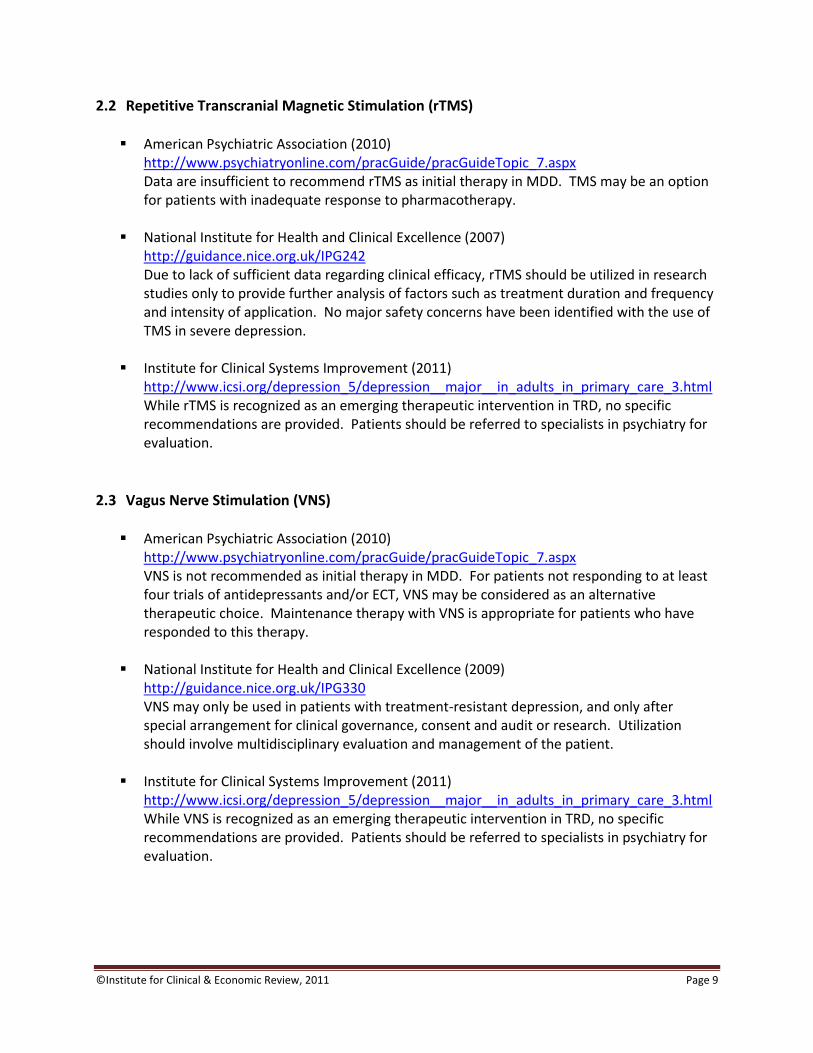
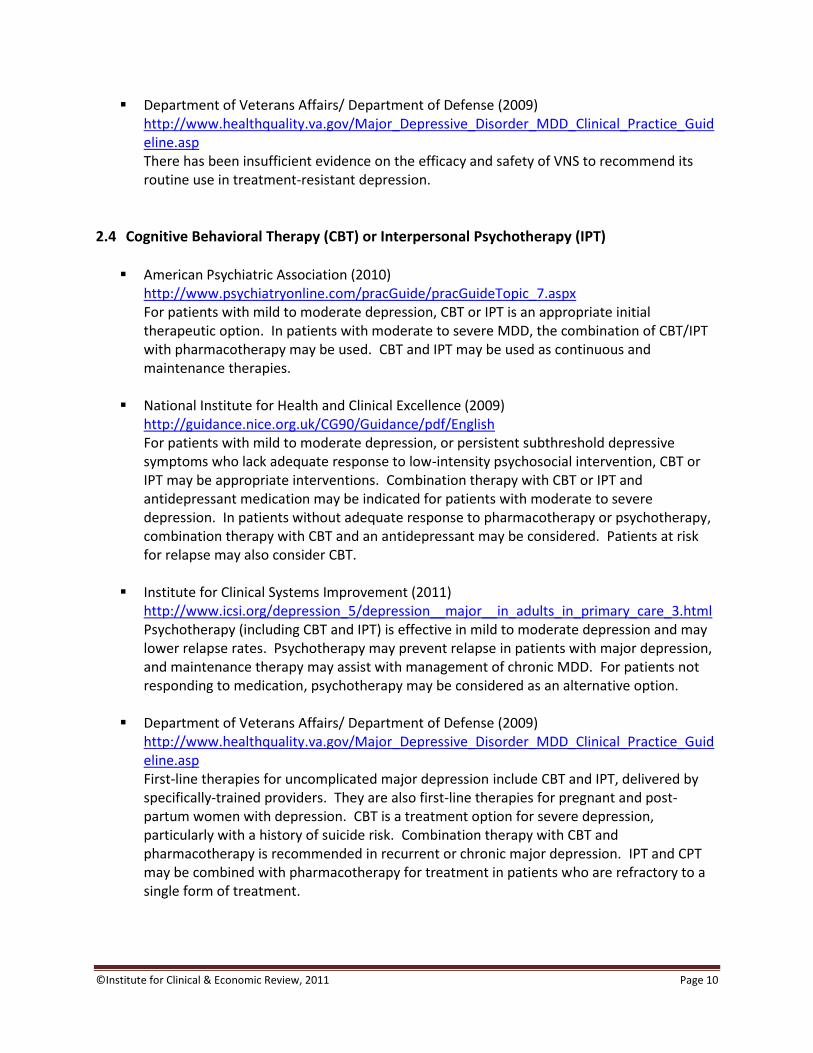
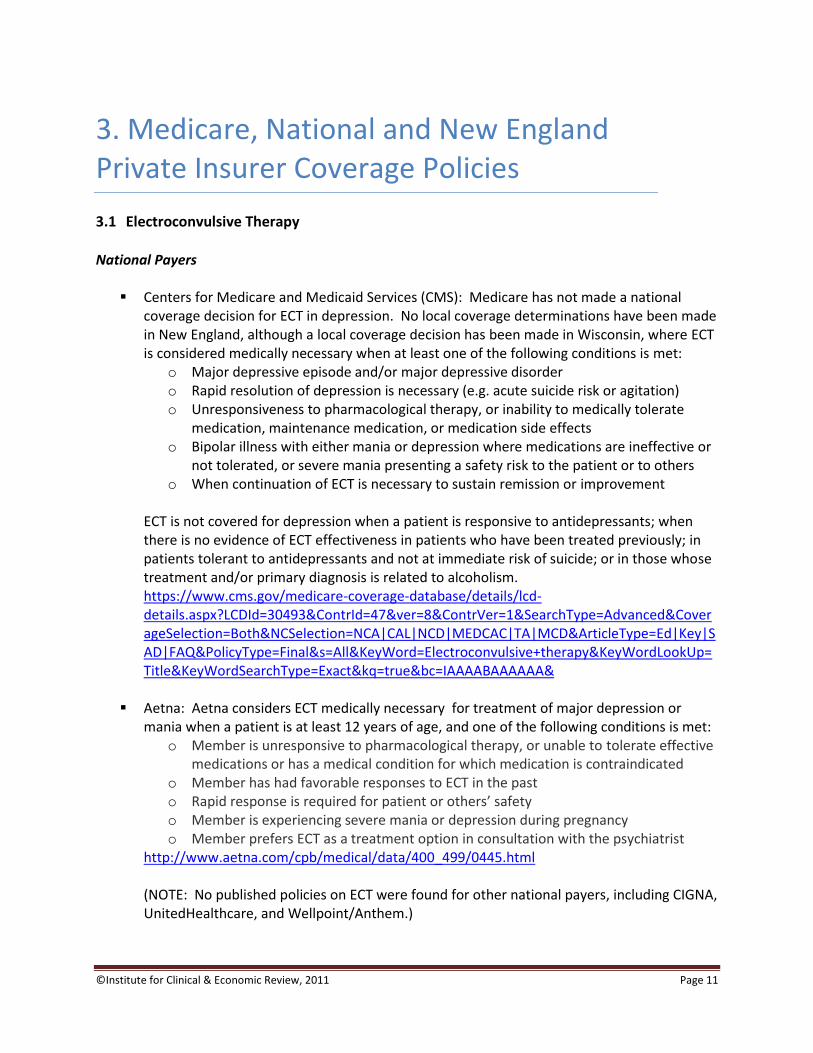
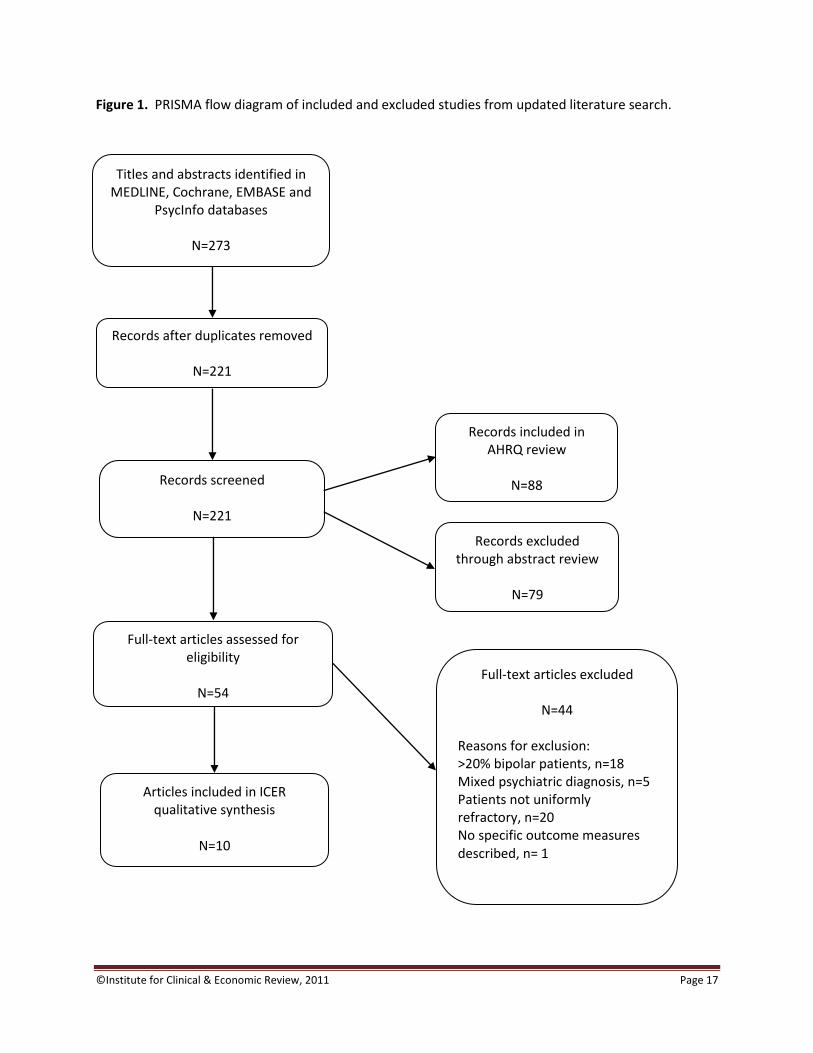
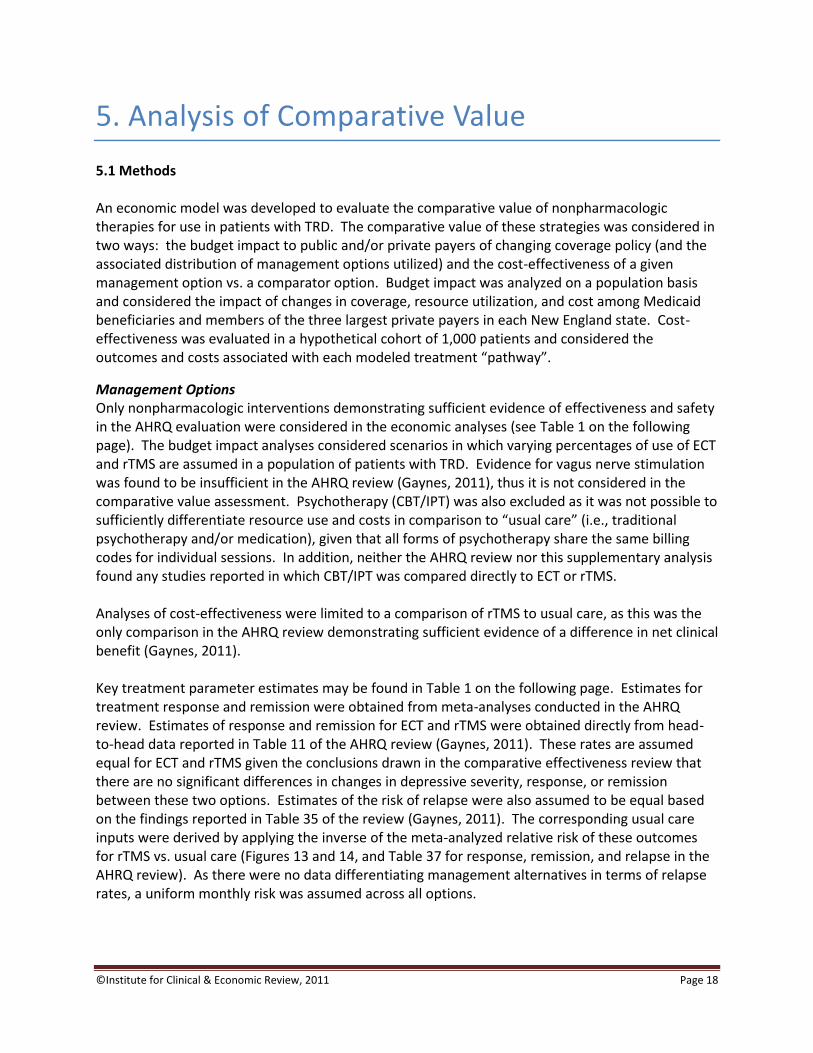
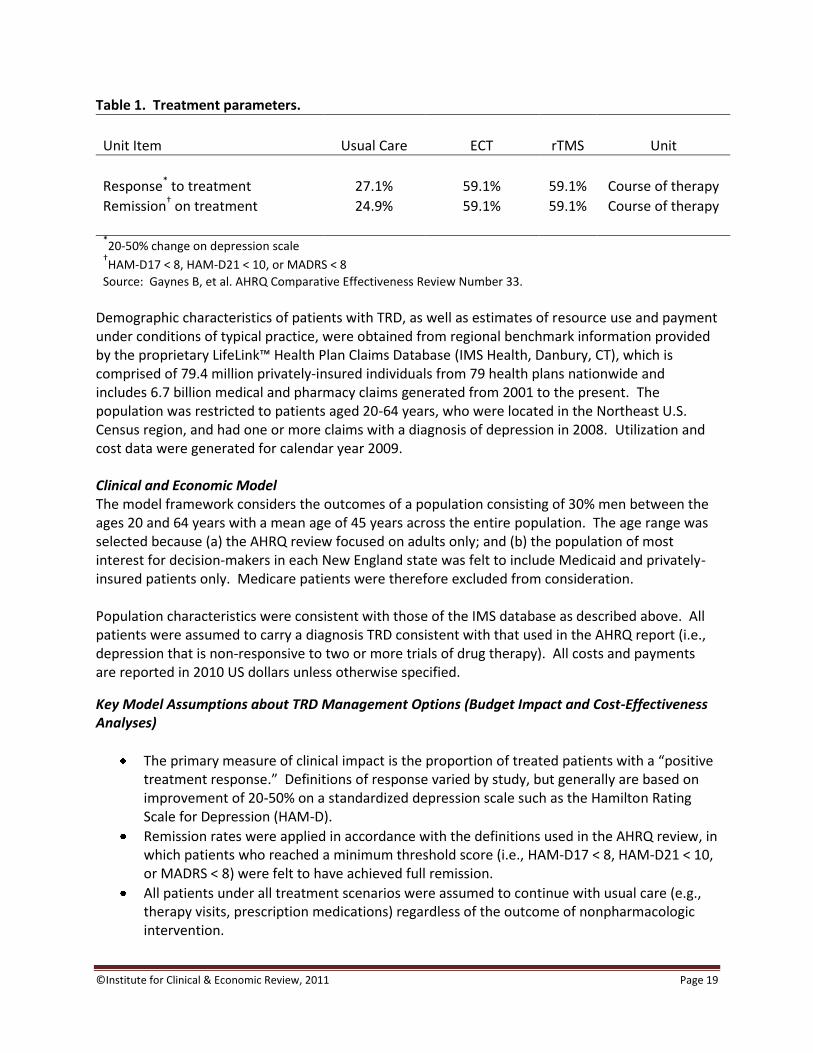
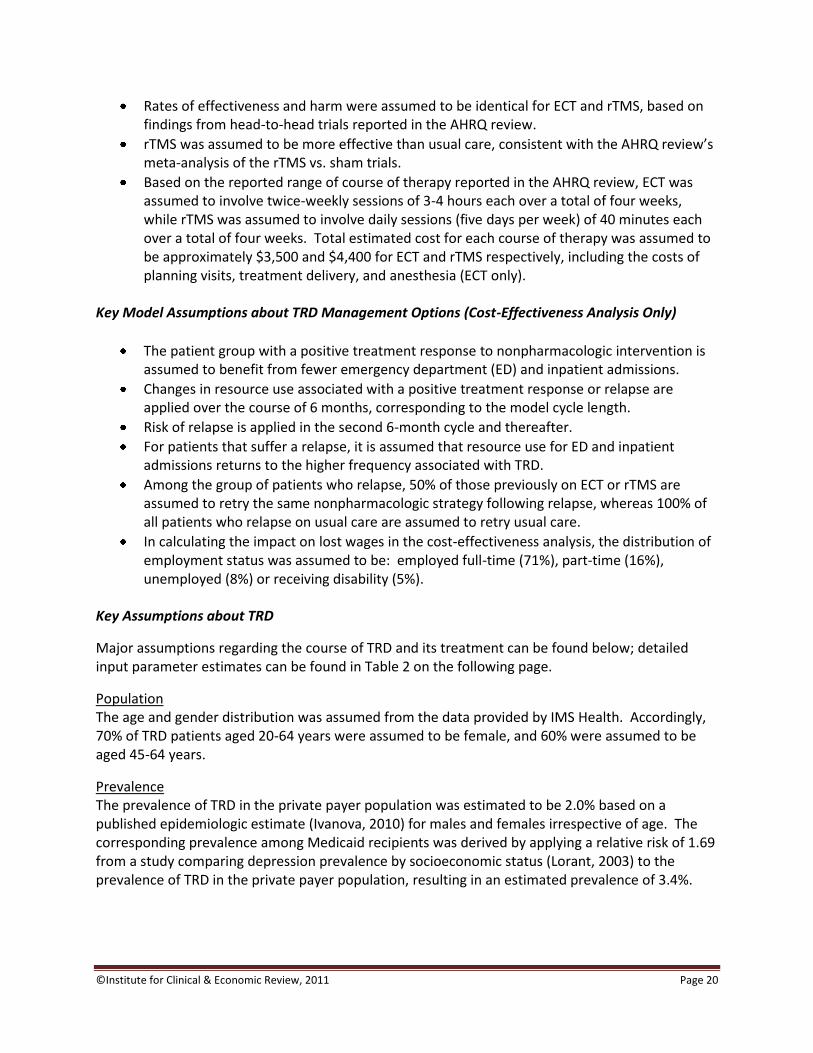
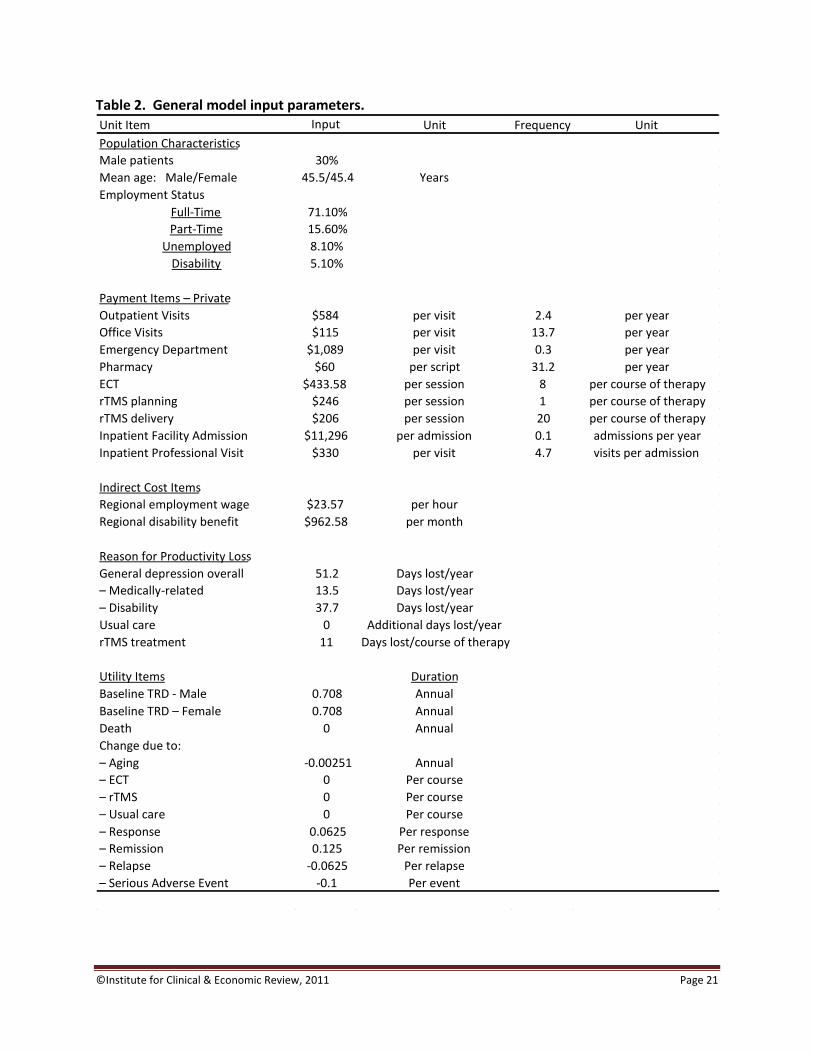
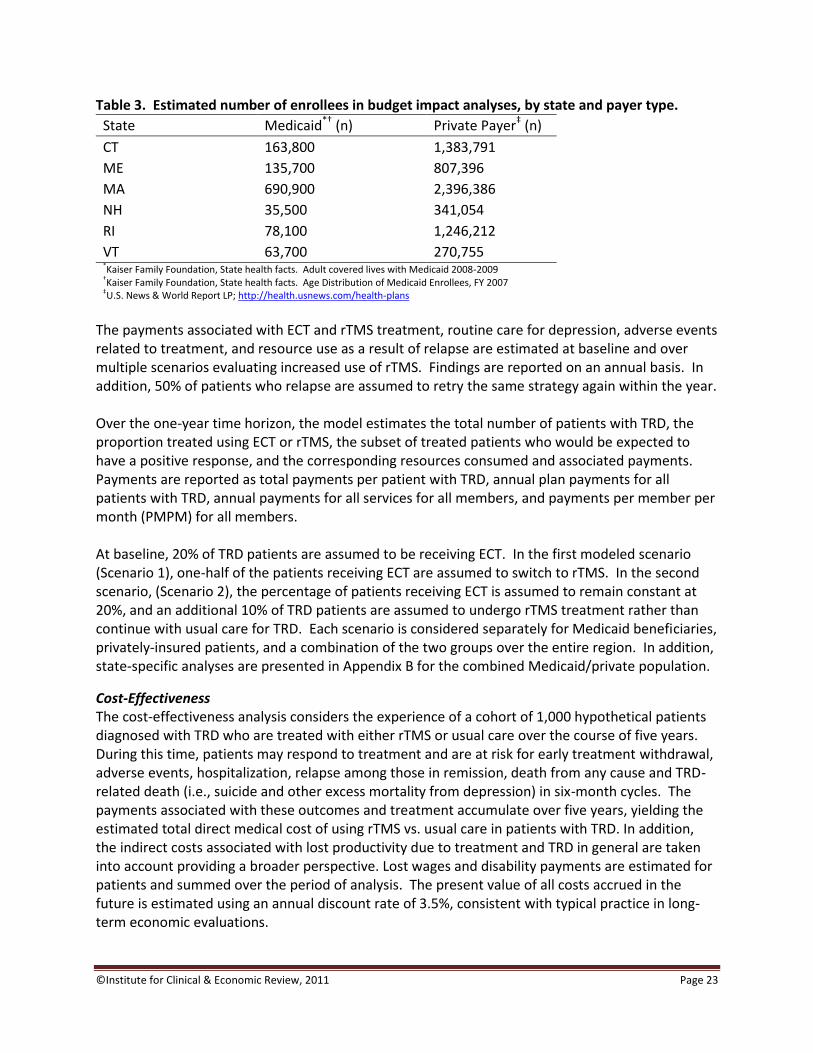
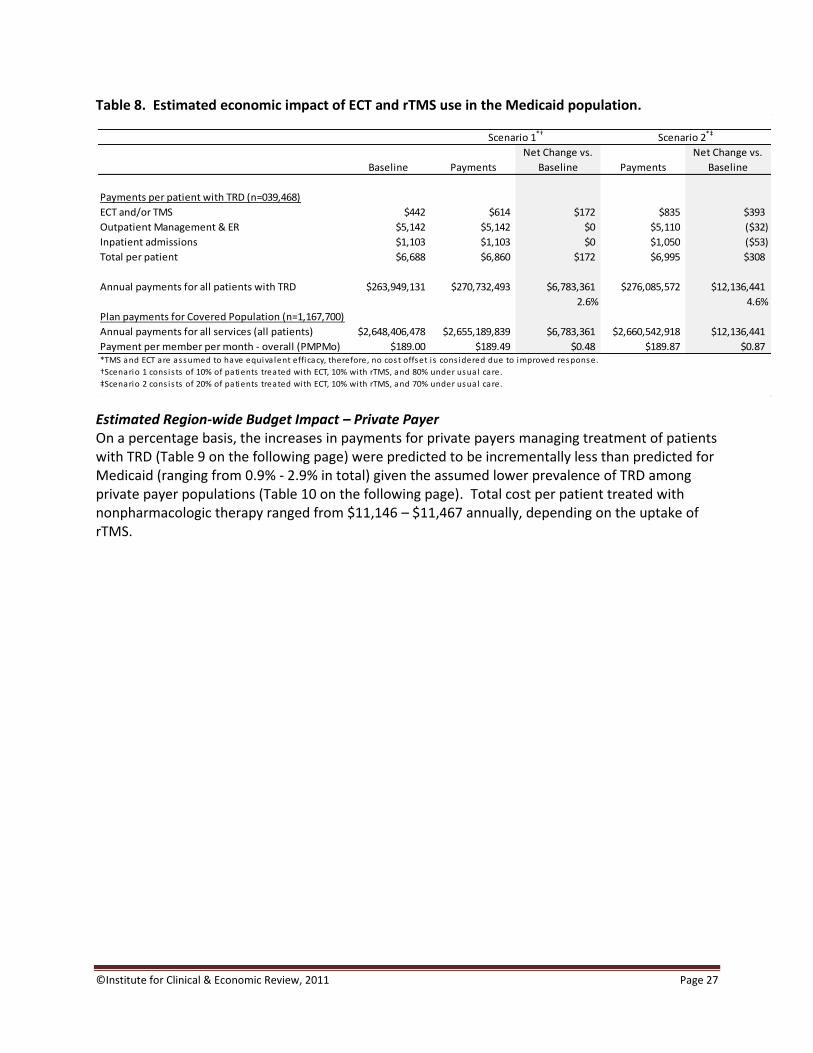
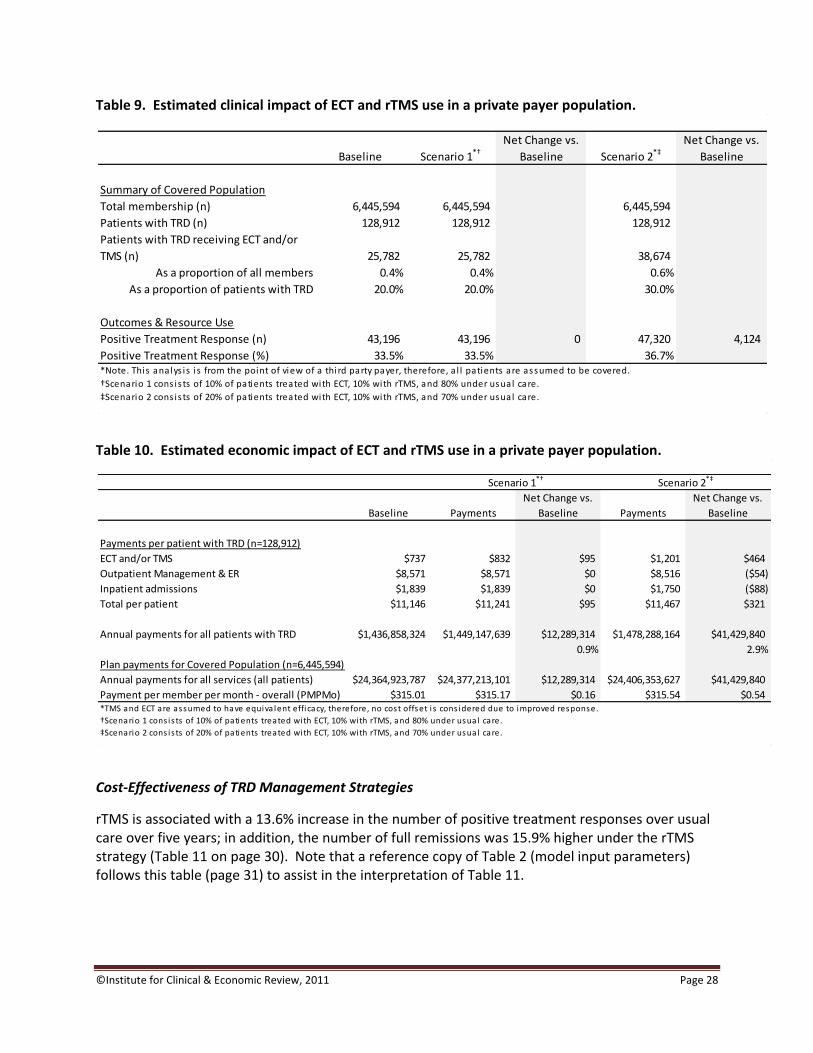
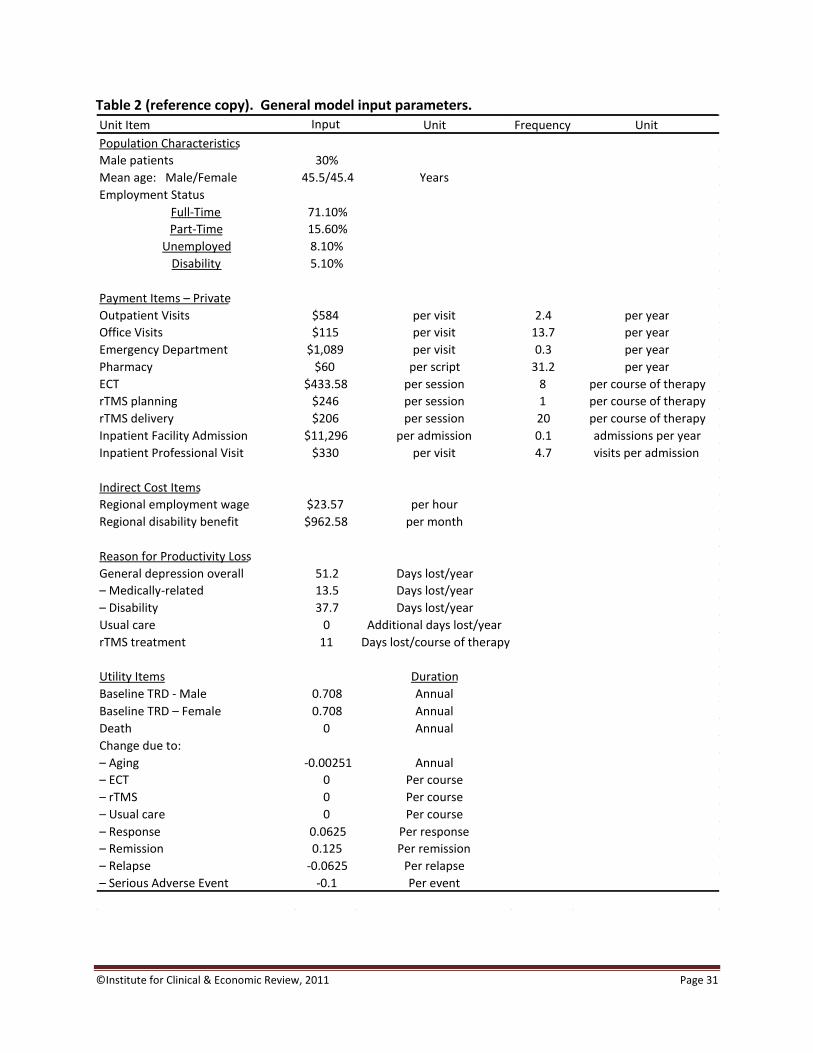
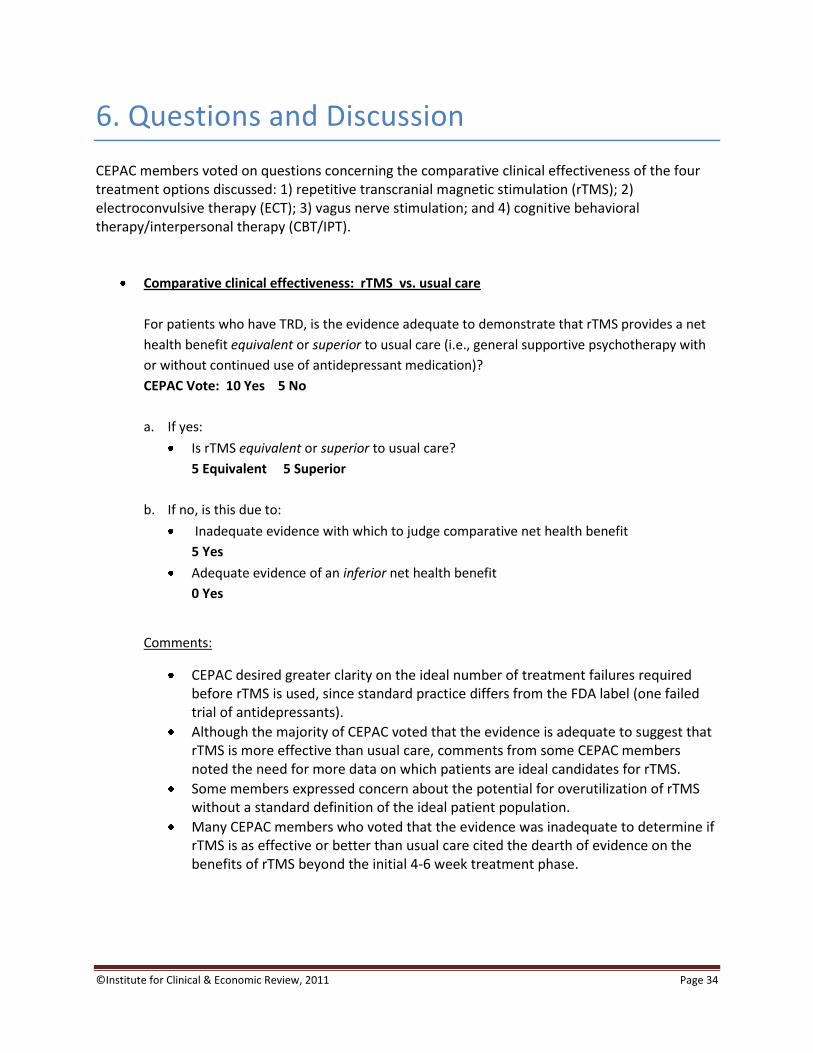
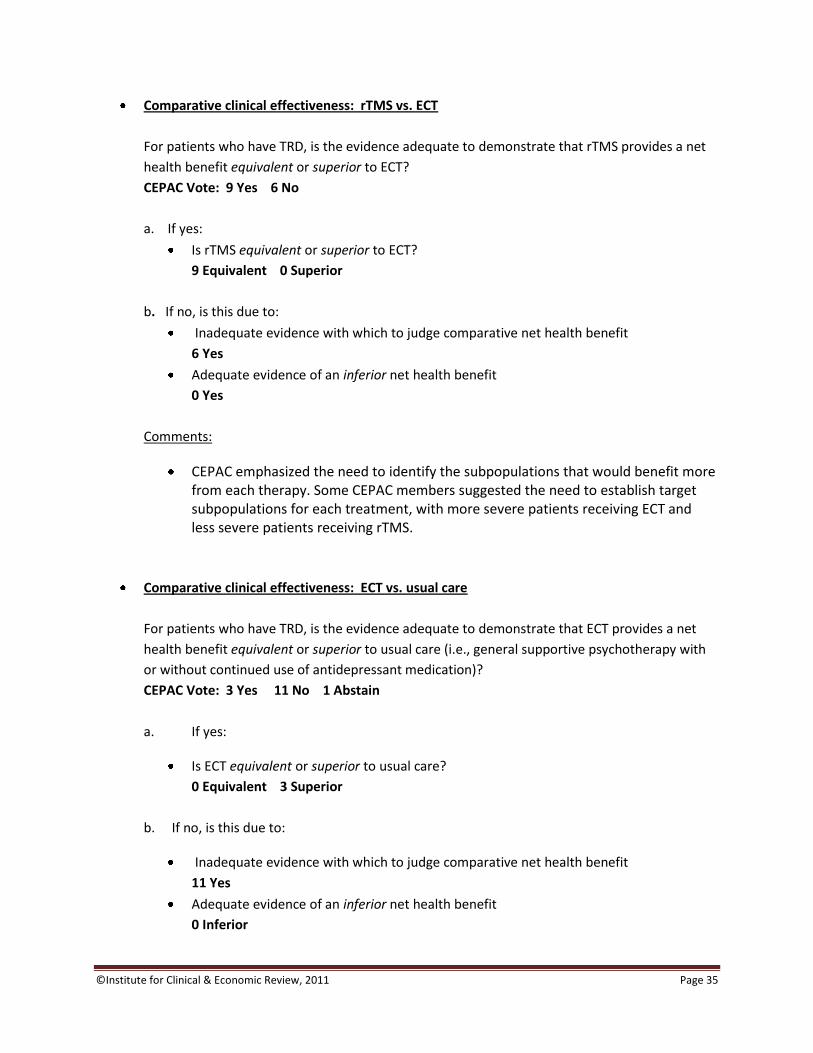
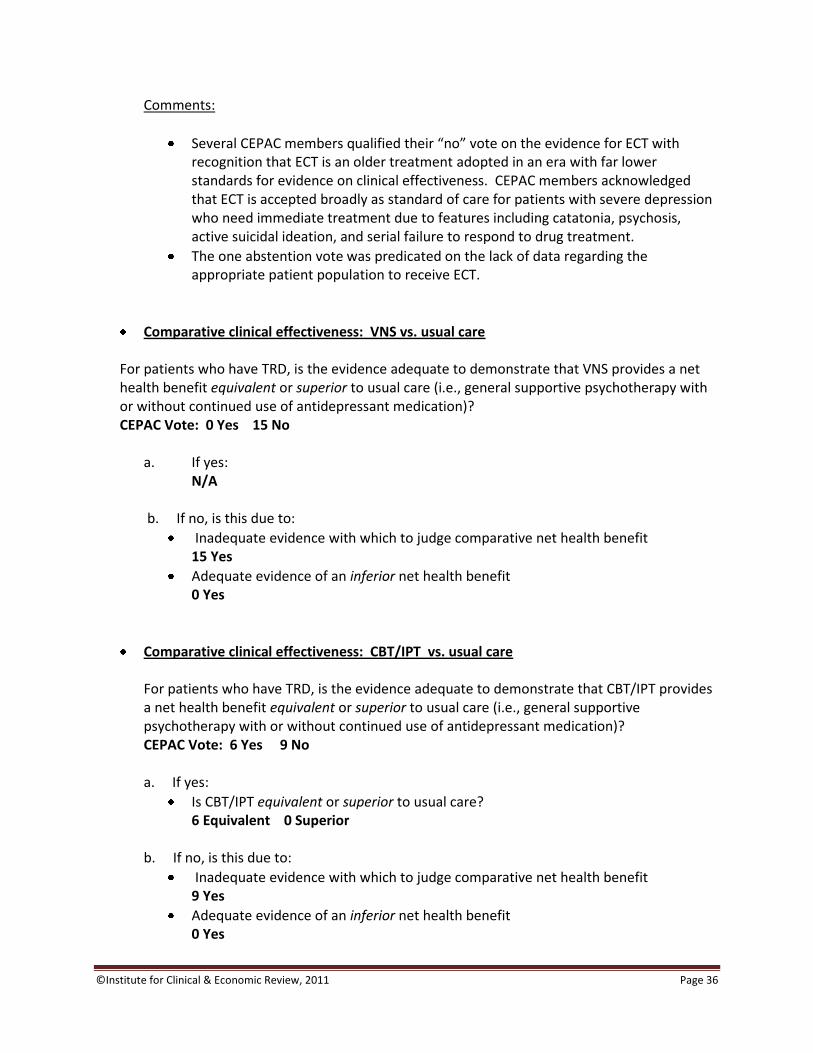
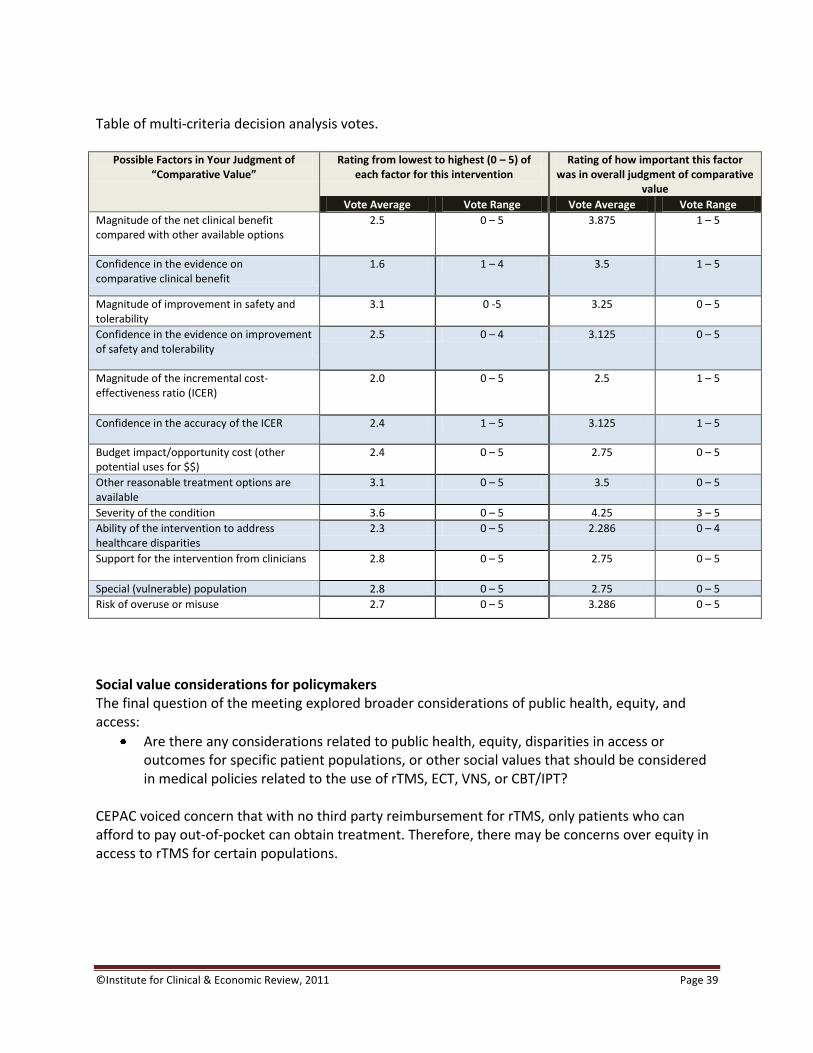
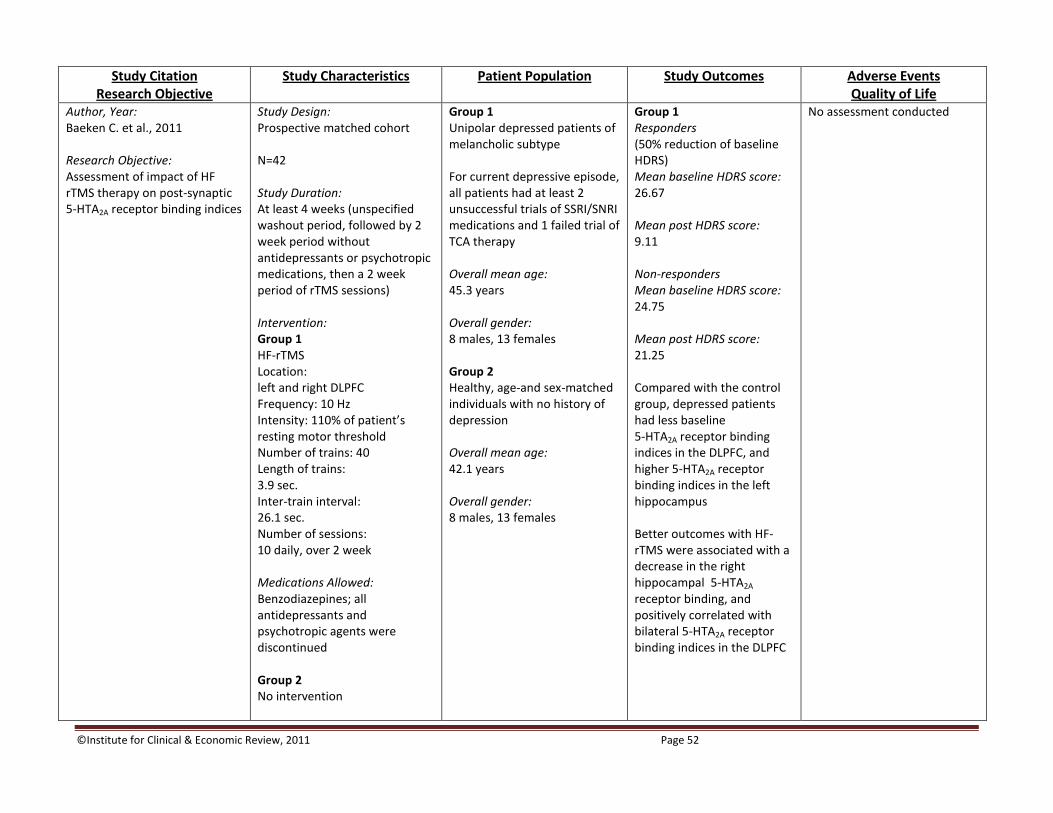
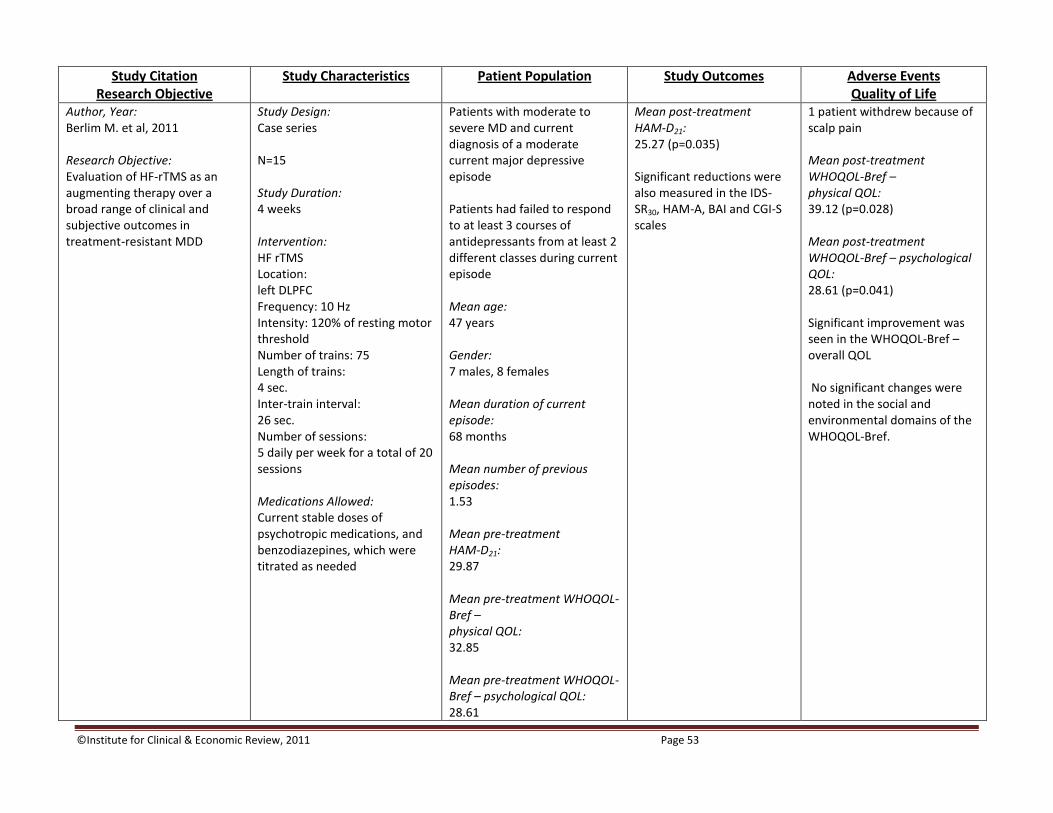
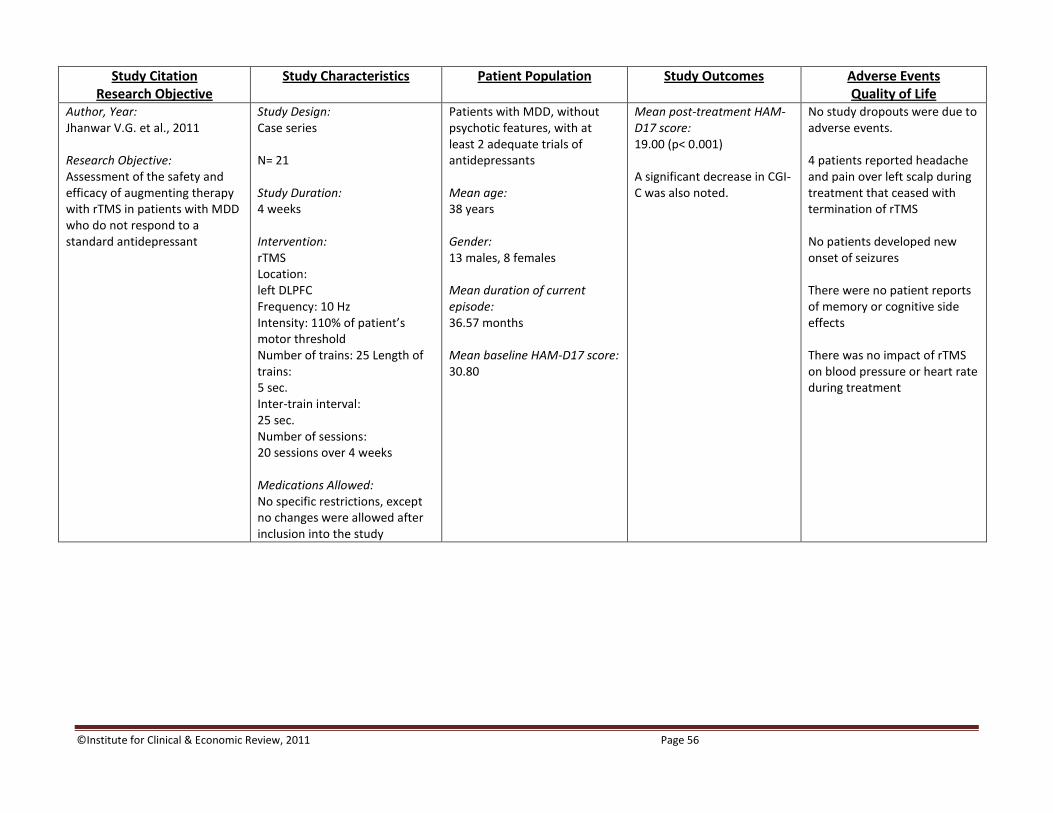
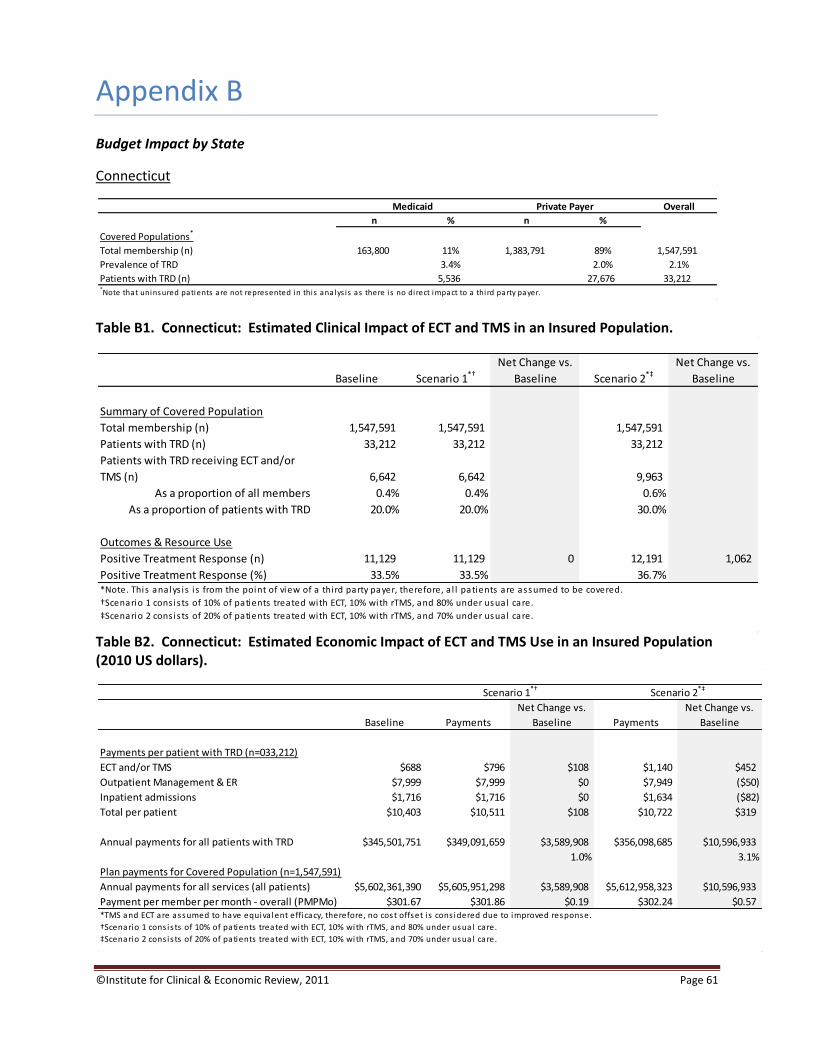
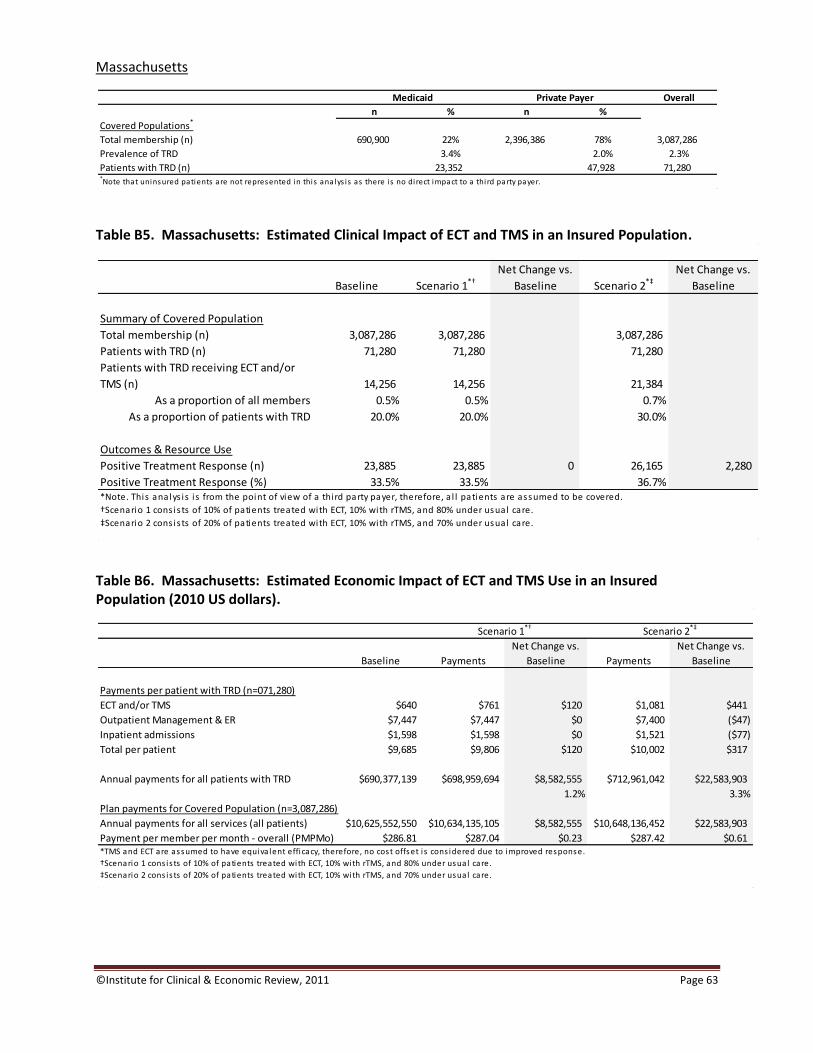
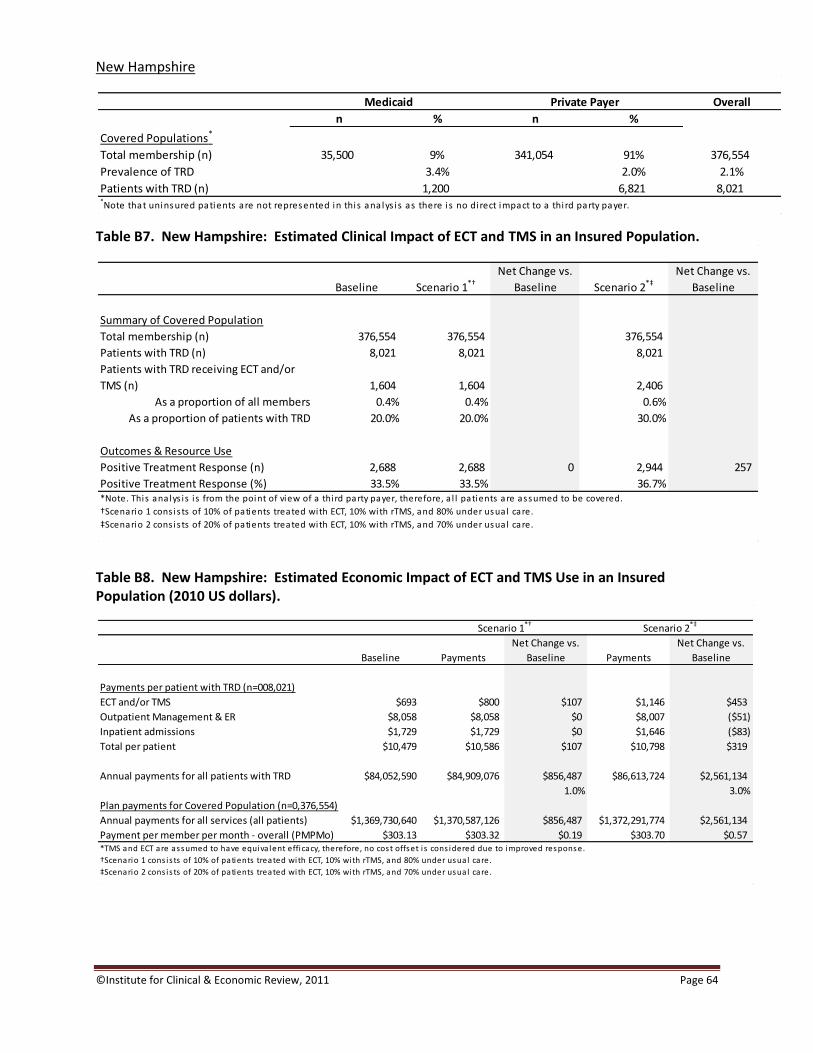
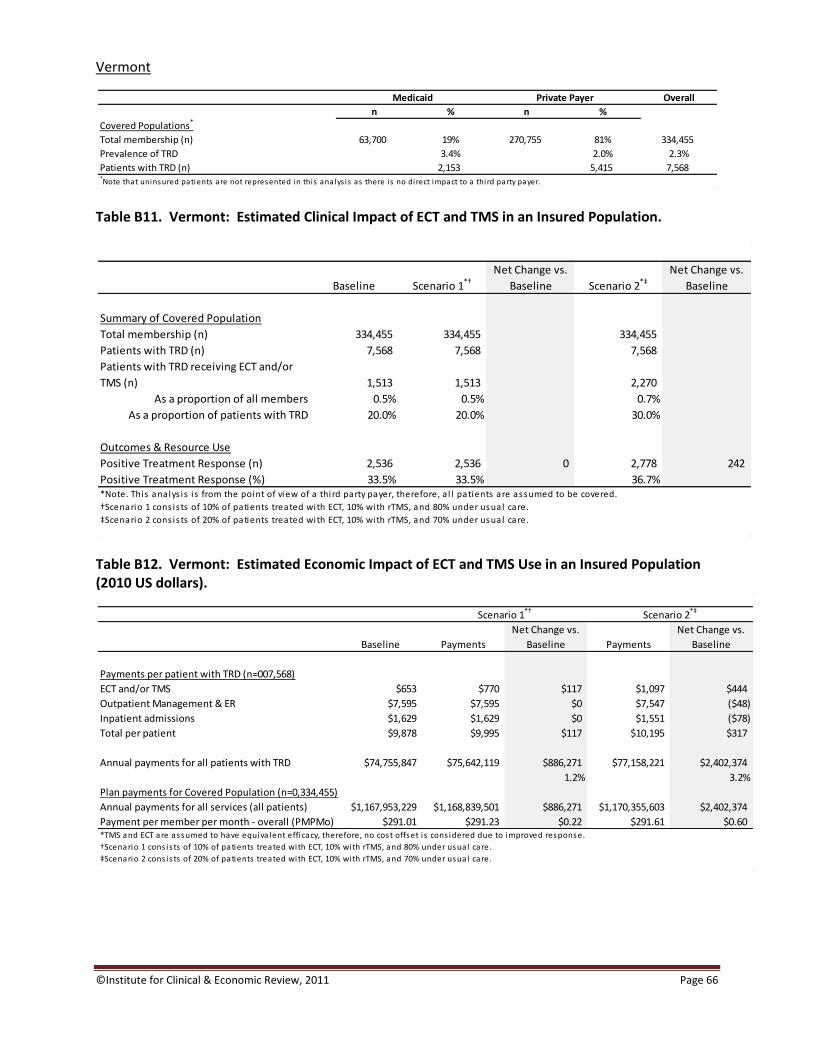