
Nonlinear response of a moored buoy - EPrints@IIT Delhi: … · A. Umar, T.K. Datta / Ocean...
22
Nonlinear response of a moored buoy A. Umar a -*, T.K. Datta b a Department of Civil Engineering, Aligarh Muslim University, Aligarh 202002, India b Department of Civil Engineering, Indian Institute of Technology, New Delhi 110016, India Received 3 January 2002; received in revised form 30 August 2002; accepted 23 October 2002 Abstract The nonlinear dynamic analysis of a multipoint slack moored buoy is performed under the action of first and second order wave forces. The nonlinearity of the system is caused by the geometric nonlinearity of the mooring lines. The resulting nonlinear equation of motion is solved by an incremental time marching scheme. The nonlinear responses of the system are analysed to investigate different kinds of dynamic instability phenomena that may arise due to the nonlinearity of the system. As an illustrative example, a hollow cylindrical buoy anch- ored to the sea bed by means of six slack mooring lines is considered. The responses of the system are obtained and analysed for three regular waves namely, 5 m/5 s, 12 m/10 s and 18 m/15 s. The results of the study show that different kinds of instability phenomena like nT subharmonic oscillations, symmetry breaking bifurcation and aperiodic responses may occur in slack mooring systems. Further, a second order wave force may considerably influence the dynamic stability of such systems. 1. Introduction Ocean mooring systems include both single and multi-point mooring systems. Multi-point mooring systems or spread mooring systems exhibit nonlinear behaviour because of inherent nonlinearities in the system. These nonlinearities are produced either due to damping nonlinearity or due to nonlinearity in the restoring force or due to the nonlinear excitation force or any combination of these. Amongst them, the nonlinearity of the restoring force generally leads to a complex response behaviour of the moored structure. The reason for the nonlinear restoring force is the geometric
Transcript of Nonlinear response of a moored buoy - EPrints@IIT Delhi: … · A. Umar, T.K. Datta / Ocean...
Nonlinear response of a moored buoy
A. Umara-*, T.K. Dattab
a Department of Civil Engineering, Aligarh Muslim University, Aligarh 202002, Indiab Department of Civil Engineering, Indian Institute of Technology, New Delhi 110016, India
Received 3 January 2002; received in revised form 30 August 2002; accepted 23 October 2002
Abstract
The nonlinear dynamic analysis of a multipoint slack moored buoy is performed under theaction of first and second order wave forces. The nonlinearity of the system is caused by thegeometric nonlinearity of the mooring lines. The resulting nonlinear equation of motion issolved by an incremental time marching scheme. The nonlinear responses of the system areanalysed to investigate different kinds of dynamic instability phenomena that may arise dueto the nonlinearity of the system. As an illustrative example, a hollow cylindrical buoy anch-ored to the sea bed by means of six slack mooring lines is considered. The responses of thesystem are obtained and analysed for three regular waves namely, 5 m/5 s, 12 m/10 s and 18m/15 s. The results of the study show that different kinds of instability phenomena like nTsubharmonic oscillations, symmetry breaking bifurcation and aperiodic responses may occurin slack mooring systems. Further, a second order wave force may considerably influence thedynamic stability of such systems.
1. Introduction
Ocean mooring systems include both single and multi-point mooring systems.Multi-point mooring systems or spread mooring systems exhibit nonlinear behaviourbecause of inherent nonlinearities in the system. These nonlinearities are producedeither due to damping nonlinearity or due to nonlinearity in the restoring force ordue to the nonlinear excitation force or any combination of these. Amongst them, thenonlinearity of the restoring force generally leads to a complex response behaviour ofthe moored structure. The reason for the nonlinear restoring force is the geometric

1626 A. Umar, T.K. Datta/Ocean Engineering 30 (2003) 1625-1646
nonlinearity or the catenary effect of the mooring lines. As the moored vesselundergoes large excitation due to a combination of wave, wind and current, someof the mooring lines slacken and others become taut, thus providing a net nonlinearrestoring force to the vessel.
Moored structures are generally classified under flexible offshore structures. Therehave been several studies on the nonlinear response behaviour of flexible offshorestructures such as guyed tower platforms (Morrison, 1983; Jain and Datta, 1990;Glasscock and Finn, 1984; Brynjolfsson and Leonard, 1988); tension leg platforms(Kim and Yue, 1988; Kobsyashi et al., 1985; Siddiqui and Ahmad, 1998); and articu-lated leg platforms (Jain and Datta, 1991; Bar-Avi and Benaroya, 1996). Apart frompresenting different methods of analysis for the structures, the studies also providea good understanding of the nonlinear response behaviour of the structures.
Relatively, few studies have been carried out on the nonlinear analysis of mooredvessels. Pinkster (1987) Umar and Datta (2001) presented a simple time-domainsimulation method for estimating the low frequency surge motions of moored vessels.Bliek and Triantafyllou (1985) studied the dynamics of a mooring line in the non-linear regime. They, in particular, investigated the effect of non-linearities on thedynamic tension amplification predicted by linear theory. Van Den Boom (1985)studied the dynamic behaviour of mooring lines. The dynamic tension amplificationwas found to be strongly influenced by non-linearities due to catenary effects, elas-ticity and drag. Langley (1986) studied the time domain simulation of the secondorder motions of a moored vessel when the random sea state is represented by super-position of "n" harmonic components. Liu and Bergdahl (1997) introduced a linear,frequency-domain method for dynamic analysis to calculate large motions of slenderstructures such as towing and mooring cables and flexible risers. Although the abovestudies provide a good understanding of the nonlinear behaviour of moored vesselsunder different conditions of excitations, there are certain areas where more workis needed. One such area is the dynamic stability of the moored vessel under primarywave force, second order wave force, and combined primary and second orderwave forces.
Herein, the nonlinear response behaviour of a multipoint moored buoy under theaction of both first order and second order wave forces is analysed to investigate itsdynamic stability. The buoy is a large diameter cylindrical floating body, mooredby an array of symmetrical moorings system. The force excursion relationship ofthe mooring cables provides the non-linear restoring force for the moored buoy. Bothfirst and second order wave forces on the cylinder have been determined by themethod proposed by Taylor and Hung (1987). In the response calculation, the effectsof added mass and hydrodynamic damping are duly considered. The responses areobtained in the time domain by integrating the nonlinear equation of motion by anincremental time marching scheme.
2. Dynamic analysis
The dynamic analysis has been carried out under the following assumptions:
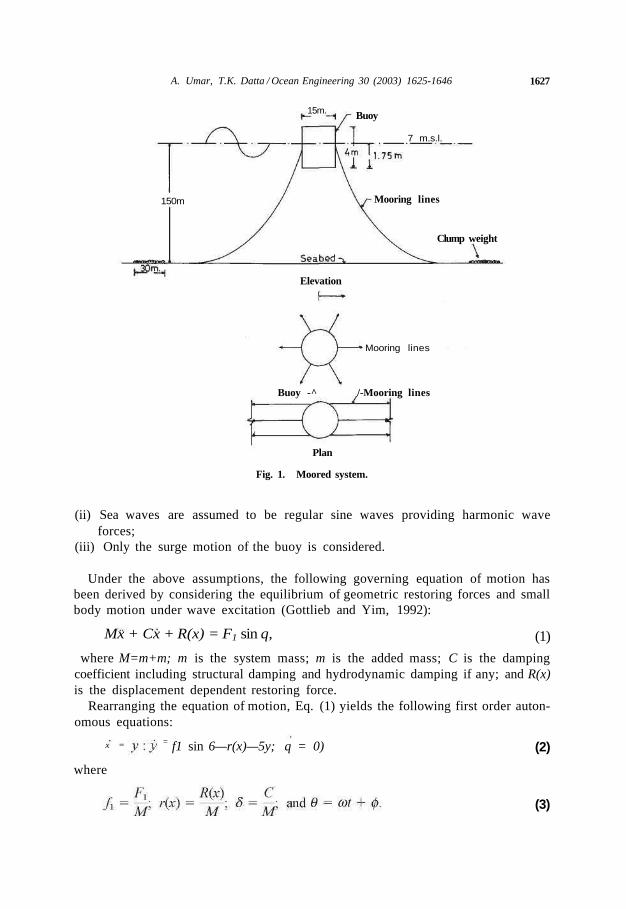
(i) The mooring system is a single degree of freedom nonlinear oscillator (Fig. 1);
A. Umar, T.K. Datta / Ocean Engineering 30 (2003) 1625-1646 1627
15m. Buoy
7 m.s.l.
150m Mooring lines
Clump weight
Elevation
Mooring lines
Buoy -^ /-Mooring lines
Plan
Fig. 1. Moored system.
(ii) Sea waves are assumed to be regular sine waves providing harmonic waveforces;
(iii) Only the surge motion of the buoy is considered.
Under the above assumptions, the following governing equation of motion hasbeen derived by considering the equilibrium of geometric restoring forces and smallbody motion under wave excitation (Gottlieb and Yim, 1992):
Mx + Cx + R(x) = F1 sin q, (1)
where M=m+m; m is the system mass; m is the added mass; C is the dampingcoefficient including structural damping and hydrodynamic damping if any; and R(x)is the displacement dependent restoring force.
Rearranging the equation of motion, Eq. (1) yields the following first order auton-omous equations:
x = = f1 sin 6—r(x)—5y; q = 0) (2)
where
(3)
1628 A. Umar, T.K. Datta / Ocean Engineering 30 (2003) 1625-1646
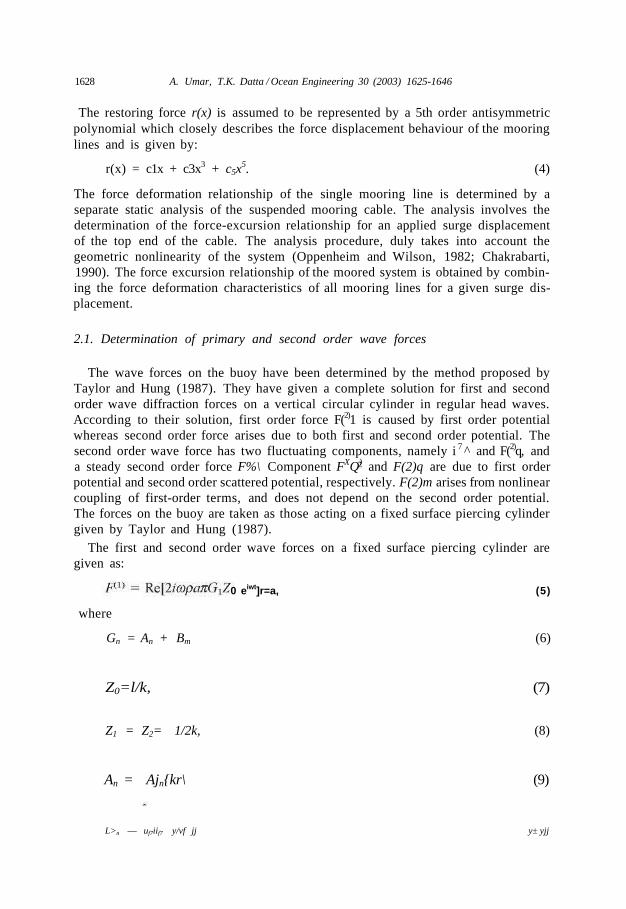
The restoring force r(x) is assumed to be represented by a 5th order antisymmetricpolynomial which closely describes the force displacement behaviour of the mooringlines and is given by:
r(x) = c1x + c3x3 + c5x5. (4)
The force deformation relationship of the single mooring line is determined by aseparate static analysis of the suspended mooring cable. The analysis involves thedetermination of the force-excursion relationship for an applied surge displacementof the top end of the cable. The analysis procedure, duly takes into account thegeometric nonlinearity of the system (Oppenheim and Wilson, 1982; Chakrabarti,1990). The force excursion relationship of the moored system is obtained by combin-ing the force deformation characteristics of all mooring lines for a given surge dis-placement.
2.1. Determination of primary and second order wave forces
The wave forces on the buoy have been determined by the method proposed byTaylor and Hung (1987). They have given a complete solution for first and secondorder wave diffraction forces on a vertical circular cylinder in regular head waves.According to their solution, first order force F(2)1 is caused by first order potentialwhereas second order force arises due to both first and second order potential. Thesecond order wave force has two fluctuating components, namely i 7 ^ and F(2)q, anda steady second order force F%\ Component FXQ) and F(2)q are due to first orderpotential and second order scattered potential, respectively. F(2)m arises from nonlinearcoupling of first-order terms, and does not depend on the second order potential.The forces on the buoy are taken as those acting on a fixed surface piercing cylindergiven by Taylor and Hung (1987).
The first and second order wave forces on a fixed surface piercing cylinder aregiven as:
0 eiwt]r=a, (5)
where
Gn = An + Bm (6)
Z0=l/k, (7)
Z1 = Z2= 1/2k, (8)
An = Ajn{kr\ (9)
L>n — uf7iif7 y/vf jj y± yjj
A. Umar, T.K. Datta/Ocean Engineering 30 (2003) 1625-1646 1629
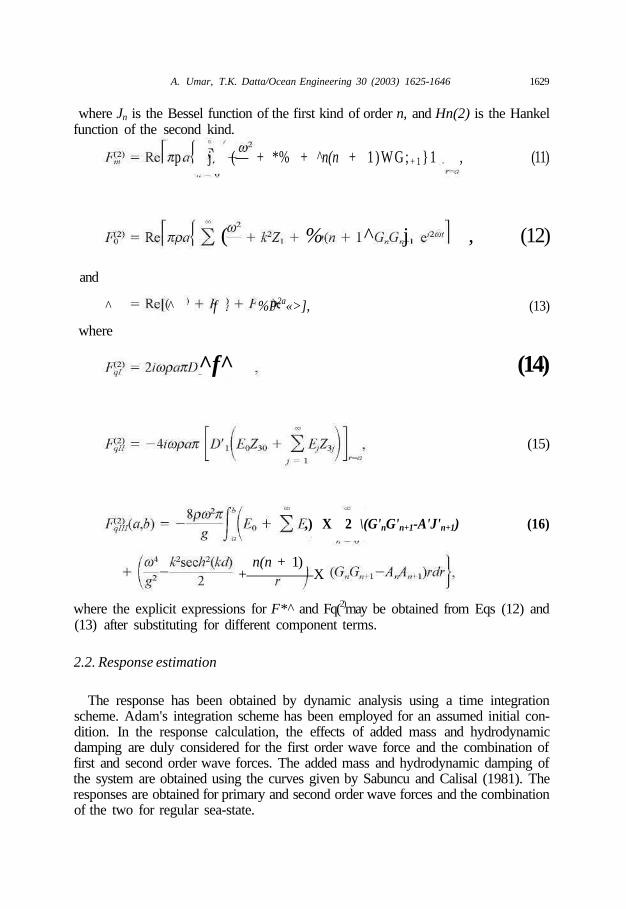
where Jn is the Bessel function of the first kind of order n, and Hn(2) is the Hankelfunction of the second kind.
p j (— + *% + ^n(n + 1 ) W G ; + 1 } 1 , (11)
( % ^ j , (12)
and
^ ^ f %P2a«>], (13)
where
^f^ (14)
(15)
,) X 2 \(G'nG'n+1-A'J'n+1) (16)
n(n + 1)+ X
where the explicit expressions for F*^ and Fq(2)may be obtained from Eqs (12) and(13) after substituting for different component terms.
2.2. Response estimation
The response has been obtained by dynamic analysis using a time integrationscheme. Adam's integration scheme has been employed for an assumed initial con-dition. In the response calculation, the effects of added mass and hydrodynamicdamping are duly considered for the first order wave force and the combination offirst and second order wave forces. The added mass and hydrodynamic damping ofthe system are obtained using the curves given by Sabuncu and Calisal (1981). Theresponses are obtained for primary and second order wave forces and the combinationof the two for regular sea-state.
1630 A. Umar, T.K. Datta / Ocean Engineering 30 (2003) 1625-1646
Table 1Numerical data used for the analysis
Buoy (diameterxheightxthickness)Submerged depth of the buoyMass of the buoyNo. of mooring linesTotal length of each mooring lineMass of the mooring line in waterYoung's modulus of the mooring linesClamp length of the cableMass of the clamp in waterDepth of seaSpecific gravity of concreteInitial angle of inclinationInitial horizontal tensionStructural damping
15 mx4 mx0.3 m1.75 m133002.01 kg6500 m21 kg/m20.595xl09 N/m2
30 m90 kg/m150 m2.460°19000 N3.25%
3. Numerical study and discussion of results
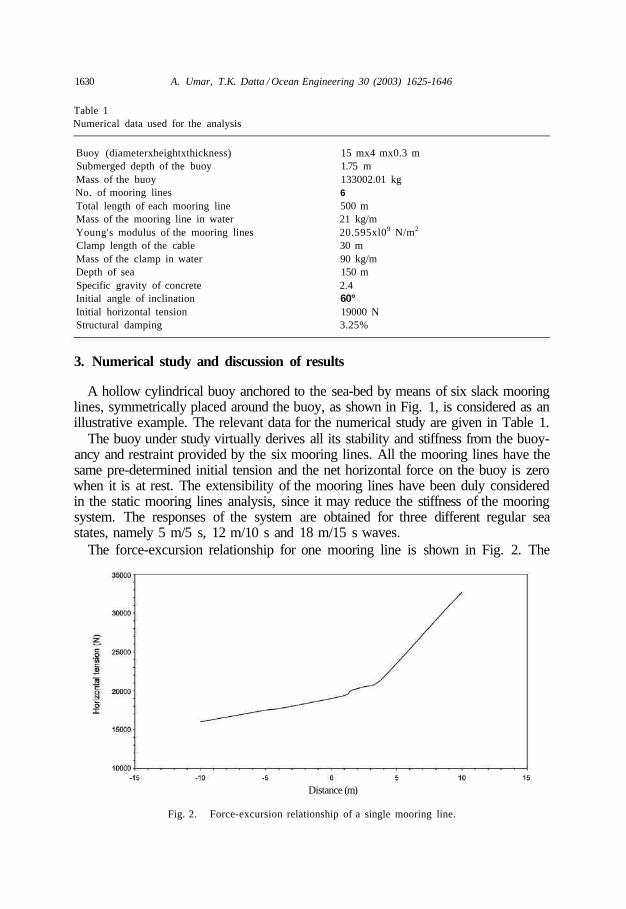
A hollow cylindrical buoy anchored to the sea-bed by means of six slack mooringlines, symmetrically placed around the buoy, as shown in Fig. 1, is considered as anillustrative example. The relevant data for the numerical study are given in Table 1.
The buoy under study virtually derives all its stability and stiffness from the buoy-ancy and restraint provided by the six mooring lines. All the mooring lines have thesame pre-determined initial tension and the net horizontal force on the buoy is zerowhen it is at rest. The extensibility of the mooring lines have been duly consideredin the static mooring lines analysis, since it may reduce the stiffness of the mooringsystem. The responses of the system are obtained for three different regular seastates, namely 5 m/5 s, 12 m/10 s and 18 m/15 s waves.
The force-excursion relationship for one mooring line is shown in Fig. 2. The
Distance (m)
Fig. 2. Force-excursion relationship of a single mooring line.
A. Umar, T.K. Datta / Ocean Engineering 30 (2003) 1625-1646 1631
- 3 - 2 - 1 0 1 2
excursion (m)
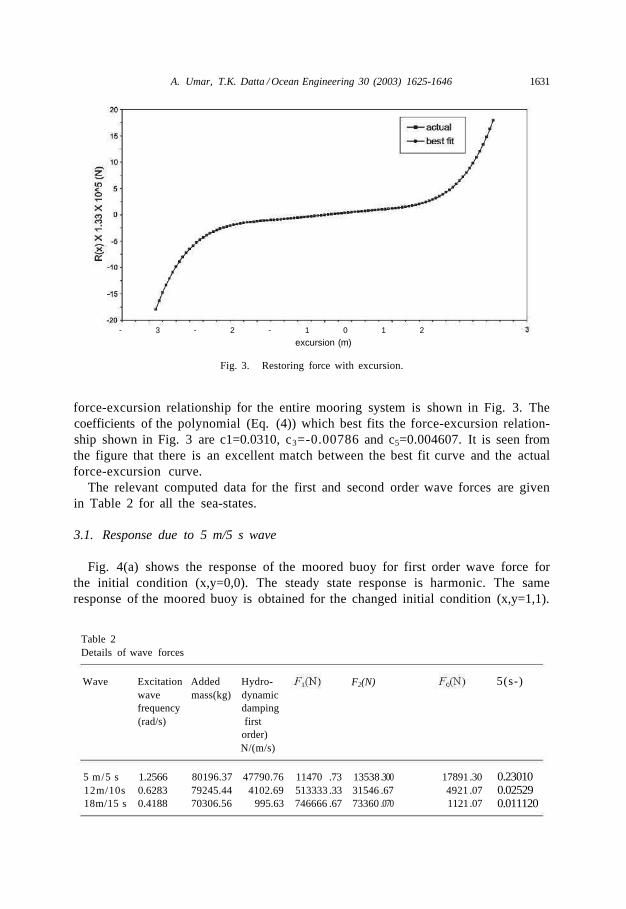
Fig. 3. Restoring force with excursion.
force-excursion relationship for the entire mooring system is shown in Fig. 3. Thecoefficients of the polynomial (Eq. (4)) which best fits the force-excursion relation-ship shown in Fig. 3 are c1=0.0310, c3=-0.00786 and c5=0.004607. It is seen fromthe figure that there is an excellent match between the best fit curve and the actualforce-excursion curve.
The relevant computed data for the first and second order wave forces are givenin Table 2 for all the sea-states.
3.1. Response due to 5 m/5 s wave
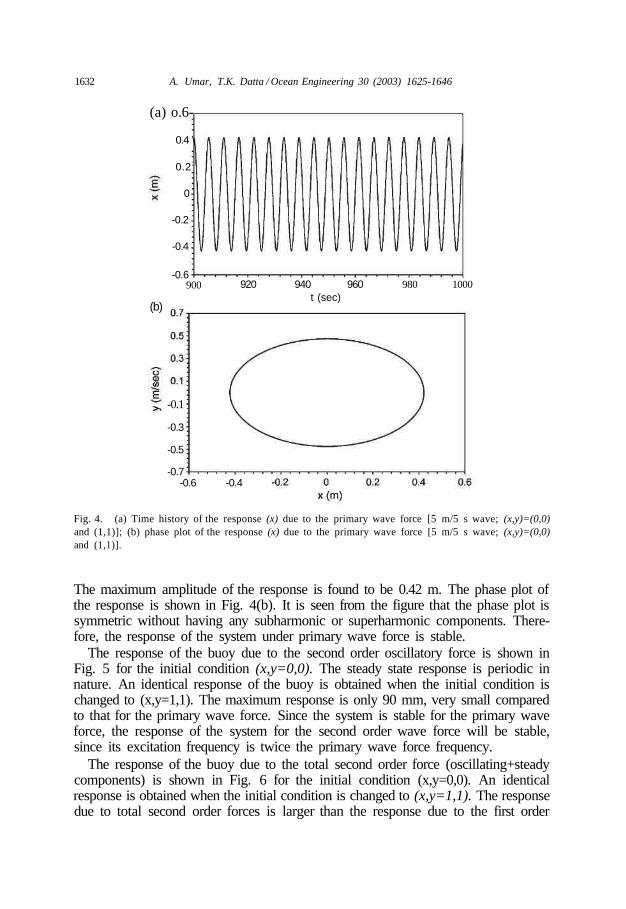
Fig. 4(a) shows the response of the moored buoy for first order wave force forthe initial condition (x,y=0,0). The steady state response is harmonic. The sameresponse of the moored buoy is obtained for the changed initial condition (x,y=1,1).
Table 2Details of wave forces
Wave
5 m/5 s12m/10s18m/15 s
Excitationwavefrequency(rad/s)
1.25660.62830.4188
Addedmass(kg)
80196.3779245.4470306.56
Hydro-dynamicdampingfirst
order)N/(m/s)
47790.764102.69
995.63
11470513333746666
.73
.33
.67
F2(N)
135383154673360
.300
.67
.070
1789149211121
.30
.07
.07
5(s-)
0.230100.025290.011120
1632 A. Umar, T.K. Datta / Ocean Engineering 30 (2003) 1625-1646
(a) o.6-
0.4 \
0.2;
0
-0.2
-0.4
-0.6900
(b)
-0.1
-0.3
-0.5
-0.7-0.6
920 940 960t (sec)
980 1000
-0.4
Fig. 4. (a) Time history of the response (x) due to the primary wave force [5 m/5 s wave; (x,y)=(0,0)and (1,1)]; (b) phase plot of the response (x) due to the primary wave force [5 m/5 s wave; (x,y)=(0,0)and (1,1)].
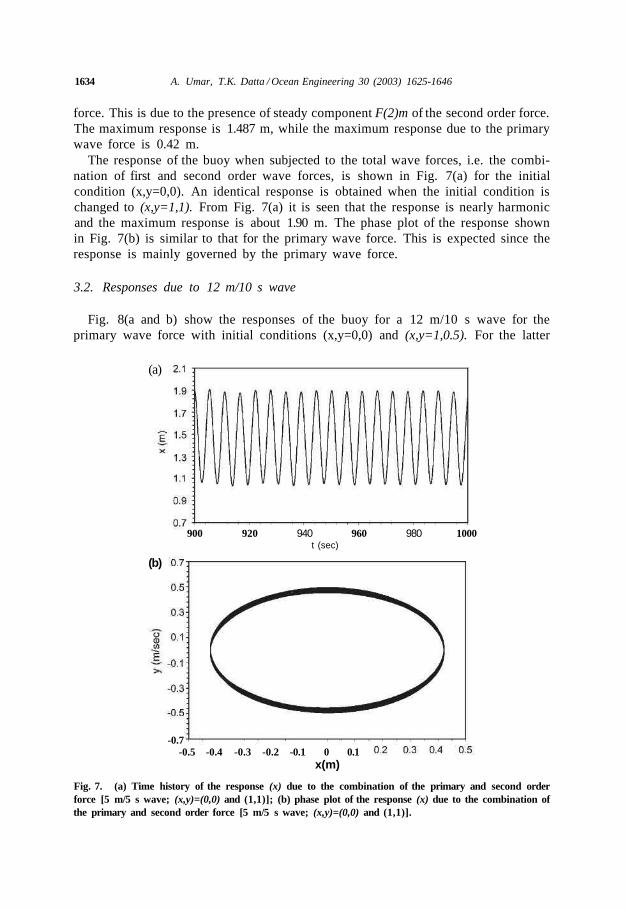
The maximum amplitude of the response is found to be 0.42 m. The phase plot ofthe response is shown in Fig. 4(b). It is seen from the figure that the phase plot issymmetric without having any subharmonic or superharmonic components. There-fore, the response of the system under primary wave force is stable.
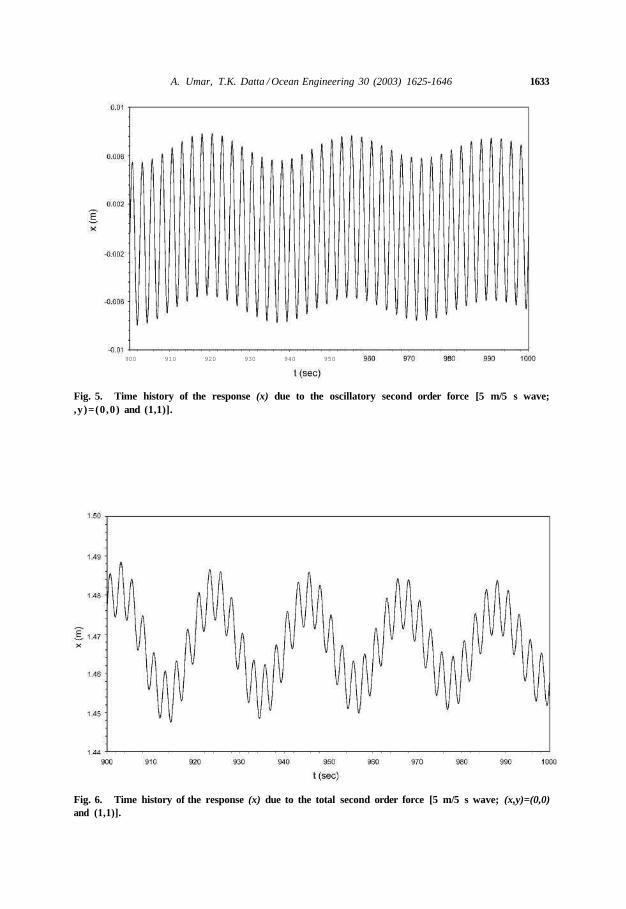
The response of the buoy due to the second order oscillatory force is shown inFig. 5 for the initial condition (x,y=0,0). The steady state response is periodic innature. An identical response of the buoy is obtained when the initial condition ischanged to (x,y=1,1). The maximum response is only 90 mm, very small comparedto that for the primary wave force. Since the system is stable for the primary waveforce, the response of the system for the second order wave force will be stable,since its excitation frequency is twice the primary wave force frequency.
The response of the buoy due to the total second order force (oscillating+steadycomponents) is shown in Fig. 6 for the initial condition (x,y=0,0). An identicalresponse is obtained when the initial condition is changed to (x,y=1,1). The responsedue to total second order forces is larger than the response due to the first order
A. Umar, T.K. Datta / Ocean Engineering 30 (2003) 1625-1646 1633
900 910 920 930 940 950
Fig. 5. Time history of the response (x) due to the oscillatory second order force [5 m/5 s wave;,y)=(0,0) and (1,1)].
Fig. 6. Time history of the response (x) due to the total second order force [5 m/5 s wave; (x,y)=(0,0)and (1,1)].
1634 A. Umar, T.K. Datta / Ocean Engineering 30 (2003) 1625-1646
force. This is due to the presence of steady component F(2)m of the second order force.The maximum response is 1.487 m, while the maximum response due to the primarywave force is 0.42 m.
The response of the buoy when subjected to the total wave forces, i.e. the combi-nation of first and second order wave forces, is shown in Fig. 7(a) for the initialcondition (x,y=0,0). An identical response is obtained when the initial condition ischanged to (x,y=1,1). From Fig. 7(a) it is seen that the response is nearly harmonicand the maximum response is about 1.90 m. The phase plot of the response shownin Fig. 7(b) is similar to that for the primary wave force. This is expected since theresponse is mainly governed by the primary wave force.
3.2. Responses due to 12 m/10 s wave
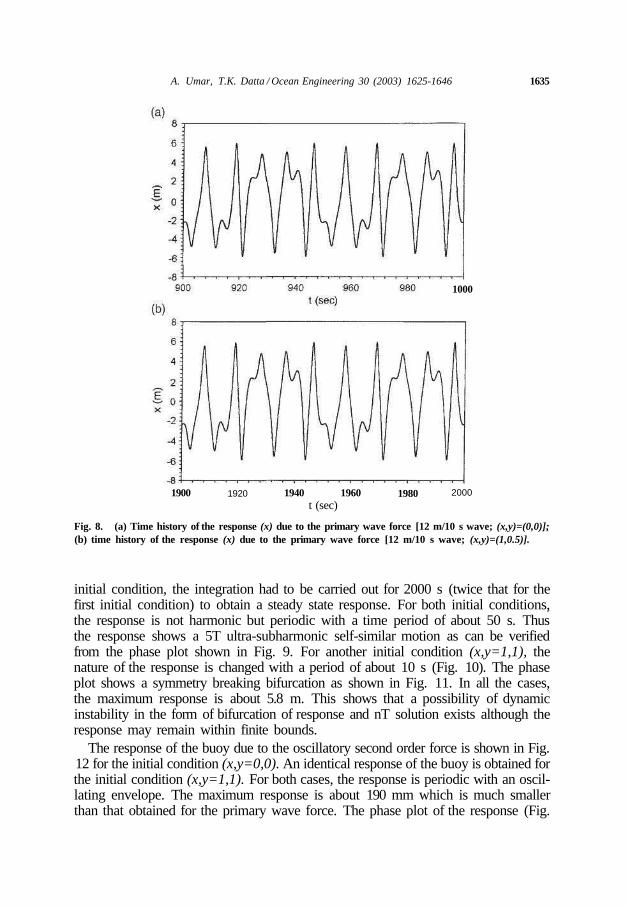
Fig. 8(a and b) show the responses of the buoy for a 12 m/10 s wave for theprimary wave force with initial conditions (x,y=0,0) and (x,y=1,0.5). For the latter
(a)
900
(b)
920 940 960 980 1000t (sec)
-0.7-0.5 -0.4 -0.3 -0.2 -0.1 0 0.1
x(m)
Fig. 7. (a) Time history of the response (x) due to the combination of the primary and second orderforce [5 m/5 s wave; (x,y)=(0,0) and (1,1)]; (b) phase plot of the response (x) due to the combination ofthe primary and second order force [5 m/5 s wave; (x,y)=(0,0) and (1,1)].
A. Umar, T.K. Datta / Ocean Engineering 30 (2003) 1625-1646 1635
1900
1000
1920 1940 1960t (sec)
1980 2000
Fig. 8. (a) Time history of the response (x) due to the primary wave force [12 m/10 s wave; (x,y)=(0,0)];(b) time history of the response (x) due to the primary wave force [12 m/10 s wave; (x,y)=(1,0.5)].
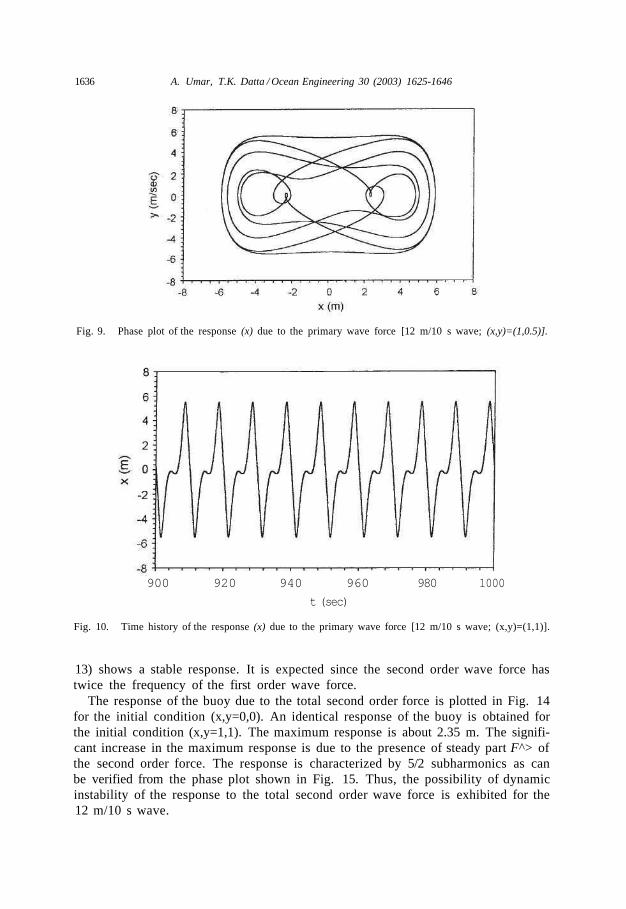
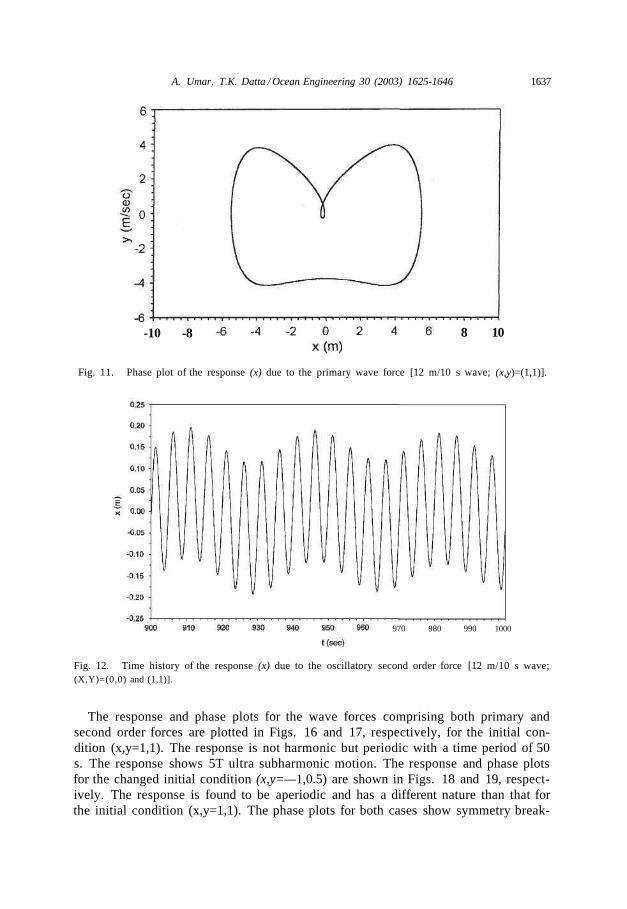
initial condition, the integration had to be carried out for 2000 s (twice that for thefirst initial condition) to obtain a steady state response. For both initial conditions,the response is not harmonic but periodic with a time period of about 50 s. Thusthe response shows a 5T ultra-subharmonic self-similar motion as can be verifiedfrom the phase plot shown in Fig. 9. For another initial condition (x,y=1,1), thenature of the response is changed with a period of about 10 s (Fig. 10). The phaseplot shows a symmetry breaking bifurcation as shown in Fig. 11. In all the cases,the maximum response is about 5.8 m. This shows that a possibility of dynamicinstability in the form of bifurcation of response and nT solution exists although theresponse may remain within finite bounds.
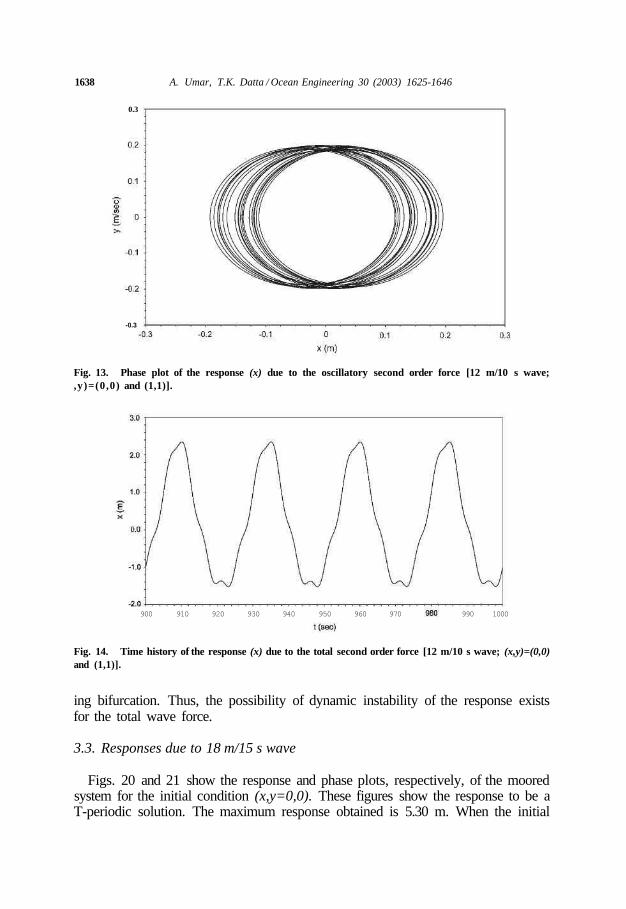
The response of the buoy due to the oscillatory second order force is shown in Fig.12 for the initial condition (x,y=0,0). An identical response of the buoy is obtained forthe initial condition (x,y=1,1). For both cases, the response is periodic with an oscil-lating envelope. The maximum response is about 190 mm which is much smallerthan that obtained for the primary wave force. The phase plot of the response (Fig.
1636 A. Umar, T.K. Datta / Ocean Engineering 30 (2003) 1625-1646
Fig. 9. Phase plot of the response (x) due to the primary wave force [12 m/10 s wave; (x,y)=(1,0.5)].
900 920 940 960
t (sec)
980 1000
Fig. 10. Time history of the response (x) due to the primary wave force [12 m/10 s wave; (x,y)=(1,1)].
13) shows a stable response. It is expected since the second order wave force hastwice the frequency of the first order wave force.
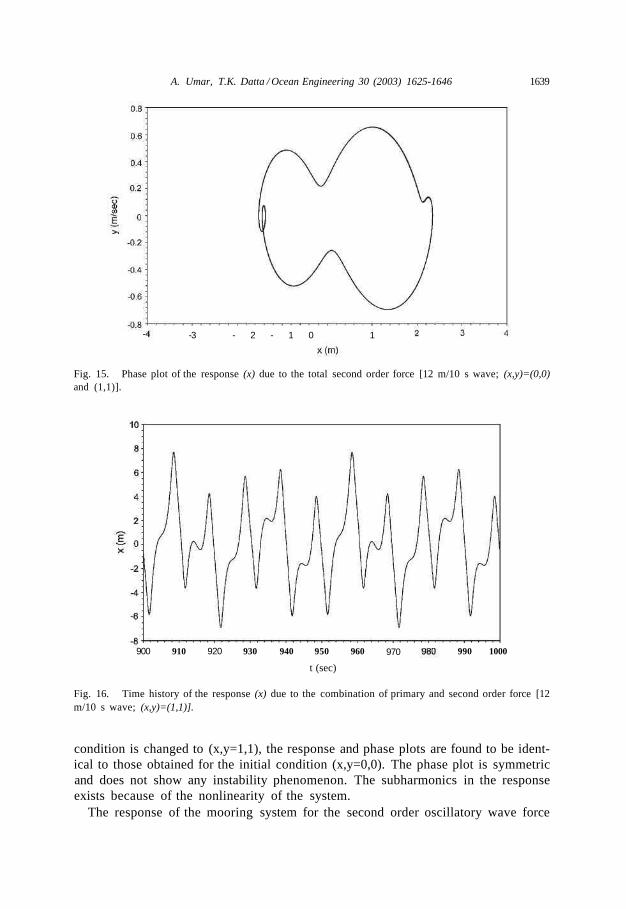
The response of the buoy due to the total second order force is plotted in Fig. 14for the initial condition (x,y=0,0). An identical response of the buoy is obtained forthe initial condition (x,y=1,1). The maximum response is about 2.35 m. The signifi-cant increase in the maximum response is due to the presence of steady part F^> ofthe second order force. The response is characterized by 5/2 subharmonics as canbe verified from the phase plot shown in Fig. 15. Thus, the possibility of dynamicinstability of the response to the total second order wave force is exhibited for the12 m/10 s wave.
A. Umar, T.K. Datta / Ocean Engineering 30 (2003) 1625-1646 1637
-10 -8 8 10
Fig. 11. Phase plot of the response (x) due to the primary wave force [12 m/10 s wave; (x,y)=(1,1)].
970 980 990 1000
Fig. 12. Time history of the response (x) due to the oscillatory second order force [12 m/10 s wave;(X,Y)=(0,0) and (1,1)].
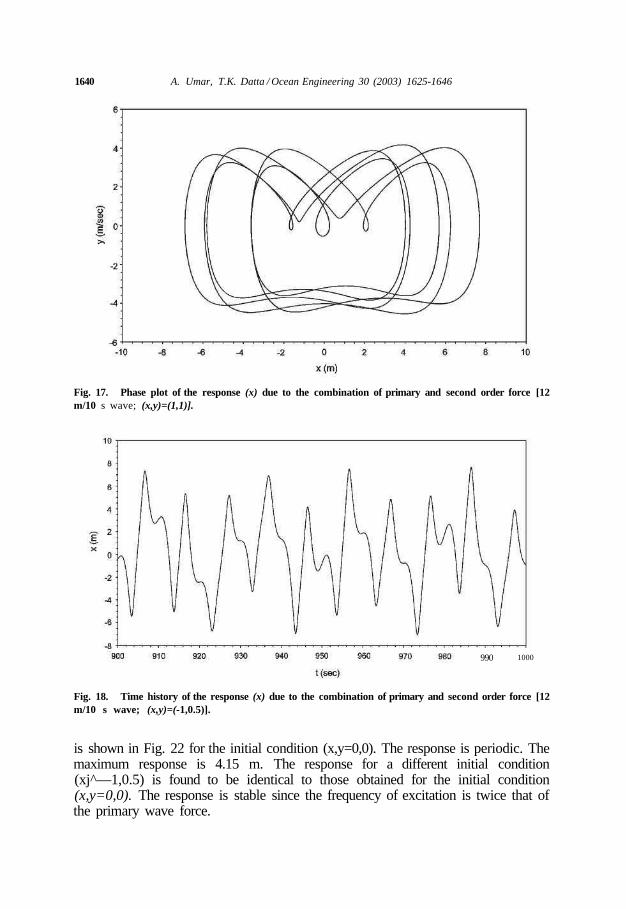
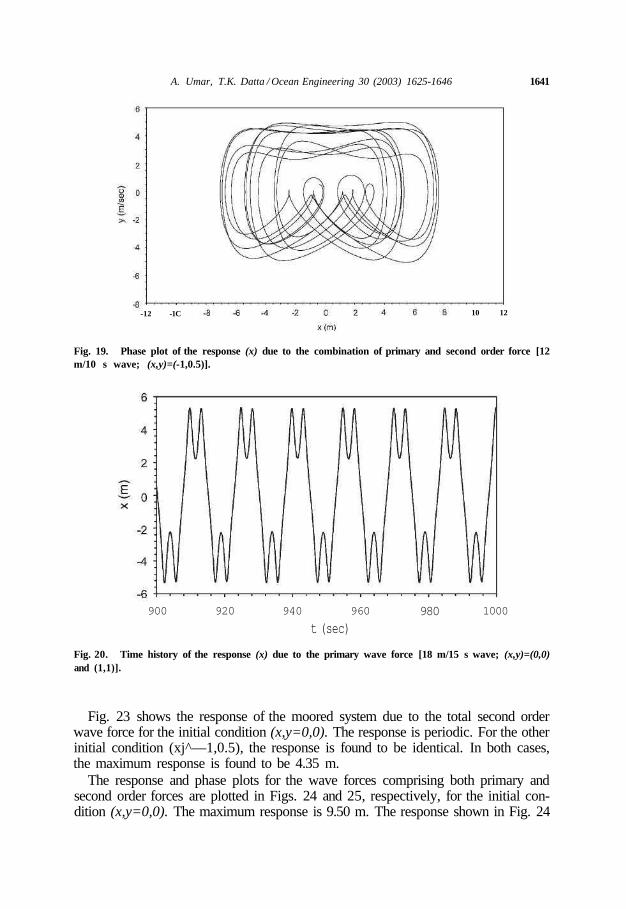
The response and phase plots for the wave forces comprising both primary andsecond order forces are plotted in Figs. 16 and 17, respectively, for the initial con-dition (x,y=1,1). The response is not harmonic but periodic with a time period of 50s. The response shows 5T ultra subharmonic motion. The response and phase plotsfor the changed initial condition (x,y=—1,0.5) are shown in Figs. 18 and 19, respect-ively. The response is found to be aperiodic and has a different nature than that forthe initial condition (x,y=1,1). The phase plots for both cases show symmetry break-
1638 A. Umar, T.K. Datta / Ocean Engineering 30 (2003) 1625-1646
0.3
-0.3
Fig. 13. Phase plot of the response (x) due to the oscillatory second order force [12 m/10 s wave;,y)=(0,0) and (1,1)].
900 910 920 930 940 950 960 970 990 1000
Fig. 14. Time history of the response (x) due to the total second order force [12 m/10 s wave; (x,y)=(0,0)and (1,1)].
ing bifurcation. Thus, the possibility of dynamic instability of the response existsfor the total wave force.
3.3. Responses due to 18 m/15 s wave
Figs. 20 and 21 show the response and phase plots, respectively, of the mooredsystem for the initial condition (x,y=0,0). These figures show the response to be aT-periodic solution. The maximum response obtained is 5.30 m. When the initial
A. Umar, T.K. Datta / Ocean Engineering 30 (2003) 1625-1646 1639
-3 - 2 - 1 0 1
Fig. 15. Phase plot of the response (x) due to the total second order force [12 m/10 s wave; (x,y)=(0,0)and (1,1)].
900 910 920 930 940 950 960
t (sec)
970 990 1000
Fig. 16. Time history of the response (x) due to the combination of primary and second order force [12m/10 s wave; (x,y)=(1,1)].
condition is changed to (x,y=1,1), the response and phase plots are found to be ident-ical to those obtained for the initial condition (x,y=0,0). The phase plot is symmetricand does not show any instability phenomenon. The subharmonics in the responseexists because of the nonlinearity of the system.
The response of the mooring system for the second order oscillatory wave force
1640 A. Umar, T.K. Datta / Ocean Engineering 30 (2003) 1625-1646
Fig. 17. Phase plot of the response (x) due to the combination of primary and second order force [12m/10 s wave; (x,y)=(1,1)].
990 1000
Fig. 18. Time history of the response (x) due to the combination of primary and second order force [12m/10 s wave; (x,y)=(-1,0.5)].
is shown in Fig. 22 for the initial condition (x,y=0,0). The response is periodic. Themaximum response is 4.15 m. The response for a different initial condition(xj^—1,0.5) is found to be identical to those obtained for the initial condition(x,y=0,0). The response is stable since the frequency of excitation is twice that ofthe primary wave force.
A. Umar, T.K. Datta / Ocean Engineering 30 (2003) 1625-1646 1641
-12 -1C 10 12
Fig. 19. Phase plot of the response (x) due to the combination of primary and second order force [12m/10 s wave; (x,y)=(-1,0.5)].
900 920 940 960
t (sec)980 1000
Fig. 20. Time history of the response (x) due to the primary wave force [18 m/15 s wave; (x,y)=(0,0)and (1,1)].
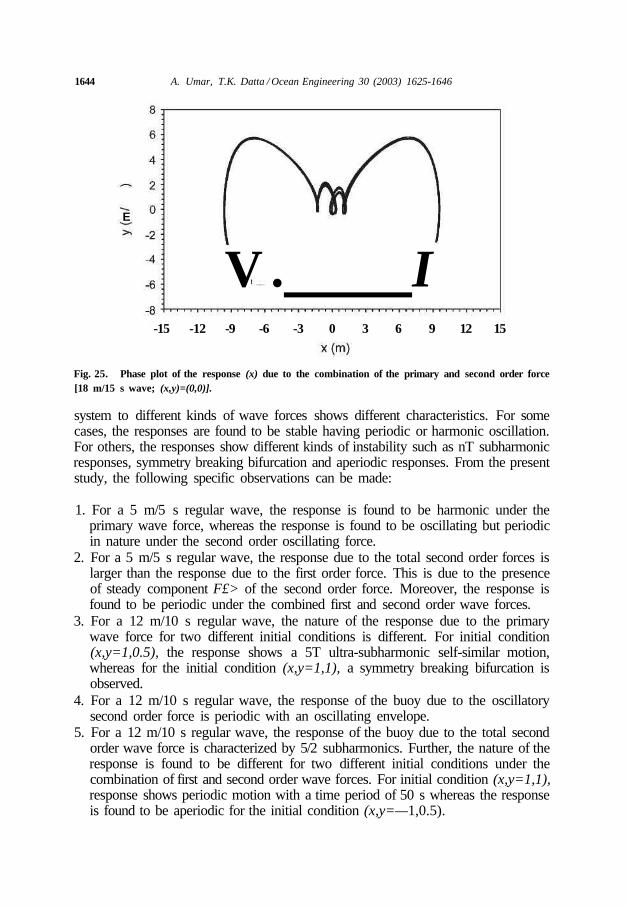
Fig. 23 shows the response of the moored system due to the total second orderwave force for the initial condition (x,y=0,0). The response is periodic. For the otherinitial condition (xj^—1,0.5), the response is found to be identical. In both cases,the maximum response is found to be 4.35 m.
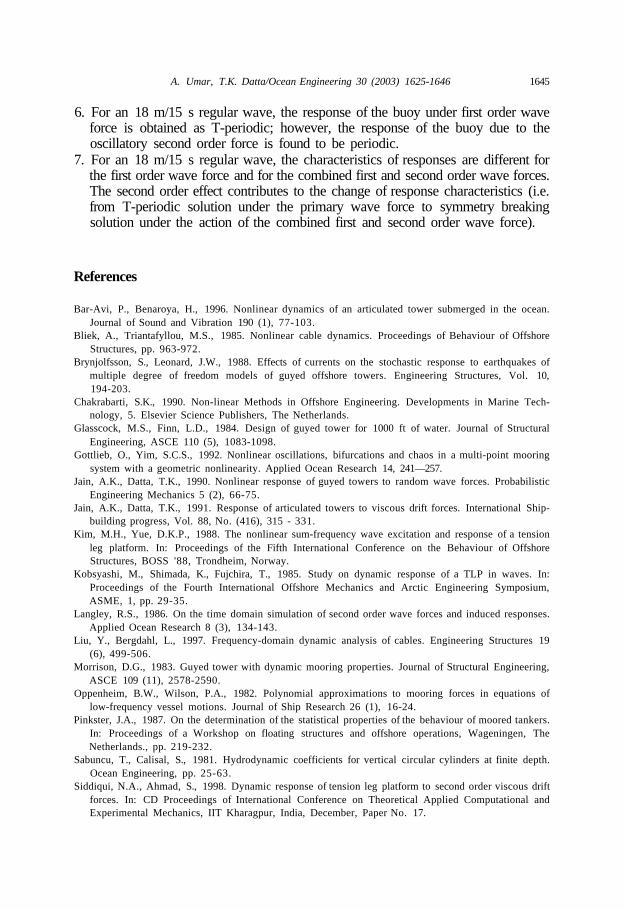
The response and phase plots for the wave forces comprising both primary andsecond order forces are plotted in Figs. 24 and 25, respectively, for the initial con-dition (x,y=0,0). The maximum response is 9.50 m. The response shown in Fig. 24
1642 A. Umar, T.K. Datta / Ocean Engineering 30 (2003) 1625-1646
/^>-—^r\
-10 - 8 - 6 - 4 - 2 0 2 4 6
x(m)
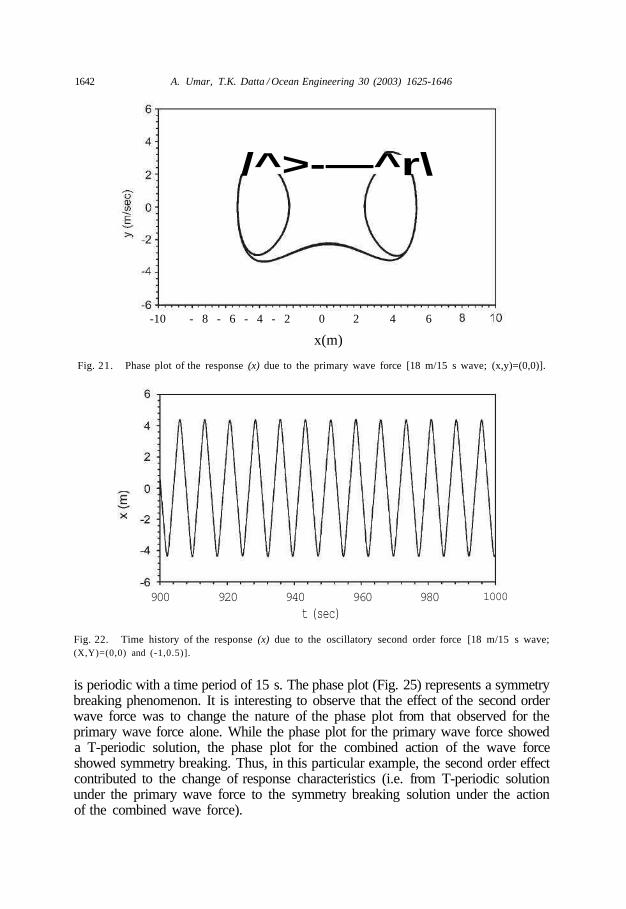
Fig. 21. Phase plot of the response (x) due to the primary wave force [18 m/15 s wave; (x,y)=(0,0)].
900 920 940 960 980 1000
t (sec)
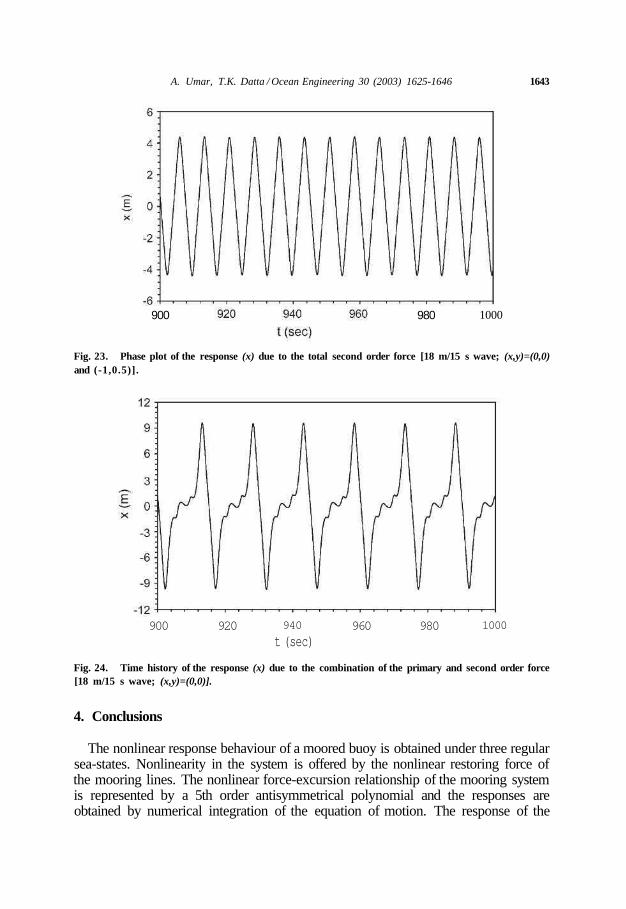
Fig. 22. Time history of the response (x) due to the oscillatory second order force [18 m/15 s wave;(X,Y)=(0,0) and (-1,0.5)].
is periodic with a time period of 15 s. The phase plot (Fig. 25) represents a symmetrybreaking phenomenon. It is interesting to observe that the effect of the second orderwave force was to change the nature of the phase plot from that observed for theprimary wave force alone. While the phase plot for the primary wave force showeda T-periodic solution, the phase plot for the combined action of the wave forceshowed symmetry breaking. Thus, in this particular example, the second order effectcontributed to the change of response characteristics (i.e. from T-periodic solutionunder the primary wave force to the symmetry breaking solution under the actionof the combined wave force).
A. Umar, T.K. Datta / Ocean Engineering 30 (2003) 1625-1646 1643
900 980 1000
Fig. 23. Phase plot of the response (x) due to the total second order force [18 m/15 s wave; (x,y)=(0,0)and (-1,0.5)].
900 920 940
t (sec)960 980 1000
Fig. 24. Time history of the response (x) due to the combination of the primary and second order force[18 m/15 s wave; (x,y)=(0,0)].
4. Conclusions
The nonlinear response behaviour of a moored buoy is obtained under three regularsea-states. Nonlinearity in the system is offered by the nonlinear restoring force ofthe mooring lines. The nonlinear force-excursion relationship of the mooring systemis represented by a 5th order antisymmetrical polynomial and the responses areobtained by numerical integration of the equation of motion. The response of the
1644 A. Umar, T.K. Datta / Ocean Engineering 30 (2003) 1625-1646
E
V . I-15 -12 -9 -6 -3 0 3 6 9 12 15
Fig. 25. Phase plot of the response (x) due to the combination of the primary and second order force[18 m/15 s wave; (x,y)=(0,0)].
system to different kinds of wave forces shows different characteristics. For somecases, the responses are found to be stable having periodic or harmonic oscillation.For others, the responses show different kinds of instability such as nT subharmonicresponses, symmetry breaking bifurcation and aperiodic responses. From the presentstudy, the following specific observations can be made:
1. For a 5 m/5 s regular wave, the response is found to be harmonic under theprimary wave force, whereas the response is found to be oscillating but periodicin nature under the second order oscillating force.
2. For a 5 m/5 s regular wave, the response due to the total second order forces islarger than the response due to the first order force. This is due to the presenceof steady component F£> of the second order force. Moreover, the response isfound to be periodic under the combined first and second order wave forces.
3. For a 12 m/10 s regular wave, the nature of the response due to the primarywave force for two different initial conditions is different. For initial condition(x,y=1,0.5), the response shows a 5T ultra-subharmonic self-similar motion,whereas for the initial condition (x,y=1,1), a symmetry breaking bifurcation isobserved.
4. For a 12 m/10 s regular wave, the response of the buoy due to the oscillatorysecond order force is periodic with an oscillating envelope.
5. For a 12 m/10 s regular wave, the response of the buoy due to the total secondorder wave force is characterized by 5/2 subharmonics. Further, the nature of theresponse is found to be different for two different initial conditions under thecombination of first and second order wave forces. For initial condition (x,y=1,1),response shows periodic motion with a time period of 50 s whereas the responseis found to be aperiodic for the initial condition (x,y=—1,0.5).
A. Umar, T.K. Datta/Ocean Engineering 30 (2003) 1625-1646 1645
6. For an 18 m/15 s regular wave, the response of the buoy under first order waveforce is obtained as T-periodic; however, the response of the buoy due to theoscillatory second order force is found to be periodic.
7. For an 18 m/15 s regular wave, the characteristics of responses are different forthe first order wave force and for the combined first and second order wave forces.The second order effect contributes to the change of response characteristics (i.e.from T-periodic solution under the primary wave force to symmetry breakingsolution under the action of the combined first and second order wave force).
References
Bar-Avi, P., Benaroya, H., 1996. Nonlinear dynamics of an articulated tower submerged in the ocean.Journal of Sound and Vibration 190 (1), 77-103.
Bliek, A., Triantafyllou, M.S., 1985. Nonlinear cable dynamics. Proceedings of Behaviour of OffshoreStructures, pp. 963-972.
Brynjolfsson, S., Leonard, J.W., 1988. Effects of currents on the stochastic response to earthquakes ofmultiple degree of freedom models of guyed offshore towers. Engineering Structures, Vol. 10,194-203.
Chakrabarti, S.K., 1990. Non-linear Methods in Offshore Engineering. Developments in Marine Tech-nology, 5. Elsevier Science Publishers, The Netherlands.
Glasscock, M.S., Finn, L.D., 1984. Design of guyed tower for 1000 ft of water. Journal of StructuralEngineering, ASCE 110 (5), 1083-1098.
Gottlieb, O., Yim, S.C.S., 1992. Nonlinear oscillations, bifurcations and chaos in a multi-point mooringsystem with a geometric nonlinearity. Applied Ocean Research 14, 241—257.
Jain, A.K., Datta, T.K., 1990. Nonlinear response of guyed towers to random wave forces. ProbabilisticEngineering Mechanics 5 (2), 66-75.
Jain, A.K., Datta, T.K., 1991. Response of articulated towers to viscous drift forces. International Ship-building progress, Vol. 88, No. (416), 315 - 331.
Kim, M.H., Yue, D.K.P., 1988. The nonlinear sum-frequency wave excitation and response of a tensionleg platform. In: Proceedings of the Fifth International Conference on the Behaviour of OffshoreStructures, BOSS '88, Trondheim, Norway.
Kobsyashi, M., Shimada, K., Fujchira, T., 1985. Study on dynamic response of a TLP in waves. In:Proceedings of the Fourth International Offshore Mechanics and Arctic Engineering Symposium,ASME, 1, pp. 29-35.
Langley, R.S., 1986. On the time domain simulation of second order wave forces and induced responses.Applied Ocean Research 8 (3), 134-143.
Liu, Y., Bergdahl, L., 1997. Frequency-domain dynamic analysis of cables. Engineering Structures 19(6), 499-506.
Morrison, D.G., 1983. Guyed tower with dynamic mooring properties. Journal of Structural Engineering,ASCE 109 (11), 2578-2590.
Oppenheim, B.W., Wilson, P.A., 1982. Polynomial approximations to mooring forces in equations oflow-frequency vessel motions. Journal of Ship Research 26 (1), 16-24.
Pinkster, J.A., 1987. On the determination of the statistical properties of the behaviour of moored tankers.In: Proceedings of a Workshop on floating structures and offshore operations, Wageningen, TheNetherlands., pp. 219-232.
Sabuncu, T., Calisal, S., 1981. Hydrodynamic coefficients for vertical circular cylinders at finite depth.Ocean Engineering, pp. 25-63.
Siddiqui, N.A., Ahmad, S., 1998. Dynamic response of tension leg platform to second order viscous driftforces. In: CD Proceedings of International Conference on Theoretical Applied Computational andExperimental Mechanics, IIT Kharagpur, India, December, Paper No. 17.

1646 A. Umar, T.K. Datta/Ocean Engineering 30 (2003) 1625-1646
Taylor, R.E., Hung, S.M., 1987. Second order diffraction forces on vertical cylinder in regular waves.Applied Ocean Research 9 (1), 19-30.
Umar, A., Datta, T.K., 2001. Stability analysis of a moored system. In: Proceedings of the StructuralEngineering Convention-An International Meet (SEC-2001). I.I.T. Roorkee, India, pp. 636-654.
Van Den Boom, H.J.J., 1985. Dynamic behaviour of mooring lines. In: Proceedings of Behaviour ofOffshore Structures., pp. 359-368.