Nonlinear Pharmacokinetics 1
34
NON-LINEAR PHARMACOKINETICS: PRESENTED BY: RAJGOR NARESH B.
-
Upload
donndisaster -
Category
Documents
-
view
482 -
download
46
Transcript of Nonlinear Pharmacokinetics 1

NON-LINEAR PHARMACOKINETICS:
PRESENTED BY: RAJGOR NARESH B.
INTRODUCTION: Drug which do not follow first order
kinetics shows non-linear or mixed order kinetic.
So, it is called as dose dependent Pharmacokinetic.
The process of drugs ADME involve enzymes or carrier-mediated systems.
Saturation of plasma protein binding or carrier mediated systems, drugs shows non-linear Pharmacokinetic due to a pathologic alteration in drug ADME.
Ex; Amino glycosides may cause renal nephrotoxicity,thereby altering renal drug excretion.
Gallstone obstruction of the bile duct will alter biliary drug excretion.
A number of drugs demonstrate saturation or capacity-limited metabolism in humans.
Ex; of saturation of metabolic process include glycine conjugation of salicylate, sulfate conjugation of salicylamide, Acetylation of PABA & elimination of phenytoin.
Drugs that demonstrate saturation kinetics usually show the following characteristics.
elimination of drug does not follow simple first order kinetics,means elimination kinetics are non-linear.
The elimination half-life changes as dose is increased.Usually ,elimination half-life increases with increased dose due to saturation of an enzyme system.
the AUC is not proportional to the amount of bioavailable drug
the saturation of capacity limited processes may be affected by other drugs that require the same enzyme or carrier-mediated system.(Competition effect.)
The composition & ratio of the metabolites of drug may be affected by a change in dose.

Causes of Non-Linear Pharmacokinetics A. GI ABSOPRTION:1. Saturable transport in gut wall. Ex: Riboflavin, L-dopa, baclofen.2. Drugs with low solubility in GI in high dose: Ex: Griseofulvin in high dose has saturated
solution in GIT.3. Intestinal metabolism: Ex: Salicylamide, propraolol4. GI decomposition: Ex: Penicillin G, omeprazole ,sequinavir

B. DISTRIBUTION:1. Saturated plasma protein binding. Ex:Phenylbutazone, lidocaine,
salicylic acid, phenytoin.2. Cellular uptake. Methicillin3. Tissue binding. Imiprimine4. Saturable transport into or out of tissue Methotrixate5. CSF Transport Benzyl penicillin
C. RENAL ELIMINATION:
1.Active secretion: Mezlocillin,Para-aminohippuric
acid2.Tubular reabsorption: Riboflavin.ascorbic acid.3.Change in urine PH: Salicylic acid.

D. METABOLISM:1. Saturable metabolism: Phenytoin, valproic acid, salicylic acid2. Cofactor or enzyme limitation: Acetaminophen,alcohol3. Enzyme induction: Carbamazepine4. Altered hepatic blood flow: Propranolol, verapamil5. Meatbolite inhibition: Diazepam

E. BILIARY EXCRETION:
1. Biliary secretion: Iodipamide,
sulfobromophthalzin sodium2. Enterohepatic recycling Cimetidine
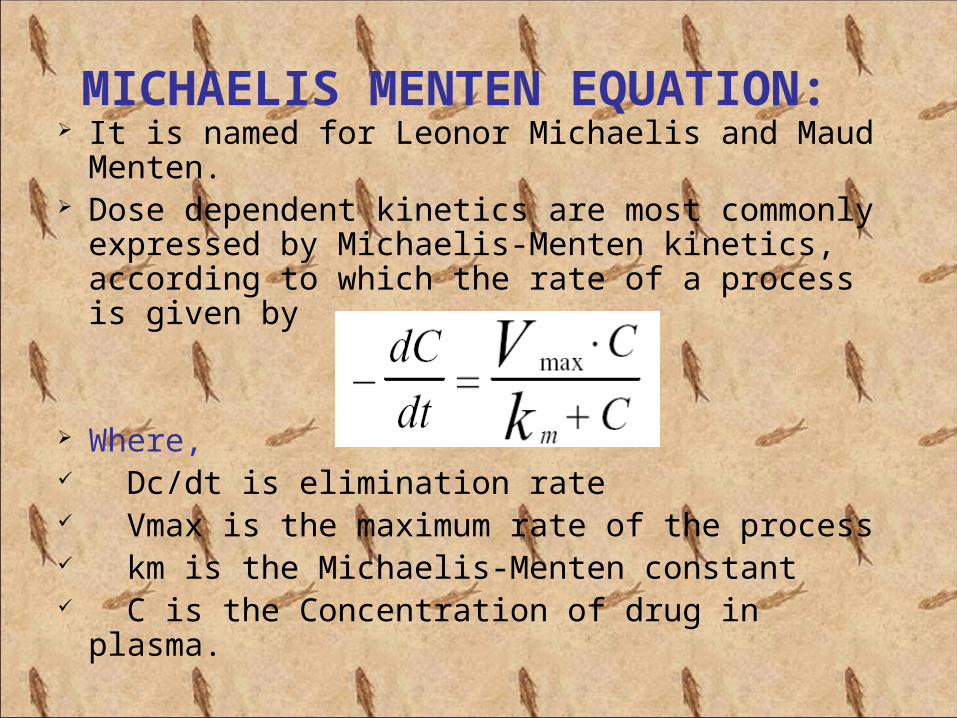
MICHAELIS MENTEN EQUATION:
It is named for Leonor Michaelis and Maud Menten.
Dose dependent kinetics are most commonly expressed by Michaelis-Menten kinetics, according to which the rate of a process is given by
Where, Dc/dt is elimination rate Vmax is the maximum rate of the process km is the Michaelis-Menten constant C is the Concentration of drug in plasma.
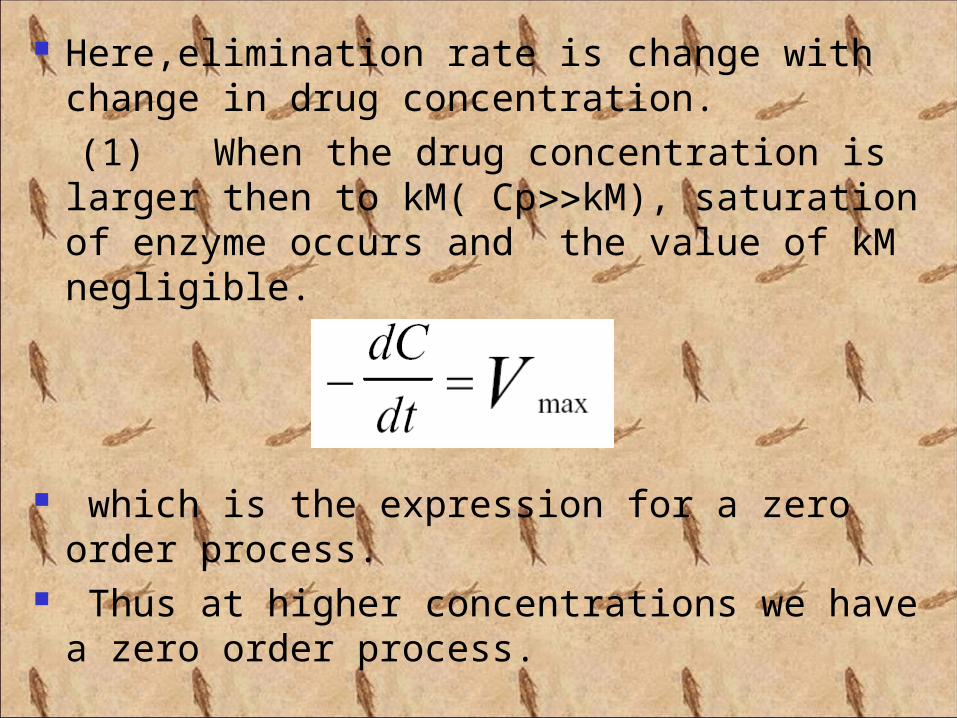
Here,elimination rate is change with change in drug concentration.
(1) When the drug concentration is larger then to kM( CpkM), saturation of enzyme occurs and the value of kM negligible.
which is the expression for a zero order process.
Thus at higher concentrations we have a zero order process.
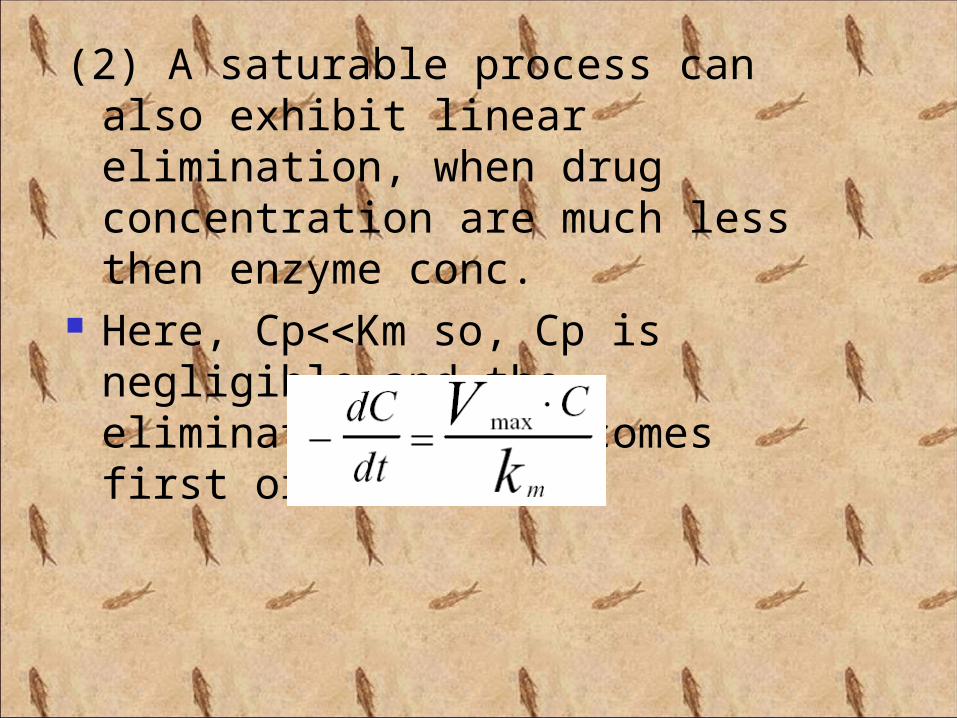
(2) A saturable process can also exhibit linear elimination, when drug concentration are much less then enzyme conc.
Here, CpKm so, Cp is negligible and the elimination rate becomes first order.
(3) If drug concentration is same as Km,then Cp=Km.
dCp = Vmax dt 2 so it is evident that the rate of
process becomes equal to one half its
maximum rate. It is also called mixed order
elimination rate
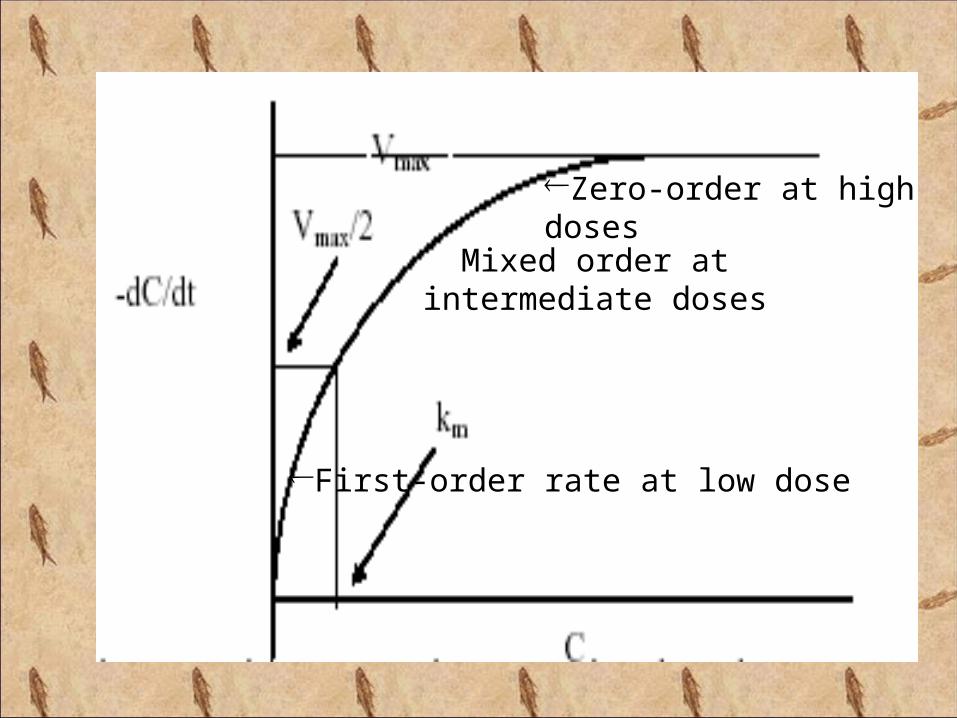
Zero-order at high doses
Mixed order at intermediate doses
First-order rate at low dose

Estimation of Km and
Vmax The parameters of capacity-limited process
like metabolism, renal tubular secretion and biliary excretion can be easily defined by assuming one-compartment kinetics for the drug and that elimination involves only a single capacity-limited process.
The parameters Km and Vmax can be assessed from the plasma conc.- time data collected after i.v.bolus administration of a drug with nonlinear elimination characteristics.

Rewriting michaelis-menten equation,
conversion to log base 10 yields,
Log C= Log Co + (Co-C) – Vmax.t (1)
2.303 Km 2.303 Km
A semilog plot of c verses t yields a curve with a terminal linear portion having slope –Vmax/2.303. Km and when back extrapolated to time zero gives - intercept log
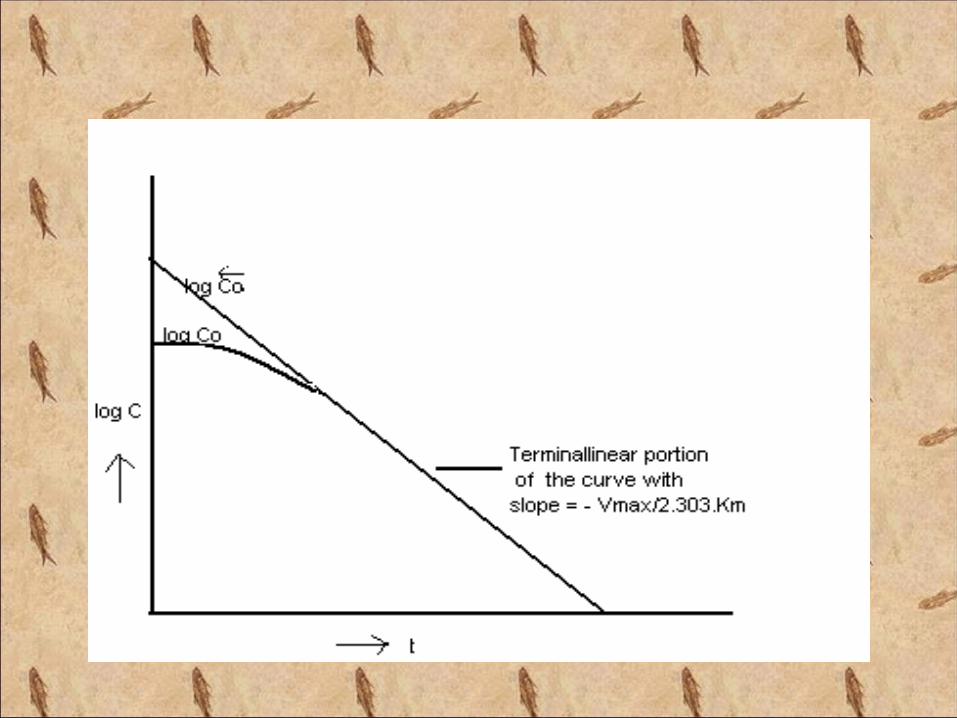
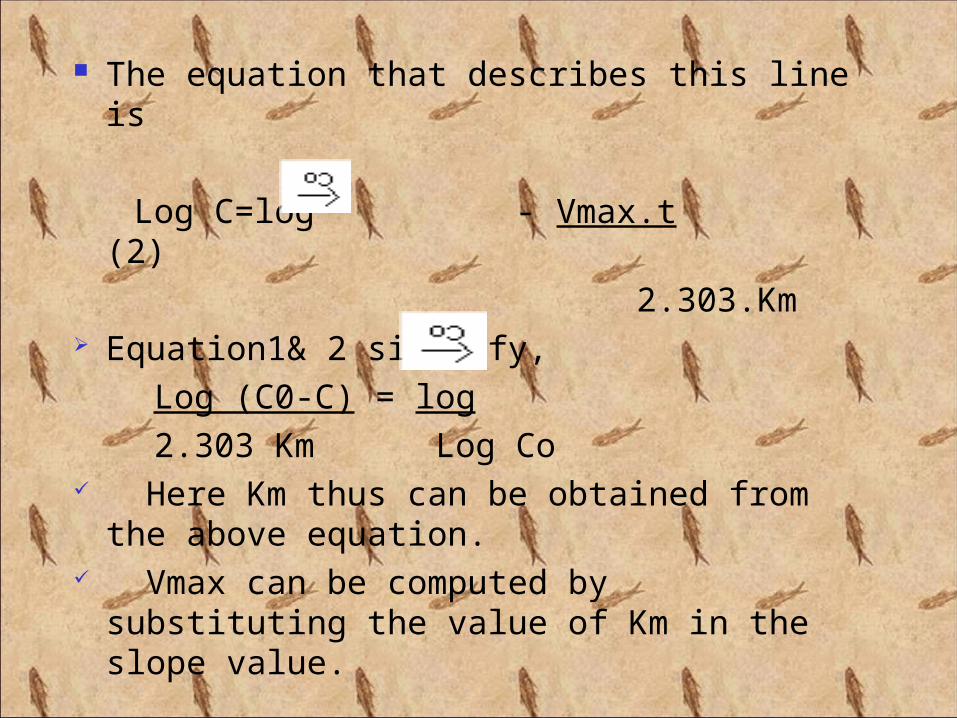
The equation that describes this line is
Log C=log - Vmax.t (2) 2.303.Km Equation1& 2 simplify, Log (C0-C) = log 2.303 Km Log Co Here Km thus can be obtained from
the above equation. Vmax can be computed by substituting
the value of Km in the slope value.
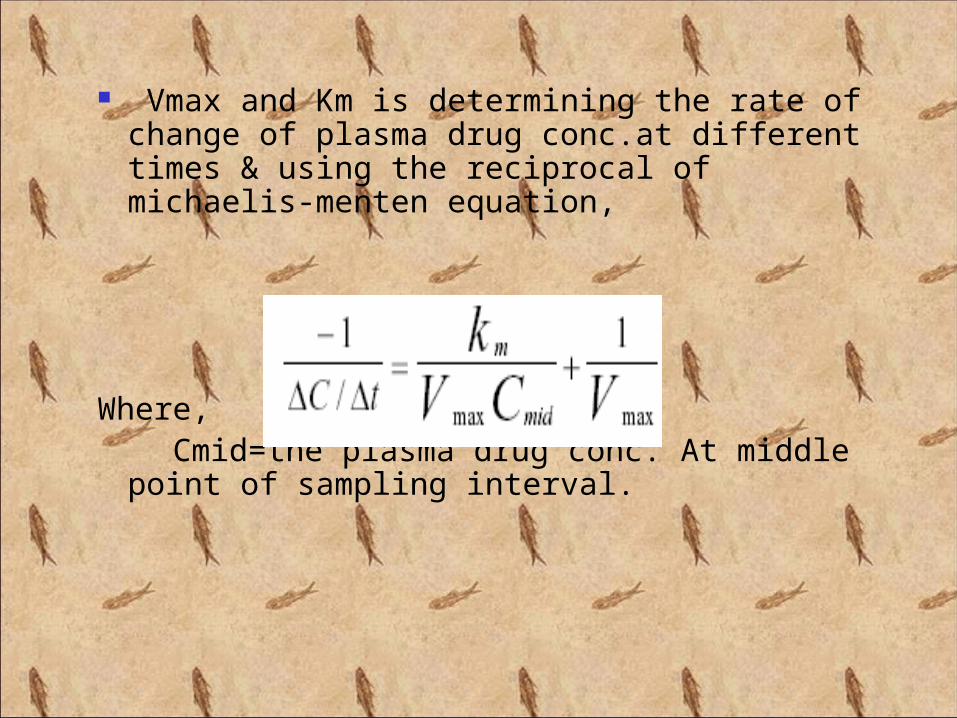
Vmax and Km is determining the rate of change of plasma drug conc.at different times & using the reciprocal of michaelis-menten equation,
Where, Cmid=the plasma drug conc. At middle point
of sampling interval.
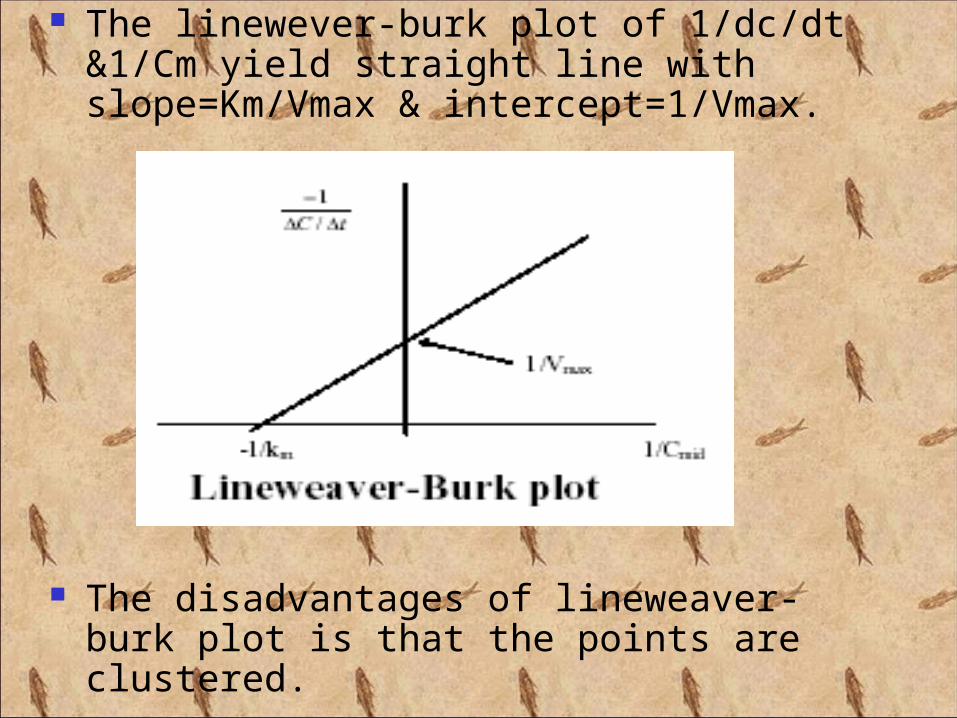
The linewever-burk plot of 1/dc/dt &1/Cm yield straight line with slope=Km/Vmax & intercept=1/Vmax.
The disadvantages of lineweaver-burk plot is that the points are clustered.
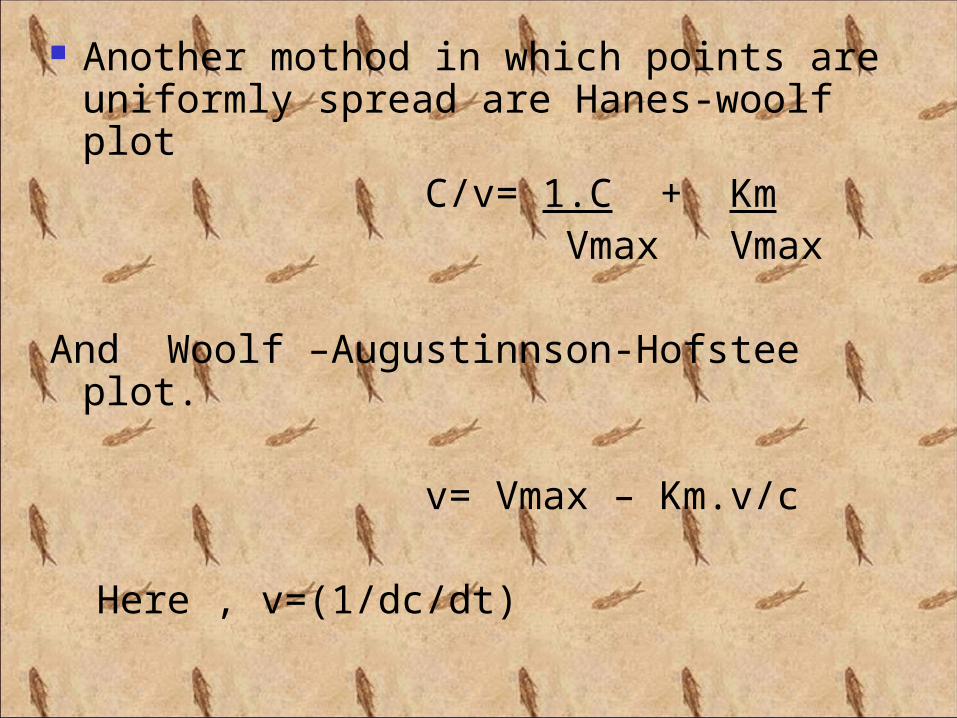
Another mothod in which points are uniformly spread are Hanes-woolf plot
C/v= 1.C + Km Vmax Vmax
And Woolf –Augustinnson-Hofstee plot. v= Vmax – Km.v/c Here , v=(1/dc/dt)

A plot of C/v verses C yield a straight line 1/Vmax as a slope & Km/ Vmax as intercept.

A plot of v verses v/C yield slope of Km&intercept of Vmax.
Slope of Km
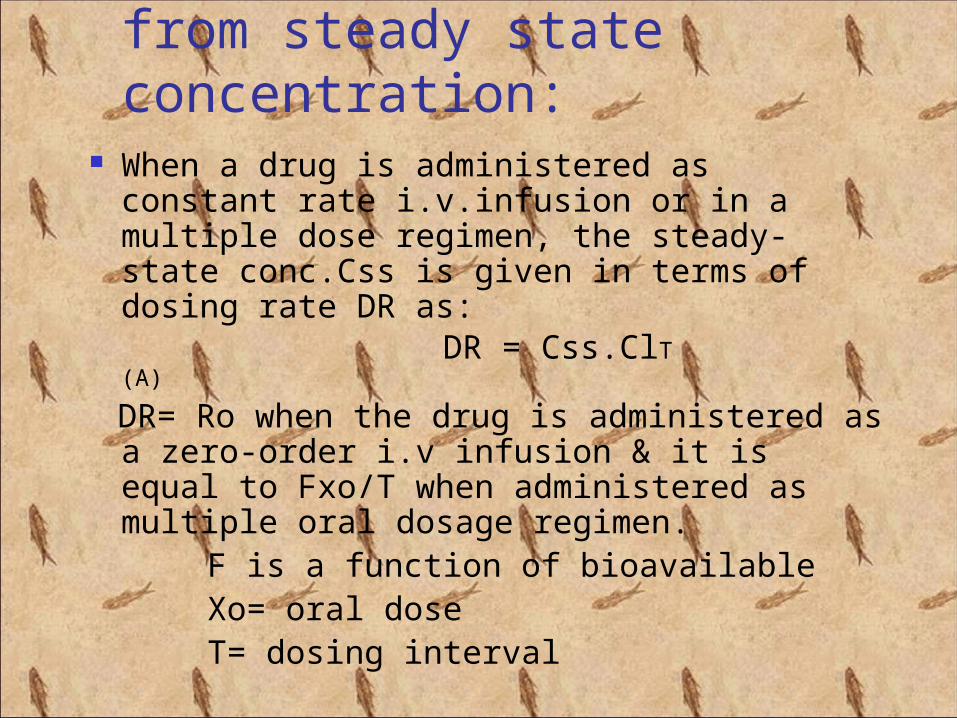
Estimation of Km & Vmax from steady state concentration:
When a drug is administered as constant rate i.v.infusion or in a multiple dose regimen, the steady-state conc.Css is given in terms of dosing rate DR as:
DR = Css.ClT (A)
DR= Ro when the drug is administered as a zero-order i.v infusion & it is equal to Fxo/T when administered as multiple oral dosage regimen.
F is a function of bioavailable Xo= oral dose T= dosing interval
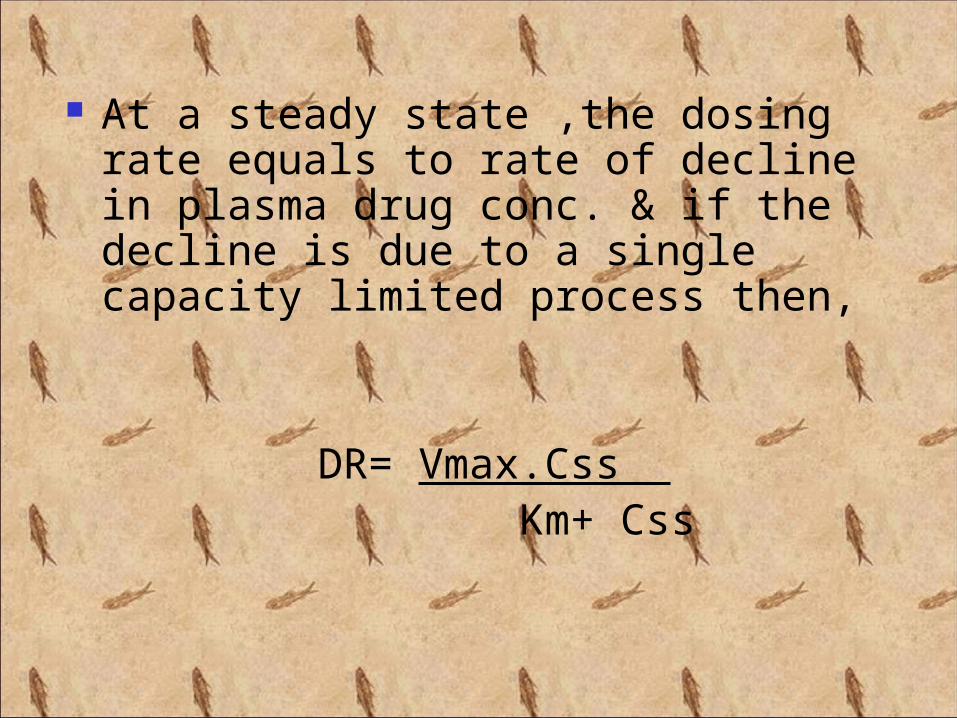
At a steady state ,the dosing rate equals to rate of decline in plasma drug conc. & if the decline is due to a single capacity limited process then,
DR= Vmax.Css Km+ Css
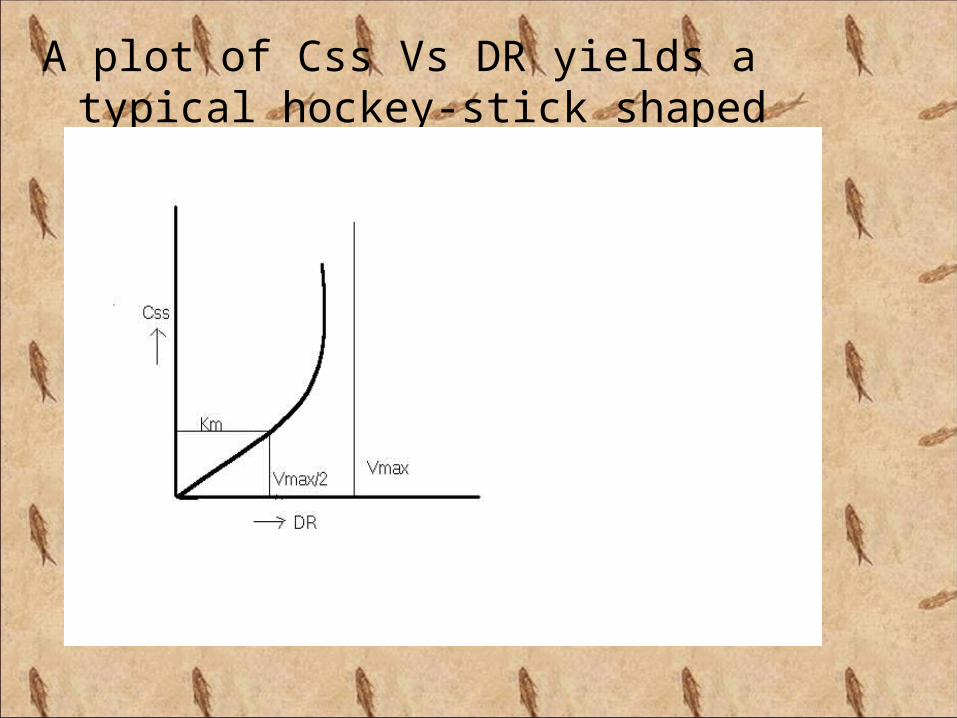
A plot of Css Vs DR yields a typical hockey-stick shaped curve as,
Three ways for estimating Km & Vmax:
(1) Lineweaver-Burk Plot:
(2) Direct Linear Plot:
(3) The Third graphical method:

(1) Lineweaver-Burk Plot: Taking reciprocal of, DR= Vmax.Css Km+ Css 1 = Km + 1 DR Vmax.Css Vmax A plot of 1/DR Vs 1/Css yields a
straight line with slope Km/Vmax & y-intercept 1/Vmax
(2) Direct Linear Plot:
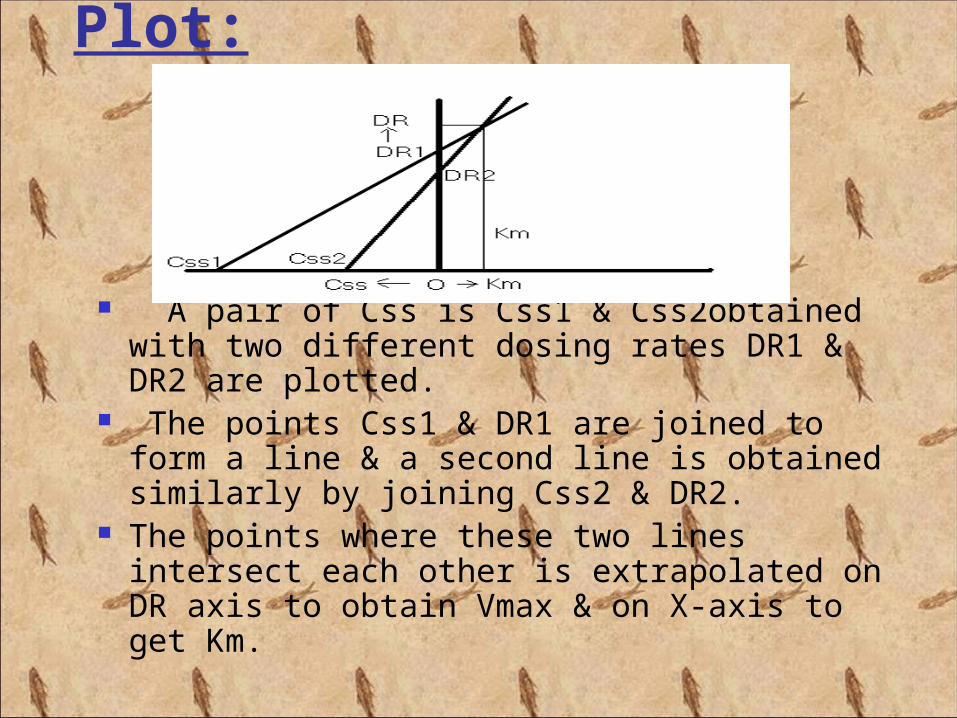
A pair of Css is Css1 & Css2obtained with two different dosing rates DR1 & DR2 are plotted.
The points Css1 & DR1 are joined to form a line & a second line is obtained similarly by joining Css2 & DR2.
The points where these two lines intersect each other is extrapolated on DR axis to obtain Vmax & on X-axis to get Km.
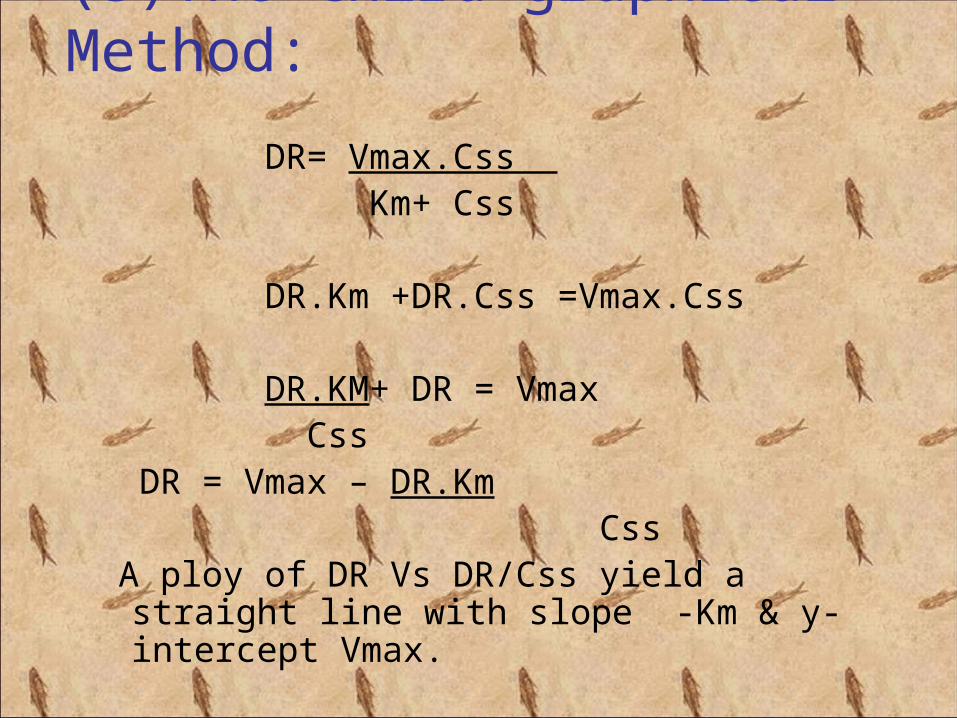
(3)The third graphical Method:
DR= Vmax.Css Km+ Css
DR.Km +DR.Css =Vmax.Css
DR.KM+ DR = Vmax Css DR = Vmax – DR.Km Css A ploy of DR Vs DR/Css yield a straight
line with slope -Km & y-intercept Vmax.
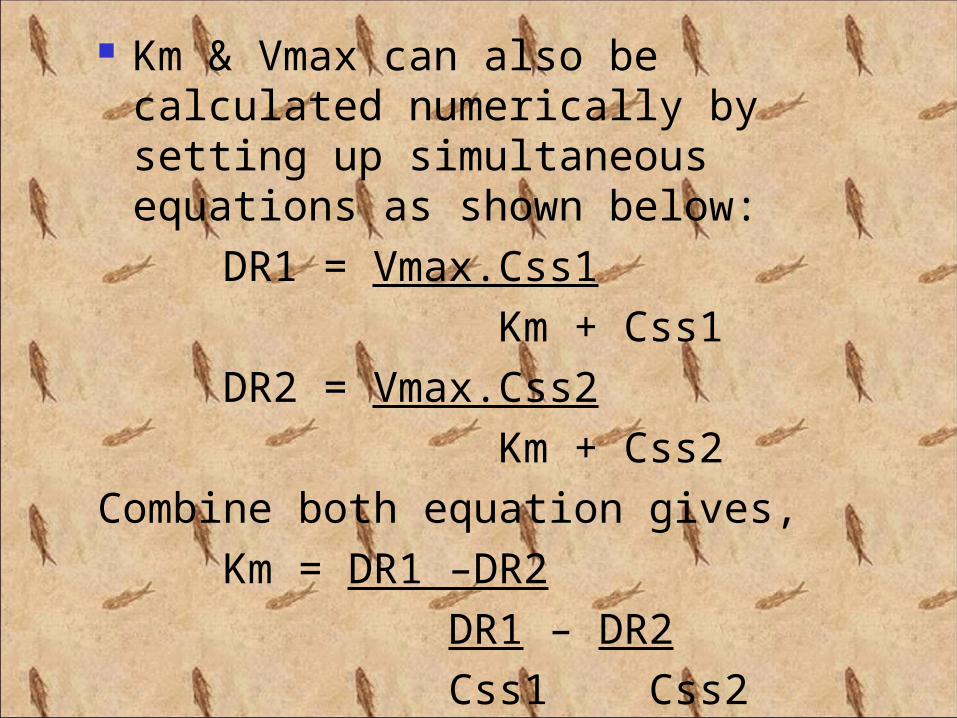
Km & Vmax can also be calculated numerically by setting up simultaneous equations as shown below:
DR1 = Vmax.Css1 Km + Css1 DR2 = Vmax.Css2 Km + Css2Combine both equation gives, Km = DR1 –DR2 DR1 – DR2 Css1 Css2

THANK YOU