
Nonlinear Optical Spectroscopy of Ce3+ Ions in Insulating Crystals
160
Nonlinear Optical Spectroscopy of Ce3* Ions in Insulating Crystals By David Matthew Piehler (Haney Mudd College) 1985 (University of California) 1987 DISSERTATION Submitted in partial satisfaction of the requirements for the degree of DOCTOR OF PHILOSOPHY in PHYSICS in the GRADUATE DTYISION of the UNIVERSITY OF CALfFORNIA at BERKELEY B.S. MJ. A+J-c,*4- ..t!:.rdilt.e **:t*******************************
-
Upload
dpiehleralphioncom -
Category
Documents
-
view
14 -
download
2
description
David Piehler, "Nonlinear Optical Spectroscopy of Ce3+ Ions in Insulating Crystals," Ph.D. dissertation, Department of Physics, University of California, Berkeley, November 1990.
Transcript of Nonlinear Optical Spectroscopy of Ce3+ Ions in Insulating Crystals
Nonlinear Optical Spectroscopy of Ce3* Ionsin Insulating Crystals
By
David Matthew Piehler
(Haney Mudd College) 1985(University of California) 1987
DISSERTATION
Submitted in partial satisfaction of the requirements for the degree of
DOCTOR OF PHILOSOPHY
in
PHYSICS
in the
GRADUATE DTYISION
of the
UNIVERSITY OF CALfFORNIA at BERKELEY
B.S.MJ.
A+J-c,*4- ..t!:.rdilt.e
**:t*******************************
.. I'
-.
.. ·
Nonlinear Optical Spectroscopy of Ce3+ Ions in Insulating Crystals
by
David Matthew Piehler
Abstract
Coherent anti-Stokes Raman spe~troscopy (CARS) involving electronic states of
rare earth ions in insulating crystals has shown only limited success, unlike CARS
involving vibrational transitions. The major problem is that x<3>R, the contribution to the
third order susceptibility from the electronic states of the rare earth ions, is often obscured
by x<3>NR, the contribution from the b~lk crystal which can be orders of magnitude larger.
Previous CARS experiments in pure rare earth crystals gave values of C = lx<3>R;x<3>NRlmax
no greater than 0.5.
The quantity x<3>R increases as the frequencies of the input lasers approach the
energies of the parity-allowed 4/--7 5d electric dipole transitions of the rare earth ions.
Among the trivalent rare earth ions, Ce3+ with its single 4f electron has the lowest energy
excited 5d configuration. Electronic CARS resonances involving Stark components of the
2F512 and 2F 712 manifolds of the Ce3+ ion-have been measured in two crystals at liquid
helium temperature. In the pure crystal, CeF3, the levels of 5d configuration range from
about 40000 to 50000 cm·1 and strong CARS resonances (C > 3) were seen when using
visible o .. l ""476 nm, ~ = 532 nm) or near ultraviolet (A.l = 355 nm, ~"" 385 nm) lasers .
Approximating the virtual intermediate states by a degenerate 5d level at 45000 cm·1
accounted for both the absolute magnitude and dispersion properties of 1x<3>R1rnax· In the
dilute crystal, LuP04 doped with 0.06 mol % Ce3+, strong CARS resonances (C > 15)
were observed only when the anti-Stokes signal was nearly resonant with the onset of the
lowest 5d band at 30460 cm·1 (328 nm).
The applicability of these experiments to other rare earth systems as well as the
prospects for stimulated electronic Raman gain are discussed.
Additionally, polarized two-photon absorption spectra originating in the 4f ground
state and terminating in the 5d levels in the Ce3+:LuP04 crystal, gave the energies and
symmetries of the zero-phonon lines of the two lowest 5d bands. The zero-phonon lines,
which are labeled by the irreducible representations of the Du double group, are at 30460
cm·1 (r7) and 39715 cm·1 (r6).
2
.. I\
J"\

...
Although he wrote to his brother Charles that the prospect of painting Peggy's mural was
"exciting as hell," Jackson's procrastination was evidence of his terror at the thought of
executing a work so large "with no strings attached as to what or how I paint" He sat on
a keg and stared at the huge blank canvas for a month .... After months of indecision
about the subject of his mural, Pollock decided to let his mode of creation constitute his
theme.
-Ellen G. Landau in Jackson Pollock (Harry N. Abrams Publishers, New York, 1989)
n
'~
Table of Contents
Acknowledgements vi
Introduction 1
Chapter One Optical Properties of Ce3+:LuP04 and CeF3 5
1.1 The Ce3+ Free Ion 5
1.2 The Ce3+ Ion in a Crystalline Environment 7
1.2.1 The 4f Configuration 8
1.2.2 The 5d Configuration 11
1.2.3 4f H 5d Transitions 13
1.3 Line Broadening in Rare Earth Systems 15
1.4 eeJ+:LuP04 19
1.5 CeF3 21 r \
Appendix 1.1 Measurement of the 2F 512 (r 6) ~ 5d (r7) Absorption Spectrum
in Ce3+:LuP04 24 ._,
Appendix 1.2 Measurement of the 5d~/Radiative Lifetime in Ce3+:LuP04 25
iii
Chapter Two
Doubly Resonant Coherent Anti-Stokes Raman Spectroscopy of Ce3+ in LuP04
.. ,, ' 2.1 Wave Mixing Spectroscopy
2.1.1 Optical Wave Mixing
' 2.1.2 Coherent Anti-Stokes Raman Spectroscopy (CARS)
2.2 Electronic Raman Scattering in Rare Earth Crystals
2.3 Estimating the Magnitude of Electronic CARS Resonances
2.3.1 Singly Resonant CARS
2.3.2 Doubly Resonant CARS
2.4 Selection Rules
2.5 The Experimental Apparatus and Procedure
2.5.1 The Light Sources
2.5.2 The CARS Setup
2.5.3 Noise
2.6 The Data
2.7 Analysis
2.7.1 Calculation of x<3)R
2.7.2 Deconvolution of the Spectra
2.7.3 Analysis
2.7.4 Summary
Chapter Three
4f_:;5d Two-photon Absorption in Ce3+:LuP04
3.1 Theory of Two-photon Absorption
3.2 4f ~ 5d Two-photon Absorption
lV
43
44
44
48
54
58
58
59
60
61
61
63
64
65
65
65
69
70
72
89
90
92
3.3 Selection Rules
3.4 Experimental Details
3.5 Results and Discussion
3.5.1 2Fsn (r6) ~ 5d (r7)
3.5.2 2Fsn (r6) ~ 5d <r ~ 3.5.3 Summary
Chapter Four
Electronic Coherent Anti-Stokes Raman Spectroscopy in CeF3
4.1 The Resonant and the Nonresonant Susceptibility
4.1.1 The Resonant Susceptibility
4.1.2 The Nonresonant Susceptibility
4. 2 Experimental
4.3 · Analysis
4.4 Summary
Appendix 4.1 Calculation of lx<3)Rimax and <Jzz
A 4.1.1
A 4.1.2
A 4.1.3
A 4.1.4
Application of the Axe Theory of Two-photon Processes
Calculating I( 4f I r 15d )I for Ce3+ in CeF3
Wavefunctions for Ce3+ in CeF3
Calculation of the Electronic Raman Cross Section
Appendix 4.2 Stimulated Electronic Raman Gain
A 4.2.1
A 4.2.2
A 4.2.3
References
Introduction
Experimental
Analysis
93
93
95
95 . . "
96 .. 97
105
108
108
110
11f
115
119
119
119
121
123
126
127 '\
127 I'
129 ..
130
145
.. Acknowledgements
Sumner Davis has been my research director and optics teacher. Looking back, I
am amazed that I have learned so much from one person. Most importantly, however,
Sumner believed in me even when I did not. Wednesday group meetings were made truly
memorable by the presence of Davis group members Mark Abrams, Sandalphon, Yan Wu,
Phil Becker and Glen Williams. Glen and Phil laid the foundation for this dissertation by
their exhaustive study of the linear electronic spectroscopy of rare earth phosphate crystals.
As my office mate for two years, Glen instilled in me a fascination with cerium and non
standard English.
Norm Edelstein has been responsible for both financial and scientific support of this
work. Norm is fond of saying "Pa4+ is just like Ce3+." After our long collaboration, my
response is now "OK Norm,'you may be right, but I'd rather work with cerium."
Among the LBL staff, Jerry Bucher pretended to be a wet blanket, but he is not,
while George Shalimoff had to endure my foolishness. Other current and former grad
students and LBLers assisted me in numerous ways on many occasions - the Medhursts
(Laura and Jane), giant-Frank Gerner, Lou lojo Terminello, Capo, Dave Pripstein, Barbara
Moriguchi-Iwa, Alan Zalkin, Wayne Lukens, Marc Wedert, Isabelle Poirot Muller, and, of
course, Sharon Beshouri. Wing K. K. Kot has been a valuable resource for information
and advice on diverse topics of mutual interest ranging from point-charge calculations to
French grammar. Denny "anything can happen and usually does" Kim furnished much
needed entertainment. The Gould family- Carol, Jay, Cam and Juice-bar the dog helped
VI
to keep everything in perspective by providing me with vacation venues, activities and
adventures.
Among those who have helped me understand various aspects of my research are
Bernard Jaquier, Roger Macfarlane, Llyod Chase, Swapan Gayen, Douglas Hamilton and
Eric Van Stryland. Colin Flint and Brian Judd were responsible for getting NATO and
NSF to fund my (working) European vacation. In Italy, I met Vincenzo Schettino and ..
Paolo Poggi who first got me interested in CARS. Marv Abraham and Lynn Boatner of
Oak Ridge National Laboratory supplied the Ce3+:LuP04 sample, and Rob Sparrow of
Optovac supplied the CeF3 crystal.
This work was supported by the Director, Office of Energy Research, Office of
Basic Energy Sciences, Chemical Sciences Division of the US Department of Energy under
Contract No. DE-AC03-76SF00098.
vii
Introduction
As a group, insulating crystals containing trivalent rare earth ions are noteworthy
for their unique optical properties, as well as their practical applications in such devices as
lasers. Among these ions, (sometimes referred to as lanthanide or 4/n ions), two
properties of the trivalent cerium ion make it an especially attractive system to study. One
is that Ce3+ has a single optically active electron (n = 1). This simplifies calculations, and
consideration of many-body interactions within the electronic configuration is unnecessary.
The other is that the first excited configuration (4f(n-I)5d1) is lower in energy than for any
other trivalent rare earth ion. This relatively low 5d configuration creates experimental
opportunities not available in other trivalent rare earth systems. This dissertation reports on
efforts to exploit these opportunities in two Ce3+ systems- the dilute Ce3+:LuP04, and the
fully concentrated CeF3.
Nonlinear wave mixing spectroscopy is a most appropriate method for studying the
electronic structure of trivalent cerium ions in insulating crystals. The electronic energy
levels of the ground 4f configuration lie in the infrared (0 - 3000 cm-1 ), while the states of
the first excited configuration, 5d, are usually in the ultraviolet (30000- 50000 cm-1 ). An
insulating crystal containing the Ce3+ ion usually remains transparent throughout the visible
region of the electromagnetic spectrum. Wave mixing spectroscopy enables access to these
1
high- and low-lying energy levels with visible lasers. The mixing of lightwaves at optical
frequencies is allowed by the fact that the complex electronic susceptibility of a material
deviates from a linear relationship with the applied electric field at sufficiently high
intensities. In this dissertation, pulsed lasers produce these high intensities. As a form of
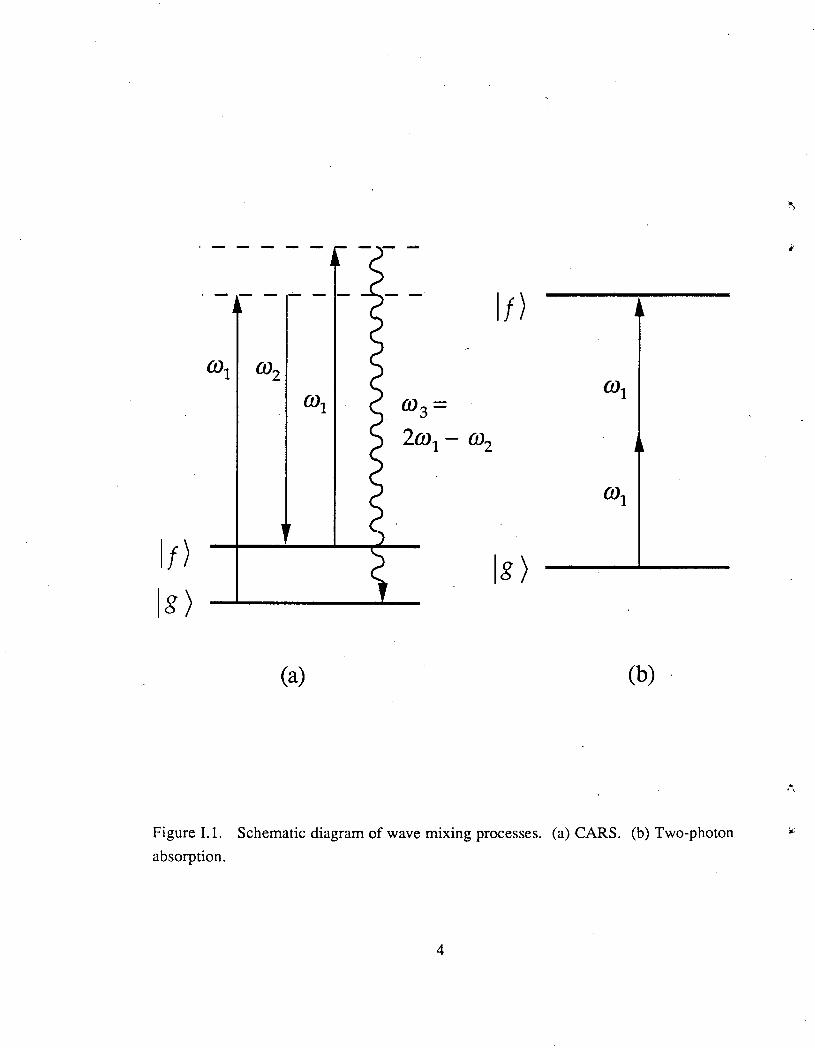
wave mixing, two-photon absorption enables a visible laser to probe ultraviolet electronic
levels by creating a material excitation wave whose frequency is twice that of the input
lightwave. (See Figure I.l (b).) In another form of wave mixing, material resonances are
detected when the difference in frequency between two input lightwaves is equal to the
energy of a low-lying state. This is known as coherent anti-Stokes Raman spectroscopy
(CARS). (See Figure I.l (a).)
The experiments are:
• Electronic Coherent Anti-Stokes Raman Spectroscopy. CARS is a
form of four-wave mixing in which two input lasers at frequencies COt and co2 interact
within a nonlinear medium to produce a third coherent beam at frequency 0>:3 = 2cot - ro2•
Resonances are observed in the signal at 0>:3 as (COt - ~) is swept through the electronic
energy levels of the Ce3+ ion. For most rare earth crystals, these resonances are very weak
due to the inherently small cross section for spontaneous electronic Raman scattering. The
strength of these resonances may be increased by using lasers near the strong 4f ~ 5d
parity allowed electric dipole transitions. When using near ultraviolet lasers 0-t = 355 nm,
"-2. == 385 nm), Ce3+:LuP04 exhibits strong CARS resonances when the anti-Stokes signal
(ffi:3) is nearly resonant with the lowest level of the 5d configuration at 30360 cm-1• These
resonances are an order of magnitude greater than those seen in pure rare earth crystals
which contain 2000 times more rare earth ions per unit volume. Due to the relatively low
energy of the 5d configuration in CeF3, electronic CARS experiments with visible lasers
(At == 476 nm, "-2. = 532 nm) show resonances an order of magnitude greater than in other
rare earth crystals containing approximately the same number of rare earth ions per unit
2
volume. The absolute strengths of these resonances were accurately predicted using the
Axe theory of two-photon processes with 4f ~ 5d absorption data. These experiments are
detailed in chapters 2 and 4.
• 4/ ~ Sd Two-photon Absorption. The simplest and most direct way to
investigate the nature of the 5d configuration in Ce3+:LuP04 is by two-photon absorption.
Although two-photon transitions between the 4/ and 5d configuratiOf!S are formally parity
forbidden (!11 = 1), they are allowed in second order by the odd parity components of the
crystal field. The intensity of the resulting 5d ~ 4f ftorescen~e as a function of laser
frequency and polarization determines the energies and symmetries of zero-phonon lines of
the 5d configuration. Results are given in Chapter 3.
• Simulated Electronic Raman Scattering. One of the original motivations
for this work was to determine if electronic Raman processes in rare earth crystals could. be
strong enough for the observation of stimulated electronic Raman scattering. Stimulated
electronic Raman scattering has been observed in atomic vapors, but not never involving
ions in crystals. No stimulated electronic Raman processes were observed in CeF3 • This
is discussed breifty in an appendix to Chapter 4.
3
·------ - It)
(01 (02
(01 (03= (01
2ro1- m2
(01
It) lg) lg)
(a) (b) .
Figure 1.1. Schematic diagram of wave mixing processes. (a) CARS. (b) Two-photon
absorption.
4
...
·..:
Chapter One
Optical Properties of Ce3+:LuP04 and CeF3
This chapter introduces the optical properties of Ce3+:LuP04 and CeF3 which are
the samples used in ~periments described in later chapters. A survey of the Ce3+ free ion
begins the chapter followed by sections dealing with the effects of introducing the Ce3+ free
ion into a crystalline environment. Finally, the optical properties of two specific Ce3+
systems- the CeF3 crystal and Ce3+ doped into the LuP04 crystal are given.
1.1 The Ce3+ Free Ion
-In order to understanding the Ce3+ ion in the condensed state, it is informative to
first review the properties of the Ce3+ free ion.
The rare earth elements span the periodic table from lanthanum (Z = 57) to lutetium
(Z = 71). In a solid state system containing rare earth ions, the rare earth ion usually exists
in the trivalent state. The electronic configuration of the trivalent rare earth ion in its ground
5
state is [Xe]4fn (n= 0, ... ,13). The first excited configuration is 4f<n-1)5d1 which usually
lies in the vacuum ultraviolet region (50000 cm-1 - 100000 cm-1). The 4f<n-1)6s1 and the
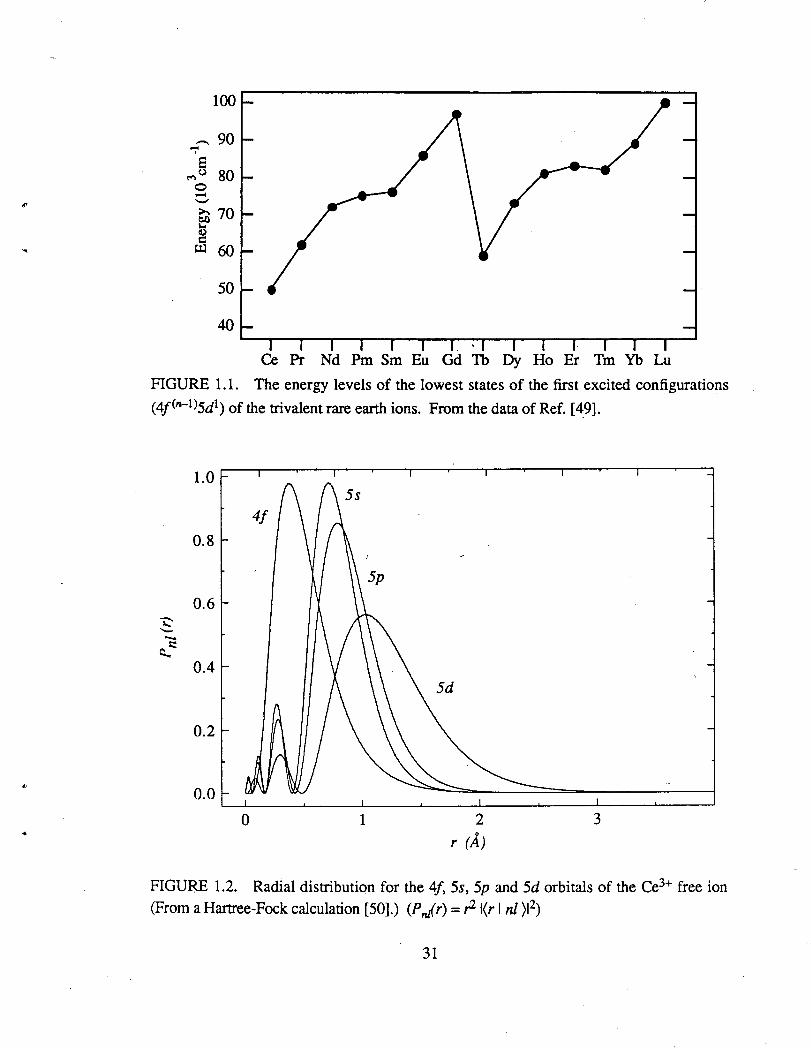
4j<n-1)6p1 configurations usually lie above 100000 cm-1. Figure 1.1 shows the lowest
levels of the various 4f<n-1)5d1 electronic configurations of the free trivalent rare earth ions
as one moves across the rare earth series. At the beginning of the series, the Ce3+ ion has
the lowest energy excited 4f(n-l)5d1 configuration.
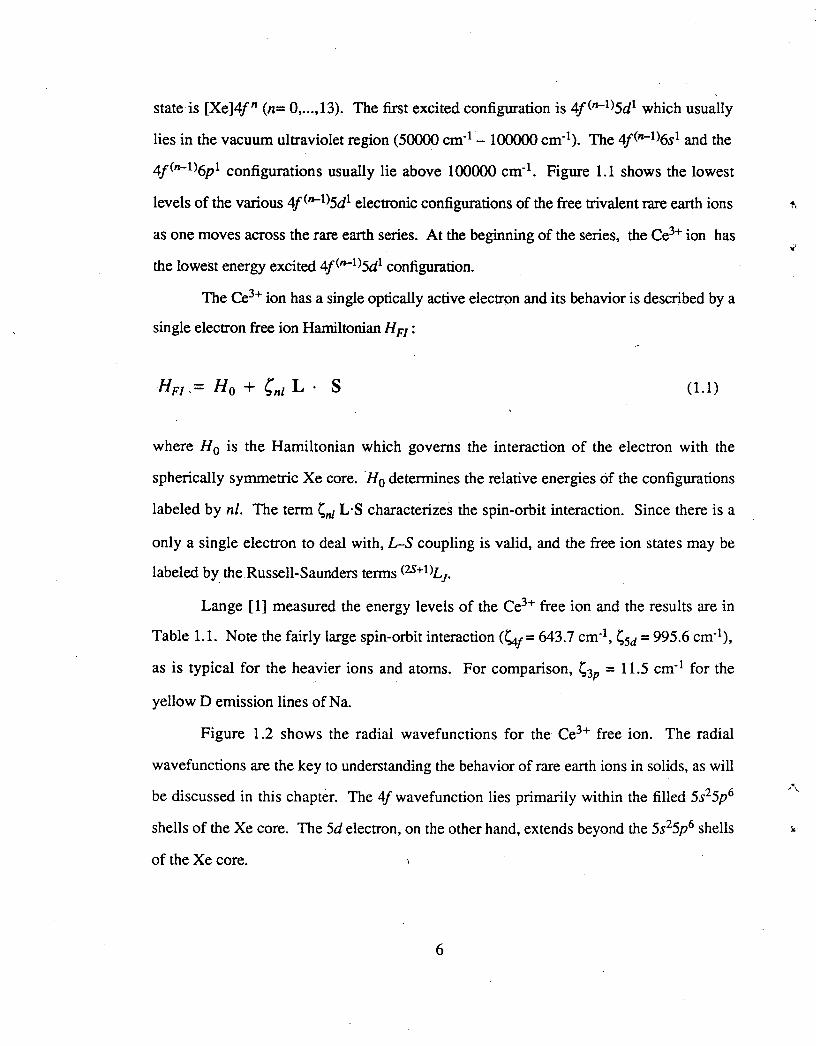
The Ce3+ ion has a single optically active electron and its behavior is described by a
single electron free ion Hamiltonian H FI :
Hn .= Ho + Cnl L · S (1.1)
where H 0 is the Hamiltonian which governs the interaction of the electron with the
spherically symmetric Xe core. H0 determines the relative energies of the configurations
labeled by nl. The term ~nl L·S characterizes the spin-orbit interaction. Since there is a
only a single electron to deal with, L-S coupling is valid, and the free ion states may be
labeled by the. Russell-Saunders terms (2S+l)£1.
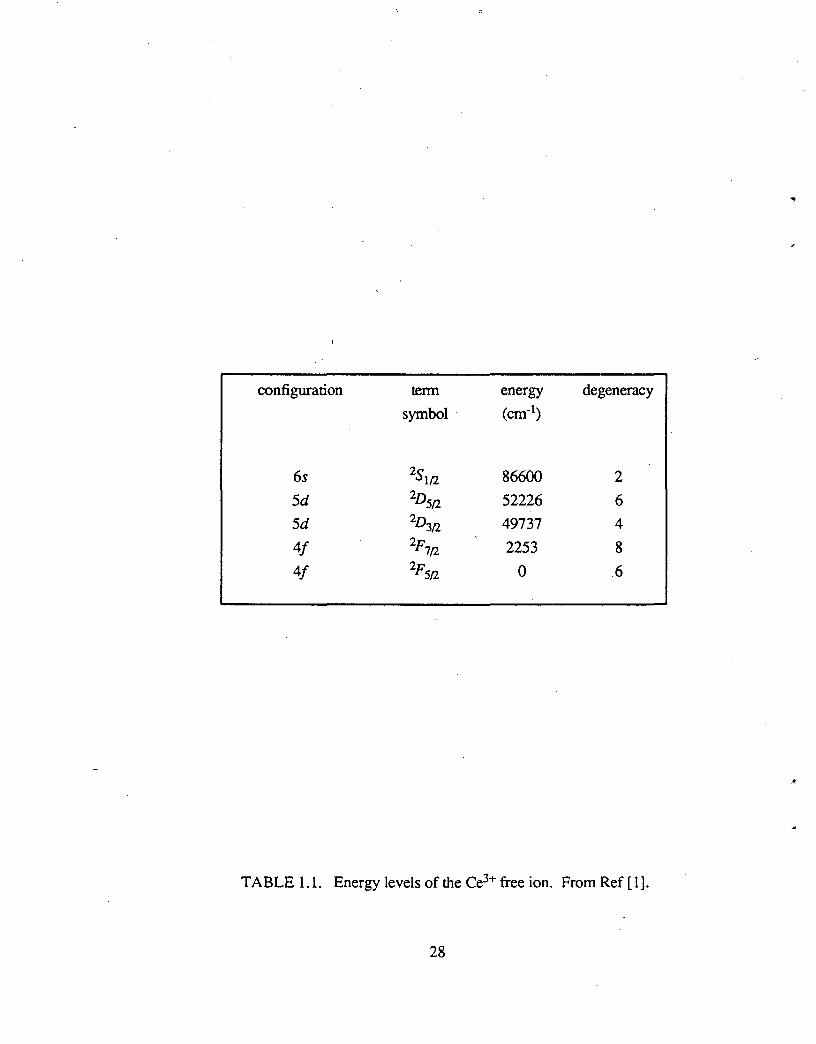
Lange [1] measured the energy levels of the Ce3+ free ion and the results are in
Table 1.1. Note the fairly large spin-orbit interaction (~1 = 643.7 cm-1, ~Sd = 995.6 cm-1 ),
as is typical for the heavier ions and atoms. For comparison, ~3P = 11.5 cm-1 for the
yellow Demission lines ofNa.
Figure 1.2 shows the radial wavefunctions for the Ce3+ free ion. The radial
wavefunctions are the key to understanding the behavior of rare earth ions in solids, as will
be discussed in this chapter. The 4f wavefunction lies primarily within the filled 5s25p6
shells of the Xe core. The 5d electron, on the other hand, extends beyond the 5s25p6 shells
of the Xe core.
6
1.2 _The Ce3+ Ion in a Crystalline Environment
The spectroscopy of the 4f n configuration of rare earth ions in crystals may be
divided into two parts - classical and modem. Classical rare earth spectroscopy deals with
the rare earth ion in a static crystalline environment. Atomic-like free-ion wavefunctions
describe the quantum state of the rare earth ion. The addition of a crystal field Hamiltonian
to the free ion Hamiltonian accounts for the introduction of the rare earth ion into a crystal
lattice. This classical model successfully explains energy level structures as well as
intensities of one- and two-photon optical transitions. Books by Judd [2], Wybome [3],
and Dieke [ 4] review this classical approach which is essentially an extension of atomic
physics. Modem rare earth spectroscopy is a branch of solid state physics. Such topics as
line broadening, electron-phonon interactions, energy transfer, and ion-ion interactions
view the rare earth ion as part of a collective solid state system. Books by Hufner [5], and
Kaplyanskii and Macfarlane [6] deal with these topics. The distinction between modem
and classical spectroscopy is somewhat artificial. For the practicing experimentalist, both
aspects are relevant
The spectroscopy of the excited 4f (n-l)5d1 configura~ion of rare earth ions in
crystals is less well known. There are two reasons for this. First, Figure 1.1 indicates that
these levels are in the ultraviolet region where many crystals are opaque. Secondly, inter
configurational4f H 5d transitions consist of broad(> 1000 cm-1), sometimes overlapping
bands making the exact location of 4j<n-l)5d1 levels a difficult task. In fact, the Ce3+ ion
with n=l, has the only really tractable 4f(n-l)5d1 configuration. It has not only the lowest \
energy configuration, but also is split into at most five levels by the effects of the crystalline
electric field. On the other hand, the number of levels in the 4J<n-l)5d1 configuration
increases rapidly as one moves toward the center of the rare earth series. For example, a
7
crystalline electric field may split the 4f(n-l)5d1 configuration of the Pr3+ ion (n=2) into as
many as 140 levels.
1.2.1 The 4/ Configuration
Figure 1.2 shows the radial extent of the 4/ wavefunction. The 4f electron exists
primarily within the filled 5s2 and 5p6 shells of the Xe core. This fact explains the success
of classical rare earth spectroscopy. Since the 4f electron is shielded from its local
environment, the effects of the crystal lattice are small, and the crystal field acts as a small
perturbation on the free ion states.
The crystal field Hamiltonian models the effect of introducing the free ion into the
crystal lattice. In the crystal field model, the Ce3+ ion is surrounded by a distribution of
charges which produce an electrostatic field at the site of the Ce3+ ion. The binding
between the ion and the surrounding ligands is assumed to be purely ionic and the ion does
not share charge with the surrounding ligand. The energy levels of the free ion are split by
the Stark effect. The effect of the crystal field on the 4f electron is small. Typical Stark
splittings are on the order of hundreds of cm-1• This accounts for a remarkable property of
rare earth crystals. The energy levels of the 4fn electrons are approximately the same in
any crystal environment- with the exception of the small crystal field (Stark) splittings.
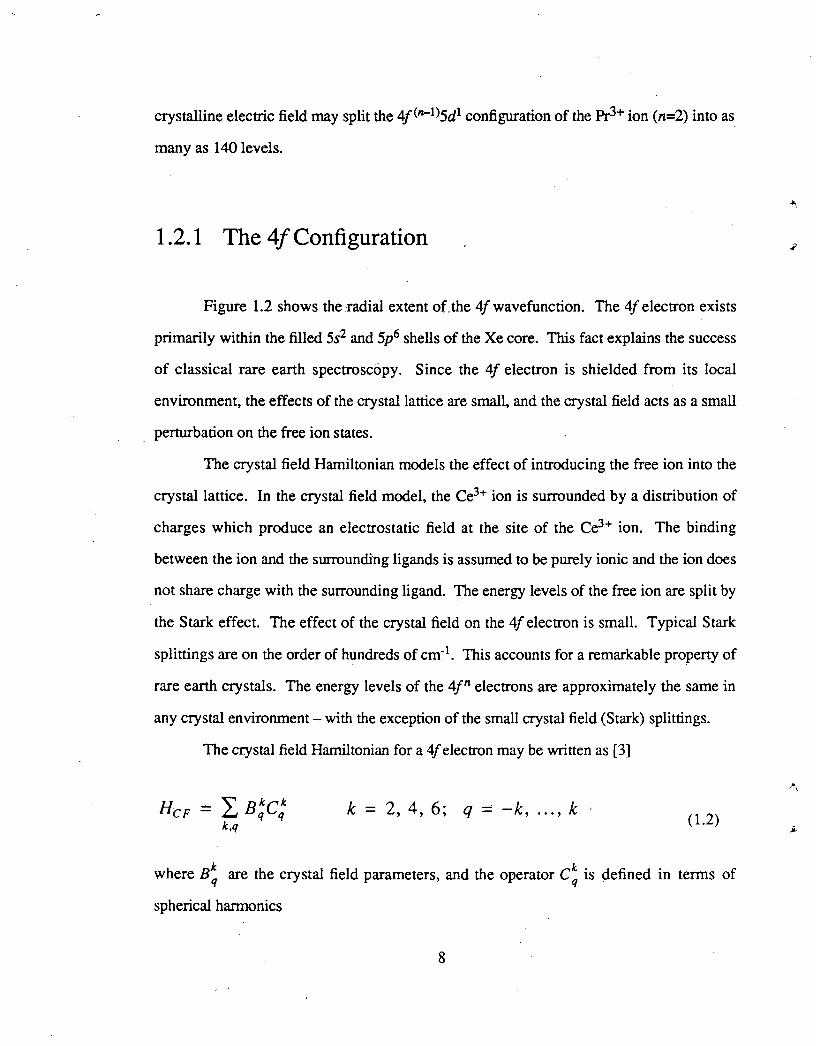
The crystal field Hamiltonian for a 4f electron may be written as [3]
k 2, 4, 6; q -k, ... , k ' (1.2)
where B! are the crystal field parameters, and the operator c! is defined in terms of
spherical harmonics
8
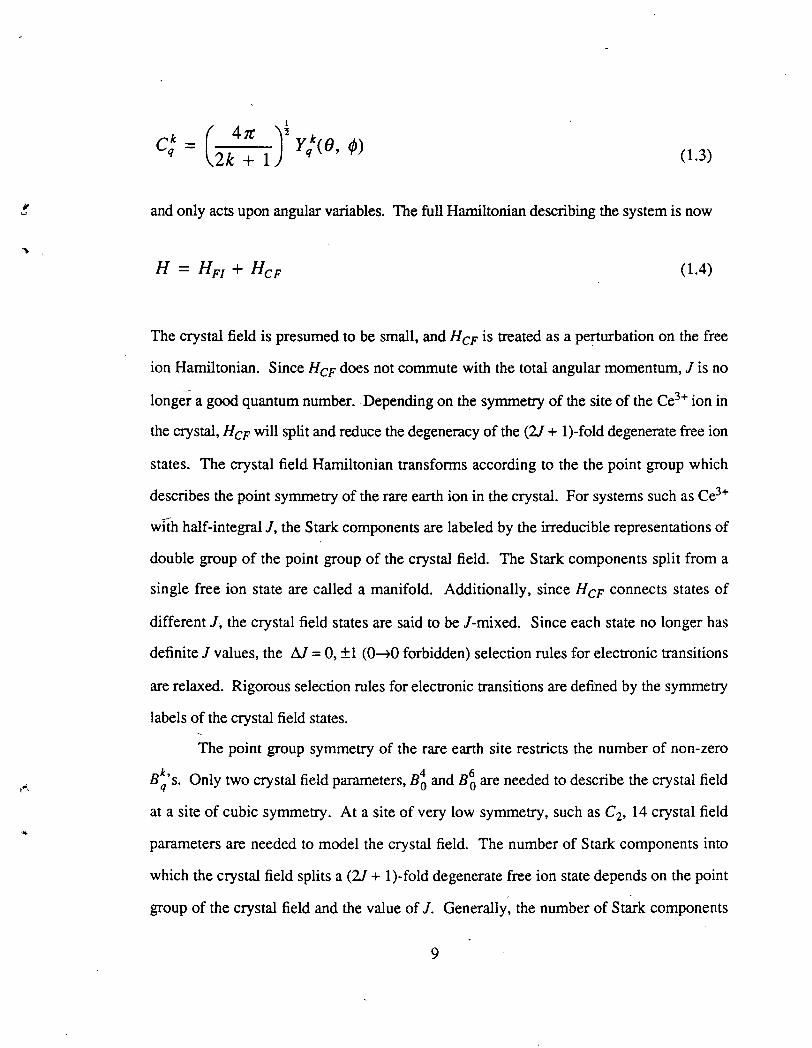
(1.3)
and only acts upon angular variables. The full Hamiltonian describing the system is now
H (1.4)
The crystal field is presumed to be small, and H CF is treated as a perturbation on the free
ion Hamiltonian. Since Hcp does not commute with the total angular momentum, J is no
longer a good quantum number. Depending on the symmetry of the site of the Ce3+ ion in
the crystal, Hcp will split and reduce the degeneracy of the (21 + I)-fold degenerate free ion
states. The crystal field Hamiltonian transforms according to the the point group which
describes the point symmetry of the rare earth ion in the crystal. For systems such as Ce3+
with half-integral J, the Stark components are labeled by the irreducible representations of
double group of the point group of the crystal field. The Stark components split from a
single free ion state are called a manifold. Additionally, since Hcp connects states of
different J, the crystal field states are said to be ]-mixed. Since each state no longer has
definite J values, the AI= 0, ±I (0~0 forbidden) selection rules for electronic transitions
are relaxed. Rigorous selection rules for electronic transitions are defihed by the symmetry
labels of the crystal field states.
The point group symmetry of the rare earth site restricts the number of non-zero
B:'s. Only two crystal field parameters, B~ and B~ are needed to describe the crystal field
at a site of cubic symmetry. At a site of very low symmetry, such as C2, 14 crystal field
parameters are needed to model the crystal field. The number of Stark components into
which the crystal field splits a (21 + I)-fold degenerate free ion state depends on the point
group of the crystal field and the value of J. Generally, the number of Stark components
9
increases as the symmetry of the crystal field is lowered. For systems with an odd number
of electrons (half-integral J) sue~ as Ce3+, Kramers' theorem demands that Stark levels
have at least two-fold degeneracy in any crystal field. Hence, a crystal field may split a J
state of a Kramers ion into a maximum of (21 + 1)/2 doubly degenerate levels. These
doubly degenerate levels are called Kramers doublets. Only the application of a magnetic
field (which destroys time-reversal symmetry) can split a Kramers doublet.
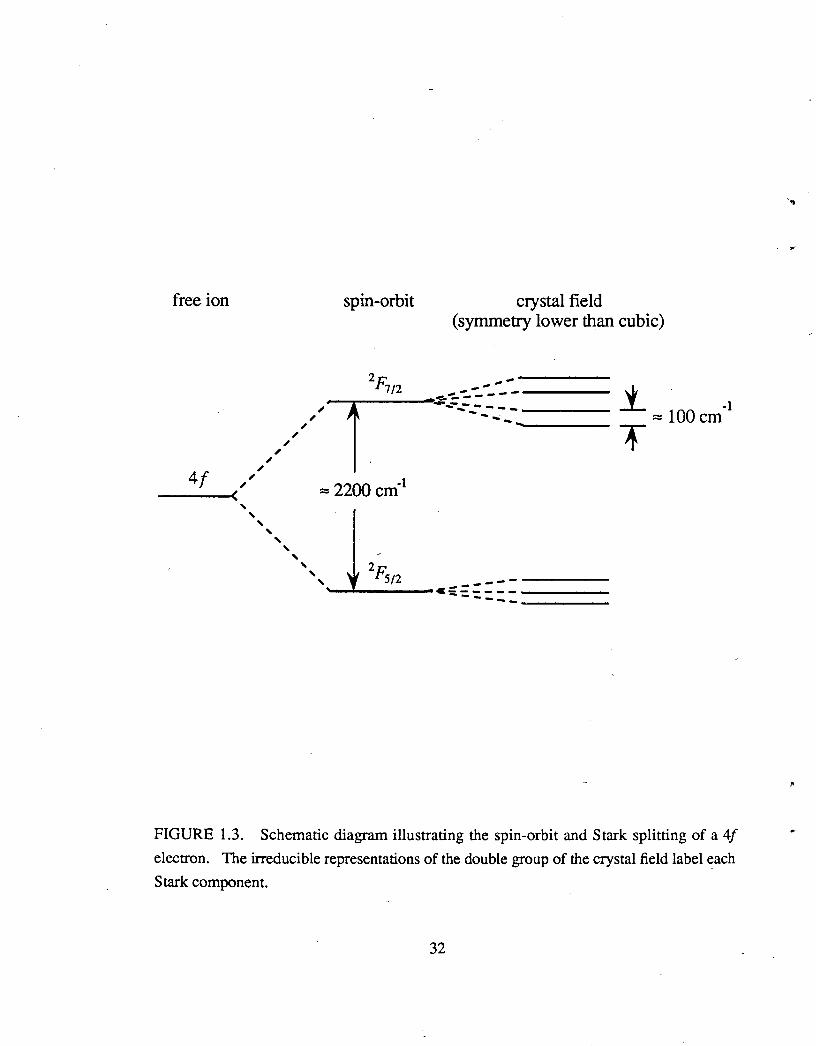
If the Ce3+ ion lies at a site in a crystal with a point group symmetry lower than
cubic, the crystal field will split the free _ion ground state, 2F 512, into three Kramers
doublets, and the 2F712 free ion state into four Kramers doublets. (See Figure 1.3.) Even
though J is no longer a good quantum number (the wavefunctions of the Stark components
of the 2F5a manifold may now be 98% 1=512 and 2% 1=7/2 in character), each manifold is
labeled by the dominant ]-component. The irreducible representations of the double group
describing the crystal field label each Stark component.
Crystal field theory can explain the location, symmetries, and number or Stark
components in terms of the addition of a small crystal field Hamiltonian to the free ion
Hamiltonian. No ab initio method of calculating crystal field parameters has yet proved
satisfactory. Crystal field parameters are derived from a least squares fit of the crystal field
Hamiltonian to experimental data. Using free ion wavefunctions as the basis set, the /
crystal field' Hamiltonian is diagonalized yielding a set of crystal field parameters and
angular wavefunctions for the Stark components. In the crystal field theory, the 4f radial
wavefunction of the free ion is unchanged, since the crystal field does not act upon radial
variables.
10
1.2.2 The 5d Configuration
The radial wave function of the 5d electron extends much further beyond the filled
5s25p6 shells of the Xe core than does the 4f electron. (See Figure 1.2.) This results in a
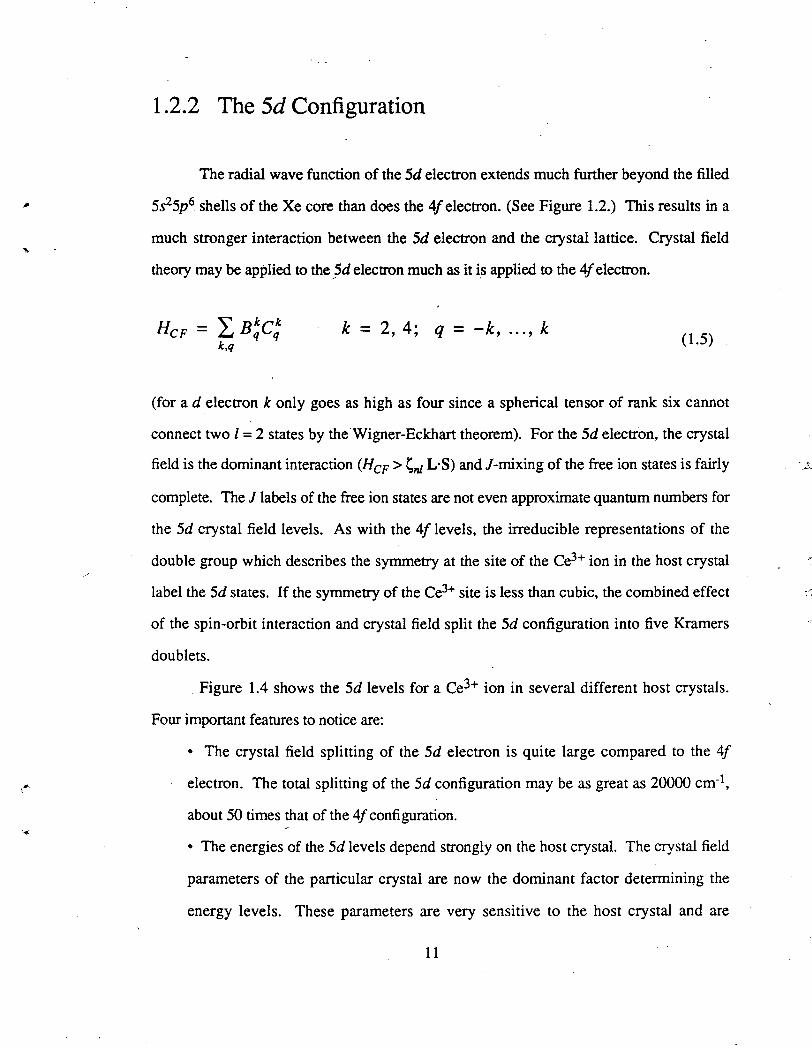
much stronger interaction between the 5d electron and the crystal lattice. Crystal field
theory may be applied to the /5d electron much as it is applied to the 4f electron.
k 2, 4; q -k, ... , k (1.5)
(for a d electron k only goes as high as four since a spherical tensor of rank six cannot
connect two l = 2 states by the Wigner-Eckhart theorem). For the 5d electron, the crystal
field is the dominant interaction (Hcp > ~nl L·S) and ]-mixing of the free ion states is fairly
complete. The J labels of the free ion states are not even approximate quantum numbers for
the 5d crystal field levels. As with the 4/ levels, the irreducible representations of the
double group which describes the symmetry at the site of the Ce3+ ion in the host crystal
label the 5d states. If the symmetry of the Ce3+ site is less than cubic, the combined effect
of the spin-orbit interaction and crystal field split the 5d configuration into five Kramers
doublets.
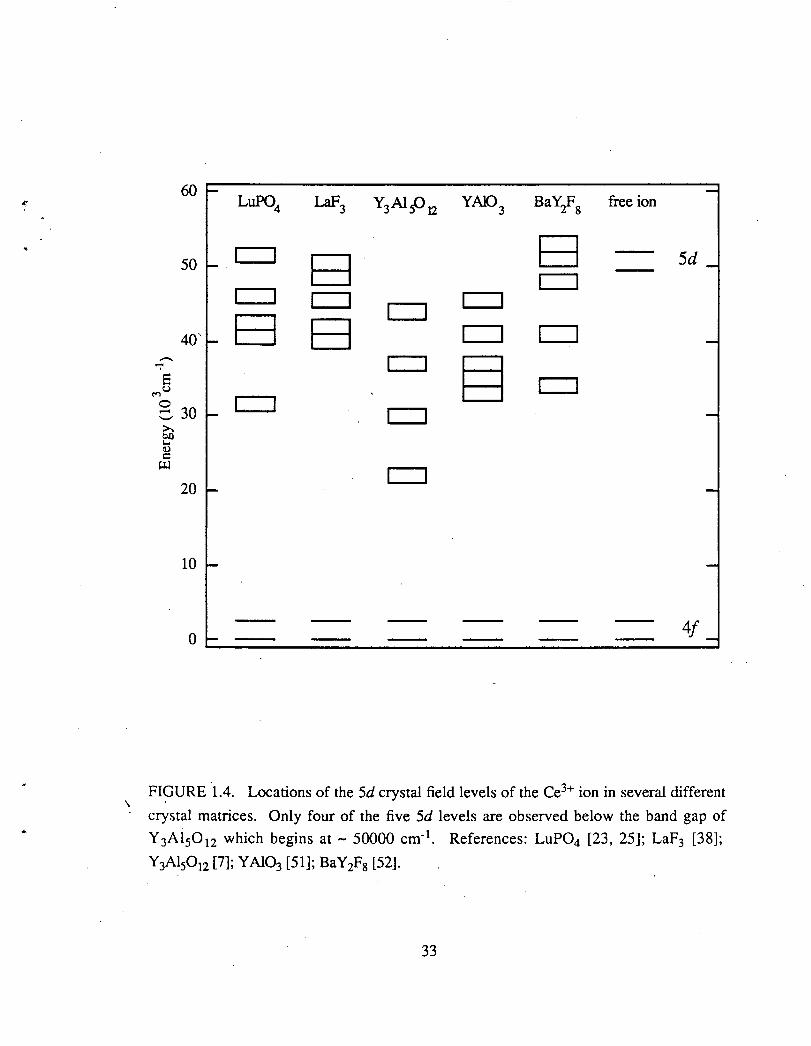
Figure 1.4 shows the 5d levels for a Ce3+ ion in several different host crystals.
Four important features to notice are:
• The crystal field splitting of the 5d electron is quite large compared to the 4/
electron. The total splitting of the 5d configuration may be as great as 20000 cm-1,
about 50 times that of the 4/ configuration.
• The energies of the 5d levels depend strongly on the host crystal. The crystal field
parameters of the particular crystal are now the dominant factor determining the
energy levels. These parameters are very sensitive to the host crystal and are
11
responsible for the wide variation of 5d spectra. The onset of the 5d configuration
varies from about 21000 cm-1 in YAG (Y3Al5012,) [7] to 38700 cm-1 in LaF3 [8].
• Unlike the 4flevels, the 5d levels are broad(> 1000 cm-1) bands. This is due to
the stronger coupling of the 5d electron to the phonons of the host crystal. This is
explained in detail in the next section.
• In a simple model where a distribution of point charges represent the crystal lattice,
one expects the center of gravity of the 5d configuration to increase since the radially
extended 5d electron is attracted to the positively charged neighbors. lp real rare earth
systems, the center of gravity of the 5d configuration is lower in a crystalline
environment than in the free ion. A key issue then is the inadequacy of the
description of the neighboring ligands by a purely electrostatic crystal field. The
interaction between the Ce3+ ion and the neighboring ligands is actually a good deal
more complicated, and the reader is referred to articles by Aull and Jenssen [9, 10]
-for more details.
One may expect the crystal field model to be less satisfactory in describing the 5d
configuration than the 4f configuration. Ionic bonding is a good approximation for the
shielded 4/ electron, but the radially extended 5d electron may share charge with the
surrounding ligands. Ford electron systems (usually transition metal ions), ligand field
theory is often used and the electronic charge may transfer between the metal ion and the
neighboring ligands. In this case, the ligand field states are a linear combination of the d
electron and the ligand states, and the distinct I = 2 character of the crystal field state is lost
[11]. In this dissertation, the 5d states are modeled by the empirical crystal field theory
since it less complicated, and it provides a convenient starting point for the treatment of the
5d electron.
12
....
1.2.3 4/ H 5d Transitions
The two main differences between intra-configurational 4f H 4f transitions and
inter-configurational 4f H 5d transitions are in strength and linewidth.
Electric dipole transitions between states in the same electronic configuration are
forbidden by parity. If a rare earth ion sits at a crystal site that lacks inversion symmetry,
the odd components of the crystal field Hamiltonian can mix excited states of opposite
parity (such as the 5d) with the 4f states to allow relatively weak second-order "forced
electric dipole" transitions. These transitions typically have oscillator strengths on the
order of 10·6 to 10·8 which are still large enough to dominate over magnetic dipole
transitions which have oscillator strengths on the order of 10·8• Electric dipole transitions
between the 4f and 5d configurations are parity allowed (~l = 1). Thus, 4f H 5d
transitions have large oscillator strengths oo-1 to 10"2) and the 5d states have a
correspondingly short radiative lifetime (-10-8 s). 4f states have much longer radiative
lifetimes (l0-3 to 10·6 s) which make crystals containing rare earth ions good materials for
Q-switched lasers operating on 4f H 4f transitions.
The rest of this section deals with the spectral features of 4f H 5d transitions.
Unlike 4f H 4f transitions which are characterized by relatively narrow (< 10 cm-1)
spectral lines, 4f H 5d transitions are broad band (> 1000 cm·1) and exhibit a Stokes shift
between the peaks of the absorption and emission band. These features may be understood
in terms of the configurational coordinate model.
The configurational coordinate model takes into account the interaction between the
electronic states of the impurity ioh and the vibrations (phonons) of the host crystal. For
simplicity, only the totally symmetric "breathing mode" of the lattice is considered. This
is the motion in which the surrounding lattice moves in and out about the impurity ion and
13
may be described by a single normal coordinate Q. The interaction of the electronic states
with this mode is usually much greater than with the other vibrational modes [12].
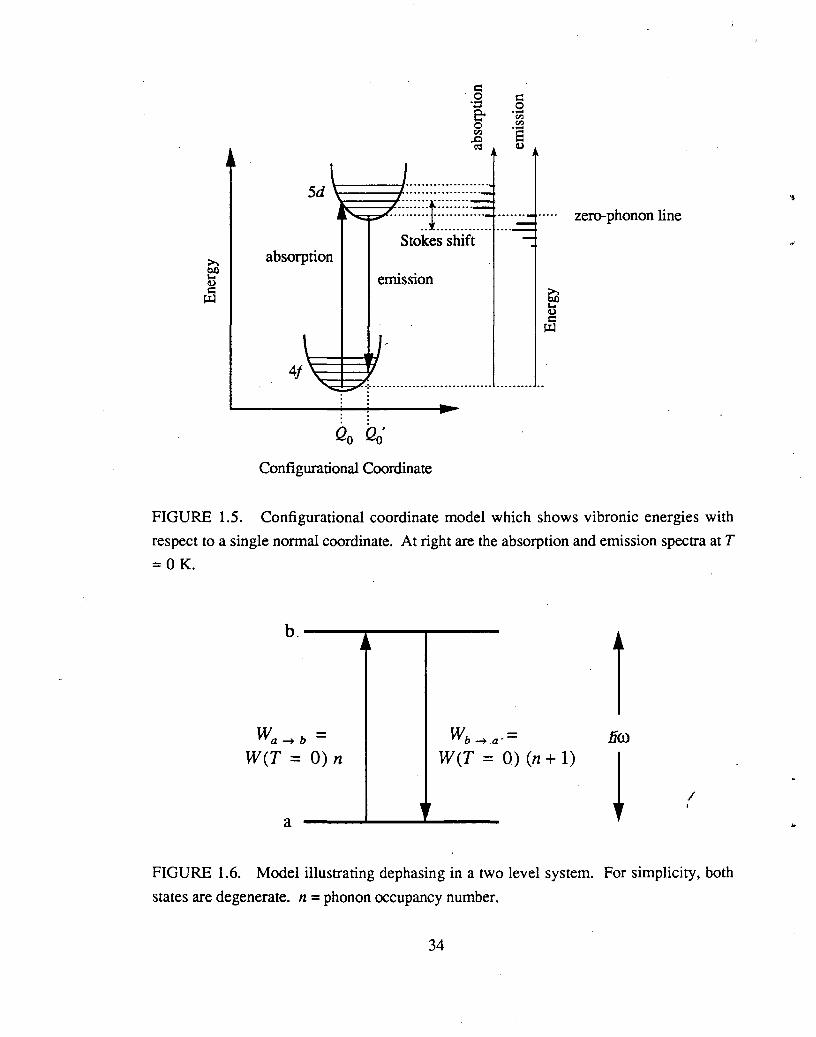
Figure 1.5 shows the configurational coordinate diagram in which the electronic
and vibrational energy levels are shown. In the ground electronic state ( 4/ ), the
configurational coordinate has an equilibrium value Q0. When the ion is in the 5d state, the
configurational coordinate average value is Q0'. The difference between Q0 and Q0' is
related to the relative sensitivity of the 5d and 4f states to the motion of the host lattice.
Again refer to Figure 1.2. The 4/ electron is shielded, and it is not very sensitive to
changes in the crystal environment. Figures 1.2 and 1.4 indicate that the radially extended
5d electron is quite sensitive to changes in the local environment.
In the Born-Oppenheimer approximation, I 'V) I x,J describes the state of the ion
lattice system. The ket I 'V> describes the electronic state and I xJ describes the vibrational
state of the lattice which may be treated as a harmonic oscillator with quantum number n.
In this simple model, one assumes that the oscillator force constant is the same for both the
ground and excited states. In the Condon approximation, the electric dipole matrix element
may be written as
(4/ I (Xn I r I Xm) I Sd) (4/ I r I Sd)(Xn I Xm) (1.6)
If (Q0 - Q0 ') = 0 (which is a good approximation for the case when both the ground and
excited states are in the 4f configuration), then (Xn I Xm) is non-zero only when n=m.
When Q0 and Q0' are different, (Xn I Xm) may be non-zero for a range of m and n values,
resulting in transitions between different vibrational quantum numbers.
If the temperature of the system is zero, only the 14/) I Xn=o) state is populated.
The absorption spectrum (Figure 1.5) shows a zero-phonon line corresponding to the
purely electronic (n = 0 ~ m = 0) transitions~ and a vibronic sideband corresponding to n
14
,•
..
= 0 ~ m > 0 transitions. The shape of the absorption band depends on the Franck
Condon factors <xn I x,J. which depend on (Qo- Qo '), which depends on the difference in
sensitivity between the electronic states to the vibrating local environment
After absorption at zero temperature, the excitation rapidly decays to the lowest
vibrational level of the excited electronic state. The emission spectrum is the mirror image
of the absorption with a zero-phonon line and a vibronic sideband. The difference between
the peaks of the absorption and emission spectra is called the Stokes shift. The greater the
difference in vibronic coupling between the ground and excited states, the greater the
Stokes shift.
. The vibrations of the totally symmetric mode usually dominate, but all even parity
phonons (both acoustic and optical, throughout the Brillouin zone) contribute to the 4f H
5d vibronic sideband. Thus, the use of a single breathing mode vibration to represent the
full spectrum of lattice phonons is crude. Actual vibronic sidebands are more complex (and
perhaps more interesting) than those shown in Figure 1.5, reflecting the richness of the full
phonon spectrum.
1.3 Line Broadening in Rare Earth Systems
The line broadening of the Stark levels occur due to mechanisms which have their
source in the nature of the crystal lattice. This section reviews both homogeneous and
inhomogeneous line broadening mechanisms since they will be important for interpreting
the results of later chapters. The reader is referred to review articles by Macfarlane [13],
and Macfarlane and Shelby [14] for further detail.
In systems which are inhomogeneously broadened, individual ions (or atoms) have
slightly different energy levels, thereby broadening the overalllinewidth of the system as a
15
whole without increasing the linewidth of the individual ions. A narrow band laser may
selectively excite only a subset of ions in the collection, and "bum a hole" in the
inhomogeneously broadened spectrum. The most familiar form of inhomogeneous
broadening is Doppler broadening, in which each atom has a different resonant frequency 'll
depending on its relative velocity.
Crystal imperfections are the major source of inhomogeneous broadening in rare
earth crystals. In an imperfect crystal, each rare earth ion may see a slightly different
crystal field, and consequently undergo a slightly different Stark splitting. The extreme
case is an impurity ion in a glass. Here there is no long range order and each impurity may
be surrounded by a very different charge distribution. The resulting inhomogeneous
linewidths may be as great as hundreds of cm-1 - greater than the Stark splitting. The
random introduction of an impurity ion.into the host crystal actually destroys the crystal
symmetry. As the doping increases, some impurity ions may experience a crystal field
which may be perturbed by the presence of another nearby impurity ion. If the impurity
ion is not same size as the ion for which it substitutes, the crystalline lattice may be
distorted at the site of the impurity. These effects may be minimized in very dilute crystals.
If nearest impurity neighbors are separated by several lattice sites, they have a small effect
on the crystal field, and the effect of random strain on the lattice by size mismatch is local
and constant. Typical inhomogeneous linewidths for 4/ H 4/ transitions in dilute rare
earth crystals are 1 to 10 GHz (0.03 to 0.3 cm-1). Since this inhomogeneous "strain"
broadening is related to the strength of the·crystal field, 5d elec~ons should have much
larger(- 50 times) inhomogeneous linewidths.
The previous section indicates that 4f H 4/ electric dipole transitions have lifetimes
on the order of w-3 to w-6 s. This implies a (homogeneous) lifetime broadening between 1
kHz and 1 MHz, much smaller than the inhomogeneous strain broadening. In real systems
at finite temperatures, non-radiative effects shorten the lifetimes. In fact, all experiments
16
...
reported in this dissenation are performed at low temperature (-3.8 to 10 K) to minimize
line broadening due to non-radiative effects.
Consider the two levels system in Figure 1.6. If the system is coupled to a crystal
lattice, transitions between a and· b may occur via absorption and emission of phonons.
For transitions from b to a the transition probability is
W(T O)(n + 1) (1.7)
where n is the occupancy number of phonons with frequency ro, and W(T = 0) is the
spontaneous emission probability at zero temperature. For transitions from a to b the
transition probability is
W(T 0) n (1.8)
As T --70, n--70 and spontaneous emission from b to a dominates. State b is lifetime
broadened to a much greater extent than state a.
The factor W(T = 0) is proportional to t~e phonon density of states. The phonon
density of states has a major influence on non-radiative decay processes. In the Debye
approximation, the density of states for acoustic phonons has a cutoff, and W(T=O) is zero
for ro > Oloebye· Typical Debye energies are in the range of hundreds of cm-1. If a and b
are separated by more than 1iroDebye• the lifetime of b will be fairly long, since decay can
occur only by the simultaneous emission of two or more acoustic phonons, a rarer process.
Unlike the acoustic phonon density of states which is a continuum, the optical
phonons usually exist in several well defined energy ranges. Additionally, optical phonons
often have energies greater than the Debye energy. Optical phonons may have energies as
higl} as thousands of cm-1•
17
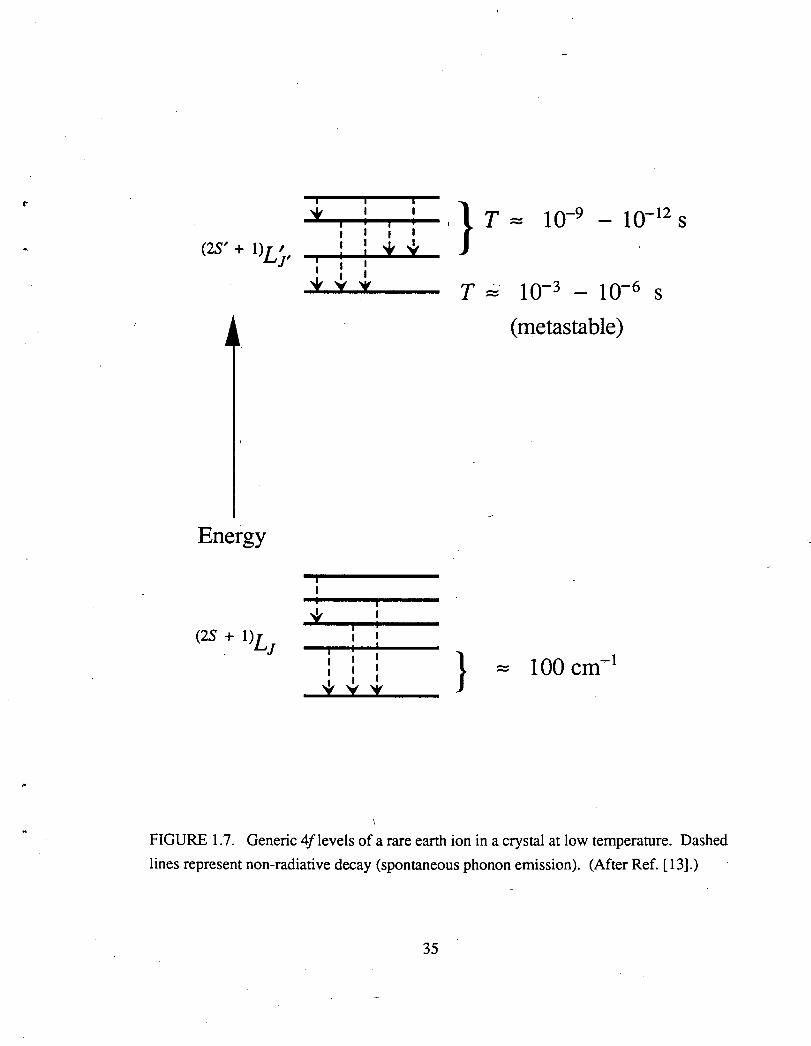
Figure 1. 7 illustrates the lifetimes for a generic rare earth system at low
temperature. Two manifolds (2S+l)£1 and (2S'+l)L'r may be separated by several thousand
cm-1. In each manifold the upper states decay rapidly to the lowest state by the
spontaneous emission of a phonon. Intra-manifold non-radiative decay is usually
dominated by acoustic phonons. Inter-manifold non-radiative transitions are dominated by
the higher energy optical phonons. If the manifolds are separated by more than the energy
of a single optical phonon, non-:radiative decay may take place by the spontaneous emission
of two or more optical phonons. The decay rate is related to the effective number of optical
phonons involved in the transition. If the number is high then non-radiative decay is
unlikely, and radiative decay (fluorescence) dominates. If the number is low (usually
below three), then non-radiative decay dominates. In other words, fluores~ence may only
be observed between manifolds that are separated by more than a few optical phonon
energies. The result is that the lowest state in a manifold will have little lifetime broadening
compared to the upper levels of the same manifold. Typical inhomogeneous linewidths for
the upper levels range from tenths to tens of cm-1• The lowest level in the manifold may
then be a metastable state, and primarily inhomogeneously broadened by crystal
imperfections.
As the concentration of rare earth ions in a crystal increase, ion-ion interact~ons
increase homogeneous broadening for all Stark levels. This type of broadening is similar
to collisional broadening in atomic systems. These ion-ion interactions, which arise from
magnetic dipole fluctuations among near,by rare earth ions, lead to homogeneous linewidths
on the order of one to five cm·1 in pure rare earth crystals.
18
-,
..
1.4 Ce3+:LuP04
ce3+:LuP04 is the first cerium system which I investigated. Compared to other rare
earth crystals, relatively little work has been done on this system. Traditionally, Ce3+
doped crystals have not been of great interest to rare earth spectroscopists since they are
transparent in the visible. The host crystal, LuP04, is uncommon since lutetium, one of its
constituent elements, is quite expensive. More common is the naturally occurring xenotime
crystal (YPO.J. The ionic radii of Y3+ (0.93 A) and Lu3+ (0.93 A) are nearly equal and the
crystal structures are very nearly the same. Since the nearby PO!- complexes have the most
influence on the crystal field experienced by the impurity ion, the electronic structure of the
Ce3+ ions in both host crystals is similar.
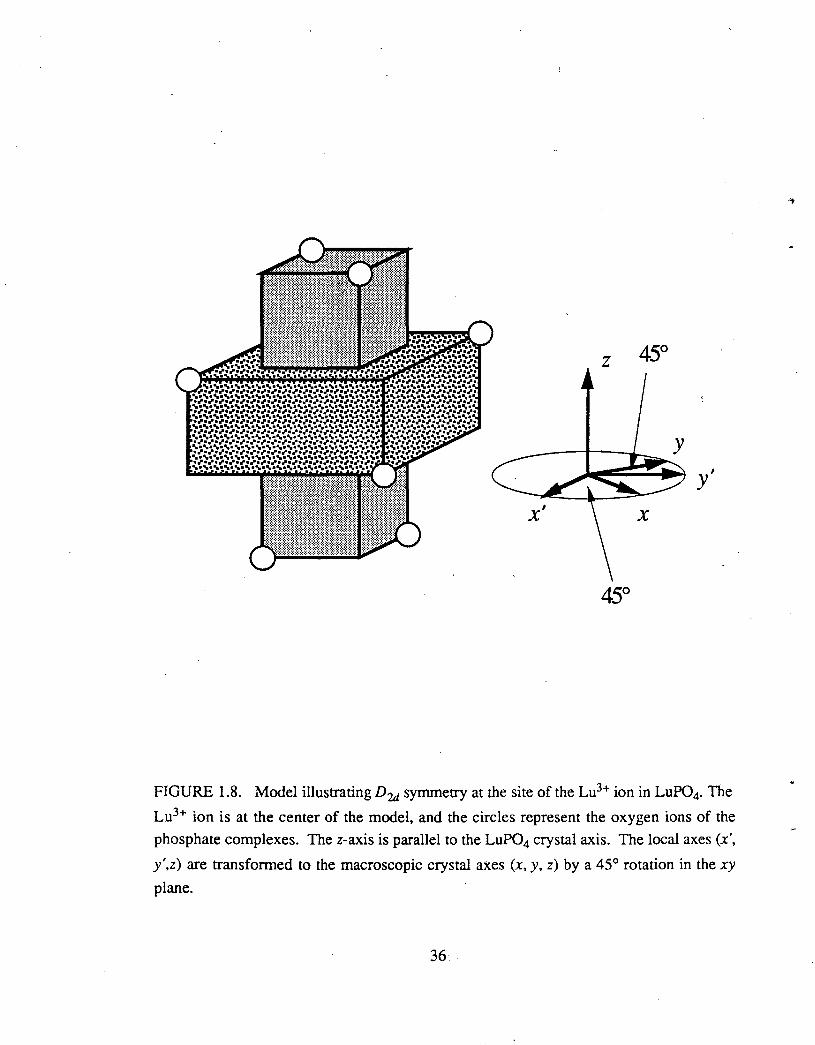
The host crystal, LuP04, is uniaxial with the tetragonal zircon structure. The space
group of the lattice is D~ and the point group symmetry of the Lu3+ site is Du [15]. The z
axis is parallel to the highest symmetry crystal axis. All Lu3+ sites are equivalent. The
nearest neighbors of the Lu3+ ion are eight ()2- ions. (See Figure 1.8.) Four of the o2-
ions are at a distance o£"2.263 A, while the other four are at a distance of 2.346 A [16].
'The nearest neighbor Lu3+ ion is 3.708 A away. The density of LuP04 is 6.508 g cm-3
[ 17], and the number density of Lu3+ ions is 1.465 x 1022 cm-3•
· Because LuP04 is not a common crystal, the optical properties have not been
thoroughly studied. However, LuP04 should not be very different from the more common
YP04 and YV04 crystals. LuP04 is an insulator with a band gap of- 70000 cm-1 [18],
and is birefringent with ne (= nz) = 1.728 and n 0 (= nx = ny) = 1.694 at 520.8 nm [19].
The energies of optical phonons in LuP04 may be as high as- 1100 cm-1, due to the local
vibrational modes of the phosphate complex [20]. The Debye energy of LuP04 at 300 K is
300 cm-1 [19].
19
Early experiments by Hoshina and Kuboniwa [21] and Nakazawa and Shinoya [22]
measured the electronic structure of Ce3+ doped into LuP04 from 5d ~ 4f emission and
excitation spectra. Since the emission bands to the various 4f Stark levels overlap, there
was some confusion as to the energies and symmetries of the 4/ levels. More recently,
Williams, et al . . [23-25] made a detailed examination of the ground 4f configurat-ion by
electronic Raman scattering and the excited 5d configuration by absorption measurements.
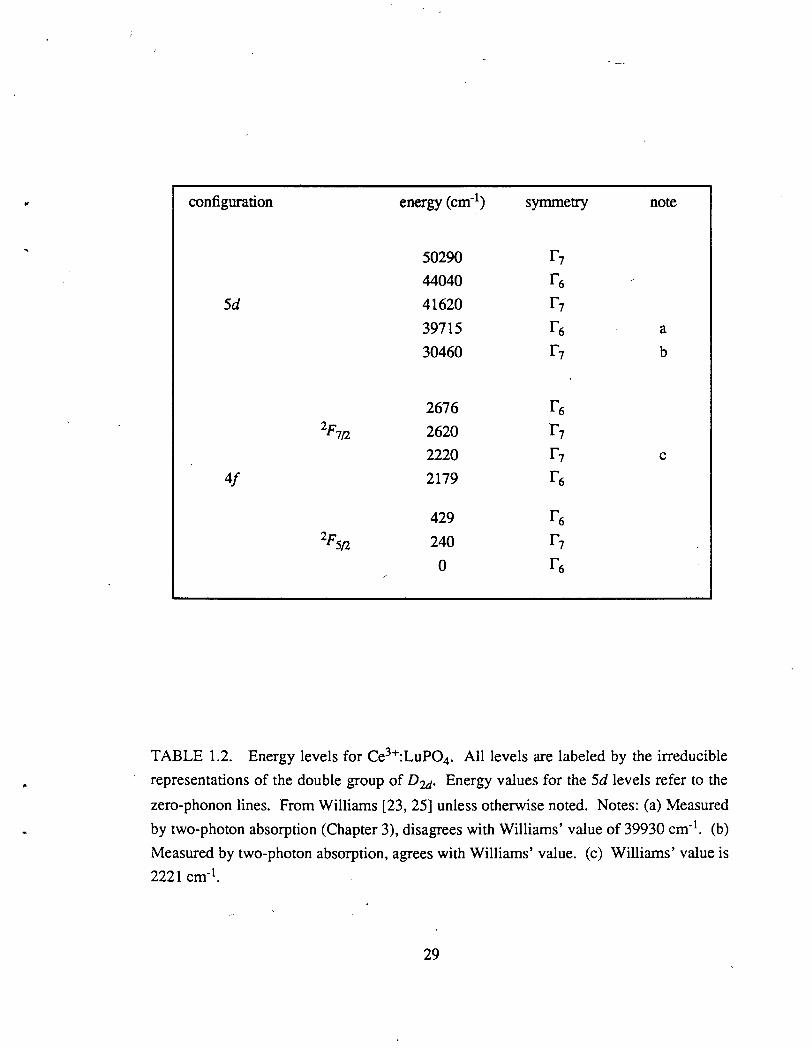
Their results are shown in Table 1.2. They also fit the energy levels of the 4f and 5d
co~guration to the empirical crystal field Hamiltonian, and derived angular wavefunctions
for levels of both the 4f and 5d configurations.
The Ce3+ ion has a larger ionic radius (1.07 A) than Lu3+. Due to this size miss
match the high doping concentrations of the Ce3+ ion tend to change the LuP04 crystal
structure. The crystal Ce)...u(t-xf04 has the tetragonal zircon structure for small x and the
monoclinic "monazite" structure for x"" 1. At low concentrations, the Ce3+ ions substitute
for the Lu3+ ions at sites of D2d symmetry. Since the Ce3+ ion has an odd number (one) of
optically active electrons, the Stark components are labeled ·by the irreducible
representations of the double group of Du, r 6 and r 7• Each Stark component is a
Kramers doublet
Selection rules for electric dipole transitions between states in D2d symmetry are:
r 7 Hr7
r 6 HT6
r 6 Hr7
allowed when electric field is polarized in the x (= y) direction.
allowed when electric-field is polarized in the x (= y) direction.
allowed when electric field is polarized in the z or x (= y) direction.
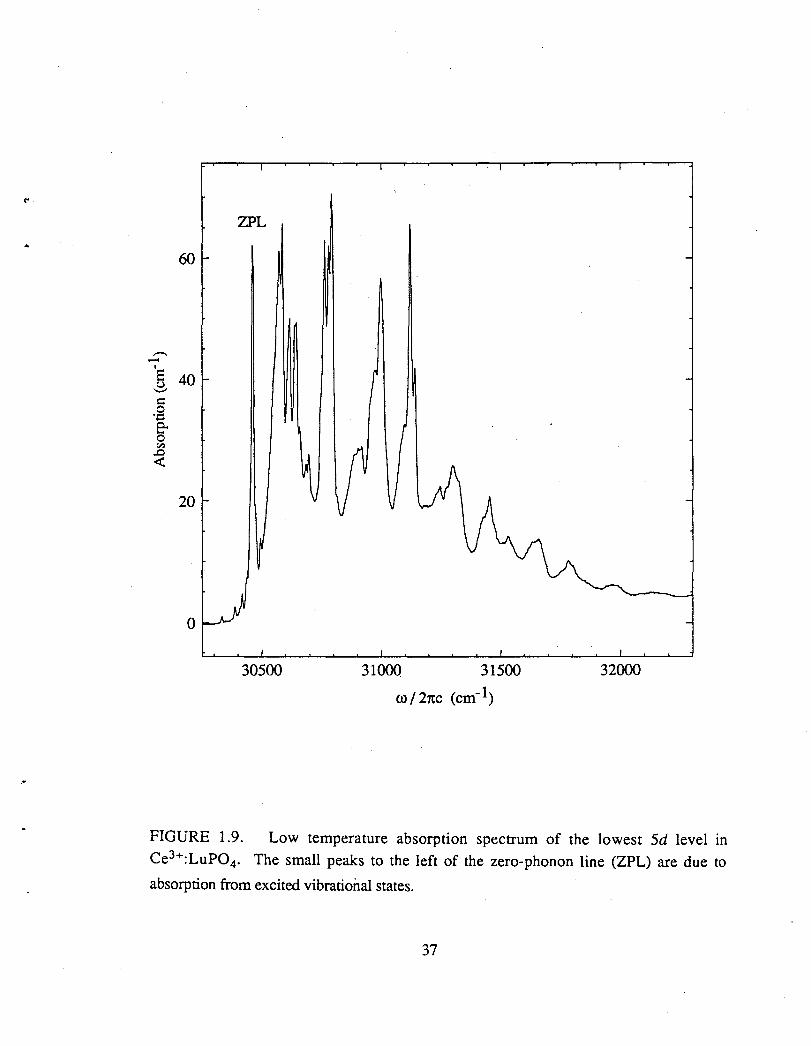
The nature of the lowest 5d band is of primary importance in the experiment
described in Chapter 2. The absorption spectrum is shown in Figure 1.9. This is very ·
similar to that recorded by Hoshina and Kuboniwa[21]. They measured the zero-phonon
20
...
...
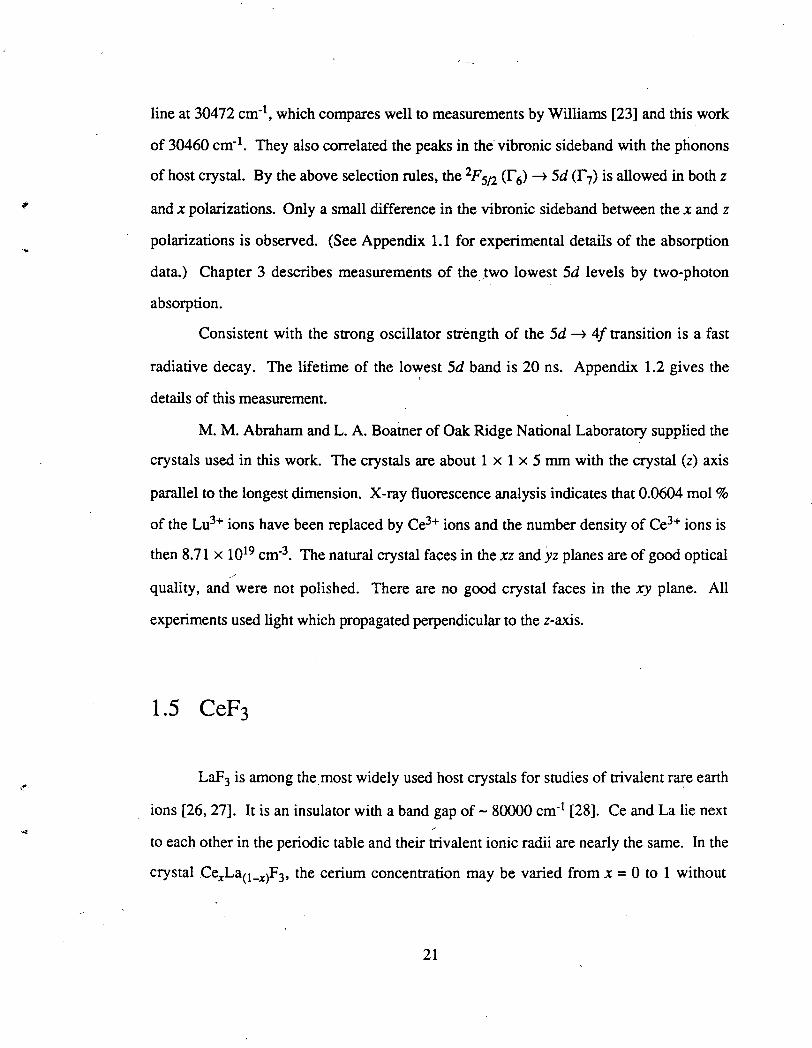
line at 30472 cm·1, which compares well to measurements by Williams [23] and this work
of 30460 cm·1. They also correlated the peaks in the vibronic sideband with the phonons
of host crystal. By the above selection rules, the 2F512 (r6) ~ 5d (r7) is allowed in both z
and x polarizations. Only a small difference in the vibronic sideband between the x and z
polarizations is observed. (See Appendix 1.1 for experimental details of the absorption
data.) Chapter 3 describes measurements of the )wo lowest 5d levels by two-photon
absorption.
Consistent with the strong oscillator strength of the 5d ~ 4/ transition is a fast
radiative decay. The lifetime of the lowest 5d band is 20 ns. Appendix 1.2 gives the
details of this measurement.
M. M. Abraham and L. A. Boatner of Oak Ridge National Laboratory supplied the
crystals used in this work. The crystals are about 1 x 1 x 5 mm with the crystal (z) axis
parallel to the longest dimension. X-ray fluorescence analysis indicates that 0.0604 mol%
of the Lu3+ ions have been replaced by Ce3+ ions and the number density of Ce3+ ions is
then 8. 71 x 1019 cm·3• The natural crystal faces in the xz and yz planes are of good optical
quality, and were not polished. There are no good crystal faces in the xy plane. All
experiments used light which propagated perpendicular to the z-axis.
1.5 CeF3
LaF3 is among the most widely used host crystals for studies of trivalent rru;e earth
ions [26, 27]. It is an insulator with a band gap of- 80000 cm·1 [28]. Ce and La lie next
to each other in the periodic table and their trivalent ionic radii are nearly the same. In the
crystal CexLa(l-x)F3, the cerium concentration may be varied from x = 0 to 1 without
21
altering the crystal structure. Tysonite, a naturally occurring mineral, with x = 0.5 is found
in the Pikes Peak region in Colorado [29].
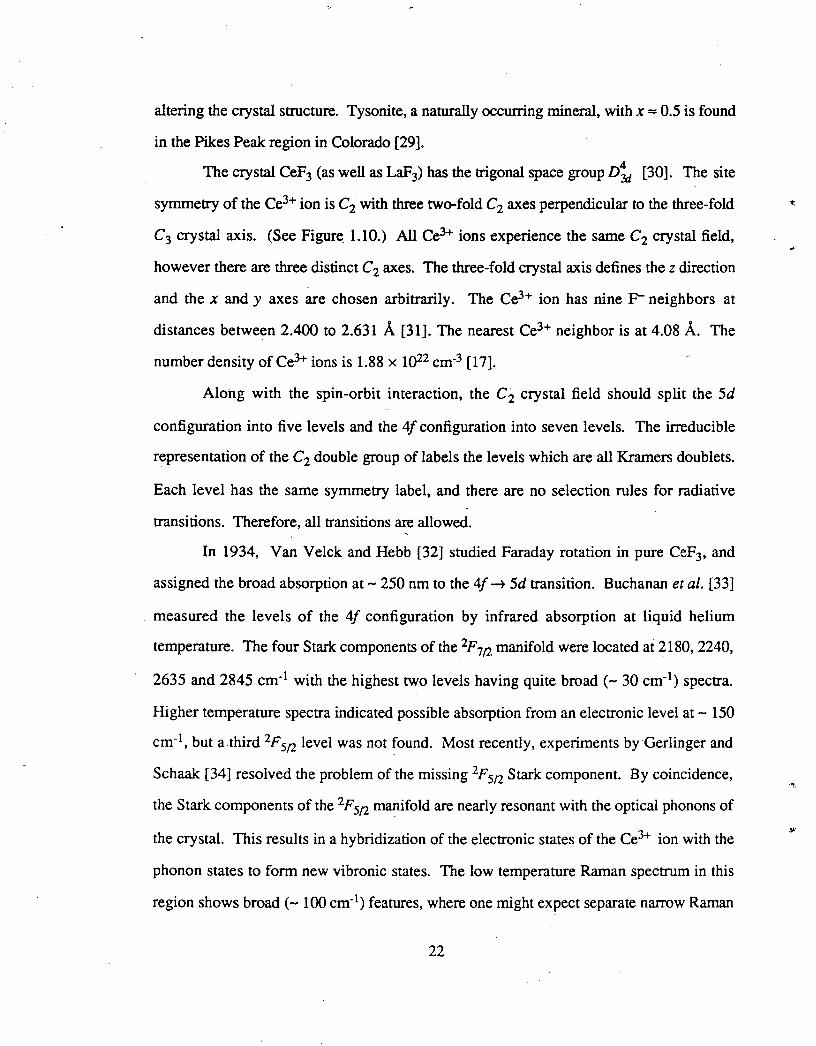
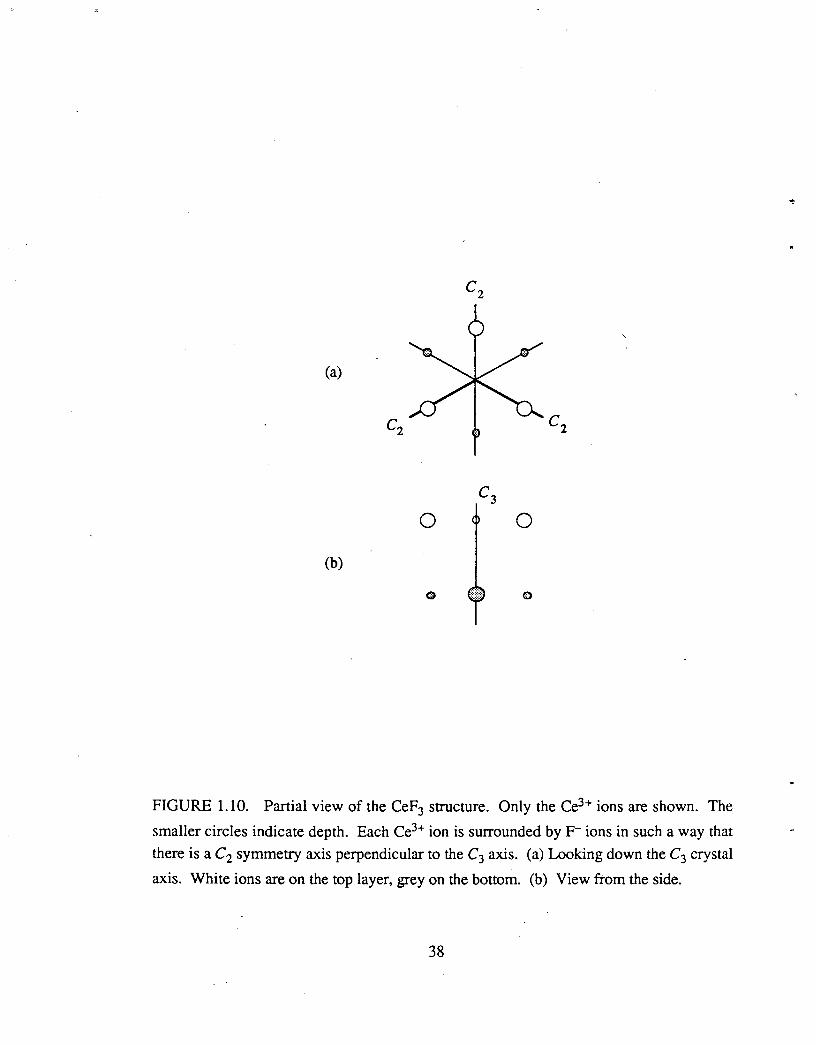
The crystal CeF3 (as well as LaF3) has the trigonal space group Di.t [30]. The site
symmetry of the ce3+ ion is c2 with three two-fold c2 axes perpendicular to the three-fold ~
C3 crystal axis. (See Figure. 1.10.) All Ce3+ ions experience the same C2 crystal field,
however there are three distinct c2 axes. The three-fold crystal axis defines the z direction
and the x andy axes are chosen arbitrarily. The Ce3+ ion has nine p- neighbors at
distances betwe~n 2.400 to 2.631 A [31]. The nearest Ce3+ neighbor is at 4.08 A. The
number density of Ce3+ ions is 1.88 x 1o22 cm-3 [17].
Along with the spin-orbit interaction, the C 2 crystal field should split the 5d
configuration into five levels and the 4/ configuration into seven levels. The irreducible
representation of the c2 double group of labels the levels which are all Kramers doublets.
Each level has the same symmetry label, and there are no selection rules for radiative
transitions. Therefore, all transitions are allowed.
In 1934, Van Velck and Hebb [32] studied Faraday rotation in pure CeF3, and
assigned the broad absorption at- 250 nm to the 4f ~ 5d transition. Buchanan et al. [33]
measured the levels of the 4/ configuration by infrared absorption at liquid helium
temperature. The four Stark components of the 2F1n manifold were located at 2180,2240,
2635 and 2845 cm-1 with the highest two levels having quite broad(- 30 cm-1) spectra.
Higher temperature spectra indicated possible absorption from an electronic level at- 150
cm-1, but a third 2F5n level was not .found. Most recently, experiments by Gerlinger and
Schaak [34] resolved the problem of the missing 2F5n Stark component. By coincidence,
the Stark components of the 2F5n manifold are nearly resonant with the optical phonons of
the crystal. This results in a hybridization of the electronic states of the Ce3+ ion with the
phonon states to form new vibronic states. The low temperature Raman spectrum in this
region shows broad(- 100 cm-1) features, where one might expect separate narrow Raman
22
·~.
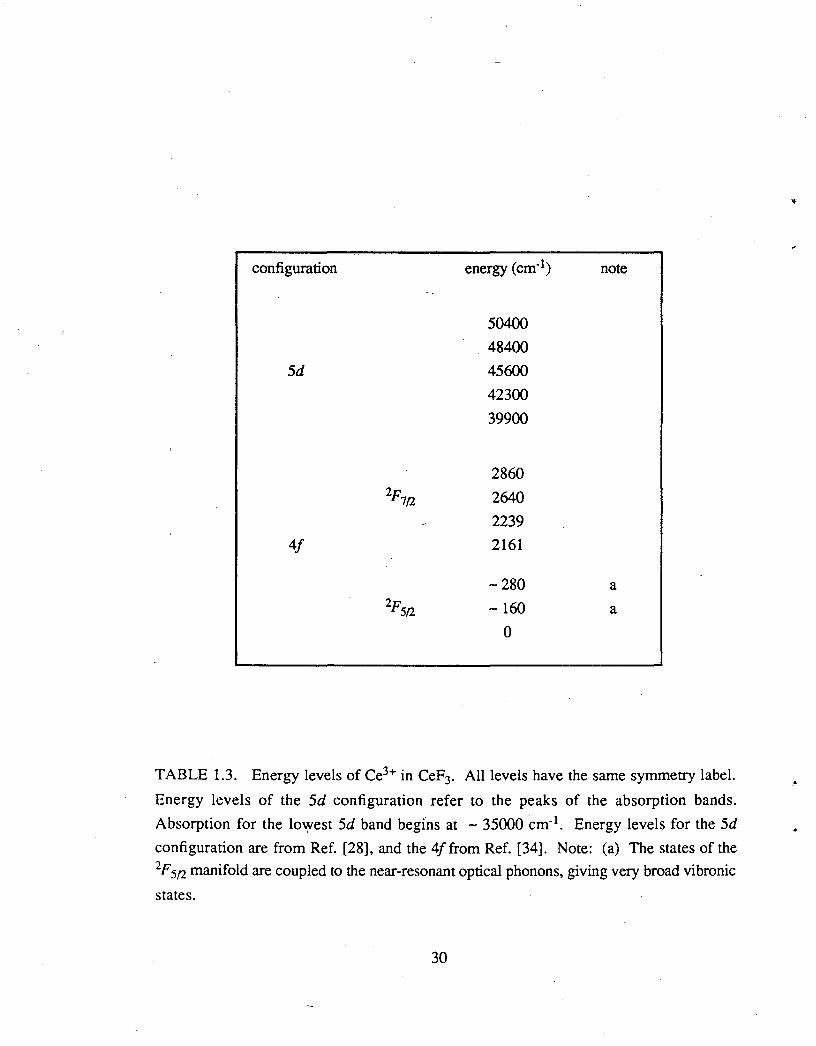
lines for the optical phonons and the electronic levels. Table 1.3 gives the energies of the
4/levels from the data of Gerlinger and Schaak who also detected the levels of the 2F1!1
manifold by electronic Raman scattering.
The 5d configuration of Ce_xLa(1-xf3 has been studied with various Ce3+ con-
centrations [8, 28, 35-38]. These investigations showed five 5d levels with the peaks of
the levels at roughly -the same energies. As the concentration of Ce3+ increases, the
absorption peaks remain approximately the same; however the 5d bands broaden, and the
onset of the 5d band becomes lower. Presumably this additional broBrdening is due to the
ion-ion interaction. Note that the radial wavefunction of 5d electron may overlap with the
radial wavefunction of its nearest neighbor at 4.08 A. (See Figure 1.2.) Elias et al. [35],
showed that the 5d band begins at- 35000 cm-1 in pure CeF3 at 100 K. Unlike the dilute
crystals, the lowest 5d absorption band does not begin abruptly with a zero-phonon line,
but gradually. The peaks in the absorption of the 5d levels measured in a thin single crystal
1ilm of CeF3 at room temperature are given in Table 1.3 [28].
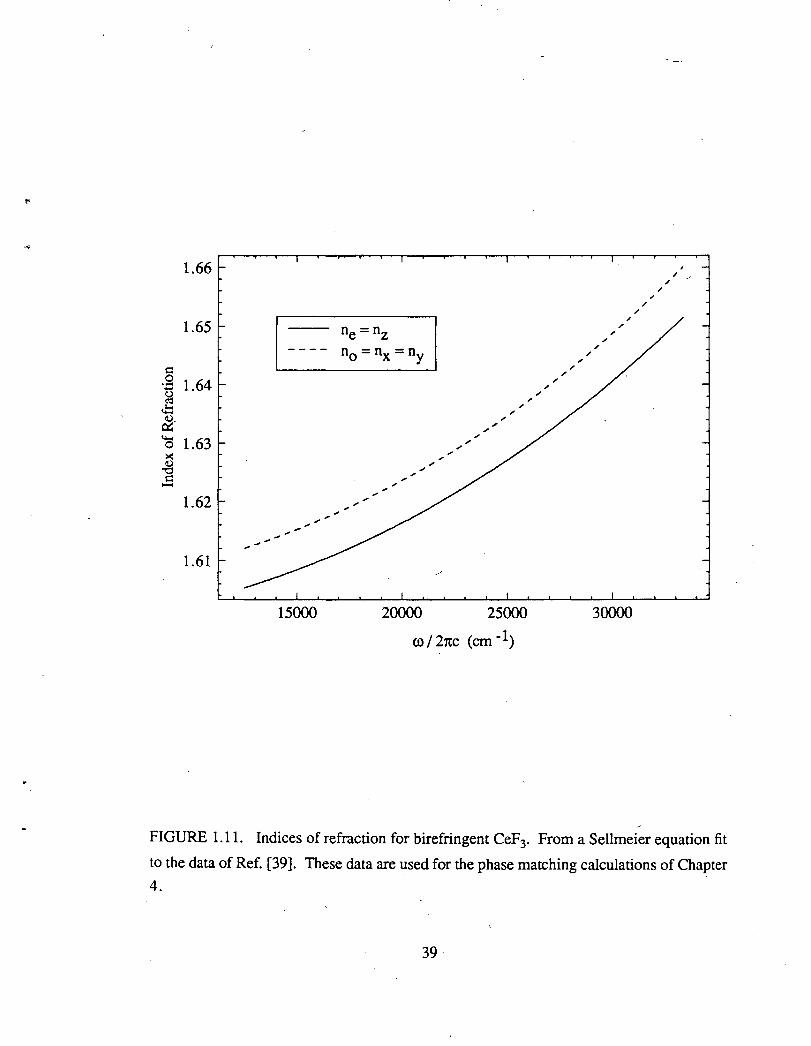
CeF3 is birefringent Figure 1.11 shows the ordinary and extraordinary indices of
refraction from the near ultraviolet to the near infrared [39]. The nonlinear index of
refraction is between 1.3 and 1.55 x w-13 esu at 1.06 ~m [40, 41]. Raman scattering
shows that there are no optical phonons in the CeF3 lattice with energies greater than -350
cm-1 [42]. The Debye energy ofCeF3 is 272 cm-1 [43].
R. W. Sparrow of Optovac, Inc. (North Brookfield, Massacho.sets) supplied the
CeF3 crystal. It is a 1 cm3 cube, polished on all six sides. The optic axis is parallel to the
sides of the cube.
23
Appendix 1.1 Measurement of the 2F512 (r6) ~ 5d (r7)
Absorption Spectrum in Ce3+:LuP04
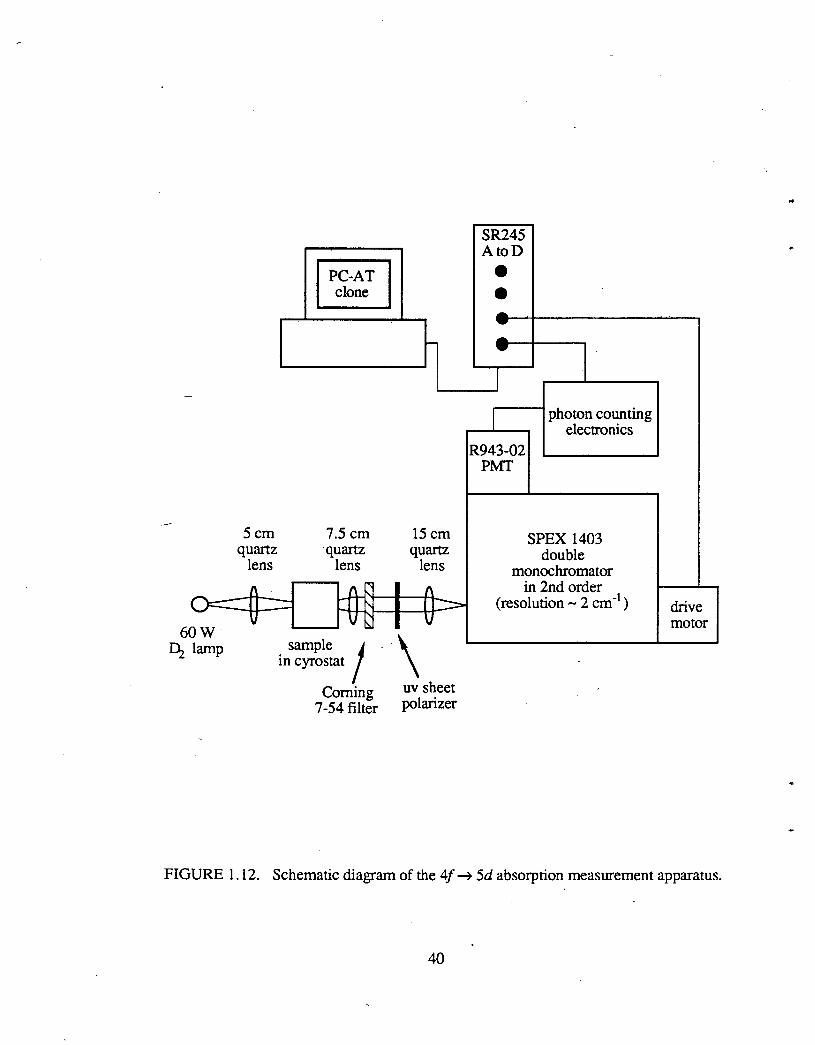
Figure 1.12 shows the experimental apparatus used to measure the absorption
spectrum of the lowest 5d band from the ground state eF 512 (r 6) 0 cm-1 ). In order to
measure the lowest 5d band, a 60 W D2 lamp illuminated the sample and the transmitted
light was directed into a SPEX 1403 double monochromator which operated in second
order. (The SPEX 1403 cannot scan beyond 31000 cm-1 in first order.) A Corning 7-54
filter (which passes the near ultraviolet, but cuts off red) prevented the first order red
emission from the lamp from overlapping the second order ultraviolet signal. The sample
was masked so that all light had to pass through 1.1 mm of crystal. The crystal was cooled
to- 10 Kin Janis Supertran cyrostat. A cooled Hamumatsu 943-02 photomultiplier tube
detected the transmitted light. A personal computer recorded the output from the photon
counting electronics, and controled the frequency scanning of the monochromator. The
transmission spectra of an undoped LuP04 crystal was used to obtain a background
spectrum and was used to subtract out the instrumental response. The intensity of light as a
function of wave number yielded the absorption spectrum of the first 5d band as shown in
Figure 1.9. The instrumental resolution was about 2 cm-1.
The x and z polarized spectra were nearly identical in both line shape and intensity.
The only asymmetry in the spectra is at the peak in the vibronic sideband at- 305 cm-1
above the zero-phonon line [23].
Figure 1.9 shows small peaks to the left of the zero-phonon line. At higher .~
resolution, the spectrum showed that these peaks have counterparts to the right of the zero
phonon line, with which they form symmetric pairs about the zero phonon line. Thus, the
(lower energy) peaks on the left are assigned to absorption from populated vibrational
levels of the ground electronic state. The mechanism for population may be from the 5d ~
24
..
4/fluorescence excited by the D2 lamp or from the radiation of the D2 lamp heating the
crystal. [No absorption losses were seen in the CARS signal when the CARS output
frequency matched these peaks. Since the CARS process does not change the quantum
state of the system, there is no mechanism by which the vibrational levels may be
populated.]
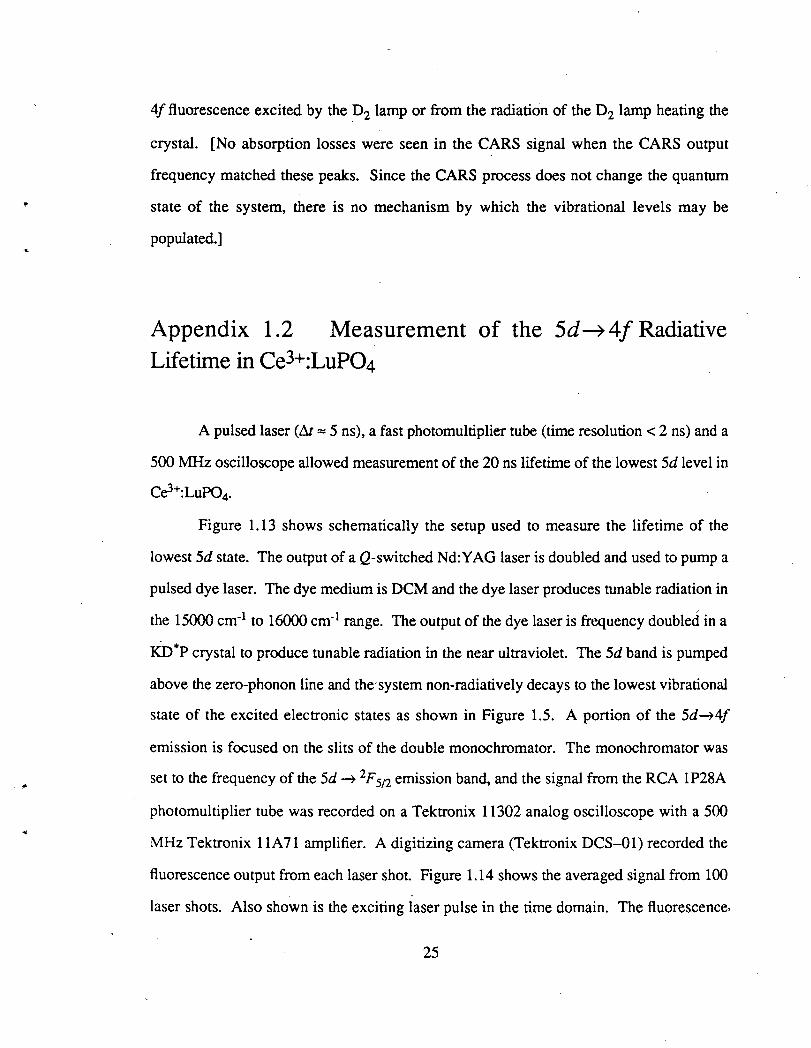
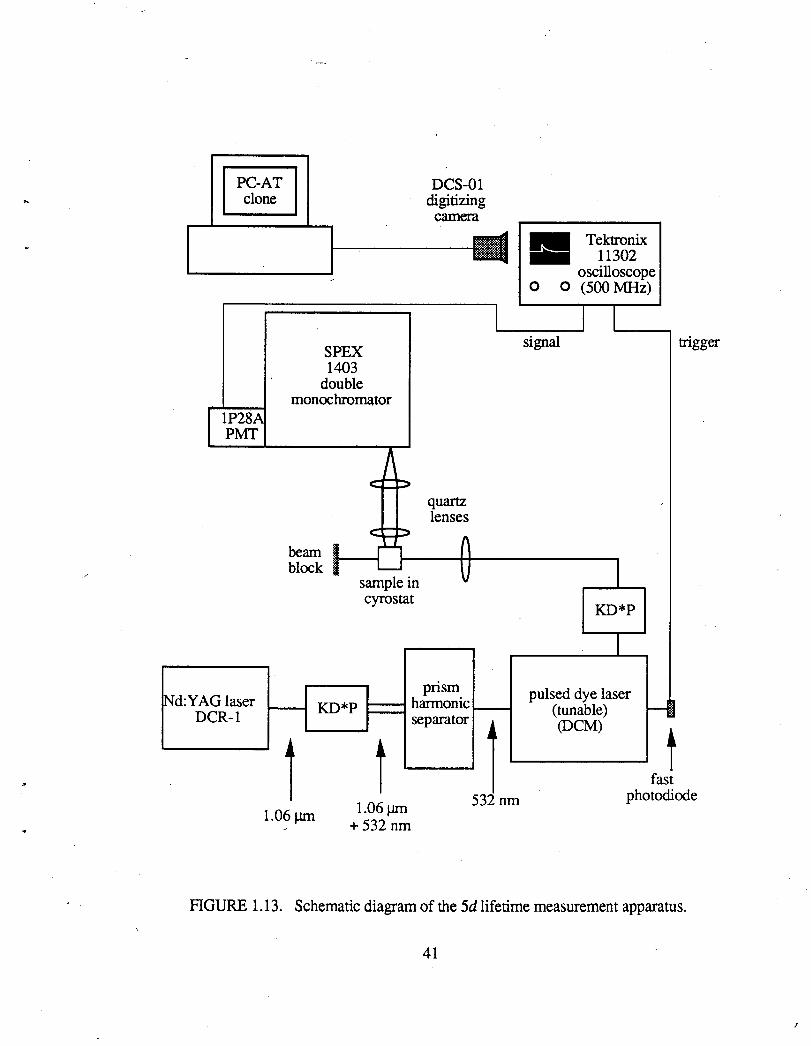
Appendix 1.2 Measurement of the 5d~4/Radiative Lifetime in Ce3+:LuP04
A pulsed laser (& = 5 ns), a fast photomultiplier tube (time resolution< 2 ns) and a
500 MHz oscilloscope allowed measurement of the 20 ns lifetime of the lowest 5d level in
ce3+:LuP04.
Figure 1.13 shows schematically the setup used to measure the lifetime of the
lowest 5d state. The output of a Q-switched Nd: YAG laser is doubled and used to pump a
pulsed dye laser. The dye medium is DCM and the dye laser produces tunable radiation in
the 15000 cm-1 to 16000 cm-1 range. The output of the dye laser is frequency doubled in a
KD*P crystal to produce tunable radiation in the near ultraviolet. The 5d band is pumped
above the zero-phonon line and the,system non-radiatively decays to the lowest vibrational
state of the excited electronic states as shown in Figure 1.5. A portion of the 5d~4f
emission is focused on the slits of the double monochromator. The monochromator was
set to the frequency of the 5d ~ 2 F 512 emission band, and the signal from the RCA 1 P28A
photomultiplier tube was recorded on a Tektronix 11302 analog oscilloscope with a 500
MHz Tektronix 11A71 amplifier. A digitizing camera (Tektronix DCS-01) recorded the
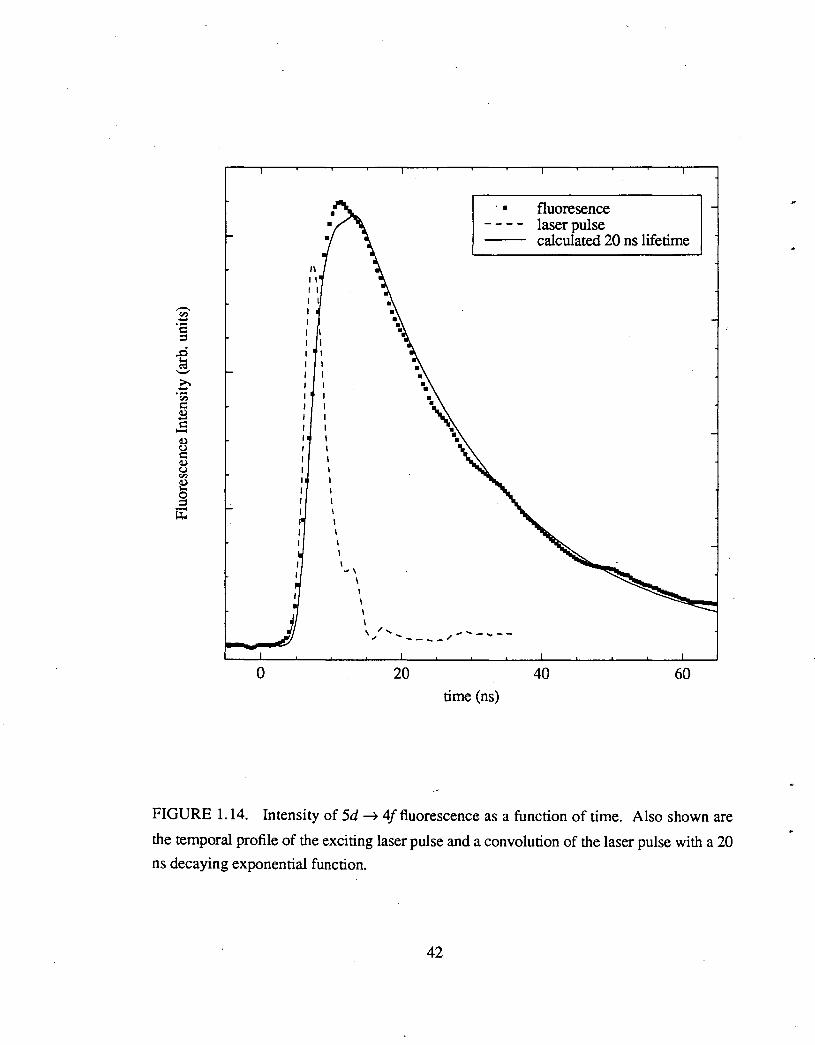
fluorescence output from each laser shot. Figure 1.14 shows the averaged signal from 100
laser shots. Also shown is the exciting laser pulse in the time domain. The fluorescence,
25
decay is fit to an exponential curve giving a lifetime of 20 ns. The accuracy of this
measurement is about ± 1 ns.
The crystal was held in a cyrostat at - 10 K. Measurements of the fluorescence
lifetime did not change at room temperature.
At - 10 K, 5d ~ 4f stimulated .emission originating from the 30460 cm-1 zero-
phonon line was observed. As the pump energy reached a threshold(- 100 ~/pulse), the
5d(r7) ~ 2F 712(r6, 2179 cm-1) transition (at 28281 cm-1) suddenly increased greatly in
intensity, and no longer showed a 20 ns exponential decay, but was a 5 ns pulse just as the
exciting laser pulse. The stimulated emission was highly directional in the direction of the
input pulse. The stimulated emission could be collimated, separated from the pump pulse
by a quartz prism, and projected on a fluorescent screen. At higher pump intensities, the
glow on the fluorescent screen resulting from the stimulated emission was visible to the
naked eye. The energy of the stimulate emission was estimated to be about 0.1 % of the
pump pulse. The stimulated emission at 28281 cm-,1 was polarized parallel to the z axis. At
a higher threshold, x polarized stimulated emission was observed on the 5d(r 7) ~
2F712(r7 , 2220 cm-1) transition at 28240 cm-1• No attempt was made to enclose the sample
in a laser cavity (with the exception of the natural faces of the crystal). For the purposes of
this section (lifetime measurement), stimulated emission is a parasitic effect.
Some interest has been focused upon the possibility of lasers based on 4f<n-1)5d1 ~
4/n transitions in trivalent rare earth crystals. These transitions are broad band, and might
lead to tunable ultraviolet solid state lasers. Stimulated emission and/or laser action.has
been observed in Ce3+:Li YF 4 at 326 nm [ 44, 45], Ce3+:LaF3 at 286 nm [38] and
Nd3+:LaF3 at 172 nm [46]. Other Ce3+ systems do not show stimulated emission due to
excited state absorption (Ce3+:YAG [47]), or the production of photochromic centers by the
ultraviolet pump (Ce3+:CaF2 [48]). Thus, Ce3+:LuP04 is the third cerium system to exhibit
26
...
5d ~ 4f stimulated emission. A more quantitative investigation is needed to determine the
suitability of Ce3+:LuP04 as a (room temperature) solid state laser material.
27
configuration
6s
5d
5d
4/ 4/
term
symbol
2slfl
2D5/l
2D3/l
2p7/l
2p5/l
degeneracy
86600 2 52226 6 49737 4 2253 8
0 6
TABLE 1.1. Energy levels of the Ce3+ free ion. From Ref [1].
28
.. configuration energy (cm-1) symmetry note
50290 r7 44040 r6
5d 41620 r7 39715 r6 a
30460 r7 b
2676 r6 2p7n. 2620 r7
2220 r7 c
4/ 2179 r6
429 r6 2p5/2 240 r7
0 r6
TABLE 1.2. Energy levels for Ce3+:LuP04. All levels are labeled by the irreducible
representations of the double group of Du. Energy values for the 5d levels refer to the
zero-phonon lines. From Williams [23, 25] unless otherwise noted. Notes: (a) Measured
by two-photon absorption (Chapter 3), disagrees with Williams' value of 39930 cm-1• (b)
Measured by two-photon absorption, agrees with Williams' value. (c) Williams' value is
2221 cm-1.
29
configuration energy (cm-1) note
50400 48400
5d 45600 42300 39900
2860 2p1/2 2640
2239 4/ 2161
-280 a 2p5/2 -160 a
0
TABLE 1.3. Energy levels of Ce3+ in CeF3. All levels have the same symmetry label.
Energy levels of the 5d configuration refer to the peaks of the absorption bands.
Absorption for the lo\Vest 5d band begins at - 35000 cm-1. Energy levels for the 5d
configuration are from Ref. [28], and the 4f from Ref. [34]. Note: (a) The states of the 2F 5/2 manifold are coupled to the near-resonant optical phonons, giving very broad vibronic
states.
30
11'
...
100
-90 "';'
8 MCJ 80
0 -->. 70 ~ c ~60
50
40
Ce Pr Nd Pm Sm Eu Gd Th Dy Ho Er Tm Yb Lu
FIGURE 1.1. The energy levels of the lowest states of the first excited configurations
( 4f<n-l)5d1) of the trivalent rare earth ions. From the data of Ref. [ 49].
0 1 2
r (A)
3
FIGURE 1.2. Radial distribution for the 4/, 5s, 5p and 5d orbitals of the Ce3+ free ion
(From a Hartree-Fock calculation [50].) (P ,jr) = r'll(r I nl )12)
31
free ion
, , ,
spin-orbit crystal field (symmetry lower than cubic)
2p ....... , ____ _ 7/2 ...... --.-----"'C.-=--=-- --------
~ .... _____ --------- j_ ' -1
, --~-' , ------- == 100 em
T , ,
__ 4_f_-< '' == 2200 cm-1
' ' ' ' ' ' ' ',,
2F5!2 ... -- -----
--------c = = =-------------------
FIGURE 1.3. Schematic diagram illustrating the spin-orbit and Stark splitting of a 4f electron. The irreducible representations of the double group of the crystal field label each
Stark component.
32
-..
't 60
LuP04 LaF3 YA103 BaY2F8
free ion Y3Alp12
50 c::J B B 5d CJ
c::J CJ c::J
40' B EJ LJ - c::J § "";'
E ...,u
§, 30 CJ Gil .... tU s:: ~
20
10
4/ 0 ~---------------------------------------------------------~
FI~URE 1.4. Locations of the 5d crystal field levels of the Ce3+ ion in several different \
crystal matrices. Only four of the five 5d levels are observed below the band gap of
Y 3Als0 12 which begins at - 50000 cm-1. References: LuP04 [23, 25]; LaF3 [38];
Y3Al50 12 [7]; YAl~ [51]; BaY2F8 [52].
33
zero-phonon line
Stokes shift absorption
emission
Configurational Coordinate
FIGURE 1.5. Configurational coordinate model which shows vibronic energies with
respect to a single normal coordinate. At right are the absorption and emission spectra at T
=OK.
b.----~----~-----
wa~b = wb ~.a-= liro W(T = 0) n W(T = 0) (n + 1)
/ ,. ' a
FIGURE 1.6. Model illustrating dephasing in a two level system. For simplicity, both
states are degenerate. n = phonon occupancy number.
34
x I ·} T 10-9 - 10-12 s I I --I I
(2S' + 1)L' I I I i: :i J' I I I
I I
i: X X T .. 10-3 - 10-6 - s -
(metastable)
Energy
i (2S + 1)L
. J I } 100 cm-1 I I I -I I -
i I I
X X
FIGURE 1.7. Generic 4flevels of a rare earth ion in a crystal at low temperature. Dashed
lines represent non-radiative decay (spontaneous phonon emission). (After Ref. [13].)
35
y'
FIGURE 1.8. Model illustrating D2d symmetry at the site of the Lu3+ ion in LuP04. The
Lu3+ ion is at the center of the model, and the circles represent the oxygen ions of the
phosphate complexes. The z-axis is parallel to the LuP04 crystal axis. The local axes (x',
y',z) are transformed to the macroscopic crystal axes (x, y, z) by a 45° rotation in the xy
plane.
36
... ZPL
60
-...... 'e 40 (.) .._, c:: 0
"d fr 0 Vl .0 <
20
0
30500 31000 31500 32000
FIGURE 1.9. Low temperature absorption spectrum of the lowest 5d level in
Ce3+:LuP04• The small peaks to the left of the zero-phonon line (ZPL) are due to
absorption from excited vibrational states.
37
(a)
0 0
(b)
0 0
FIGURE 1.10. Partial view of the CeF3 structure. Only the Ce3+ ions are shown. The
smaller circles indicate depth. Each Ce3+ ion is surrounded by p- ions in such a way that
there is a c2 symmetry axis perpendicular to the c3 axis. (a) Looking down the c3 crystal
axis. White ions are on the top layer, grey on the bottom. (b) View from the side.
38
..,
1.66
1.65
c:: .9 1.64 ..... ~
<l:: ~-......
1.63 0 >< ~
"0 c:: -1.62
1.61
ne =nz no= nx = ny
15000 20000
" ,; " "' "' "
"' "' "'
25000
"' ,. "' "
"' "' "'
"' "' "'
30000
FIGURE 1.11. Indices of refraction for birefringent CeF3. From a Sellmeier equation fit
to the data of Ref. [39]. These data are used for the phase matching calculations of Chapter
4.
39
60 w Dz lamp
PC-AT clone
Scm 7.5cm quartz quartz
lens lens
J1 II - ~ \]
sample I in cyrostat
Coming 7-54 filter
t-
15cm quartz
lens
1\ 1> v
\ uv sheet polarizer
SR245 AtoD
• • ~ ---J
photon counting l electronics R943-02
PMT
SPEX 1403 double
monochromator in 2nd order
(resolution- 2 cm-1) drive motor
FIGURE 1.12. Schematic diagram of the 4/ ~ 5d absorption measurement apparatus.
40
..
PC-AT clone
1P28 PMT
d:YAG laser DCR-1
SPEX 1403
double monochromator
beam block
sample in cyrostat
DCS-01 digitizing
camera
quartz lenses
prism KD*P harmonic
separator
t 1 1 532nm 1.06~
1.06~ + 532 om
Tektronix 11302
oscilloscope 0 0 (500MHz)
signal
KD*P
pulsed dye laser (tunable) (DCM)
trigger
t fast
photodiode
FIGURE 1.13. Schematic diagram of the 5d lifetime measurement apparatus.
41
I
0
I I I
II
I I I I
I I I I I
I I I I l I
I I I ~'
· • fluoresence
I I I I
\ ,'' ... ----, ... -- ... --20
time (ns)
laser pulse calculated 20 ns lifetime
40 60
FIGURE 1.14. Intensity of 5d ~ 4f fluorescence as a function of time. Also shown are
the temporal profile of the exciting laser pulse and a convolution of the laser pulse with a 20
ns decaying exponential function.
42
Chapter Two
Doubly Resonant Coherent Anti-Stokes Raman Spectroscopy of Ce3+ in LuP04
This chapter describes a doubly resonant four-wave mixing experiment in a dilute
rare earth doped crystal- Ce3+ in Lu.P04.
I measured coherent anti-Stokes Raman spectra between Stark components of the
2F512 and 2F 712 manifolds of the Ce3+ ion diluted in LuP04• The anti-Stokes signal is
nearly resonant with the lowest level of the 5d configuration at 30460 cm-1• (See Figure
2.1.) For a LuP04 crystal doped with 0.06 mol% Ce3+, enhancements of the third order
susceptibility lx(3)Rfx(3)NRI are as high as 15. This enhancement is over 30 times larger than
seen previously in singly resonant experiments in pure rare earth crystals which contain
2000 times as many rare earth ions per unit volume.
The reader is invited to review section 1.5 which specifies the optical properties of
Ce3+:LuP04. This chapter is organized as follows:
Section 2.1 introduces nonlinear optical wave mixing processes in general, and
coherent anti-Stokes Raman spectroscopy (CARS) in particular. Although a physically
43
distinct process, CARS is related to spontaneous Raman scattering. Section 2.2 discusses
spontaneous Raman scattering involving the electronic states of rare earth ions in crystals.
Section 2.3 contains estimates for the magnitudes of electronic CARS processes in rare
earth crystals based upon spontaneous electronic Raman scattering cross sections. A brief
examination of CARS selection rules may be found in section 2.4. The experimental
apparatus and procedure used to measure CARS resonances are given section 2.5. Section
2.6 presents the experimental results. Finally, section 2.7 contains a discussion and
analysis of the experimental results.
2.1 Wave Mixing Spectroscopy
2.1.1 Optical Wave Mixing
Wave mixing involves the interaction of one or more modes of an electromagnetic
field within a material which possesses optical properties which vary with the strength of
the electromagnetic field. In the linear optical approximation, one plane wave with a
definite polarization, wavevector, and frequency will propagate freely and independently of
another distinct plane wave which may differ in polarization, wavevector, or frequency.
(Any arbitrary electromagnetic wave may be decomposed into a linear superposition of
plane waves.) The fact that the dielectric constant is, not a linear function of the electric field
intensity will couple the Maxwell equations for the individual plane waves. Hence one can
no longer speak of truly distinct plane waves. Now the behaviors of all waves are tied to
each other. Where waves overlap in time and space they will influence the behavior of each
other. Even a single plane wave may interact with itself.
The polarization of a medium depends o~ the applied field as:
44
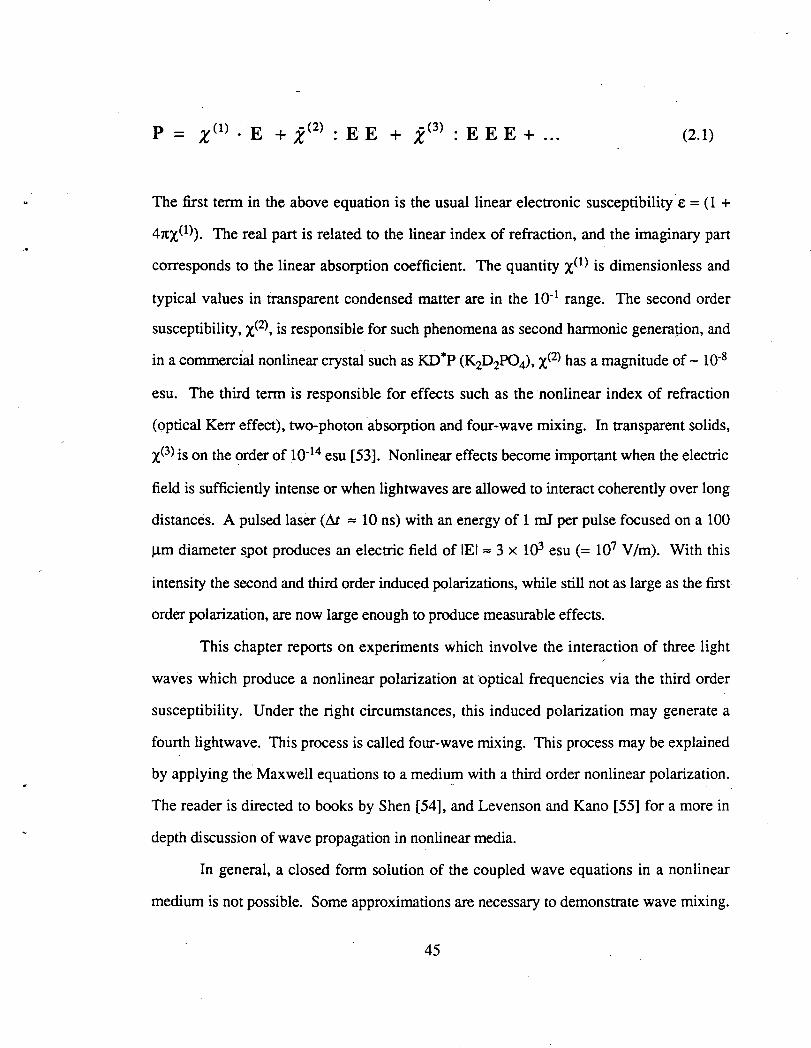
p x0 ) · E + i<2) E E + z<3
) E E E + ... (2.1)
The first term in the above equation is the usual linear electronic susceptibility E = ( 1 +
47tX(1)). The real part is related to the linear index of refraction, and the imaginary part
corresponds to the linear absorption coefficient. The quantity x<l) is dimensionless and
typical values in transparent condensed matter are in the 10-1 range. The second order
susceptibility, x<2), is responsible for such phenomena as second harmonic generation, and
in a commercial nonlinear crystal such as KD*P (K2D2PO,J, x<2) has a magnitude of- w-8
esu. The third term is responsible for effects such as the nonlinear index of refraction
(optical Kerr effect), two-photon ·absorption and four-wave mixing. In transparent solids,
x<3) is on the order of I0-14 esu [53]. Nonlinear effects become important when the electric
field is sufficiently intense or when lightwaves are allowed to interact coherently over long
distances. A pulsed laser (M = 10 ns) with an energy of 1 mJ per pulse focused on a 100
Jlm diameter spot produces an electric field of lEI= 3 x 1o3 esu (= 107 V/m). With this
intensity the second and third order induced polarizations, while still not as large as the first
order polarization, are now large enough to produce measurable effects.
This chapter reports on experiments which involve the interaction of three light /
waves which produce a nonlinear polarization at optical frequencies via the third order
susceptibility. Under the right circumstances, this induced polarization may generate a
fourth lightwave. This process is called four-wave mixing. This process may be explained
by applying the Maxwell equations to a mediu!D with a third order nonlinear polarization.
The reader is directed to books by Shen [54], and Levenson and Kano [55] for a more in
depth discussion of wave propagation in nonlinear media.
In general, a closed form solution of the coupled wave equations in a nonlinear
medium is not possible. Some approximations are necessary to demonstrate wave mixing.
45
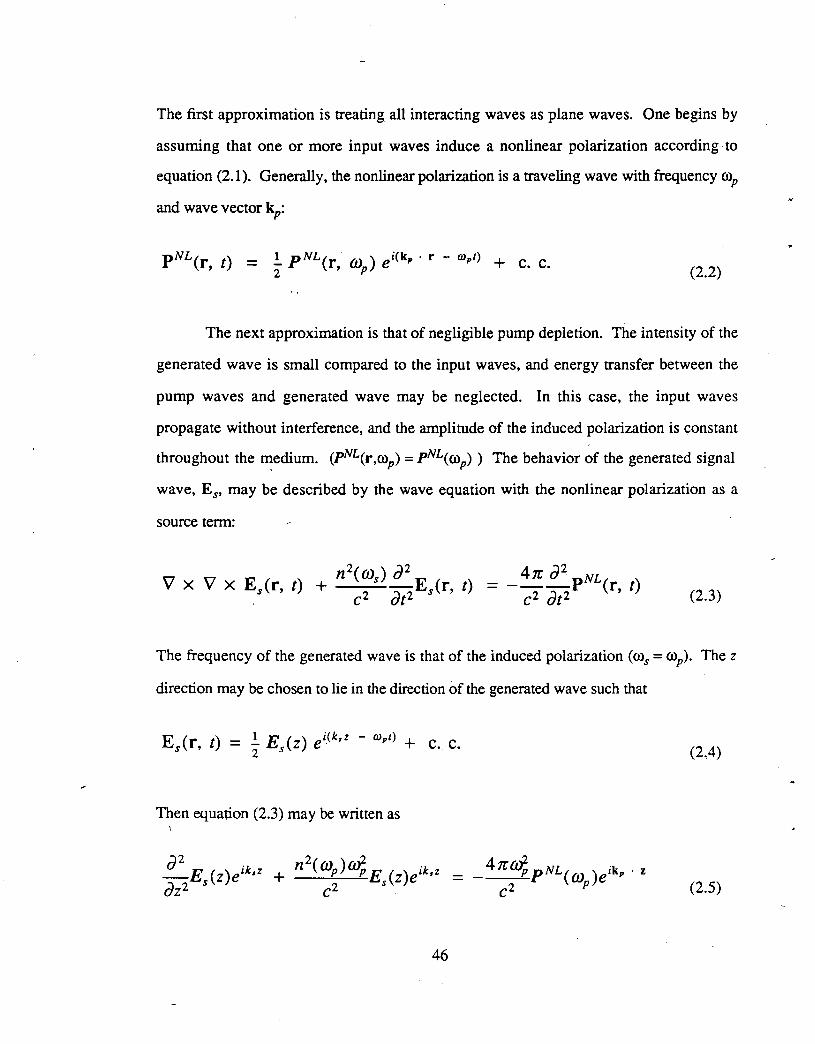
The first approximation is treating all interacting waves as plane waves. One begins by
assuming that one or more input waves induce a nonlinear polarization according to
equation (2.1 ). Generally, the nonlinear polarization is a traveling wave with frequency rop
and wave vector kp:
(2.2)
The next approximation is that of negligible pump depletion. The intensity of the
generated wave is small compared to the input waves, and energy transfer between the
pump waves and generated wave may be neglected. In this case, the input waves
propagate without interference, and the amplitude of the induced polarization is constant
throughout the ~edium. (pNL(r,rop) = pNL(rop) ) The behavior of the generated signal
wave, Es, may be described by the wave equation with the nonlinear polarization as a
source term:
(2.3)
The frequency of the generated wave is that of the induced polarization (ros = roP). The z
direction may be chosen to lie in the direction of the generated wave such that
(2.4)
Then equation (2.3) may be written as \
(2.5)
46
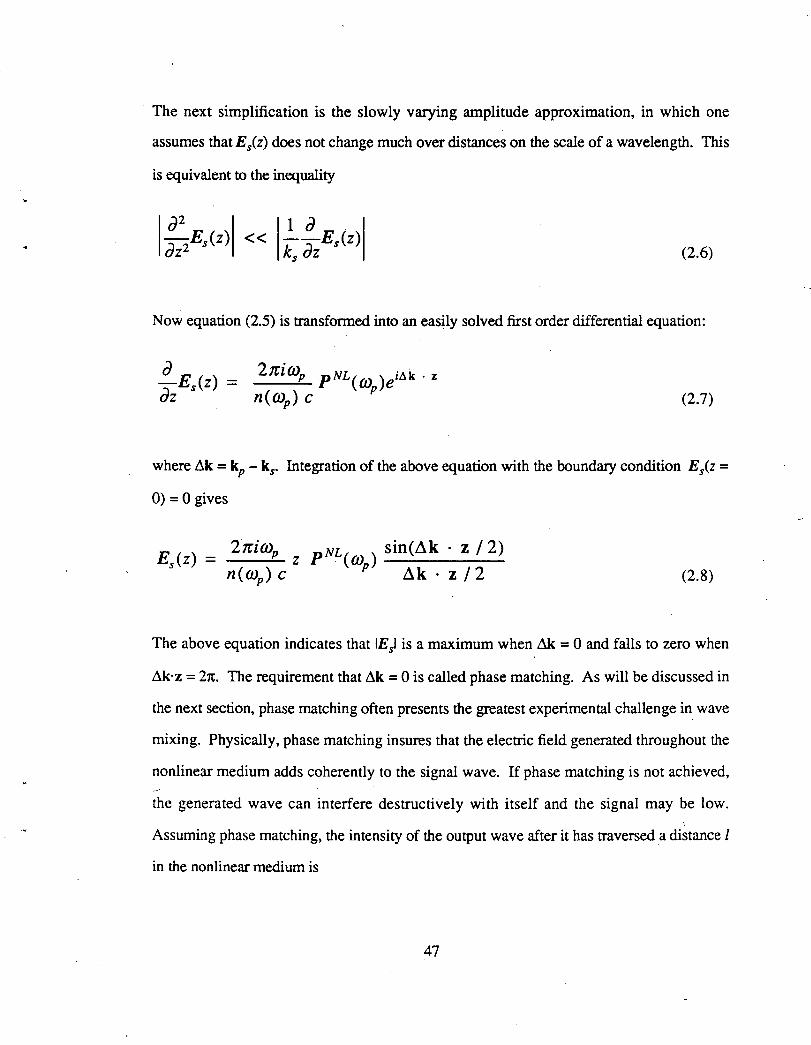
The next simplification is the slowly varying amplitude approximation, in which one
assumes thatE5(z) does not change much over distances on the scale of a wavelength. This
is equivalent to the inequality
(2.6)
Now equation (2.5) is transformed into an easily solved first order differential equation:
(2.7)
where ~k = kp- k5 • Integration of the above equation with the boundary condition Es<z =
0) = 0 gives
2nimP z pNL(m ) sin(~k · z I 2) n ( mP) c P ~ k · z I 2 (2.8)
The above equation indicates that IE51 is a maximum when~= 0 and falls to zero when
~k-z = 27t. The requirement that ~k = 0 is called phase matching. As will be discussed in
the next section, phase matching often presents the greatest experimental challenge in wave
mixing. Physically, phase matching insures that the electric field generated throughout the
nonlinear medium adds coherently to the signal wave. If phase matching is not achieved,
the generated wave can interfere destructively with itself and the signal may be low. \
Assuming phase matching, the intensity of the output wave after it has traversed a distance l
in the nonlinear medium is
47
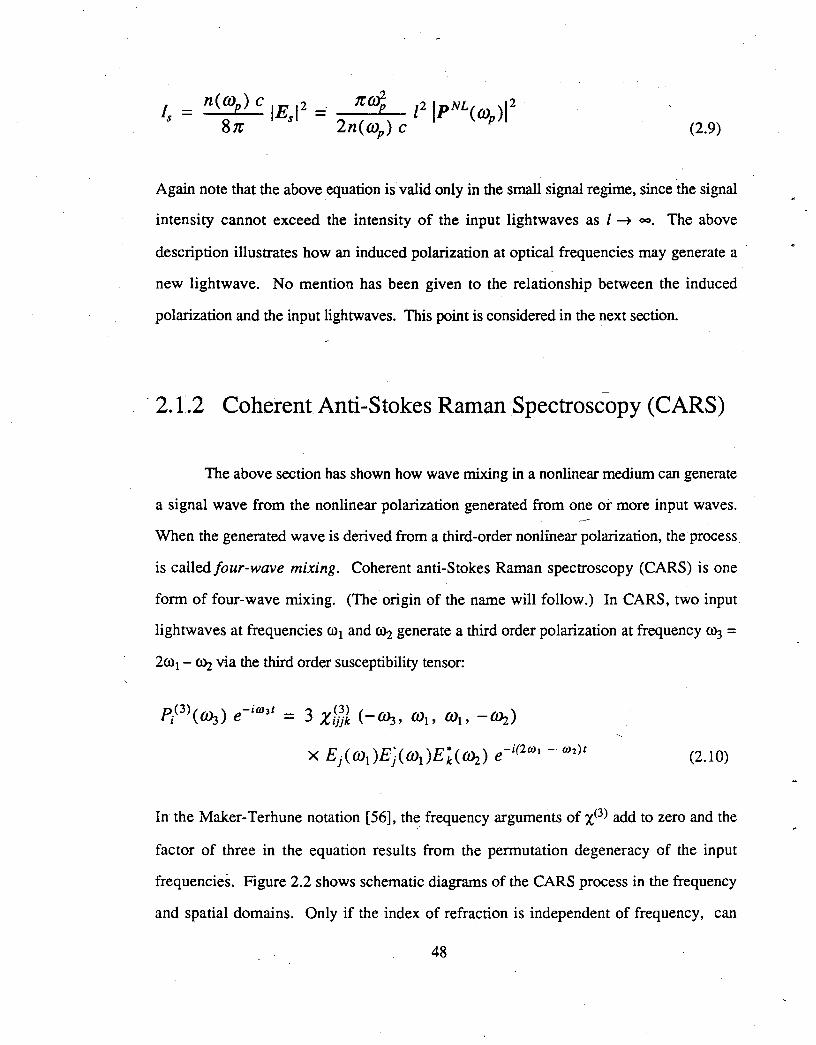
(2.9)
Again note that the above equation is valid only in the small signal regime, since the signal
intensity cannot exceed the intensity of the input lightwaves as l ~ oo. The above
description illustrates how an induced polarization at optical frequencies may generate a
new lightwave. No mention has been given to the relationship between the induced
polarization and the input lightwaves. This point is considered in the next section.
-
-2.1.2 Coherent Anti-Stokes Raman Spectroscopy (CARS)
The above section has shown how wave mixing in a nonlinear medium can generate
a signal wave from the nonlinear polarization generated from one or more input waves.
When the generated wave is derived from a third-order nonlinear polarization, the process_
is calledfour-wave mixing. Coherent anti-Stokes Raman spectroscopy (CARS) is one
form of four-wave mixing. (The origin of the name will follow.) In CARS, two input
lightwaves at frequencies ro1 and 002, generate a third order polarization at frequency 0>:3 =
2ro1 - O>z via the third order susceptibility tensor:
pl.<3)(r,-t .. ) e-iwJt = 3 (3) ( ) ~,j Ziiik -Wj, m1, m1, -~
x Ej(ml)Ej(mt)E~(~) e-i(2wl- w2)r (2.10)
In the Maker-Terhune notation [56], the frequency arguments of X(3) add to zero and the
factor of three in the equation results from the permutation degeneracy of the input
frequencies. Figure 2.2 shows schematic diagrams of the CARS process in the frequency
and spatial domains. Only if the index of refraction is independent of frequency, can
48
phase matching be satisfied by collinear beams. That is, <0:3 = 2co1 - ~ implies that lk31 =
21k11 - lk21. Generally, the index of refraction is dispersive, and the phase matching
condition is satisfied when the input beams cross at an angle 9. (See Figure 2.2(c).)
Thus far lhave focused on the fact that wave mixing produces new lightwaves at
new frequencies. The most common application of wave mixing is second harmonic
generation in which light may be frequency doubled by wave mixing in a medium with a
non-zero r._<2).
Four-~ave mixing may be used as a spectroscopic tool when the intensity of the
signal wave is dependent on the frequencies of the input lightwaves. According to
equations (2.9) and (2.10)
where In is the intensity of the nth lightwave. Note that the intensity of the signal~ /3,
varies linearly with the intensity of co2 and quadratically with the intensity of co1. A
measurement of / 3 as a function of co1 and co2 yields the frequency dependence of the
quantity IX~~~(-co3 , co1, co 1, -co2)1 2. This quantity may contain useful spectroscopic
information.
Both the linear and nonlinear susceptibilities are characteristic properties of a
material, and may be calculated from quantum mechanical principles. The macroscopic
polarization of a material is
(P) = N(~) -Ne (r) (2.12)
where N is the number density of constituents (atoms, ions, molecules, etc.) of the
material, and ~ is the dipole moment of each constituent. The brackets indicate that the
49
ensemble average of the dipole moment is used. The density matrix, p, is used to calculate
the ensemble average [57]:
(P) Tr(pP)
The Liouville equation governs the behavior of the density matrix.
ap ar
where
.lli [H, p] l '
H = H0 +er·E+Hrelax
(2.13)
(2.14)
(2.15)
Ho is the Hamiltonian for the material, er ·E describes the interaction oflight and matter in
the electric dipole approximation, and Hrelax is a phenomenological Hamiltonian added to
account for relaxation effects (e.g. lifetime broadening).
Typically, pis expanded in a power series in the electric field, and (2.14) is solved
by successive perturbations [54]. (P) is derived from equation (2.13).
(2.16)
where D is the Maker-Terhune degeneracy factor. The full expression for X~~~ has 48
terms.
For a particular wave mixing experiment, the 48 terms may be divided into two
parts. The nonresonant part, x<tf!R, has negligible frequency dependence, while the
resonant part, x~JJ:, varies considerably over the frequency domain of the experiment.
50
The resonant third order susceptibility tensor governing singly resonant CARS
(shown schematically in Figure 2.3(a)) is [54, 58]
where
~ L [(g lerul n)(n lervl f) 1i n (mx - COgn)
(2.17)
(g lervl n)(n lerul f)] (my + mgn)
(2.18)
is the usual (non-resonant) Raman tensor. The indices i, j, k and l denote the polarizations
of the 0>:3, rot> ro1, and~ beams respectively. The kets lg), If), and In) correspond to the
ground, low lying, and intermediate states with energies zero, Jirogf, and lirogn· The
number density of scatterers is N, and r gf is the Lorentzian line width (HWHM) of the lg)
~ If) transition. The term A= ((n2 + 2)/3)4, where n is the refractive index, contains the
local field corrections.
N h (3)R ote t at 'Xijkl varies rapidly in both magnitude and phase as ro1 - ro2 is scanned
through rogf. The other terms vary only slightly with changing ro1 - ~ , and are collected
into 'X~rtR, which is treated as a (real) constant.
The fact that the matrix element for this wave mixing process is related to the
spontaneous Raman tensor is responsible for the name of this process- Coherent Anti
Stokes Raman Spectroscopy (CARS). Anti-Stokes comes from the right two arrows in
Figure 2.2(a) which look like a diagram for spontaneous anti-Stokes Raman scattering. It
is important to emphasize at this point that CARS and spontaneous Raman scattering are
physically distinct processes. As a form of wave mixing, CARS may be understood in
51
terms of classical electromagnetic waves. Spontaneous Raman· scattering may be explained
only within the framework of a quantized electromagnetic field [59].
The intensity of the CARS signal, / 3, at 00:3 = 2ro1- ~is proportional to the square
of the induced polarization (equation (2.9)), which is proportional to the the total third
order susceptibility tensor (equation (2.10)).
(2.19)
where for simplicity, the tensor indices are suppressed. In addition, the factor ro32 in
equation (2.9) may be treated as a constant since 00:32 does not change much over a typical
CARS scan. If one considers only a single low lying level, !f), and notes that the Raman
tensors are essentially independent of ro1 and ro2 as (ro1 - ro2) is swept through rogf, one
may write equation (2.17) as
X(3)R -A X(3)NR o- ir (2.20)
where A is a constant, and o = ro1 - COz- COgt The intensity of the CARS signal normalized
to the off-resonance -intensity is
IX(3)R + X(3)NRI2
IX(3)NR 12
2Ao 1- ---+
82 + r2 (2.21)
Figure 2.4 shows each term in the above equation. At 8 = 0, lx<3 )Rfx<3 )NRI reaches a
maximum value of All. One sees that as All ~ 0, the first term dominates and the CARS
signal is constant and frequency independent. In order to observe the resonance against the
background, the quantity .C = lx<3)Rfx<3)NR1max =Air should be greater than the
52
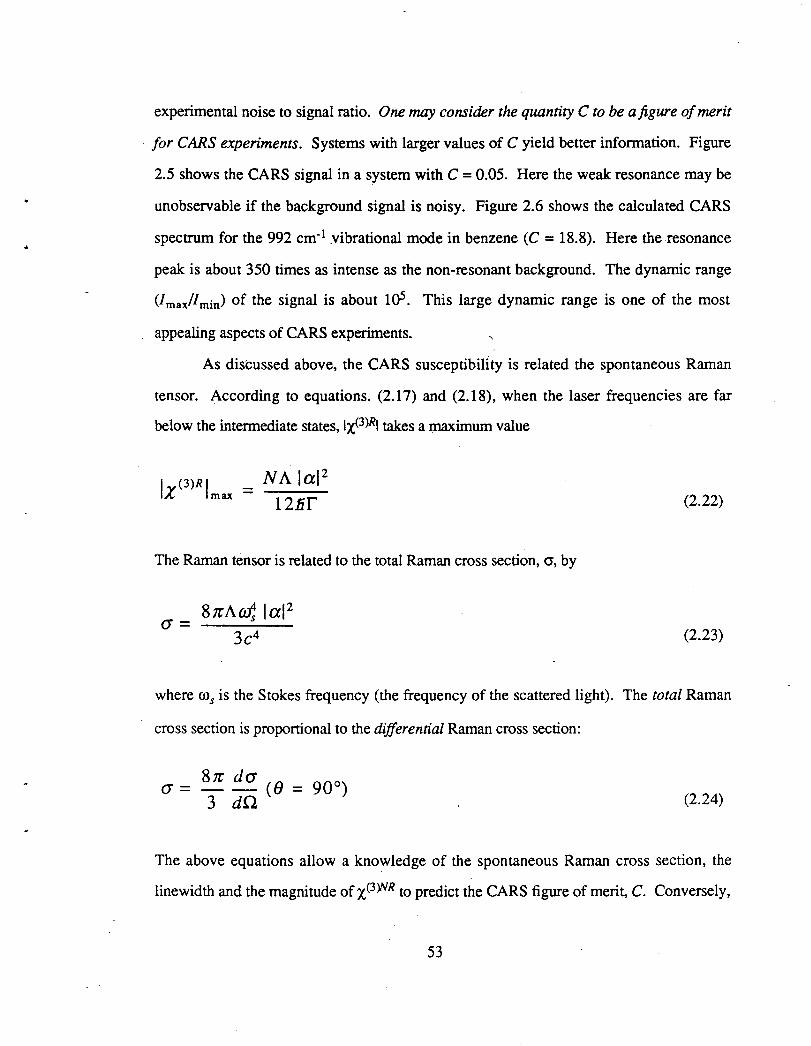
experimental noise to signal ratio. One may consider the quantity C to be a figure of merit
for CARS experiments. Systems with larger values of C yield better information. Figure
2.5 shows the CARS signal in a system with C = 0.05. Here the weak resonance may be
unobservable if the background signal is noisy. Figure 2.6 shows the calculated CARS
spectrum for the 992 cm-1 .vibrational mode in benzene (C = 18.8). Here the resonance
peak is about 350 times as intense as the non-resonant background. The dynamic range
(I maxll min) of the signal is about 1 OS. This large dynamic range is one of the most
appealing aspects of CARS experiments.
As discussed above, the CARS susceptibility is related the spontaneous Raman
tensor. According to equations. (2.17) and (2.18), when the laser frequencies are far
below the intermediate states, lx<3)RI takes a maximum value
NAial 2
121iT
The Raman tensor is related to the total Raman cross section, cr, by
(2.22)
(2.23)
where ros is the Stokes frequency (the frequency of the scattered light). The total Raman
cross section is proportional to the differential Raman cross section:
a= 8n da (B 3 dO. (2.24)
The above equations allow a knowledge of the spontaneous Raman cross section, the
linewidth and the magnitude ofx(J)NR to predict the CARS figure of merit, C. Conversely,
53
if A and rare measured in a CARS experiment, and x<3)NR is known, the spontaneous
Raman cross section may be determined. This is done in Chapter 4.
Since the size of the CARS resonance is related to the spontaneous Raman cross
section, the next sec_tion deals with spontaneous Raman scattering involving electronic
states of rare earth ions in crystals.
An historical note: Maker and Terhune [56] performed the first four-wave mixing
experiment in which lasers at frequencies co1 and~ produced light at 2co1- ~· Wynne
[ 60] first demonstrated that this process could be used as a spectroscopic tool when the
four-wave mixing signal is measured as a function of (co1 - co2). In rare earth crystals,
there have been many degenerate wave mixing experiments, but relatively few
experimenters have reported wave mixing with lasers of two or more colors. The work of
Shand [61] and Traar [62] involved singly resonant CARS in pure rare earth crystals and
will be discussed in section 2.3.1. Cone and co-workers have measured multiresonant
two-photon absorption induced four-wave mixing in Tb(OH)J, LiTbF4, and TbF3 crystals
· [63-66]. Recently, Mosharay eta/. observed three-level photon echoes in Pf3+:LaF3 [67].
2.2 Electronic Raman Scattering in Rare Earth Crystals
Spontaneous Raman scattering is an inelastic light scattering process. An incident
photon with energy Jicoi produces.a .scattered photon with energy Jicos, and the material
undergoes a change in energy of Ji(coi- cos). If roi >cos , then cos is called the Stokes
frequency and the system absorbs an energy of Ji(coi- cos). If cos> coi, then cos is called
the anti-Stokes frequency and the system is put into a lower energy state. (See Figure
2.7.) The excitation may be electronic, vibrational, or rotational in nature. Raman and
Krishnan first discovered vibrational Raman scattering in liquid solutions in 1928 [68].
54
Independently, Landsberg and Mandelstamm discovered vibrational Raman scattering in.
transparent crystals in the same year [69].
Hougen at1d Singh [70] first reported Raman scattering between electronic states of
rare earth ions in a crystal in 1963. Unlike electric dipole transitions between crystal field
states of the ground 4fn configuration, which are parity forbidden in first order, Raman
transitions between states of the same electronic configuration are parity allowed. The ..
primary use of electronic Raman scattering (ERS) has been to locate and determine the
symmetry of low-lying Stark levels [71]. The main experimental problem associated with
ERS in rare earth crystals is due to the magnitude of ERS cross sections which are usually
much smaller than those encountered in vibrational Raman scattering. For example: the
total Raman cross section of the 992 cm-1 vibrational mode in benzene [72] is 2.7 x 10⁻²⁸
cm2 I molecule while electronic Raman cross sections for rare earth ions in crystals [73, 74].
range from 5 x w-29 to 1 x 10-33 cm2 I ion. Crystals with dilute concentrations of rare
earth ions will have even smaller effective cross sections. If the energies of the electronic
levels are close to the optical phonons of the crystal, the phonon Raman signal may -
overwhelm the ERS signal.· In addition, electronic linewidths increase rapidly with
temperature, necessitating the use of a cryogenic cooling system for the crystals.
For these reasons, coherent electronic Raman spectroscopy in rare earth crystals
[61, 62] has shown only limited success unlike coherent vibrational Raman spectroscopy
[75, 76]. The intensity of the signal from coherent anti-Stokes Raman spectroscopy
(CARS) is proportional to the square of the third order electronic susceptibility, lx<3)1 2
(equation (2.19)). The complex quantity x<3) is the sum of a non-resonant part <x<3)NR)
which is due to the bulk crystal, and a resonant, frequency dependent part <x<3)R) which
contains the spectroscopic information (equation (2.17)). Since x<3)R is roughly
proportional to the spontaneous Raman cross section, one has
55
(2.25)
The resonant susceptibility for electronic CARS, ·x<!~ is often so s~all that it is obscured
by x(3)NR which can be orders of magnitude larger. This is especially true for dilute rare
earth crystals, since x<3JR is proportional to the number density of rare earth ions in the
crystal.
Experiments [77-83] have shown that ERS cross sections in rare earth crystals can
be resonantly enhanced when the frequency of the exciting laser is near the energy of an
electronic level of the rare earth ion. These studies included inter- and intra-configurational
resonances. In the case of intra-configurational resonant ERS, the intermediate state is
within the same electronic configuration as the initial and final state, i.e., 4fn for the rare
earth ions. The ERS cross sections involve electric dipole matrix elements between the
initial and final states to the intermediate states. Electric dipole 4/ n ~ 4f n transitions are
parity forbidden in first order, but the odd components of the crystal field mix excited states
of opposite parity (such as the 4f (n-l)5d1) with the 4/ n crystal field states to allow
relatively weak second order "forced electric dipole" transitions. Inter-configurational
resonant ERS directly use excited states of opposite parity ( 4/ (n-1)5d 1 ), and the
enhancement of the ERS signal is much stronger. As indicated in Chapter 1, most of these
excited configurations of the trivalent rare eart~ ions have energies greater than 50,000
cm-1, and are inaccessible to conventional spectroscopic sources.
Due to the small ERS cross sections, studies in very dilute crystals involve inter
configurational resonances. Keil and Scott [77] observed ERS between levels of the
ground 4f 5d configuration of w-3 mol % Ce2+ in CaF2 crystals. They used a laser in
resonance with the excited 4j 2 configuration. Piehler, eta/. [83] detected ERS between
Stark components of the 5/ configuration of - 0.1 mol% Pa4+ in Cs2ZrCl6 crystals using a
laser 525 cm-1 below the lowest level of the 6d configuration. Most recently, Cone eta/.
56
[84] observed ERS in Tb3+:LiYF4 and LiTbF4 using a laser in near resonance with the
4/5d configuration of the Th3+ ion at about 39000 cm-1.
Among the trivalent rare earth ions, the Ce3+ ion with its single 4f electron, is not
only the simplest ion to analyze, but also has the lowest energy 4j<n-1)5d1 configuration.
· In Ce3+:LuP04, the lowest crystal field level of the 5d configuration begins at 30460 cm-1.
Williams et al. [23, 25] took advantage of the relatively low energy of the 5d
configuration in a 0.6 mol% Ce3+:LuP04 crystal and measured ERS intensities between the
ground state and excited crystal field states of the 2 F 512 and 2 F 712 manifolds. They
performed this experiment with lasers at 354.7 nm (28192 cm-1) and 514.5 nm (19430
cm-1). A change of laser source from 514.5 nm to 354.7 nm resulted in the enhancement
of the ERS intensity by a factor an order of magnitude larger than could be accounted for I
by the ro4 dependence of the Raman eros~ section.
In the spirit of resonant ERS, this chapter reports on doubly resonant electronic
CARS experiments on a 0.06 mol% Ce3+:LuP04 crystal. Use of a frequency-tripled
Nd3+:YAG laser (28192 cm-1) and a tunable dye laser operating in the 26000 cm-1 range,
satisfies two resonance conditions. When the difference in energy between the two lasers
is equal to the energy of the lower crystal field levels of the 2F 112 manifold, the CARS
s~gnal will be in the the 30400 cm-1 range, less than 100 cm-1 below the lowest 5d band.
(See Figure 2.1.) With this extra resonance, the resonant susceptibility is large enough to
compete with x<3)NR, even in a dilute crystal.
57
2.3 Estimating the Magnitude of Electronic CARS Resonances ..
In this section, the figures of merit are estimated for singly resonant electronic
CARS in rare earth crystals, and doubly resonant electronic CARS in Ce3+:LuP04.
2.3.1 Singly Resonant CARS
The size of singly resonant CARS resonances in rare earth crystals may be
estimated by using equations (2.23) and (2.24), and a knowledge of the both the
spontaneous Raman cross section and the non-resonant susceptibility. For a typical pure '
rare earth crystal at low temperature, N = 1022 cm·3, r/27tc"" 2 cm·1, and the intermediate
states of opposite parity lie above 50000 cm·1. (A pure rare earth crystal is one in which
the rare earth ion is a full stoichiometric component, e.g. PrF3, Tb3Al50 12 etc.) A typical
Stokes frequency is wj27tc "" 20000 cm·1• Using the earlier cited figures for ERS cross
sections (section 2.2), one finds that lx<3)Rimax for singly resonant electronic CARS should
vary between 5 x 10·14 esu and 5 x 10·18 esu. For a dilute rare earth crystal such as the
crystal discussed in this chapter, N"" 1019 cm·3 and r/27tc = 0.2 cm·1. This impl_ies that
lx<3)Rimax will vary from 5 x 10·16 esu to 5 x 10-20 esu. For most transparent solids
x<3)NR,.. 10·14 esu [53], and lx<3)Rimax will be the same order of magnitude or smaller than
x<3)NR_ One may conclude that in singly resonant CARS, the enhancement ofx<3) due to
resonances between electronic states of rare earth ions will be modest at best. For dilute
rare earth crystals, C << 1, and detection of singly resonant CARS will be difficult, if not
impossible.
Experiments by Shand [61] and Traar [62] are consistent with this conclusion.
Both selected favorable rare earth systems to obtain the highest values of C. Shand
58
measured electronic CARS resonances between Stark components of the ground 1F 6
manifold and the 1F5 manifold of the Tb3+ ion in Tb3Al50 12 at 80 K, and found C ~ 0.4.
Traar investigated electronic CARS resonances from the 3 H 4 H 3 F 2 transitions of J>r3+ in
PrF3 at 2 K, and found C ~ 0.5. Figure 2.8 shows the results of their experiments.
Additionally, Shand [61] reported that no CARS resonances were detected for Nd3+ doped
into several host crystals (Gd3Ga50 12, Y 3Al50 12, and ~B~Os.)
2.3.2 Doubly Resonant CARS
For doubly resonant CARS, the resonant third order susceptibility tensor
corresponding to Figure 2.3 (b) is [54]
(3)R · -NAL 1 XijkL (-OJ..3, col, m~, -Cih) = 12.53 t -(m-~ --~-_-m_g_f ___ ir_gJ_) x
L {g le'il n){n le?l f) X L {g !erkl n'){n' le'il f) " ( 01:3 - mgn - zrgn) n' ( (01 - mgn' - irgn') (2.26)
In the above equation, both summations, nand n', are over all intermediate states. Double
resonance is a route by which x<3)R may be increased to compete favorably with x<J)NR.
Equation (2.26) indicates that IX(J)Rimax will increase as liiD:J and Jiro1 approach the energies
of the intermediate states, lirogn and lirogn'· For this reason, I chose to work with a crystal
containing Ce3+ ions whose 5d configuration lies in the near ultraviolet. Using the 514.5
nm line of an argon ion laser (19430 cm-1), Williams, et al. [23, 25] measured absolute
values for the ERS cross sections between the ground state and the crystal field levels of
the 2F112 manifold. These ranged from (0.14 to 2.5) x 10·29 cm2 I ion which are on the
high end of the range of rare earth ERS cross .sections. The low lying 5d configuration in
59
Ce3+:LuP04 accounted for its large spontaneous ERS cross section. Using the methods of
the section 2.3.1, I estimate that for singly resonant CARS in dilute Ce3+:LuP04, lx<3)Rimax
"" 2.5 X lQ-16 esu.
The lowest 5d band in Ce3+:LuP04 begins at 30460 cm-1. (See Figure 1.9.) By
using the frequency tripled output of a Nd3+:YAG laser (28192 cm-1) and a tunable light
source in the 26000 cm-1 region, a CARS resonance between the ground state and the
lowest level of the 2F1a manifold at 2179 cm-1 produces a signal at ro-J27tc = 30371 cm-1.
(See Figure 2.1.) If one assumes that the lowest 5d level is most important for the Raman -
cross section, one can estimate the enhancement of lx<3)Rimax relative to its singly resonant
value. (i.e. at ro1/27tc =19430 cm-1) According to Equation (2.26),
(2.27)
if lffi:3 - rognl » r .if Since the entire lowest 5d band contributes, I replace the summations in
the above equation by integrals weighted by the absorption data of Figure 1.9. Numerical
integration gives an enhancement factor of about 97. Now lx<3)R1max may be as great as
2.5 X w-14 esu for the dilute Ce3+:LuP04 crystal. By going from singly to doubly
resonant CARS, the figure of merit changes from C << 1 to C ~ 1 for a dilute rare earth
crystal. This is the primary point of this chapter.
2.4 Selection Rules
The symmetry of the crystal field levels imposes selection rules on the electronic
Raman tensors [73]. The symmetry properties of the tensor Xl]J: are that of the product of
Raman tensors a.ij · ald. In the experiments described in this chapter, all polarizations are
60
.. .
-
parallel so that x~~ifl is of interest. For electronic CARS resonances ( lg) H !f) ), the
following selection rules apply: (Recall that the ground state has symmetry r6.)
(3)R 'Xiiii allowed fori= x, y, z.
'X,~~t allowed for i =X, y (X,~~ = 0) .
2.5 The Experimental Apparatus and Procedure _
The experimental CARS setup is displayed schematically in Figure 2.9.
2.5 .1 The Light Sources
The ultimate source of coherent radiation in this experiment is a Q-switched
Spectra-Physics DCR-1 Nd3+: Y AG laser. The Nd3+: Y AG laser generates laser pulses
which are about 10 ns in length with energies up to 0.5 J at a wavelength of 1.064 Jlm
(9379.2 cm·1 ). The laser operates at a repetition rate of 10 Hz. The pulses may be
frequency doubled in a type II KD*P crystal to produce green light at 532.1 nm (18794.3 /
cm-1). (KDP is an abbreviation for potassium di-hydrogen phosphate, a common nonlinear
material. The star indicates that deuterium substitutes for hydrogen.) This green light may
be frequency mixed in another type II KD*P crystal with the original 1.064 Jlm beam to
generate frequency-tripled light at 355.6_nm (28191.5 cm·1 ). The energy of the 10 ns 355
nm pulse may be as high as 22 mJ. The output is linearly polarized.
Individual laser shots could be measured in the time domain by digitizing the shots
as they appeared on an oscilloscope screen (as in Appendix 1.2.) Figure 2.10 shows
oscilloscope tracings of five individual laser shots along with the average of 100 laser
61
shots. The RCA 1P28A photomultiplier tube (PMT) has a Ilsted time response of < 2 ns.
The PMT produces electronic pulses which were viewed on a Tektronix 11302 analog
oscilloscope with a 11A 71 plug-in amplifier. The frequency response of the oscilloscope
amplifier combination is 500 :MHz (2 ns). Therefore, the time resolution in Figure 2.10 is
between 2 and 3 ns. The temporal shape of the individual pulses vary greatly, but the
average pulse length (defined as the FWHM of the averaged pulse envelope) is about 10
ns. Rankin et al. [85] have studied the 355 nm output from a Q-switched Nd3+:YAG laser
with a s.treak camera with 40 ps resolution. The results show a complex temporal structure
not detectable on a nanosecond scale. The output consists of irregular bursts of pulses with
widths of 100 to 700 ps.
Measurement of the emission lines from a low pressure Hg lamp showed that the
bandwidth of SPEX 1403 double monochromator was about 0.25 cm-1 when the entrance
and exit slits were opened to 10 ~m and the intermediate slits were open to 20 ~m. The
line profile is approximately gaussian with a FWHM bandwidth of 0.8 ± 0.1 cm-1 (24±3
GHz). Immediately evident is the fact that the pulses are not fourier transform limited. A
cursory inspection shows that .1~aser .1t1aser == 2000.
The fundamental, doubled, and tripled laser output are more or less collinear after
passing through the KD*P crystals. This beam passes through a series of dispersing
prisms which separate the frequencies. The 1.06 ~m and 532 nm beams head toward a
beam dump while the 355 nm beam is saved for further use. The beam from the prism -
harmonic separator passes through a quartz plate as shown in figure 2.9. About 8% of the
beam is picked off at a right angle while the rest of the beam pumps a Spectra-Physics
PDl.r--1 dye laser. This laser operates with Quinolon 390 laser dye to provide a source of
radiation continuously tunable from 382-396 nm (-26200 to 25250 cm-1). The dye laser
oscillator is of the Littman design where a grating in the seventh order is used as the tuning
element. As with the Nd3+:YAG laser, the pulsed dye laser is multimode. The average
62
pulse length is 5 ns and the linewidth is 0.6 ± 0.1 cm-1. When operated at full power (with
both pre-amplifier and amplifier operational) the pulsed dye laser is capable of producing
500 j.JJ pulses at 384 om (=26000 cm-1).
2.5.2 The CARS Setup
The polarizations of both ro1 and ~ were parallel. An optical delay line insured that
the pulses from both the Nd3+: Y AG laser and the dye laser overlaped in time at the sample.
A 25 em focal length lens focused both beams onto a 100 IJ.m spot on the sample. The
sample size was about 1 x 2 x 5 mm with the laser light passing through about 1 mm of
material. The crystal was mounted in a Janis liquid helium Supertran Cyrostat, and cooled
to about 10 K. The sample could be oriented such that the z-axis was either parallel or
perpendicular to the polarization of the input beams ro1 and roz. This facilitated measurement
of lx.~lzl and IX,~.I2 . Since the crystal is uniaxial X~ = x.~]yy· The energy per pulse
was 200 j.JJ for each beam.
The prism which directs ~ into the 25 em lens was mounted on a translation stage
in order to adjust the phase matching angle. Optimal signal was detected when the angle
between ro1 and ~ was 48 mrad outside of the crystal. At this angle phase matching was
satisfied for (ro1 - Wz)/2rcc,. 2000 to 2400 cm-1•
A SPEX 1403 double monochromator analyzed the CARS signal at 0>:3 = 2ro1 - roz, and an RCA 1P28A photomultiplier tube detected the signal. The slits on the
monochromator were opened such that bandwidth was about 10 cm-1. In addition, a biased
silicon photodiode (EG&G SCG-100A) detected attenuated light from beam roz. A pair of
Stanford Research Systems SR250 boxcar integrators measured the pulses from both the
photomultiplier and the photodiode.
63
A IBM-PC clone personal computer collected individual measurements of the
CARS signal, normalized this signal to ~ for each laser shot, and averaged these values
over 7 5 laser shots. After collecting each set of data, the computer scanned the dye laser to
a new value of c.o2 and adjusted the monochromator. to maintain the relationship
c.oMONOCHROMATOR = 2c.ol- C.02. The data were s~ved on floppy disks and transfered.to
Macintosh Ilx computer for analysis.
2.5.3 Noise
For any experiment, one would prefer to have a signal to noise ratio that is as great
as possible. In this experiment, the overwhelming cause of noise in the data is the laser
source. The Nd3+: Y AG laser operated on more than one longitudinal mode. This affects
both the temporal and frequency characteristics of the laser pulse [86]. Figure 2.10 shows
that the output from the Nd3+:Y AG laser varies both in energy and pluse shape from shot to
shot. The complex temporal structure of the laser pulses c.o1 and c.o2 are uncorrelated, and
vary randomly from pulse to pulse. The CARS signal for a given pulse is proportional to
the integral of f2(c.o1, t)xl(ffi-J., t) over time. In other words, the main source of noise is the
fact that the random spiking in both pulses causes the temporal overlap of the two pulses to
vary wildly from shot to shot The normalization procedure cannot account for the random
variation in the signal since the signal is normalized to the time integrated intensity of l(ffi-J.,
t) over each shot. In fact, the shot to shot normalization does not improve the signal to
noise ratio much. Normalization does, however, account for the variation in the gain of the
dye laser over the spectral range of the experiment. Averaging the signal over a large
number (- 75) of laser shots helps to improve the signal to noise ratio.
64
"
2.6 The Data
I measured enhancements in the third order susceptibility due to electronic
transitions between the ground 1 6 state and the two lower levels of the 2F112 manifold at
2179 cm-1 (16) and 2220 cm-1(17). I did not observe the two upper levels of the 2F112
manifold because the CARS signals from these two levels are within the 5d absorption
band. Figures 2.11 and 2.12 show the intensities of the signals normalized to the off
resonance intensities as a function of frequency and polarization. As expected from the
selection rules, I observed no resonance between the 1 6 ground state and the 1 7 level at
2220 cm-1 in the z polarization.
2. 7 Analysis
2. 7.1 Calculation of x<3)R
In order to fit the observed spectra, the form of x<3)R as a function of ro1, ~ and ~
must be known. I assume the same form x<3)Rfx<3)NR = -A/(8- il) (equation (2.20)) as
used for singly resonant CARS with a single low lying level. Since this is a doubly
resonant experiment with a number of Raman active electronic levels, this choice must be /""
justified with respect to Equation (2.26).
The two lowest crystal field levels ofthe 2F112 manifold are separated by 41 cm-1.
Since this separation is much greater than the linewidths of either level, I may treat these
levels separately, and the susceptiblities for each level will not interfere with each other.
65
In a doubly resonant CARS experiment [87], the line shape of the signal changes as
ro3 moves through resonance with the intermediate state In). In terms of equation (2.26)
this occurs for two reasons. First, irgn may become comparable in magnitude to (0>:3- rogn)
adding an additional phase to x<3>R. In ·addition, the quantity (ro3 - rogn) may vary
considerably throughout the scan, shifting both the magnitude and phase of x<3>R. For the
conditions of the experiment reported here, both of these effects are small and may be
safely ignored as demonstrated below~
All 5d bands (zero phonon lines and vibronic sidebands) act as intermediate states
for the CARS process, and one must sum over the entire 5d configuration in equation
(2.26). If the coupling between the Ce3+ ion and the host lattice is not too strong, the
intermediate states may be described by the Born-Oppenheimer approximation, and written
as the product
(2.28)
where In) labels the nth 5d band (n=l to 5), lne) labels the nth electronic state of the Ce3+
ion 5d configuration, and IXv) labels the vibrational state of the crystal. Then
(2.29)
where 1irogfl4 is the energy of the nth zero phonon line (purely electronic transition), and
lirox corresponds to the phonon states. The Stark components of the 4/ configuration
involved in the CARS experiment all have same vibrational quantum number, namely 10).
In the Condon approximation
(2.30)
66
If ro1 is far enough below the 5d bands, the following approximation holds for the final
summation in Equation (2.26)
L (g le'il n')(n' le'il f) oc
n' ( (()1 - mgn') all 5d bands (2.31)
where Erngn' are the centers of gravity of the five 5d bands. Since only x.~li is of interest,
all tensor indices are the same.
For the second summation in Equation (2.26), only the lowest 5d band contributes
appreciably. The absorption coefficient, a(rogJ, for the ground state to the lowest 5d level
is
(2.32)
The intensity of the absorption spectrum of the lowest 5d band shows very little
polarization behavior. Hence, l(gelerille)l2 may be treated as a constant, independent of i.
Then equations (2.30) and (2.32) allow the following change to be made to the second
summation in equation (2.26):
(2.33)
Note that the ir gn term has been disregarded. This is justified in our experiment because
lro3 - rognl I 21tc is always;;:: 50 cm-1, which is much larger than r gnl21tc for the individual
levels which make up the 5d band.
67
Now Equation (2.26) may be written as
X L all 5d bands (2.34)
The frequency-tripled Nd3+: Y AG laser provides ro1 which is a constant. The absorption
coefficient, a(rogn), is plotted in Figure 1.9. Numerical evaluation of the above integral
shows that its value changes only slightly as ~ varies throughout each resonance. The
value of the integral varies by only 1% over the line profiles in Figure 2.12 and by about
5% over Figure 2.11. For this reason, I treat the integral as a constant over each resonance.
I therefore fit the data to
Xp~NR lUI
-A o- ir (2.35)
Measurement ofx~R I x<;;~R= 1.48 ± 0.15 in a pure LuP04 crystal allows
comparison of all observed resonances. Williams, et al. [23, 24] have calculated angular
wavefunctions for all electronic levels of the 4/ and 5d configurations. Using the
absorption data of Figure 1.9, relative values of A may be calculated according to Equation
(2.34) and compared with experiment. Since the features to the left of the zero phonon line
in Figure 1.9 are not connected to the ground state, I did not include them in the
68
calculation. The results of the calculation are giv~n in Table 2.2. The basis of the
calculations rests on the assumption that the 5d states may be described by the Born
Oppenheimer approximation. The Born-Oppenheimer approximation does not, however,
affect the choice of Equation (2.35) as an appropriate functional form for x<3)R.
2.7.2 Deconvolution of the Spectra
Ideally, one would like to fit the data of Figures 2.11 and 2.12 to equation (2.21).
However, the actual spectra must be deconvolved, in order to take into account the finite
bandwidths of the input lasers. The output intensity is written as [88]
l(OJ:3) oc J lx(3)(-0J:3, rot, rot,-~)+ X(3)(-0J:3, rot', rot', -~)1 2
x gt(rot)gt(~)g 2 (~) D(OJ:3- ro~- rot -t- ~) drotdro~dro2 (2.36)
where gi(ro) is the normalized intensity of beam roi centered at ro~. Since the input lasers
have finite linewidths, the output /(0>:3) will have a frequency distribution centered at ro~ =
2ro~- ro~. The detector bandwidth is greater than that of /(0>:3) so the data corresponds to
l(dj 2ro? - cJi) oc J l(OJ:3)dt:1J:3 (2.37)
Our lasers have approximately gaussian lineshapes with FWHM 0.8 cm-1 for ro1
and 0.6 cm-t for ro2. The accuracy of the laser line width measurements is± 0.1 cm-1.
With gaussian intensity profiles for the input lasers, the above equations cannot be
evaluated in closed form. The CARS signals in Figures 2.1_1 and 2.12 may be fit by
69
numerically computing/(~). A least squares fit is obtained by treating A and r as variable
parameters. Table 2.1 summarizes these results. The fitted curves are drawn as solid lines
in Figures 2.11 and 2.12. The major effect of using lasers with linewidths greater than the
Ce3+ linewidths is a general broadening of the spectra, especially when ~rolaser > 2r.
Perhaps most noticeable is the suppression of the ''dip'' in the CARS signal in Figures
2.12(a) and (b). Here the normalized intensity does not fall far below one as in a typical
CARS intensity profile. In Figure 2.11 (b), ~~aser < 2r, and the effect is less.
According to Teets [88], the above convolution (equation (2.36))is superior to that
introduced by Yuratich [89] which is the standard equation used in the field. In a
publication based on the work in this chapter [90], the Yuratich convolution was used and
gave similar results.
2.7.3 Analysis
Although the. above analysis strictly applies only to homogeneously broadened ·
lines, I view r as a phenomenological parameter which may include contributions from
both homogeneous and inhomogeneous broadening. The use of broad band lasers /
hampers the ability to accurately measure these quantities. The fourth column of Table 2.1
lists the linewidths for the various levels. The linewidth of the lowest crystal field level in
the 2F7n manifold is much narrower than the higher level. This is expected since the higher
level may decay by the· spontaneo~s emission of a phonon. Reed and Moos [91]
investigated multi-phonon inter-manifold relaxation in YP04 crystals doped with various
rare earth ions. (The phonon spectra of LuP04 and YP04 are very similar.) They found
that manifolds with energy gaps~ 2500 cm-1 do not fluoresce but decay non-radiatively.
An extrapolation of their data indicates that the nonradiative decay rate from the 2179 cm-1
70
level to the 429 cm·1 level should be less than 107 s·1. This rate corresponds to
homogeneous linewidths less than 10 MHz (3 x 10⁻⁴ cm-1). As a consequence, the 2220
cm·1 state is lifetime broadened, while the linewidth of the 2179 cm·1 level may be
primarily attributed to crystal strain broadening. These measured linewidths are typical of
those found in dilute rare earth crystals at low temperatures as discussed in Chapter 1.
The fifth column of Table 2.1 gives the value of C for the different resonances.
The bandwidths and noise levels of the lasers place limits on how weak a resonance can be
detected. The experimental noise to signal ratio is about 5%. For a resonance with r/27tc
= 0.045 cm·1, the lower limit of detection is C < 0.5. For a resonance with r/27tc = 0.45
cm·1, the lower limit of detection is C < 0.05. When I performed this experiment with
visible lasers (ro1/27tc = 18792 cm·1, ro2/27tc "" 16600 cm-1), I observed no CARS
resonances. Therefore, by going from singly to doubly resonant CARS, C increases by at
least a factor of 31.
The third column of of Table 2.1 give the experimental values of A. Table 2.2
compares the ratios of the A values for both calculation and experiment. Agreement is fair
since both the calculation and experiment predict that the 2220 cm·1 xxxx and 2179 cm·1
zzzz -polarized resonances will be several times larger than the 2179 cm·1 xxxx polarized
resonance.
The use of broad band lasers masks the true size of the resonance for narrow lines.
Had I used lasers with sub-gigahertz bandwidths, the signal peak in Figure 2.12(a) would
be about 150 times as large as the off resonance intensity. Figure 2.13 shows the data of
Figure 2.12(a) along with the CARS signal calculated from equation (2.21) (which
neglects the finite laser linewidths) using the parameters in Table 2.1. The use of broad
band lasers has a smaller effect on the 2220 cm·1 resonance, and the CARS "dip" is
visible.
71
2.7.4 Summary
Calculations in section 2.3 indicated that the figure of merit (C) for singly resonant
electronic CARS experiments in pure rare earth crystals may be expected to be modest at
best. By going from singly resonant CARS to doubly resonant CARS (where the second
resonance involves the strong 4/ ~ 5d transition) the figure of merit may be enhanced to
such an extent that C may be large even for a dilute rare earth crystal.
I have demonstrated doubly resonant CARS involving electronic states in a dilute
rare earth crystal - Ce3+:LuP04• The signals produced are an order of magnitude larger
than those seen previously in singly resonant CARS in pure rare earth crystals which
contain 2000 times as many rare earth ions per unit volume. Two factors account for the
large values of C = lx<3>R;x<3)NRimax = A/f'. First and most important is the enhancement
due to the signal being in near resonance with the lowest 5d band. In addition, the narrow
linewidth of the lowest level of the 2Fm. manifold gives Can extra boost.
The use of doubly resonant CARS should be applicable to high resolution
spectroscopy of other dilute rare earth systems. Requirements are, in order of importance,
accessible 5d levels, electronic transitions with narrow linewidths, and lasers with
bandwidths narrower than the material resonances. Crystals doped with divalent rare earth
ions are attractive candidates. The 5d bands of divalent rare earths are in the visible and
near infrared. At low temperatures electronic linewidths of metastable states in dilute
crystals are ultimately limited by inhomogeneous broadening. Dilute single crystals usually
have inhomogeneous broadening (F'WHM) in the 1 to 10 GHz range [13]. Finally, in
order to accurately measure the resonance, and to avoid deconvolution of spectra, narrow
band lasers should be employed
72
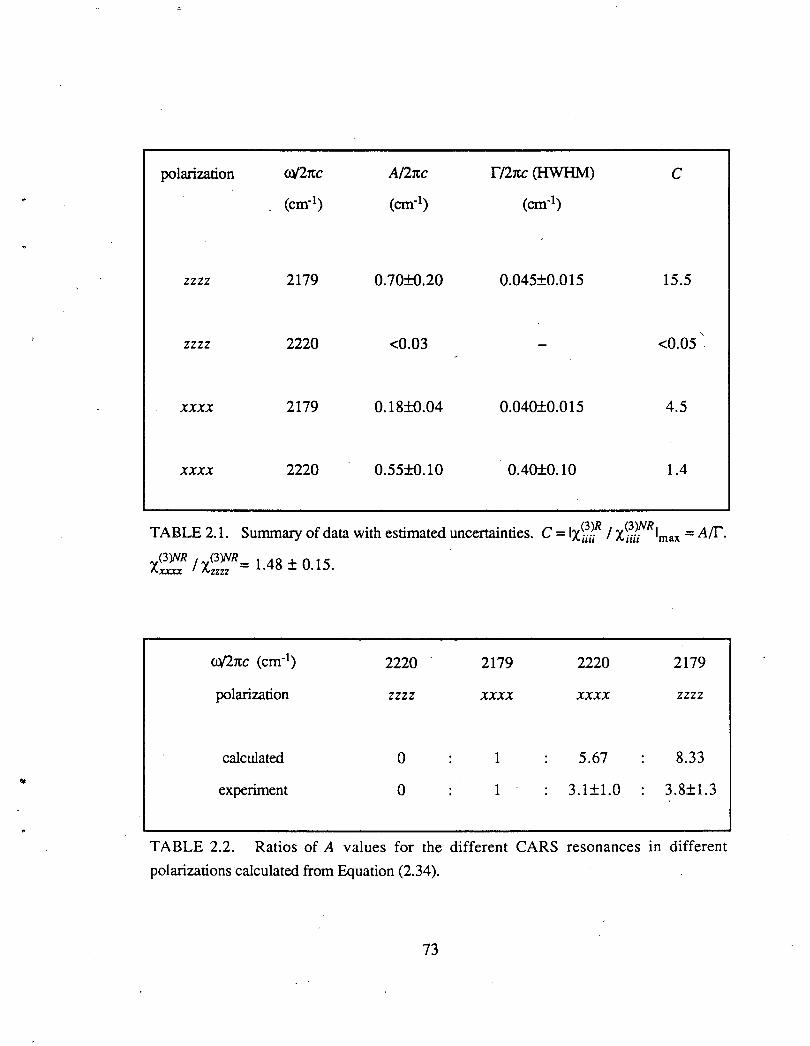
polarization c
zzzz 2179 0.70±0.20 0.045±0.015 15.5
zzzz 2220 <0.03 <0.05.
xxxx 2179 0.18±0.04 0.040±0.015 4.5
xxxx 2220 0.55±0.10 0.40±0.10 1.4
TABLE 2.1. Summary of data with estimated uncertainties. C = lx~7~R I x~;l[Rimax =A/['. x~R Jx~!>::R= 1.48 ± o.15.
polarization
calculated
experiment
2220
zzzz
0
0
2179
xxxx
1
1
2220
xxxx
5.67
3.1±1.0
2179
zzzz
8.33
3.8±1.3
TABLE 2.2. Ratios of A values for the different CARS resonances in different
polarizations calculated from Equation (2.34).
73
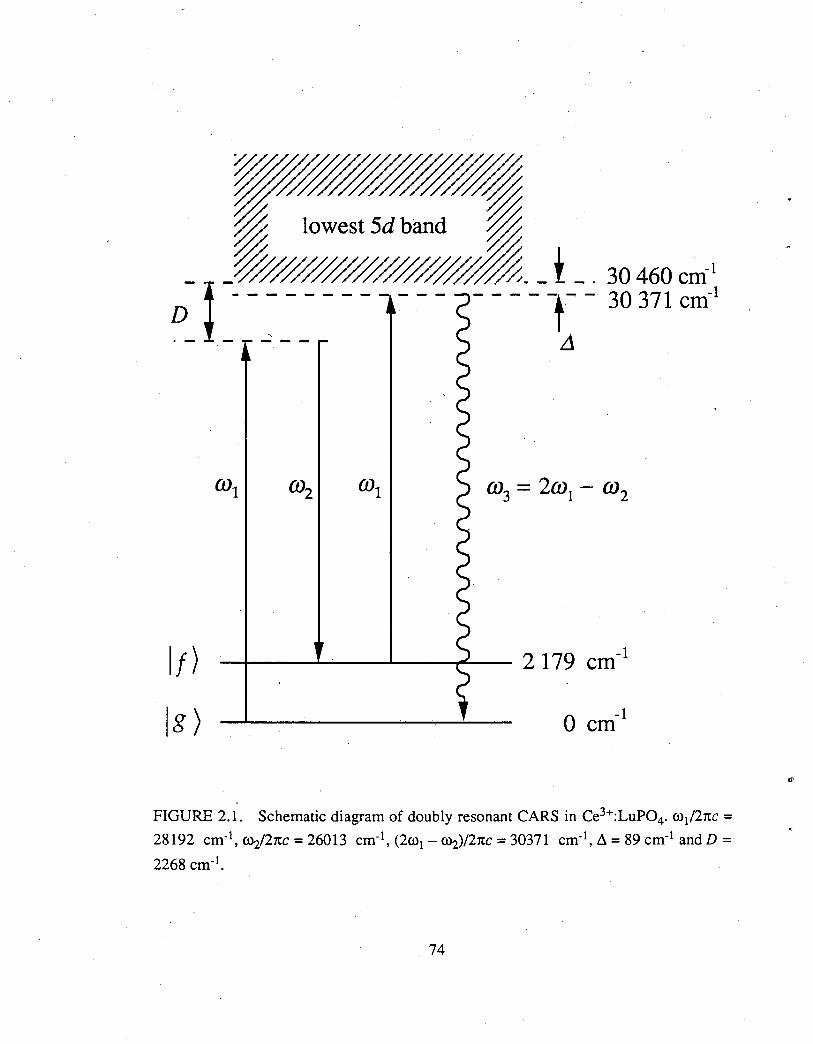
It)
jg) 0 -1 em
FIGURE 2.1. Schematic diagram of doubly resonant CARS in Ce3+:LuP04. ro1/27tc = 28192 cm-1, ~/27tc = 26013 cm-1, (2ro1 - ro2)/27tc = 30371 cm-1, ~ = 89 cm-1 and D = 2268 cm-1.
74
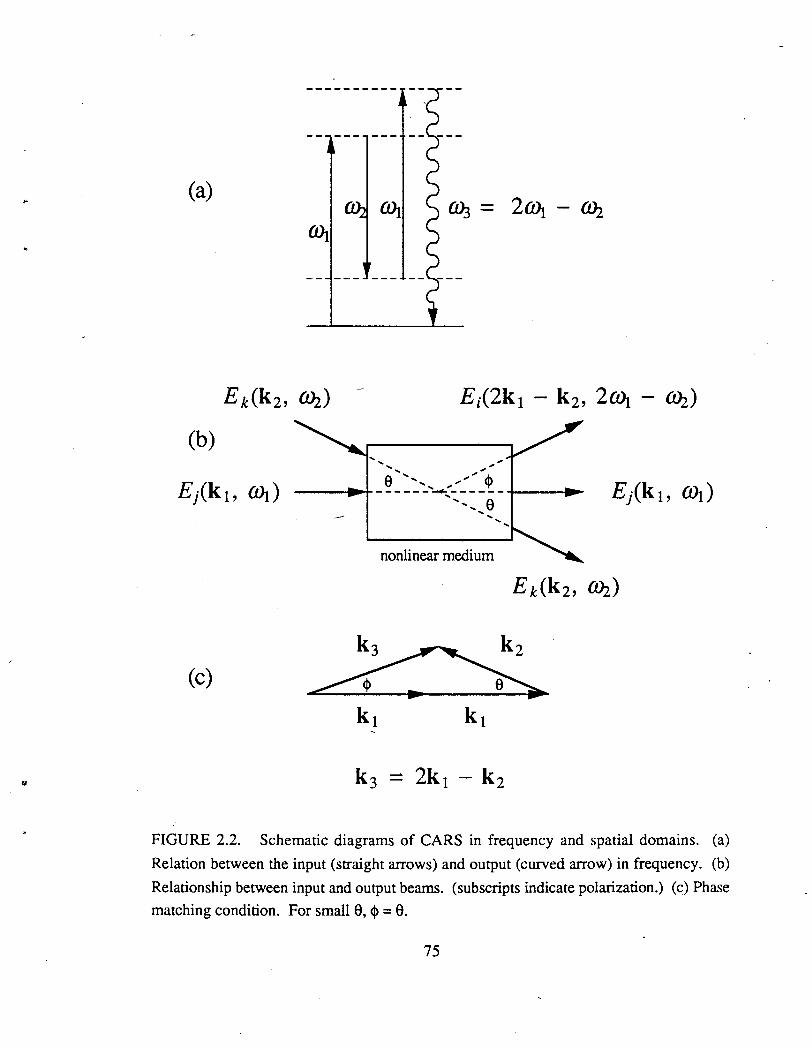
(a)
(b)
(c)
lU.3 = 2Wt - ~
.......... ," ...... ... e .............. ..,.," <1>
---.-r------...._::-------+-----~ ............ a ... ...
nonlinear medium
... ...
FIGURE 2.2. Schematic diagrams of CARS in frequency and spatial domains. (a)
Relation between the input (straight arrows) and output (curved arrow) in frequency. (b)
Relationship between input and output beams. (subscripts indicate polarization.) (c) Phase
matching condition. For small 8, <!> = 8.
75
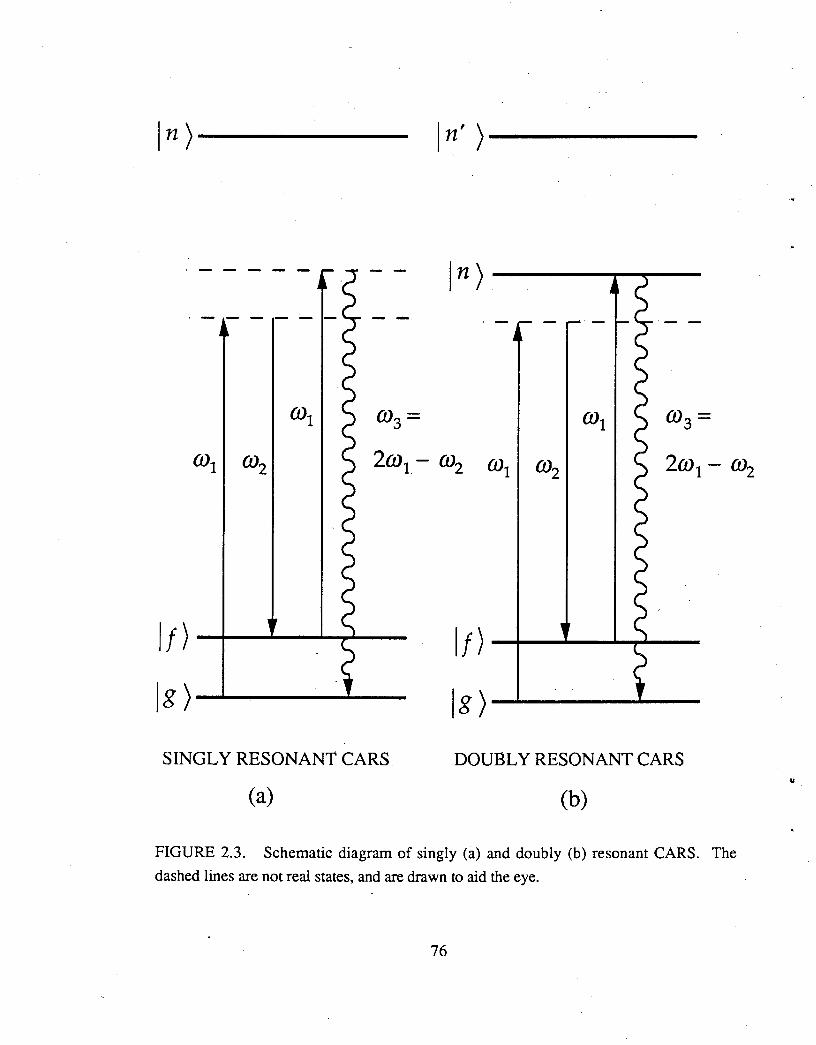
In)----- In')-----
(03=
2mL- Wz ml Wz
I g ) ---~-----'----
SINGLY RESONANT CARS DOUBLY RESONANT CARS
(a) (b)
FIGURE 2.3. Schematic diagram of singly (a) and doubly (b) resonant CARS. The
dashed lines are not real states, and are drawn to aid the eye.
76
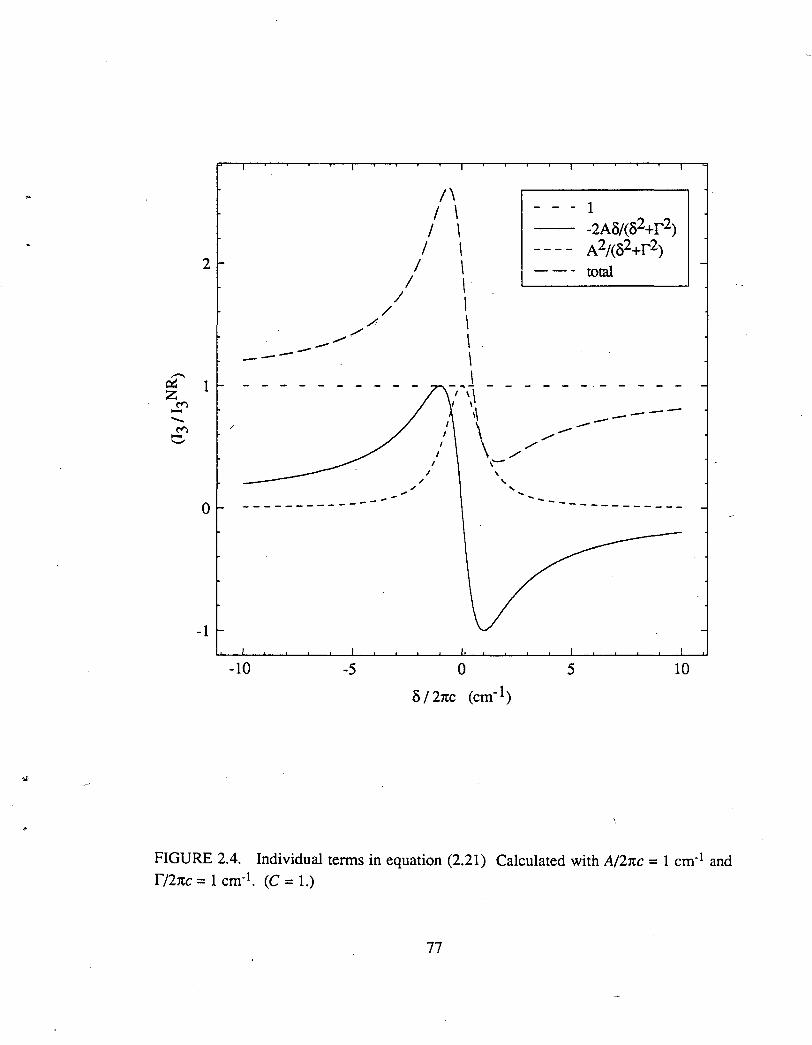
!\ 1 I \ - - -
I \ -2Ao/(o2+r2) I I A2/(o2+r2)
2 I I --- total I I
I I / / I
/ I / --- I --- I ~ 1 - - - - - - -1 ~ ,-, - - - - - - - - - - -z
~ I I ---- ,, --- \ -~ / / - / ......... \ /
/ I ,-
I ' I ' "' ' 0 -------- --- , __
----------
-1
-10 -5 5 10
FIGURE 2.4. Individual terms in equation (2.21) Calculated with A/2rcc = 1 cm-1 and r12rcc = 1 cm-1• (C = 1.)
77
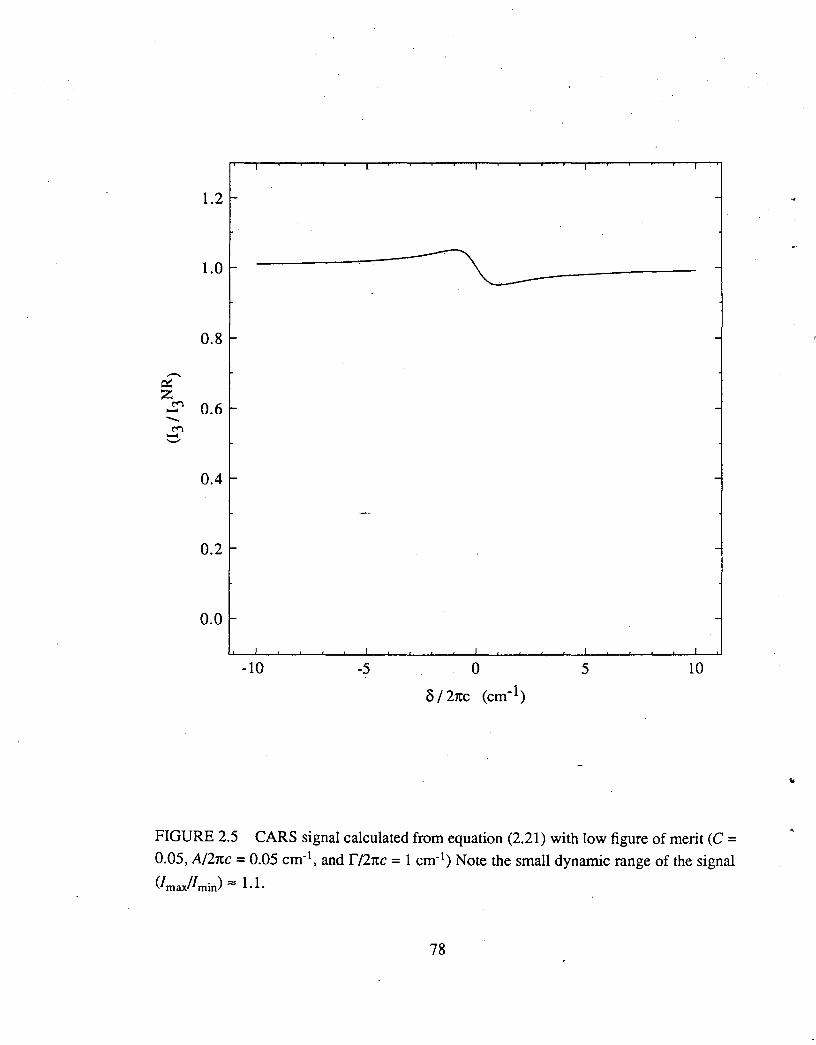
1.2
1.0
0.8
--~ z ("') 0.6 --("') ---
0.4
0.2
0.0
FIGURE 2.5 CARS signal calculated from equation (2.21) with low figure of merit (C = 0.05, A/21tc = 0.05 cm-1, and r/27tc = 1 cm-1) Note the small dynamic range of the signal
(I max/1 min) ,. 1.1.
78
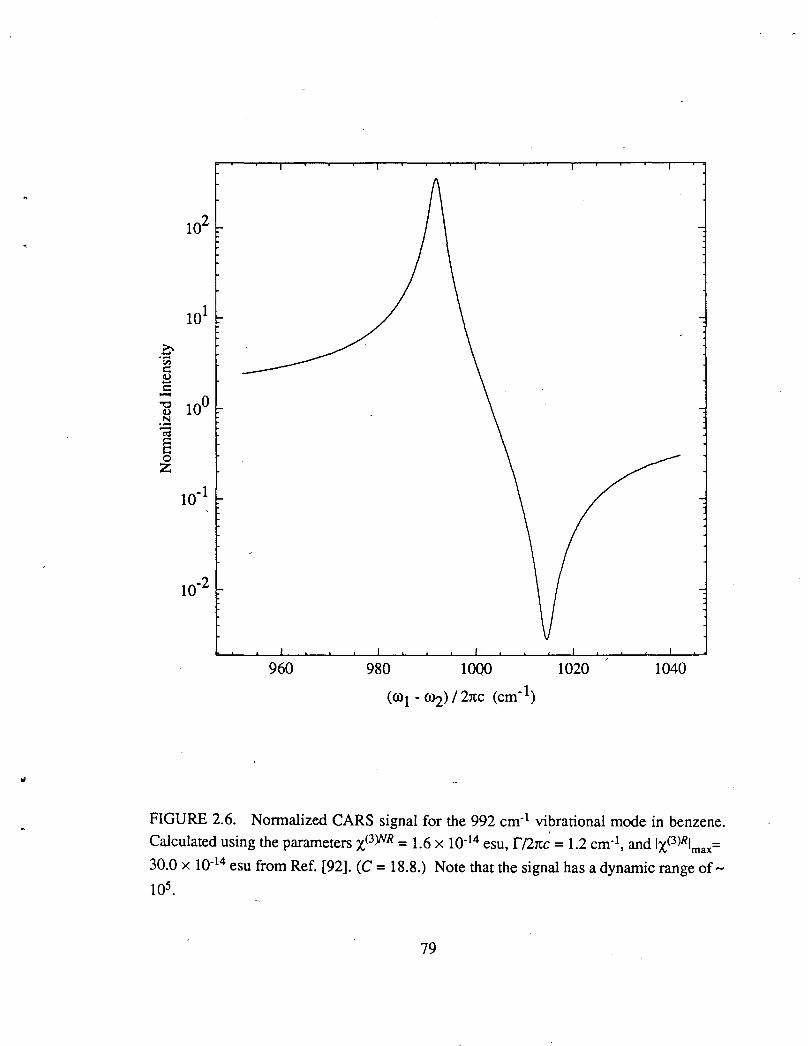
101
0 ·-<ll c:: 0 ....
..$ 100 ~
0 N
~ § 0 z
10-1
960 980 1000 1020 1040
FIGURE 2.6. Normalized CARS signal for the 992 cm-1 vibrational mode in benzene.
Calculated using the parameters xP)NR = 1.6 X 10⁻¹⁴ esu, r/21t~ = 1.2 cm-1, and lx<3)Rimax=
30.0 x 10⁻¹⁴ esu from Ref. [92]. (C = 18.8.) Note that the signal has a dynamic range of-105.
79
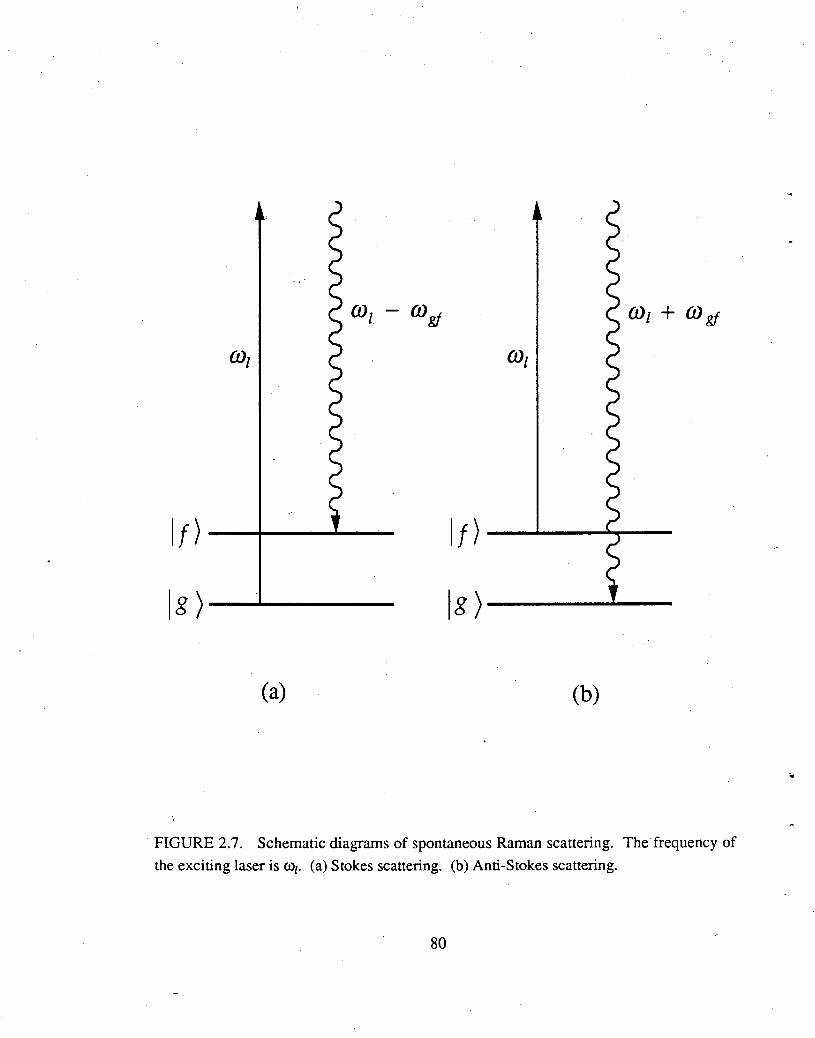
lg) lg )--__._-
(a) (b)
· FIGURE 2.7. Schematic diagrams of spontaneous Raman scattering. The frequency of
the exciting laser is ro1• (a) Stokes scattering. (b) Anti-Stokes scattering.
80
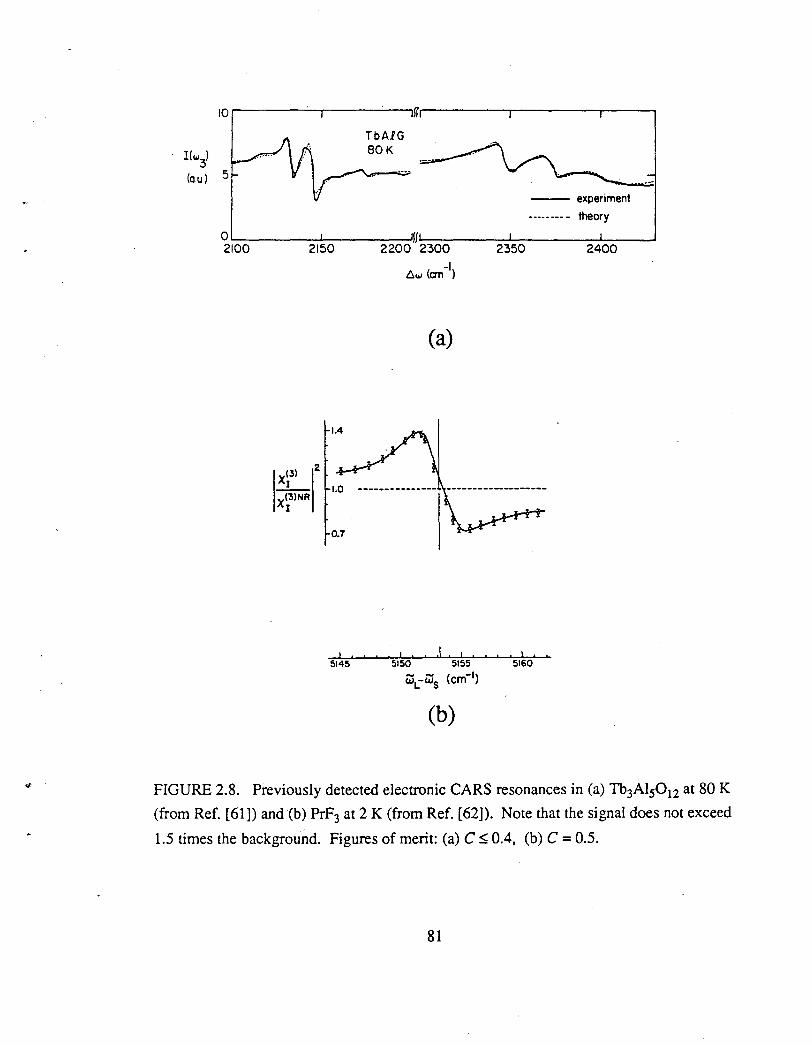
10
l(w3)
(au)
0 2100
fT
TbAlG 80K
fl 2150 2200 2300
-I t:.w (an )
(a)
(3) 2
~ 1.0 ---------------X(3lNR
I
0.7
5145 5150 5155
- - ( -1) wcws em
(b)
-- experiment
--------- theory
2350 2400
5160
FIGURE 2.8. Previously detected electronic CARS resonances in (a) Tb3Als012 at 80 K
(from Ref. [61]) and (b) PrF3 at 2 K (from Ref. [62]). Note that the signal does not exceed
1.5 times the backgrou-nd. Figures of merit: (a) C :5: 0.4, (b) C = 0.5.
81
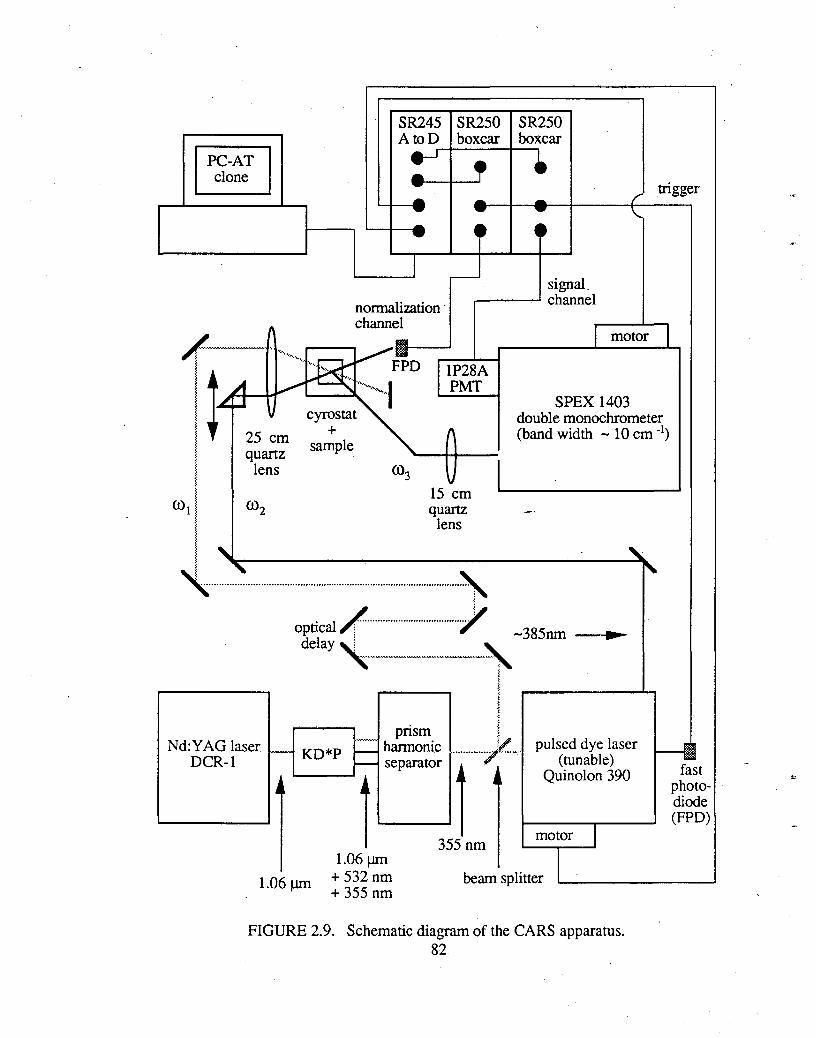
SR245 AtoD
PC-AT clone ..
SR250 boxcar
' SR250 boxcar
-- - - r trigger - - -- 4~ • I
normalization
- signaL .--.-....~channel
"' channel
\1
15 em
1--·-----"'"'··r·--~~FPD 11P28A
! l A v~··-·"·'''·-1 PMT l ..£~ l v cyrostat l + ~ l 25 em sample l quartz I lens I
I motor I
SPEX 1403 double monochrometer (band width - 10 em -1)
ffi' I ' ffiz qfe": - '
~ ....... ~ .. ~.-........ -........ -........ -........ -........ -........ -........ -......... -........ -........ -.~---~1'
optical~ .................................... / - 385nm
delay ~----------~~-----------·-·"-
Nd: Y AG laser. _ KD*P DCR-1
~ l
prism I =harmonic pulsed dye laser
(tunable) Quinolon 390
diode ...._ _ ____. (FPD)
1.06 IJI11
1.06 IJI11 + 532 nm + 355 nm
355 nm motor I beam splitter 1~....--______ __J
FIGURE 2.9. Schematic diagram of the CARS apparatus. 82
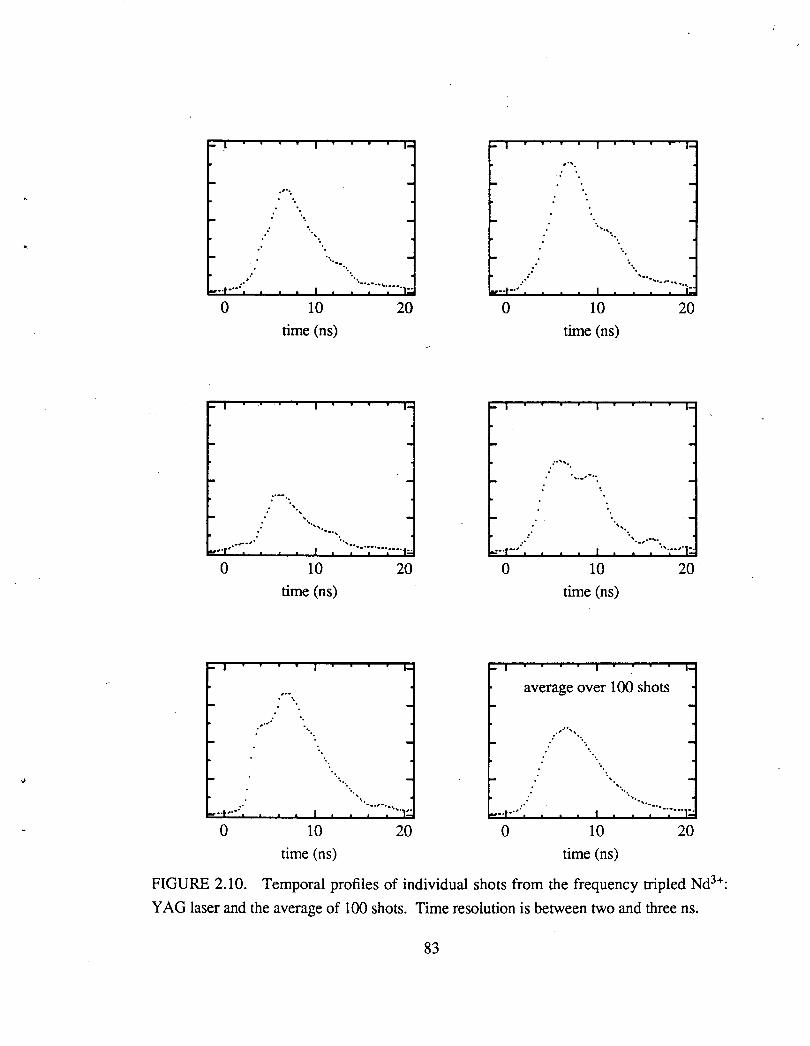
1- .1
1-
1-
1-
.. '
u•·t···'·
0
- I
---
,.,, .. , .. ,.
0
I-I
1-
1-
1-r··•···:· 0
I ·--·'"•.
·. •. -·. ' ·.
.. -··-. .. · .
I ···············l;· 10 20
time (ns)
I ·---
:··· ..
,.,.
· ..... ' -'· ... "'·-...... I ··················1,.
10 20 time (ns)
I
, .. ·.
' ·. ·.
I
10
time (ns)
·--
-
20
I-I
~
1-
~
.. 1-•·t··'
0
I-I
.. ···r···· 0
..
I
, .....
., ....... ·. ·.
·•
I
10 time (ns)
I
· .........
I
10
time (ns)
·-
-
-
-· . ...... .... , .. , .. 1~·
20
·---
.. -""._, .......
·······t· 20
~I I 1-
average over 100 shots
- -_, ........
- : ·· ... -- ' -
'.· ...
-··t···'· I ················,;·
0 10 20 time (ns)
FIGURE 2.10. Temporal profiles of individual shots from the frequency tripled Nd3+:
YAG laser and the average of 100 shots. Time resolution is between two and three ns.
83
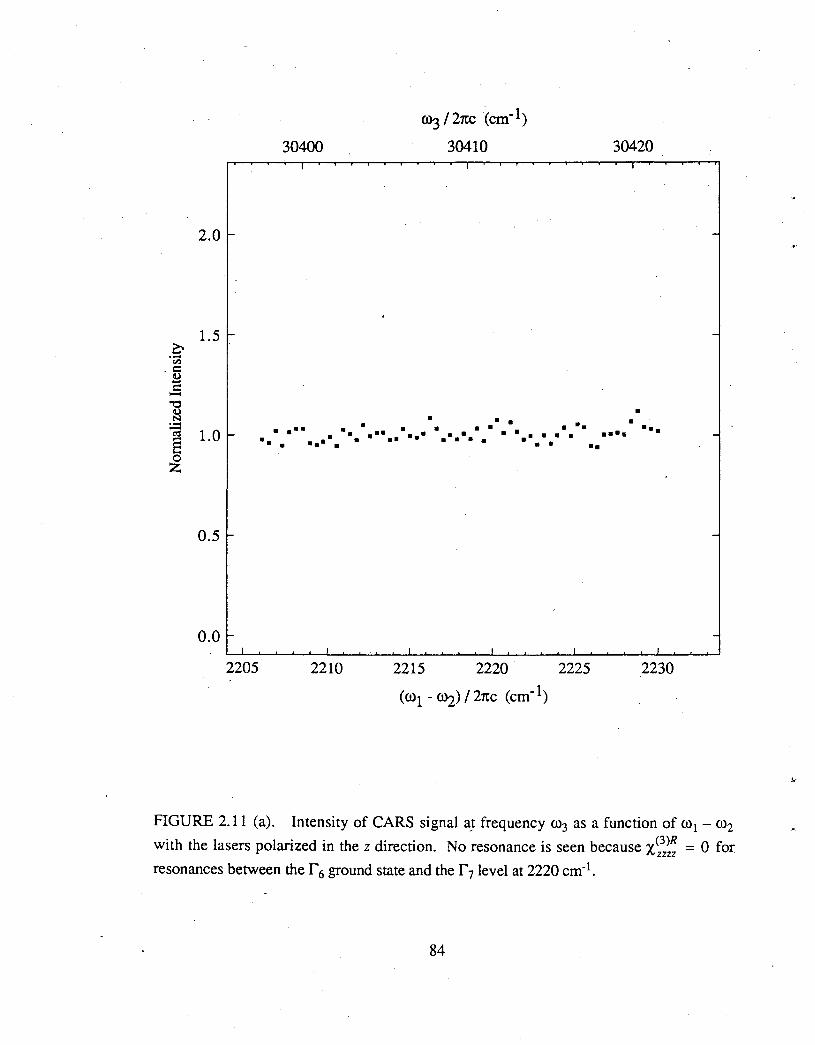
2.0 1-
1.5 -
1.0 1-
0.5 1-
0.0 I-I
2205
30400 I
ffiJ/2rcc (cm-1)
30410
• • •••
••• • • • • •• ••• •••••
• •• • • •• • • • • • • • • • • •••
I
2210 I
2215
• • • • • • • ••
I I
2220 2225
30420 I
-
-
• • ••• •••• -
-
-I
2230
FIGURE 2.11 (a). Intensity of CARS signal a_t frequency co3 as a function of co1 - co2
with the lasers polarized in the z direction. No resonance is seen because x<;;~ = 0 for
resonances between the r 6 ground state and the r7 level at 2220 cm-1.
84
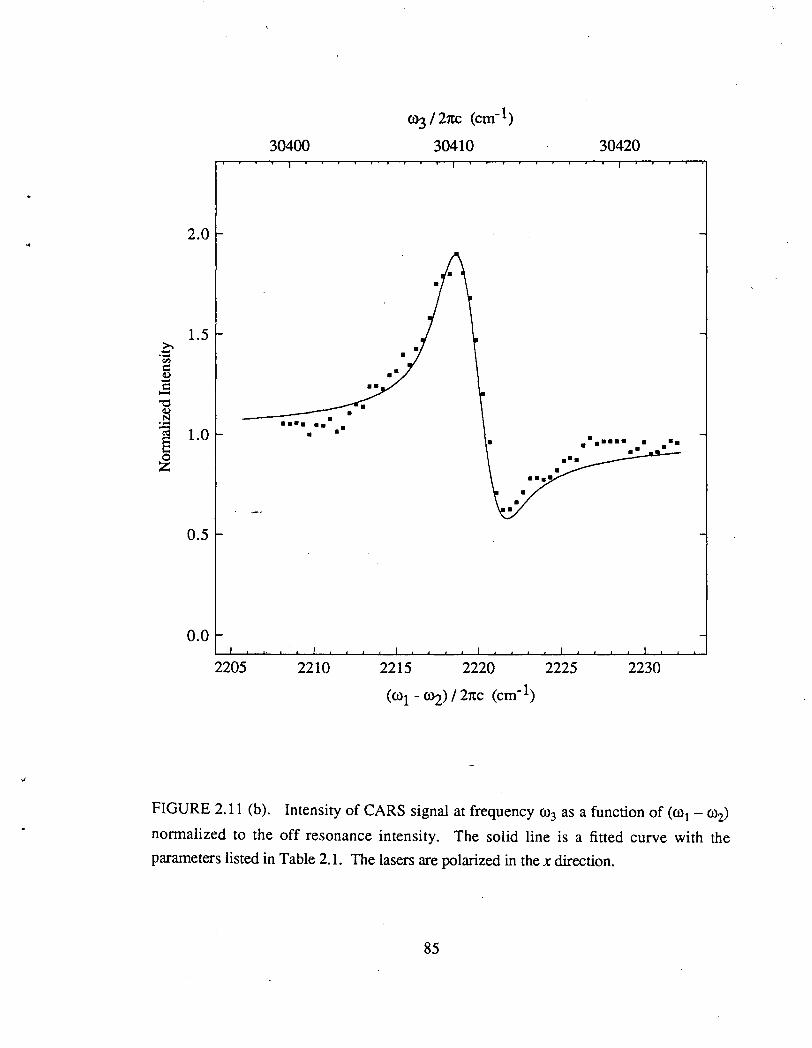
30400
2.0
1.5
0.5
0.0
2205 2210
ro3 I 21tc (cm-1)
30410
2215 2220
30420
2225 2230
FIGURE 2.11 (b). Intensity of CARS signal at frequency ro3 as a function of (ro1 - ro2)
normalized to the off resonance intensity. The solid line is a fitted curve with the
parameters listed in Table 2.1. The lasers are polarized in the x direction.
85
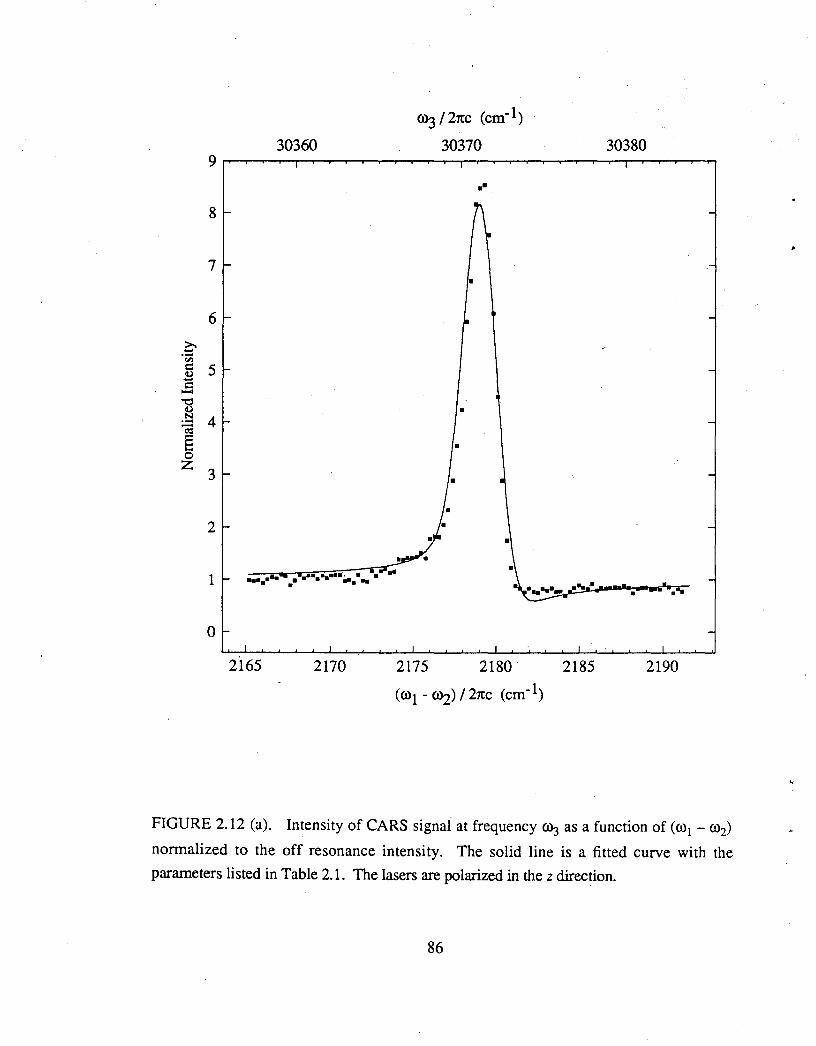
OYJ I 21tc (cm-1)
30360 30370 30380 9
••
8
7 •
6
0 ·-rJl c: 5 0 ...... c: -"'!j 0 II N 4 ·--c:'d e • 0 z
3 •
2
1 • •
0
2l65 2170 2175 2180 2185 2190
FIGURE 2.12 (a). Intensity of CARS signal at frequency ro3 as a function of (ro1 - ro2)
normalized to the off resonance intensity. The solid line is a fitted curve with the
parameters listed in Table 2.1. The lasers are polarized in the z direction.
86
,.
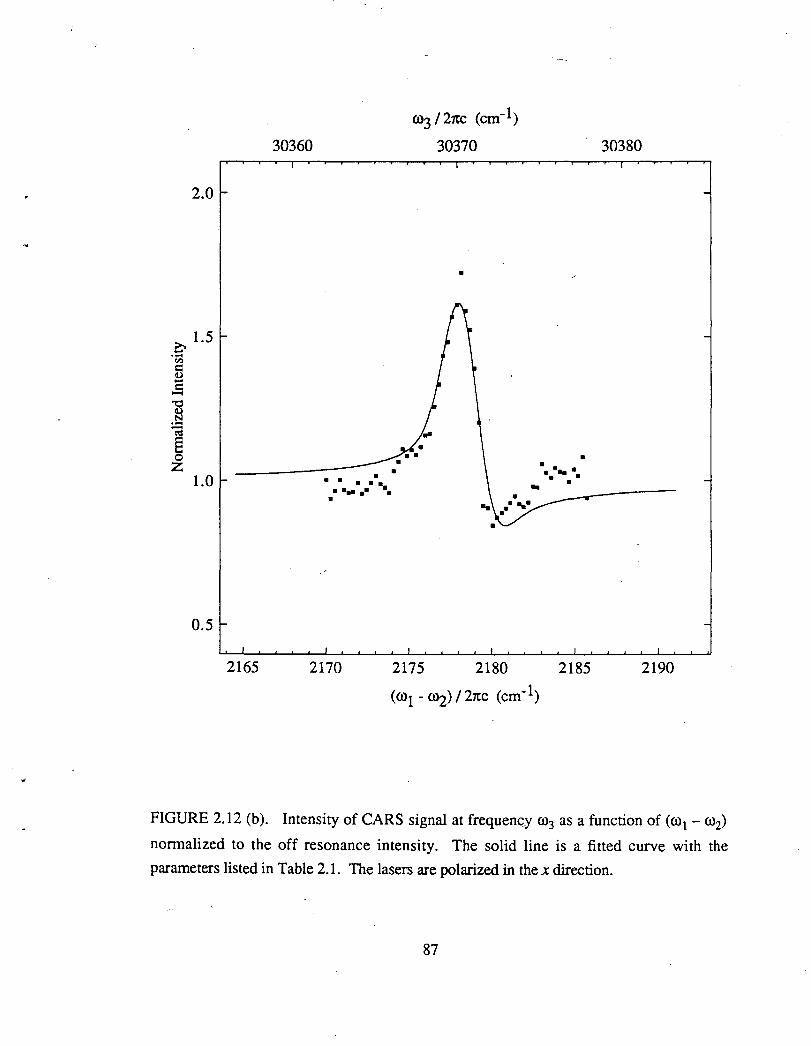
2.0
1.0
0.5
2165
30360
• • • • •• . ... .. · . •
2170
ro3 I 21tc (cm-1)
30370
•
2175 2180
..... • • • • •
2185
30380
2190
FIGURE 2.12 (b). Intensity of CARS signal at frequency COJ as a function of (ro1 - ro2)
normalized to the off resonance intensity. The solid line is a fitted curve with the
parameters listed in Table 2.1. The lasers are polarized in the x direction.
87
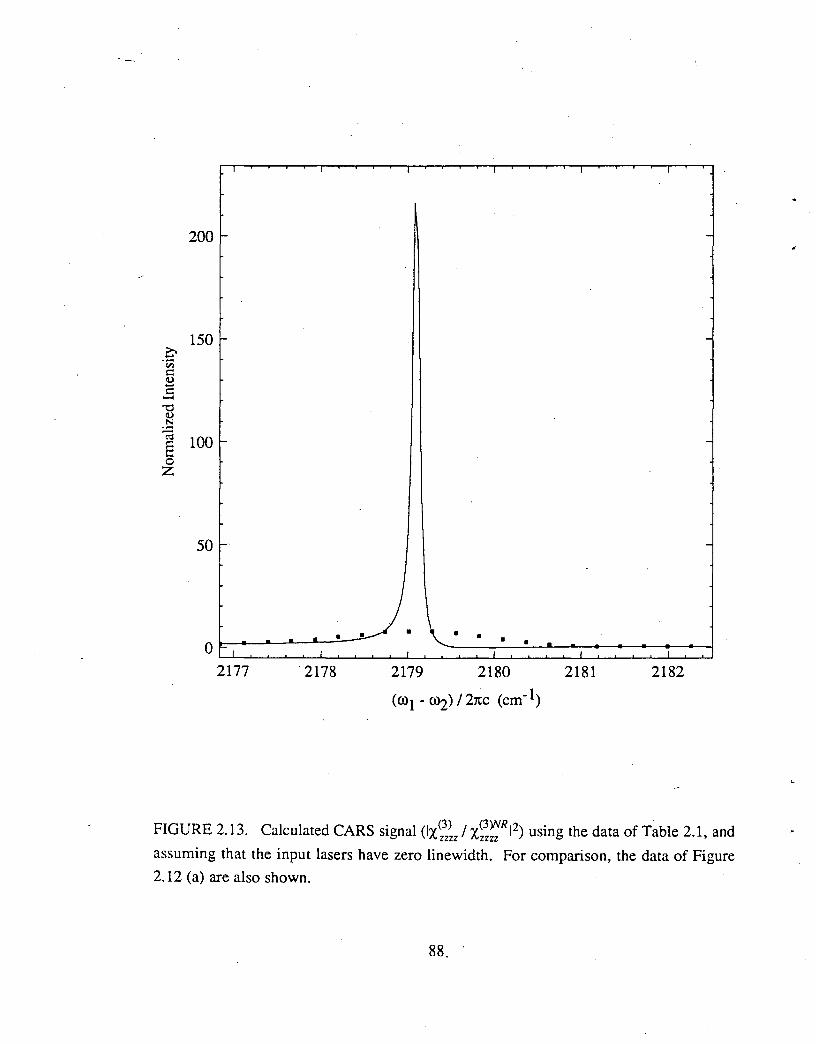
::>. -~ "' c d) ...... c -"C:) d)
.:::: c; a 0 z
I
200 I-
150 I-
100 I-
50 I-
Q F- I
2177
I
. . . • I
2178
r I
• • • • I
2179 2180
I
. . I
2181 I
2182
-
-
-
-
FIGURE 2.13. Calculated CARS signal (IX~lzz I X~~~RI2) using the data of Table 2.1, and
assuming that the input lasers have zero linewidth. For comparison, the data of Figure 2.12 (a) are also shown.
88 ..
Chapter Three
4f ~ 5d Two-photon Absorption in Ce3+:LuP04
My motivation for investigating the 4f ~ 5d two'-photon absorption (TP A) spectra
of the Ce3+ ion in the LuP04 crystal was to locate and determine the symmetry of the
crystal field components of the 5d configuration. Knowledge of the nature of the 5d states
is vital to understanding electronic Raman processes. The calculations of relative CARS
intensities in Chapter 2 (Table 2.2) require accurate electronic wavefunctions for the 5d
levels. Williams et al. calculated electronic wavefunctions from a crystal field fit of the 5d
configuration. They used single-photon absorption spectra to locate the 5d levels., They
experimentally located the zero-phonon line and determined its symmetry for only lowest
5d level. The energies of zero-phonon lines in the higher crystal field levels were not
observed - they were estimated, and the symmetries of the higher levels were derived from
the crystal field fit.
89
By measuring polarized TPA spectra, I confirmed that the zero-phonon line of the
lowest 5d level is at 30460 cm·1, and its symmetry is r 7• This is consistent with results
from single-photon absorption spectra. Additionally the two-photon spectra shows the
next crystal field level has its zero.:.phonon line at 39715 cm·1, with symmetry is r 6. The
two-photon spectra of higher lying levels do not reveal any information.
This chapter is organized as follows: Section 3.1 introduces the theory of two
photon absorption in the context of four-wave mixing. Section 3.2 reviews previous 4f ~
5d TPA experiments. Section 3.3 briefly reviews TPAselection rules. The apparatus for
detection of TPA is described in section 3.4. Section 3.5 presents and discusses the
results.
3.1 Theory of Two-photon Absorption
In 1931 Goeppert-Mayer predicted the TJ:> A process using time-dependent
perturbation theory [93]. In the TPA process, a state with energy 21iro is populated by the
simultaneous absorption of two quanta of energy Jiro. The two-photon absorption
coefficient is proportional to the square of the intensity of the incident light. As a res.ult of
this nonlinear intensity dependence, it was not until after the invention of the laser that this
process was actually observed [94]. TPA allows access to energy levels which may be out
of the frequency rang(( of available light sources. (See Figure 3.1.) In addition, selection
rules for two-photon transitions may differ from those of single photon transitions. As a
consequence, TPA spectroscopy may be used to compliment single photon spectroscopy,
and to determine the symmetry labels of energy levels.
TP A may also be described within the framework of four-wave mixing as in section
2.1. Assume that a plane wave, polarized in the i direction, is traveling in the z direction.
90
E(r, t) !. E (z) ei(kz - rot) + c. c. 2 (3.1)
and that the plane defined by z = 0 is the boundary between vacuum and a nonlinear
medium. Within the medium, there is a nonlinear polarization generated via the th4"d-order
.b.li (3) ( ) susceptl 1 ty tensor X iiii -{J), ro, ro, -ro :
p.NL I X p~ (- (JJ (JJ (JJ _ (JJ) E.£.£~ ei(kz - rot)
1111 ' ' ' I I I (3.2)
Note that the induced polarization travels in phase with the incident wave. This means that
phase matching is automatically satisfied. Use of the same methods and approximations as
in section 2.1.1 yields
(Compare with equation (2.7).) Since the intensity,/, of the wave is given by
I
equation (3.3) may be rearranged as
a -l(z) ()z [
321t'2
(3) ] 2 - ImXiiii (-(JJ, (JJ, (JJ, -(JJ) (JJ/ (z) n2( (JJ) c2
(3.3)
(3.4)
(3.5)
Thus for TPA, attenuation of the intensity is proportional to the square of the intensity and
the imaginary part of the susceptibility. Since the nonresonant part of the susceptibility is a
91

real number, one only needs to be concerned with the resonant susceptibility. From Ref.
[54],
Im x(~~R 1111 (3.6)
where
M·· II I
(3.7)
and g (1i(2ro- rog~)) is a normalized Lorenztian function with linewidth 1if' gf The kets lg ),
If), and In) correspond to the ground, final, and intermediate states with energies zero,
lirog~. and lirogn· (See Figure 3.1.) The number density of ions is N, and r gf is the
Lorentzian linewidth (HWHM) of the lg)-? If) transition. Equation (3.6) predicts that the
TP A will peak when 2ro = rogf . . Note that the TP A matrix element Mii is very similar to the
Raman tensor in equation (2.18). It is evident from equation (3. 7) that if the states I g) and
If) are parity eigenstates, then TPA from lg) to !f) can occur only if both states have the
same parity.
3.2 4f~5d Two-photon Absorption
In the first order, two-photon transitions between the 4f and 5d configurations are
parity forbidden (fl/ = 1). In a crystal, the odd parity components of a non-
centrosymmetric crystal field or the odd parity lattice vibrations may relax the parity
selection rules, and 4f-? 5d two-photon absorpti.on may be observed. Gayen, eta/. have
92
extensively studied 4f---? 5d two-photon transitions in Ce3+:CaF2 [95-98]. They measured
the TPA cross section for the zero-phonon line of the lowest 5d level to be 5 x 10·54 cm4 s.
Typical TPA cross sections for parity allowed two-photon transitions range from 10-49 to
10·51 cm4 s. Leavitt [99] and Sztucki and Strek [100] have contributed to a theoretical
understanding of 4f---? 5d two-photon absorption.
The first observation of TPA involved the 4!1 ---? 4f 65d transition in Eu2+:CaF2
[94]. With the exception of the work by Gayen, et al. and Bayer and Schaak [101], most
subsequent TPA experiments in rare earth crystals [102] concentrated on the sharp, parity
allowed 4fn ---? 4fn transitions.
3.3 Selection Rules
The TPA matrix element in equation (3.7) has the same selection rules as the Raman
tensor. Therefore, the· selection rules for the TP A susceptibility tensor are the same as the
CARS selection rules (section 2.4):
(3)R 'Xiiii allowed for i = x, y, z. (3)R • (3)R 0 X.w; allowed for z = x, y (Xzzzz = ).
In this case i is the polarization of the incident radiation. Recall that the ground state in
ce3+:LuP04 has symmetry r 6.
3.4 Experimental Details
Figure 3.2 shows the experimental apparatus.
93
A frequency doubled (tripled) Nd3+:YAG laser (Spectra~Physics DCR-1) pumped a
pulsed dye laSer which used DCM (LD489) laser dye to provide tunable radiation in the
14900 to 16500 cm·1 (18800 to 21200 cm-1) range. The pulsed dye laser linewidth was
about 0.5 cm·1• These frequency ranges allowed the two-photon investigation of the
lowest 5d level (DCM) and the next two higher 5d levels (LD489). (Table 1.2 lists the 5d
levels of Ce3+:LUP04.) The energy per pulse of the incident radiation was about 500 ~-
The light from the pulsed dye laser was focused on the sample by a 15 em lens. The
focused laser light passed through about 2 mm of the sample. A Spectra-Physics 310-21
broadband polarization rotator allowed measurements to be made with the incident light
polarized in the z and x directions. The transmitted light was attenuated and detected by a
biased photodiode (EG&G 100A). The sample was cooled to .... 10 Kin a Janis Supertran
cryostat as in Chapter 2.
Two-photon absorption can be a weak process. Rather than attempt to detect the
minute attenuation in the laser beam as it passes through the sample, the 5d -7 4f
fluorescence which results from the two-photon excitation was measured. (See Figure
3.3.) This actually is a much more sensitive measure of absorption, since the background
is zero. The fluorescence from the lowest 5d level to the 4/ levels is in the ultraviolet
(27000- 30000 cm-1) while the laser excitation is in the visible. Therefore, two ultraviolet
filters (Corning 7 -54) which pass ultraviolet, while blocking the visible were used to
discriminate the fluorescence from the excitation. An RCA 1P28A photomultilplier tube
covered with the two filters was placed at the window of the cryostat in order to collect the
greatest amount of light. The 5d -7 4f fluorescence has a lifetime of 20 ns. The signal
from the PMT was detected with a SRS 250 boxcar averager with a 30 ns gate. The boxcar
gate was delayed by 10 ns after the 5 ns laser pulse to further discriminate the florescence
signal from the laser (see Figure 3.4). Another boxcar measured the signal from
photodiode. As in Chapter 2, a personal computer collected individual measurements of
94
the 5d ~ 4f fluorescence signal, normalized this signal to the square of the intensity for
each laser shot, and averaged these values over 7 5 laser shots. After collecting each set of
data, the computer scanned the dye laser to a new frequency. This yielded the two-photon
excitation spectra in Figures 3.5, 3.6 and 3.7.
3.5 Results and Discussion
Figure 3.5 shows the two-photon excitation spectra of the lowest 5d level in both
the x and z polarizations. The x polarized spectrum is much more intense than the z
polarized spectra leading to the assignment of this level as r 7. The z polarized spectra is
probably due to some polarization leakage. The single photon spectra [23] shows very
little polarization dependence and is also consistent with the assignment of r 7• Figure 3.6
shows the x polarized two-photon spectrum along with the single photon spectrum from
Figure 1.9. Note that both spectra show the zero-phonon line at 30460 cm-1. Additionally,
many peaks in the two-photon vibronic sidebands correlate with the single photon
sideband. Probably the most interesting feature is the intensity of the zero-phonon line
compared to the vibronic sideband. The zero-phonon line is much more prominent in the
two-photon spectrum than in the single photon spectrum. Gayen eta/. observed the same
feature in Ce3+:CaF2 [95, 97].
95
The two-photon spectra of the higher 5d levels differed from the lowest 5d levels.
Figure 3. 7 shows the only distinct feature in the excitation spectra from scanning the laser
from 18800 to 21200 cm-1 (corresponding to two-photon energies of 37600 to 42400
cm-1 ). I interpret this as the zero-phonon line of the of the second 5d level. Since it was
detected in both z and x polarizations, the r 6 symmetry label is assigned to this level.
Another possible explanation for this feature is as follows: If an impurity ion with
an energy level at 19857 cm-1 exists within the host crystal, an incident photon may
populate this level. With this level populated, the higher 5d level of the Ce3+ ion may be
populated by a the absorption of another 19857 cm-1 photon in an energy transfer process.
There are two reasons to doubt this. Both the Ce3+ and the impurity ion have very low
concentrations making energy transfer unlikely. Additionally, no rare earth ion doped into
LuP04 has an energy level at 19857 cm-1•
The signal for the two-photon spectra of the zero-phonon line at 39715 cm-1 was
weaker than the zero-phonon line of the lowest 5d level, and there was a non-zero ·
background. This non-zero background may be a continuation of the vibronic sideband of
the lmyest 5d level, or, alternatively, ultraviolet fluorescence may be excited by multi
(greater than two )-photon absorption into the crystal band gap.
Using calibrated filters, I determined that the florescence resulting from the two
photon excitation of the higher levels originates in the lowest 5d level. Therefore,
excitation non-radiatively decays from the higher 5d levels to the lowest 5d level. (see
Figure 3.2(b).) The zero-phonon line of the third 5d level was not observed. Presumably,
this level is extremely broadened by non-radiative decay to second 5d level. It is not
surprising that no vibronic sideband was observed in the second 5d level since the peaks of
the sideband are probably much weaker than the zero-phonon line.
96
The symmetry assignments for the two lowest 5d levels are at odds with those
reported by Karanjikar and Niak [103] for Ce3+ in YP04• Since the structure of YP04 and
LuP04 are nearly identical, one expects the spectra of Ce3+:LuP04 and Ce3+:YP04 to be
very similar. Indeed, the 5d energy levels reported for Ce3+: YP04 are quite close to those
listed for Ce3+:LuPO 4 in Table 1.2. The symmetry assignments of Karanjikar and Niak are
extrapolated from the work of Nakazawa and Shinoya [22] and are probably iri error. Th~
symmetry assignments of the two lowest 5d levels in this work rely on the fact that the
ground state has symmetry r 6• The electronic Raman work of Williams et al. [23, 25] has
demonstrated this to be the case with no ambiguity.
3.6 Summary
I have demonstrated the use of two photon absorption to locate and determine the
symmetry of 4f ~ 5d zero-phonon lines in Ce3+:LuP04 at low temperature. Two-photon
absorption has some advantages over single photon absorption. (1) Ultraviolet levels can
be easily accessed with visible lasers. (2) Zero-phonon lines seem to be easily
distinguished from the vibronic sideband.
97
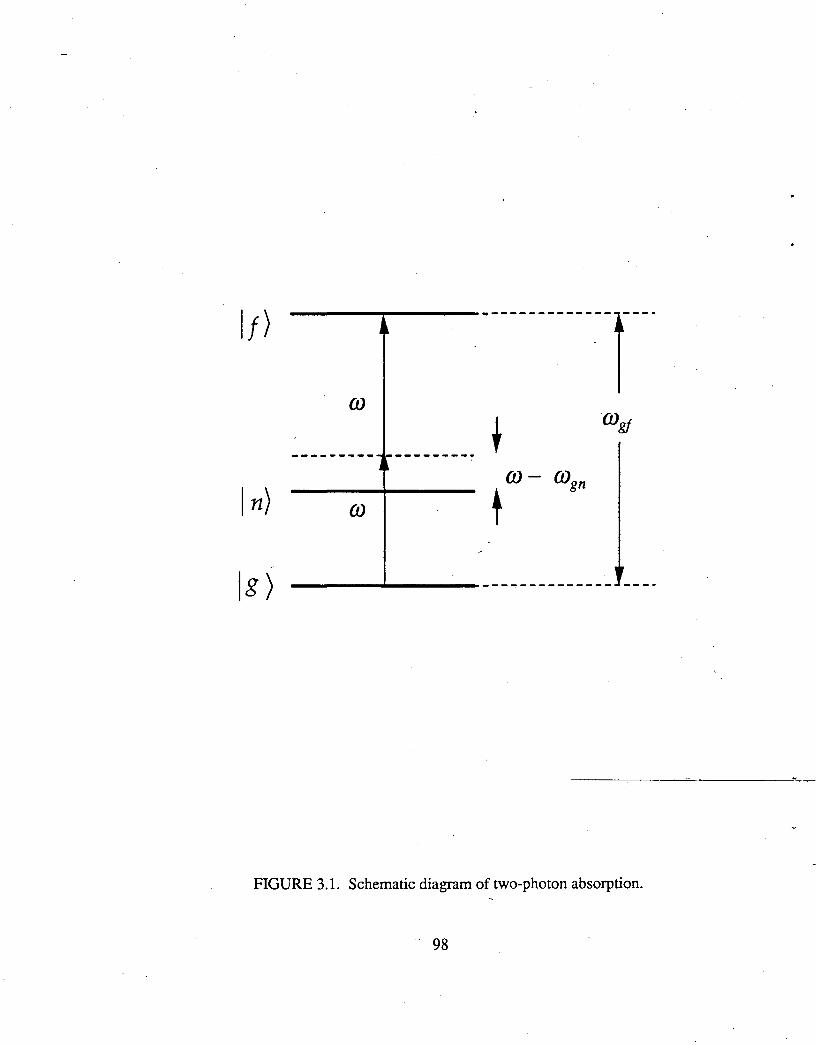
It) --------------r-·
In)
--------~----------------------
------,----~---------'"'--
FIGURE 3.1. Schematic diagram of two-photon absorption.
~ 98
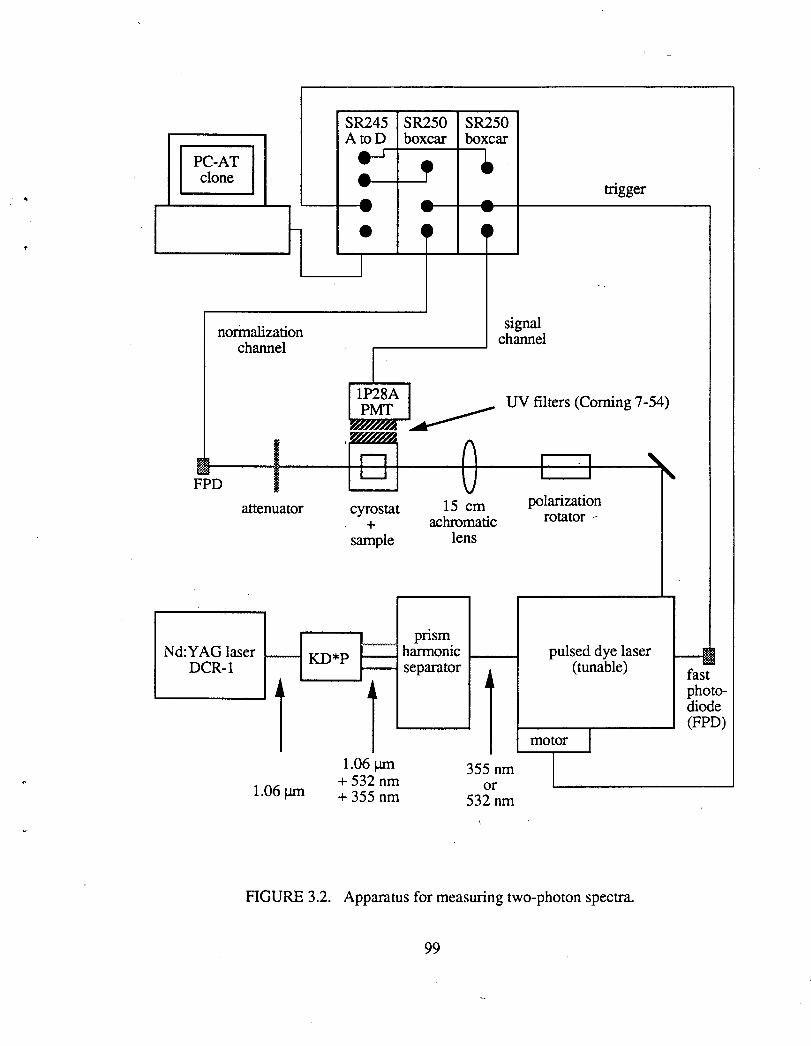
~
PC-AT clone
-
normalization channel
SR245 AtoD
.. ---•
I
SR250 boxcar
' --4t
SR250 boxcar
--4t
signal channel
trigger
l~A L-- UV filters (Coming 7-54)
" m•----~--~+r.-r~--++----~'~·+'----'~ FPD L.J I ' v
attenuator
Nd: Y AG laser -DCR-1
1 1.06 J.lrl1
KD*P
cyrostat +
sample
·-~·
1--1--
1 1.06 J.lrl1
+ 532 nm + 355 nm
15 em achromatic
lens
prism harmonic separator
J
355 nm or
532nm
polarization rotator ~
pulsed dye laser (tunable)
motor I I
FIGURE 3.2. Apparatus for measuring two-photon spectra.
99
HI fast photo-diode (FPD)
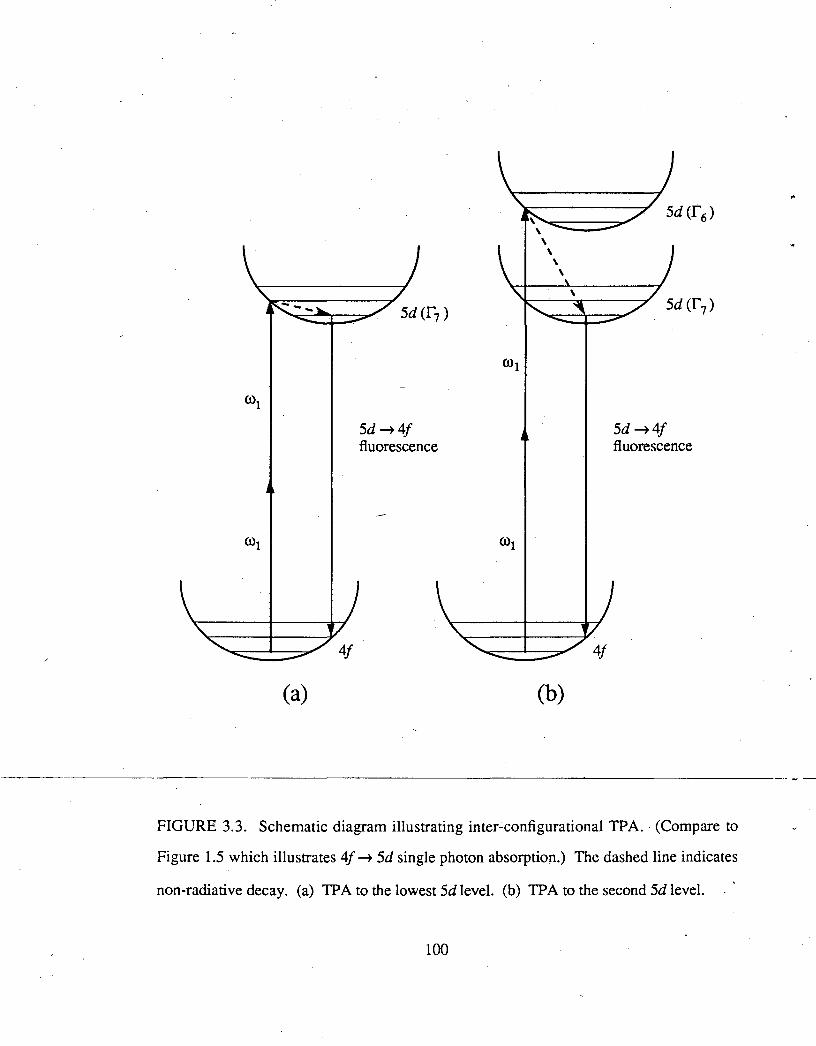
(a)
5d~4f fluorescence
(b)
5d~4f fluorescence
FIGURE 3.3. Schematic diagram illustrating inter-configurational TPA. (Compare to
Figure 1.5 which illustrates 4f ~ 5d single photon absorption.) The dashed line indicates
non-radiative decay. (a) TPA to the lowest 5d level. (b) TPA to the second 5d level.
100
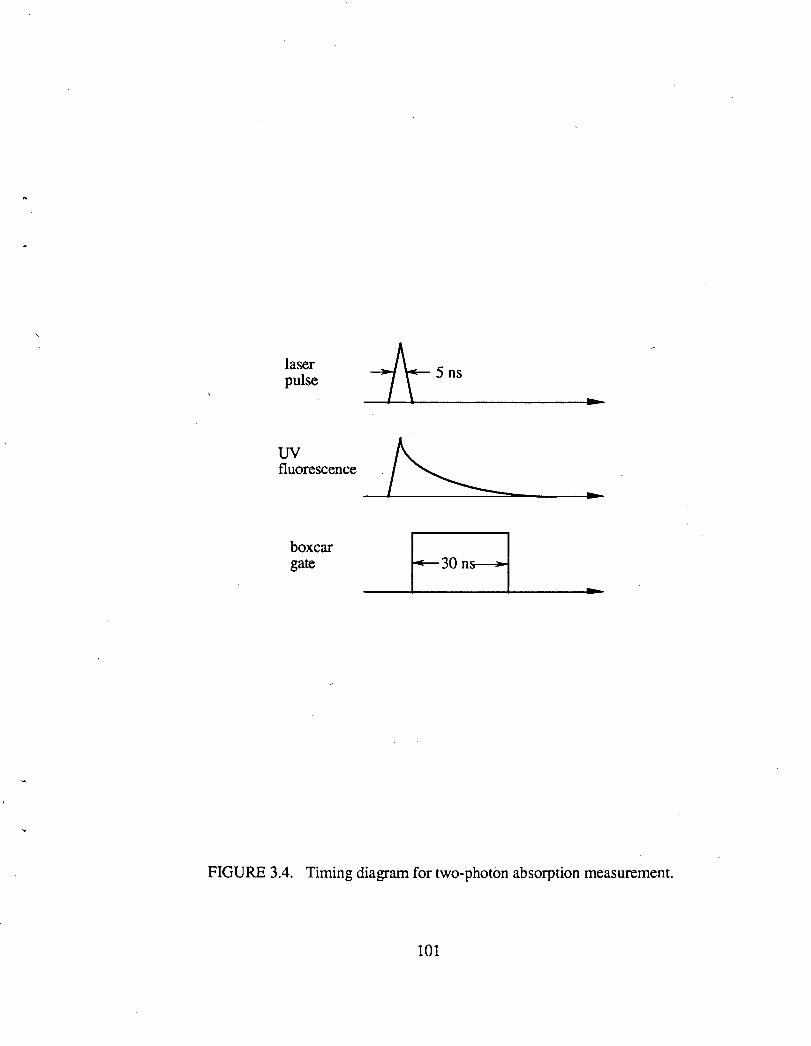
laser ±5ns pulse ... uv ·~ fluorescence
...
t30n~ boxcar gate
...
FIGURE 3.4. Timing diagram for two-photon absorption measurement.
101
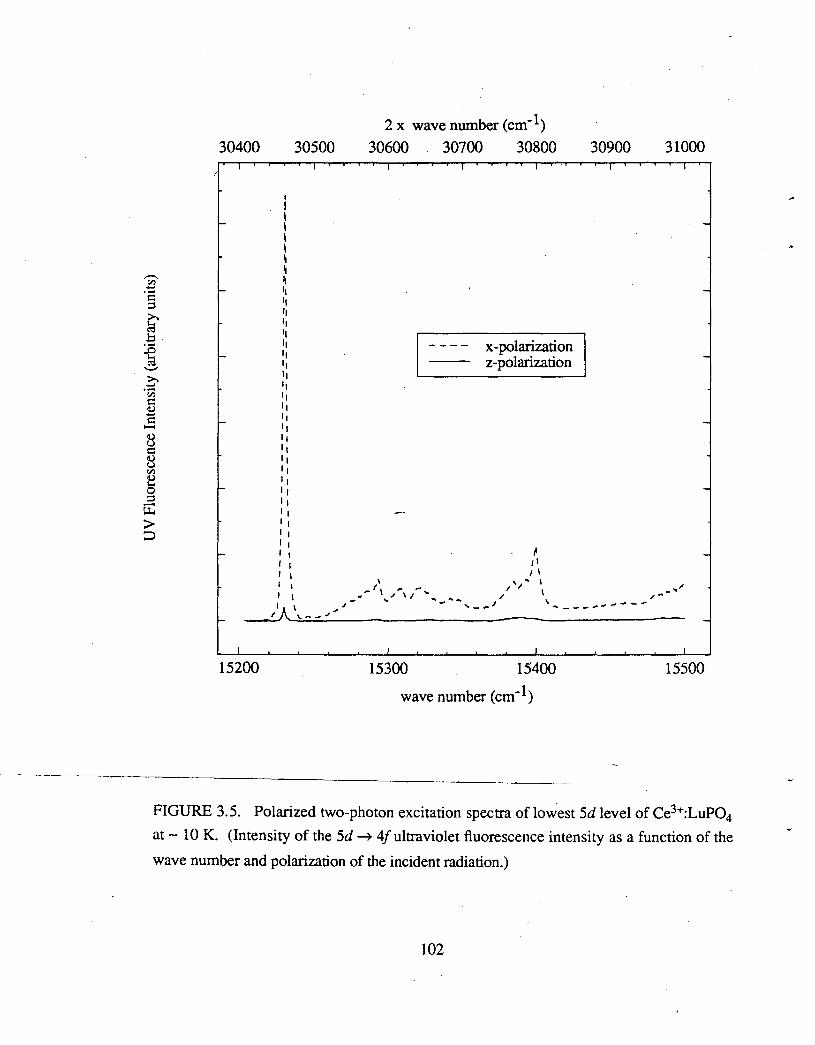
30400
I I I
II II II II I I I I I I I I I I I I I I I I
30500
I I " ~\, __ ..,,
15200
2 x wave number (cm-1)
30600 30700 30800
15300
x-polarization z-polarization
15400
wave number (cm-1)
30900 31000
15500
FIGURE 3.5. Polarized two-photon excitation spectra of low'est 5d level of Ce3+:LuP04
at - 10 K. (Intensity of the 5d -7 4f ultraviolet fluorescence intensity as a function of the
wave number and polarization of the incident radiation.)
102
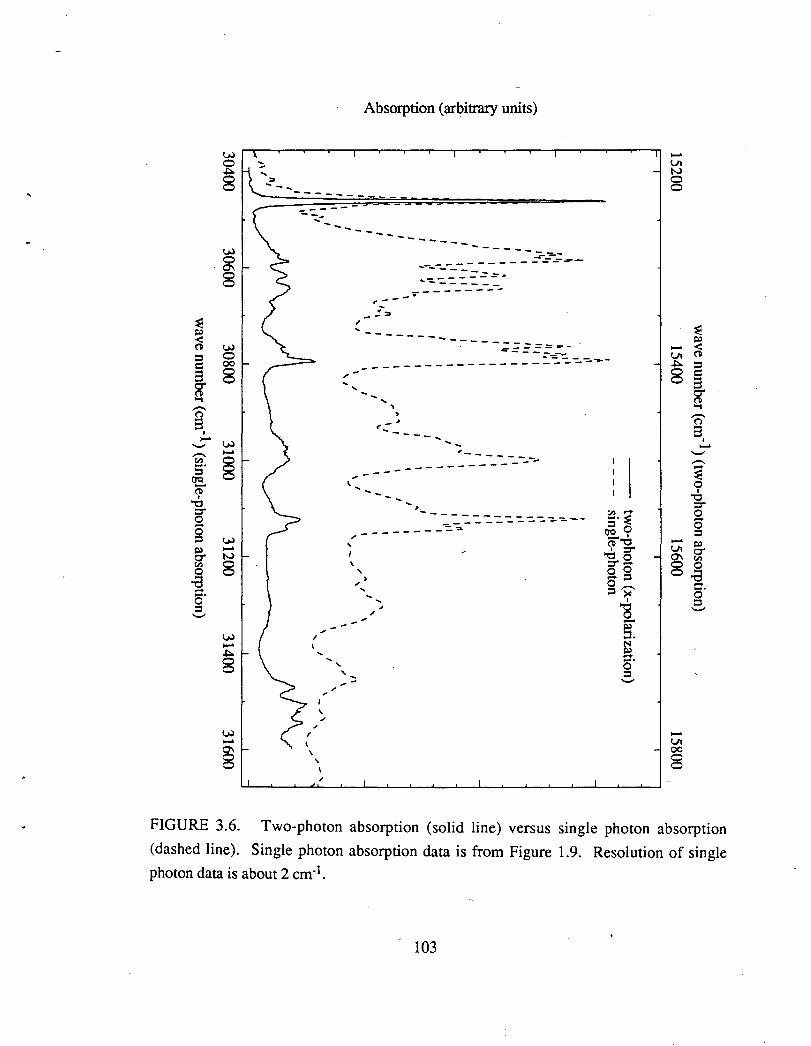
Vl 0
§
Vl 0 00
8
-§
Vl -N
8
Vl -~ 8
\
"
' I "
---
" ...
,. ' I \
' "
Absorption (arbitrary units)
--- -------- --------?~.;.. __
--· .. -~---
-------- - - ---~-=-~~-:-:=~ ------
-------
' • .-: --- -.. _ ----------------------
·---- -----=--=-~-::.~~~---_____ =.-,---
)
... ' " "
.... ... ... :::
;
-Ul N
8
-Ul 00
8
FIGURE 3.6. Two-photon absorption (solid line) versus single photon absorption
(dashed line). Single photon absorption data is from Figure 1.9. Resolution of single
photon data is about 2 cm-1.
103
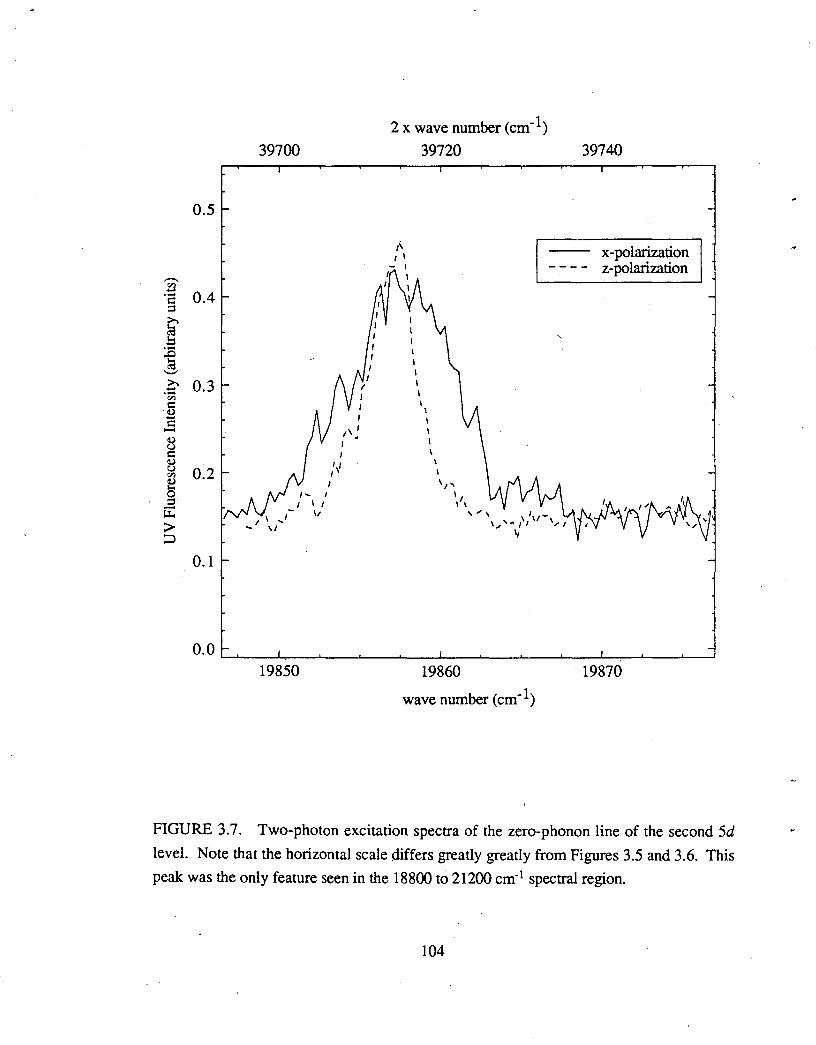
39700
19850
2 x wave number (cm-1)
39720
19860
wave number (cm-1)
39740
FIGURE 3.7. Two-photon excitation spectra of the zero-phonon line of the second 5d
level. Note that the horizontal scale differs greatly greatly from Figures 3.5 and 3.6. This
peak was the only feature seen in the 18800 to 21200 cm-1 spectral region.
104
Chapter Four
Electronic Coherent Anti-Stokes Raman Spectroscopy in CeF3
This chapter reports on CARS resonances detected between the 2F sa ground state
and the 2161 cm-1 and 2239 cm-1 Stark components of the 2F7a manifold of the Ce3+ ion in
the CeF3 crystal at 3.8 K. The reader is invited to review section 1.6 which discusses the
properties of the CeF3. In Chapter 2~ I demonstrated that strong electronic CARS
resonances (C > 15) could be detected in a dilute crystal (0.06 mol% Ce3+ doped into
LuP04) only when the anti-Stokes signal was nearly resonant with the onset of the lowest
5d level at 30460 cm-1. This chapter reports the observation of singly resonant electronic
CARS in a fully concentrated cerium crystal - CeF3. In CeF3 , the levels of 5d
configuration range from about 40000 to 50000 cm- 1• This rather low energy 5d
configuration is responsible for a relatively large electronic Raman cross section. This
large cross section leads to a high figure of merit, and the detection of strong CARS
resonances (C > 1) with visible lasers should be possible.
105
Measurements were made with both the visible (},.1 = 476 nm, A.2 = 532 nm) and
near ultraviolet (A.1 = 355 nm, ~ = 385 nm) lasers. The enhancement of the third order
susceptibility due to the electronic resonances C = lx,<3)RJx,<3)NRimax is as great as 4.8. This
represents an ordet:" of magnitude increase over singly resonant electronic CARS
experiments in other pure rare earth crystals. The CARS data also allowed accurate
measurement of the Ce3+ electronic Raman cross sections. In the visible region, <Jzz (2161
cm-1) = (5.0±1.1) x 10-30 cm2, and <Jzz (2239 cm~1 ) = (1.9±0.7) x 10~30 cm2. Both the
absolute magnitude and dispersion of lx,<3)Rimax could be calculated by modeling the virt~l
intermediate states as a single degenerate 5d state at 45000 cm-1.
In the CeF3 crystal, the spectra of both the ground 4f and excited 5d configurations
[8, 28, 32-38] as well as the linear [39] and nonlinear [40, 41] refractive indices have been
characterized. From the linear and nonlinear refractive indices, x,<3)NR may be estimated.
Experimental CARS measurements yield lx,<3)RJx,<3)NRimax which lead to an absolute
measurement of lx,<3)Rimax· The spontaneous Raman cross section may be derived from
lx,(3)Rimax·
In the appendix of this chapter, lx,(3)Rimax is calculated using the Axe [ 1 04] ·theory of
two-photon processes which follows the Judd-Ofelt [105, 106] theory for 4fn~41n single
photon intensities. Both involve summations over intermediate states of excited electronic
configurations whose parity is opposite that of the ground 4fn configuration. In both
theories, calculations are simplified.by assuming that all electronic states within each
excited config!Jration are degenerate in energy. Absolute two-photon intensities may be
calculated if the energies Jiron/ of the excited nl configurations and radial integrals 1(4/lrln/ )I
are known. Usually, the 4j<n-l)5d1 configuration is expected make the major contribution
to the intensity since other excited states of opposite parity (e. g. 4J<n-l)ng1 ) are too high
in energy to contribute appreciably. Most previous work [102] on two-photon 4fn~4fn
transitions (two-photon absorption and electronic Raman scattering) in rare _earth crystals
106
measured relative intensities, and application of the Axe theory did not require knowledge
of 1iro5d and 1(4flrl5d)l. Chase and Payne [107], however, measured absolute two-photon
absorption cross sections of the Nd3+ ion in YAG and LiYF4 crystals. They found a
significant difference in cross sections between the host crystals which suggested that 1iro5d
and 1(4flrl5d)l differ from their free ion values and vary according to the host crystal.
For most trivalent rare earth ions, the 4f<n-l)Sd1 configuration lies in the vacuum
ultraviolet. When the ion is introduced into a crystal lattice, these states are often well
above the crystal band gap, and experimental evaluation of 1iro5d and 1(4flrl5d )I is
impossible .. For Ce3+ systems, however, the states the 5d configuration are usually in the
20000 to 60000 cm-1 range, and 1iro5d and 1(4flrl5d )I may be derived from absorption
measurements. This allows an independent test of the Axe theory, which uses the same
approximations as the more familiar Judd-Ofelt theory. (The quantities which characterize
absolute single photon intensities in the Judd-Ofelt theory are related to the odd parity
components of the crystal field, and cannot be measured in an independent experiment.)
Williams et al. [23, 24] studied the Ce3+ ion in LuP04, and related the observed
absolute electronic Raman cross sections to observed 4/ ~ 5d oscillator strengths and a
reduction of I( 4flrl5d )I relative to its free ion value.
In this chapter, both 1(4flrl5d)l and 1iro5d for CeF3 have been derived from 4f ~ 5d
absorption measurements. lx<3)Rimax is then calculated from the Axe theory, and compared
with experimental measurements. In Ce3+:LuP04 the 5d configuration is split into five
levels which range from
There are two main conclusions to be drawn from this chapter. One is that the
electronic CARS signals in rare earth crystals may be significantly greater than reported in
earlier experiments. Additionally, both the magnitude and dispersion of 1x<3>R1max agree
with the predictions of the Axe theory in which the states of the excited 5d configuration are
the dominate intermediate states.-
107
Section 4.1 compares the resonant and nonresonant third-order susceptibilities for
electronic CARS in CeF3 , and gives an estimate of C, Section 4.2 outlines the
experimental procedure which is essentially that of Chapter 2, with a few modifications.
Section 4.3 presents the experimental data and analysis. Section 4.4 summarizes the
CARS experiment. Section 4.5 discusses the applicability .of these results to stimulated
electronic Raman scattering. In the appendix to this chapter, lx<3)RJx<3)NRI is calculated
using the Axe theory of two-photon transition intensities in atomic systems. The second
appendix to this chapter deals with stimulated electronic Raman gain.
4.1 The Resonant and the Nonresonant Susceptibility
The optical properties of the CeF3 crystal outlined in section 1.6 allow the
calculation of both ..,<3)R and ..,<3)NR l'..zzzz l'..zzzz •
4.1.1 The Resonant Susceptibility
For the CARS measurements with visible lasers, a frequency-doubled Nd3+:YAG
laser provides ID]_/21tc = 18794.3 cm-1. A tunable laser operating in the 21000 c_m-1 region
provides co1. The CARS signal at co3 = 2ro1 - ro2 is then in the co3/27tc = 23200 cm- 1
region. (See Figure 4.1.) The magnitude of the resonant third-order susceptibility tensor
peaks when 1i(co1 - ro2) is equal to .tirogf, the energy of the Raman transition. In the
appendix, the maximum value of IX~~;~ ( -ro3, ro1, ro1, -ro2)1, is calculated using the Axe
theory of two:-photon processes. This calculation is based on the following assumptions:
• The 5d intermediate states are the dominant intermediate states for the calculation
of the Raman tensor. Additionally, the 5d intermediate states are treated as if all
108
have the same energy (following the work of Judd [105], Ofelt [106] and Axe
[104]).
• The 4flevels are treated in the zero crystal field limit, meaning that the states have
spherical (i.e. atomic) symmetry.
~ The quantity (4/1 r I 5d) is derived from oscillator strength measurements in
c&+:LaF3•
In addition, the methods used in the appendix are also used to calculate the total
spontaneous electronic Raman cross section, crzz· (The indices correspond to the
polarizations of the incident and scattered light, respectively.) -
The results given in the the appendix show that for a CARS resonance between the
ground state of the 2F 512 manifold and one of the four Stark components of the 2F 112
manifold, the maximum of resonant third-order susceptibility is
I (3)RI (2F. 2p ) _ Xzzzz max 5/2 H 7/2 -
1.3 x 10⁻¹⁴ esu
r' (4.1)
where r' is the linewidth (HWHM) of the Raman transition in cm-1• The linewidths for
electronic Raman transitions between Stark components in rare earth crystals at low
temperature should range from about 0.5 to 10 cm-1. The lowest (metastable) level in a
manifold usually has the smallest linewidth. As discussed in section 2.3.1, the value in
equation (4.1) is on the high end for electronic CARS in fully concentrated rare earth
crystals.
109
4.1.2 The Nonresonant Susceptibility
In a CARS experiment the nonresonant susceptibility is responsible for the constant
background in the signal. The nonresonant susceptibility is related to the product of the
linear.(~) and nonlinear (nz) indices of refraction [108]:
X,(3)NR(-tH... (J) (J) r.l...) zzzz """j' 1 ' 1 ' - -.r.l :::::
n ( md n 2 ( m1 )
127t' (4.2)
Using the data of Ref. [39] for n and that of Refs. [ 40] and [ 41] for n2 yields x<3)NR
= 6.1 X lQ-lS esu at 1.06 ~m. The quantity X(3)NR is slightly dispersive, and changes
(slowly) with increasing frequency. Sheik-Bahae, et al. [109] have shown that the
dispersion of n2 is a consequence of two-photon absorption to the crystal band gap, just as
the dispersion of n is a consequence of single photon absorption. They applied a Kramers
Kronig ·analysis to a two-parabolic-band model to arrive at
(4.3)
where
G2(x) -2 + 6x - 3x 2 - ~x4 - ~x 5 + 2(1 ~ 2x)3128(1 - 2x)
4 . 4
(4.4)
Egis the energy of the crystal band gap, and 8 is the unit step function. Empirically, they
have shown that this model is applicable to a wide range of solids, from wide-gap
insulating crystals to semiconductors. One may be tempted to use the energy of the 4f ~
110
5d band gap in CeF3 as Eg. However, as discussed in Chapter 3, 4/ ~ 5d two-photon
absorption is forbidden in first order since 6.1 = 1. Gayen et al. have measured the 4f ~ 5d
two-photon absorption cross section of Ce3+ in CaF2 [95]. Assuming that 4f ~ 5d two-
. photon cross section of ce3+ in CeF3 is similar to Ce3+ in CaF2, the two-photon absorption
contribution to n2 due to the Ce3+ 4f ~ 5d band gap should be negligible. Ultraviolet
reflectance spectra shows the onset of the valence band to conduction band transition at -
10 eV in CeF3 [28]. (LaF3, which has nearly the same linear and nonlinear refractive
indices as CeF3 [39-41], also shares nearly identical optical properties in the 8 - 34 eV
range.) Using Eg = 10 eV, and the measured value of n2 at 1.06 J.lm, x<3)NR has the
following values in the following spectral regions:
9397 cm·1 (1.06 J.lm) X(3)NR = 6 1 X 10·15 esu zzzz •
21000cm·1 (476 nm) X(3)NR = 8 0 X 10·15 esu zzzz •
28192 cm·1 (355 nm) X(3)NR = 9 7 X 10·15 esu . zzzz •
Therefore, one may expect from equation (4.1) a figure of merit of C =
lx<3)Rtx<3)NRimax::::::: 2 in the visible region if the linewidths are about 1 cm·1• While there is
some uncertainty in this figure, one can expect th~t electronic CARS resonances in CeF3 at
low temperature should be readily observable.
4.2. Experimental
The experimental apparatus is very similar to that used in Chapter 2. The major
difference is in the size of the crystal. The Ce3+:LuP04 crystal is a- 1 x 1 x 5 mm natural
crystal while the CeF3 crystal is a 1 cm3 polished cube. A Oxford CF1204 helium gas flow
111
cryostat is used to col the CeF3 crystal to 3.8 K. This is a better cooling system than the
cold-finger dewar used in Chapters 2 and 3. Low pressure helium gas provides a direct
contact between the sample and the cryogenic fluid, and a temperature probe at the sample
site provides accurate temperature measurements.
CARS resonances were observed in the visible region by the use of the Nd3+:YAG
laser second harmonic (18794.3 cm·1, linewidth = 0.52 cm·1 (FWHM)) to provide ro2.
Frequency-tripled light from the same laser pumped a dye laser operating with Coumarin
500 (- 21000 cm·1, linewidth = 0.25 cmc1) which provided a variable ro1. At each laser
shot, the signal was normalized to the square of the intensity of beam ro1• The energy of
each beam was about 100 ~/pulse. Both ro1 and roz were polarized parallel to the optical
(z) axis of CeF3. The optimal signal was seen when the angle between ro1 and COz was- 50 I
mrad. This yielded measurements of lx?lzl· Figures 4.2 and 4.3 show CARS resonances
at (ro1- COz)/2rtc = 2161 cm·1 and 2239 cm·1, respectively. A measure of the success of this
experiment is that it now makes sens~ to plot the data on a logarithmic intensity scale. In
Figure 4.2, the normalized intensity ranges from 0.09 to 9.5 for a dynamic range of about
102• (The dynamic range for previous electronic CARS measurements in pure rare earth
crystals did not exceed 2 [61, 62].) CARS resonances involving the two highest Stark
components of the 2F1n. manifold. were not observed. This is probably due to the large
linewidths of these levels.
CARS resonances were also detected using the ultraviolet laser frequencies used in
Chapter 2. The frequency tripled light from the Nd3.+: YAG laser at rotf27tc = 28191.5 cm·1
provided one beam, and also pumped a dye laser to provide tunable radiation in the roz/2rtc
=:: 26000 cm·1 range. As in Chapter 2, the linewidths of the lasers were llro1/2rtc = 0.80 \
cm·1 and llroz/2rtc = 0.60 cm·1• Table 4.1 displays the characteristics of the lasers used in
this chapter. Measurements were taken with the polarizations of both ro1 and COz parallel to
the z axis to yield IX~~l· Additionally, measurements were made with the polarizations of
112
ro1 and ro2 perpendicular to each other. A 354.7 nm half-wave plate could be inserted into
beam ro1 to rotate the polarization ·by 90°. In the case of non-parallel polarizations in a
birefringent medium, a detailed calculation is necessary to determine the possibility of
phase matching, and if so the phase matching angle.
The CARS phase matching requirement is
(4.5)
In a nondispersive medium (n = constant), phase matching would be satisfied with all wave
vectors collinear. In a dispersive medium, phase matching is non-collinear. Figure 4.4 is a
pictorial diagram of this requirement. It is evident that phase matching is impossible if lk31
+ lk21 < 21kll. The solution for the phase matching angle, e, is
cos8 4ky + k~ - k~
4klk2 (4.6)
and the magnitude of the wave vector ki is proportional to the product of the frequency and
the index of refraction.
(4.7)
Equation ( 4.24) determines the phase matching angle and may be solved using the data for
the index of refraction for both x (o) and z (e) polarized lightwaves as a function of
frequency given in Figure 1.11. There are three cases to consider.
• x?lzz· All beams are polarized parallel to the z axis. An application of equation
(4.6) gives a phase matching angle of 33 mrad.
113
• X~z: co1 is polarized parallel to the x axis, ~ is polarized parallel to the z axis
and the signal co3 is polarized parallel to the z axis. Equation (4.6) gives an
imaginary phase matching angle (0.108 i mrad). This corresponds to the situation
illustrated in Figure 4.4(b ). The wave vectors k2 and k3 are now too short to
complete the triangle as in Figure 4.4(a). This may be understood by referring to
the index of refraction data of Figure 1.11. ~ and~ are e-rays and have a smaller
index of refraction than the a-ray co1• No phase matching exists, and no signal was
observ~ at ~·
• X<;lzx COt is polarized parallel to the Z axis, ~ is polarized parallel to the X axis
and the signal ~ is polarized parallel to the x axfs. Equation (4.6) gives a phase
matching angle of 112 mrad. This relatively large phase matching angle may also
be understood by referring to the index of refraction data in Figure 1.11. Now co1
is an e-ray and has a lower index of refraction than a-rays ~ and ~· The wave
vector k 1 is now fairly short and and a larger pnase matching angle e is required to
complete the triangle in Figure 4.4(c). Since CeF3 is uniaxial (nx = ny = n0 ), this
analysis applies equally to x~lzy•
The phase matching angle is the angle at which the beams cross inside the nonlinear
medium. (See Figure 4.5.) The angle between beams co1 and co2 outside the medium, 9', /
is related to the phase matching angle, 9, by Snell's law:
n sin (9/2) - sin (9'/2) (4.8)
Since n0 ::::: ne ::::: 1.63, 33 mrad inside the sample corresponds to 46 mrad (2.6°) outside the
sample, and 112 mrad inside the sample corresponds to 182 mrad (10.5°). The four em
diameter 25 em focal length lens used in Chapter 2 cannot converge two parallel beams at
an angle of 182 mrad. A four em diameter 10 em focal length lens is then used to focus
both beams on the sample at an angle of 182 mrad (or 46 mrad).
114
The results are shown in Figures 4.6, 4.7, 4.8. Fairly strong CARS resonances
were observed at (ro1 - e»-z)/27tc = 2161 cm-1 in the zzzz, xzzx and yzzy polarizations. The
signal from the xzzx and yzzy polarizations are nearly identical. A weak CARS resonance
at (ro1- e»-z)/27tc = 2239 cm-1 was seen only in the zzzz polarization. Again, no resonances
were observed for the two highest states of the 2F712 manifoJd.
4.3 Analysis
The data are fit to a third order susceptibility as in Chapter 2:
X p~R 1))1 -A
zPWR 1))1 (4.9)
As in Chapter 2, the finite bandwidths of the input lasers are taken into account by
convolving the spectrum as in equations (2.36) and (2.37). The effect of laser bandwidth
are not as extreme as in Chapter 2. The dilute Ce3+:LuP04 crystal at low temperature had
very narrow linewidths compared the concentrated crystal CeF3. A best fit of the data in
Figures 4.2 and 4.3 gives values for A, r and C given in Table 4.2. The best fits of the
data from the ultraviolet lasers in Figures 4.6, 4.7 and 4.8 alsq give values for A, rand C
in Table 4.2. The fitted curves are drawn as solid lines in the figures.
UnJike the case of Ce3+:LuP04, resonances were detected using visible lasers. (See
Table 4.1.) Since the visible lasers have narrower linewidths than the ultraviolet lasers,
they may be expected to yield better data. Additionally, since the magnitude of the
nonresonant susceptibility is extrapolated from its value at 1.06 IJ.m, the value of x~~>;:R is
likely to be more accurate for the visible frequencies. The dynamic range for the 2161 cm-1
115
resonance was much higher than the 2239 cm·1 resonance. As a result the 2161 cm·1
resonance may be expected to yield better data than the 2239 cm·1 resonance. The
linewidths should be the same when measured with either laser setup. The difference in
measured linewidths between the visible and ultraviolet spectra (0.55 and 0.60 cm·1 for the
2161 cm·1 resonance and 3.5 and 4.5 cm·1 for the 2239 cm·1 resonance) are indicative of
the accuracy of the measurements. Estimated uncertainties in the data are included in Table
4.2.
Note that the peak CARS intensities are similar for 2161 cm·1 resonances. The
ultraviolet spectrum has a greater figures of merit (C = 4.8) compared to the visible
spectrum (C = 3.5). The ultraviolet spectra were recorded with broader linewidth lasers,
and the effect is that the CARS peaks are suppressed to a greater degree than in the visible
spectra which were recorded with narrower band lasers. The spectra do differ in the
difference between maxima and minima. The difference between maxima, ( ro1 - ro2)+,
and minima, (ro1 - ro:z)_, in the limit of zero-linewidth lasers is [54]:
.. (4.10)
The ultraviolet resonances have a larger difference between peak and valley than do the
visible resonances due to a larger value of A. Figure 4.9 shows the CARS resonances
calculated using the data of Table 4.2, and assuming that the input lasers have negligible
linewidth.
The linewidth of the higher lying level at 2239 cm·1 is much greater than the level at
2161 cm·1• The higher state may decay to the lower state by the spontaneous emission of a
single phonon and is lifetime broadened. This broadening is enhanced by the existence of a
78 cm·1 optical phonon in the CeF3 crystal [42]. The lower level, on the other hand,
requires the relatively unlikely simultaneous emission of several phonons to decay to the
116
ground 2F 5/2 manifold. The r/21CC = 0.55 cm-1 linewidth of the lower level is probably due
to ion-ion interactions which occur in fully concentrated rare earth crystals.
The quantity lx<3)Rlmax may be calculated from Table 4.2. For the experiment with
visible lasers, lx<3)Rlmax .r' = 1.5 x w-14 esu for the 2161 cm-1 resonance and 0.6 x w-14
esu for the 2239 cm-1 resonance. These values agree quite well with the prediction of the
Axe theory given in equation (4.1). Because the calculation in the appendix neglected
crystal field effects, the value given in equation (4.1) is the average value of lx<3)Rjmax for
t~e four Stark components of the 2F m. manifold.
The parameter A is related to the total spontaneous Raman cross section by (from
equations (2.20), (2.23) and (2.24))
327rnW: A x<3)NR Gzz = N c4 zzzz (4.11)
where ros is the frequency of the scattered light (the Stokes frequency). The Raman cross
sections (assuming ros = ro1) are listed in Table 2. The Raman cross section in the visible
region compares well with the estimated values in the appendix (equation (4.32)). The
value in equation (4.32) is the sum of the Raman cross sections of the four levels of the
2Fm. manifold. The major uncertainty in the experimental values are due to the uncertainty
in the non-resonant susceptibility (or equivalently, the nonlinear index of refraction). An
accurate measurement of n2 in CeF3 in the z polarization in at 476 nm and 355 nm would
allow a more accurate absolute Raman cross section measurement.
Assuming that the 5d levels are degenerate, and that the 5d configuration dominates
the electronic Raman processes, the dispersion of the maximum value of the resonant
susceptibility is given in equations ( 4.15) and ( 4.17) of the appendix:
117
(4.12)
This allows a comparison of values of A for the visible and ultraviolet experiments. For
the visible experiments, ro1/2rcc == 21000 cm·1, ro2/2rcc = 18794.3 cm·1 and ro3/2rcc ==
23200 cm·1• For the ultraviolet experiments, ro1/2rcc = 28191.5 cm·1, ro2/2rcc == 26000 /
cm·1 and ffiJj2rcc == 30400 cm·1. In the Axe approximation, ro5d/2rcc = 45000 cm·1• Then
X (~)NR VlS
X(3)NR uv
[(co)v ~ COs.t) - (co~v ~ COs.tJ [(co~v ~ COs.t) - (co;v ~ COs.tJ
[<cor• ~ cos.t) - (cor"~ cos.tJ Lcor• ~ cos.t) - (col'"~ cos.tJ
or, upon inserting the above values (along with the nonresonant susceptibilities)
Auv
Avis 1.43 + 0.21
(4.13)
(4.14)
The uncertainty in the above figure comes from the uncertainty in x.~/:R IX.~)NR. The
experimental ratios, from Table 4.2, are (AuvfAvis) (2161 cm-1) = 1.46±0.16 and (AuvfAvis)
(2161 cm-1) = 2.23±0.95. This agreement is quite good. In their analysis of the
asymmetries in electronic Raman transitions in ErP04 and TmP04, Becker et a/. [110]
indicated that intermediate states of d and g electronic configurations make contributions of
"equal significance." The above results indicate that the 5d configuration alone accounts
for the dispersion of of lx.<3)Rjmax in CeF3•
118
4.4 Summary
Strong electronic CARS resonances have been observed in CeF3• Figures of merit,
C = lx<3)Rfx<3)NRimax = Atr, are an order of magnitude larger than measured previously in
other pure rare earth crystals. This is due to the fairly large electronic Raman cross section
which is, in turn, due to the relatively low 5d configuration of the Ce3+ ion. The absolute
strengths of these resonances were accurately predicted using the Axe theory of two-photon
processes and along with 4f ~ 5d absorption data. Approximating the intermediate states
. by a single degenerate 5d level at 45000 cm-1 accounted for both the absolute magnitude
and dispersion properties of lx<3>Rimax·
Appendix 4.1 Calculation of 1x<3)Rimax and Ozz
A4.1.1 Application of the Axe Theory of. Two-photon Processes
The quanti_ty IX;~;~ lmax is calculated for an electronic CARS experiment in CeF3
using visible lasers. A frequency-doubled Nd3+:YAG laser provides ro2/21Cc = 18794.3
cm-1. A tunable laser operating in the 21000 cm-1 region provides ro1. The CARS signal at
0>:3 = 2ro1- O>z is then in the OJ:3/21Cc "" 23200 cm-1 region. (See Figure 4.1.) The quantity
IX~~!~(-ro3, ro1, rot> -ro)lmax for singly resonant CARS may be derived from equation
(2.17):
N A I a ii ( W:3 , m1 ) a ii ( m1 , U1z ) I 121ll
119
(4.15)
where
is the usual (nonresonant) Raman tensor (equation 2.18).
(g lervl n)(n lerul f)] (COy + COgn)
(4.16)
The first approximation is the assumption that the intermediate states, In), are
dominated by the 5d levels at O>gn /21tc = 40000 to 50000 cm-1. Other excited states of
opposite parity are presumed to be too high in energy to contribute appreciably. The next
approximation is originally due to Judd [105] and Ofelt [106], and was first applied to two-
photon processes by Axe [104]. If the denominators do not cause the quantities in the
summation to change rapidly as a function of n, the denominators may be removed from
the summation. This is equivalent to setting the energies of all the 5d levels to the same
energy. That is, O>gn /21tc = ro5d /21tc = 45000 cm-1. Equation ( 4.16) may now be written
as
~ [ -( CO_x_l_CO_sd-) L (g lrd 5d)(5d lrd f) all Sd states
(4.17)
The initial and final states are in the 4/ configuration and the intermediate states ru:e 5d.
Using, the methods of Axe [104], the·above summation simplifies to
L (4/ 1j!JM lzl 5d)(5d lzl 4/ t( J'M') all Sd states
(I = 3 llc<l)ll l = 2? 1(4/ I r I 5d)l 2
120
..
xI <2A- + 1) ( 1 A- 1) { 1 A-2
13
} (4fl/fJM lua,.)l4tvfJ'M'> ;. = 0,2 0 0 0 3
(4.18)
The above equation may be evaluated if angular wavefunctions are available for
both the initial and final states, and the quantity 1(4fl r 15d )I is known. Unfortunately, the
4/- 5d radial overlap varies from crystal to crystal, and accurate angular wavefunctions for
Ce3+-tn CeF3 (or LaF3) are not known. As demonstrated below, an effective measure of
1(4fl r 15d )I may be derived from the 4f ~ 5d absorption spectrum of Ce3+ in LaF3. For
the 4/ wavefunctions, those of the free Ce3+ ion are used.
A4.1.2 Calculating I( 4f I r 15d )I for Ce3+ in CeF3
_ In the crystal field model, the crystal field Hamiltonian acts only upon angular
variables. The radial wavefunctions are presumed to be unaffected by the crystal field
interaction. However, studies [23, 25, 101: 111, 112] indicate that the 5d radial
wavefunction may be sensitive to the local crystal environment, and the quantity
1(4/1 r 15d )I can vary considerably from crystal to crystal. The 4/ wavefunction has no
radial node while the 5d radial wavefunction has two nodes, one near the maximum of the
4/ radial wavefunction. (See Figure 4.10.) Since the interaction of the the 5d electron with
the host lattice is much greater than the 4f electron, a small change in the 5d radial
wavefunction can significantly alter the radial overlap. Therefore, a calculation of
1(4fl r 15d )I from the free ion wavefunctions cannot be applied to this work. An effective
measurement of 1(4/1 r 15d )I may be derived from the 4/ ~ 5d oscillator strength of the
Ce3+ ion in the (Ce,La)F3 environment.
The oscillator strength,/, is related to the absorption coefficient, a, by [113]
121
mc2
f = J a (a) d a rte2N (4.19)
where 0' = 1/)... The oscillator strength is related to the dipole matrix element between the
initial state li) and final state Jl) by [105]
f = 2mm (n2 + 2)2 l(i lrl 1)12 1i 9n (4.20)
Both Erlich et a/. [38] and Elias et a/. [36] have measured the ultraviolet absorption spectra
of Ce3+:LaF3. Integration of the total spectra according to equation ( 4.19) yields a total
oscillator strength for the ground state to 5d configuration transition. The oscillator
strength should not depend on Ce3+ concentration, so that the Ce3+:LaF3 values should
apply to CeF3• Erlich eta/. measured the spectra of 0.05 mol % Ce3+ in LaF3 at room
temperature. Measurement of the area under the 4f ~ 5d absorption spectrum gave f = 2.2
x I o-2. Elias et a/. measured the absorption spectra of 0. 01 mol % Ce3+ in LaF3 at 100 K.
The area under the spectrum gave f = 1.8 x w-2, and there was no polarization
dependence. For the purposes of this calculation, we shall assume that all levels of the
2F 512 manifold contribute equally to the absorption spectrum to give a 4f ~ 5d oscillator
strength off= 2 X w-2• From equation (4.20) and/=·2 X w-2
(4.21) all 5 d states
Since all levels of the 2F512 manifold are assumed to be equally occupied, the initial state is
122
..
..
li) = I2F5i2 ) = ~ 2F (15 /2, +5 /2) + 15/2, +3 /2) + 15/2, +1 /2)) y6 ~
(4.22)
and the small amount of ]-mixing is ignored. The summation in equation (4.21) may be
calculated with the aid of equation (4.18) and the quantities ( 3 II C(l) II 2) = 31/2, and
(4/ vrJM 1 u6">i 4/ 1J1 I'M') = )7 O< vrJM, IJI' I'M') (4.23)
!O give
L, l(i I z I 5d)l 2 = ~ 1(4/ I r I 5d)l 2
all 5d states 7 (4.24)
(The A.= 2 term in equation (4.18) is zero when summed over all M.) Judd [114] has
derived an equivalent result. Combining equation (4.21) with (4.24) gives
1(4/lrl5d)l = 0.25 A (4.25)'
This compares with a value calculated for the free ion radial wavefunctions of 1(4flrl5d )I =
0.441 A [24]. (Recently, Lyu and Hamilton [115] have calculated 1(4flrl5d)l = 0.29 A
from lifetime measurements of Ce3+ in LaF3 .)
A4.1.3 Wavefunctions for Ce3+ in CeF3
Accurate wavefunctions for the electronic states of the 4fconfiguration of the Ce3+
ion in CeF3 are not available. Fourteen crystal field parameters are needed to characterize
the Stark splitting of a 4/ electron at a site of C2 symmetry. Crystal !Jeld parameters are ·
123
determined by a least squares fit of the energy levels to the crystal field Hamiltonian, and
the angular wavefunctions are the eigenstates of the Hamiltonian. In the case of Ce3+, the
seven energy levels of the 4/ configuration are insufficient to uniquely determine the
fourteen crystal field parameters. Additionally, as discussed earlier, the only well
determined energy levels of the 4/ configuration are the the four Stark components of the
2F 712 manifold. Attempts to model the Ce3+:LaF3 crystal field by assuming a higher
symmetry such as C2v or D3h (which decreases the number'of crystal field parameters),
have proven unsatisfactory [34].
Without wavefunctions of the initial and final states, equation (4.18) cannot be
exactly solved. Approximations are necessary. As before, we assume that there is no]
mixing. For 4f electrons, a weak crystal field only mixes the J character of the 4/ levels
slightly. Additionally, we assume that the wavefunctions of the Stark components have
spherical (i.e. atomic) symmetry as in the free ion. This is equivalent to a zero crystal field
approximation. Thus,
~ 2F (15 12, ±5 12) + 1512, +3 12) + 1512, ±1 12)) y6 .
.Is 2F (17 I 2, ±7 I 2} + 17 I 2, +5 /2} + 17 I 2, +3 I 2}
+ I 7 I 2, ± 1 I 2) )
(4.26a)
(4.26b)
The zero crystal field approximation is likely to be better for a Ce3+ ion at a site of
low symmetry (such as C 2 ) than at a site of high symmetry. Like the, free ion
wavefunctions, the angular wavefunction for a Stark component of a low symmetry ion
will contain all M (IMI '5. J) values, and no selection rules exist. Additionally, the crystal
field has only a second-order influence on the electronic Raman process. That is, the
124
crystal field is responsible for the distribution of Raman intensity among the Stark
components of a given manifold. Use of equation (4.18), ( 2F 512 11 u<2) 11 2F 712 ) = 0.350,
the Wigner-Eckart theorem, and the orthogonality relation
(4.27)
and the orthogonality relation
m~, ( ~~ ~22 :) (~! :2 ;:) = (2k 1+ 1) {j(k, k')8(q, q') (4.28)
gives
I I eFsn I z I 5d)(Sd I z I 2F7/2)1
2
all 5d states 6.06 X 1 o-3 1(4/ I r I 5d)l 4
(4.29)
Now the quantity IX~~~~Imax may be estimated for 2F 512 H 2F712 Raman transitions.
Use of equations (4.15), (4.17), (4.25) and (4.29) gives IX~~;~Imax = 5.1 X w-14 esu. This
value is actually the sum of IX~~~Imax for the four Stark components of the 2F 712 manifold
(if one assumes that each level has a linewidth r/27tc = 1 cm-1 ). One might then expect that
for each Stark level
lx (3)RI (2F. H 2p ) ::::: zzzz max 5/2 7/2
5 . 1 x 1 0- 14 es u (4.30)
4 x (HWHM linewidth in cm-1)
This value is on the high end of resonant susceptibilities for singly resonant electronic
CARS experiments in rare earth crystals as discussed in section 2.3.1.
125
A4.1.4 Calculation of the Raman Cross Section
The above analysis also applies to the calculation of the total spontaneous Raman
cross section for transitions from the 2 f 512 ground state to the Stark levels of the 2 F 712
manifold. The total (not differential) Raman cross section is related to the Raman in tensor
equation (4.16) by
(4.31)
where ros is the frequency of scattered light (the Stokes frequency). This leads to a Raman
cross section of (assuming ros/2rcc = 21000 em -1)
(4.32)
Again, the above expression is the sum of Raman cross sections for the four Stark
components of the 2F 712 manifold. This is on the high end of the range of ERS cross
sections [73]. For comparison, Williams et al. [23, 25] measured crzz = 1.4 x w-29 cm2 for .
the four 2F7n Stark components in Ce3+:LuP04.
126
Appendix 4.2 Stimulated Electronic Raman Gain
A4.2.1 Introduction
Finally, I discuss stimulated electronic Raman scattering in rare earth crystals. The
data collected in the electronic CARS experiments in CeF3 enables a calculation of the
stimulated Raman gain coefficient. I observed no electronic stimulated Raman gain in
CeF3. This was due to mainly to the low crystal damage threshold.
Stimulated electronic Raman scattering has been observed in atomic vapors, but
- never involving the electronic states of ions in crystals. While the energies of molecular
vibrations are limited to the infrared, the energies of electronic transitions may be in the
infrared, visible or ultraviolet As a consequence, electronic stimulated Raman scattering
may shift the frequency of an input laser by tens of thousands.of cm-1, while vibrational
stimulated Raman scattering only shifts frequencies by thousands of cm-1. Since CeF3 has
a large electronic Raman cross section (for a rare earth system), it is a good system on
which to begin the investigation of stimulated electronic Raman gain in crystals.
Like CARS and two-photon absorption, stimulated Raman scattering may be
viewed within the framework of four-wave mixing. In the stimulated Raman effect, the
presence of a lightwave at frequency roP causes a lightwave at frequency ro5 to be amplified
when li(rop- ro5 ) is equal to the energy of a Raman transition. The initial growth of the
Stokes wave,/5, compared to its initial value IsCO) is given by [54]
(4.33)
127
where gR is the Raman Gain coefficient, I is the distance over which both lightwaves
interact, and IP is the intensity of the lightwave at coP (the ''pump'' frequency). The Raman
gain coefficient is related to the spontaneous Raman cross section, CJ, by [54]:
3Nrcc2nPa
coP to;n}tll (4.34)
This quantity may be calculated from the linewidths and electronic Raman cross
sections listed in Table 4.2. For cos/2rr.c = 28192 cm·1; the Raman gain for the 2161 cm·1
level at 3.8 K is
0.52 em GW
For cos/2rr.c = 21000 cm·1, the Raman gain is for the 2161 cm·1 level is
0.21 em
GW
(4.35)
(4.36)
Since gR is inversely proportional to the linewidth, the gain for the other states of the 4f
configuration will be much smaller. Recall that the Stark components of the 2F5a manifold
are vibronicly broadened by- 100 cm·1.
Equation (4.34) gives a value of gR = 1.9 cm/GW for the 992cm·1 vibration in
benzene in the visible region (N = 7 X 1021 cm·3, rJ2rr.c = 1.2 cm·1, CJ = 2.7 X 10·28 at ffis
/2rr.c = 21000 cm·1 [72]). For the 1085 cm·1 vibrational mode in a calcite (CaC03) crystal,
a measurement of the Raman gain gave 13 cm/GW [116]. Thus, the calculated electronic
Raman gain in CeF3 at low temperature is several times smaller than vibrational Raman gain
in common materials. ·
128
A4.2.2 Experimental
The apparatus used to detect Raman Gain is shown in Figure 4.11. A laser pulse of
frequency roP is focused on the sample with a 15 em lens. The light passes through 1 em of
the sample. Spontaneous Raman scattering produces photons of energy Jiros = Ji(rop- roR).
The photons of frequency ros which travel along the path of the pump beam are amplified
according to equation (4.33). The iris blocks off-axis scattered light which consists
primarily of spontaneous Raman photons. A lens collimates the light, and a prism·
separates ros and ror The Stokes beam is focused into the SPEX 1403 double
monochromator. The Stokes signal is detected with the same photomultiplier tube and
electronics as in Chapter 2. A variety of pump sources (frequency-doubled and tripled
Nd3+:YAG, pulsed dye lasers, and freque~cy-doubled pulsed dye lasers) were used to
cover the range ropl2rr.c- 18000 cm-1 to- 33000 em-1• A nonlinear relationship between
the intensity of the pump and the Stokes intensity indicates stimulated Raman gain.
In benzene and calcite samples(- 1 em thickness at room temperature) stimulated
vibrational Raman gain was easily observed. In both cases stimulated Raman gain was
observed at pump energies of- 100 J..l]/pulse. (The low threshold in benzene is due to self-·,
focusing of the pump beam [54].) At slightly higher energies, a fair fraction of the pump
beam was converted to a coherent beam at the Stokes frequency, and the signal was clearly
visible to the naked eye.
No stimulated electronic Raman gain was observed in CeF3 at 3.8 K. The pump
beam could be polarized either parallel or perpendicular to the crystal axis. The frequency
of the input light ranged from- 18000 cm-1 to- 33000 cm-1 . When the frequency-tripled
Nd3+:YAG was used as the pump (rop/2rr.c = 28191.5 cm-1 ), the threshold for crystal
129
damage was- 700 J.l]/pulse (- 1 GW/cm2). At higher pump frequencies, the damage
threshold was lower. No stimulated electronic Raman gain was seen below the onset of
-crystal damage.
A4.2.3 Analysis
The experimental apparatus described above is adequate for the demonstration of
stimulated Raman gain if the gain coefficient is high enough. Since the spatial profile of the
pump beam as it passes through the sample is not well known, it is difficult to put an upper
limit on the electronic Raman gain coefficient of CeF3. Other experimental arrangements
permit accurate quantitative measurements. The best methods use stable cw pump and
probe beams, and detect the small change in the probe intensity induced by the pump beam
[55].
Optical fibers are perhaps the most appropriate structures for stimulated Raman
scattering since they provide beam confinement and long interaction lengths. In a silica
glass fiber, the maximum vibrational Raman gain coefficient is- 0.01 cm/GW [117], and
stimulated Raman scattering, Raman amplification, and Raman lasing have been observed.
If one assumes that the linewidth of the 2161 cm-1 electronic level in CeF3 increases by an
order of magnitude at room temperature, then gR- 0.01 cm/GW (from equation (4.36)). If
a CeF3 single crystal fiber. were fabricated, one then may expect to observe electronic
Raman gain at room temperature.
130_
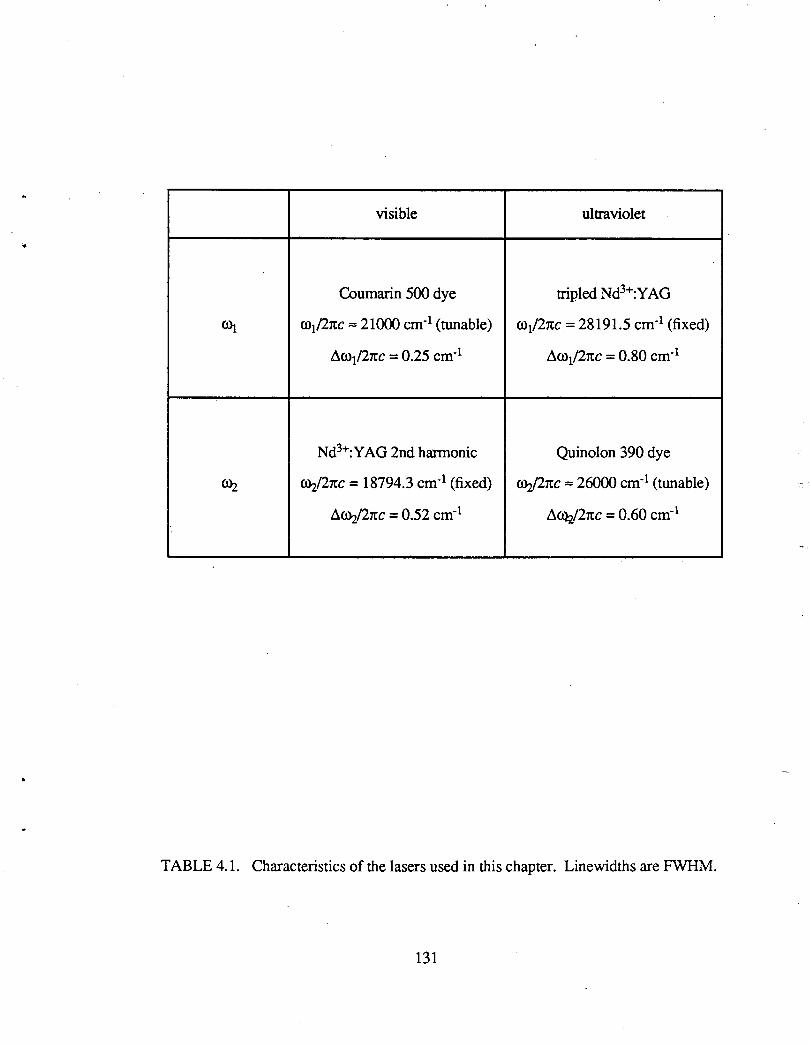
visible ultraviolet
Coumarin 500 dye tripled Nd3+:YAG
O>t rotf2rcc:::::: 21000 cm-1 (tunable) ro1/2rcc= 28191.5 cm-1 (fixed)
tl.ro1/2rcc = 0.25 cm-1 tl.ro1/2rcc = 0.80 cm-1
Nd3+: Y AG 2nd harmonic Quinolon 390 dye
~ (J}-j2rcc = 18794.3 cm-1 (fixed) ~/2rcc:::::: 26000 cm-1 (tunable)
tl.(J}-j2rcc = 0.52 cm-1 tl.Ci};/2rcc = 0.60 cm-1
TABLE 4.1. Characteristics of the lasers used in this chapter. Linewidths are FWHM.
131

ro/2rcc ijji A/2rcc r/2rcc c CSzz
(cm-I) (cm-I) (em-I) (em~
visible
lasers '
ro1 == 21000 em·1 2161 zzzz 1.95±0.10 0.55±0.03 3.5 (5.0±1.1) x 10"30
ro2 = 18794.3 em·1 2239 zzzz 0.72±0.22 . 3.5±1.0 0.21 (1.9±0.7) x 10·30
x(3)NR -ZU% .-
(8.0±2.0) x 10"15 esu
ultraviolet 2161 zzzz 2.85±0.29 0.60±0.06 4.8 (2.9±0.9) x 10"29
lasers 2239 zzzz 1.6±0.5 4.52±1.4 0.36 (1.6±0. 7) x 10'29
ro1 = 28191.5 em'1 2161 xzzx 2.35±0.25 0.50±0.05 4.7 -
ro2 == 26000 em ·I 2239 xzzx 0 - - -
x(3)NR_ uu - 2161 yzzy 2.35±0.25 0.50±0.05 4.7 - -
(9.7±2.9) x 10·15 esu 2239 yzzy 0 - - -
TABLE 4.2. Summary of the data and estimated uncertainties. (C = IX~~~R lx~J]i'Rimax =
All). The total spontaneous Raman cross section, crzz• is related to A and x~)~R through
equation (4.11).
132
..
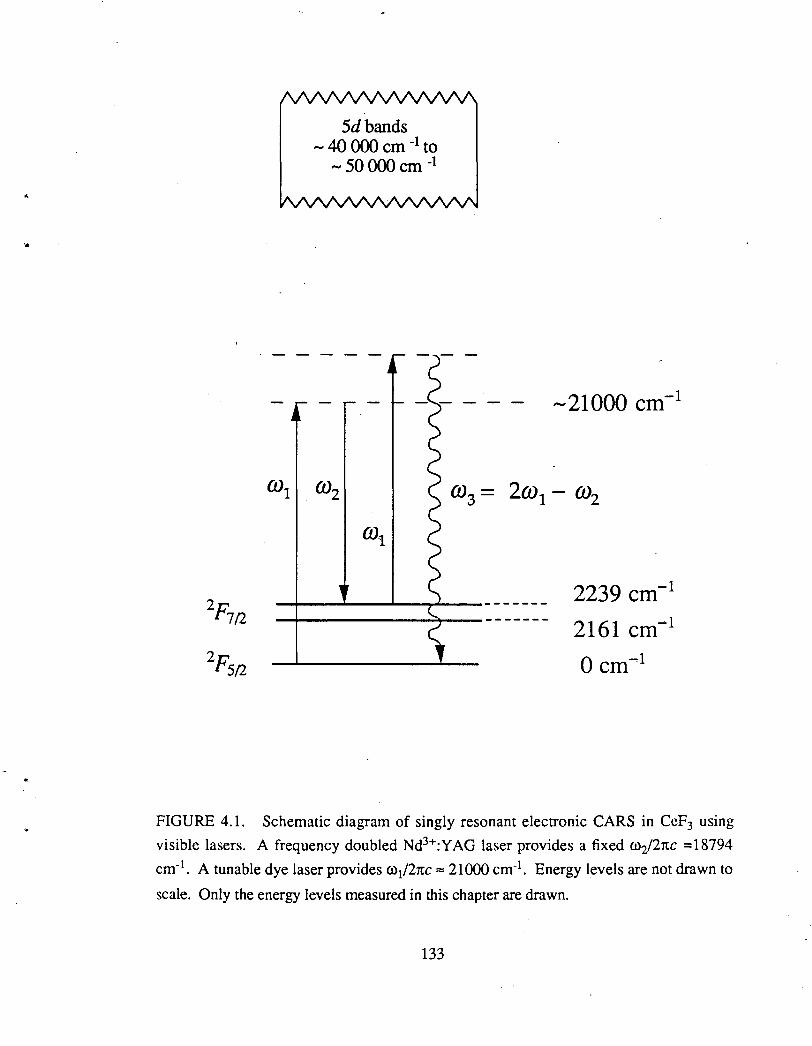
5dbands - 40 000 em -1 to
-50000cm -1
-21000 cm-1
2239 cm-1
2161 cm-1
0 cm_,1
FIGURE 4.1. Schematic diagram of singly resonant electronic CARS in CeF3 using
visible lasers. A frequency doubled Nd3+:YAG laser provides a fixed ro2/21tc =18794
cm·1• A tunable dye laser provides ro1/21tc"" 21000 cm·1. Energy levels are not drawn to
scale. Only the energy levels measured in this chapter are drawn.
133
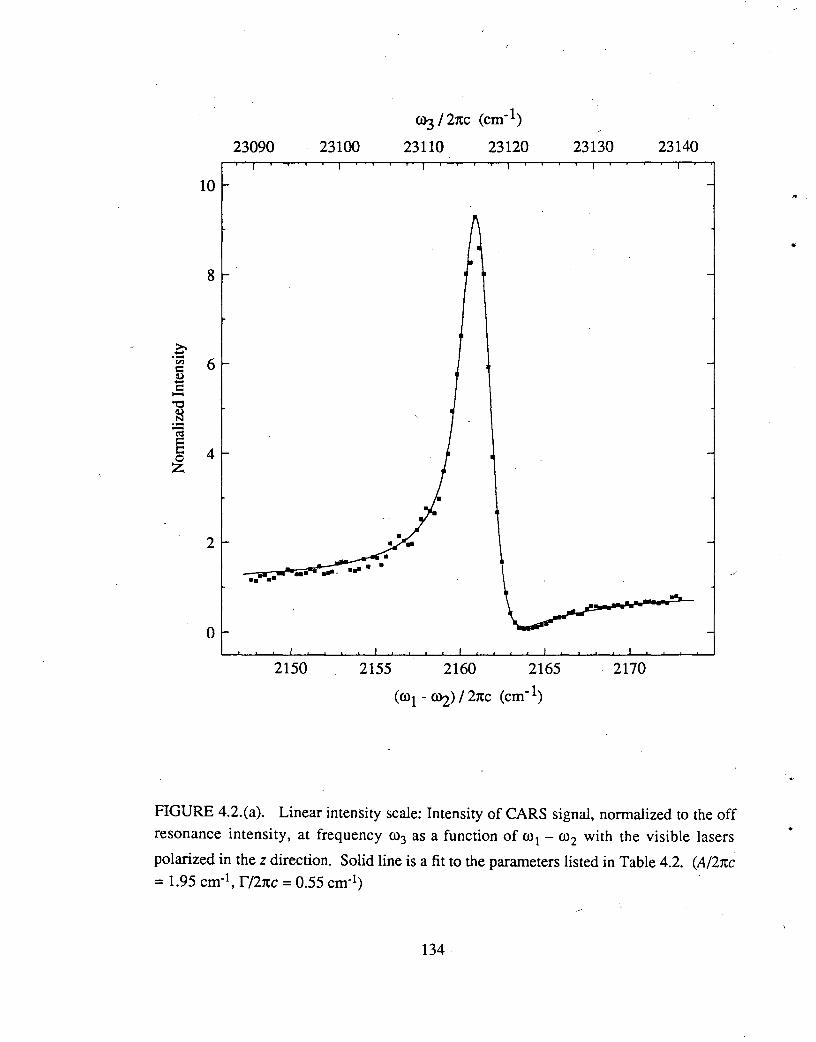
~/2xc (cm-1)
23090 23100 23110 23120 23130 23140
10
8
6
4
2
0
2150 2155 2160 2165 2170
FIGURE 4.2.(a). Linear intensity scale: Intensity of CARS signal, normalized to the off resonance intensity, at frequency ro3 as a function of ro 1 - ro2 with the visible lasers
polarized in the z direction. Solid line is a fit to the parameters listed in Table 4.2. (A/2xc = 1.95 cm-1, l/21tc = 0.55 cm·1)
134
..
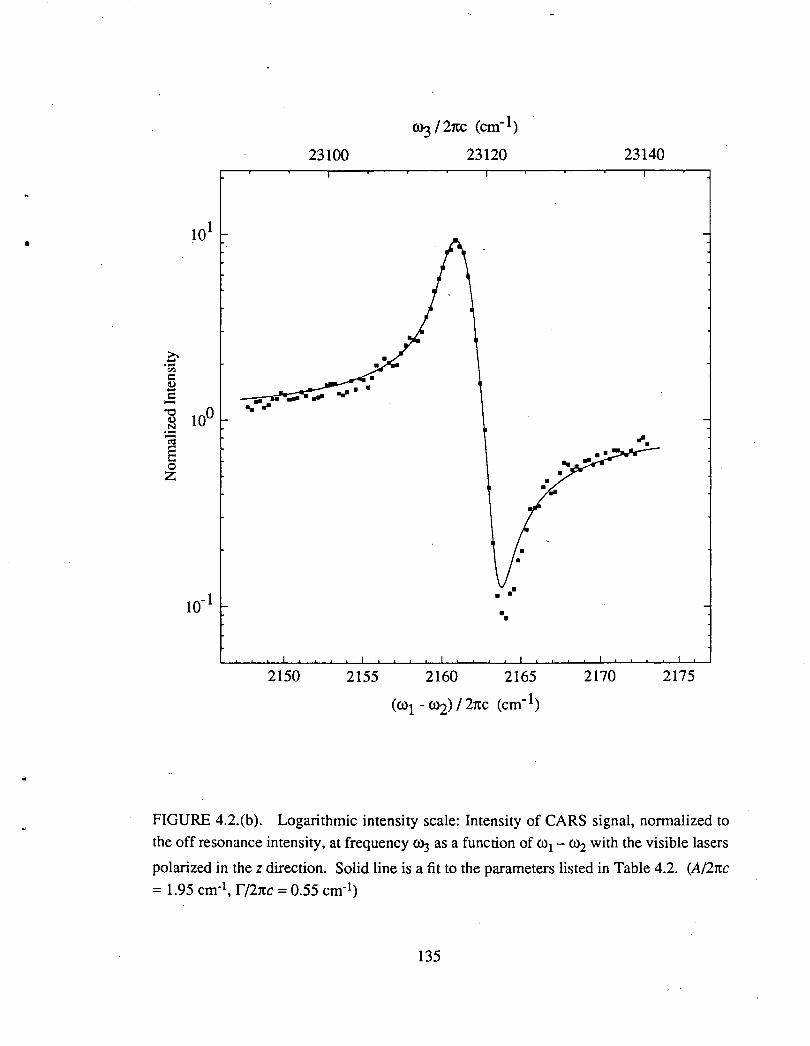
•
..
23100
2150 2155 2160
• •
2165
23140
"'·
2170 2175
FIGURE 4.2.(b). Logarithmic intensity scale: Intensity of CARS signal, normalized to
the off resonance intensity, at frequency 00:3 as a function of ro1 - ro2 with the visible lasers
polarized in the z direction. Solid line is a fit to the parameters listed in Table 4.2. (A/2rtc
= 1.95 cm-1' r/2rtc = 0.55 cm-1)
135
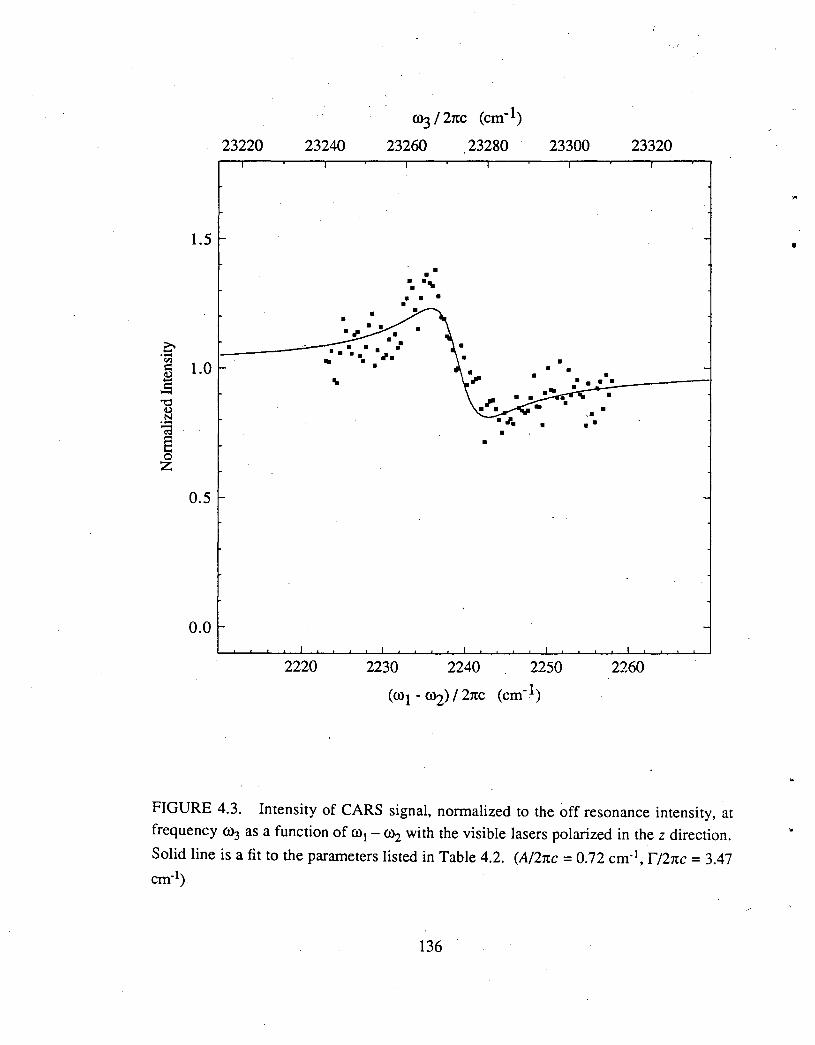
0>:3 I 21tc (cm-1)
23220 23240 23260 .23280 23300 23320
1.5
• • ·. ·~ • • • •
0 ·-Coil
1.0 c:: Q) ....
..s • "'t:: ~ •
• ·-ca • § • 0 z
0.5
0.0
2220 2230 2240 2250 2260
FIGURE 4.3. Intensity of CARS signal, normalized to the off resonance intensity, at frequency 0>:3 as a function of ro1 - ro2 with the visible lasers polarized in the z direction.
Solid line is a fit to the parameters listed in Table 4.2. (A/21tc = 0.72 cm-1, r/21tc = 3.47 cm-1)
136
•
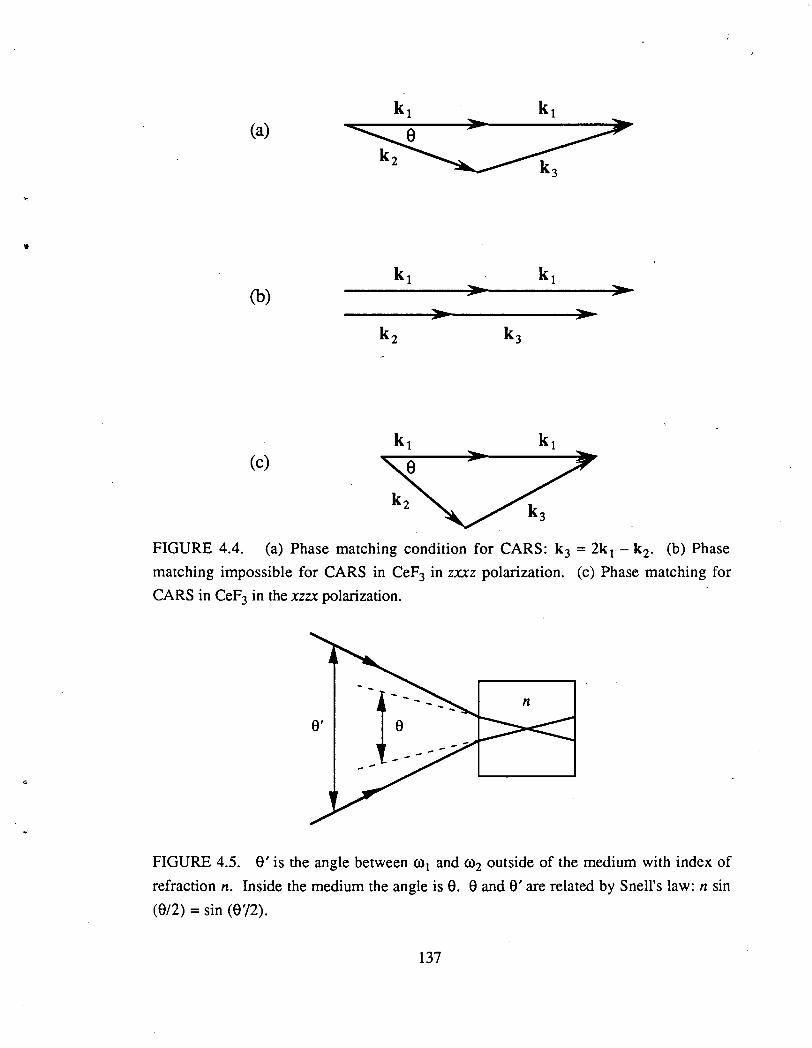
•
(a)
(b)
(c)
FIGURE 4.4. (a) Phase matching condition for CARS: k3 = 2k 1 - k2 . (b) Phase
matching impossible for CARS in CeF3 in zxxz polarization. (c) Phase matching for
CARS in CeF3 in the xzzx polarization.
FIGURE 4.5. 9' is the angle between ro1 and ro2 outside of the medium with index of
refraction n. Inside the medium the angle is 9. 9 and 9' are related by Snell's law: n sin
(912) = sin (9'/2).
137
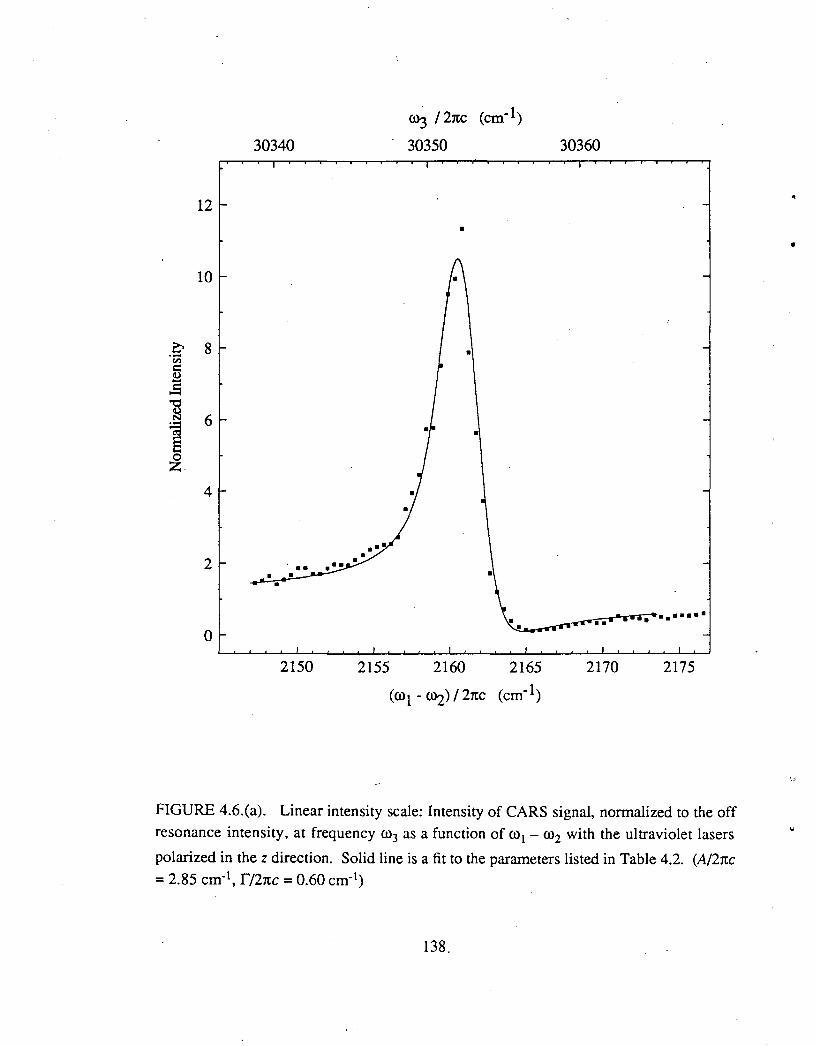
30340
12
10
,q 8 en c: Q) ..... ~ "t:: ~ 6 ·-~ e 0 z
4
2
0
2150 2155
COJ /2rcc (cm-1)
30350
•
•
•
2160 2165
30360
2170 2175
FIGURE 4.6.(a). Linear intensity scale: Intensity of CARS signal, normalized to the off resonance intensity, at frequency ro3 as a function of ro1 - ro2 with the ultraviolet lasers
polarized in the z direction. Solid line is a fit to the parameters listed in Table 4.2. (A/2rcc = 2.85 cm-1, r/2rcc = 0.60 cm-1)
138,
•
\,)
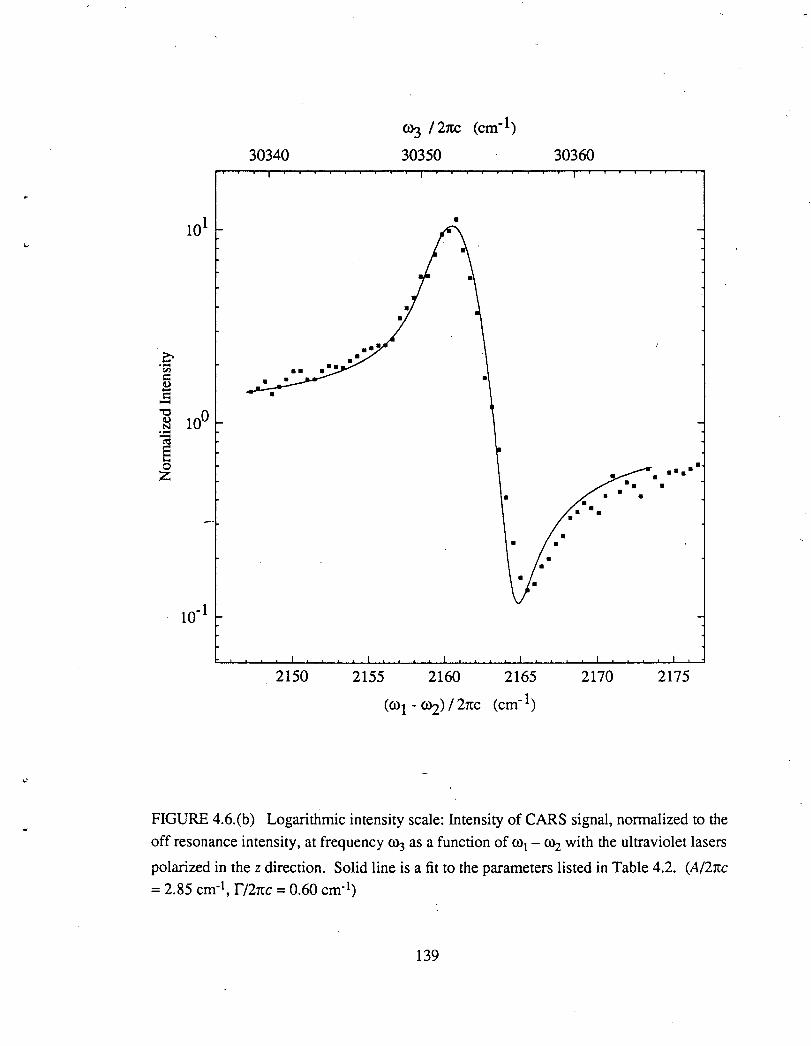
30340
•
2150 2155 2160 2165
30360
2170
• ••••• •
2175
FIGURE 4.6.(b) Logarithmic intensity scale: Intensity of CARS signal, normalized to the
off resonance intensity, at frequency 0>:3 as a function of ro1- ~with the ultraviolet lasers
polarized in the z direction. Solid line is a fit to the parameters listed in Table 4.2. (A/21tc
= 2.85 cm·1, r/2rr.c = 0.60 cm-1)
139
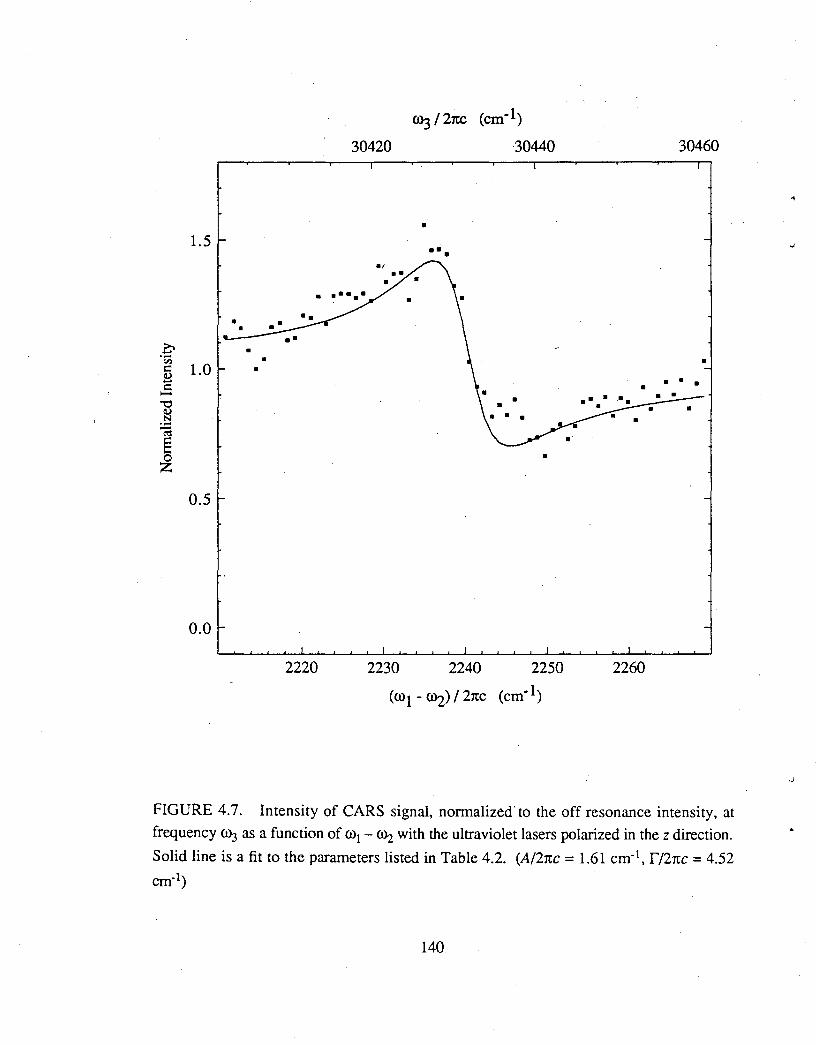
1.5
~ ·-C'-l
1.0 c:: (!) -c:: -~ (!) N ·-~ § 0 z
0.5
0.0
2220
~/2rcc (cm-1)
30420 30440
•
2230
•• •
•
2240 2250
30460
2260
FIGURE 4.7. Intensity of CARS signal, normalized' to the off resonance intensity, at
frequency 00:3 as a function of ro1- ~ with the ultraviolet lasers polarized in the z direction.
Solid line is a fit to the parameters listed in Table 4.2. (A/2rcc = 1.61 cm·1, r/2rcc = 4.52
cm-1)
140
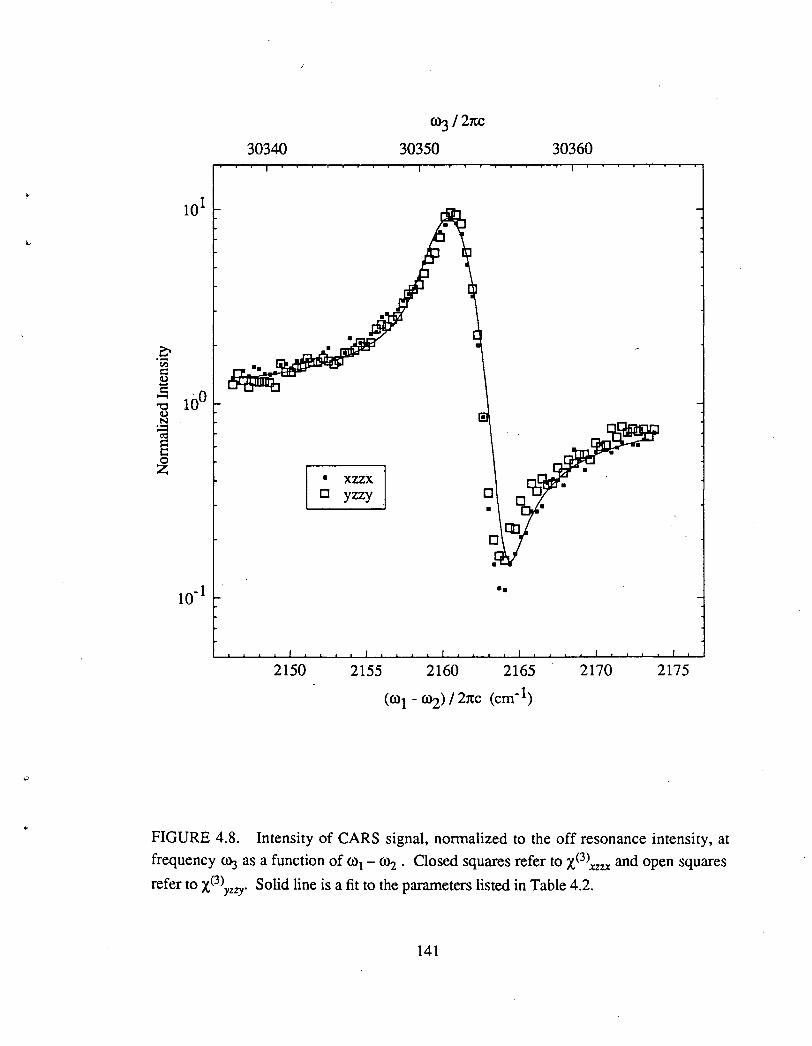
..
30340
~ ~
2150 2155
0>:3 I 21tc
30350
•
2160
30360
••
2165 2170 2175
FIGURE 4.8. Intensity of CARS signal, normalized to the off resonance intensity, at
frequency ffi:3 as a function of ro1 - ro2 . Closed squares refer to x<3>xzzx and open squares
refer to x<3>yzzy· Solid line is a fit to the parameters listed in Table 4.2.
141
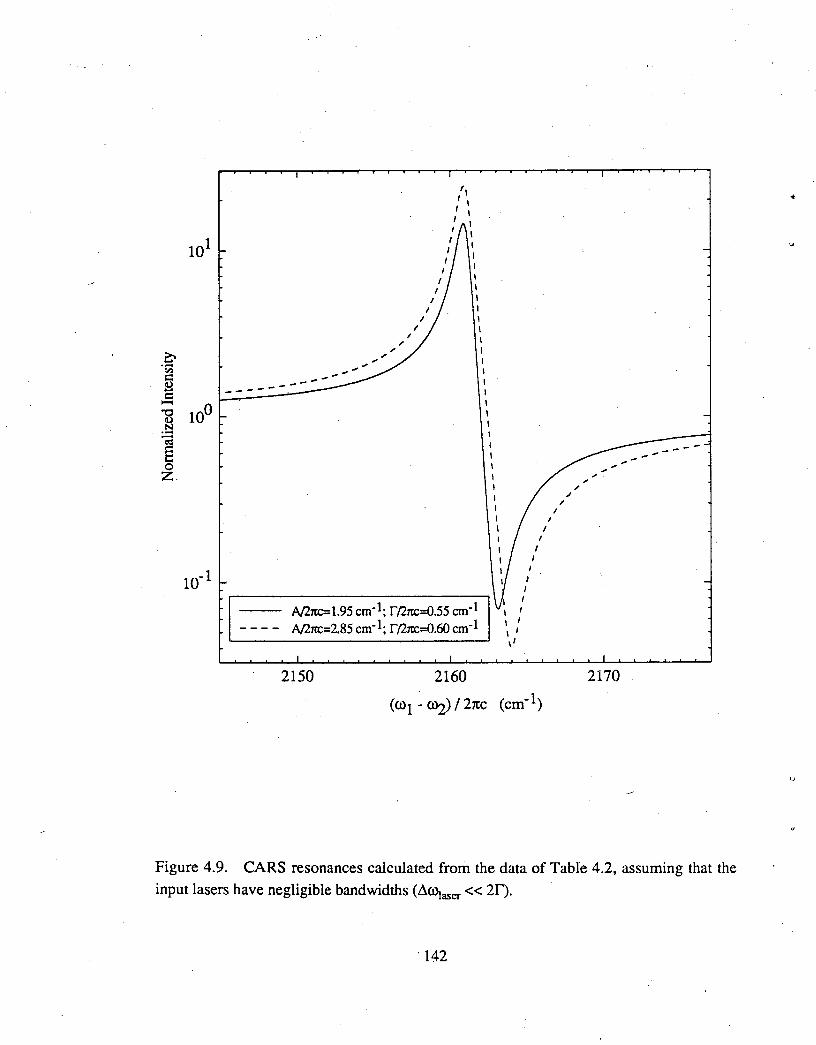
---- ---
'I I I I I I 1
1 I I I
1 I I I I
A/21tC=l.95 cm-1; r/21tC=0.55 cm-1
A/21tC=2.85 cm-1; r/21tC=0.60 cm-1
2150 2160
1 1 I
I I I I
I I I I I I
I I
I
(co1 - COZ) /27tc (cm-1)
/ , I
I I
/
..... "
2170
---
Figure 4.9. CARS resonances calculated from the data of Table 4.2, assuming that the
input lasers have negligible bandwidths (LlCOJaser << 2I) .
. 142
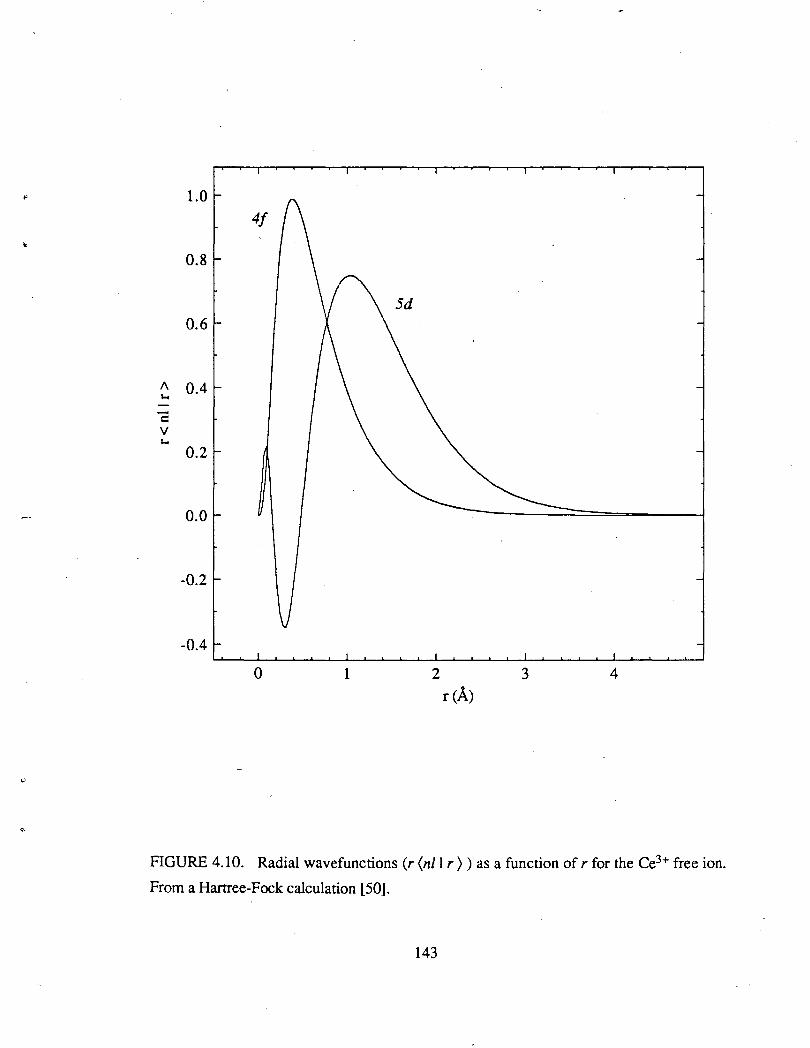
1.0
0.8
0.6
~ 0.4
0.2
0.0
-0.2
-0.4
4/
0 1 2
r(A)
3 4
FIGURE 4.10. Radial wavefunctions (r (nil r)) as a function of r for the Ce3+ free ion.
From a Hartree-Fock calculation [50].
143
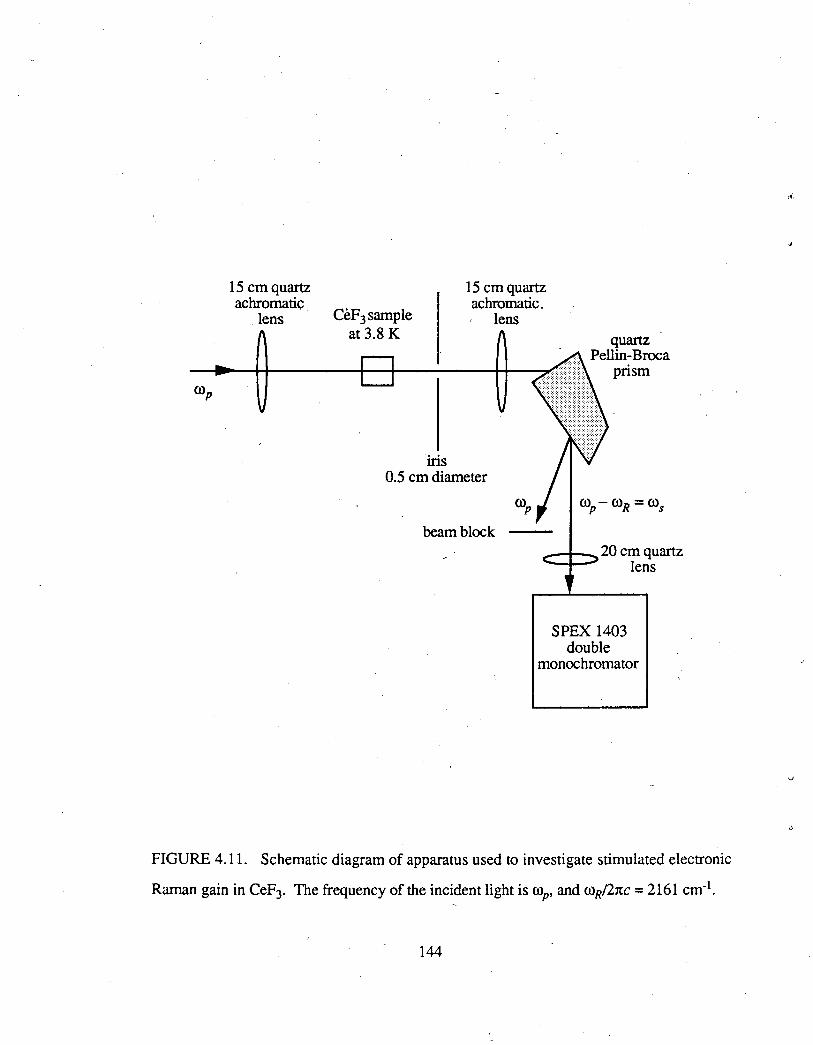
15 em quartz achromatic
lens CeF3sample at 3.8 K
iris
15 em quartz achromatic.
lens quartz
Pellin-Broca prism
0.5 em diameter
beam block --+-- 20 em quartz lens
SPEX 1403 double
monochromator
FIGURE 4.11. Schematic diagram of apparatus used to investigate stimulated electronic
Raman gain in CeF3. The frequency of the incident light is c.oP, and c.oR/2rtc = 2161 cm·1.
144
0
..
References
[1] R. J. Lange, Can. J. Res. A 14, 127 (1935).
[2] B. R. Judd, Operator Techniques in Atomic Spectroscopy, (McGraw-Hill, New York,
1963).
[3] B. G. Wybome, Spectroscopic Properties of the Rare Earths (Wiley, New York,
1965).
[4] G. H. Dieke, Spectra and Energy Levels of Rare Earth Ions in Crystals (Wiley, New
York, 1968).
[5] S. Hufner, Optical Spectra ofTransparent Rare Earth Compounds (Academic, New
York, 1978).
[6] Spectroscopy of Solids Containing Rare Earth Ions, edited by A. A. Kaplyanskii and
R. M. Macfarlane (Elsevier, Amsterdam, 1987). ,
[7] W. J. Miniscalco, J. M. Pellegrino and W. M. Yen, J. Appl. Phys~l09 (1978).
[8] W. S. Heaps, L. R. Elias and W. M. Yen, Phys. Rev. B 13, 94 (1976) .
[9] B. F. Aull and H. P. Jensen, Phys. Rev. B 34, 6640 (1986).
[10] B.-F. Aull and H. P. Jensen, Phys. Rev. B 34, 6647 (1986).
145
[11] G. F. Imbusch and R. Kopelman, in Laser Spectroscopy of Solids, edited by W. M.
Yen and P.M. Selzer (Springer-Verlag, Berlin, 1981), p. 1.
[12] C. J. Balhausen, Molecular Electronic Structure of Transition Metal Complexes
(McGraw-Hill, London, 1979) ..
[13] R..M. Macfarlane, in Lasers, Spectroscopy and New Ideas, edited by .w. M. Yen and
M.D. Levenson (Springer-Verlag, New York, 1988), p. 205.
[14] R. M. Macfarlane and R. M. Shelby, in Spectroscopy of Solids Containing Rare Earth
Ions, edited by A. A. Kaplyanskii and R. M. Macfarlane (Elsevier, Amsterdam, 1987), p.
51.
[15] W. 0. Milligan, D. F. Mullica, G. W. Beall and L.A. Boatner, Inorg. Chim. Acta
60, 39 (1982).
[ 16] C. Linares, A. Loat and M. Blanchard, Structure and Bonding 33, (1977).
[17] Landolt-Bornsteion, Neue Serie, edited by K. H. Hellwege (Springer-Verlag, Berlin,
1973).
[18] E. Nakazawa and F. Shaiga, J. Lumin. 15, 255 (1977);
[19] A. Armbruster, R. Thoma and H. Wehrle, Phys. Stat. Sol. A 24, K71 (1971).
[20] G. M. Begun, G. W. Beall, L. A. Boatner and W. J. Gregor, J. Raman Spec. 11,
273 (1981).
[21] T. Hoshina and S. Kuboniwa, J. Phys. Soc. Jpn 31, 828 (1971).
[22] E. Nakazawa and S. Shionoya, J. Phys. Soc. Jpn. 36, 504 (1974).
[23] G. M. Williams, Ph.D. thesis, University of California at Berkeley (1988).
[24] G. M. Williams, N. Edelstein, L.A. Boatner and M. M. Abraham, Phys. Rev. B 40,
4143 (1989).
[25] G. M. Williams, P. C. Becker, J. G. Conway, N. Edelstein, L.A. Boatner and M.
M. Abraham, Phys. Rev. B 40, 4132 (1989).
146
"
[26] W. T. Camall, H. Crosswhite and H. M. Crosswhite, Argorie National Laboratory
Report, (unpublished), (1977).
[27] W. T. Camall, G. L. Goodman, K. Rajnak and R. S. Rana, J. Chern. Phys. 90,
3443 (1989).
[28] C. G. Olson, M. Piacentini and D. W. Lynch, Phys. Rev. B 18, 5740 (1978).
[29] 0. D. Allen and W. T. Comstock, Am. J. Sci. 19, 390 (1880).
[30] A. Zalkin, D. H. Templeton and T. E. Hopkins, Inorg. Chern. 5, 1466 (1966).
[31] G. D. Falcon and B. M. Gatehouse, Acta Cryst. B 32, 97 (1976).
[32] J. H. VanVleck and M. H. Hebb, Phys. Rev. 46, 17 (1934).
[33] R. A. Buchanan, H. E. Rast and H. H. Caspers, J. Chern. Phys. 44, 4063 (1966).
[34] H. Gerlinger and G. Schaak, Phys. Rev. B 33, 7438 (1986).
[35] L. R. Elias, R. Flach and W. M. Yen, Appl. Opt. 12, 138 (1973).
[36] L. R. Elias, W. S. Heaps and W. M. Yen, Phys. Rev. B 8, 4989 (1973).
[37] K. Y. Yang and J. A. DeLuca, Appl. Phys. Lett. 31, 594 (1977).
[38] D. J. Ehrlich, P. F. Moulton and J. R. M. Osgood, Opt. Lett. 5, 339 (1980).
[39] R. Laiho and M. Lakkisto, Phil. Mag. B 48, 203 (1983).
[40] D. Milman, M. J. Weber and A. J. Glass, Appl. Phys. Lett. 31, 822 (1977).
[41] R. Adair, L. L. Chase and S. A. Payne, Phys. Rev. B 39, 3337 (1989).
[42] R. P. Bauman and S. P. S. Porto, Phys. Rev. 161, 842 (1967).
[43] R. Laiho, M. Lakkisto and T. Levola, Phil. Mag. A 47, 235 (1983).
[44] D. J. Ehrlich, P. F. Moulton and J. R. M. Osgood, Opt. Lett. 4, 184 (1979).
[45] K. S. Lim and D. S. Hamilton, J. Opt. Soc. Am. B 6, 1401 (1989).
[46] R. W. Waynat and P. H. Klein, Appl. Phys. Lett. 46, 14 (1985).
[47] R. R. Jacobs, W. F. Krupke and M. J. Weber, Appl. Phys. Lett. 33, 410 (1978).
147
[ 48] D. S. Hamilton, in Tunable Solid State Lasers: Proceedings of the First International
Conference, edited by P. Hammerling, A. B. Budgor and A. Pinto (Springer-Verlag,
Berlin, 1985), p. 80.
[49] L. Brewer, J. Opt. Soc. Am. 61, 1666 (1971).
[50] N. Edelstein (private communication).
[51] M. J. Weber, J. Appl. Phys. 44, 3205 (1973).
[52] S. P. Chernov, L. I. Devyatkova, 0. N. Ivanova, A. A. Kaminskii, V. V. Mikhailin,
S. N. Rudnev and T.V. Uvarova, Phys. Stat. Sol. A 88, K169 (1985).
[53] M.D. Levenson and N. Bloembergen, Phys. Rev. B 10, 4447 (1974).
[54] Y. R. Shen, The Principles of Nonlinear Optics (Wiley, New York, 1984).
[55] M. D. Levenson and S. Kano, Introduction to Nonlinear Laser Spectroscopy
(Acad~mic, San Diego, 1988).
[56] P. D. Maker and R. W. Terhune, Phys. Rev. 137, A801 (1965).
[57] J. J: Sakurai, Modern Quantum Mechanics (Benjamin/Cummings, Menlo Park,
1985).
[58] The factor of 12·is added to conform to the notation of Maker and.Tehrune (Phys.
Rev. 137, A801 (1965)).
[59] J. J. Sakurai, Advanced Quantum Mechanics (Addison-Wesley, Reading, MA, 1967).
[60] J. J. Wynne, Phys. Rev. Lett. 29, 650 (1972).
[61] M. L. Shand, J. Appl. Phys. 52, 1470 (1981).
[62] K. P. Traar, Phys. Rev. B 35, 3111 (1987).
[63] R. L. Cone, D. A. Ender, M. S. Otteson, P. L. Fisher, J. M. Freidman and H. J. ,,
Guggenheim, in Proceedings of the Topical Meeting on Laser Techniques for Extreme
Ultraviolet Spectroscopy, AlP Conf. Proc. No. 90, edited by T. J. Mcilrath and R. R.
Freeman (AlP, New York, 1982), p. 471.
148
[64] R. L. Cone, D. A. Ender, M. S. Otteson, P. L. Fisher, J. M. Freidman and H. J.
Guggenheim, Appl. Phys. B 28, 143 (1982).
[65] D. A. Ender, M. S. Otteson, R. L. Cone and H. J. Guggenheim, Opt. Lett. 7, 611
(1982).
[66] J. Huang, B. Jaquier and R. L. Cone, (to be published).
[67] F. Mosharay, R. Kichinski, R. J. Beach and S. R. Hartman, Phys. Rev. A 40, 4426
(1989).
[68] C. V. Raman and K. S. Krishnan, Nature 121, 501 (1928).
[69] G. Landsberg and L. Mandelstamm, Die Naturwissenschaften 16, 577 (1928).
[70] J. T. Roughen and S. Singh, Phys. Rev. Lett. 10, 406 (1963).
[71] R. J. H. Clark and T. J. Dines, in Advances in Infrared and Raman Spectroscopy,
edited by R. J. H. Clark and R. E. Hester (Heyden, London, 1982), p. 282.
[72] Y. Kato and H. Takuma, J. Chern. Phys. 54, 5398 (1971).
[73] A. Keil and S. P. S. Porto, J. Mol. Spectrosc. 32, 458 (1969).
[74] J. A. Koningstein and 0. S. Mortensen, Phys. Rev. 168, 75 (1968).
[75] Chemical Applications of Nonlinear Raman Spectroscopy, edited by A. B. Harvey
(Academic, New York, 1981).
[76] Advances in Non-linear Spectroscopy, edited by R. J. H. Clark and R. E. Hester
(Wiley, Chichester, 1988).
[77] A. Keil and J. F. Scott, Phys. Rev. B 2, 2033 (1971).
[78] R. L. Wadsack and R. K. Chang, Solid State Commun. 10, 45 (1972).
[79] D. Nicollin and J. A. Koningstein, Chern. Phys. 49, 377 (1980);
[80] P. C. Becker, G. M. Williams, R. E. Russo, N. Edelstein, J. A. Koningstein, L. A.
Boatner and M. M. Abraham, Opt. Lett. 11, 282 (1986).
[81] P. C. Becker, Ph.D. thesis, University of California at Berkeley (1986).
[82] P. Myslynski and J. A. Koningstein, Chern. Phys. 114, 137 (1987).
149
[83] D. Piehler, W. K. Kot and N. Edelstein, J. Chern. Phys. (in press).
[84] R. L. Cone, J. M. Freidman and T. W. Scott, Bull. Am. Phys. Soc. 35, 799 (1990).
[85] M. B. Rankin, J. P. Davis, C. Giranda, M. F. Squicciarini and L. C. Bobb, Talk
MEE1, OSA Annual Meeting, 1988 Technical Digest Series, Vol. 11, (Optical Society of
America, Washington, Year), p. 68.
[?61 W. Koechner, Solid-State Laser Engineering (Springer-Verlag, New York, 1988).
[87] R. T. Lynch, H. Lotem and N. Bloembergen, J. Chern. Phys .. 66, 4250 (1977).
· [88] R. E. Teets, Opt. Lett. 9, 226 (1984).
[89] M.A. Yuratich, Mol. Phys. 38, 625 (1979).
[90] D. Piehler and N. Edelstein, Phys. Rev. A 41, 6406 (1990).
[91] E. D. Reed and H. W. Moos, Phys. Rev. B 8, 980 (1973).
[92] R. T. Lynch and H. Lotem, J. Chern. Phys. 66, 1905 (1977).
[93] M. Goeppert-Mayer, Ann. Physik 9, 273 (1931).
[94] W. Kaiser and C. G. B. Garret, Phys. Rev. Lett. 7, 229 (1961).
[95] S. K. dayen, D. S. Hamilton and R. H. Bartram, Phys. Rev. B 28, 3706 (1983).
[96] S. K. Gayen, G. J. Pogatshnik and D. S. Hamilton, J. Lumin. 31&32, 260 (1984).
[97] S. K. Gayen, Ph.D. thesis, University of Connnecticut (1984).
[98] S. K. Gayen, D. S. Hamilton and R. H. Bartram, Phys. Rev. B 34, 7517 (1986).
[99] R. C. Leavitt, Phys. Rev. B 35, 9271 (1987).
[100] J. Sztucki and W. Strek, Chern. Phys. 143, 347 (1990).
[101] E. Bayer and G. Schaak, Phys. Stat. Sol. 41, 827 (1970).
·II
[102] M. C. Downer, in Laser Spectroscopy of Solids II, edited by W. M. Yen (Springer- ,j
Verlag, Berlin, 1989), p. 29.
[103] N. P. Karanjikar and R. C. Naik, Solid State Commun. 65, 1419 (1988).
[104] J.D. Axe, Phys. Rev. 136, A42 (1964).
[105] B. R. Judd, Phys. Rev. 127, 750 (1962).
150
[106] G. s.· Ofelt, J. Chern. Phys. 37, 511 (1962).
[107] L. L. Chase and S. A. Payne, Phys. Rev. B 34, 8883 (1986).
[108] M.D. Levenson, IEEE J. Quantum Electron. QE-10, 110 (1974).
[109] M. Sheik-Bahae, D. J. Hagan and E. W. VanStryland, Phys. Rev. Lett. 65, 96
(1990).
[110] P. C. Becker, N. Edelstein, B. R. Judd, R. C. Leavitt and G. M. S. Lister, J. Phys.
C 18, L1063 (1985).
[111] W. F. Krupke, Phys. Rev. 145, 325 (1966).
[112] R. C. Powell, S. A. Payne, L. L. Chase and G. D. Wilke, Phys. Rev. B 41, 8593
(1990).
[113] J. I. Steinfeld, Molecules and Radiation (MIT Press, Cambridge, Massachusetts,
1985).
[114] B. R. Judd, Inorg. Chim. Acta 139, 341 (1987).
[115] L. J. Lyu and D. S. Hamilton, (to be published).
[116] S. N. Karpukhin and A. I. Stepanov, Sov. J. Quantum Electron. 16, 1027 (1986).
[117] R. H. Stolen, Proc. IEEE 68, 1232 (1980).
151