
Nonlinear Molecular Vibrational Spectroscopy for Surface ... · Nonlinear Molecular Vibrational...
29
Transcript of Nonlinear Molecular Vibrational Spectroscopy for Surface ... · Nonlinear Molecular Vibrational...

1
2
Nonlinear Molecular Vibrational Spectroscopy for Surface Analysis of Thin
Complex Films and Buried Interfacial Systems (II)
NSC89-2112-M-009-036 (Aug. 1, 1999 to July 31, 2000)
Investigator: Jung Y. Huang
Organization: Institute of Electro-Optical Engineering
Chiao Tung University
Hsinchu, Taiwan 30050, R.O.C.
Tel: 03-5719755
Fax: 03-5716631
E-mail: [email protected]
Abstract
In this report, we present the studies of thin complex films, such as liquid crystals
and polymeric aligning layers, with optical retardance measurement, infrared absorption
spectroscopy, Raman scattering, and Raman imaging microscopy. The molecular ordering
of liquid crystals and polymeric thin films induced by mechanical rubbing and ultraviolet
light exposure are investigated in view of their technical potential. An important question is
that how liquid crystal molecules are aligned and reoriented during field-induced switching.
It is still unclear about the detailed reorientation process of the chain and core parts of liquid
crystal. To understand the underlying dynamics at the molecular level, we are employing
Fourier transform infrared absorption spectroscopy to generate time-resolved spectra of
liquid crystal molecules during the field-induced switching process. By combining these
methods we wish in the near future to answer how molecular chirality and chiral dopants
affect the switching dynamics of ferroelectric liquid crystals.

3
Contents
I. Introduction
II. Theory
(a) Polarized infrared absorption and the relations to the order parameters of molecular
orientational distribution
(b) Raman scattering and the relations to the order parameters of molecular orientational
distribution
III. Experimental developments for characterizing thin complex films
(a) Characterization of polymeric aligning surfaces with optical retardation measurement
(b) Characterization of polymeric aligning films with Fourier transform infrared
absorption spectroscopy
(c) Anchoring energy measurement of liquid crystal molecules on a polymeric aligning
surface
(d) Raman imaging for thin complex films
(e) Time-resolved and polarized Fourier-transform infrared absorption spectroscopy for
liquid crystal alignment and field-induced reorientation
IV. Conclusions and future prospect
4
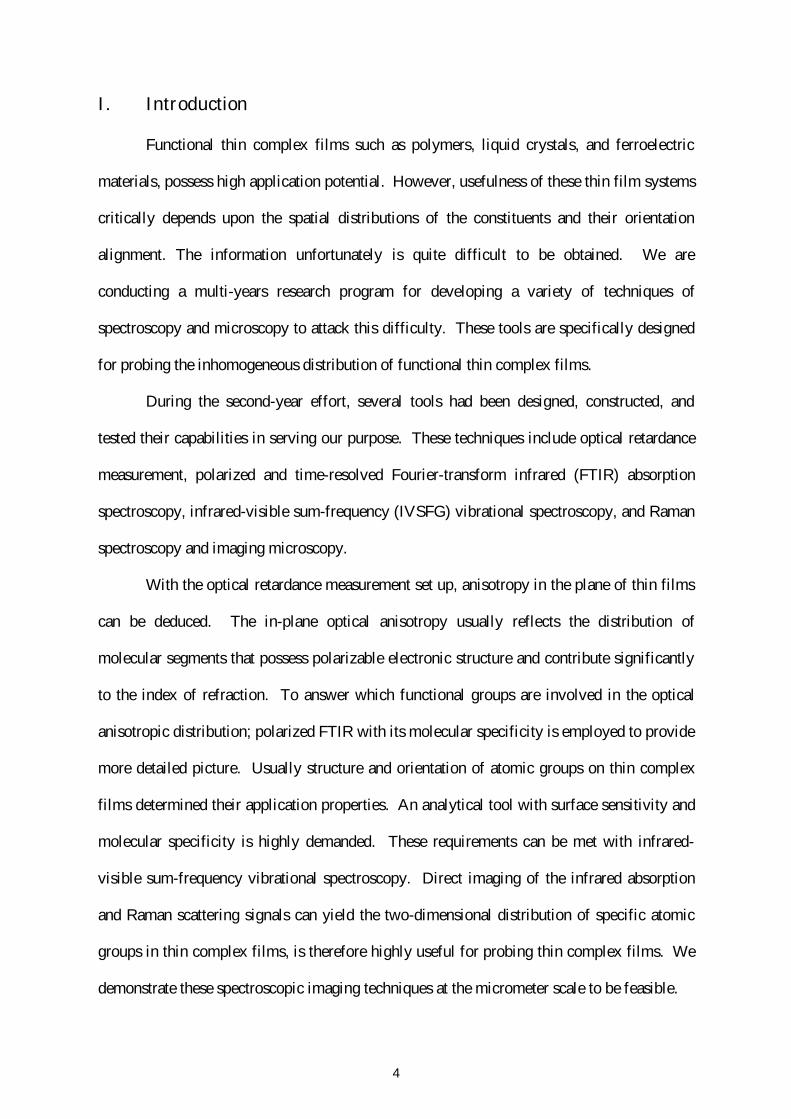
I. Introduction
Functional thin complex films such as polymers, liquid crystals, and ferroelectric
materials, possess high application potential. However, usefulness of these thin film systems
critically depends upon the spatial distributions of the constituents and their orientation
alignment. The information unfortunately is quite difficult to be obtained. We are
conducting a multi-years research program for developing a variety of techniques of
spectroscopy and microscopy to attack this difficulty. These tools are specifically designed
for probing the inhomogeneous distribution of functional thin complex films.
During the second-year effort, several tools had been designed, constructed, and
tested their capabilities in serving our purpose. These techniques include optical retardance
measurement, polarized and time-resolved Fourier-transform infrared (FTIR) absorption
spectroscopy, infrared-visible sum-frequency (IVSFG) vibrational spectroscopy, and Raman
spectroscopy and imaging microscopy.
With the optical retardance measurement set up, anisotropy in the plane of thin films
can be deduced. The in-plane optical anisotropy usually reflects the distribution of
molecular segments that possess polarizable electronic structure and contribute significantly
to the index of refraction. To answer which functional groups are involved in the optical
anisotropic distribution; polarized FTIR with its molecular specificity is employed to provide
more detailed picture. Usually structure and orientation of atomic groups on thin complex
films determined their application properties. An analytical tool with surface sensitivity and
molecular specificity is highly demanded. These requirements can be met with infrared-
visible sum-frequency vibrational spectroscopy. Direct imaging of the infrared absorption
and Raman scattering signals can yield the two-dimensional distribution of specific atomic
groups in thin complex films, is therefore highly useful for probing thin complex films. We
demonstrate these spectroscopic imaging techniques at the micrometer scale to be feasible.

5
Finally, to investigate the molecular dynamics of a field-induced reorientation in a
thin complex liquid crystal film, we are currently undergoing to construct a time-resolved
FTIR spectroscopy to probe the underlying reorientation process at the molecular level. In
the near future, we hope by combining these methods to answer how molecular chirality and
chiral dopants affect the switching dynamics of ferroelectric liquid crystals.

6
Theory
(a) Polar ized infrared absorption and the relations to the order parameters of
molecular or ientational distr ibution
A laser beam propagates through a sample, which has a complex index of refraction
)()()(~ ννν iKnn −= , will experience an intensity loss of
dlINNBc
hdlIKdI nnnn )()( '''''' −==−νν , (IIa.1)
where Nn’ is the population of the n’ level. B is the Einstein B coefficient of the material and
can be related to the square of the transition moment from 'n to ''n
2'''2
32
'''2
'''2
'''2
3
''' |)(|3
)2(]|)(||)(||)(|[
3)2(
nnnnznnynnxnn hhB µπµµµπ
=++= . (IIa.2)
From Eqs. (IIa.1) and (IIa.2), the extinction coefficient K(ν) can be then expressed as
2'''''''''
3
|)(|)(3
)2()( nnnnnn NN
chK µνπν −= . (IIa.3)
Assuming '''nnB to be constant over the spectral line, we then have an integrated absorption
coefficient of
><=∫ 2''' |)(|
3)( nngc
NdK µπνν , (IIa.4)
where KK
Kggg Q∑+= )()0( µµµ .
A 2nd-rank absorbance tensor can be defined as
ΩΩ⋅=Φ ∫ dfEc
NA Kg )(][
3)( 2)(µπ
, (IIa.5)
where Φ is the angle between the incident light polarization direction and the X-axis of the
laboratory coordinates system, f(Ω) denotes the orientational distribution of the dipole
moment derivative in the measurement spot. We can also deduce an anisotropic part from
the absorbance tensor

7
ikikikik ATrAa δ)(31
−= . (IIa.6)
In the molecular frame, the anisotropic absorbance tensor can be expressed in terms of an
1×5 vector
)2,2,2),(21,23( ηςξςξηηηξξςς aaaaaaWmol −= . (IIa.7)
Similarly, in the laboratory frame, the corresponding anisotropic absorbance tensor can be
found to be: )2,2,2),(21,23( yzxzxyyyxxzzlab aaaaaaW −= . (IIa.8)
Fig. IIa.1 Schematic diagram showing the relationship between the molecular frame (ξηζ)
and the laboratory coordinates system (XYZ).
From Eq. (IIa.5) we can obtain simple relationships between the orientational averaged
absorbance tensors from the molecular to the laboratory frames
5,...,2,1,
)()(
=
>><<=ΩΩ=ΩΩ>=< ∫ ∫lmwhere
SWdfSWdfWW mlmol
mmlmol
llab
llab
l . (IIa.9)
With a normal incident geometry on the XZ plane, the integrated absorbance is found to be
>Φ<+−=Φ 2cos232
21
31
)( 21lablab WWAA . (IIa.10)

8
Based on the analysis, the orientational distribution of given functional groups in a
complicated thin film can be deduced from a set of measured polarized Fourier-transform
infrared (FTIR) absorption spectra. The procedure is detailed as follows:
(i) For a given normal mode vibration the integrated absorbance as a function of the
incident infrared polarization direction A(Φ) is first calculated from measured FTIR
spectra;
(ii) Fit the resulted A(Φ) to Eq. (IIa.10) to deduce lablab WandW 21 ;
(iii) From
><+><=−=
><+><==
2221212
2121111
)(21
23
SWSWaaW
SWSWaWmolmol
YXlab
molmolZ
lab
(IIa.11)
and
])()[(21
)(232)(
,2)(
,2
2)(,1
Kg
Kg
mol
Kg
mol
W
W
ηξ
ς
µµ
µ
−=
=
(IIa.12)
the order parameters of molecular distribution, ><><><>< 22211211 ,,, SandSSS , can
then be determined. Note that ><>< 1211 SandS denote the orientational order parameter
and the transverse order parameter (which relates to the dichroic ratio), and
><>< 2221 SandS can reflect the biaxiality of the film.
(b) Raman scatter ing and the relations to the order parameters of molecular
or ientational distr ibution
Considering a molecule which is excited by a laser beam with a polarization along the X-
axis and propagating along the Y-axis of the laboratory frame, the Raman signal along the Z-
axis is proportional to
][2
])()([2
),( 2233
2233
><+><=><+><= XXYXsp
ZYsp
pss cQQ
cI αα
ννπµµ
ννπνν . (IIb.1)
The Raman polarizability tensor for a rod-shape molecule usually possesses a single
dominant component ςςα . A free molecular rotation along the ς -axis leads to the following
orientational averages of the squared polarizability components

9
222242
2442
)]2sin()sin(cos)2cos(sincos2[sin41
]sinsincos[cossin
ςς
ςς
αφφθα
αφφθα
Φ−Φ+ΦΦ>=<
Φ−Φ>=<
YX
YX
.
(IIb.2)
Here Φ is the azimuthal angle between the sample coordinates (xyz) and the laboratory
frame (XYZ). By combining Eqs. (IIb.1) and (IIb.2), we therefore obtain the azimuthal-
dependent Raman scattering intensity
)]2cos(1[)]2cos(2cos(1[),( 00 Φ⋅+=Φ><+= QIII sspss φνν , (IIb.3)
where Q is the azimuthal order parameter. Eq. (IIb.3) will be used to deduce the aligning
ordering of liquid crystal molecules on a variety of polymeric surfaces.
II. Exper imental developments for character izing thin complex films
(a) Character ization of polymer ic aligning sur faces with optical retardation
measurement
The molecular orientation of polymers can be studied using wide-angle x-ray diffraction,
small-angle x-ray diffraction, polarized infrared absorption spectroscopy, and birefringence
measurements. Birefringence measurements are quite robust because they can determine
molecular orientation for both amorphous and crystalline materials. The angle between the
polymer chains and the film in-plane direction govern the anisotropy. The birefringence n∆
of spin-coated films can be related to their molecular orientation >=< )2cos( φQ using
)13(4max
|| +∆
=−=∆ ⊥ Qnnnn (IIIa.1)
where ||n is the index of refraction lateral to the film, ⊥n is the index of refraction vertical to
the film, and maxn∆ is the maximum birefringence at perfect molecular alignment which
yields Q=1.
10
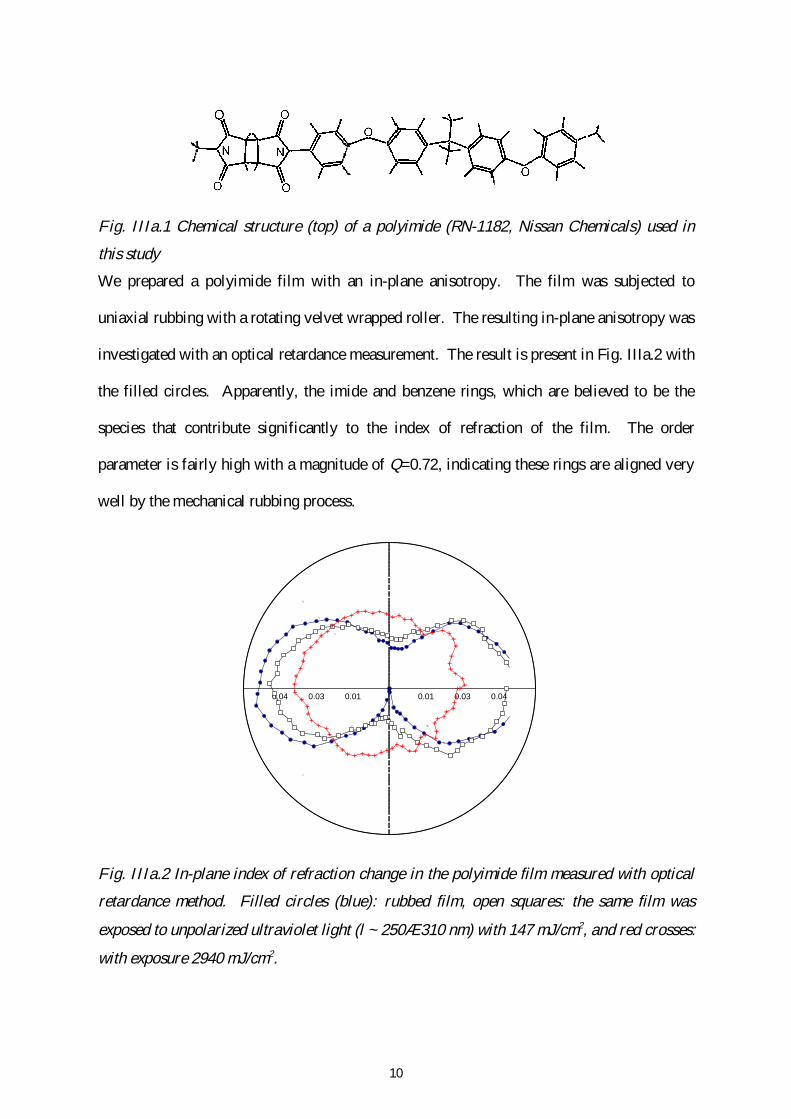
Fig. IIIa.1 Chemical structure (top) of a polyimide (RN-1182, Nissan Chemicals) used in
this study
We prepared a polyimide film with an in-plane anisotropy. The film was subjected to
uniaxial rubbing with a rotating velvet wrapped roller. The resulting in-plane anisotropy was
investigated with an optical retardance measurement. The result is present in Fig. IIIa.2 with
the filled circles. Apparently, the imide and benzene rings, which are believed to be the
species that contribute significantly to the index of refraction of the film. The order
parameter is fairly high with a magnitude of Q=0.72, indicating these rings are aligned very
well by the mechanical rubbing process.
0.010.01 0.030.03 0.040.04
Fig. IIIa.2 In-plane index of refraction change in the polyimide film measured with optical
retardance method. Filled circles (blue): rubbed film, open squares: the same film was
exposed to unpolarized ultraviolet light (λ∼ 250→310 nm) with 147 mJ/cm2, and red crosses:
with exposure 2940 mJ/cm2.
11
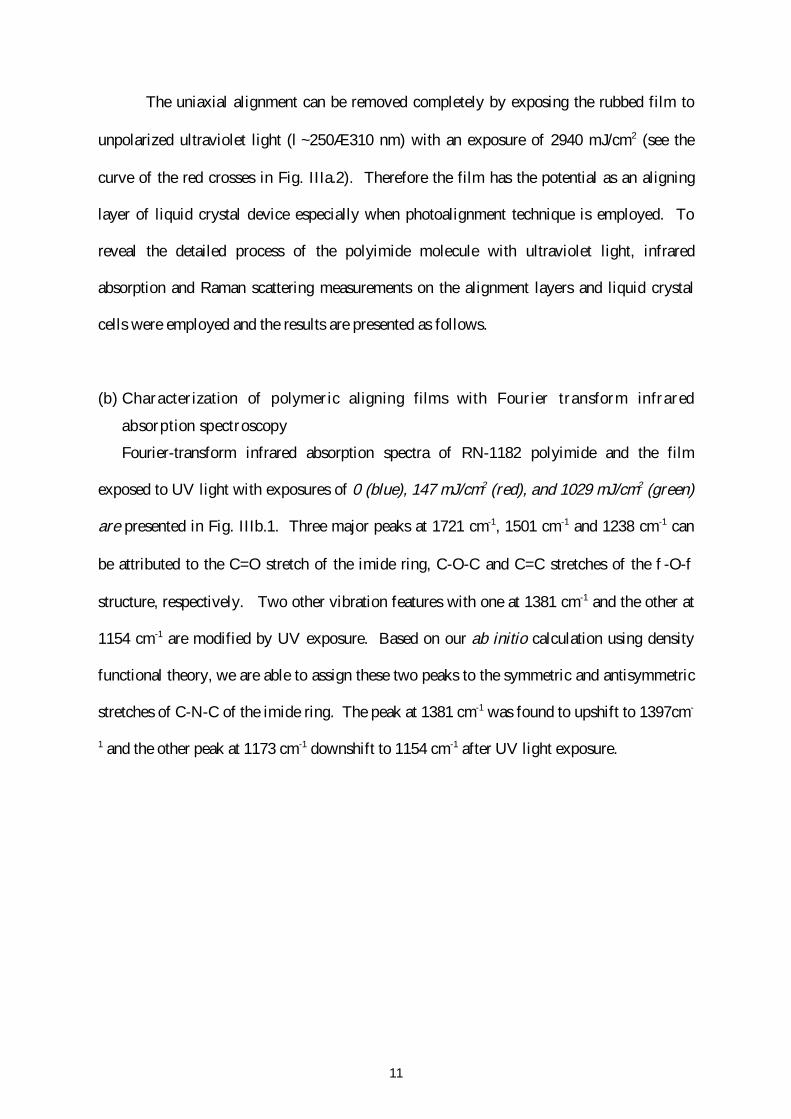
The uniaxial alignment can be removed completely by exposing the rubbed film to
unpolarized ultraviolet light (λ∼250→310 nm) with an exposure of 2940 mJ/cm2 (see the
curve of the red crosses in Fig. IIIa.2). Therefore the film has the potential as an aligning
layer of liquid crystal device especially when photoalignment technique is employed. To
reveal the detailed process of the polyimide molecule with ultraviolet light, infrared
absorption and Raman scattering measurements on the alignment layers and liquid crystal
cells were employed and the results are presented as follows.
(b) Character ization of polymer ic aligning films with Four ier transform infrared
absorption spectroscopy
Fourier-transform infrared absorption spectra of RN-1182 polyimide and the film
exposed to UV light with exposures of 0 (blue), 147 mJ/cm2 (red), and 1029 mJ/cm2 (green)
are presented in Fig. IIIb.1. Three major peaks at 1721 cm-1, 1501 cm-1 and 1238 cm-1 can
be attributed to the C=O stretch of the imide ring, C-O-C and C=C stretches of the φ-O-φ
structure, respectively. Two other vibration features with one at 1381 cm-1 and the other at
1154 cm-1 are modified by UV exposure. Based on our ab initio calculation using density
functional theory, we are able to assign these two peaks to the symmetric and antisymmetric
stretches of C-N-C of the imide ring. The peak at 1381 cm-1 was found to upshift to 1397cm-
1 and the other peak at 1173 cm-1 downshift to 1154 cm-1 after UV light exposure.

12
1000 1200 1400 1600 1800
IR Frequency (cm-1 )
0.005
0.015
0.025
0.035
IR A
bsor
banc
e
↓↓
↓
Fig. IIIb.1 Fourier transform infrared absorption spectra of the polyimide film which had
been subjected to varying exposures (blue: 0, red: 147 mJ/cm2 , and green: 1029 mJ/cm2) of
ultraviolet light with λ∼ 250→310 nm.
It has been known that imide ring is photoactive and can be modified by UV absorption. A
simple model can therefore be proposed, which is illustrated by a schematic diagram of Fig.
IIIb.2. The separation of the connected imide rings leads to a rearrangement of the RN-1182
polymer chain and therefore removes the rubbing-induced in-plain anisotropy. A similar
exposure on a spin-coated RN-1182 film with polarized UV light can also produce an in-
plane anisotropy.

13
Fig. IIIb.2 A chemical reaction model proposed to explain the observed infrared absorption
spectra shown in Fig. IIIb.1
To probe more deeply what happen on the rubbed RN-1182 film, we employed infrared-
visible sum-frequency (IVSFG) vibrational spectroscopy to reveal the realigned surface
structure. The result is presented in Fig. IIIb.3, where shows the CH3 stretch of the RN-1182
segments on surface. The peak at 2881 cm-1 is originated from the symmetric stretch of CH3
on Phe-O-Phe segment of RN-1182 molecule. The azimuthal dependence of the peak
intensity along the surface normal clearly exhibits threefold symmetry along the rubbing
direction. Since IVSFG process is high surface specific, the threefold symmetry of the
azimuthal pattern indicates CH3 group on the film surface is not isotropic. We currently are
undertaking similar investigation on UV light exposed RN-1182 films with IVSFG
spectroscopy in order to reveal the detailed surface aligning mechanism by UV photon
absorption. The information is important for understanding the detailed photo alignment
processes of liquid crystal by UV defined polyimide film. The results shall be presented in
our next NSC annual report.

14
2750 2850 2950 3050
Infrared Frequency (cm-1)
0.0
0.3
0.6
SFG
Inte
nsity
(arb
. uni
ts)
0.40.4
rubbed polymer film: ssp SFG Azimuthal pattern
2888 cm-1
Fig. IIIb.3 (Top) An infrared-visible sum-frequency vibrational spectrum from hydrocarbon
segments of a RN-1182 film. (Bottom) Azimuthal dependence of the symmetric CH3 stretch
peak at 2881 cm-1.
(c) Anchor ing energy measurement of liquid crystal molecules on a polymer ic aligning
surface
A film of liquid crystal molecules lying between two aligning surfaces can be
properly modeled by continuum mechanics. The deformation of liquid crystal medium, the
interaction of liquid crystal with an external field and alignment surface can be described
with proper free energies

15
20
2
233
2
022
211
)(21
)(21
)]([)2
()(21
Enf
enAf
nnkp
nnknkf
wherefffF
f
s
b
sfb
×∆−=
⋅−=
×∇×++×∇⋅+⋅∇=
++=
r
rr
rrrrr
εε
π
. (IIIc.1)
Here k11, k22, k33 are the splay, twist and bend elastic constants of the liquid crystal,
respectively, and p0 denotes the pitch of the material induced by a chiral dopant, and
er
represents the easy direction of the aligning surface. By minimizing the total free energy F
with the Euler-Lagrange approach, the following equation can be obtained
θθθ
θθεεφθθθ
θθθθ
233
211
20
222
2
sincos)(
0)(cos)(sin)(])()(
)()(
[21)(
)(
kkf
where
zzzEdzd
ddh
dzd
ddf
dzzdf
+=
=∆+−+
(IIIc.2)
The solution )(zθ is subjected to the boundary conditions at z=0 and z=d
dzedz
zez
Adzdf
Adzdf
==
==
−=
−−=
)](2sin[21
)(
)](2sin[21
)(00
θθθθ
θθθθ . (IIIc.3)
The phase of a light beam after passing through a liquid crystal cell, which is excited with an
external electric field, can be retarded with a magnitude of
]sinsin
[2
2222||
||⊥
⊥
⊥ −+
= nnn
nndRθθλ
π. (IIIc.4)
A set of calculated curves of R as a function of inverse voltage are presented in Fig. IIIb.1. It
shows the anchoring strength A can be deduced from a saturated voltage, with that field
strength all the liquid crystal molecules including that lie on the aligning surfaces are
oriented perpendicularly with the electric field. Therefore with the saturated field strength,
the optical retardance induced by liquid crystal film becomes zero. Experimentally the

16
saturated voltage can be estimated from the measured R-1/V curve by linearly expolating to
the zero retardance point, and the anchoring strength can be calculated from
0.00 0.05 0.10 0.15 0.20 0.25Inverse Voltage (1/V)
0
20
40R
etar
danc
e (D
egre
es)
K11=7 pN Az=5 pN/umK11=7 pN Az=50 pN/umK11=7 pN Az=500 pN/umK11=7 pN Az=20 pN/umK11=7 pN Az=10 pN/umK11=7 pN Az=30 pN/um
HN Cell Cell thickness=10 um
Fig. IIIc.1 Calculated curves of optical retardance as a function of inverse voltage for anti-
parallel aligned nematic liquid crystal cells with varying magnitudes of elastic constant k11
and anchoring strength A.
0.00 0.02 0.04 0.06 0.08 0.10 0.12 0.140.0
0.2
0.4
0.6
B A=10 C A=50 D A=100 E A=500 F A=1000 G A=20 H A=10000 I A=80 J A=300 K A=70 L A=40 A antiparallel cell uv0min C antiparallel cell uv1min G antiparallel cell uv3min I antiparallel cell uv7min M antiparallel cell uv20min ### A=150
reta
rdan
ce (r
ad)
1/V
Fig. IIIc.2 Measured (symbols) and calculated (lines) optical retardance of anti-parallel
homogeneous nematic liquid crystal cells aligned by rubbed RN-1182 films with various
anchoring energies.

17
0 1500 3000
Light Exposure (mJ/cm2)
0.5
1.0
1.5
2.0
Anc
horin
g E
nerg
y (1
0-4 J
/m2 )
Fig. IIIc.3 Measured anchoring energy of homogeneous nematic liquid crystal cells
deduced from Fig. IIIc.2. The aligning surfaces were prepared by rubbed RN-1182 films
and then subjected to various unpolarized UV light exposures.
To determine the azimuthal anchoring strength imposed by rubbing action or linearly
polarized ultraviolet light irradiation, 900-twist nematic liquid crystal cell were employed.
Owing to an elastic torque from the twist LC bulk, the liquid crystal molecules on the
surfaces do not orient to yield perfect 090=tφ twist angle. Instead, there exists an angular
deviation 0φ with 00220
0 cossin2
2 φφπφφkAd
pd
t =−− . (IIIc.5)
Equation (IIIc.5) may give us the simplest way to evaluate the azimuthal anchoring strength.
In other words, the anchoring energy can be calculated from the measurement of 0φ as a
zero-field technique.
We also investigate the molecular alignment of nematic liquid crystal molecules on
UV light defined RN-1182 aligning surface with Raman spectroscopy. The aligning surfaces
were exposed with linearly polarized ultraviolet light (LPUV) to induce in-plane anisotropy
[7]. The stretching modes of the C=C and CN groups in a cyano biphenyl liquid crystal

18
molecule can be aligned by LPUV exposed polymer films. This is supported by the
observed strong dependence of the Raman peaks on the rotational angle of the liquid crystal
film along the surface normal as shown by Fig. IIIc.4.
Fig. IIIc.4 Raman spectra from a nematic cyano biphenyl liquid crystal film as a function of
the rotation angle of the film relative to the surface normal. The zero degree denotes the
anisotropic direction of the aligning layer.
The molecular structure of cyano biphenyl liquid crystal molecule is shown in Fig. IIIc.5.
We performed an ab initio density functional calculation to obtain the molecular vibrations
and infrared absorption spectrum. The results are presented in Table IIIc.1
Fig. IIIc.5 Schematic showing the molecular structure of cyano biphenyl (CB) liquid crystal
Four peaks at 1200, 1302, 1616, and 2260 cm-1 can be attributed to from vibrations involved
biphenyl and C-N stretches whose transition moments are mainly along the molecular long
axis. If the long axes of liquid crystal molecules are aligned properly, their Raman scattering
intensities should exhibit significantly azimuthal dependence.

19
Table IIIc.1 Calculated molecular normal-mode frequencies of cyano biphenyl and thecorresponding infrared absorption strengths
Normal Modes Vibration Frequency(cm-1)
IR Absorption Symmetry
1. C1-N stretch 2237 89.8 A1
2. biphenyl C=Cstretch
1605 46.3 A1
3. (a) biphenyl C-C +C-H in-plane wag
(b) C5-C8 stretch +C-H in-plane wag
1446
1261
29.5
6.5
A1
A1
4. C(biphenyl)-H in-plane wag
1095 13.9 A1
1. biphenyl in-planeangular distortion
985 510
4.25.9
A1
6. C-H out-of-planewag
507 544 664 713 742 818
9.96.342.811.845.723.2
B1
0.30.3 0.60.6 0.90.9
1103 cm-1
1199 cm-1
1302 cm-1
1616 cm-1
Fig. IIIc.6 Polar plot of Raman peaks from a nematic cyano biphenyl liquid crystal film as a
function of the rotation angle of the film relative to the surface normal.

20
To probe the ordering, we select the C=C (biphenyl) stretch mode at 1616 cm-1 for
further analysis. The order parameter of the liquid crystal molecules, which are sandwiched
between two polymeric aligning surfaces, can be deduced by using Eq. (IIb.3). The results
are presented in Fig. IIIc.7. Here the polymeric surfaces are rubbed uniaxially and then
assembled anti-parallel. The rubbed surfaces were exposed to unpolarized UV light with
various exposures. It is surprising to see that the unpolarized light exposure enhances the
molecular alignment order instead of destroying it. Light exposure may remove some local
defects from mechanical rubbing, thus increase liquid crystal ordering. Detailed information
can be obtained by employing infrared-visible sum-frequency (IVSFG) vibration
spectroscopy, which is well known for its outstanding surface sensitivity and molecular
specificity. The study with IVSFG has been undertaking.
0 1000 2000 3000Exposure (mJ/cm2)
0.4
0.6
0.8
Ord
er P
aram
eter
Q=<
cosϕ
>
Fig. IIIc.7 Order parameter of the 1616 cm-1 Raman peak from a homogeneous nematic
liquid crystal film at 22 oC (red) and 33 oC (green). The Rubbed polymeric surfaces had
been illuminated with unpolarized UV light to various exposures.
(d) Raman imaging for thin complex films

21
Quantitative optical spectroscopic technique is highly useful for probing various optical
properties of materials. Methods based on the generation of second harmonic (SH) light [1]
and Raman scattering [2] are known to be capable of producing information about the polar
orientation and composition of the sample being studied. In a typical measurement, a sample
is illuminated with a focused laser beam and the generated SH or Raman signal is detected.
The generated signal is then integrated over whole laser beam and pulse duration. The signal
carries information about the material’s properties averaged over the illuminated area. To
probe the local structure and composition of a material, various imaging techniques should
be employed for providing the spatial resolving ability[2,3].
In this section, we shall present a multifunctional optical microscopy with wide field
illumination and multichannel detection. The analytical capability of our instrument was
demonstrated with several application examples in which the polar structure and
composition distribution of materials were resolved.
The Raman imaging spectro-microscope is detailed in Fig. IIId.1. Briefly, laser
excitation is provided by a 523 nm doubled Nd:YLF laser and a wide field excitation is
achieved at the sample. The scattered Raman photons are collected by an infinity-corrected
microscope (Nikon, Eclipse 600) via a Raman edge filter (Omega Optical). For Raman
imaging with high spatial fidelity, the Raman emission is filtered with a compact
electronically controlled 8-cm-1 band pass liquid crystal tunable filter (LCTF)[4]. Raman
images are collected using a 16-bit, TE-cooled (-20 oC), slow scan charge-coupled device
(CCD) detector (Apogee, AP7) having 512 pixels × 512 pixels (25 µm). The CCD has
quantum efficiency more than 80% from 500 nm to 800 nm.

22
Fig. IIId.1 Schematic of a Raman spectroscopy and microscope.
A swing away mirror can be positioned before LCTF to redirect the Raman emission to
a single-stage 0.3m spectrograph (Acton SP300). The Raman spectrum is collected with a
CCD detector (Apogee, SPH4) located at the exit focal plane of the spectrograph.
For SH imaging, a compact mode-locked Nd:YAG laser with a repetition rate of 100
MHz and pulse duration of 18 ps is used [5]. The experimental setup is similar to that
described in Fig. IIId.1 except transmission geometry is employed. A lens with a focal
length of 50 cm focuses the fundamental beam at 1.064 µm to achieve a peak power of 250
MW/cm2. The second harmonic signal at 532 nm was separated from the fundamental with
a series of filters in order to obtain high signal-to-noise ratio.
For probing the material composition, vibrational spectroscopy is better suited than
absorption/luminescence spectroscopy owing to its finger printing capability. By combining
Raman spectroscopy with optical microscopy, a distribution of material composition can be
revealed. This is illustrated in Fig. IIId.2, where Raman spectrum and Raman image from a
silicon integrated circuit chip are presented. The sample had subjected to various oxidation
and metallization processes. The Raman spectrum showed in Fig. IIId.2 (a) exhibits three
peaks located at 520, 610 and 810 cm-1. The 520-cm-1-peak is originated from the lattice

23
vibration of single crystal silicon (SCS) substrate. The other two peaks are mainly from
silicon and oxygen bonding as their intensities are much enhanced compared with the
spectrum taken on a clean SCS (bottom) with a native oxide.
By tuning the LCTF to the corresponding wavelengths of the Raman peaks, the two-
dimensional intensity distributions of the Raman signals can be obtained. In Fig. IIId.2(b),
the color composite (red=520 cm-1, blue=620 cm-1, green=820 cm-1) Raman chemical image
of the sample is presented to reveal the composition distribution of silicon and oxide on the
chip.
.
Fig. IIId.2 (a) Raman spectrum from a silicon integrated circuit chip (top) and a single
crystal silicon substrate (bottom). (b) Color composite Raman chemical image of the 520 cm-
1 (red), 610 cm-1 (blue) and 810 cm-1 (green) peaks from the silicon integrated circuit chip.
In summary, a multifunctional optical microscope has been developed for spatially
resolving the second harmonic and Raman scattering photons. The instrument has been
successfully applied to reveal the polar structure and composition distribution of some

24
optical materials. Detailed analysis of these imaging data demonstrates the technique to be
useful for many other functional materials with high application potential.
REFERENCES
[1] Y. R. Shen, Nature (London) 337, 519 (1989).
[2] H. R. Morris, J. F. Turner, H. Branka, M. Rose, A. Ryntz, and P. J. Treado, Langmuir 15,
2961-2972 (2000).
[3]M. H. Flörsheimer, M. Salmen, C. Bösch, M. Brillert, M. Wierschem, and H. Fuchs, Adv.
Mater. 9, 1061-1065 (1997); J. Vydra, and M. Eich, Appl. Phys. Lett. 72, 275-277 (1998).
[4]K. A. Christensen, N. L. Bradley, M. D. Morris, and R. V. Morrison, Appl. Spectrosco. 49,
1120-1125 (1995).
[5]P. K. Yang and J. Y. Huang, Opt. Commun. 173, 315-321 (2000).
[6]Pao-Keng Yang, Jung Y. Huang, and Jwo-Huei Jou, Proc. of NSC A 24, 310-315 (2000).
K. Sakamoto, K. Usami, T. Araya, and S. Ushioda, Jpn. J. Appl. Phys. 38, L1435-L1438
(1999).
(e) Time-resolved polar ized Four ier -transform infrared absorption spectroscopy for
liquid crystal alignment and field-induced reor ientation
Vibrational spectroscopy, such as Raman and infrared absorption spectroscopies, are
better suited for probing molecular conformation owing to the finger printing capability. In
liquid crystal research, an important question is that how liquid crystal molecules are aligned
and reoriented during field-induced switching. It is still unclear for the detailed reorientation
dynamics of chain and core parts of liquid crystal. Time-resolved Fourier transform infrared
absorption spectroscopy could yield more useful information.
Recently, Masutani et al. [Appl. Spectro. 46, 560 (1992)] developed a novel
asynchronous time-resolved FTIR spectrophotometer based on a conventional continuous-
scan interferometer. Their new method does not require synchronization between the signal
for time resolving and that for the sampling of the AD converter. In addition, there is no
shortest limit in time for transient phenomena to be measured, therefore time-resolved

25
measurements in the nanosecond or even shorter could be possible if proper gating technique
with infrared laser pulses are available.
In these regards, we modify a commercial FTIR module for making it a time-resolved
FTIR spectrophotometer in order to answer how liquid crystal molecules are aligned and
reoriented during field-induced switching processes. The schematic of our time-resolved
FTIR set up is described in Fig. IIIe.1. The electronic modules in blue color are involved in
the original FTIR modules. The resulting signals at every labeled point are depicted in Fig.
IIIe.2.
Fig. IIIe.1 Schematic showing a time-resolved Fourier transform infrared absorption
spectroscopy with asynchronous continuous scan approach.
Consider a material, which is excited by a periodic excitation )(tτΠ (see Fig. IIIe.2,
A) and the recovery time of the material is shorter than τ. The infrared transmittance
through the excited sample at time t is given then by
)(),()(),( 0 ttTTtT τννν Π⊗∆+= (IIIe.1)
We can also properly express the resulting interferogram as

26
∫ ∑∫
∫ ∫ ∑∫
∫∫
∞+
∞−
∞+
−∞=
∞+
∞−
∞+
∞−
∞+
−∞=
∞+
∞−
+∞
∞−
+∞
∞−
−∆+=
−−∆+=
Π⊗∆+==
ννπντνννπνν
ννπντδνννπνν
ννπννννπνν τ
dxSntTdxStT
dxSdtntttTdxStT
dxSttTdxStTtvtxF
n
n
m
]2cos[)(),(]2cos[)(),(
]2cos[)(]')'()',([]2cos[)(),(
]2cos[)()(),(]2cos[)(),(),2(
0
0
0
(IIIe.2)
By employing a gating technique to sample the interferogram at a fixed delay time
∆tD=gate-excitation, the time resolved interferogram (see Fig. IIIe.2, F) becomes
∫
∫ ∫ ∑∞+
∞−
+∞
∞−
+∞
∞−
+∞
−∞=
∆∆−=
−∆+∆−=
νπνν
ντνπννπνν
τ
τ
dvxStTttG
dntTvxSdvxSTttGtxF
DD
nD
)2cos[)(),()(
),()2cos[)()2cos[)()()[(),(' 0
(IIIe.3)
where T(ν, ∆tD) denotes the time-resolved transmittance at the delay time ∆tD. A smooth
time-resolved interferogram can be obtained by passing the gated signal through a low
pass filter (see Fig. IIIe.2, G)
∫+∞
∞−
∆=∆ νπνντ
dvxStTtxF DD )2cos[)(),(1
),( (IIIe.4)
Fig. IIIe.2 Schematic showing signals at each step of the time-resolved Fourier
transform infrared absorption spectroscopy.

27
We have checked the signals to be properly produced at each step. The data
acquisition in the time-resolved FTIR does not distort the acquired interferograms. This
is confirmed in Fig. IIIe.3, where two the infrared absorption spectra of a polyimide film
for homeotropic liquid crystal alignment measured with a continuous scan (blue color)
and the time-gating setup (red color) are compared. The gating circuit reproduces all the
fine features of the spectrum obtained by a continuous-scan FTIR module.
1000 1200 1400 1600 1800
IR frequency (cm[-1])
-0.05
0.15
IR A
bsor
banc
e
PI for homeotropic alignment
measured by continuous scanmeasured by gating setup
Fig. IIIe.3 Fourier-transform infrared absorption spectra of a polyimide film measured
with a continuous-scan FTIR module (blue) and with gating circuit inserted (red).
IV. Conclusions and future prospect
In this report, we present the studies of complex thin films, such as liquid crystals
and polymeric aligning layers, with optical retardance measurement, infrared absorption
spectroscopy, Raman scattering, and Raman imaging microscopy. The molecular ordering
of liquid crystals and polymeric thin films induced by mechanical rubbing and ultraviolet
light exposure are chosen in view of their technical potential. An important question about
their various applications is how liquid crystal molecules are aligned and reoriented during

28
field-induced switching. It is still unclear for the detailed reorientation process of chain and
core parts of liquid crystal. To understand the underlying dynamics at the molecular level,
we are currently employing Fourier transform infrared absorption spectroscopy to generate
time resolved FTIR spectra of liquid crystal molecules during the field-induced switching
process. By combining these techniques we wish in the near future to answer how molecular
chirality and chiral dopants affect the switching dynamics of ferro- and antiferroelectric
liquid crystals.