Nonlinear measure of synchrony between blood oxygen saturation...
16
Nonlinear measure of synchrony between blood oxygen saturation and heart rate from nocturnal pulse oximetry in obstructive sleep apnoea syndrome D Álvarez 1 , R Hornero 1 , D Abásolo 1 , F del Campo 2 , C Zamarrón 3 , M López 1 1 Biomedical Engineering Group, E.T.S.I. de Telecomunicación, University of Valladolid, Camino del Cementerio s/n, 47011, Valladolid, Spain 2 Hospital Universitario del Río Hortega, Servicio de Neumología, c/ Cardenal Torquemada s/n, 47010, Valladolid, Spain 3 Hospital Clínico Universitario, Servicio de Neumología, Travesía de la Choupana s/n, 15706, Santiago de Compostela, Spain E-mail: [email protected], [email protected], [email protected], [email protected], [email protected], [email protected] Abstract This study focuses on the analysis of the relationship between changes in blood oxygen saturation (SaO 2 ) and heart rate (HR) recordings from nocturnal pulse oximetry (NPO) in patients suspected of suffering from obstructive sleep apnoea (OSA) syndrome. Two different analyses were developed: a classical frequency analysis based on the magnitude squared coherence (MSC) and a nonlinear analysis by means of a recently developed measure of synchrony, the cross approximate entropy (cross-ApEn). A data set of 187 subjects was studied. We found significantly higher correlation and synchrony between oximetry signals from OSA Positive patients compared with OSA Negative subjects. We assessed the diagnostic ability to detect OSA syndrome of both the classical and nonlinear approaches by means of receiver operating characteristic (ROC) analyses with ten-fold cross-validation. The nonlinear measure of synchrony significantly improved the results obtained with classical MSC: 69.2% sensitivity, 90.9% specificity and 78.1% accuracy were reached with MSC, whereas 83.7% sensitivity, 84.3% specificity and 84.0% accuracy were obtained with cross-ApEn. Our results suggest that the use of nonlinear measures of synchrony could provide essential information from oximetry signals, which cannot be obtained with classical spectral analysis. Keywords: Obstructive sleep apnoea, nocturnal pulse oximetry, blood oxygen saturation, heart rate, synchrony, magnitude squared coherence, nonlinear analysis, cross approximate entropy. 1. Introduction Obstructive sleep apnoea (OSA) syndrome is a major sleep-related breathing disorder, affecting 1 to 5% of adult men and 2% of women in western countries (Young et al 2002). The gold standard diagnostic method for a definitive diagnosis of OSA is overnight polysomnography
Transcript of Nonlinear measure of synchrony between blood oxygen saturation...

Nonlinear measure of synchrony between blood oxygen saturation and heart rate from nocturnal pulse oximetry in obstructive sleep apnoea syndrome
D Álvarez1, R Hornero1, D Abásolo1, F del Campo2, C Zamarrón3, M López1 1 Biomedical Engineering Group, E.T.S.I. de Telecomunicación, University of Valladolid, Camino del Cementerio s/n, 47011, Valladolid, Spain 2 Hospital Universitario del Río Hortega, Servicio de Neumología, c/ Cardenal Torquemada s/n, 47010, Valladolid, Spain 3 Hospital Clínico Universitario, Servicio de Neumología, Travesía de la Choupana s/n, 15706, Santiago de Compostela, Spain E-mail: [email protected], [email protected], [email protected], [email protected], [email protected], [email protected] Abstract This study focuses on the analysis of the relationship between changes in blood oxygen saturation (SaO2) and heart rate (HR) recordings from nocturnal pulse oximetry (NPO) in patients suspected of suffering from obstructive sleep apnoea (OSA) syndrome. Two different analyses were developed: a classical frequency analysis based on the magnitude squared coherence (MSC) and a nonlinear analysis by means of a recently developed measure of synchrony, the cross approximate entropy (cross-ApEn). A data set of 187 subjects was studied. We found significantly higher correlation and synchrony between oximetry signals from OSA Positive patients compared with OSA Negative subjects. We assessed the diagnostic ability to detect OSA syndrome of both the classical and nonlinear approaches by means of receiver operating characteristic (ROC) analyses with ten-fold cross-validation. The nonlinear measure of synchrony significantly improved the results obtained with classical MSC: 69.2% sensitivity, 90.9% specificity and 78.1% accuracy were reached with MSC, whereas 83.7% sensitivity, 84.3% specificity and 84.0% accuracy were obtained with cross-ApEn. Our results suggest that the use of nonlinear measures of synchrony could provide essential information from oximetry signals, which cannot be obtained with classical spectral analysis. Keywords: Obstructive sleep apnoea, nocturnal pulse oximetry, blood oxygen saturation, heart rate, synchrony, magnitude squared coherence, nonlinear analysis, cross approximate entropy.
1. Introduction
Obstructive sleep apnoea (OSA) syndrome is a major sleep-related breathing disorder, affecting 1 to 5% of adult men and 2% of women in western countries (Young et al 2002). The gold standard diagnostic method for a definitive diagnosis of OSA is overnight polysomnography

D Álvarez et al
(PSG). However, its relative high cost and complexity, along with the large number of people suspected of having this disease, limit its capacity as a diagnostic test for OSA (Whitelaw et al 2005). Due to its simplicity and low cost, nocturnal pulse oximetry (NPO) has been proposed as a substitute for PSG in the diagnostic assessment of patients with suspected sleep apnoea (Netzer et al 2001). NPO is a standard technique for monitoring the arterial blood oxygen saturation (SaO2) in operating rooms, intensive care units and other critical care settings (Kirby et al 1997). Additionally, pulse oximeters accurately estimate heart rate (HR) at rest and during submaximal exercise (Iyriboz et al 1991) and are widely used for screening for the presence of congenital heart disease and cardiovascular malformations in newborns (Granelli et al 2008).
OSA is characterised by repetitive reduction or cessation of airflow due to partial or complete airway obstruction, leading to hypoxemia, bradycardia, arousals and fragmented sleep (Gilleminault et al 1978). The cardiovascular and pulmonary systems deliver oxygen to the tissues working in an integrated fashion: HR increases with inspiration and decreases with expiration. Moreover, under certain physiological conditions, HR is clearly a dependent variable of ventilation (Finley et al 1985). Apnoeic episodes during sleep are generally associated with profound bradycardia with cyclical variation of the HR during apnoea and resumption of breathing (Krahn et al 2006). Nightly episodes of hypoxia, arousals and swings in intrathoracic pressure due to OSA may lead to sustained elevation of blood pressure via pathophysiologic mechanisms that include chronically elevated sympathetic tone, alterations in baroreceptor function and cardiovascular remodelling (Young et al 2002). Additionally, recent studies relate OSA with secondary systemic hypertension (Peppard et al 2000).
The cardiovascular morbidity associated with OSA affects patients in a wide severity spectrum and single SaO2 recordings do not reflect all the physiological aspects of this disease. NPO-based studies have been mainly focused on SaO2 and few researchers have assessed the usefulness of HR and its relation with SaO2 to characterise OSA syndrome. The synchronization between the increase in the very low frequency components of Holter ECG and episodes of sleep-related breathing disorders was suggested in the studies by Shiomi et al (1996) and Keyl et al (1997). The study by Zamarrón et al (2003) showed that spectral analysis of HR from NPO provided additional information to that obtained from SaO2. Recently, Zamarrón et al (2005) showed that OSA patients presented a dynamic coordination between SaO2 and HR from NPO in specific frequencies. In the present study, we investigate changes in simultaneously recorded SaO2 and HR signals from NPO to search for additional and useful information in order to better characterise OSA syndrome. Our research is aimed at estimating the overall synchrony of each SaO2 and HR pair, in order to test its possible usefulness in OSA diagnosis.
Spectral analysis has been commonly applied to investigate periodicities due to apnoea events in cardiorespiratory recordings (Penzel et al 2002, Zamarrón et al 2003). Additionally, spectral coherence has also been traditionally used to estimate similarities between physiological signals (Stam and van Dijk 2002, Zamarrón et al 2005). However, standard spectral estimators can be inconsistent and biased, especially in the presence of outliers and nonstationarities (Pincus 2000). Particularly, coherence estimates are not suitable to characterize nonstationary signals and only capture linear relations (Stam and van Dijk 2002).
Recent studies (Álvarez et al 2006, del Campo et al 2006, Zamarrón et al 2006, Hornero et al 2007, Álvarez et al 2007) have shown the usefulness of nonlinear analysis of SaO2 and HR from NPO to help in the diagnosis of OSA syndrome. Other researchers (Aguirre et al 1999) have previously estimated different nonlinear models of the dynamics of sleep apnoea based on SaO2, HR and respiration, suggesting the nonlinearity of such data. A recently developed nonlinear measure of asynchrony between time series, the cross approximate entropy (cross-ApEn), has demonstrated to be complementary and often superior to classical spectral and correlation based methods (Pincus 2001). It has been mainly applied to study hormone time series dynamics (Veldhuis et al 2001, Liu et al 2005).
In the present study we apply both classical and nonlinear measures of synchrony to SaO2 and HR recordings from NPO. Our research is aimed to assess whether cross-ApEn could

Nonlinear measure of synchrony from pulse oximetry in sleep apnoea
improve the classical approach based on the magnitude squared coherence (MSC). Finally, we evaluate their advantages and limitations in the diagnostic assessment of OSA syndrome. 2. Data set and sleep studies
A total of 187 subjects (147 males and 40 females) with ages between 21 and 81 years old and body mass indexes (BMI) ranging between 19.53 and 46.51 kg/m2 suspected of having OSA were included in the study. All subjects presented, at least, one of the following symptoms reported by the subject or a bed mate: daytime hypersomnolence, loud snoring, nocturnal choking and awakenings, or apnoeic events. Sleep studies were carried out usually from midnight to 08:00 AM in the Sleep Unit of Hospital Clínico Universitario in Santiago de Compostela, Spain. The Review Board on Human Studies approved the protocol, and all subjects gave their informed consent to participate in the study. Sleep studies consisted on a conventional PSG with a simultaneously acquired NPO. All patients were clinically stable during the whole recording time. None of the patients involved in the study suffered from chronic heart failure or insulin-dependent diabetes mellitus. Additionally, none of the patients showed clinical evidence of autonomic dysfunction or neuropathy. Individuals presenting permanent or paroxysmal atrial fibrillation or a pacemaker were excluded from the study. Patients were free from any medication which could influence sleep studies. Table 1 summarizes the demographic and clinical data of the patients included in this study.
All patients underwent overnight PSG (Ultrasom Network, Nicolet, Madison, WI, U.S.A.). Each PSG register included electroencephalogram (EEG), electrocardiogram (ECG), electrooculogram (EOG), chin electromyogram (EMG), measurement of chest wall movement and air flow measurement (three-port thermistor). In the airflow measurement procedure, the thermistor may not be sensitive for detecting hypopnoeas, leading to an underestimation of the AHI (Series and Marc 1999). However, the thermistor is the most common method for defining breathing events based on a flow measurement (Flemons et al 2003). The PSG register was analyzed over periods of 30 s according to the Rechtschaffen and Kales rules (Rechtschaffen and Kales 1968). Apnoea was defined as the cessation of airflow for more than 10 seconds and hypopnoea as the reduction of respiratory flow for at least 10 seconds accompanied by a 4% or more decrease in the saturation of haemoglobin. The average apnoea-hypopnoea index (AHI) was calculated for hourly periods of sleep. Subjects with an AHI greater than or equal to 10 (AHI ≥ 10) were diagnosed as suffering from OSA. If the subject had less than 3 hours of total sleep, the sleep study was repeated. The initial patient population was divided into two groups using the AHI derived from the PSG. 111 patients (59.4%) diagnosed as suffering from OSA syndrome composed the OSA Positive group, with an average AHI of 40.07 ± 19.64 events/hour, an age of 58.30 ± 12.88 years and a BMI of 30.45 ± 4.92 kg/m2. The remaining 76 patients (40.6%) composed the OSA Negative group, with an AHI of 2.04 ± 2.36 events/hour, a mean age of 57.57 ± 12.87 years and a BMI of 28.42 ± 6.02 kg/m2.
The oximetry analysis was carried out using a Criticare 504 pulse oximeter (CSI, Waukesha, WI, U.S.A.). SaO2 and HR signals were simultaneously recorded using a dual wavelength-based finger probe with a sampling frequency of 0.2 Hz (one sample every 5 s). Although new oximeters work at higher sampling frequencies, the study carried out by Warley et al (Warley et al 1987) showed that this sampling frequency provides reasonable resolution in SaO2 variability. Moreover, oximetry signals recorded at higher sampling frequencies are usually subsequently averaged to obtain one sample every 12 seconds (Levy et al 1996, Flemons et al 2003, Magalang et al 2003). There is some underestimation of the peak SaO2 in recovery post-apnoea, but the signal shape and variability are preserved (Warley et al 1987). Pulse oximeters quantify SaO2 by measuring the absorption of two frequencies of light by perfused tissues: two LEDs of differing wavelengths are placed on one side of the finger, whereas a photodetector detect the transmitted light at the opposite side (Coetzee et al 2000). The absorption of light passing through the body varies as blood pulses into the tissue with each beat of the heart. The HR can be accurately estimated from the variations in the amount of

D Álvarez et al
transmitted light. Oximetry signals were saved to separate files and processed off-line by means of MSC and cross-ApEn. Each pair of oximetric recordings was automatically scanned to remove artefacts and drops to zero due to poor contact from the finger probe, patient movements or bad regional circulation.
3. Methods
3.1. Coherence function analysis
The coherence function between two wide-sense stationary random processes x and y is equal to the cross power spectrum Gxy(f) divided by the squared root of the product of their auto power spectra (Carter 1987). Mathematically, the coherence function is defined by
( ))()(
)(
fGfG
fGf
yyxx
xy
xy =γ . (1)
The magnitude squared coherence (MSC) Cxy(f) is a normalized cross-spectral density function given by
2)()( ffC xyxy γ= , 1)(0 ≤≤ fC xy , (2)
which provides a measure of the degree of correlation between each of the individual frequency components of two signals (Hampson and Mallen 2006).
To estimate the cross power spectral density (cross-PSD) and the auto power spectral density (PSD), we used the nonparametric Welch’s method (Welch 1967). Firstly, the method divides the time series into overlapping segments, applies a smooth time weighting to each segment and computes the discrete Fourier transform (DFT). Finally, all DFTs are averaged to obtain the PSD estimate. The Hanning smooth weighting function and an overlapping percentage of 50% are widely used to improve the performance of the power spectral estimation (Carter 1987). The MSC analysis was performed using Matlab®. In this study, a 300-sample Hanning window with 50% overlap was used. Thus, every record was divided at least into 38 segments, which ensured that each MSC estimate was asymptotically unbiased (Carter 1987). 512-points DFTs were used to estimate PSDs and cross-PSDs.
3.2. Cross approximate entropy (cross-ApEn)
Cross approximate entropy (cross-ApEn) is a two parameter family of statistics introduced as a measure of asynchrony between two paired time series (Pincus 2000). It was proposed as a method to compare correlated sequences, suggesting its application to physiological signals like HR and respiratory rate (Pincus and Singer 1996). Cross-ApEn is generally applied to compare sequences from two distinct yet intertwined variables. It allows the assessment of system
Table 1. Demographic and clinical characteristics of the patient groups. Data are presented as mean ± SD or n (%). OSA Positive: patients with obstructive sleep apnea; OSA Negative: patients without obstructive sleep apnea; BMI: body mass index; AHI: apnea-hypopnea index.
All Subjects OSA Positive OSA Negative Subjects (n) 187 111 (59.4%) 76 (40.6%) Age (years) 58.0 ± 12.8 58.3 ± 12.9 57.6 ± 12.9 Males (%) 147 (78.6%) 94 (84.7%) 53 (69.7%) BMI (kg/m2) 29.5 ± 5.5 30.5 ± 4.9 28.4 ± 6.0 Time recorded (h) 8.2 ± 0.6 8.2 ± 0.8 8.2 ± 0.3 AHI (n/h) 40.1 ± 19.6 2.0 ± 2.4

Nonlinear measure of synchrony from pulse oximetry in sleep apnoea
evolution characteristics such as feedback and control, avoiding the requirement to model the underlying system (Pincus 2000). Cross-ApEn evaluates secondary as well as dominant patterns in data, quantifying changes in underlying episodic behaviour that do not reflect in peak occurrences and amplitudes (Veldhuis et al 2001). For two paired time series u(i) and v(i), cross-ApEn measures, within tolerance r, the (conditional) regularity or frequency of v-patterns similar to a given u-pattern of window length m. Greater asynchrony indicates fewer instances of (sub)pattern matches, quantified by larger cross-ApEn values (Pincus 2000).
Formally, given two equally sampled sequences of length N, u = [u(1), u(2), …, u(N)] and v = [v(1), v(2), …, v(N)], cross-ApEn could be computed as follows (Pincus 2000):
1. Form the vector sequences x(i) = [u(i), u(i+1), …, u(i+m-1)] and y(j) = [v(j), v(j+1), …, v(j+m-1)]. These vectors represent m consecutive u and v values, respectively, commencing with the ith point.
2. Define the distance between x(i) and y(j), d[x(i), y(j)], as the maximum absolute difference in their respective scalar components:
[ ] |)1()1(|max)(),(,...,2,1
−+−−+==
kjvkiujyixdmk
. (3)
3. For each x(i), count the number of j (j = 1…N-m+1) so that d[x(i),y(j)] ≤ r, denoted as )(rN m
i . Then, for i=1…N-m+1, set
)1/()()u )(( +−= mNrNvrCm
i
m
i. (4)
The )(rC mi values measure within a tolerance r the regularity, or frequency, of v
patterns similar to a given u pattern of window length m.
4. Compute the natural logarithm of each )(rC mi , and average it over i,
∑+−
=+−=
1
1
))((ln1
1))((
mN
i
mi
m uvrCmN
uvrφ . (5)
5. Cross-ApEn is defined by:
))(())(())(,,(- 1 uvruvruvNrmApEnCross mm +−= φφ . (6)
Typically, cross-ApEn is applied to normalized {u*(i), v*(i)} time series, where u*(i) = [u(i)−mean(u)]/SD(u) and v*(i) = [v(i)−mean(v)]/SD(v).
Two important issues must be taken into account when computing cross-ApEn (Richman
and Moorman 2000): 1. Cross-ApEn(m,r,N)(v||u) will not always be defined, because ))(( uvrC
mi
in equation
(4) will be equal to 0 in the absence of similar patterns between u and v. To solve this, we used two correction strategies (Richman and Moorman 2000): bias 0 and bias
max. Both strategies assign non zero values to ))(( uvrCmi and ))((1
uvrCmi
+ in the
absence of matches. The bias 0 correction sets the bias towards zero by setting:
1)()( 1==
+rCrC
mi
mi if originally 0)()( 1 == +
rCrCmi
mi
,
11 )()( −+ −= mNrCmi if originally 0)( ≠rC
mi and 0)(1 =+
rCmi .
(7)
The bias max correction sets the bias towards the highest observable value of cross-ApEn by setting:

D Álvarez et al
1)( =rCmi if originally 0)( =rCm
i ,
11 )1()( −+ +−= mNrCmi if originally 0)(1 =+
rCmi .
(8)
In this research, both correction strategies were implemented, and their influence in the diagnostic ability of cross-ApEn were studied.
2. There is a direction dependence. Because of the logarithm in equation (5), ))(( uvrmφ
will not generally be equal to ))(( vurmφ . Thus, cross-ApEn(v||u) and its direction
conjugate cross-ApEn(u||v) are different in most cases. In the present study, both cross-ApEn(v||u) and cross-ApEn(u||v) were estimated, and the influence of the direction dependence in the diagnostic accuracy of cross-ApEn was tested.
In this study, we divided SaO2 and HR signals in 200-sample epochs before cross-ApEn
was applied. This methodology is intended to reduce the computational time of cross-ApEn when applied to long-term signals, due to the multiple comparisons. Cross-ApEn data were subsequently averaged over the whole number of segments to obtain a single value per subject. The segment length (200 samples = 16.6 min) was also fixed taking into account the apnoea period (between 25 s and 2 min) (Álvarez et al 2006, del Campo et al 2006, Zamarrón et al 2006, Hornero et al 2007, Álvarez et al 2007), to include various apnoeic events in every epoch. The run length input parameter m was fixed to the widely established values m = 1 and 2 (Pincus 2000, 2001), whereas the tolerance window r varied from 0.1 to 1.0 in steps of 0.1, in order to assess the consistency of the method (Richman and Moorman 2000). 3.3. Statistical analysis
The linear relation between each measure and the AHI from PSG was studied by means of Pearson correlation. Student’s t-test was applied to verify if there were significant differences between the OSA Positive and the OSA Negative group. p-values < 0.01 were considered significant. A receiver operating characteristic (ROC) analysis was performed to assess the diagnostic ability of each method. The following statistics were derived from the ROC analysis: sensitivity (percentage of OSA Positive subjects correctly diagnosed), specificity (percentage of OSA Negative patients correctly diagnosed) and accuracy (proportion of total subjects under study rightly classified). To ensure statistical validity of results, a 10-fold cross-validation approach was applied. The population under study was divided into 10 subsets, so the ROC analysis was applied in 10 iterations. At each iteration, 9 subsets were used to compute an optimum threshold, which was applied to the remaining group to compute ROC derived parameters. A different subset was left out at each iteration. Finally, sensitivity, specificity and accuracy were averaged over the 10 iterations. The optimum decision threshold in the cross-validation procedure is selected looking for a compromise between sensitivity and specificity. This value is graphically determined from the ROC curve as the closest point to the left top corner (100% sensitivity and 100% specificity). 4. Results
4.1. MSC analysis
Figure 1 displays the averaged MSC curves for both the OSA Positive and the OSA Negative groups. The lower and upper limits of the apnoea interest frequency range (0.014−0.033 Hz) are represented by the dashed vertical lines. We fixed these limits within the frequency range (0.008−0.04 Hz), determined by the maximum (2 min) and the minimum (25 s) apnoea cycle length (Zamarrón et al 2003, 2005). The curve corresponding to the OSA Positive group (solid line) is above that corresponding to the OSA Negative group (dotted line). This is especially

Nonlinear measure of synchrony from pulse oximetry in sleep apnoea
Figure 1. Average MSC curves for the OSA Positive and the OSA Negative groups. Vertical dashed lines represent the lower and upper limits of the apnea interest region (0.014−0.033 Hz).
evident within the apnoea interest region, where a peak in the OSA Positive MSC curve is shown around 0.021 Hz.
The following spectral features were derived from the MSC curves for each patient (Zamarrón et al 2003, 2005): total area enclosed below the MSC curve (ATOT), area enclosed below the MSC curve in the apnoea interest region (AREG), the ratio of the area in the apnoea interest region to the total area enclosed below the MSC curve (AREG/ATOT) and the maximum of the MSC function within the apnoea interest region (MREG). Table 2 summarises the results from the MSC analysis for the groups under study. All the spectral features values were larger in the OSA Positive group than in the OSA Negative, suggesting higher coherence between oximetric recordings from OSA patients. Significant differences between both groups (p-value << 0.01) were obtained with all spectral features.
Table 3 shows the statistics from the 10-fold cross-validation analysis. We can see that all spectral features provide small sensitivity values, between 65% and 70%, whereas the specificity values range from 76.8% to 90.9%. The best results are obtained with AREG, which provides 69.2% sensitivity, 90.9% specificity and 78.1% accuracy. 4.2. Cross-ApEn analysis
The usefulness of cross-ApEn in OSA diagnosis was assessed. Different combinations of the input parameters m and r were used, as well as the correction strategies bias 0 and bias max, and the two possible directions (SaO2||HR) and (HR||SaO2). Firstly, results were different for both directions of the method. No statistical differences were found between the groups under study when computing cross-ApEn(HR||SaO2), whereas significant differences where found with (SaO2||HR). This fits well with the nature of oximetry signals. SaO2 are more regular than HR in both OSA Positive and OSA Negative subjects. The number of SaO2 patterns similar to a fixed HR pattern when computing ))(( 2 HRSaOrC m
i will be greater than the number of similar
patterns when comparing a HR record to a fixed SaO2 pattern. Hence, cross-ApEn will be statistically better estimated in the first case (Pincus and Goldberger 1994), increasing the
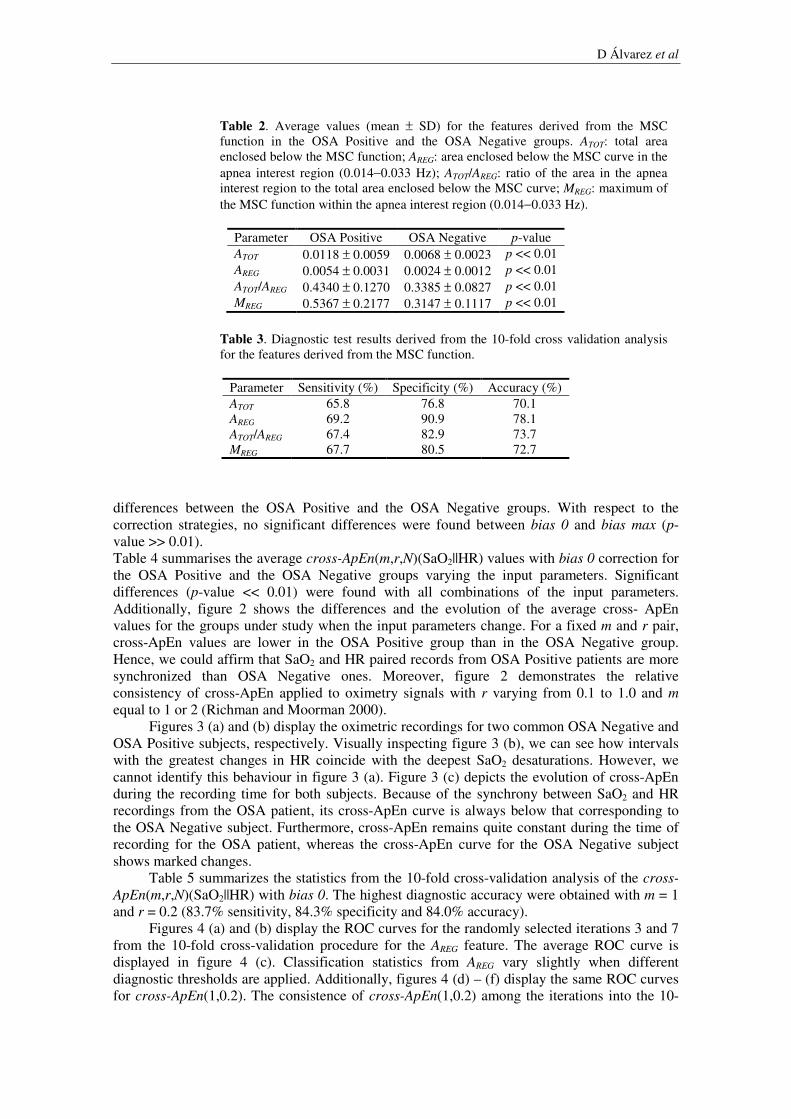
D Álvarez et al
Table 2. Average values (mean ± SD) for the features derived from the MSC function in the OSA Positive and the OSA Negative groups. ATOT: total area enclosed below the MSC function; AREG: area enclosed below the MSC curve in the apnea interest region (0.014−0.033 Hz); ATOT/AREG: ratio of the area in the apnea interest region to the total area enclosed below the MSC curve; MREG: maximum of the MSC function within the apnea interest region (0.014−0.033 Hz).
Parameter OSA Positive OSA Negative p-value ATOT 0.0118 ± 0.0059 0.0068 ± 0.0023 p << 0.01 AREG 0.0054 ± 0.0031 0.0024 ± 0.0012 p << 0.01 ATOT/AREG 0.4340 ± 0.1270 0.3385 ± 0.0827 p << 0.01 MREG 0.5367 ± 0.2177 0.3147 ± 0.1117 p << 0.01
Table 3. Diagnostic test results derived from the 10-fold cross validation analysis for the features derived from the MSC function.
Parameter Sensitivity (%) Specificity (%) Accuracy (%) ATOT 65.8 76.8 70.1 AREG 69.2 90.9 78.1 ATOT/AREG 67.4 82.9 73.7 MREG 67.7 80.5 72.7
differences between the OSA Positive and the OSA Negative groups. With respect to the correction strategies, no significant differences were found between bias 0 and bias max (p-value >> 0.01). Table 4 summarises the average cross-ApEn(m,r,N)(SaO2||HR) values with bias 0 correction for the OSA Positive and the OSA Negative groups varying the input parameters. Significant differences (p-value << 0.01) were found with all combinations of the input parameters. Additionally, figure 2 shows the differences and the evolution of the average cross- ApEn values for the groups under study when the input parameters change. For a fixed m and r pair, cross-ApEn values are lower in the OSA Positive group than in the OSA Negative group. Hence, we could affirm that SaO2 and HR paired records from OSA Positive patients are more synchronized than OSA Negative ones. Moreover, figure 2 demonstrates the relative consistency of cross-ApEn applied to oximetry signals with r varying from 0.1 to 1.0 and m equal to 1 or 2 (Richman and Moorman 2000).
Figures 3 (a) and (b) display the oximetric recordings for two common OSA Negative and OSA Positive subjects, respectively. Visually inspecting figure 3 (b), we can see how intervals with the greatest changes in HR coincide with the deepest SaO2 desaturations. However, we cannot identify this behaviour in figure 3 (a). Figure 3 (c) depicts the evolution of cross-ApEn during the recording time for both subjects. Because of the synchrony between SaO2 and HR recordings from the OSA patient, its cross-ApEn curve is always below that corresponding to the OSA Negative subject. Furthermore, cross-ApEn remains quite constant during the time of recording for the OSA patient, whereas the cross-ApEn curve for the OSA Negative subject shows marked changes.
Table 5 summarizes the statistics from the 10-fold cross-validation analysis of the cross-
ApEn(m,r,N)(SaO2||HR) with bias 0. The highest diagnostic accuracy were obtained with m = 1 and r = 0.2 (83.7% sensitivity, 84.3% specificity and 84.0% accuracy).
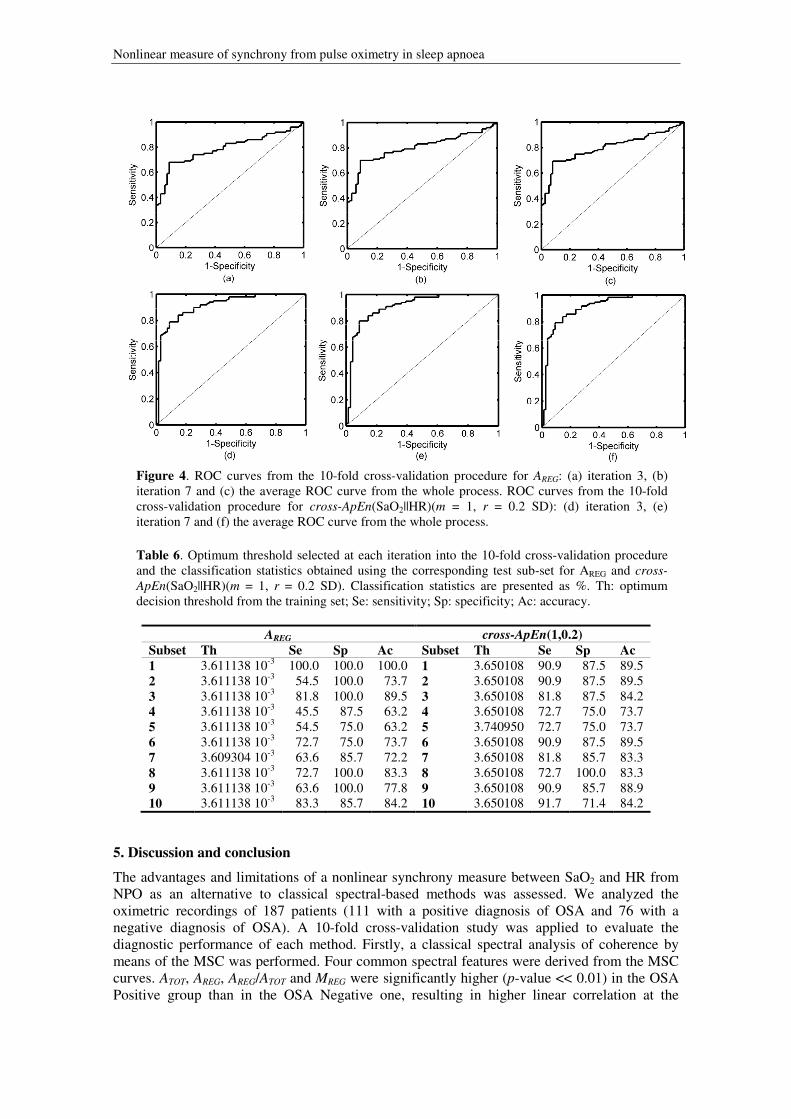
Figures 4 (a) and (b) display the ROC curves for the randomly selected iterations 3 and 7 from the 10-fold cross-validation procedure for the AREG feature. The average ROC curve is displayed in figure 4 (c). Classification statistics from AREG vary slightly when different diagnostic thresholds are applied. Additionally, figures 4 (d) – (f) display the same ROC curves for cross-ApEn(1,0.2). The consistence of cross-ApEn(1,0.2) among the iterations into the 10-

Nonlinear measure of synchrony from pulse oximetry in sleep apnoea
Table 4. Average cross-ApEn values (mean ± SD) in the OSA Positive and the OSA Negative groups. m: cross-ApEn window length; r: cross-ApEn tolerance.
m r OSA Positive OSA Negative p-value
m = 1
0.1 3.69 ± 0.79 4.73 ± 0.41 p << 0.01 0.2 2.83 ± 0.72 4.15 ± 0.59 p << 0.01 0.3 2.20 ± 0.62 3.51 ± 0.70 p << 0.01 0.4 1.70 ± 0.50 2.88 ± 0.73 p << 0.01 0.5 1.34 ± 0.39 2.35 ± 0.71 p << 0.01 0.6 1.07 ± 0.29 1.87 ± 0.63 p << 0.01 0.7 0.87 ± 0.21 1.46 ± 0.54 p << 0.01 0.8 0.71 ± 0.16 1.13 ± 0.42 p << 0.01 0.9 0.59 ± 0.12 0.86 ± 0.33 p << 0.01 1.0 0.50 ± 0.09 0.68 ± 0.24 p << 0.01
m = 2
0.1 4.17 ± 0.65 4.96 ± 0.31 p << 0.01 0.2 2.98 ± 0.91 4.48 ± 0.59 p << 0.01 0.3 2.28 ± 0.81 3.88 ± 0.75 p << 0.01 0.4 1.79 ± 0.63 3.25 ± 0.82 p << 0.01 0.5 1.43 ± 0.48 2.70 ± 0.83 p << 0.01 0.6 1.15 ± 0.35 2.16 ± 0.75 p << 0.01 0.7 0.94 ± 0.26 1.70 ± 0.65 p << 0.01 0.8 0.78 ± 0.19 1.33 ± 0.52 p << 0.01 0.9 0.65 ± 0.14 1.01 ± 0.40 p << 0.01 1.0 0.55 ± 0.10 0.79 ± 0.30 p << 0.01
Figure 2. Mean cross-ApEn(SaO2||HR) for both the OSA Positive and OSA Negative groups varying cross-ApEn input parameters.
fold cross-validation procedure could be seen. Furthermore, the AROC for cross-ApEn(1,0.2) in figure 4 (f) is significantly higher than the AROC for the AREG feature in the figure 4 (c). The optimum threshold selected at each iteration and the classification statistics obtained using the corresponding test sub-set for AREG and cross-ApEn(1, 0.2) are shown in table 6.
Finally, table 7 shows the statistics from the Pearson correlation test between the AHI derived from PSG and the measures involved in the study. Additionally, correlation between spectral and nonlinear features is included. High correlation coefficients were obtained between

D Álvarez et al
Figure 3. SaO2 and HR records from NPO for a common (a) OSA Negative subject and (b) OSA Positive patient. (c) Evolution of the cross-ApEn(SaO2||HR) for both the common OSA Negative and OSA Positive subjects with the recording time. Table 5. Diagnostic test results derived from cross-validation for the cross-ApEn analysis. m: cross-ApEn window length; r: cross-ApEn tolerance.
m r Sensitivity (%) Specificity (%) Accuracy (%)
m = 1
0.1 81.9 84.3 82.9 0.2 83.7 84.3 84.0 0.3 81.0 78.9 80.2 0.4 82.8 76.6 80.2 0.5 81.9 76.6 79.7 0.6 83.7 75.4 80.3 0.7 82.0 75.2 79.2 0.8 80.2 76.6 78.6 0.9 77.4 66.1 72.7 1.0 76.7 64.8 71.6
m = 2
0.1 81.9 79.1 80.8 0.2 81.0 83.0 81.8 0.3 83.7 80.4 82.3 0.4 81.9 81.6 81.8 0.5 81.9 76.6 79.7 0.6 84.6 75.4 80.8 0.7 78.3 75.2 77.0 0.8 80.2 76.6 78.6 0.9 78.3 67.3 73.8 1.0 77.5 64.8 72.2
spectral features from MSC, whereas lower correlation was observed between these indexes and cross-ApEn. AREG and cross-ApEn(1,0.2) were significantly correlated with AHI (p-value << 0.01), with Pearson correlation coefficients ρ = 0.67 and ρ = −0.68, respectively. This suggests that, as OSA severity increases, both correlation and synchrony between oximetric recordings increases: coherence increases and cross-ApEn decreases.
Nonlinear measure of synchrony from pulse oximetry in sleep apnoea
Figure 4. ROC curves from the 10-fold cross-validation procedure for AREG: (a) iteration 3, (b) iteration 7 and (c) the average ROC curve from the whole process. ROC curves from the 10-fold cross-validation procedure for cross-ApEn(SaO2||HR)(m = 1, r = 0.2 SD): (d) iteration 3, (e) iteration 7 and (f) the average ROC curve from the whole process.
Table 6. Optimum threshold selected at each iteration into the 10-fold cross-validation procedure and the classification statistics obtained using the corresponding test sub-set for AREG and cross-
ApEn(SaO2||HR)(m = 1, r = 0.2 SD). Classification statistics are presented as %. Th: optimum decision threshold from the training set; Se: sensitivity; Sp: specificity; Ac: accuracy.
AREG cross-ApEn(1,0.2) Subset Th Se Sp Ac Subset Th Se Sp Ac 1 3.611138 10-3 100.0 100.0 100.0 1 3.650108 90.9 87.5 89.5 2 3.611138 10-3 54.5 100.0 73.7 2 3.650108 90.9 87.5 89.5 3 3.611138 10-3 81.8 100.0 89.5 3 3.650108 81.8 87.5 84.2 4 3.611138 10-3 45.5 87.5 63.2 4 3.650108 72.7 75.0 73.7 5 3.611138 10-3 54.5 75.0 63.2 5 3.740950 72.7 75.0 73.7 6 3.611138 10-3 72.7 75.0 73.7 6 3.650108 90.9 87.5 89.5 7 3.609304 10-3 63.6 85.7 72.2 7 3.650108 81.8 85.7 83.3 8 3.611138 10-3 72.7 100.0 83.3 8 3.650108 72.7 100.0 83.3 9 3.611138 10-3 63.6 100.0 77.8 9 3.650108 90.9 85.7 88.9 10 3.611138 10-3 83.3 85.7 84.2 10 3.650108 91.7 71.4 84.2
5. Discussion and conclusion
The advantages and limitations of a nonlinear synchrony measure between SaO2 and HR from NPO as an alternative to classical spectral-based methods was assessed. We analyzed the oximetric recordings of 187 patients (111 with a positive diagnosis of OSA and 76 with a negative diagnosis of OSA). A 10-fold cross-validation study was applied to evaluate the diagnostic performance of each method. Firstly, a classical spectral analysis of coherence by means of the MSC was performed. Four common spectral features were derived from the MSC curves. ATOT, AREG, AREG/ATOT and MREG were significantly higher (p-value << 0.01) in the OSA Positive group than in the OSA Negative one, resulting in higher linear correlation at the

D Álvarez et al
Table 7. Pearson correlation coefficients between AHI and spectral and nonlinear features derived from NPO. ρ: Pearson correlation coefficient; ATOT: total area enclosed below the MSC function; AREG: area enclosed below the MSC curve in the apnea interest region (0.014−0.033 Hz); ATOT/AREG: ratio of the area in the apnea interest region to the total area enclosed below the MSC curve; MREG: maximum of the MSC function within the apnea interest region (0.014−0.033 Hz).; cross-ApEn(1,0.2): cross approximate entropy with input parameters m = 1 and r = 0.2.
ρ AHI cross-ApEn (1,0.2) ATOT AREG AREG/ATOT MREG
AHI 1 -0.68 0.61 0.67 0.49 0.64 cross-ApEn (1,0.2) -0.68 1 -0.60 -0.62 -0.42 -0.62 ATOT 0.61 -0.60 1 0.92 0.46 0.84 AREG 0.67 -0.62 0.92 1 0.73 0.92 AREG/ATOT 0.49 -0.42 0.46 0.73 1 0.76 MREG 0.64 -0.62 0.84 0.92 0.76 1
frequency components in the apnoea interest band. The relationship between these oximetric recordings was subsequently investigated applying a nonlinear measure of synchrony: the cross-ApEn. We developed an exhaustive study of the method varying the input parameters m and r, showing the relative consistence of cross-ApEn when applied to oximetry signals. For a fixed m and r pair, the OSA Positive group had an average cross-ApEn significantly lower than the OSA Negative group (p-value << 0.01), which corresponds to a higher degree of synchrony between SaO2 and HR. Results from the nonlinear analysis of oximetry signals by means of cross-ApEn agree with classical frequency analysis. We showed that the recurrent apnoea events typical of OSA cause coordinated fluctuations in SaO2 and HR signals, leading to high ATOT, AREG, AREG/ATOT and MREG values and, similarly, to low cross-ApEn values. Additionally, we found that the diagnostic accuracy obtained with cross-ApEn significantly improved that obtained with spectral features derived from the MSC curve. Classical coherence analysis provided low sensitivities and moderate to high specificities: AREG reached the best results, with 69.2% sensitivity, 90.9% specificity and 78.1% accuracy. On the other hand, moderate to high sensitivities and specificities were obtained with cross-ApEn, leading to accuracies greater than 80% in ten combinations of the input parameters: cross-ApEn(1,0.2) reached the best results, with 83.7% sensitivity, 84.3% specificity and 84.0% accuracy. The mechanisms controlling the interrelation between the respiratory and the cardiovascular systems are not completely described applying the spectral methods commonly used. Our results suggest that the relationship between changes in SaO2 and HR from NPO due to apnoea events is better characterized by nonlinear analysis.
To our knowledge, this is the first study assessing the synchrony between SaO2 and HR signals from NPO by means of cross-ApEn. Furthermore, this is the first study that assesses the diagnostic ability of MSC and cross-ApEn analyses of oximetric recordings to detect OSA. Although previous studies had evaluated the relationship between SaO2 and HR, our research extends these analyses providing new measures of synchrony between both signals and quantitative results of their diagnostic ability in OSA screening. An increase in the spectral frequency components of HR from Holter ECG was linked to synchronised episodes of hypoxemia in the study by Shiomi et al (1996). In (Keyl et al 1997), frequency analysis was applied to nocturnal Holter ECG epochs during episodes of periodic and normal breathing determined by oximetry. The authors suggest that spectral analysis of HR provides an accurate methodology to detect episodes of sleep-related breathing disorders. In the study by Noda et al (1998), 24-h simultaneously recorded SaO2 and Holter ECG signals were used to search for daytime sleep consequences in patients with OSA. However, all these studies did not analyze SaO2 and HR signals jointly and no results about its diagnostic ability in OSA screening were provided. In (Zamarrón et al 2003), independent frequency analyses of SaO2 and HR from nocturnal oximetry were developed to screen for OSA syndrome. Different spectral features

Nonlinear measure of synchrony from pulse oximetry in sleep apnoea
were derived from the periodograms. The researchers showed that taking the periodograms together improved the results provided by the independent spectral analysis of SaO2 or HR. This study reached high diagnostic accuracies by visual inspection but no automated assessment was made. Furthermore, none of the spectral features was derived from the joint analysis of the oximetric recordings. In a latter study by Zamarrón et al (2005), a simultaneous analysis of SaO2 and HR from NPO was developed by means of the coherence function. Three different patterns were identified: positive, negative and undetermined. Both positive and negative patterns were mainly associated to OSA Positive patients, while a significant number of subjects had an undetermined pattern. No features were derived from the coherence function and no results about the ability of coherence to help in OSA diagnosis were provided.
We should take into account some limitations of our study. The sample size could be larger and OSA Positive patients were predominantly studied. Further work is required to apply our methodology to a new and larger data set with a wide spectrum of sleep-related breathing disorders, as well as to study groups of especial interest, such as patients with lung or cardiovascular diseases and young snorers. Our research is aimed at discriminating OSA Positive patients from OSA Negative subjects. However, it would be interesting to study additional groups, like a control population consisting of healthy subjects. This would increase our knowledge of the methods involved in our study (MSC and cross-ApEn) and would also confirm the consistency of both methods. An additional drawback could be linked to our methodology and it should be mentioned. Our study is based solely on oximetry data: SaO2 and HR were simultaneously recorded with a single oximeter, eliminating the need for additional equipment. This a priori advantage could introduce a correlation between both signals. Although our results agree with previous studies assessing the relation between oximetric recordings and HR from Holter ECG, further analyses are necessary to test our methodology. Moreover, the sampling frequency used in this study (0.2 Hz) is lower than that used by current oximeters (1 Hz). The study by Wiltshire et al (2001) showed that low sampling rates provide SaO2 recordings with a low number of artefacts. However, low sampling frequencies potentially reduce the sensitivity and increase the specificity of a diagnostic test (Flemons et al 2003). An additional limitation should be taken into account, related to the lack of repeated sleep studies in successive nights. Night-to-night variability of AHI from conventional PSG is widely known (Dean et al 1992, Chediak et al 1996, Carlile and Carlile 2008). However, a recent study emphasize that the high cost and complexity of PSG limits its repeatability (Levendowski et al 2009). This study also suggests that sleep studies at home by means of portable equipment would be less variable. Thus, our methodology, based on portable NPO and automated nonlinear analysis, could benefit from this issue. However, repeated sleep studies (both in PSG and NPO) among two consecutive nights would be necessary to validate the performance of our methodology. Finally, an additional issue regarding the continuous positive airway pressure (CPAP) therapy should be taken into account. Our study is aimed at developing a screening tool for OSA syndrome, in order to discriminate OSA Positive patients, who will benefit from respiratory therapies like continuous positive airway pressure (CPAP). CPAP is currently the most widely used treatment for severe OSA (Lindberg et al 2006, Marshall et al 2006). Nevertheless, whether CPAP reduces sleepiness in subjects with mild to moderate OSA syndrome (AHI between 5 and 30 e/h) is not proven (Marshall et al 2006, Gay et al 2006). Thus, further work is needed to assess the accuracy of our methodology for screening those patients who will benefit from CPAP.
In summary, the results reported in this study suggest that nonlinear analysis of joint SaO2 and HR from NPO could provide additional and useful information to help in sleep apnoea detection. Our results agree with previous studies that assessed the relationship between desaturations and changes in HR due to periodic hypoxia (Shiomi et al 1996, Keyl et al 1997, Noda et al 1998, Zamarrón et al. 2003, 2005). We found that the recurrence of apnoea events in patients with OSA syndrome determined an important increase in the synchrony between SaO2 and HR, which leads to a significant decrease of cross-ApEn. Additionally, our results suggest that nonlinear analysis by means of cross-ApEn could be better suited to help in OSA diagnosis

D Álvarez et al
than classical frequency analysis. However, we need to carry out this methodology with larger populations to verify prospectively whether cross-ApEn may be an easy tool to use in OSA diagnosis on an ambulatory basis. Acknowledgements
This work has been partially supported by Ministerio de Ciencia e Innovación and FEDER grant TEC 2008–02241, the grant project from Consejería de Sanidad de la Junta de Castilla y León SAN/673/VA03/08 and Sociedad Castellano – Leonesa y Cántabra de Patología Respiratoria (SOCALPAR). References Álvarez D, Hornero R, García M, del Campo F and Zamarrón C 2007 Improving diagnostic ability of
blood oxygen saturation from overnight pulse oximetry in obstructive sleep apnea detection by means of central tendency measure Artif. Intell. Med. 41 13–24
Álvarez A, Hornero R, Abásolo D, del Campo F and Zamarrón C 2006 Nonlinear characteristics of blood oxygen saturation from nocturnal oximetry for obstructive sleep apnoea detection Physiol. Meas.
27 399−412 Aguirre L A, Barros V C and Souza A V P 1999 Nonlinear multivariable modeling and analysis of sleep
apnea time series Comput. Biol. Med. 29 207−28 Carlile J and Carlile N 2008 repeat study of 149 patients suspected of having sleep apnea but with an
AHI<5 Sleep 31 A153
Carter G C 1987 Coherence and time delay estimation Proceedings of the IEEE 75 236−55 Chediak AD, Acevedo-Crespo JC, Seiden DJ, Kim HH and Kiel MH 1996 Nightly variability in the
indices of sleep-disordered breathing in men being evaluated for impotence with consecutive night polysomnograms Sleep 19 589–92
Coetzee F M and Elghazzawi Z 2000 Noise-Resistant Pulse Oximetry Using a Synthetic Reference Signal, IEEE Trans. Biomed. Eng. 47 1018–26
Dean RJ and Chaudhary BA 1992 Negative polysomnogram in patients with obstructive sleep apnea syndrome Chest 101 105–8
Del Campo F, Hornero R, Zamarrón C, Abásolo D and Álvarez D 2006 Oxygen saturation regularity analysis in the diagnosis of obstructive sleep apnea Artif. Intell. Med. 37 111−8
Findley L J, Farkas G A and Rochester D F 1985 Changes in heart rate during breathing interrupted by recurrent apneas in humans J. Appl. Physiol. 59 536–42
Flemons WW, Littner MR, Rowley JA, Gay P, Anderson WM, Hudgel DW, McEvoy RD and Loube DI 2003 Home diagnosis of sleep apnea: A systematic review of the literature Chest 124 1543–79
Gay P, Weaver T, Loube D and Iber C 2006 Evaluation of positive airway pressure treatment for sleep related breathing disorders in adults Sleep 29 381–401
Guilleminault C, Van Den Hoed J and Mitler M M 1978 Clinical overview of the sleep apnea syndromes.
In sleep Apnea syndromes (ed Gilleminault C and Dement WC) (New York, Alan R. Liss) Granelli A W, Wennergren M, Sandberg K, Mellander M, Bejlum C, Inganäs L, Eriksson M, Segerdahl
N, Ågren A, Ekman-Joelsson B M, Sunnegårdh J, Verdicchio M and Östman-Smith I 2008 Impact of pulse oximetry screening on the detection of duct dependent congenital heart disease: a Swedish prospective screening study in 39.821 newborns BMJ 337 a3037
Hampson M H and Mallen E A H 2006 Coherence function analysis of the high-order aberrations of the human eye Opt. Lett. 31 184−6
Hornero R, Álvarez D, Abásolo D, del Campo F and Zamarrón C 2007 Utility of approximate entropy from overnight pulse oximetry data in the diagnosis of the obstructive sleep apnea syndrome IEEE
Trans. Biomed. Eng. 54 107−13 Iyriboz Y, Powers S, Morrow J, Ayers D and Landry G 1991 Accuracy of pulse oximeters in estimating
heart rate at rest and during exercise Br. J. Sp. Med. 25 162–4 Keyl C, Lemberger P, Pfeifer M, Hochmuth K and Gesiler P 1997 Heart rate variability in patients with
daytime sleepiness suspected of having sleep apnea syndrome: a receiver-operating characteristics analysis Clin. Sci. 92 335−43
Kirby R R, Taylor R W and J M Civetta 1997 Handbook of Critical Care (2nd Ed.) (Philadelphia, USA Lippincott-Raven)

Nonlinear measure of synchrony from pulse oximetry in sleep apnoea
Krahn A D, Yee R, Erickson M K, Markowitz T, Gula L J, Klein G J, Skanes A C, George C F P and Ferguson K A 2006 Physiologic Pacing in Patients With Obstructive Sleep Apnea J. Am. Coll.
Cardiol. 47 379–83 Levendowski D, Steward D, Woodson BT, Olmstead R, Popovic D and Westbrook P 2009 The impact of
obstructive sleep apnea variability measured in-lab versus in-home on sample size calculations International Archives of Medicine 2 1–8
Lévy P, Pépin JL, Deschaux-Blanc C, Paramelle B and Brambilla C 1996 Accuracy of oximetry for detection of respiratory disturbances in sleep apnea syndrome Chest 109 395−9
Lindberg E, Berne C, Elmasry A, Hedner J and Janson C 2006 CPAP treatment of a population-based sample – What are the benefits and the treatment compliance? Sleep Medicine 7 553–60
Liu P Y, Pincus S M, Keenan D M, Roelfsema F and Veldhuis J D 2005 Analysis of bidirectional pattern synchrony of concentration-secretion pairs: implementation in the human testicular and adrenal axes Am. J. Physiol. Regul. Integr. Comp. Physiol. 288 R440−6
Magalang UJ, Dmochowski J, Veeramachaneni S, Draw A, Mador MJ, El-Solh A and Grant BJB 2003 Prediction of the apnea-hypopnea index from overnight pulse oximetry Chest 124 1694−1701
Marshall NS, Barnes M, Travier N, Campbell AJ, Pierce RJ, McEvoy RD, Neill AM and Gander PH 2006 Continuous positive airway pressure reduces daytime sleepiness in mild to moderate sleep apnoea: a meta-analysis Thorax 61 430–4
Netzer N, Eliasson A H, Netzer C and Kristo D A 2001 Overnight Pulse Oximetry for Sleep-Disordered Breathing in Adults Chest 120 625−33
Noda A, Ito R, Okada T, Yasuma F, Nakashima N and Yokota M 1998 Twenty four ambulatory oxygen desaturation and electrocardiographic recording in obstructive sleep apnea syndrome Clin. Cardiol. 21 506−10
Penzel T, McNames J, de Chazal P, Raymond B, Murray A and Moody G 2002 Systematic comparison of different algorithms for apnoea detection based on electrocardiogram recordings Med. Biol. Eng.
Comput. 40 402−407 Peppard P E, Young T, Palta M and Skatrud J 2000 Prospective study of the association between sleep-
disordered breathing and hypertension N. Engl. J. Med. 342 1378–84 Pincus S M and Goldberger A L 1994 Physiological time-series analysis: what does regularity quantify?
Am. J. Physiol. 266 H1643−56 Pincus S M and Singer B H 1996 Randomness and degrees of irregularity Proc. Natl. Acad. Sci. USA. 93
2083−8 Pincus S M 2000 Irregularity and asynchrony in biologic network signals Methods Enzymol. 321 149−82 Pincus S M 2001 Assessing serial irregularity and its implications for health Ann. N. Y. Acad. Sci. 954
245−67 Rechtschaffen A and Kales A 1968 A Manual of Standardized Terminology, Techniques and Scoring
System for Sleep Stages of Human Subjects (US Government Printing Office, Washington DC: Public Health Service)
Richman J S and Moorman J R 2000 Physiological time series analysis using approximate entropy and sample entropy Am. J. Physiol. Heart Circ. Physiol. 278 H2039−49
Sériès F and Marc I 1999 Nasal pressure recording in the diagnosis of sleep apnoea hypopnea syndrome Thorax 54 506–10
Shiomi T, Guilleminault C, Sasanabe R, Hirota I, Maekawa M and kobayashi T 1996 Augmented very low frequency component of the heart rate variability during obstructive sleep apnea Sleep 19 370–7
Stam C J and van Dijk B W 2002 Synchronization likelihood: an unbiased measure of generalized synchronization in multivariate data sets Physica D 163 236−51
Veldhuis J D, Pincus S M, García-Rudaz M C, Ropelato M G, Escobar M E and Barontini M 2001 Disruption of the joint synchrony of luteinizing hormone, testosterone, and androstenedione secretion in adolescents with polycystic ovarian syndrome J. Clin. Endocrinol. Metab. 86 72−9
Warley AR, Mitchell JH and Stradling JR 1987 Evaluation of the Ohmeda 3700 pulse oximeter Thorax 42 892–6
Welch P D 1967 The use fast Fourier transform of the estimation of power spectra: a method based on time averaging over short, modified periodograms 1967 IEEE Transactions on Audio and
Electroacoustics AU-15 70−3 Whitelaw W A, Brant R F and Flemons W W 2005 Clinical usefulness of home oximetry compared with
polysomnography for assessment of sleep apnea, Am. J. Respir. Crit. Care Med. 171 188−93

D Álvarez et al
Wiltshire N, Kendrick A and Catterall J 2001 Home oximetry studies for diagnosis of sleep apnea/hypopnea syndrome: limitation of memory storage capabilities. Chest 120 384−9
Young T, Peppard P E and Gottlieb D J 2002 Epidemiology of Obstructive Sleep Apnea, Am. J. Resp.
Crit. Care 165 1217−39 Zamarrón C, Gude F, Barcala J, Rodríguez J R and Romero P V 2003 Utility of Oxygen Saturation and
Heart Rate Spectral Analysis Obtained From Pulse Oximetric Recordings in the Diagnosis of Sleep Apnea Syndrome Chest 123 1567−76
Zamarrón C, Pichel F and Romero P V 2005 Coherence between oxygen saturation and heart rate obtained from pulse oximetric recordings in obstructive sleep apnoea Physiol. Meas. 26 799–810
Zamarrón C, Hornero R, del Campo F, D Abásolo and Álvarez D 2006 Heart rate regularity analysis obtained from pulse oximetric recordings in the diagnosis of obstructive sleep apnea Sleep Breath. 10 83−9