Nonlinear Dynamics and Covered Interest Rate Parity Dynamics and Covered Interest Rate Parity Nathan...
47
Nonlinear Dynamics and Covered Interest Rate Parity Nathan S. Balke and Mark E. Wohar January 1997 Research Department Working Paper 97-01 Federal Reserve Bank of Dallas This publication was digitized and made available by the Federal Reserve Bank of Dallas' Historical Library ([email protected])
Transcript of Nonlinear Dynamics and Covered Interest Rate Parity Dynamics and Covered Interest Rate Parity Nathan...

Nonlinear Dynamics and CoveredInterest Rate Parity
Nathan S. Balke
and
Mark E. Wohar
January 1997
Research Department
Working Paper
97-01
Federal Reserve Bank of Dallas
This publication was digitized and made available by the Federal Reserve Bank of Dallas' Historical Library ([email protected])

Nonlinear Dynamics and Covered Interest Rate Parity
Nathan S. Balke'
and
Mark E. Wohar"
January 1997
, Department ()f Economics, Southern Methodist University, Dallas, TX 75275 (214-768-2693)and Research Department, Federal Reserve Bank of Dallas (214-922-5186): E-mail:[email protected]
" Distinguished Lucas Professor, Department of Economics, University of Nebraska at Omaha,CBA-512K, Omaha, NE 68182 (402-554-3712). E-mail: [email protected]
The authors would like to thank Jeanette Diamond, Michael O'Hara, Baldev Raj, twoanonymous referees, and participants at the Midwest Econometric Meetings for helpfulsuggestions on an earlier draft. The views expressed herein are solely those of the authors andshould not be construed to be those of the Federal Reserve Bank of Dallas or the FederalReserve System.

Abstract
This paper examines the dynamics of deviations from covered interest parity using daily dataon the UK/US spot, forward exchange rates and interest rates over the period January 1974 toSeptember 1993. Like other studies we fmd a substantial number of instances during the samplein which the covered interest parity condition exceeds the transactions cost band, implyingarbitrage profit opportunities. While most of these implied profit opportunities are relativelysmall, there is also evidence of some very large deviations from covered interest parity in thesample. In order to examine the persistence of these deviations, we estimated a thresholdautoregressive/threshold ARCH model in which the dynamic behavior of deviations fromcovered interest parity differs outside the transactions cost band than inside them. We find thatwhile the impulse response functions when inside the transactions cost band are nearlysymmetric, those for the outside the bands are asymmetric--suggesting less persistence outsideof the transactions cost band than inside the band.
1
1. Introduction
The theory of covered interest parity (CIP) links money market interest rates to spot and
forward exchange rates. Models of foreign exchange rate behavior often assume that CIP holds
as a valid approximation. It is thus, not surprising that a fair amount of research has been
devoted to the empirical validation of this condition.' Practitioners are interested in CIP
because this condition may be used to simplify hedging practices for financial decisions.
Furthermore, significant violations of CIP can generate arbitrage opportunities for international
market participants, resulting in profits. There are a number of important empirical questions
that one must consider when examining CIP. The first deals with observed deviations from CIP.
A number of studies have identified significant deviations of forward rates from their covered
interest parity (see e.g. Frenkel and Levich, 1975, 1977, 1981; Otani and Tiwar~ 1981; Bahmani
Oskooee and Das, 1985; Sharpe, 1985; Overturf, 1986; Clinton, 1988; Fletcher and Taylor, 1994;
Abeysekera and Turtle, 1995).'
Previous research has attempted to rationalize these deviations from CIP in terms of
optimizing behavior. Such an approach views deviations from CIP as a response to real world
frictions, including transactions costs, [Frenkel and Levich (1975, 1977, 1981)], capital market
imperfections such as capital controls and/or political risk (Prachowny, 1970; Frenkel, 1973;
Dooley and Isard, 1980; Otani and Tiwari, 1981; and Blenman 1991), imperfect substitutability,
political risk (Aliber, 1973), as well as differential tax treatment, inelastic demand and supply
schedules, and other risk premia influences. Such market frictions result in 'neutral bands'
around the theoretical parity condition within which profitable arbitrage activities are not
possible.
A second issue related to the magnitude of deviations from CIP is the speed with which
short-run deviations from CIP are eliminated and convergence to equilibrium is achieved. Most

2
studies that examine the empirical validity of CIP deal mainly with the size of raw deviations
relative to estimates of transactions costs (referred to as profitable trading opportunities) and
pay less attention to the speed with which these profitable trading opportunities are eliminated.
However, using informal analysis Clinton (1988) concluded that, at least for the Euromarket,
profitable trading opportunities are small and transitory. This result has been corroborated by
the work Atkins (1991, 1993). Atkins employed cointegration methodology and reported results
which suggest that deviations from CIP in the Euromarket are in general eliminated within two
days, with this time decreasing as one moves from the 1970s through the 1980s.'
In this paper, we examine the dynamics of deviations from CIP for the UK using daily
data over the period January 1974 to September 1993. First, similar to other studies we
calculate the percentage of observations found to lie within the transactions costs bands (i.e. the
so called 'neutral zone') as well as the percentage above and below these bands. To avoid
indirect measures of transactions costs, our empirical investigation uses direct measures
embedded in the bid-ask spread.' We find numerous observations in which the covered interest
parity condition exceeds the transaction costs bands. In addition, we examine the persistence
of these deviations over time.
The presence of transaction costs bands suggests that deviations from CIP should exhibit
some nonlinear dynamics. One would expect that the persistence of deviations from CIP should
be substantially lower outside the transactions cost bands than inside them as agents act to
exploit the implied profit opportunities. Thus, the presence of transactions costs implies that
deviations from covered interest parity might be modeled as a threshold autoregression (TAR)
in which the dynamic behavior of deviations from CIP changed if they exceed the transactions
cost bands.' In addition, to capture the variable volatility and the "fat-tailed" nature of
deviations from CIP, we allowed for threshold-ARCH (TARCH) effects in which the conditional
3
variance of deviations from CIP can change over time and across thresholds. Using this
threshold autorgression/threshold ARCH (TAR/TARCH) framework, we examine the
difference in the dynamics of deviations from CIP that occur within the transactions costs bands
versus the dynamics of those which occur outside the neutral zone by employing nonlinear
impulse response analysis. By calculating impulse response functions conditional on whether
one starts inside or outside the transactions cost band, we can compare the persistence of
deviations from CIP that imply exploitable profit opportunities with those in which no profit
opportunities exist.
The outline of the paper is as follows. Section 2 presents a brief review of the literature
concerning covered interest parity and transactions costs. Section 3 presents the theoretical
underpinnings of the literature on covered interest parity including a discussion of the role of
transactions costs in the context of covered interest parity. Section 4 describes the data used.
Section 5 presents an empirical examination of deviations from CIP and compares findings with
previous work in this area. Section 6 describes the threshold autoregression/threshold ARCH
model employed to capture! these dynamics. Section 7 examines dynamics through the use of
impulse response functions. Section 8 presents a summary and conclusion.
2. Brief Literature Review
A large portion of the empirical literature on deviations from covered interest parity has
focused on the size of transactions costs. In two important papers Frenkel and Levich (1975,
1977), define a neutral zone as the area which surrounds the CIP condition above and below,
within which observed deviations from CIP can occur without yielding any profit after netting
out transactions costs. They estimate these transactions costs·in the market for foreign
exchange by using data on triangular arbitrage and conclude that CIP holds net of transactions

4
costs. They also fmd evidence of a regular flow of profit opportunities in which the return
exceeds transactions costs. However, the later work of Deardorff (1979), Callier (1981), and
Bahmani-Oskooee and Das (1985) argued that the size of the transactions costs were in reality
much smaller than those reported by Frenkel and Levich.
Much of the ClP literature debates the magnitude of the neutral zone in the presence of
transaction costs, liquidity risk, political risk, and other market frictions which would cause
violations of ClP. Clinton (1988), for example, demonstrated that the neglect of the swap
market resulted in a serious overstatement of transactions costs and its introduction made the
neutral zone even narrower than those found by Deardorff, Callier, and Bahmani-Oskooee and
Das. Using daily observations over the period November 1985 to May 1986, in which careful
attention was given to accurate timing,' Clinton (1988) found that in the Euromarket,
transactions costs should not give rise to deviations from ClP in excess of .06 percent between
well traded currencies.7 Although Clinton found that net deviations (i.e. net of transactions
costs) from CIP were transitory and small enough to support the assumption of CIP, he also
found that raw deviations often occurred outside transactions costs bands, and thus there were
times in which profit opportunities were available.
More recently, Fletcher and Taylor (1994, 1996) examine whether CIP holds in markets
for long-term assets.' They examine covered arbitrage boundary conditions in the Eurobond and
foreign bond markets in the 5-, 7-, and 10 year maturities for five currency pairs. The empirical
evidence which they present suggest that deviations from CIP (in excess of transactions costs)
do exist. They find that these disequilibrium states can have long memories (that dissipate over
time) which lead to a window of profitable trading opportunities. They also fmd that in every
long-term market there is a set of outliers that substantially violate theClP condition. Most
recently, Abeysekera and Turtle (1995), using the Johansen VAR/error-eorrection methodology

5
and employed weekly data over the period 1984-1991, for Canada, Germany, Japan, and the
UK, find substantial deviations from CIP over this period.
Abeysekera and Turtle (1995; p. 433) may have anticipated our current research when
they made the following points.
"Without data on the level of market imperfections such as transaction costs or bid-ask
spreads, we cannot comment on the presence of arbitrage opportunities." ".. .future
research should attempt to incorporate bid-ask spreads and transaction costs directly into
the analysis."
In the next section, we present the theoretical foundations of the literature on CIP along with
a discussion of transactions costs in the context of CIP.
3. The Covered Interest Rate Parity Condition
A. CIF without Transactions Costs
In markets where arbitrage is active and unfettered, the net return offered by a financial
instrument denominated in foreign currency should be approximately equal to the net return
offered by a similar financial instrument denominated in domestic currency. This is the basis
of the CIP condition. The concept of interest parity recognizes that portfolio investors at any
time t have the choice of holding assets denominated in the domestic currency (say dollars)
offering the rate of interest is between time t and t+ 1 or assets denominated in foreign currency
offering a rate of interest i" Thus, an investor beginning with one unit of domestic currency
needs to compare the option of accumulating 1+ i$ units with the option of converting (at the
spot exchange rate) into 8 units of foreign currency, and investing in foreign assets to
accumulate 8(1 +i,) units of foreign currency at time t+ 1, and then reconverting back into
domestic currency. If domestic and foreign assets differ only in their currency denomination,
6
and if investors have the opportunity to cover against exchange rate uncertainty by arranging
at time t to reconvert from foreign to domestic currency one period later at the forward
exchange rate F (units of foreign currency per units of domestic currency), then market
equilibrium requires the CIP condition holds.
Without transactions costs, the no arbitrage condition of covered interest parity implies
that
FS
= (1)
where F is the T-period forward exchange rate (foreign currency per domestic currency--in this
case the US dollar), S is the spot exchange rate (foreign currency per US dollar), i, is the
interest rate on foreign assets, i. is the interest rate on dollar denominated (domestic) assets,
and T is the time to maturity of the assets" The left-hand-side of equation (1) is the forward
exchange premium (FP) (or discount) and the right-hand-side of equation (1) is the nominal
interest rate differential (ID).
B. Lender and Owner Arbitrage and Transaction Costs Bands
With transaction costs, the covered interest parity condition implied by no arbitrage given
by equation (1) is replaced by a pair of conditions. Consider the case of no "lender" arbitrage.
Lender arbitrage is the case in which a trader can make riskless profits by borrowing one
currency and then lending the other. For no lender arbitrage, the speculator does not take a
position. One simply borrows, say $, and lends, say pounds, to make a riskless profit. In this
case the investor puts up no capital of his own. The absence of "lender" arbitrage for borrowing
dollars and lending the foreign currency implies the following condition
7
(2)
where SA is the asked spot rate (foreign currency per dollar) and P" is the bid forward rate
(foreign currency per dollar), iA, is the asked interest rate on dollar deposits and i", is the bid
interest rate on foreign deposits. A similar condition holds for no lender arbitrage for
borrowing the foreign currency and lending dollars and is given by
(3)
Combining these conditions and rearranging implies
Some additional algebra yields
(4)
The middle term of (4) is the covered interest parity condition based on the geometric mid-
point, or average, of the bid/ask prices while the outer terms are essentially the geometric

8
average of the bid/ask spreads and their reciprocals. If equation (2) is violated, then it is
profitable to borrow domestic currency (dollars) and lend foreign currency (pounds). If
equation (3) is violated, then it is profitable to borrow foreign currency (pounds) and lend
domestic currency (dollars). We can relate this to equation (4). If the right hand side of
equation (4) is violated (i.e. one is above the upper bounds) this implies the violation of
equation (3). Hence, if elP (evaluated at geometric average of bid-ask spread) is greater than
the upper bound then, this is equivalent to saying that it pays (there are arbitrage opportunities)
to borrow pounds and lend dollars at the existing bid-ask spreads. Similarly, if the left hand side
of (4) is violated (i.e. below the lower bounds) this implies a violation of equation (2) and it will
pay to borrow dollars and lend pounds at the existing bid-ask spread.
Taking logarithm of equation (4), yields
(5)
where
The term cip is approximately the percentage deviation from the covered interest parity
relationship evaluated at the geometric average of the bid and asked prices. The transaction

9
cost bands are given by 8' and 8U• Note that for lender arbitrage deviations from covered
interest parity fluctuate in a region symmetric around zero. This region is determined solely
on the basis of the ratio of bid and asked prices or the transactions costs.
We can also derive a similar condition for no "owner" arbitrage. Owner arbitrage is the
case where a trader initially has a cash position in one currency and can invest in assets
denominated in that currency or of another currency. Unlike lender arbitrage, owner arbitrage
requires traders to put up their own capital. In this case where the investor has a cash position
in $, the question is whether one should keep the $ or sell $ and purchase foreign currency.
The absence of "owner" arbitrage implies the following conditions:
and
After some algebraic manipulation these conditions imply:
a~ ,: cip ,: If. (6)
where
I+fa" = au - T log(--..1)
0 .B1+l
f
1+iA
~ = a' + T log(--$)..B
1+1$
The transaction band is smaller for owner than for lender arbitrage since there is one less
10
transaction that needs to take place--no borrowing has to be undertaken as the investor already
has one of the assets. Note also that for owner arbitrage, cip is not necessarily bounded by a
symmetric band; the band is only symmetric if the bid/ask ratio for the interest rates are the
same.
4. Description of Data
Daily data on bid and ask prices for spot and forward exchange rates for the British
pound are obtained from Data Resources Incorporated (DR!) for the period January 1974
September 1993. Currencies are expressed as foreign currency per U.S. dollar. The forward
rates are for a "one-month" term. Interest rates.are also obtained from DR! and are I-month
Eurorates quoted on an annual basis. All data prior to October 8, 1986 are 9 a.m. New York
open Quotes. Data after October 8, 1986 are London close (11 a.m. New York time)."
The decision to employ Euro-deposit rates was motivated by several considerations. First,
the use of Euro-deposit rates ensures that the underlying asset is comparable. Euro-deposits
denominated in different currencies are issued by banks that have similar default risk. This
means that term structures of different countries are comparable because they do not have to
be adjusted for differing default risk. In addition, Euro-deposit rates are not subject to capital
controls because they are offshore securities, and hence, rates in different countries do not have
to be adjusted for differing capital controls. Thus, eurocurrency deposits are comparable in
terms of credit risk, maturity, and issuer, but not in terms of currency denomination (see Levich
(1985». Furthermore, high quality data for domestic interest rates are not easily obtained for
all countries. In some countries, other than the U.S. and Canada, domestic Treasury bill rates
are not always market clearing, and hence will not reflect the true cost of credit, while Euro
deposit rates are market clearing. Treasury bill rates are not always market clearing because in

11
some countries there are either restrictions on the number of participants which can trade in
such markets or the government imposes limits on price fluctuations of such securities. That
these considerations are important is evidenced by the discussion of Marston (1993).
5. Empirical Analysis: Departures from Covered Interest Parity
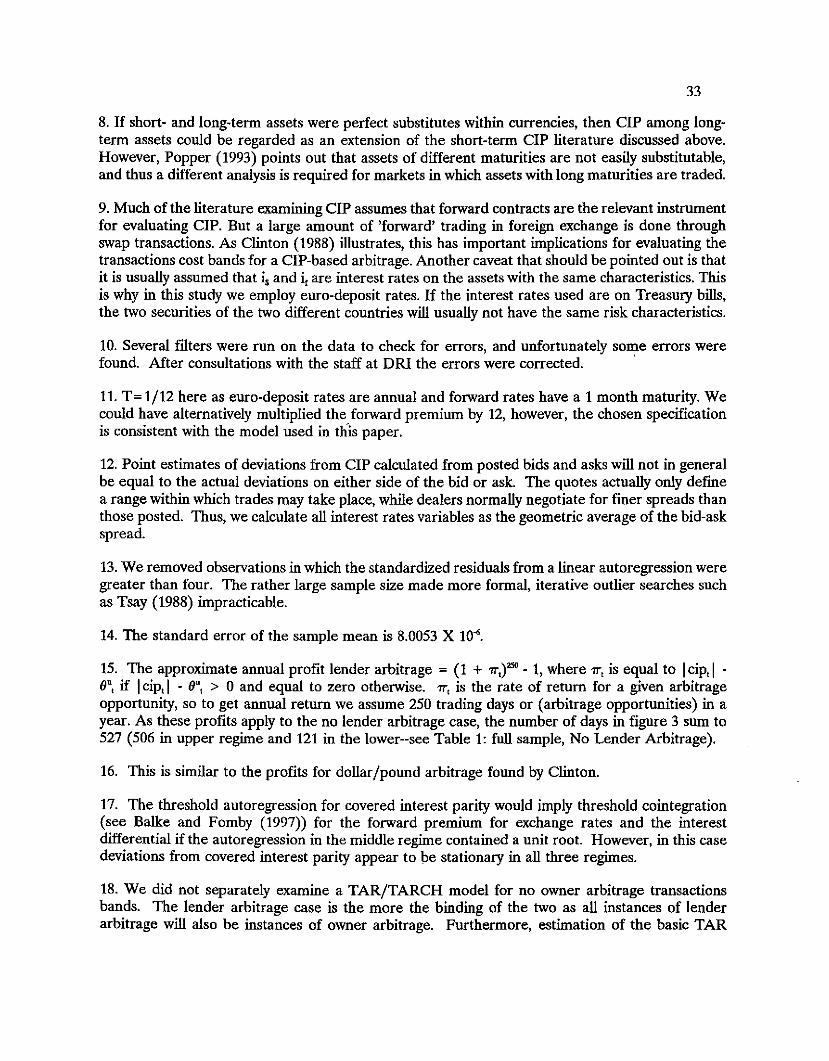
Figure 1 plots the logarithm of the forward premium evaluated at the geometric average
of bid and asked rates (log(FIS», the logarithm of the interest rate ratio evaluated at the
geometric average of bid and asked rates (T log[(1+ i,)/(1+is»)])," as well as deviations from
covered interest parity again evaluated at the geometric average of bid and asked prices (cip,).!2
From the figure it is clear that the deviations from covered interest parity (i.e. cip, not equal
to zero) relative to the fluctuations in forward premium and the ratio of interest rates are quite
small. It is also apparent that deviations from covered interest parity can be quite persistent.
While deviations from covered interest parity are stationary (the augmented Dickey-Fuller t-stat
is -5.61), there are substantial periods in which cip, is above or below zero.
Figure 2 plots deviations from covered interest parity as well as the transaction cost bands
implied by no lender arbitrage. From the figure, there appear to be violations of the covered
interest no arbitrage conditions as deviations from covered interest parity exceed the transaction
costs bands implied by no lender arbitrage. Table 1 presents the number of times that the no
arbitrage conditions are violated for the alternative transactions costs bands. From the diagram,
these violations appear to be clustered together suggesting some persistence to these violations
as well. Interestingly, while the transactions costs bands are not constant, they are, nonetheless,
relatively stable. The results for no owner arbitrage are similar except that the transactions
bands are slightly narrower and, hence, there are more violations of the no arbitrage conditions.
While only a small percentage of the observations fall outside the transactions cost bands,

12
there are a surprising number of violations given the findings of Taylor (1987) and (1989).
Taylor (1987) examined observations sampled 10 minutes apart during November 11, 12, and
13 of 1985 and failed to find a single violation of no arbitrage. This period is relatively stable
compared with other periods in our sample. Even for periods examined in his second study
(Taylor (1989», which overlap those in this study, the CIP condition was relatively stable.
Clinton (1988), on the other hand, fmds similar percentages to those shown in Table 1 in a
sample taken over the period November 1985 to May 1986.
There is also evidence of some very large deviations from covered interest parity in the
sample. These coincide with several events such as the attack on the British pound and
subsequent withdrawal of the United Kingdom from the European Exchange Rate Mechanism
in September 1992. Many of these same observations also violate the no arbitrage conditions.
Nonetheless, even after the outliers are removed (see second column of Table 1) there are still
numerous violations of the no arbitrage conditions."
In Table 2, we present the mean, median and standard deviations of the gross deviation
from CIP and the transaction costs implied by no lender and no owner arbitrage. The mean
deviation is stlHistically different from zero", this indicates that despite the symmetric
transactions bands implied by no lender arbitrage some type ofwedge causes the CIP condition..;
for the US and UK to systematically deviate from zero in one direction. Nonetheless, the mean
deviation from CIP is dwarfed by its standard deviations, indicating that deviations are highly
variable. As a comparison, the average lender transactions cost (i.e. 6U) is 0.0008 or 0.08
percent. This figure is slightly higher than that of Clinton (0.06 percent) but smaller than that
of McCormick (0.09). The mean deviations from CIP is less than the mean of transactions costs
which suggest that one could not make profits on average by randomly engaging in CIP
arbitrage.
13
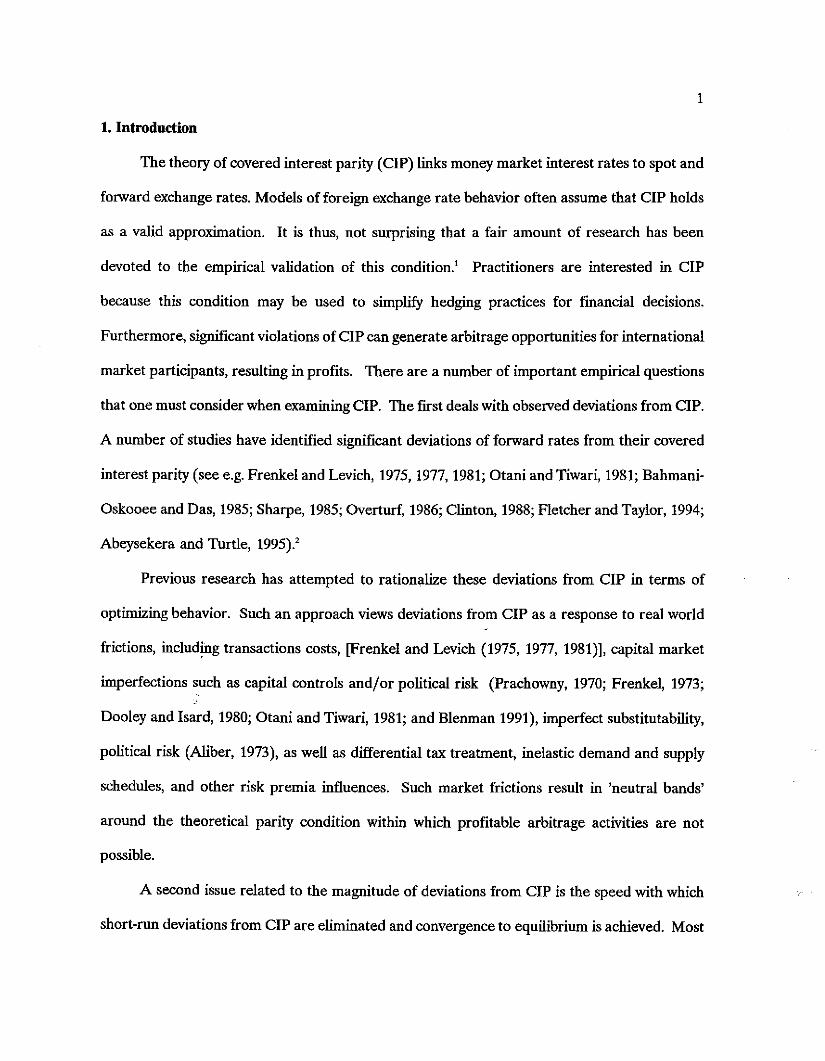
As suggested by the results in Table 1, there are a substantial number of instances during
the sample in which the covered interest parity condition exceeds the transaction costs band.
These instances imply arbitrage profit opportunities. To better understand the nature of these
opportunities, Figure 3 plots a histogram of the implied lender arbitrage profits over the sample.
For ease of interpretation we display these profits in terms of the approximate rate of return
over the course of a year if these opportunities were available for every trading day during that
period.1S From Figure 3, it is clear that most of the actual profit opportunities are relatively
small-less than four percent on an "annual" basis. There appear to have been some very rare
opportunities for extremely large profits over the course of the sample--on twelve occasions
arbitrage profits entailed "annual" returns over 100%! Nevertheless, because arbitrage profit
opportunities in general and large ones in particular are relatively rare, the scope to make large
systematic profits from engaging in covered interest parity arbitrage is limited. Looking at the
entire sample, including observations in which no profits were available, the average net profit
was .0056 percent. l• This translates into an "annualized" return of 1.4 percent--a fairly paltry
returns from engaging solely in dollarjpound covered interest arbitrage. The "annualized" rate
of return from owner arbitrage is a more (respectable) 2.3 percent (average net profit of .0091
percent per transaction), although as we suggested above, to engage in owner arbitrage,
arbitragers must put up their own capital.
Not only are profit opportunities from covered interest arbitrage relatively small, they are
typically of short duration. Table 2, Panel B presents the frequency of durations outside the
transactions cost band. An overwhelming majority of durations outside of the transactions cost
band are of one or two days. Nonetheless, there are several episodes in which the duration
outside the transactions band lasted five or more days. We conduct a more formal analysis of
the persistence of arbitrage opportunities in Section 7 below.
14
This discussion of profit opportunities is just meant to be suggestive rather than an exact
accounting. The sampling interval of one day may be too long and it may be that adjustment
actually takes place hourly. To the extent that this is a problem, the result would be a shorter
adjustment time, and thus, the findings of this paper may be viewed as upper bounds on
adjustment periods.
6. Empirical Analysis: Threshold Autoregressions for Covered Interest Parity
If the no arbitrage conditions strictly hold then deviations from covered interest parity
should be bounded by the transactions costs bands. Yet, as we saw above there appear to be
numerous and persistent deviations from CIP that exceed the transactions cost bands.
Nonetheless, even if deviations from CIP exceed the transactions bands, one might suspect that
deviations from CIP outside the transactions cost bands would be substantially less persistent
than those inside the transaction cost bands as market participants will eventually respond to
large and/or persistent arbitrage opportunities.
A relatively simple model that can capture the possible change in persistence as covered
interest parity condition moves outside the transactions cost band is a threshold autoregression.
Here the parameters of an autoregression for dp, change depending on whether dp,_! is above,
inside, or below the transactions cost bands. Specifically, let dp, be described by a threshold
autoregression (TAR):

15
J
cip, = [a: + E ajUcip,"] I(cip,_,>O~_,)
J-'J
+ [at + E atcip,"] I(O:_,,;;cip,_,,;;O~_)jot
J
+ [a,' + E a;'cip,) I(cip,_,<O:-,> + £,,-,
(8)
where 1(.) is an indicator function that is one if the condition holds and zero otherwise. OU,.! is
the upper bid/ask transaction band while 0',_, is the lower bid/ask transaction band.17 In our
empirical application, we take the thresholds to be the upper and lower transactions bands from
lender arbitrage (i.e. O',.! = _OU,_,)," While threshold autoregressions have been used in
economics before (see for example Terasvirta and Anderson (1992), Potter (1995), Balke and
Fomby (1997», one difference in the application here is that the thresholds (i.e_ the bid/ask
spread) are not constant over time as OU and 0' change as the bid/ask spreads change." The
other difference is that we can take the thresholds as known which greatly simplifies estimation
and inference.
In addition, as in many financial time series, the volatility of cip, appears to change over
time and that shocks to cip, appear to be characterized by a "fat-tailedu distribution (hence the
numerous outliers). As a result, we allow for the conditional distribution of E, to differ across
regimes and over time. In particular, E, = (h'.)'/'v, where h'. = E[e,' I0,.,] is the conditional
variance of E, given information at t-l (0,.,) and differs across regimes (i = u, m, or I indicates
whether the covered interest parity condition is above, inside, or below the transactions cost
band). The standardized shock v, is assumed to have a t-distribution with u' degrees of freedom
which may also differs across regimes.'" Here we specify the conditional variance by an ARCH
model of the form:
for i = u, m, or l. An examination of autocorrelation and partial autocorrelation functions of
K
h I = b I + Eb Ie'to kt-k'-1
the squared residuals from the basic TAR suggests an ARCH model of order K = 7.
16
(9)
Because we take the thresholds to be the bid/ask transactions cost band, the thresholds
are assumed to be known and, hence, need not be estimated. Therefore, we estimated the
above model given the actual bid/ask transactions cost bands. To test whether a threshold
autoregression is appropriate for covered interest parity, one simply tests if the autoregressions
are the same across regimes, i.e. if aU) = am; = al; for j = 0, ..., J. Similarly, we can test whether
the conditional distribution of e, is constant across regimes by testing bU. = bm• = bl", k = 1 to
K, and VU= vm= VI.
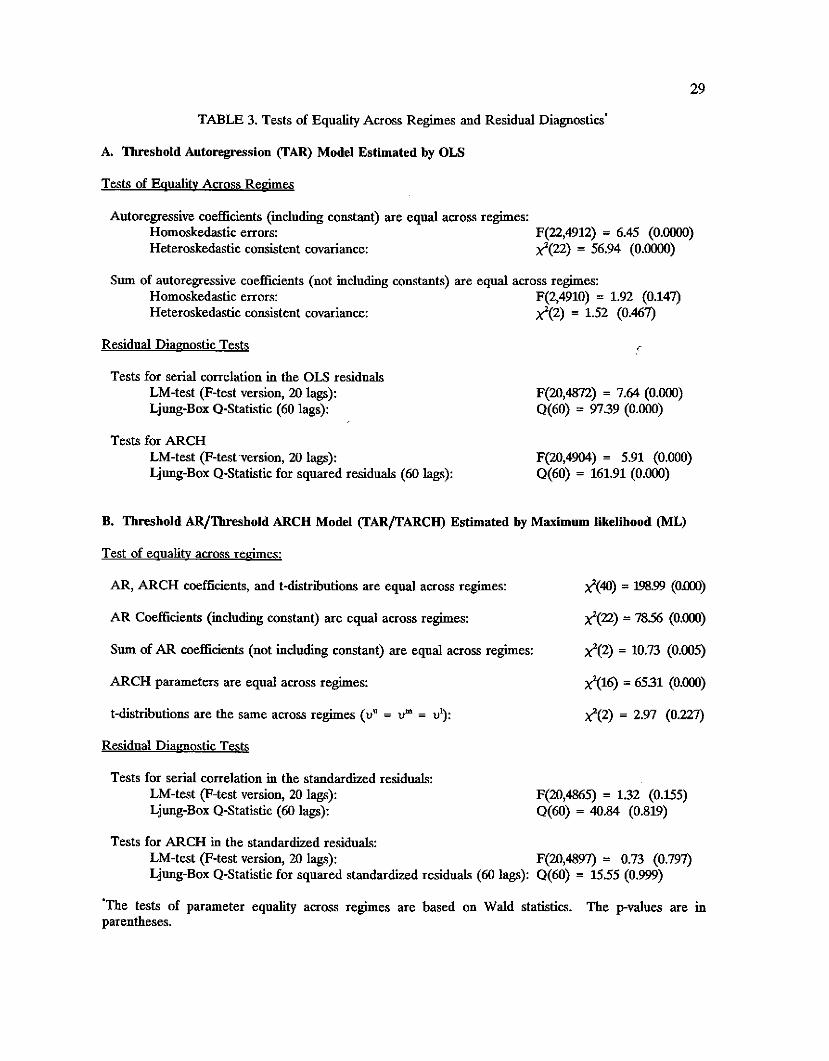
Table 3 presents tests of parameter equality across regimes.'! We present results for a
basic TAR estimated by OLS as well as for the threshold ARCH (TARCH) model which was
estimated by maximum likelihood. Clearly, for both the basic TAR and the TAR/TARCH
models we can reject the hypothesis that the parameters are constant across regimes." Both
the autoregressive and the ARCH parameters are statistically different across regimes; only the
parameters of the t-distribution are not significantly different across regimes. While there is
some latent residual correlation and ARCH effects in the residual from the basic TAR, the
standardized residuals from the TAR/TARCH model do not appear to be serially correlated
or contain additional ARCH effects."
In our discussion above, we conjectured that the persistence of deviations from covered
interest parity should be substantially less when outside the transactions band than inside the
bands as market participants begin to take advantage of arbitrage profits. Usually, a rough and
ready measure of persistence is the sum of the autoregressive coefficients; these indicate that
the regimes are not too different in this dimension. The sum of the AR coefficients in the

17
upper, middle and lower regimes for the basic TAR model are 0.75, 0.85, and 0.74 and are not
statistically different from one another. For the TAR/TARCH model, the sum of the AR
coefficients for the upper and lower regimes (0.78 and 0.87 respectively) are smaller than the
sum of AR coefficients in the middle regime (0.92), but only the upper regime is statistically
different. However, in nonlinear models such as the TAR/TARCH model above, analysis of
persistence is substantially more subtle than in a linear model. The interaction between the
autoregressive coefficients, the intercepts, the thresholds, and even the conditional variance can
all effect the persistence exhibited by the model. As a result, in the next section we turn to
nonlinear impulse response analysis in order to examine the persistence implied by the model
as a whole and by the individual regimes.
7. Understanding Dynamics: Impulse Response Analysis
To better understand the dynamics implied by the threshold model, we calculate impulse
. response functions for the covered interest parity condition. The nonlinear structure of the
model makes impulse response analysis substantially more complex than in the linear case."
The reason is th,at the moving average representation is not linear in the shocks.
The impulse response function (IRF) is the change in the forecasted value for cip'+K as
a result of knowing the value of an exogenous shock e" or
E[ciP"k IO""e,] - E[cip'+k10,.,],
where 0,-, is the information set at time t-1 and e, is a particular realization of the exogenous
shock. Unlike linear models, impulse response functions for the nonlinear model is, in general,
conditional on the entire past history of the variables and the size and direction of the shock.
Furthermore, because the moving average representation of ciP'+k for the threshold model is not
linear in the e,'s, one cannot calculate the conditional expectations, E[cip'+kIO,_"e,] and

18
E[ciPI.. ln._t], by projecting the model forwards and setting future shocks (e,+;) to zero as is the
case with a linear model.
In order to calculate the conditional expectations for the nonlinear model, we essentially
simulate the model. Because there is a single shock and that shock affects the one-step-ahead
forecast linearly, in the initial period change in conditional expectations is just the value of the
shock. In order to calculate the conditional expectations, E[cipI+kIDl-l,eJ and E[cipI+kIDI_J, in
each subsequent period, however, we must simulate two separate histories: one in which the
shock at time t is known and one in which the at time t is not known but determined randomly.
In each period we draw a standardized shock, vt+" using resampled standardized residuals
(standardized by the conditional variance). Note this shock is conditional on regime because
the distribution of actual standardized residuals may differ across regimes. Thus, when the
simulated value for cipI+i_' is above the transaction cost band, we draw a standardized residual
from observation in which the upper regime was entered. The innovation e,+i is calculated by
scaling up V'+i by the conditional standard deviation, hi+i' Again, h,+i depends on the simulated
values of cipt+H and e"+i." This simulation gives a hypothetical history for cipI+" i = 0 to k. We
repeat this simulation 200 times, keeping the values of D,., and e, the same for each simulation
but drawing different realizations of V'+i' We average the simulations to obtain estimates of the
conditional expectations, E[cip'+k IDl-l'e,] and E[cip<+k I11,.,].
As suggested above, the IRFs are a function of the value of the shock, e" and the initial
conditions, D,_,. To evaluate the sensitivity of the IRF to the size and direction of the shock,
we calculated IRFs for positive versus negative, and small versus large shocks. Here we
considered two alternative ways to of specifying "small" versus "large" shocks. First, to get a
clear sense of the difference in persistence across regimes, we conducted an experiment in which
the size of the shock was the same regardless of the current regime. To determine size of the

19
shock, we then took a small shock to be equal to the 84th percentile of the distribution of actual
nonstandardized residuals while a large shock was set to be the 97.7th percentile." Because in
reality the distribution of shocks differs across regimes, we considered a second way of
specifying the initial shock. In this case, e, = h.'/'v, where both h, and the distribution of v, are
conditional on regime. If, for example, cip,., > 8,." then a "small" v, shock was set to be the 84th
percentile of standardized residuals for observations in the upper regime while a large shock
was set the 97.7th percentile. Selecting v, shocks when in the other regimes was conducted in
a similar fashion. The end result is that in this case "small" and "large" e, shocks Jould differ
across regimes and over time.
We also calculated IRFs for two different types of initial conditions. For the first, we
determined the initial condition by randomly drawing an initial condition, unconditionally, from
the actual data. This was repeated 500 times and the resulting IRFs were averaged to yield an
IRF for cip" unconditional on 0,.,.26 Alternatively, we calculate impulse response functions
conditional on regime. For example, for the IRF in the middle regime we randomly selected
as initial conditions dates in which the cip, series was in the middle regime. Likewise for the
upper and lower regimes. Again, we repeated these experiments 500 times and took the
average to estimate the IRF conditional on regime." By comparing these conditional IRFs, we
can get an indication of how the dynamics (and persistence) differs across regimes.
Finally, one last complication presents itself. Because the transaction cost band is not
constant over time, we had to specify the behavior of the thresholds when calculating the
impulse response function. The actual transaction band at time t-l was taken as part of the
initial condition (0,.,). However, current and future values of the thresholds were required for
the simulations used to calculate E[cip'+kIO,."eJ and E[cip'+kIO,.,]. Again, we set values for the
thresholds in periods t to t+k equal to the actual transactions cost band in those periods.28

20
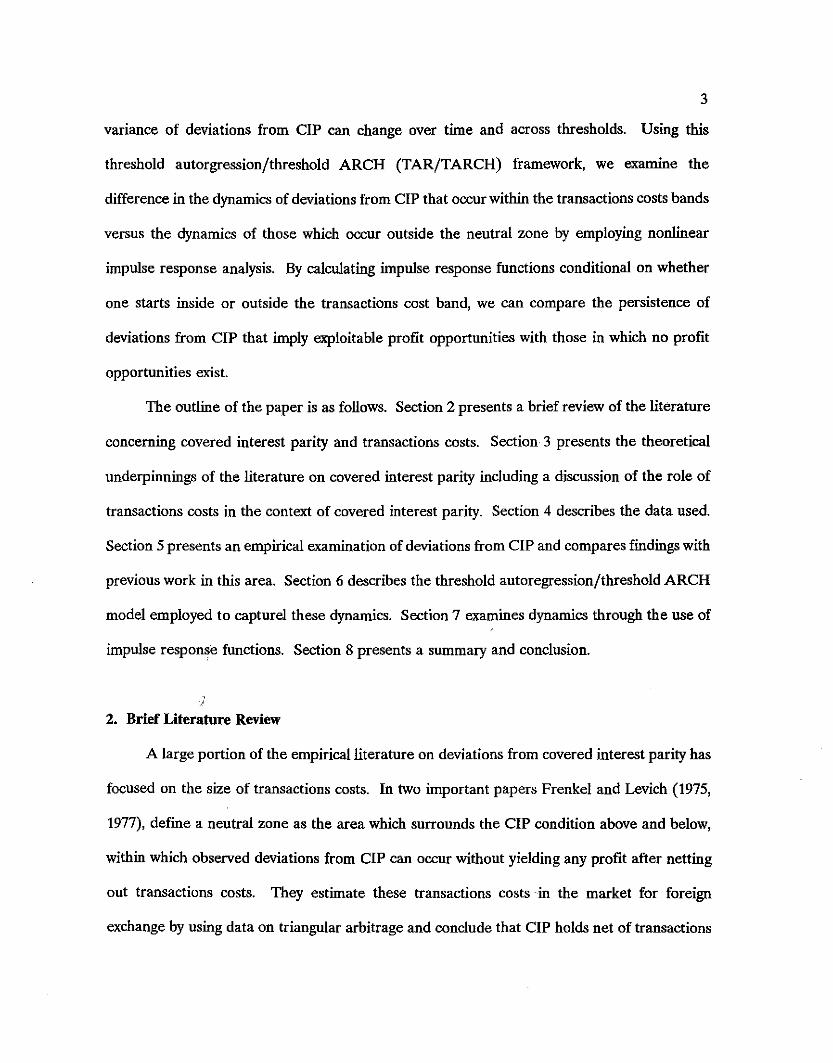
Figure 4 displays the IRF for the covered interest parity condition for the TAR/TARCH
model for the case where the initial shock is the same across regimes. Because episodes in
which the transactions band is exceeded are relatively rare, the average (or unconditional) IRF
and the IRF for the middle regime are nearly symmetric. However, the IRF for the upper and
lower regimes are asymmetric, particularly in the few of periods immediately following a "large"
shock. When CIP is initially in the upper regime, large positive shocks get dissipated faster than
large negative shocks. The opposite is the case in the lower regime. We argue then that shocks;:
in the outer regimes display less persistence than do shocks in the middle reiime. The
reasoning is as follows. Starting in the upper regime, a large positive shock is likely to cause
the CIP condition to remain outside the transactions cost bands in the initial period while a
negative shock is likely to push the CIP condition inside the transaction band. In the
subsequent period the different response to a positive and negative shock reflect primarily the
dynamic structure of the upper regime versus that of the middle regime. As a result, the
different response in the outer regimes to positive and negative shocks reflects different degrees
of persistence in the various regimes. The difference in persistence can also be seen by
comparing the middle and upper (lower) regime response to a "large" positive (negative) shock.
Again, positive (negative) shocks are dissipated faster in the upper (lower) regime than in the
middle regime.
Figure 5 displays IRFs for the case where the size of the initial shock is conditional on
current regime. Once more, the impulse response function for the lower regime is asymmetric--
suggesting less persistence outside of the transactions band than inside the band. On the other
hand, the asymmetry is not as apparent for the upper regime In addition, one can see that, on
average, "large" shocks in the outer and lower regimes are substantially larger than those in the
middle regime (nearly twice as large). Also, the fact that the distribution of shocks for the

21
middle and upper regimes has fatter tails than that of the lower regime (see also the estimated
values of t-distribution degrees of freedom, Il', in Table A2 of the Appendix) shows up in Figure
5. "Large" shocks for both the middle and upper regimes are nearly three times larger than the
"small" shocks for these regimes while for the lower regime this ratio is less than 2.5.
8. Summary and Conclusion
A large amount of research has been devoted to the empirical validation of the covered
interest parity (CIP). Most studies that examine the empirical validity of CIP deal mainly with
the size of raw deviations relative to estimates of transactions costs and pay less attention to the
speed with which these profitable trading opportunities are eliminated. This paper contributes
and extends the above research on CIP in a number of respects. We argue the presence of
transaction cost bands suggests that deviations from CIP should exhibit some nonlinear
dynamics. In particular, the persistence of deviations from CIP should be substantially lower
outside the transaction cost bands (where there are potential profit opportunities) than inside
them. Thus, we model deviations from covered interest parity as a threshold autoregression
with threshold ARCH effects (TAR/TARCH) in which the dynamics of deviations from CIP
within the transaction cost bands differ from the dynamics of those occur outside the
transactions cost band. Using nonlinear impulse response analysis, we compare the persistence
of deviations from CIP that imply exploitable profit opportunities with those in which no profit
opportunities exist.
Using daily data for the US and UK over the period January 1974 to September 1993,
we find numerous observations in which the covered interest parity condition exceeds the
transaction cost bands. Such findings call into question the practice of constructing forward
exchange rates using spot exchange rates and interest rate differentials, assuming CIP holds.'"

22
Nonetheless, because arbitrage profit opportunities in general, and large ones in particular, are
relatively rare, the scope to make large systematic profits from engaging in covered interest
parity is limited. Furthermore, using impulse response functions implied by the threshold
autoregressive/threshold ARCH model, we find that deviations from covered interest parity that
are outside the transaction cost bands are less persistent than those inside the bands. Thus, not
only are profit opportunities from covered interest arbitrage relatively small, they are typically
of short duration.

23
References
Abeysekera, Sarath P. and Harry J. Turtle, "Long-run Relations in Exchange Markets: A Testof Covered Interest Parity," Journal of Financial Research, 18, (Winter, 1995): 431-447.
Agmon, T. and S. Bronfeld "The International Mobility of Short-Term Arbitrage Capital,"Journal of Business. Finance. and Accounting. 2, (1975), 269-278
Aliber, R. Z., 'The Interest Rate Parity Theorem: A Reinterpretation," Journal of PoliticalEconomy. 81, (1973): 1451-1459.
Anderson, Heather M., "Transactions Costs and Nonlinear Adjustment Towards Equilibriumin the U.S. Treasury Bill Market," (1994) unpublished paper, University of Texas.
Atkins, Frank J., "Covered Interest Parity Between Canada and the United States: AnotherLook Using Modern Time Series Methods," Empirical Economics, 16, (1991): 325-334.
____-', "The Dynamics of Adjustment in Deviations from Covered Interest Parity in theEuromarket: Evidence From Matched Daily Data," Applied Financial Economics, 3,(1993): 183-187.
Bahmani-Oskooee, M. and S. P. Das, ''Transactions Costs and the Interest Parity Theorem,"Journal of Political Economy, 93, (August 1985): 793-799.
Balke, Nathan S. and Chili-Ping Chang, "Credit and Economic Activity: Shocks or PropagationMechanism?" (1995), unpublished paper, Southern Methodist University.
Balke, Nathan S. and Thomas B. Fomby, "Threshold Cointegration," (1997), forthcoming,International Economic Review.
Blenman, Uoyd, P., "A Model of Covered Interest Arbitrage Under Market Segmentation,"Journal of Money, Credit and Banking, 23, (November 1991): 706-717.
Callier, P., "One Way Arbitrage, Foreign Exchange and Securities Markets: A Note," Journalof Finance, 36, (December 1981): 1117-1186.
Clinton, K, ''Transactions Costs and Covered Interest Parity," Journal of Political Economy,96, (April, 1988): 358-370.
Deardorff, A.v., "One Way Arbitrage and its Implications for the Foreign Exchange Markets,"Journal of Political Economy, 87, (April 1979): 351-364.
Dooley, M.P. and P. Isard, "Capital Controls, Political Risk, and Deviations From Interest-RateParity," Journal of Political Economy, 88, (1980): 370-84.
Fletcher, Donna J. and Larry W. Taylor, "A Non-parametric Analysis of Covered Interest Parityin Long-Data Capital Markets," Journal of International Money and Finance, 13, (1994):459-475.
24
__-=-__""'Swap' Covered Interest Parity in Long-Date Capital Markets," The Review ofEconomics and Statistics, 78, (August 1996), 530-538.
Frenkel, J. A, "Elasticities and the Interest Parity Theorem," Journal of Political Economy, 81,(1973): 741-747.
Frenkel, Jacob A and Richard M. Levich, "Covered Interest Arbitrage: Unexploited Profits?"Journal of Political Economy, 83, (April 1975): 325-338.
__--=-_~'. "Transactions Costs and Interest Arbitrage: Tranquil versus Turbulent Periods,"Journal of Political Economy. 85, (December 1977): 1209-1226.
_____" "Covered Interest Arbitrage in the 1970s," Economic Letters, 8, (March 1981):267·274. .
Gallant, A. Ronald, Peter E. Rossi, George Tauchen, "Nonlinear Dynamic Structures,"Econometrica, 61, (July 1993): 8}1-908.
Hsieh, DA., "Tests of Rational Expectations and No Risk Premium in Forward ExchangeMarkets," Journal of International Economics, 17, (1984) 173-184.
Koop, G., M.H. Pesaran, S.M. Potter, "Impulse Response Analysis in Nonlinear MultivariateModels," Journal of Econometrics, 74, (1996): 119-148.
Levich, R M., "Empirical Studies of Exchange Rates: Price Behavior, Rate Determination, andMarket Efficiency," in Handbook of International Economics (Eds.) R. W. Jones and P.B.Kenen, Vol. 2, (Elsever Publishers B.V./North-Holland, Amsterdam, 1985): 1025·1035.
___~, "Is the Foreign Exchange Market Efficient?" Oxford Review of Economic Policy,5, (1989): 40-66.
Liu, P.e. and G.S. Maddala, "Rationality of Survey Data and Tests of Market Efficiency in theForeign Exchange Markets," Journal ofInternational Money and Finance, 11, (1992): 366381.
Maasoumi, Esfandiar, and John Pippenger, ''Transaction Costs and the Interest Rate Theorem:Comment," Journal of Political Economy. 97, (1989): 236-243.
MacDonald, R and M. P. Taylor, "International Parity Conditions," in AS. Courakis and M.P.Taylor (eds.), Private Behavior and Government Policy in Interdependent Economies,(1990): Oxford, Oxford University Press.
Marston, Re., "Interest Differentials Under Fixed and Flexible Exchange Rates: The Effectsof Capital Controls and Exchange Risk," in M.D. Bordo and B. Eichengreen (Eds.), ARetrospective on the Bretton Woods System: Lessons for International Monetary Reform(Chicago: Chicago University Press for NBER, 1993): pp. 515-46.
25
McCormick, Frank, "Covered Interest Arbitrage: Unexploited Profits? Comment," Journal ofPolitical Economy, 87, (April 1979): 411-422.
Officer, L.H., and T.D. Willett, ''The Covered Arbitrage Schedule: A Critical Survey of RecentDevelopments," Journal of Money, Credit and Banking. 2, (1970): 247-57.
Otani, I. and S. Tiwari, "Capital Controls and the Interest Parity Rate: The JapaneseExperience, 1978-81," IMF Staff Papers, 28, (December 1981): 793-815.
Overturf, S., "Interest Rate Expectations and Interest Parity," Journal of International Moneyand Finance, 5, (March 1986): 91-98.
Pippenger, J., "Interest Arbitrage Between Canada and the United States: A New Perspective,"Canadian Journal of Economics, 11, (1978): 183-93.
Poitras, Geoffrey, "Arbitrage Boundaries, Treasury Bills, and Covered Interest Parity," Journalof International Money and Finance, 7, (1988): 429-445. '
Popper, H., "Long-term Covered Interest Parity: Evidence From Currency Swaps," Journal ofInternational Money and Finance, 12, (August 1993): 439-448.
Potter, Simon M., "A Nonlinear Approach to US GNP," Journal of Applied Econometrics, 10,(1995): 109-125.
Prachowny, M. F., "A Note On Interest Parity and the Supply of Arbitrage Funds," Journal ofPolitical Economy, 78, (1970): 540-545.
Rhee, S. Ghon, and Rosita P. Chang, "Intra-Day Arbitrage Opportunities in Foreign Exchangeand Eurocurrency Markets," Journal of Finance, XLVII, (March 1992): 363-379.
Sharpe, I., "Interest Parity, Monetary Policy, and the Volatility ofAustralian Short-term InterestRates: 1978-82," Economic Record 61, (Dece!llber 1985): 436-444.
Taylor, Mark P., "Covered Interest Parity: A High-frequency, High-quality Data Study,"Economica, 54, (1987): 429-438.
__---;-:=:::-=~' "Covered Interest Arbitrage and Market Turbulence," Economic Journal, 99,(1989): 376-391.
Terasvirta, Timo, and Heather M. Anderson, "Characterizing nonlinearities in Business CyclesUsing Smooth Transition Autoregressive Models,," Journal of Applied Econometrics, 7(December, 1992): S119-S136.
Thornton, D., "Tests of Covered Interest Rate Parity," Federal Reserve Bank of St. LouisReview (July/Aug 1989): 55-66.
Tsay, Ruey S., "Outliers, Level Shifts, and Variance Changes in Time Series," Journal ofForecasting. 7, (1988): 1-20.
26
Wakeman, L., "The Portfolio Approach to Swaps Management," in c.R. Beidleman (ed.),Interest Rate Swaps, Homewood, Illinois, Dow Jones, Irwin, 1990.
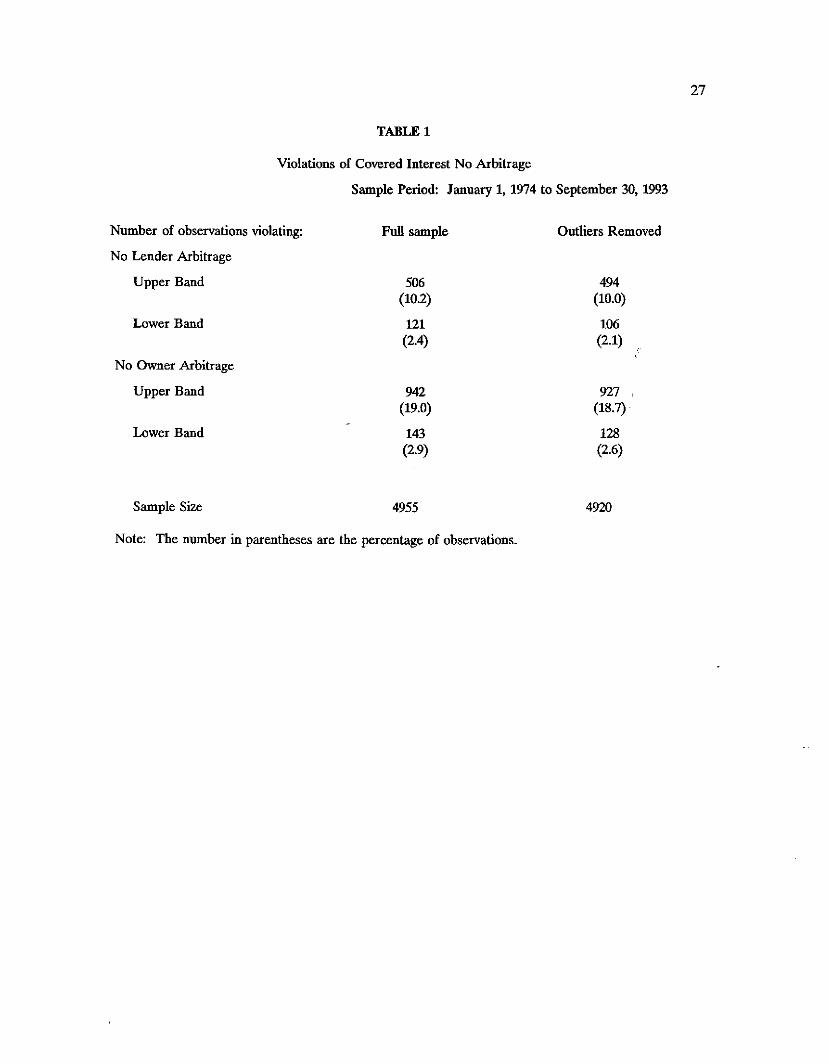
TABLE 1
Violations of Covered Interest No Arbitrage
Sample Period: January 1, 1974 to September 30, 1993
27
Number of observations violating:
No Lender Arbitrage
Upper Band
Lower Band
No Owner Arbitrage
Upper Band
Lower Band
Sample Size
Full sample
506(10.2)
121(2.4)
942(19.0)
143(2.9)
4955
Outliers Removed
494(10.0)
106(2.1)
927(18.7)
128(2.6)
4920
Note: The number in parentheses are the percentage of observations.
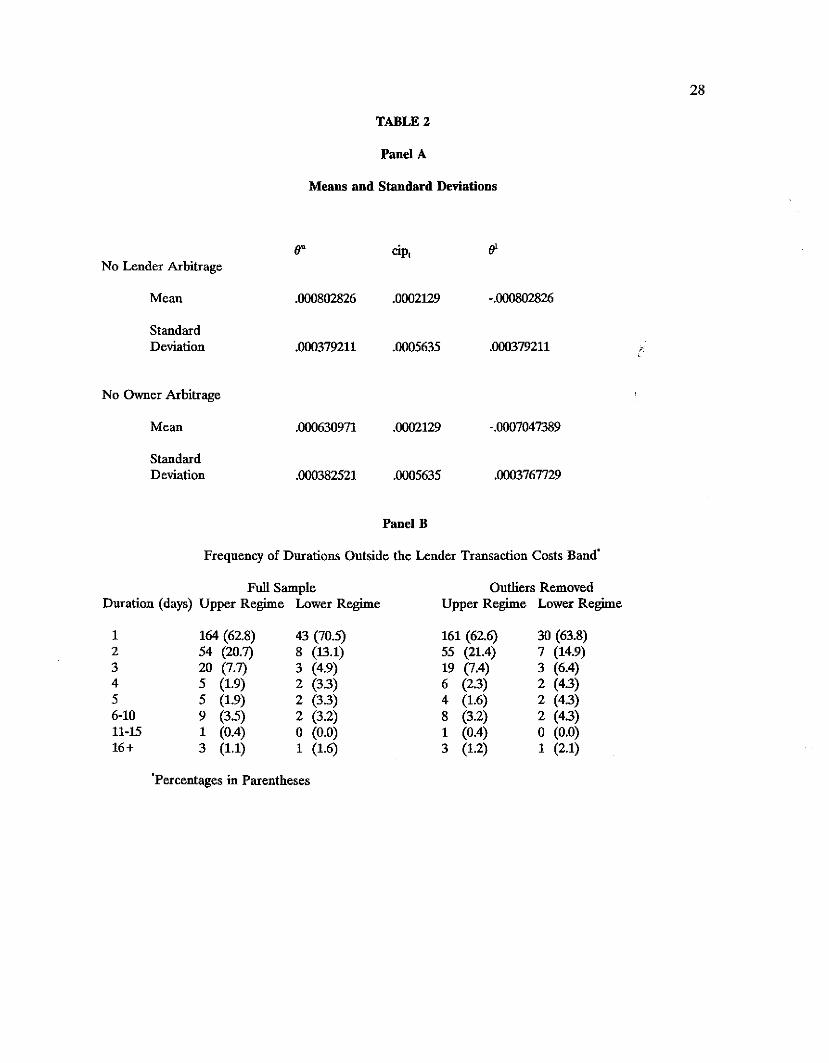
TABLE 2
Panel A
Means and Standard Deviations
28
No Lender Arbitrage
Mean
StandardDeviation
No Owner Arbitrage
Mean
StandardDeviation
/I"
.000802826
.000379211
.000630971
.000382521
cipt
.0002129
.0005635
.0002129
.0005635
Panel B
-.000802826
.000379211
-.0007047389
.0003767729
Frequency of Durations Outside the Lender Transaction Costs Band"
Full SampleDuration (days) Upper Regime Lower Regime
Outliers RemovedUpper Regime Lower Regime
123456-1011-1516+
164 (62.8)54 (20.7)20 (7.7)5 (1.9)5 (1.9)9 (3.5)1 (0.4)3 (1.1)
43 (70.5)8 (13.1)3 (4.9)2 (33)2 (33)2 (3.2)o (0.0)1 (1.6)
161 (62.6)55 (21.4)19 (7.4)6 (2.3)4 (1.6)8 (3.2)1 (0.4)3 (1.2)
30 (63.8)7 (14.9)3 (6.4)2 (43)2 (4.3)2 (43)o (0.0)1 (2.1)
"Percentages io Parentheses
29
TABLE 3. Tests of Equality Across Regimes and Residual Diagnostics
A. Threshold Autoregression (TAR) Model Estimated by OLS
Tests of EQuality Across Regimes
Autoregressive coefficients (including constant) are equal across regimes:Homoskedastic errors: F(22,4912) = 6.45 (ooסס.0)
Heteroskedastic consistent covariance: Y(22) = 56.94 (ooסס.0)
Smn of autoregressive coefficients (not including constants) are equal across regimes:Homoskedastic errors: F(2,4910) = 1.92 (0.147)Heteroskedastic consistent covariance: y(2) = 1.52 (0.467)
Residual Diagnostic Tests
Tests for serial correlation in the OLS residualsLM-test (F-test version, 20 lags):Ljung-Box Q-Statistic (60 lags):
Tests for ARCHLM-test (F-testversion, 20 lags):Ljung-Box Q-Statistic for squared residuals (60 lags):
F(2O,4872) = 7.64 (0.000)0(60) = 9739 (0.000)
F(2O,4904) = 5.91 (0.000)0(60) = 161.91 (0.000)
B. Threshold AR/Threshold ARCH Model (TAR/TARCH) Estimated by Maximnm likelihood (ML)
Test of equality across regimes:
AR, ARCH coefficients, and t-distributions are equal across regimes:
AR Coefficients (including constant) are equal across regimes:
Smn of AR coefficients (not including constant) are equal across regimes:
ARCH parameters are equal across regimes:
t-distributions are the same across regimes (VU = vm = Vi):
Residual Diagnostic Tests
Tests for serial correlation in the standardized residuals:LM-test (F-test version, 20 lags):Ljung-Box O-Statistic (60 lags):
Tests for ARCH in the standardized residuals:LM-test (F-test version, 20 lags):Ljung-Box O-Statistic for squared standardized residuals (60 lags):
y(40) = 198.99 (0.000)
y(22) = 78.56 (0.000)
y(2) = 10.73 (0.005)
y(l6) = 6531 (0.000)
y(2) = 2.97 (0.227)
F(2O,4865) = 1.32 (0.155)Q(60) = 40.84 (0.819)
F(2O,4897) = 0.73 (0.797)Q(6O) = 15.55 (0.999)
'The tests of parameter equality across regimes are based on Wald statistics. The p-vaiues are inparentheses.

Table AI.Basic Threshold AR Model Estimated By OLS
Variable Upper Regime Middle Regime Lower Regime
Constant 1.95x10'" 2.73x10⁻⁵' -.1.93x10"
(6.00xl0-') 7.l2x1<r (1.6x10")
apt_1 .168" .403' .065(.043) (.024) (.065)
ciPt_2 .131' .071" .055(.051) (.015) (.100)
ciPt_3 .080 .093' .187(.050) (.015) (.144)
ciP'-4 .144' .076" .147(.050) (.016) (.078)
ClPI·.5 .022 .074' .163(.043) (.016) (.138)
ClPt-6 .070 -.044 -.021(.052) (.015) (.158)
cip,.? -.042 -.011 .317(.054) (.015) (.169)
ciPt_8 .126" 3.1Ox10·' -.334(.055) (.015) (.171)
ClPt.9 .033 .11z' -.036(.040) (.016) (.213)
cipt-to .019 .073" .200(.059) (.014) (.165)
SEE 6.02x10" 4.05x10" 7.16x10"
30

Table A2. TARJTARCH Model Estimated by ML
Coefficients Upper Regime Middle Regime Lower Regime
Constant 1.24xl0"'* -1.00.10" -9.32xl0·'(3.21.10") (2.3S.10'") (1.28xl0")
ciPt_1 .241' .447- .056(.041) (.016) (.108)
ciPt_2 .OSS .043· .143(.036) (.014) (.093)
ciP'_3 .081 .092* .303-(.046) (.013) (.133)
ciPt-4 .198' .083' .IS3(.042) (.013) (.117)
ciPt.s .016 .178' .211'(.047) (.OIS) (.088)
ciPt-6 .123' -.013 -.012 ,
(.039) (.012) (.099)
ciPt_7 -.026 -.000 .112(.038) (.012) (.130)
ciPt-8 .045 .005 -.OS9(.035) (.010) (.097)
ciPI-9 .010 .034' -.047(.028) (.010) (.144)
ciPI_IO .040 .OSO' .009
(.035) (.009) (.107)
ARCH Coefficients
Constant l.3Oxl0" 2.30dO·' 1.82xl0·7
(8.00.10"') (1.70.10") (1.48xl0·7)
l!!:2t•1 .377' .591' .051
(.139) (.098) (.035)
,2102 .086 .113' .022
(.073) (.038) (.173)
6 2t_3 .439' .097' .027
(.214) (.030) (.212)
E2t-4 .010 .10S' -.009
(.052) (.035) (.042)
f2t_S .512' .57S' .003
(.220) (.097) (.036)
,2t-6 .036 -.000 .024
(.067) (.014) (.114)
,2t_7 .077 .076' .039
(.067) (.025) (.097)
" (df t-<list.) 2.833' 2.565' 4.281'(.386) (.060) (1.082)
31

32
Endnotes1. For surveys of some of this literature see Officer and Willett (1970), Thornton (1989), andMacDonald and Taylor (1990).
2. One exception is Rhee and Chang (1992) who test arbitrage violations directly using highfrequency (intradaily) data and find only a small number of violations of CIP over limited periodsof time.
3. This is in contrast to Pippenger (1978) who presents empirical results for the Canada-US CIP,that indicate adjustment can take weeks.
4. Rhee and Chang (1992) have argued that indirect measures of transactions costs, such as thoseused by Frenkel and Levich are not appropriate for examining the frequency of mar~et equilibriumfor at least two reasons. First, the validity of indirect measures of transactions costs require thatcosts structures built into triangular arbitrage remain stable. Unfortunately, equilibrium conditionstend to be violated when markets are unstable. Second, the indirect measures represent only anaverage cost which does not capture the degree of uncertainty associated with each and everyarbitrage transaction. To be exact, the frequency of market disequilibrium should be compiledbased on individual transactions.
5. Balke and Fomby (1997) argue that transactions costs could give rise to time series that arethreshold cointegrated in which movement back towards a long-run equilibrium occurs only ifdeviations from the equilibrium are "large". Along these lines, Anderson (1994) applies thresholdcointegration to the term structure of interest rates and estimates threshold error correction modelsfor the term structure.
6. Other studies which have demonstrated that timing and accuracy of data is important includeMcCormick (1979), Maasoumi and Pippenger (1989), and Taylor (1987,1989). McCormick (1979)has analyzed the effects of using different closing prices from markets in different time zones (e.g.close in New York for the OM and the close in London for the British pound) and finds thatdeviations from triangular arbitrage declines substantially when exchange rates are quotedsimultaneously. Taylor (1987, 1989) use high quality, high-frequency data (five- and ten-minute)to examine the hypothesis that the apparent unexploited profit opportunities for arbitrage may bethe result of inappropriate data, including issues of measurement error and timing. He finds veryfew deviations from CIP when institutional detail was considered. More recently, Rhee and Chang(1992) examined the frequency of simultaneous equilibrium on four markets using real-timequotations drawn from Eurocurrency and interbank foreign exchange markets during the morningtrading hours of New York. Profit opportunities were examined not only for one-way but also forcovered interest arbitragers. Their results indicate that i) profit opportunities from traditionalcovered interest arbitrage are rarely available, ii) the frequency of attaining market equilibrium waslow, thus, opening the door for one-way arbitrage, and iii) profits from one-way arbitrage persist,indicating why one-way arbitragers do not search for the least-cost arbitrage route.
7. These results were in contrast to those of Frenkel and Levich (1981). Frenkel and Levich (1981)employed Treasury bill rates for the US and Canada over the period 1973-1979 and calculated atransaction cost equivalent to 0.125 percent per annum from bid-ask spreads, which is twice as largeas those reported in Clinton (1988).
33
8. If short- and long-term assets were perfect substitutes within currencies, then CIP among longterm assets could be regarded as an extension of the short-term CIP literature discussed above.However, Popper (1993) points out that assets of different maturities are not easily substitutable,and thus a different analysis is required for markets in which assets with long maturities are traded.
9. Much of the literature examining CIP assumes that forward contracts are the relevant instrumentfor evaluating CIP. But a large amount of 'forward' trading in foreign exchange is done throughswap transactions. As Clinton (1988) illustrates, this has important implications for evaluating thetransactions cost bands for a CIP-based arbitrage. Another caveat that should be pointed out is thatit is usually assumed that i. and it are interest rates on the assets with the same characteristics. Thisis why in this study we employ euro-deposit rates. If the interest rates used are on Treasury bills,the two securities of the two different countries will usually not have the same risk characteristics.
10. Several filters were run on the data to check for errors, and unfortunately some errors werefound. After consultations with the staff at DRI the errors were corrected. '
11. T= 1/12 here as euro-deposit rates are annual and forward rates have a 1 month maturity. Wecould have alternatively multiplied the forward premium by 12, however, the chosen specificationis consistent with the model used in this paper.
12. Point estimates of deviations from CIP calculated from posted bids and asks will not in generalbe equal to the actual deviations on either side of the bid or ask. The quotes actually only definea range within which trades may take place, while dealers normally negotiate for finer spreads thanthose posted. Thus, we calculate all interest rates variables as the geometric average of the bid-askspread.
13. We removed observations in which the standardized residuals from a linear autoregression weregreater than four. The rather large sample size made more formal, iterative outlier searches suchas Tsay (1988) impracticable.
14. The standard error of the sample mean is 8.0053 X 10⁻⁶.
15. The approximate annual profit lender arbitrage = (1 + 71".)250 - 1, where 71", is equal to IciptlOUt if Icipt I - OUt > 0 and equal to zero otherwise. 71", is the rate of return for a given arbitrageopportunity, so to get annual return we assume 250 trading days or (arbitrage opportunities) in ayear. As these profits apply to the no lender arbitrage case, the number of days in figure 3 sum to527 (506 in upper regime and 121 in the lower-osee Table 1: full sample, No Lender Arbitrage).
16. This is similar to the profits for dollarIpound arbitrage found by Clinton.
17. The threshold autoregression for covered interest parity would imply threshold cointegration(see Balke and Fomby (1997» for the forward premium for exchange rates and the interestdifferential if the autoregression in the middle regime contained a unit root. However, in this casedeviations from covered interest parity appear to be stationary in all three regimes.
18. We did not separately examine a TAR/TARCH model for no owner arbitrage transactionsbands. The lender arbitrage case is the more the binding of the two as all instances of lenderarbitrage will also be instances of owner arbitrage. Furthermore, estimation of the basic TAR

34
model with the no owner arbitrage transactions bands yielded very similar results to those presentedin the paper. Thus, to save space we present results ouly for the no lender arbitrage case.
19. We also experimented with the estimation of a smooth transition autoregressive model butdifficulties in estimating the curvature of the transition functions forced us to settle on the discretethreshold model as it is a more parsimonious model which does not require the specification oftransition functions.
20. Our use of a parametric distribution for v, ouly affects our estimation of the threshold model.In the simulations used to construct impulse responses described below, we use the realizedstandardized residuals as v, shocks.
21. Tables Al and A2 in the appendix present the details of the estimated threshold models. Allcalculations including the impulse response analysis discussed below were conductf)d using RATSVersion 4.1. '
22. One can also reject the hypothesis that the autoregressive models for the upper and lowerregimes are equal. Similarly, for the ARCH models.
23. The lag length for the TAR was set at ten lags. For the TAR model estimated by OLS, thiswas not sufficient to eliminate all the serial correlation in the residuals; however, when examiningthe autocorrelation function of the residuals, it appears that this remaining serial correlation is theresult of correlation of residuals at infrequent and irregular lags. This correlation is eliminated onceARCH effects and a "fat-tailed" distribution for standardized shocks are allowed.
24. See Koop, Pesaran, and Potter (1996) and Gallant, Rossi, Tauchen (1993) for a discussion ofnonlinear impulse response analysis.
25. If the shocks were normally distributed, these would correspond to approximately one and twostandard deviation shocks.
26. For example, we first draw an initial date '1", from the actual data and calculate the IRFconditional on that date. We then reselect another date '1"" with replacement, and calculate anotherIRF. This is continued until 500 initial dates have been selected for the model and then take theaverage to obtain an IRF for cip.
27. When conditioning on each regime, we draw 500 different initial dates from the respectiveregime and then take averages of the resulting IRFs. This gives us three conditional IRFs--one foreach regime, upper, lower, middle. These three, combined with the IRF obtained from drawinginitial dates from the full sample yields the four IRFs displayed in Figures 4 and 5.
28. In a previous version of this paper, we considered using a threshold autoregression to modelthe bid/ask spread itself. However, the results were not substantially different from those reportedhere. In future work, we hope the develop a more interesting model of the bid/ask spread, so thatwe better explore the joint dynamics between the covered interest parity condition and the bid/askspread.
29. For example Liu and Maddala (1992) follow Hsieh (1984) and construct one-week forward rates(in their tests of foreign exchange market efficiency) assuming CIP holds.
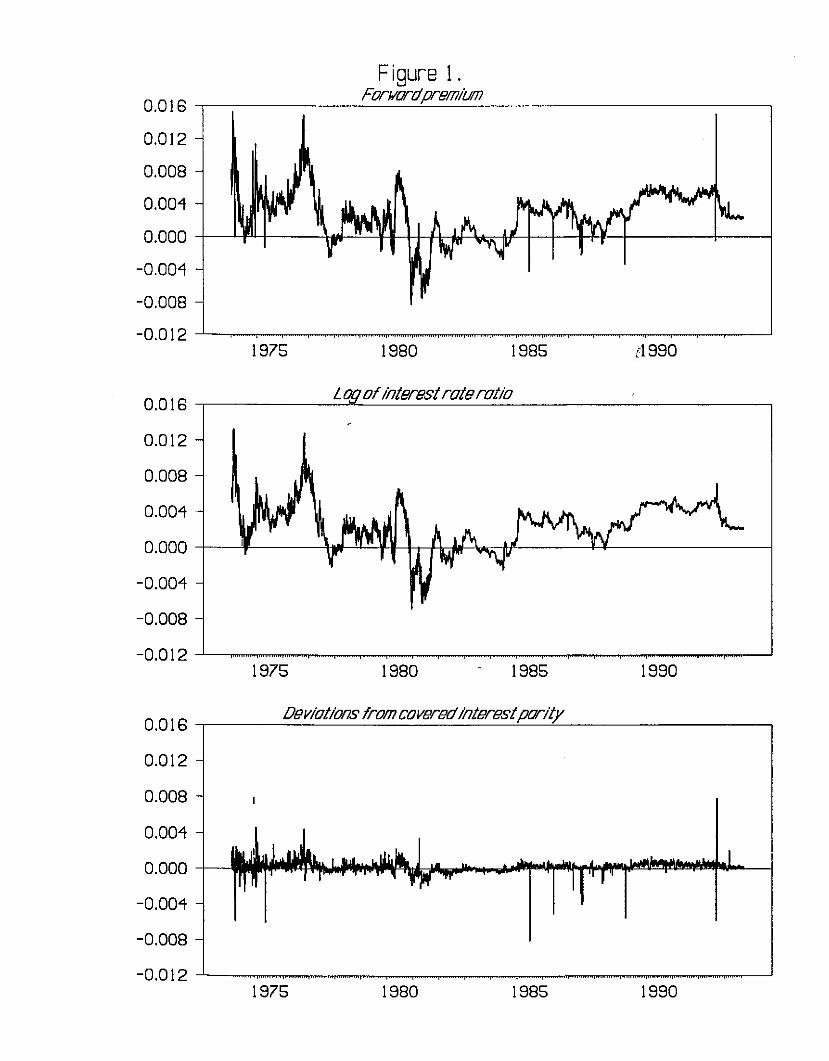
Figure 1.0.0 16 -.-- Fi._or_M_zr._d-'-p_l'i_'B/1l._~_vm _____,
0.012
0.008
0.004
0.000 +------'--f"'-I----\1IN---'''--'--H-+I--H.- 1.I-'-\.c--M-+-+--I-I~-+----+-----1
-0.004
-0.008
-0.0 12 --'--~~~~~~~-~~~~~~~~-~~~-----'
Logofinterestrateratio
1975
0.016
0.012
0.008
0.004
0.000
-0.004
-0.008
-0.0121975
1980
1980
1985
1985
[1990
1990
0.0 16 -.--__---=f),:..:'B'"'-v~:.=o..::.:.tA.::.:.'{}f7S.:.::....:..fr.:..:'OIlJ::.:.:...::c,:.=,o.:...:ver.~'EJd:...:/i:...:'f7t.::.::er.:..:i9.::.::~_'_'tpor:c:..:::...:..::/Iy<-- --,
0.012
0.008
0.004
0.000
-0.004
-0.008
-0.0 12 --'-----~~~-----~~~----~~-------'1975 1980 1985 1990

oOJen
L.OCDen
a<Den
LOI'...en
=:i l~-~ ~-- _................. ~~--
-l ~--~- -~-
--~ r-:.----":.-1 i'~--:ii:~~ F·
- - - - - --=; 0=- - - - - -.- - ---~""1- -r~--- --.---i t---
-l- -t--( j-
-~~-.--~~ ~--.- --1:- -t--1r-
.J l.- -a! !.e- -
t t-... ...-- - - --.:;..~ ~;.:-- - - -~~
----~ ~- ----
------J t---- ----- - - - -, ~: - - - - -
~r
----~==~ ~==~----------11. 'Ii:: ------
------~~ ------:Jt:-
-o:--:-~ ~:"":'-
aCDen
L.OI'...en
aOJen
L.O'1-------1 CD
OJ
CD W ~ NON ~ W CDa a a 0 a a 0 a aa a a a a a a a aa a a a a a a a a
I I I I
I I I I I I
CD W ~ N a N ~ W <Da 0 a a a a a a aq 0 0 a a a a a aa 0 0 a a a a a 0
I I I I
00 --........-t ~
00....-t
0/\
CO0·0 +'"
rn't:lr:l0
(V) 0 Po.rn
(0~
0 ~
~ ~
0:: 0u
p0t:..' 0
~.
0 ....-t~ ~ --
0 +'".r-!.....0~-
p..
0 't:lC\2 ~· N0 .r-!
.....-ictl
:::lr:lr:l
0 -<0 ·0
0 0 0 0 0 0lC:l 0 lC:l 0 lC:lC\2 C\2 ....-t ....-t
SA~a JO .1aQUInN

Figure 4. Impulse Response FunctionsSame Initial Shock Across Regimes
\ +large shack --
- - large shack - -
+small shack --
\ _oMoli shack\.-. ----------- - - - - - - -
/ -,- - , --- --------_.I '" ~-
I '"IIIII
II
Avg Response of CIP in Middle Regime0.00075
0.00050
0,00025
0.00000
-0,00025
-0.00050
-0,00075
Avg Response of CIP
\ +large shack -- large shack - -
+small shack - -
\ N:moll shack -\.-.----------- -- - - - -
/ -,- - "- --- --------_.
I/ ~/
I '"IIIIIII
0.00075
0.00025
0,00050
0.00000
-0.00025
-0,00050
-0,000755 9 13 17 5 9 13 17
Avg Response of CIP In Upper Regime0,00075
+large shack --
- large shack - -+small shack --
.\ -\_--- -- --..-- -...--.
- .- - ~ - ~...
cO< - - "' ... -~ ------; ..... _--
I ' , ... ,,,.. -IJIIIII,
Avg Response of CIP In Lower Regime0,00075
0.00050
0.00025
0.00000
-0,00050
-0,00025
-0,00075
+large shack --- large shack - -
+small shack --
\
\.- small shack ---- - --
/ - - - --- - - - -I
I - ~ -- -_.... ---------I
-_/IIII
III
0.00025
0,00050
0,00000
-0.00025
-0.00050
-0.000755 9 13 17 5 9 13 17

Figure 5. Impulse Respouse FuuetiousIuitial Shock Couditioual ou Regime
.....
Avg ReSponse of CIP
I+lorge shock --
- large shock - -
+smoll shock --\
k:-.,mn'l Shock\ -
~---------- - - - - - - - --,. ----------1- -..... "
... -- ... -I I '
IIIIIII
0.00016
0.00048
0.00032
Avg Response of CIP in Middle Regime0,00064
-0,00016
-0,00000
-0.00032
-0.00048
-0.00064
(
+large shock --
- large shock - -
+smoll shock --
\l-.omoll shock\ --
"'---- --- -----_.- - - - - --,. ... -- ............ ----- - - --~--
/ ,/I I
II,
III,
0.00000
0.00050
0.00025
0.00075
-0,00025
-0,00050
-0.000755 8 13 17 5 8 13 17
+large shock --
- large shack - -
+small shock --\
\ ,II ohnnk
.......----..._-------,. - - -'-~, ..... - - :---------I........ - ",.--- ........I - ...
I~
I 1,II,,
0.00075
0.00050
Avg Response of CIP In Lower Regime0.00100
0.00025
0.00000
-0.00025
-0.00050
-0.00075
-0.00100
+large shock --
- large shock - -
+small shock --\
\ - - small shock -.......'-----------_.-
- - - - - - - - - -,. ~- .... ~---_ .... ---------/ ,"
I I
II,
IIII
Avg Response of CIP In upper Regime0.00120
0.00080
0.00040
-0.00000
-0.00080
-0.00120
-0.00040
5 8 13 17 5 8 13 17
RESEARCH PAPERS OF THE RESEARCH DEPARTMENTFEDERAL RESERVE BANK OF DALLAS
Available, at no charge, from the Research DepartmentFederal Reserve Bank of Dallas, P. O. Box 655906
Dallas, Texas 75265-5906
Please check the titles of the Research Papers you would like to receive:
9201 Are Deep Recessions Followed by Strong Recoveries? (Mark A. Wynne and Nathan S. Balke)9202 The Case of the "Missiug M2" (Johu V. Duca)9203 Immigrant Liuks to the Home Country: Implications for Trade, Welfare and Factor Rewards (David
M. Gould)9204 Does Aggregate Output Have a Unit Root? (Mark A. Wynne)9205 Inflation and Its Variability: A Note (Kenneth M. Emery)9206 Budget Constraiued Frontier Measures of Fiscal Equality and Efficiency in Schooliug (Shawna
Grosskopf, Kathy Hayes, Lori L. Taylor, William Weber)9207 The Effects of Credit Availability, Nonbank Competition, and Tax Reform on Bank Consumer Lendiug
(Johu V. Duca and Bonnie Garrett)9208 On the Future Erosion of the North American Free Trade Agreement (William C. Gruben)9209 Threshold COintegration (Nathan S. Balke and Thomas B. Fomby)9210 Coiutegration and Tests of a Classical Model of Inflation iu Argentiua, Bolivia, Brazil, Mexico, and
Peru (Raul Arribal Feliz and Johu H. Welch)9211 Nomiual Feedback Rules for Monetary Policy: Some Comments (Evan F. Koenig)9212 The Aualysis of Fiscal Policy iu Neoclassical Models 1 (Mark Wynne)9213 Measuriug the Value of School Quality (Lori Taylor)9214 Forecastiug Turning Poiuts: Is a Two-State Characterization of the Business Cycle Appropriate?
(Kenneth M. Emery & Evan F. Koenig)9215 Energy Security: A Comparison of Protectionist Policies (Miue K. Yiicel and Carol Dahl)9216 An Analysis of the Impact of Two Fiscal Policies on the Behavior of a Dynamic Asset Market (Gregory
W. Huffman)9301 Human Capital Externalities, Trade, and Economic Growth (David Gould and Roy J. Ruffm)9302 The New Face of Latin America: Fiuancial Flows, Markets, and Institutions in the 1990s (Johu Welch)9303 A General Two Sector Model of Endogenous Growth with Human and Physical Capital (Eric Bond,
Piug Wang, and Chong K. Yip)9304 The Political Economy of School Reform (S. Grosskopf, K. Hayes, L. Taylor, and W. Weber)9305 Money, Output, and Income Velocity (Theodore Palivos and Piug Wang)9306 Constructing an Alternative Measure of Changes iu Reserve Requirement Ratios (Joseph H. Haslag
and Scott E. Heiu)9307 Money Demand and Relative Prices Duriug Episodes of Hyperinflation (Ellis W. Tallman and Piug
Wang)9308 On Quantity Theory Restrictions and the Sigualliug Value of the Money Multiplier (Joseph Haslag)9309 The Algebra of Price Stability (Nathan S. Balke and Kenneth M. Emery)9310 Does It Matter How Monetary Policy is Implemented? (Joseph H. Haslag and Scott Heiu)9311 Real Effects of Money and Welfare Costs ofinflation iu an Endogenously Growing Economy with
Transactions Costs (Ping Wang and Chong K. Yip)9312 BOITowiug Constraiuts, Household Debt, and Racial Discriutination in Loan Markets (Johu V. Duca
and Stuart Rosenthal)9313 Default Risk, Dollarization, and Currency Substitution iu Mexico (William Gruben and Johu Welch)9314 Techuological Unemployment (W. Michael Cox)9315 Output, Inflation, and Stabilization iu a Small Open Economy: Evidence from Mexico (Johu H. Rogers
and Ping Wang)9316 Price Stabilization, Output Stabilization and Coordiuated Monetary Policy Actions (Joseph H. Haslag)9317 An Alternative Neo-Classical Growth Model with Closed-Form Decision Rules (Gregory W. Huffman)

9318
9319
932093219322
9323*
9324
9325
93269327
9328
9329*
9330
9331
9332933393349335
93369337
9338
933993409341
934294019402
9403
94049405940694079408
9409
Why the Composite Index of Leading Indicators Doesn't Lead (Evan F. Koenig and Kenneth M.Emery)
Allocative Inefficiency and Local Government: Evidence Rejecting the Tiebout Hypothesis (Lori L.Taylor)
The Output Effects of Government Consumption: A Note (Mark A. Wynne)Should Bond Funds be Included in M2? (John V. Duca)Recessions and Recoveries in Real Business Cycle Models: Do Real Business Cycle Models GenerateCyclical Behavior? (Mark A. Wynne)Retaliation, Liberalization, and Trade Wars: The Political Economy of Nonstrategic Trade Policy(David M. Gould and Graeme L. Woodbridge)A General Two-Sector Model of Endogenous Growth with Human and Physical Capital: BalancedGrowth and Transitional Dynamics (Eric W. Bond, Ping Wang,and Chong K. Yip)Growth and Equity with Endogenous Human Capital: Taiwan's Econontic Miracle Revisited (Maw-LinLee, Ben-Chieh Liu, and Ping Wang)Clearinghouse Banks and Banknote Over-issue (Scott Freeman)Coal, Nattual Gas and Oil Markets after World War II: What's Old, What's New? (Mine K. Yiicel andShengyi Guo)On the Optimality of Interest-Bearing Reserves in Econonties of Overlapping Generations (ScottFreeman and Joseph Haslag)Retaliation, Liberalization, and Trade Wars: The Political Economy of Nonstrategic Trade Policy(David M. Gould and Graeme L. Woodbridge) (Reprint of 9323 in error)On the Existence of Nonoptimal Equilibria in Dynantic Stochastic Economies (Jeremy Greenwood andGregory W. Huffman)
The Credibility and Performance of Unilateral Target Zones: A Comparison of the Mexican andChilean Cases (Raul A. Feliz and John H. Welch)Endogenous Growth and International Trade (Roy J. Ruffin)Wealth Effects, Heterogeneity and Dynamic Fiscal Policy (Zsolt Becsi)The Inefficiency of Seigniorage from Required Reserves (Scott Freeman)Problems of Testing Fiscal Solvency in High Inflation Economies: Evidence from Argentina, Brazil,and Mexico (John H. Welch)Income Taxes as Reciprocal Tariffs (W. Michael Cox, David M. Gould, and Roy J. Ruffm)Assessing the Economic Cost of Unilateral Oil Conservation (Stephen P.A. Brown and Hillard G.Huntington)Exchange Rate Uncertainty and Economic Growth in Latin America (Darryl McLeod and John H.Welch)
Searching for a Stable M2-Demand Equation (Evan F. Koenig)A Survey of Measurement Biases in Price Indexes (Mark A. Wynne and Fiona Sigalla)Are Net Discount Rates Stationary?: Some Further Evidence (Joseph H. Haslag, MichaelNieswiadomy, and D. J. Slottje)On the Fluctuations Induced by Majority Voting (Gregory W. Huffman)Adding Bond Funds to M2 in the P-Star Model of Inflation (Zsolt Becsi and John Duca)Capacity Utilization and the Evolution of Manufacturing Output: A Closer Look at the "Bounce-BackEffect" (Evan F. Koenig)The Disappearing January Blip and Other State Employment Mysteries (Frank Berger and Keith R.Phillips)
Energy Policy: Does it Achieve its Intended Goals? (Mine Yiicel and Shengyi Guo)Protecting Social Interest in Free Invention (Stephen P.A. Brown and William C. Gruben)The Dynamics of Recoveries (Nathan S. Balke and Mark A. Wynne)Fiscal Policy in More General Equilibriium (Jim Dolman and Mark Wynne)On the Political Economy of School Deregulation (Shawna Grosskopf, Kathy Hayes, Lori Taylor, andWilliam Weber)The Role ofIntellectua1 Property Rights in Economic Growth (David M. Gould and William C.Gruben)
9410 U.S. Banks, Competition, and the Mexican Banking System: How Much Will NAFTA Matter?(William C. Gruben, John H. Welch and Jeffery W. Gunther)
9411 Monetary Base Rules: The Currency Caveat (R. W. Hafer, Joseph H. Haslag, andScott E. Hein)9412 The Information Content of the Paper-Bill Spread (Kenneth M. Emery)9413 The Role of Tax Policy in the Boom/Bust Cycle of the Texas Construction Sector (D'Ann Petersen,
Keith Phillips and Mine Yiicel)9414 The p* Model of Inflation, Revisited (Evan F. Koenig)9415 The Effects of Monetary Policy in a Model with Reserve Requirements (Joseph H. Haslag)
9501 An Equilibrium Analysis of Central Bank Independence and Inflation (Gregory W. Huffman)9502 Inflation and Intermediation in a Model with Endogenous Growth (Joseph H. Haslag)9503 Country-Bashing Tariffs: Do Bilateral Trade Deficits Matter? (W. Michael Cox and Roy J. Ruffm)9504 Building a Regional Forecasting Model Utilizing Long-Term Relationships and Short-Term Indicators
(Keith R. Phillips and Chih-Ping Chang)9505 Building Trade Barriers and Knocking Them Down: The Political Economy of Unilateral Trade
Liberalizations (David M. Gould and Graeme L. Woodbridge)9506 On Competition and School Efficiency (Sbawna Grosskopf, Kathy Hayes, Lori L. Taylor and William
L. Weber)9507 Alternative Methods of Corporate Control in Commercial Banks (Stephen Prowse)9508 The Role oflntratemporal Adjustment Costs in a Multi-Sector Economy (Gregory W. Huffman
and Mark A. Wynne)9509 Are Deep Recessions Followed By Strong Recoveries? Results for the G-7 Countries (Nathan
S. Balke and Mark A. Wynne)9510 Oil Prices and Inflation (Stephen P.A. Brown, David B. Oppedahl and Mine K. Yiicel)9511 A Comparison of Alternative Monetary Environments (Joseph H. Haslag))9512 Regulatory Changes and Housing Coefficients (John V. Duca)9513 The Interest Sensitivity of GDP and Accurate Reg Q Measures (John V. Duea)9514 Credit Availability, Bank Consumer Lending, and Consumer Durables (John V. Duea and
Bonnie Garrett)9515 Monetary Policy, Banking, and Growth (Joseph H. Haslag)9516 The Stock Market and Monetary Policy: The Role of Macroeconomic States (Chih-Ping Chang
and Huan Zhang)9517 Hyperinflations and Moral Hazard in the Appropriation of Seigniorage: An Empirical Implementation
With A Calibration Approach (Carlos E. Zarazaga)9518 Targeting Nominal Income: A Closer Look (Evan F. Koenig)9519 Credit and Economic Activity: Shocks or Propagation Mechanism? (Nathan S. Balke and
Chih-Ping Chang)9601 The Monetary Policy Effects on Seignorage Revenue in a Simple Growth Model (Joseph H. Haslag)9602 Regional Productivity and Efficiency in the U.S.: Effects of Business Cycles and Public Capital
(Dale Boisso, Shawna Grosskopf and Kathy Hayes)9603 Inflation, Unemployment, and Duration (John V. Duca)9604 The Response of Local Governments to Reagan-Bush Fiscal Federalism (D. Bois80, Shawna
Grosskopf and Kathy Hayes)9605 Endogenous Tax Determination and the Distribution of Wealth (Gregory W. Huffman)9606 An Exploration into the Effects of Dynamic Economic Stabilization (Jim Dolmas and Gregory W.
Huffman)9607 Is Airline Price Dispersion the Result of Careful Planning or Competitive Forces? (Kathy J.
Hayes and Leola B. Ross)9608 Some Implications of Increased Cooperation in World Oil Conservation (Stephen P.A. Brown
and Hillard G. Huntington)9609 An Equilibrium Analysis of Relative Price Changes and Aggregate Inflation (Nathan S. Balke
and Mark A. Wynne)

9610 What's Good for GM...? Using Auto Industry Stock Returns to Forecast Business Cycles and Test theQ-Theory of Investment (Gregory R. Duffee and Stephen Prowse)
9611 Does the Choice of Nominal Anchor Matter? (David M. Gould)9612 The Policy Sensitivity of Industries and Regions (Lori L. Taylor and Mine K. Yiicel)9613 Oil Prices and Aggregate Economic Activity: A Study of Eight OECD Countries (Stephen P.A. Brown,
David B. Oppedahl and Mine K. Yiicel)9614 The Effect of the Minimum Wage on Hours of Work (Madeline Zavodny)9615 Aggregate Price Adjustment: The Fischerian Alternative (Evan F. Koenig)9701 Nonlinear-Dynamics and Covered Interest Rate Parity (Nathan S. Balke and Mark E. Wohar)
Name: Organization:
Address: City, State and Zip Code:
Please add me to your mailing list to receive future Research Papers: Yes No

Research Papers Presented at the1994 Texas Conference on Monetary Economics
April 23-24, 1994held at the Federal Reserve Bank of Dallas, Dallas, Texas
Available, at no charge, from the Research DepartmentFederal Reserve Bank of Dallas, P. O. Box 655906
Dallas, Texas 75265-5906
Please check the titles of the Research Papers you would like to receive:
1 A Sticky-Price Manifesto (Laurence Ball and N. Gregory Mankiw)
2 Sequential Markets and the Suboptima1ity of the Friedman Rule (Stephen D. Williamson)
3 Sources of Real Exchange Rate Fluctuations: How Important Are Nominal Shocks? (Richard Claridaand Jordi Gali)
4 On Leading Indicators: Gelling It Straight (Mark A. Thoma and Jo Anna Gray)
5 The Effects of Monetary Policy Shocks: Evidence From the Flow of Funds (Lawrence J. Christiano,Martin Eichenbaum and Charles Evans)
Name: Organization:
Address: City, State and Zip Code:
Please add me to your mailin.glist to receive future ResearchPapers: Ves No