Nonlinear dynamic features and co-predictability of the ...
13
MARINE ECOLOGY PROGRESS SERIES Mar Ecol Prog Ser Vol. 464: 195–207, 2012 doi: 10.3354/meps09868 Published September 19 INTRODUCTION Nonlinear population processes, ecological inter- actions, environmental forcing, and anthropogenic impacts can individually and collectively generate dramatic patterns of variability in marine ecosystems (Steele & Henderson 1984, Dixon et al. 1999, Hsieh et al. 2005, Anderson et al. 2008). Recognition of the consequences of this broad spectrum of critical pro- cesses affecting marine systems, and the possibility of synergistic interactions among them, has led to calls for dedicated research into the structure, func- tion, and resilience of exploited marine systems (Mangel & Levin 2005, Murawski et al. 2010). An ex- tensive catalogue of multispecies and ecosystem modeling approaches has now been applied in fish- ery management (Plagányi 2007). These models in- corporate varying levels of mechanistic detail in specifying key elements of ecosystem structure and function. In many instances, the choice of model structure and complexity reflects a tradeoff between realism and accuracy due to the potential for in- © Inter-Research 2012 · www.int-res.com *Email: [email protected] Nonlinear dynamic features and co-predictability of the Georges Bank fish community Hui Liu 1,6, *, Michael J. Fogarty 1 , Sarah M. Glaser 2,7 , Irit Altman 3 , Chih-hao Hsieh 4 , Les Kaufman 5 , Andrew A. Rosenberg 3 , George Sugihara 2 1 NOAA/NMFS, Northeast Fisheries Science Center, Woods Hole, Massachusetts 02543, USA 2 Scripps Institution of Oceanography, University of California San Diego, La Jolla, California 92093, USA 3 University of New Hampshire, Ocean Process Analysis Lab, Durham, New Hampshire 03824, USA 4 Institute of Oceanography and Institute of Ecology and Evolutionary Biology, National Taiwan University, Taipei 106, Taiwan 5 Boston University Marine Program, 5 Cummington Street, Boston, Massachusetts 02215, USA 6 Present address: Department of Marine Biology, Texas A&M University at Galveston, Texas 77553, USA 7 Present address: College of William and Mary, Williamsburg, Virginia 23185, USA ABSTRACT: We examined evidence for nonlinear dynamics in fishery-independent survey data for an assemblage of 26 fish species on Georges Bank spanning the period 1963 to 2008. We used nonlinear time series analysis to determine (1) the presence of nonlinear dynamics in fish popula- tions on Georges Bank, (2) the minimum number of dimensions required to effectively describe system dynamics, (3) the strength of patterns of co-predictability among all possible pairs of fish species, and (4) identification of groups of species characterized by similar dynamics. Here, non- linear behavior refers to non-equilibrium dynamics, including chaos. The population trajectories of all 26 species exhibited strong density-dependent feedback as indicated by a Partial Rate Correlation Function analysis. Significant evidence of complex dynamical behavior was found for approximately 1 in 5 species. Low dimensionality for many of the individual series was identified, suggesting that for a given level of predictability, this system can be represented by a relatively small number of critically important ecological variables. Further, we found high levels of co- predictability among pairwise combinations of individual species. We identified 4 major species groups sharing similar dynamic features on the basis of patterns of co-predictability, and explored potential mechanisms for interpreting the groupings in terms of trophic interactions and life history characteristics. KEY WORDS: Nonlinear system dynamics · Co-predictability · Fish population · Community Resale or republication not permitted without written consent of the publisher
Transcript of Nonlinear dynamic features and co-predictability of the ...

MARINE ECOLOGY PROGRESS SERIESMar Ecol Prog Ser
Vol. 464: 195–207, 2012doi: 10.3354/meps09868
Published September 19
INTRODUCTION
Nonlinear population processes, ecological inter -actions, environmental forcing, and anthropogenicimpacts can individually and collectively generatedramatic patterns of variability in marine ecosystems(Steele & Henderson 1984, Dixon et al. 1999, Hsieh etal. 2005, Anderson et al. 2008). Recognition of theconsequences of this broad spectrum of critical pro-cesses affecting marine systems, and the possibilityof synergistic interactions among them, has led to
calls for dedicated research into the structure, func-tion, and resilience of exploited marine systems(Mangel & Levin 2005, Murawski et al. 2010). An ex -tensive catalogue of multispecies and ecosystemmodeling approaches has now been applied in fish-ery management (Plagányi 2007). These models in -corporate varying levels of mechanistic detail inspecifying key elements of ecosystem structure andfunction. In many instances, the choice of modelstructure and complexity reflects a tradeoff betweenrealism and accuracy due to the potential for in -
© Inter-Research 2012 · www.int-res.com*Email: [email protected]
Nonlinear dynamic features and co-predictability ofthe Georges Bank fish community
Hui Liu1,6,*, Michael J. Fogarty1, Sarah M. Glaser2,7, Irit Altman3, Chih-hao Hsieh4, Les Kaufman5, Andrew A. Rosenberg3, George Sugihara2
1NOAA/NMFS, Northeast Fisheries Science Center, Woods Hole, Massachusetts 02543, USA2Scripps Institution of Oceanography, University of California San Diego, La Jolla, California 92093, USA
3University of New Hampshire, Ocean Process Analysis Lab, Durham, New Hampshire 03824, USA4Institute of Oceanography and Institute of Ecology and Evolutionary Biology, National Taiwan University, Taipei 106, Taiwan
5Boston University Marine Program, 5 Cummington Street, Boston, Massachusetts 02215, USA
6Present address: Department of Marine Biology, Texas A&M University at Galveston, Texas 77553, USA7Present address: College of William and Mary, Williamsburg, Virginia 23185, USA
ABSTRACT: We examined evidence for nonlinear dynamics in fishery-independent survey datafor an assemblage of 26 fish species on Georges Bank spanning the period 1963 to 2008. We usednonlinear time series analysis to determine (1) the presence of nonlinear dynamics in fish popula-tions on Georges Bank, (2) the minimum number of dimensions required to effectively describesystem dynamics, (3) the strength of patterns of co-predictability among all possible pairs of fishspecies, and (4) identification of groups of species characterized by similar dynamics. Here, non-linear behavior refers to non-equilibrium dynamics, including chaos. The population trajectoriesof all 26 species exhibited strong density-dependent feedback as indicated by a Partial Rate Correlation Function analysis. Significant evidence of complex dynamical behavior was found forapproximately 1 in 5 species. Low dimensionality for many of the individual series was identified,suggesting that for a given level of predictability, this system can be represented by a relativelysmall number of critically important ecological variables. Further, we found high levels of co- predictability among pairwise combinations of individual species. We identified 4 major speciesgroups sharing similar dynamic features on the basis of patterns of co-predictability, and exploredpotential mechanisms for interpreting the groupings in terms of trophic interactions and life history characteristics.
KEY WORDS: Nonlinear system dynamics · Co-predictability · Fish population · Community
Resale or republication not permitted without written consent of the publisher

Mar Ecol Prog Ser 464: 195–207, 2012
creased uncertainty in parameter estimation in morecomplex models (Yodzis 1998, Fulton et al. 2003).Uncertainty in specifying the critical structural ele-ments to be included in ecosystem models, however,remains a dominant source of risk and uncertainty formanagement. An alternative and complementary ap -proach is to use a class of phenomenological modelsfit to time series data using nonparametric methodswithout the requirement of specifying a particularmodel structure.
Here, we explored the utility of a flexible class ofnonlinear time series models to assess the complexityof these systems (Sugihara & May 1990, Sugihara1994) and to develop short-term forecasts for a multi-species assemblage of fish species. Application ofthese nonparametric models avoids the dilemma ofspecifying a particular model form while allowingconsiderable flexibility in representing nonlinearecological processes. This general approach hasbeen successfully applied to marine ecosystemdynamics (Dixon et al. 1999, Hsieh et al. 2005, Ander-son et al. 2008, Glaser et al. 2011). These simplermodels can often outperform more complicatedmechanistic models in forecast skill. We applied theconcept of co-predictability to increase forecast skillassociated with relatively short time series data, andto examine possible associations between fish spe-cies in the Georges Bank system. For nonlinear sys-tems, correlations between system components maybe weak or undetectable even if they are dynami-cally coupled because parametric correlation analy-sis will only detect linear associations. Co-predict -ability provides an alternative quantitative measureof model forecast skill and is particularly useful fornonlinear systems. We examined pairwise combina-tions of fish species to assess whether the observedtrajectory of 1 species can be used to model and predict the trajectory of a second species. High co-predict ability between species indicates significantdynamic similarity.
Georges Bank is a highly productive submarineplateau located off the coast of New England (USA).Its distinctive bathymetric and oceanographic char-acteristics result in the development of seasonallyimportant anti-cyclonic circulation with importantimplications for the productivity of the system relatedboth to water mass retention and water column mix-ing (Townsend et al. 2006). Georges Bank has beenthe focus of commercial fishing activity off the south-ern New England coast for several centuries (Ger-man 1987). Intensive harvesting pressure has causedprofound impacts on the composition, abundance,and production of the Georges Bank fish community,
with enduring effects on the overall variability of pro-duction potential and harvestable biomass in this system (Fogarty & Murawski 1998). In this study, weapplied nonlinear time series analysis to fisheries-independent biomass estimates for economically andecologically important members of the fish commu-nity on Georges Bank. We hypothesized that sym-patric marine fish populations tend to be co-predict -able, but not necessarily correlated, because theymay share common life history and dynamical char-acteristics, may interact with each other, and mayrespond to common underlying forcing in a multi-plicative rather than an intrinsically linear way. Wenote that not all co-predictable species are ecologi-cally interacting, and therefore this is not a test fordirect interactions. For example, species which donot interact, but are driven by the same external forcing, may exhibit similar dynamics and thus highco-predictability. Here, our objectives included de -tecting the dynamical features of this system (di -mensionality and nonlinearity), assessing increasesin forecast skill achieved by taking advantage of co-predictability, and categorizing the number of dyna -mically equivalent ecological components in the system as measured by co-predictability.
METHODS
Survey biomass index data
The Northeast Fisheries Science Center (NEFSC)has conducted fall bottom trawl surveys off theNortheast US Continental Shelf since 1963 (Grosslein1969, Azarovitz 1981). Briefly, a stratified randomdesign is employed using a proportional allocationscheme. Vessel and gear characteristics have beenstandardized throughout the survey period. All spe-cies caught are weighed and measured. Biologicalsamples for age determination, food habits, maturity,and pathology are taken according to a length- stratified cluster sampling design. Additional physi-cal measurements are collected at each station.
In this study, we conducted time series analysis ofbiomass indices for 26 fish species (Table 1), collec tedduring the NEFSC fall bottom trawl survey in the pe-riod of 1963 to 2008 on Georges Bank (Fig. 1). Rela tiveabundance data (weight) were corrected for vesseland/or gear differences in the time series on a per-towbasis as required. The stratified mean (expanded)weight-per-tow was then calculated for each speciesof each survey. Prior to nonlinear analyses, fish abun-dance data were first-differenced (Δx = xt − xt –1,
196

Liu et al.: Nonlinear dynamics and co-predictability in fish populations
where t is time) and then standardized (mean = 0, stan-dard devia tion, SD = 1) to remove secular trends andto normalize the time series data. To avoid spuriousdynamics caused by over-differencing, we con duc ted
a Kwiatkowski-Phillips-Schmidt-Shin stationary testfor each individual time series (Kwiatkowski et al.1992) available in an R package (tseries). Prior to first-differencing, 16 of 26 series were non-stationary.However, after first-differencing, all time series werestationary at the p < 0.05 level. Compared to non-differenced time series, first-differencing the 10 sta-tionary time series did not cause significant changesin our assessment of nonlinearity and di mensionality.Therefore, further nonlinear analyses were based onthe first-differenced normalized data for all species.Fluctuations in time series data are shown in Fig. S1in the supplement (www.int-res. com/articles/ suppl/m464p195_supp.pdf), and no apparent autocorrelationpatterns existed after first differencing and standard-ization (Fig. S2 in the supplement).
Nonlinear analysis
Endogenous nonlinear processes of some form area critical pre-requisite for complex dynamical behav-ior. Nonlinear population models have been exten-sively employed in ecological models to represent
197
Group Common name Scientific name Family Code Exploitation status
Gadids Atlantic cod Gadus morhua Gadidae AC E Haddock Melanogrammus aeglefinus Gadidae HD E Pollock Pollachius virens Gadidae PO E Silver hake Merluccius bilinearis Gadidae SH E Red hake Urophycis chuss Gadidae RH E White hake Urophycis tenuis Gadidae WH E
Flatfishes Yellowtail flounder Limanda ferruginea Paralichthyidae YF E Winter flounder Pseudopleuronectes americanus Pleuronectidae WT E American plaice Hippoglossoides platessoides Pleuronectidae AP E Fourspot flounder Paralichtheys oblongus Paralichthyidae FF E Witch flounder Glyptocephalus cynoglossus Pleuronectidae WF E Windowpane flounder Scophthalmus aquosus Scophthalmidae WP E
Other Ocean pout Macrozoarces americanus Zoarcidae OP Uground Goosefish Lophius americanus Lophiidae GO E Longhorn sculpin Myoxocephalus octodecemspinosus Cottidae LS U Cunner Tautogolabrus adspersus Labridae CU U Acadian redfish Sebastes fasciatus Sebastidae AR U
Skates Little skate Leucoraja erinacea Rajidae LK E Winter skate Leucoraja ocellata Rajidae WS E Thorny skate Amblyraja radiata Rajidae TS E Barndoor skate Dipturus laevis Rajidae BS U Smooth skate Malacoraja senta Rajidae SS E
Pelagics Atlantic mackerel Scomber scombrus Scombridae AM E Butterfish Peprilus triacanthus Stromateidae BF E Atlantic herring Clupea harengus Clupeidae AH E
Dogfish Spiny dogfish Squalus acanthias Squalidae DF E
Table 1. Fish species from the Northeast Fisheries Science Center fall bottom survey on Georges Bank. E: exploited; U: unexploited
Fig. 1. Georges Bank eco-region, with survey samples from the shaded strata included in the analysis
Mar Ecol Prog Ser 464: 195–207, 2012
density-dependent dynamics. Many of these deter-ministic models have globally stable equilibriumpoints. A broad spectrum of discrete-time populationmodels can also exhibit complex dynamics rangingfrom oscillatory dynamics to chaos (for a review, seeKot 2001). Systems of coupled differential equationsof order ≥3 can also exhibit complex dynamics. In thefollowing, we reserve the term nonlinear dynamics torefer specifically to dynamic complexity. As a pre-lude, we begin by testing for density-dependenceand then turn to testing for evidence of complexdynamical behavior in the observed time series.
The analysis of many ecological time series hasfocused on estimation of Lyapunov exponents to testfor complex dynamics (e.g. Ellner & Turchin 1995).However, with inevitable process noise, the meaningof such estimates becomes unclear (Sugihara 1994).Here we applied an alternative approach that com-pares forecast skill of linear and nonlinear models tojudge the relative importance of nonlinear dynamicsin the systems examined (Sugihara & May 1990, Sugi -hara 1994). The linear case is taken as the null model.The methods involve a nonparametric modelingscheme and are well established and validated inmany areas of science, but because they are not yetbroadly known in marine ecology, we provide a de -tailed account of the methodology1.
Density dependence
Density-dependent feedback can give rise to non-linear dynamics in biological populations. We testedfor evidence of density-dependent feedback in theindividual time series data using a Partial Rate Correlation Function (PRCF) analysis (Berryman &Turchin 2001, 2003, Royer & Fromentin 2006). Wecalculated the PRCF for the first-order finite differ-ence (log Nt − logNt–1) against the lagged biomassindexes (log Nt–1, log Nt–2, …etc.) of time series for 26fish populations on Georges Bank. The significanceof PRCF was tested by Bartlett’s criterion ,where n is the length of the time series at lag 1 (Box &Jenkins 1976). Because density dependence (broadlydefined) is a necessary but insufficient condition forcomplex dynamics, we next test for non-equilibriumdynamics explicitly.
Nonlinear dynamics
To test for evidence of complex nonlinear dynamicsin the Georges Bank fish population estimates, webuild on 2 critical elements: (1) identification of thedimensionality of the (unobserved) underlying eco-logical system based on past values of a restrictednumber of measured variables, and (2) application ofa nonlinear time series analysis to estimate the pres-ence of nonlinearity in the empirical time series. Akey component of the approach throughout is the useof out-of-sample forecast skill as the determinant ofthe ‘best’ model. For the case of a single time series,the general approach involves splitting the series andbuilding the model using one portion of the data (re -ferred to as the library set) while reserving the with-held portion to test the model (the prediction set). Weused this approach to estimate dimensionality andclassify nonlinearity in the individual time series. Wealso employed a related approach by which modelsbuilt from all observations of 1 species were used topredict a second species. This is referred to as co-prediction and was done for all pairwise combina-tions of species.
To set the stage, consider a generalized represen-tation of an ecological variable (e.g. population sizeor biomass) as a function of its past values:
(1)
where X is the variable of interest, g{.} is an unspeci-fied function, L is a specified lag period, and D is thenumber of past values needed to capture the dynam-ics of the system. Difference equations of this generalform have been extensively used in ecology to modelpopulation processes. May (1976) provided a cata-logue of models for the case L = D = 1, and Turchin(1990) explored the use of second-order differenceequations (L = 2; D = 1) to assess delayed densitydependence in single-species population models. Ifthe model is intrinsically linear, we have a simpleautoregressive model of the type used extensively forforecasting (Box & Jenkins 1976).
Lagged coordinate embeddings
The modeling approach we used is nonparametricin the sense that there is no specified functional form.Rather, our approach involves interpreting the timeseries as having been produced from dynamics thatreflect motion on an attractor (see Fig. 2). We addressthe inverse problem and reconstruct the attractor(and the coordinate space it occupies) from the time
±2 n
X g X X X Xt t L t L t L t DL= − − − −{ , , ,... }2 3
198
1Readers seeking to apply the method are encouraged tocontact the Sugihara Lab (email: [email protected]) forguidance and access to software. An introduction to the basic simplex method is available at http://deepeco.ucsd.edu/simplex/

Liu et al.: Nonlinear dynamics and co-predictability in fish populations
series. Our task is to use an observed time series toattempt a reconstruction of key elements of the sys-tem as a whole. Although the true dimensionality ofthe system is unknown and potentially very high, itcan be shown that an understanding of the number ofkey dimensions affecting the variable(s) of interestcan be determined from the histories recorded in thetime series. In practice, the effective dimensionalityrequired of the system to achieve significant predict -ability is often relatively low (Sugihara & May 1990,Sugihara 1994).
For a hypothetical 3-species system with no exo -genous forcing factors, the dimensionality of the sys-tem would be 3 and we construct a 3-dimensionalphase space with each of the species arrayed alongone of the axes. We can further track the trajectory(temporal evolution) of each species in this phasespace. If there is a globally stable equilibrium pointfor each of the 3 species, the trajectories will con-verge to a set of 3 points. These points are attractorsin the phase space. More complicated dynamics(e.g. limit cycles, chaotic processes) will trace differ-ent geometries (attractors) in the phase space (seebelow).
In a remarkable theorem, Takens (1981) showedthat a time-delayed coordinate system such as Eq. (1)contains information not only about the measuredvariable itself but also about a set of unobserved butrelated variables (in our context, other species, envi-ronmental variables, etc.). In effect, the broader di -mensions of the system can be captured by a morelimited set of observations on one or more variablesif the system is principally driven by deterministicprocesses. Takens’ key insight was that the basicproperties of the phase space for the overall system
can be reconstructed by examining the time-delayed structure of just 1 of the variables.Deyle & Sugihara (2011) provided a general-ization of Takens’ approach to take advantageof the case where multiple time series fromthe same system are available for analysis.
The resulting geometric shape in phasespace is directly related to the true underly-ing attractor, giving a ‘shadow’ attractor. Anexample of translating a time series into aphase space representation by plotting thetime-delayed coordinates is shown in Fig. 2.From Eq. (1), the dimensionality of the sys-tem, D, can be estimated by the embeddingdimension (E). To do this, we transform thetime series into a vector space comprising thetime-delayed coordinate system. All methodsof nonlinear time series analysis used to
assess dynamic complexity employ time-delay co -ordinate systems (or embeddings) as the foundationfor determining the dimensionality of the system (fora readable account, see Kaplan & Glass 1995).
The embedding dimension (or minimum dimen-sionality of the full system) is the minimum number oflagged variables needed to unfold the attractor sothat trajectories do not cross. Higher dimensionalembeddings can also fully resolve the dynamics, butthey introduce greater uncertainty due to contamina-tion of nearby points in the higher dimensionalembeddings with points whose earlier coordinatesare close, but whose recent coordinates are distant(Sugihara & May 1990).
In the following, we first used a simple nearest-neighbor forecasting algorithm to provide an esti-mate of the minimum dimensionality of the system(E). We sequentially identified points in the phasespace and tracked these and their nearest neighborsin a forward projection. These nearby points repre-sented similar past events on the shadow attractor inthe phase space. For a chaotic system, these pointswill diverge exponentially with time; however, forshort forecast periods, they will retain a connectionwith the recent past. We defined nearest neighbors inEuclidean phase space using the conventional repre-sentation:
(2)
where is a suitable vector norm for variable y.Our identification of nearest neighbors depends crit-ically on the embedding dimension. The set of E + 1nearest neighbors is the minimum number of pointsneeded to uniquely define the location of Xt in E-dimensional space. These points define a simplex.
min X Xt i−
y
199
Fig. 2. Example of a hypothetical time series and corresponding 3-dimensional embedding for this series

Mar Ecol Prog Ser 464: 195–207, 2012
For a 2-dimensional system, we required a minimumof 3 points to define the vertices of the simplex(Fig. 3). Higher dimensional embeddings result in amore complex simplex structure. For a 3-dimensionalsystem, the simplex is a tetrahedron (pyramid) andso on. We sequentially increased E to a maximum of10 and determined the ‘best’ embedding dimensionbased on the forecast skill (described below) of eachmodel. Limitations on the length of the availableseries precluded examination of E greater than 10.To generate a forecast, we used an exponentiallyweighted average of the values given by the positionof nearest neighbor vectors yi at time T + 1:
(3)
where the weighting wj is determined by the locationof Xt relative to the nearest neighbor vectors at Tand applied at T + 1. Thus, the forecast is made basedon the assumption that, when the ‘best’ E is selectedto reconstruct the attractor, the trajectory of the pre-diction vector at T + 1 can be calculated based on thetrajectories of the nearest library vectors on theattractor at time T. Recall that here we only variedthe number of dimensions to include in the analysisand then calculated the resulting mean forecastbased on the average of the points defining the sim-plex. The choice of the embedding dimension pro-ducing the highest forecast skill was selected as‘best’ for this simplex projection. We defined forecastskill, or ρ, as the correlation coefficient between theobserved and model-generated values of each .
We next examined evidence for the degree of non-linearity in the series using a simple form of nonpara-metric regression based on locally weighted maps,using the best E estimated by simplex projection.These locally weighted maps are known as S-maps(Sugihara 1994). Previous work (Sugihara 1994) indi-cated that the performance of the S-map procedureis superior to simplex projection for systems withshort, noisy time series. As in simplex projection, thetime series is decomposed into lagged-coordinatevectors and divided into library and prediction sets.In S-map, the location of the forecast for the predic-tion vector in embedded space is predicted by thelocation of all library vectors, not only the nearestneighbors (as in simplex projection), with heavyweightings given locally to library vectors nearest toprediction points. Again, the distances (in embeddedspace) from the library vectors to the prediction vec-tors are used to generate forecasts. Specifically, forthe unknown forecast of prediction vector xt,given library vectors {xi} and setting xt(0) ≡ 1 for theconstant term in the solution of Eq. (4):
(4)
where c is solved using singular value decompositionas:
b = Ac (5)
where A contains elements for the library (predictor)set:
(6)
b contains the elements for the prediction set:
(7)
The weighting function w is defined as
(8)
where d is the Euclidean distance between anylibrary vector (xi) and the prediction vector xt, is themean distance computed from all library vectors {xi}to the prediction vector, and θ is a nonlinear tuningparameter that gives variable weight to library vec-tors when generating the forecast. When θ = 0, alllibrary vectors are given equal weight and we havea linear model (essentially, a vector autoregressive,AR, model of order E). For a series of nonlinear mod-els, θ > 0, and the library vectors nearest the predic-tion vector are weighted according to Eq. (8). Thus, anonlinear model gives greater weight to the neigh-borhood immediately surrounding the predictionvector. These nearby trajectories contain more simi-lar recent information on the attractor, resulting inhigher forecast skill if the system displays nonlinear
yt
yt
ˆ ( ) ( )y c j x jt t tj
E
==∑
0
A w x x x jij i t i( ) ( )= −
b w x x yi i t i= −( )
w d d d( ) /= −e θ
d
ˆ ( )y w x jt jj
E
==∑
0
200
Fig. 3. Example of a simplex projection for a time series em-bedded in 2 dimensions (D = 2, where D is the dimension -ality of the system) showing the 1-step-ahead forecast for 1point (dot) and its nearest neighbors from a library set. Forthis 2-dimensional system, 3 nearest neighbors define thesimplex. The shaded triangle encloses the simplex. The pro-jection for the simplex is shown by the shaded triangle on
the right-hand side
Liu et al.: Nonlinear dynamics and co-predictability in fish populations
behavior (Sugihara 1994). We applied a correlationcoefficient (ρ) and mean absolute error (MAE) be -tween predictions and observations to representmodel performance, and the decrease in forecasterror (ΔMAE) to measure nonlinearity. Nonlinearitywas identified by a nonparametric randomization testfor a significant decrease in model error (negativeΔMAE) as θ was tuned above 0 (Hsieh & Ohman2006), with a cutoff p-value at 0.05 significance level.
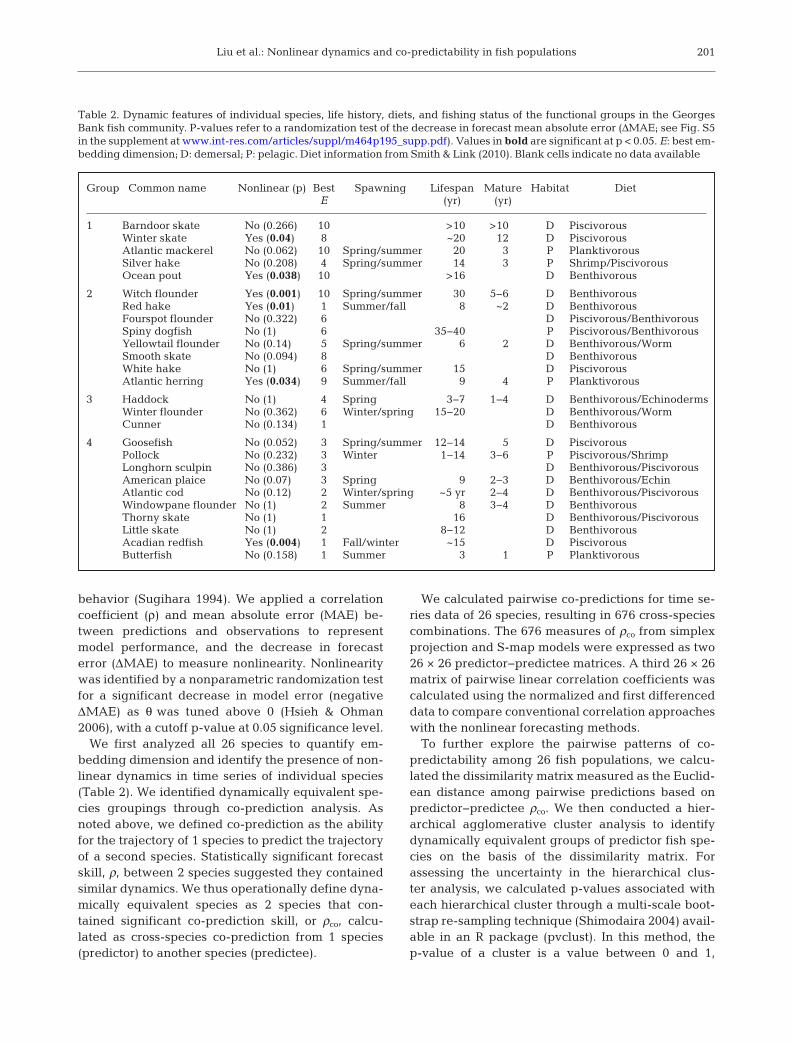
We first analyzed all 26 species to quantify em -bedding dimension and identify the presence of non-linear dynamics in time series of individual species(Table 2). We identified dynamically equivalent spe-cies groupings through co-prediction analysis. Asnoted above, we defined co-prediction as the abilityfor the trajectory of 1 species to predict the trajectoryof a second species. Statistically significant forecastskill, ρ, between 2 species suggested they containedsimilar dynamics. We thus operationally define dyna -mically equivalent species as 2 species that con -tained significant co-prediction skill, or ρco, calcu-lated as cross-species co-prediction from 1 species(predictor) to another species (predictee).
We calculated pairwise co-predictions for time se -ries data of 26 species, resulting in 676 cross-speciescombinations. The 676 measures of ρco from simplexprojection and S-map models were expressed as two26 × 26 predictor−predictee matrices. A third 26 × 26matrix of pairwise linear correlation coefficients wascalculated using the normalized and first differenceddata to compare conventional correlation approacheswith the nonlinear forecasting methods.
To further explore the pairwise patterns of co-predictability among 26 fish populations, we calcu-lated the dissimilarity matrix measured as the Euclid-ean distance among pairwise predictions based onpredictor−predictee ρco. We then conducted a hier -archical agglomerative cluster analysis to identifydynamically equivalent groups of predictor fish spe-cies on the basis of the dissimilarity matrix. Forassessing the uncertainty in the hierarchical clus -ter analysis, we calculated p-values associated witheach hierarchical cluster through a multi-scale boot-strap re-samp ling tech nique (Shimodaira 2004) avail-able in an R package (pvclust). In this method, thep-value of a cluster is a value between 0 and 1,
201
Group Common name Nonlinear (p) Best Spawning Lifespan Mature Habitat Diet E (yr) (yr)
1 Barndoor skate No (0.266) 10 >10 >10 D Piscivorous Winter skate Yes (0.04) 8 ~20 12 D Piscivorous Atlantic mackerel No (0.062) 10 Spring/summer 20 3 P Planktivorous Silver hake No (0.208) 4 Spring/summer 14 3 P Shrimp/Piscivorous Ocean pout Yes (0.038) 10 >16 D Benthivorous
2 Witch flounder Yes (0.001) 10 Spring/summer 30 5−6 D Benthivorous Red hake Yes (0.01) 1 Summer/fall 8 ~2 D Benthivorous Fourspot flounder No (0.322) 6 D Piscivorous/Benthivorous Spiny dogfish No (1) 6 35−40 P Piscivorous/Benthivorous Yellowtail flounder No (0.14) 5 Spring/summer 6 2 D Benthivorous/Worm Smooth skate No (0.094) 8 D Benthivorous White hake No (1) 6 Spring/summer 15 D Piscivorous Atlantic herring Yes (0.034) 9 Summer/fall 9 4 P Planktivorous
3 Haddock No (1) 4 Spring 3−7 1−4 D Benthivorous/Echinoderms Winter flounder No (0.362) 6 Winter/spring 15−20 D Benthivorous/Worm Cunner No (0.134) 1 D Benthivorous
4 Goosefish No (0.052) 3 Spring/summer 12−14 5 D Piscivorous Pollock No (0.232) 3 Winter 1−14 3−6 P Piscivorous/Shrimp Longhorn sculpin No (0.386) 3 D Benthivorous/Piscivorous American plaice No (0.07) 3 Spring 9 2−3 D Benthivorous/Echin Atlantic cod No (0.12) 2 Winter/spring ~5 yr 2−4 D Benthivorous/Piscivorous Windowpane flounder No (1) 2 Summer 8 3−4 D Benthivorous Thorny skate No (1) 1 16 D Benthivorous/Piscivorous Little skate No (1) 2 8−12 D Benthivorous Acadian redfish Yes (0.004) 1 Fall/winter ~15 D Piscivorous Butterfish No (0.158) 1 Summer 3 1 P Planktivorous
Table 2. Dynamic features of individual species, life history, diets, and fishing status of the functional groups in the GeorgesBank fish community. P-values refer to a randomization test of the decrease in forecast mean absolute error (ΔMAE; see Fig. S5in the supplement at www.int-res.com/articles/suppl/m464p195_supp.pdf). Values in bold are significant at p < 0.05. E: best em-bedding dimension; D: demersal; P: pelagic. Diet information from Smith & Link (2010). Blank cells indicate no data available

Mar Ecol Prog Ser 464: 195–207, 2012
indicating how strongly the data sup-port the cluster. Briefly, the pvclustpackage performs hierarchical clusteranalysis via function hclust and auto-matically computes p-values for allclusters contained in the clustering oforiginal data. It provi des 2 types ofp-values: approximately unbiased (au)and bootstrap probability. We usedthe ‘au’ p-value calculation becauseit provided a better ap proximation ofan unbiased p-value than alternativemethods.
RESULTS
Density dependence
The PRCF plots displayed a highlysignificant first-order negative density-dependent feedback for all 26 timeseries plus weak and relatively higher-order negative feedback for somefish species on Georges Bank (Fig. S3in the supplement at www.int-res.com/articles/ suppl/ m464p195_supp. pdf).This set the stage for further examination of whetherthe underlying dyna mics are stable or unstablethrough nonlinear time series analysis.
Nonlinear time series analysis
The results of single-species analysis by simplexprojection models disclosed a pattern of relativelylow dimensionality for the Georges Bank fish com-munity (Table 2, Fig. S4 in the supplement). Forecastskill (ρ) varied considerably among species. The S-map forecast models demonstrated evident nonlinearbehaviors in 6 of 26 time series of fisheries-indepen-dent re lative biomass indices based on a nonpara-metric randomization test of ΔMAE at a 0.05 level(Fig. S5).
Nonlinear co-predictability
Many pairwise combinations of results from thesimplex projection (Fig. 4) and S-map models (Fig. 5)showed significant co-predictability. S-map modelpredictions tended to be stronger than simplex pro-jection models for producing co-prediction measures
(ρco). In contrast, the ordinary correlation analysisrevealed a different pattern of species interactionsamong the Georges Bank fish community. Most spe-cies appeared to have only moderate positive or neg-ative association (Fig. 6). To interpret these results,we should note the symmetrical structure of the cor-relation coefficient matrix in contrast to the non -symmetrical matrices of the co-prediction measuresfrom simplex pro jection and S-map models. The co-prediction matrices calculated from the nonlinearmodels should not be considered equivalent to thecorre lation coefficients from the ordinary correlationanalysis under linear assumptions of classical statis-tics. In particular, one should not expect identical ρfor each pairwise component when swapping thedirection of predictor and predictee. This is be causethe singular forecast for the predictee species is con-structed from the multiple trajectories of the E + 1nearest neighbor vectors from the predictor species;symmetry is structurally implausible.
Dynamically equivalent units
The cluster analysis revealed 4 main dynamicallyequivalent groups (Table 2) with high probability
202
Fig. 4. Co-prediction coefficient matrix from a simplex projection model rep-resents the dynamical connection among the Georges Bank fish community.
Species codes listed in Table 1

Liu et al.: Nonlinear dynamics and co-predictability in fish populations
based on the dissimilarity of co-predictability (ρco; Fig. 7). The firstgroup included barndoor skate, winterskate, silver hake, ocean pout, andAtlantic mackerel at a probability of96%. The second group containedhaddock, winter flounder, and cunnerwith 89% probability. Witch flounder,red hake, fourspot flounder, spinydog fish, smooth skate, white hake,and Atlantic herring comprised thethird group. All other species weregrouped in the fourth cluster. Thesegroupings differ from classificationsone would expect based solely ontaxo nomic affinity. Here, groupingsem er ged based on similarity in theirco-predictability (dy namic equiva -lence) for other species, and thus,these groupings reflect a combinationof si m ilarities in life history and dy -namical characteristics, possible bio ticinter actions, and common natural andanthro pogenic forcing.
DISCUSSION
Density-dependent dynamics
Understanding dynamic features ofbiological populations (i.e. nonlinear-ity and dimensionality) is a criticalstep for modeling and forecastingcomplex systems (Sugihara & May1990, Sugihara 1994). Analysis of ecological time series provides cluesfor understanding the underlyingcausal structure driving the observeddy namics. PRCF is a useful tool fordetecting density-dependent struc-ture in ecological time series (Berry-man & Tur chin 2001). In general, negative feedback of the first orderusually re p resents intraspecific inter-actions, while negative feedback ofthe second order often results frominter actions between species, particu-larly between con sumers and theirresources (Roy a ma 1992, Berryman1999, Turchin 2003). In the presentstudy, a significant first-order nega-tive feedback was found for all 26
203
Fig. 5. Co-prediction coefficients matrix from an S-map prediction modelrepresents the dynamical connection among the Georges Bank fish
community. Species codes listed in Table 1
Fig. 6. Correlation coefficient matrix of the Georges Bank fish community. Species codes listed in Table 1

Mar Ecol Prog Ser 464: 195–207, 2012
species. This suggests that intraspecific density-dependent regulation is common among the speciesconsidered in this ana lysis.
Although density-dependent feedback was foundin the fish community on Georges Bank, we shouldnote that the driving processes behind the observa-tions remain hidden. In general, negative feedbackoperates through competition for environmentalresources (food or living space), higher death ratesdue to starvation, cannibalism, predation, or disease.We found complex nonlinear dynamics in about one-fifth of the fish populations on Georges Bank. Wenote that observational error and stochasticity canobscure underlying nonlinear dynamics but that themethods used in this study have proven relativelyrobust in the face of noise (e.g. Sugihara & May1990).
Nonlinear dynamics of the Georges Bank fish community
Our findings clearly indicate that the dynamics ofthis fish assemblage are generally characterized bylow dimensionality, which is consistent with findingsfrom studies of time series data of various marinefisheries populations in other ecosystems from theGreat Barrier Reef, Australia, to the west Pacific coastof North America and the Mediterranean (Dixon etal. 1999, Hsieh et al. 2005, Royer & Fromentin 2006,Anderson et al. 2008, Glaser et al. 2011). Low dimen-sionality implies that the system can be further modeled with few variables to achieve relativelyhigh forecast skill and explored to illuminate the keyprocesses driving the system using a multivariateembedding technique (see Dixon et al. 1999). The
204
Fig. 7. Dendrogram for finding the dynamically equivalent groups among 26 fish populations at Georges Bank based on theirco-predictability computed from the S-map models. Species codes listed in Table 1. au: approximately unbiased probability;
bp: bootstrap probability

Liu et al.: Nonlinear dynamics and co-predictability in fish populations
S-map modeling approach provides a useful way toidentify nonlinearity in a stationary time series by thedifference in forecast skill achieved with a nonlinearmodel versus a linear model. For complex systemswith higher dimensionality and strong nonlinear sig-nals, S-map usually produces higher forecast skill(Sugihara 1994). This might explain why the S-mapapproach tended to be more successful than the sim-plex projection model for our time series data. Thesedata are characterized by low dimensionality andapparent nonlinear signatures.
We note that temporal and spatial scales are criticalissues in terms of model forecast skill (Sugihara 1994,Hsieh et al. 2008, Glaser et al. 2011). In the presentstudy, the moderate time series length (~45 yr) andrelatively broad spatial coverage of the study areamight lessen the possibility of detecting nonlinearbehaviors, as spatial averaging tends to mask localnonlinearity and accentuate linear autoregressivesig nals. Ex tending length through concatenatingtime series data (Hsieh et al. 2008), or analysis of spa-tially structured data (Glaser et al. 2011), can im -prove forecast skill and the detection of nonlineardynamics by effectively increasing sample size. Inany event, the spatial and temporal scales employedin this analysis are well suited for management appli-cations on Georges Bank. Given the temporal lengthand spatial resolution of this study, results from thesimplex projection and S-map forecast models in thisstudy showed promise for identifying nonlinearityand complexity within the fish community onGeorges Bank (see Figs. S4 & S5 in the supplement atwww.int-res.com/ articles/ suppl/ m464p195_supp. pdf).Successful development of short-term forecasts canbe quite useful in management for quota setting andother applications.
Co-predictability and dynamically equivalent units
By definition, co-predictability indicates that an ex planatory variable or a collection of explanatoryvariables can be used to improve out-of-sample prediction of the trajectory of another dynamicallydependent variable. In this study, we examineddynamical equivalence among species within the fishcommunity on Georges Bank. Co-predictability as aquantitative measure of model forecast skill is par-ticlarly useful for nonlinear systems where normalcorrelations between system components may beweak or undetectable even if they are dynamicallycoupled. In stable linear systems, correlation shouldbe sufficient to identify links between coupled com-
ponents. However, in nonlinear systems, correlationanalysis and linear models are not sufficient to detectdynamic linkages. Co-prediction, by design, is ableto accommodate both linear and nonlinear linkagesbetween components and can identify underlyingdynamical connections that correlation or other lin-ear approaches may fail to detect. Thus, co-predict -ability can be used for finding relevant sets of systemcomponents to objectively characterize marine eco -systems that share common dynamical features. Co-prediction alone, however, is not sufficient to identifycausal connections among species.
We identified 4 dynamically equivalent groups offish species based on a cluster analysis using the co-predictability results. In general, the grouped speciestend to share more or less similar dynamical features(i.e. dimensionality and nonlinearity), and life historytraits and feeding habits (Table 2). Recent hypothe-ses have proposed that ecologically equivalent spe-cies sharing analogous topological attributes in a sys-tem space can be predicted from the time series ofother equivalent species using the simplex projectionand S-map techniques (Hsieh et al. 2008). Conver -sely, significant co-predictability in the time seriesdata of the Georges Bank fish community derivedfrom these nonlinear analyses presumably indicatesthat these fish species likely come from dynamicallyequivalent groups or ones responding to commonunderlying mechanisms such as environmental andfishing-related forcing.
Ecological dynamics of communities reflect morethan the sum of their parts (Mangel & Levin 2005). Tointerpret the groupings of dynamically equivalentunits classified based on co-predictability, we notethat our findings are not explicitly based on eithertrophodynamic or habitat analyses. However, tropho -dynamic mechanisms may underlie some of theobserved patterns of co-predictability in our analysesbecause species in this study with relatively high co-predictability often showed similar feeding patternsor reflected predator−prey interactions (Table 2). Forexample, dynamically grouping winter skate andbarndoor skate together is consistent with our know -ledge based on life history characteristics, spatial dis-tributions, and diet. Both are benthic invertebratefeeders and piscivores with relatively consistent dietstructure over spatial and seasonal time scale scales(Smith & Link 2010). Overlap in feeding habits forspecies within the dynamically equivalent groupsalso exists for other groups. Many gadid speciesincluded in this study are known to prey extensivelyon pelagic species such as herring, mackerel, andbutterfish (Grosslein et al. 1980), while mackerel and
205

Mar Ecol Prog Ser 464: 195–207, 2012
herring can also be voracious predators on early lifestages of groundfishes (Pepin et al. 1987). Therefore,behind commonly observed negative correlationsamong pelagics, gadids, and flatfishes hides a quitedifferent picture of dynamic connection among them(see Figs. 4−6). We note that most fish species in theGeorges Bank system tend to be generalist carni-vores with moderate dietary overlap, and many spe-cies also show strong ontogenetic shifts in diet (Bow-man & Michael 1984, Garrison & Link 2000a,b).
A generalized competitive release due to the re -moval of historically dominant groundfishes by fishingactivities may have caused increases in histo ricallyunderexploited species on Georges Bank (Fogarty &Murawski 1998). We can expect that species subjectto similar external forcing mechanisms exhibit com-mon features in their dynamics. A diffuse competitiverelease may have explained the ob served patterns ofnegative correlations but positive co-predictions inthe Georges Bank fish community. For example, co-predictability among species of skates, flatfishes, andgadids may be related to competitive release followingthe extensive removal of flatfishes and gadids in the1970s. Skates are considered potential competitors offlatfishes and gadids and share relatively high levelsof diet similarity with haddock, yellowtail flounder,and winter flounder (Grosslein et al. 1980). We notethat, in general, diet overlap within the fish commu-nity of the Northeast Continental Shelf Large MarineEcosystem (NES LME) is moderate (Smith & Link2010), and if competitive release is important, it likelyoperates in a diffuse manner at a broad system level.
Intrinsic population processes, environmental vari-ability, and harvesting are 3 major causes of nonlin-ear fluctuations and dynamic complexity in marinefisheries populations. In this study, we have identi-fied negative density-dependent feedback as a po -tentially important mechanism; however, we did notexplicitly address the effects of environmental varia-tion and fishing pressure in understanding systemdynamics. Fishing pressure can magnify the non -linear fluctuations in fish abundance (Anderson et al.2008), while climate variability can cause alterationsin the spatial distributions of fish populations (Nye etal. 2009). These 2 processes tend to act synergisti-cally on the variability of fish population dynamics(Hare et al. 2010, Planque et al. 2010).
Relevance to management
Traditional fisheries management has focused on asingle-species approach designed to maximize the
long-term sustainable yield of target species. As pro -gress toward implementing ecosystem-based fisheriesmanagement unfolds, development of tools to evalu-ate aspects of ecosystem structure becomes increas-ingly important. The initial motivation of this workwas to assess possible approaches to complement andaugment traditional ecosystem modeling approaches.A lack of understanding of ecosystem structure andfunction limits our ability to develop successfulecosystem-based management plans and to con -duct ef fective ecosystem comparisons in the oceans(Megrey et al. 2009, Murawski et al. 2010). This studyrepresents an effort to overcome these obstacles, par-ticularly the issue of uncertainty of the appropriatefunctional forms to be included in multispecies/ecosystem models. Our results indicate that the effec-tive dimensionality of the fish community in theGeorges Bank system is relatively low. Further, evi-dence of co-predictability between fish populationsde rived in these nonlinear time series models pointsto important inter-relationships or common underlyingforcing mechanisms influencing species within thefish assemblage. The traditional ap proaches to defin-ing species assemblages in marine ecosystems (e.g.by size, taxonomic affinity, etc.) can be expanded toinclude consideration of the under lying dynamicalfeatures of the system components.
Acknowledgements. We thank all those who participated inthe NEFSC bottom trawl surveys over many years. We thankJ. Link, B. Shank, E. Klein, H. Ye, E. Deyle, and L. Storch fordiscussion of this work. We are grateful for the constructivereviews from F. M. Serchuk and 4 anonymous referees. Thisis CAMEO contribution number 9, a joint program fundedby the National Science Foundation and the NationalOceanic and Atmospheric Administration.
LITERATURE CITED
Anderson CNK, Hsieh CH, Sandin SA, Hewitt R and others(2008) Why fishing magnifies fluctuations in fish abun-dance. Nature 452: 835−839
Azarovitz TR (1981) A brief historical review of the WoodsHole Laboratory trawl survey time series. Can Spec PublFish Aquat Sci 58: 62−67
Berryman A (1999) Principles of population dynamics andtheir application. Stanley Thornes, Cheltenham
Berryman A, Turchin P (2001) Identifying the density- dep endent structure underlying ecological time series.Oikos 92: 265−270
Bowman RE, Michael WL (1984) Food of seventeen speciesof Northwest Atlantic fish. NOAA Tech Memo NMFS-F/NEC−28. Northeast Fisheries Science Center, WoodsHole, MA
Box GEP, Jenkins GM (1976) Time series analysis: forecast-ing and control. Holden Day, Oakland, CA
206

Liu et al.: Nonlinear dynamics and co-predictability in fish populations
Deyle ER, Sugihara G (2011) Generalized theorems for non-linear state space reconstruction. PLoS ONE 6: e18295
Dixon PA, Milicich MJ, Sugihara G (1999) Episodic fluctua-tions in larval supply. Science 283: 1528−1530
Ellner SP, Turchin P (1995) Chaos in a noisy world: newmethods and evidence from time-series analysis. Am Nat145: 343−375
Fogarty MJ, Murawski SA (1998) Large-scale distributionand the structure of marine systems: fishery impacts onGeorges Bank. Ecol Appl 8(Suppl): s6−s22
Fulton EA, Smith ADM, Johnson CR (2003) Effect of com-plexity on marine ecosystem models. Mar Ecol Prog Ser253: 1−16
Garrison LP, Link JS (2000a) Fishing effects on spatial distri-bution and trophic guild structure of the fish communityin the Georges Bank region. ICES J Mar Sci 57: 723−730
Garrison LP, Link JS (2000b) Dietary guild structure of thefish community in the Northeast United States continen-tal shelf ecosystem. Mar Ecol Prog Ser 202: 231−240
German AW (1987) History of the early fisheries: 1720−1930.In: Backus RH (ed) Georges Bank. MIT Press, Cam-bridge, MA, p 409−424
Glaser SM, Ye H, Maunder M, MacCall A, Fogarty MJ, Sug-ihara G (2011) Detecting and forecasting complex non-linear dynamics in spatially-structured catch-per-unit-effort time series for North Pacific albacore (Thunnusalalunga). Can J Fish Aquat Sci 68: 400−412
Grosslein MD (1969) Groundfish survey program of BFCWoods Hole. Commer Fish Rev 31: 22−35
Grosslein MD, Langton R, Sissenwine MP (1980) Recentfluctuations in pelagic fish stocks in the Northwest At -lantic, Georges Bank region in relation to species inter-actions. Rapp PV Reùn Cons Int Explor Mer 177: 374−405
Hare JA, Alexander MA, Fogarty MJ, Williams EH, Scott JD(2010) Forecasting the dynamics of coastal fishery spe-cies using a coupled climate-population model. EcolAppl 20: 452−464
Hsieh CH, Ohman MD (2006) Biological responses to envi-ronmental forcing: the linear tracking window hypo -thesis. Ecology 87: 1932−1938
Hsieh CH, Glaser SM, Lucas AJ, Sugihara G (2005) Distin-guishing random environmental fluctuations from eco-logical catastrophes for the North Pacific Ocean. Nature435: 336−340
Hsieh CH, Anderson CNK, Sugihara G (2008) Extendingnonlinear analysis to short ecological time series. Am Nat171: 71−80
Kaplan D, Glass L (1995) Understanding nonlinear dynam-ics. Springer-Verlag, New York, NY
Kot M (2001) Elements of mathematical ecology. CambridgeUniversity Press, Cambridge
Kwiatkowski D, Phillips PCB, Schmidt P, Shin Y (1992) Test-ing the null hypothesis of stationarity against the alterna-tive of a unit root. J Econom 54: 159−178
Mangel M, Levin P (2005) Regime, phase and paradigmshifts: making community ecology the basic science forfisheries. Philos Trans R Soc Lond B Biol Sci 360: 95−105
May RM (1976) Simple mathematical models with verycompli cated dynamics. Nature 261: 459−467
Megrey BA, Link JS, Hunt GL Jr, Moksness E (2009) Com-parative marine ecosystem analysis: applications,opportunities, and lessons learned. Prog Oceanogr 81: 2−9
Murawski SA, Steele JH, Taylor P, Fogarty MJ, SissenwineMP, Ford M, Suchman C (2010) Why compare marineecosystems? ICES J Mar Sci 67: 1−9
Nye JA, Link JS, Hare JA, Overholtz WJ (2009) Changingspatial distribution of fish stocks in relation to climateand population size on the Northeast United States con-tinental shelf. Mar Ecol Prog Ser 393: 111−129
Pepin PS, Pearre S Jr, Koslow JA (1987) Predation on larvalfish by Atlantic mackerel, Scomber scombrus, with acomparison of predation by zooplankton. Can J FishAquat Sci 44: 2012−2018
Plagányi ÉE (2007) Models for an ecosystem approach tofisheries. FAO Fish Tech Pap 477. FAO, Rome
Planque B, Fromentin JM, Cury P, Drinkwater KF, JenningsS (2010) How does fishing alter marine populations andecosystems sensitivity to climate? J Mar Syst 79: 403−417
Royama T (1992) Analytical population dynamics. Chapman& Hall, London
Royer F, Fromentin JM (2006) Recurrent and density- dependent patterns in long-term fluctuations of Atlanticbluefin tuna trap catches. Mar Ecol Prog Ser 319: 237−249
Shimodaira H (2004) Approximately unbiased tests of re -gions using multistep-multiscale bootstrap resampling.Ann Stat 32: 2616−2641
Smith BE, Link JS (2010) The trophic dynamics of 50 finfishand 2 squid species on the Northeast U.S. continentalshelf. NOAA Tech Memo NMFS-NE-216. NortheastFisheries Science Center, Woods Hole, MA
Steele JH, Henderson EW (1984) Modeling long-term fluctuations in fish stocks. Science 224: 985−987
Sugihara G (1994) Nonlinear forecasting for the classifica-tion of natural time-series. Philos Trans R Soc Lond AMath Phys Eng Sci 348: 477−495
Sugihara G, May RM (1990) Nonlinear forecasting as a wayof distinguishing chaos from measurement error in timeseries. Nature 344: 734−741
Takens F (1981) Detecting strange attractors in turbulence.Lect Notes Math 898: 366−381
Townsend DW, Thomas AC, Mayer LM, Thomas M, QuinlanJ (2006) Oceanography of the Northwest Atlantic Con -tinental Shelf. In: Robinson AR, Brink KH (eds) The Sea,Vol 14A. Harvard University Press, Cambridge, MA,p 119−168
Turchin P (1990) Rarity of density dependence or populationregulation with lags? Nature 344: 660−663
Turchin P (2003) Complex population dynamics: a theoretical/empirical synthesis. Princeton University Press, Princeton,NJ
Yodzis P (1998) Local trophodynamics and the interaction ofmarine mammals and fisheries in the Benguela eco -system. J Anim Ecol 67: 635−658
207
Editorial responsibility: Matthias Seaman, Oldendorf/Luhe, Germany
Submitted: November 17, 2010; Accepted: June 6, 2012Proofs received from author(s): September 6, 2012