Noninvasive individual and species identification of ... · claudia wultsch,*† lisette p....
12
Noninvasive individual and species identification of jaguars (Panthera onca), pumas (Puma concolor) and ocelots (Leopardus pardalis) in Belize, Central America using cross-species microsatellites and faecal DNA CLAUDIA WULTSCH,* † LISETTE P. WAITS ‡ andMARCELLA J. KELLY* *Department of Fish and Wildlife Conservation, Virginia Tech, 100 Cheatham Hall, Blacksburg, VA 24061, USA, †Sackler Institute for Comparative Genomics, American Museum of Natural History, 79th Street at Central Park West, New York, NY 10024, USA, ‡Department of Fish and Wildlife Resources, University of Idaho, 875 Perimeter Drive MS 1136, Moscow, ID 83844, USA Abstract There is a great need to develop efficient, noninvasive genetic sampling methods to study wild populations of multi- ple, co-occurring, threatened felids. This is especially important for molecular scatology studies occurring in challenging tropical environments where DNA degrades quickly and the quality of faecal samples varies greatly. We optimized 14 polymorphic microsatellite loci for jaguars (Panthera onca), pumas (Puma concolor) and ocelots (Leopardus pardalis) and assessed their utility for cross-species amplification. Additionally, we tested their reliability for species and individual identification using DNA from faeces of wild felids detected by a scat detector dog across Belize in Central America. All microsatellite loci were successfully amplified in the three target species, were poly- morphic with average expected heterozygosities of H E = 0.60 0.18 (SD) for jaguars, H E = 0.65 0.21 (SD) for pumas and H E = 0.70 0.13 (SD) for ocelots and had an overall PCR amplification success of 61%. We used this nuclear DNA primer set to successfully identify species and individuals from 49% of 1053 field-collected scat samples. This set of optimized microsatellite multiplexes represents a powerful tool for future efforts to conduct noninvasive studies on multiple, wild Neotropical felids. Keywords: cross-species microsatellites, individual identification, molecular scatology, noninvasive genetic sampling, Panthera onca, scat detector dogs Received 20 December 2013; revision received 28 March 2014; accepted 31 March 2014 Introduction Jaguars (Panthera onca) and co-occurring Neotropical fe- lids, such as pumas (Puma concolor) and ocelots (Leopar- dus pardalis), are extremely difficult to study in the wild due to their elusive nature. As landscapes change and human impacts increase, felid populations become increasingly fragmented and ecological processes such as dispersal, intraguild competition and top-down tro- phic impacts (Linnell & Strand 2000) are affected, but remain understudied. Consequently, there is a great need for efficient survey methods that can be applied to multiple co-occurring species instead of focusing research efforts on a single species. Noninvasive genetic monitoring has been of increasing importance in the field of wildlife management and conservation in recent years (e.g. Waits & Paetkau 2005; Beja-Pereira et al. 2009), providing the potential to gain valuable information on multiple species existing across a fragmented landscape. Molecular scatology, in which individuals are genotyped using DNA isolated from sloughed intestinal epithelial cells in field-collected faecal samples (Hoss et al. 1992; Kohn & Wayne 1997), is especially suitable for wild fe- lids, which often deposit scat at prominent sites for intra- and interspecific communication (Sunquist & Sunquist 2002). Additionally, DNA extracted from faeces can be obtained without physically capturing or disturbing ani- mals of interest (Taberlet et al. 1999). Noninvasive genetic sampling also holds great promise for providing large sample sizes for multiple species simultaneously and identification of species, gender and individuals, which is beneficial for a wide array of analyses (e.g. Waits & Paetkau 2005; Kelly et al. 2012; Rodgers & Jane- cka 2013). To efficiently monitor threatened species, robust iden- tification of individuals is crucial for various types of Correspondence: Claudia Wultsch, Fax: +1-212-313-7819; E-mail: [email protected] © 2014 John Wiley & Sons Ltd Molecular Ecology Resources (2014) 14, 1171–1182 doi: 10.1111/1755-0998.12266
Transcript of Noninvasive individual and species identification of ... · claudia wultsch,*† lisette p....
Noninvasive individual and species identification of jaguars(Panthera onca), pumas (Puma concolor) and ocelots(Leopardus pardalis) in Belize, Central America usingcross-species microsatellites and faecal DNA
CLAUDIA WULTSCH,*† LISETTE P. WAITS‡ and MARCELLA J . KELLY*
*Department of Fish and Wildlife Conservation, Virginia Tech, 100 Cheatham Hall, Blacksburg, VA 24061, USA, †Sackler Institute
for Comparative Genomics, American Museum of Natural History, 79th Street at Central Park West, New York, NY 10024, USA,
‡Department of Fish and Wildlife Resources, University of Idaho, 875 Perimeter Drive MS 1136, Moscow, ID 83844, USA
Abstract
There is a great need to develop efficient, noninvasive genetic sampling methods to study wild populations of multi-
ple, co-occurring, threatened felids. This is especially important for molecular scatology studies occurring in
challenging tropical environments where DNA degrades quickly and the quality of faecal samples varies greatly.
We optimized 14 polymorphic microsatellite loci for jaguars (Panthera onca), pumas (Puma concolor) and ocelots
(Leopardus pardalis) and assessed their utility for cross-species amplification. Additionally, we tested their reliability
for species and individual identification using DNA from faeces of wild felids detected by a scat detector dog across
Belize in Central America. All microsatellite loci were successfully amplified in the three target species, were poly-
morphic with average expected heterozygosities of HE = 0.60 � 0.18 (SD) for jaguars, HE = 0.65 � 0.21 (SD) for
pumas and HE = 0.70 � 0.13 (SD) for ocelots and had an overall PCR amplification success of 61%. We used this
nuclear DNA primer set to successfully identify species and individuals from 49% of 1053 field-collected scat
samples. This set of optimized microsatellite multiplexes represents a powerful tool for future efforts to conduct
noninvasive studies on multiple, wild Neotropical felids.
Keywords: cross-species microsatellites, individual identification, molecular scatology, noninvasive genetic sampling,
Panthera onca, scat detector dogs
Received 20 December 2013; revision received 28 March 2014; accepted 31 March 2014
Introduction
Jaguars (Panthera onca) and co-occurring Neotropical fe-
lids, such as pumas (Puma concolor) and ocelots (Leopar-
dus pardalis), are extremely difficult to study in the wild
due to their elusive nature. As landscapes change and
human impacts increase, felid populations become
increasingly fragmented and ecological processes such
as dispersal, intraguild competition and top-down tro-
phic impacts (Linnell & Strand 2000) are affected, but
remain understudied. Consequently, there is a great
need for efficient survey methods that can be applied to
multiple co-occurring species instead of focusing
research efforts on a single species. Noninvasive genetic
monitoring has been of increasing importance in the field
of wildlife management and conservation in recent years
(e.g. Waits & Paetkau 2005; Beja-Pereira et al. 2009),
providing the potential to gain valuable information on
multiple species existing across a fragmented landscape.
Molecular scatology, in which individuals are genotyped
using DNA isolated from sloughed intestinal epithelial
cells in field-collected faecal samples (Hoss et al. 1992;
Kohn & Wayne 1997), is especially suitable for wild fe-
lids, which often deposit scat at prominent sites for intra-
and interspecific communication (Sunquist & Sunquist
2002). Additionally, DNA extracted from faeces can be
obtained without physically capturing or disturbing ani-
mals of interest (Taberlet et al. 1999). Noninvasive
genetic sampling also holds great promise for providing
large sample sizes for multiple species simultaneously
and identification of species, gender and individuals,
which is beneficial for a wide array of analyses (e.g.
Waits & Paetkau 2005; Kelly et al. 2012; Rodgers & Jane-
cka 2013).
To efficiently monitor threatened species, robust iden-
tification of individuals is crucial for various types ofCorrespondence: Claudia Wultsch, Fax: +1-212-313-7819;
E-mail: [email protected]
© 2014 John Wiley & Sons Ltd
Molecular Ecology Resources (2014) 14, 1171–1182 doi: 10.1111/1755-0998.12266
studies (e.g. capture–recapture analysis). However, indi-
vidual-based molecular scatology studies of single and
especially of multiple wild felid species are rare, particu-
larly in tropical regions. Multispecies felid studies often
do not go beyond the species level (e.g. Zuercher et al.
2003; Cossios & Angers 2006; Haag et al. 2009; Michalski
et al. 2011; Roques et al. 2011), with a few exceptions (e.g.
Singh et al. 2004; Trigo et al. 2008; Mondol et al. 2012).
One of the challenges to conducting individual-based
genetic population monitoring using faecal DNA col-
lected in tropical environments is the rapid removal of
faecal samples by insects and rain and the rapid degra-
dation of DNA. DNA degradation is affected by various
environmental factors (high temperatures, precipitation
and UV radiation) (e.g. Brinkman et al. 2010; Vynne et al.
2012), which are particularly problematic in tropical cli-
mates where excessive heat and humidity cause DNA to
deteriorate rapidly. Generally, low DNA quantity and
quality are major concerns for molecular scatology stud-
ies in the tropics (e.g. Michalski et al. 2011; Vynne et al.
2012), as they decrease polymerase chain reaction
(PCR) amplification success and cause genotyping errors
(Taberlet et al. 1996). Genotyping errors increase the
chance of misidentification of individuals and potentially
bias population estimates (Taberlet & Luikart 1999; Tab-
erlet et al. 1999; Mills et al. 2000; Waits & Leberg 2000).
To conduct a noninvasive genetic study of multiple
Neotropical felid species simultaneously, a set of highly
polymorphic microsatellite markers, also known as sim-
ple sequence repeats (SSRs), are needed that amplify
multiple target species and have the potential to identify
species and individuals from faecal DNA. Cross-species
amplification of microsatellites depends on the conserva-
tion of primer sequences, which has been described for
several mammalian taxa (e.g. Moore et al. 1991). Cross-
species microsatellites are transferrable between closely
related species (e.g. Barbara et al. 2007), which makes
them a cost-effective and efficient approach for conserva-
tion genetic studies of multiple target species. Menotti-
Raymond and O’Brien (1995) and Menotti-Raymond
et al. (1999) characterized microsatellite loci for the
domestic cat (Felis catus) and described their utility for
cross-species amplification due to conserved flanking
primer sequences across the family Felidae. Cross-spe-
cies microsatellites subsequently were used for several
felid studies (e.g. Menotti-Raymond & O’Brien 1995;
Johnson et al. 1999; Carmichael et al. 2000; Williamson
et al. 2002; Singh et al. 2004; Buckley-Beason et al. 2006;
Moreno et al. 2006; Grisolia et al. 2007; Trigo et al. 2008).
Their application is diverse and has helped facilitate
comparisons among closely related feline species for
assessing levels of genetic diversity and phylogeographic
patterns (Johnson et al. 1999; Moreno et al. 2006; Grisolia
et al. 2007), to recognize new feline species (Wilting et al.
2007), to assess hybridization between wild and domestic
cats (e.g. Oliveira et al. 2008; Trigo et al. 2008) and to
detect illegal hunting and trafficking of threatened felids
(Maudet et al. 2004; Singh et al. 2004). Nevertheless,
cross-species amplification of microsatellites has not
often been used for demographic and genetic monitoring
of multiple felids in the wild, which could ultimately
improve conservation and management activities for
these elusive species. Besides the comparison of popula-
tion genetic parameters among multiple closely related
species, cross-species microsatellites can also be applied
for species identification based on species-specific allele
sizes at multiple loci, a technique that has rarely been
used for noninvasive studies of wild carnivores (e.g.
Pilot et al. 2007; Wilting et al. 2007).
We conducted a 4-year noninvasive genetic study of
three co-occurring felids (jaguar, puma and ocelot) across
several study sites in tropical Belize, Central America.
We initially screened 20 microsatellite loci developed in
earlier feline studies (Menotti-Raymond et al. 1999) and
identified 14 microsatellite markers for a molecular sca-
tology study of three Neotropical felids suitable for
answering a variety of questions relevant to conservation
and management. Specifically, our objective was to
define a set of highly polymorphic microsatellite loci
applicable for reliable and cost-effective species and indi-
vidual identification across three target species. Further-
more, we evaluated the reliability of genotypes from
faecal samples of highly variable DNA quality and quan-
tity as a primary DNA source by determining PCR
amplification success, genotyping accuracy and error
rates.
Methods
Study area
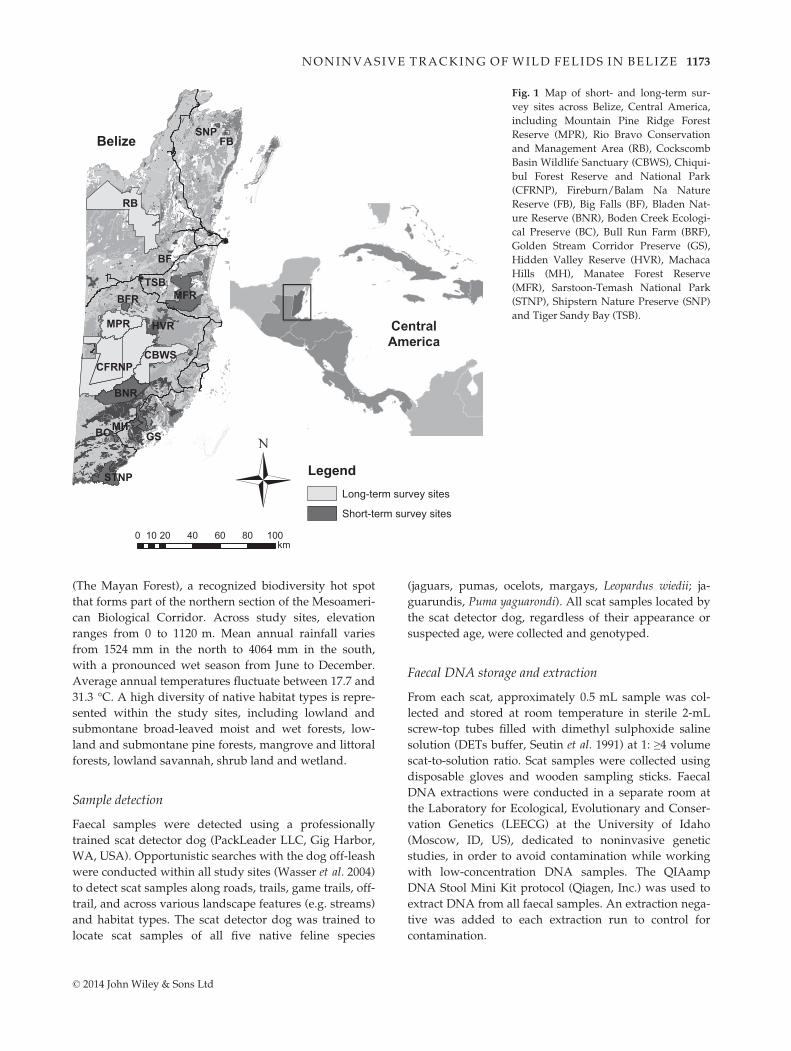
We conducted 2- to 3-month long scat surveys across five
main study sites (Mountain Pine Ridge Forest Reserve –
MPR, Rio Bravo Conservation and Management
Area – RB, Cockscomb Basin Wildlife Sanctuary – CBWS,
Chiquibul Forest Reserve and National Park – CFRNP
and Fireburn/Balam Na Nature Reserve – FB) and 2- to
10-day surveys at several other sites (Big Falls – BF, Bla-
den Nature Reserve – BNR, Boden Creek Ecological Pre-
serve – BC, Bull Run Farm – BRF, Golden Stream
Corridor Preserve – GS, Hidden Valley Reserve – HVR,
Machaca Hills – MH, Manatee Forest Reserve – MFR,
Sarstoon-Temash National Park – STNP, Shipstern Nat-
ure Preserve – SNP, Tiger Sandy Bay – TSB) from 2007 to
2010 across Belize, Central America (17°150N, 88°450W;
Fig. 1). All sites except BF, BRF, MH and TSB are part of
the national system of protected areas in Belize. The
study sites also fall within the forests of La Selva Maya
© 2014 John Wiley & Sons Ltd
1172 C. WULTSCH, L . P . WAITS and M. J . KELLY
(The Mayan Forest), a recognized biodiversity hot spot
that forms part of the northern section of the Mesoameri-
can Biological Corridor. Across study sites, elevation
ranges from 0 to 1120 m. Mean annual rainfall varies
from 1524 mm in the north to 4064 mm in the south,
with a pronounced wet season from June to December.
Average annual temperatures fluctuate between 17.7 and
31.3 °C. A high diversity of native habitat types is repre-
sented within the study sites, including lowland and
submontane broad-leaved moist and wet forests, low-
land and submontane pine forests, mangrove and littoral
forests, lowland savannah, shrub land and wetland.
Sample detection
Faecal samples were detected using a professionally
trained scat detector dog (PackLeader LLC, Gig Harbor,
WA, USA). Opportunistic searches with the dog off-leash
were conducted within all study sites (Wasser et al. 2004)
to detect scat samples along roads, trails, game trails, off-
trail, and across various landscape features (e.g. streams)
and habitat types. The scat detector dog was trained to
locate scat samples of all five native feline species
(jaguars, pumas, ocelots, margays, Leopardus wiedii; ja-
guarundis, Puma yaguarondi). All scat samples located by
the scat detector dog, regardless of their appearance or
suspected age, were collected and genotyped.
Faecal DNA storage and extraction
From each scat, approximately 0.5 mL sample was col-
lected and stored at room temperature in sterile 2-mL
screw-top tubes filled with dimethyl sulphoxide saline
solution (DETs buffer, Seutin et al. 1991) at 1: ≥4 volume
scat-to-solution ratio. Scat samples were collected using
disposable gloves and wooden sampling sticks. Faecal
DNA extractions were conducted in a separate room at
the Laboratory for Ecological, Evolutionary and Conser-
vation Genetics (LEECG) at the University of Idaho
(Moscow, ID, US), dedicated to noninvasive genetic
studies, in order to avoid contamination while working
with low-concentration DNA samples. The QIAamp
DNA Stool Mini Kit protocol (Qiagen, Inc.) was used to
extract DNA from all faecal samples. An extraction nega-
tive was added to each extraction run to control for
contamination.
0 20 40 60 80 10010km
LegendLong-term survey sites
Short-term survey sites
Belize FBSNP
RB
BF
TSBMFRBFR
MPR HVR
CFRNPCBWS
BNR
GSBCMH
STNP
Fig. 1 Map of short- and long-term sur-
vey sites across Belize, Central America,
including Mountain Pine Ridge Forest
Reserve (MPR), Rio Bravo Conservation
and Management Area (RB), Cockscomb
Basin Wildlife Sanctuary (CBWS), Chiqui-
bul Forest Reserve and National Park
(CFRNP), Fireburn/Balam Na Nature
Reserve (FB), Big Falls (BF), Bladen Nat-
ure Reserve (BNR), Boden Creek Ecologi-
cal Preserve (BC), Bull Run Farm (BRF),
Golden Stream Corridor Preserve (GS),
Hidden Valley Reserve (HVR), Machaca
Hills (MH), Manatee Forest Reserve
(MFR), Sarstoon-Temash National Park
(STNP), Shipstern Nature Preserve (SNP)
and Tiger Sandy Bay (TSB).
© 2014 John Wiley & Sons Ltd
NONINVASIVE TRACKING OF WILD FELIDS IN BELIZE 1173
Microsatellite screening and selection
A total of 20 microsatellite loci (F53, F85, F98, F124,
FCA008, FCA032, FCA043, FCA090, FCA096, FCA100,
FCA124, FCA126, FCA132, FCA212, FCA225, FCA229,
FCA275, FCA391, FCA441 and FCA741) originally iden-
tified for the domestic cat (Menotti-Raymond et al. 1999,
2005) were tested on faecal samples from wild Neotropi-
cal felids (19 jaguars, 18 pumas and 12 ocelots) collected
in the first two study sites (MPR and RB). Microsatellite
performance was evaluated by assessing allelic variation,
probabilities of identity for unrelated individuals and
siblings (Waits et al. 2001), PCR amplification success,
genotyping accuracy and genotyping error rates.
Microsatellite amplification and genotyping
Following microsatellite screening, 14 highly polymor-
phic loci were selected, labelled with fluorescent dyes
and arranged in three PCR multiplex reactions (multi-
plex 1 – F124-PET, FCA391-NED, FCA043-NED,
FCA275-VIC, FCA096-6-FAM, FCA126-PET, FCA090-6-
FAM; multiplex 2 – F85-VIC, F98-6-FAM, FCA741-PET,
FCA225-PET, FCA008-6-FAM; and multiplex 3 – F53-
NED and FCA441-6-FAM) to enhance performance and
efficiency. The three multiplexes each contained 5.2 lLPCR mixture and 1.8 lL of DNA. Multiplex 1 included
3.5 lL 19 concentrated Qiagen Master Mix (Qiagen,
Inc.), 0.7 lL of 0.59 concentrated Qiagen Q solution
(Qiagen, Inc.), 0.88 lL of primers (0.10 lM F124, 0.34 lMFCA391, 0.07 lM FCA043, 0.13 lM FCA275, 0.21 lMFCA096, 0.20 lM FCA126, 0.20 lM FCA090), 0.12 lL H2O
and 1.8 lL DNA extract. Multiplex 2 consisted of 3.5 lL19 concentrated Qiagen Master Mix, 0.7 lL of 0.59 con-
centrated Qiagen Q solution, 0.65 lL of primers (0.20 lMfor F85, 0.09 lM for F98, 0.11 lM for FCA741, 0.43 lM for
FCA225, 0.10 lM for FCA008), 0.35 lL H2O and 1.8 lLDNA extract. Multiplex 3 only differed in the amount of
water (0.76 lL) and primers (0.24 lL; 0.20 lM for F53,
0.14 lM for FCA441) added. Microsatellite PCR amplifi-
cations were conducted using a DNA Engine Tetrad 2
Peltier Thermal Cycler (Bio-Rad Laboratories, Inc.) start-
ing with an initial denaturation step of 15 min at 95 °C;followed by 13 cycles of 30 s at 94 °C for denaturation,
1.5 min at 60 °C with a decrease in annealing tempera-
ture of 0.8 °C in each cycle and 1-min elongation at
72 °C; followed by 30 cycles of 30 s at 94 °C for denatur-
ation, 1.5 min at 50 °C for annealing and 1 min elonga-
tion at 72 °C; and 30 min at 60 °C for final elongation. A
polymerase chain reaction negative was included in each
group of PCRs to indicate the presence/absence of
contamination. We visualized PCR products using an
ABI PRISM� 377 automated DNA sequencer (Applied
BiosystemsTM), and genotypes were identified using
the software GENEMAPPER, version 3.7 (Applied Biosys-
temsTM).
Initially, we performed a minimum of two PCRs for
all scat samples using the screening multiplex 1 (seven
loci). Depending on the number of successfully amplified
loci within multiplex 1, we placed the scat samples in
three categories describing amplification success: (i) bad
(0–2 loci amplified), (ii) medium (3–5 loci amplified) and
(iii) good (6–7 loci amplified). We conducted 1–4 addi-
tional PCR runs for scat samples placed into the medium
and good quality categories. Scat samples with ≤2 loci
amplified were discarded from the study. The total num-
ber of PCRs ranged from 2 to 6 replicates per locus and
averaged 4.29 � 1.84 (SD) per locus for samples with
finalized genotypes. To finalize the consensus genotypes,
a multitube approach was used where at least three iden-
tical homozygote PCR results were required for homozy-
gote genotypes, and each allele had to be observed in
two independent PCRs to record a heterozygous geno-
type.
Species and individual identification
Scat samples were assigned to feline species based on
species-specific alleles and allelic ranges initially identi-
fied across several loci from known faecal DNA samples
of 12 jaguars, four pumas, 12 ocelots, 30 margays and
four jaguarundis obtained from captive facilities (Belize
Zoo, Belize; Feline Conservation Center, CA, US; Naples
Zoo, FL, US, Profelis, Costa Rica). Additionally, to verify
species assignment of all unique jaguar, puma and ocelot
individuals, we conducted assignment tests with the
Bayesian clustering software STRUCTURE, version 2.3.3
(Pritchard et al. 2000). Species assignment for all individ-
ual genotypes detected was verified by analysing cluster-
ing patterns based on distinctive allele frequencies and
the most likely number of genetic clusters (K). The
admixture model was used (predefined K = 1–5 corre-
sponding to the five native feline species; 10 runs per K
value; length of burn-in period: 105 iterations; number of
MCMC iterations after burn-in: 106). The optimal K value
was chosen by calculating the posterior probability for
each K value, which is based on estimated maximum
log-likelihood values. After finding the optimal K, indi-
viduals were assigned to distinct genetic clusters using
the % of the genotype’s ancestry (Q) attributed to each
genetic cluster. For successful species identification, Q
values had to be ≥95%. Also, mitochondrial sequencing
was conducted for four DNA samples per species cluster
to confirm species assignment. Four mitochondrial gene
regions were amplified including cytochrome b (H15149,
Kocher et al. 1989; Farrell-R, Farrell et al. 2000), 12S
(L1085, H1259, Kitano et al. 2007), 16S (L2513, H2714,
Kitano et al. 2007), 16Scp (16Scp-F, 16Scp-F, Kitano et al.
© 2014 John Wiley & Sons Ltd
1174 C. WULTSCH, L . P . WAITS and M. J . KELLY
2007) and adenosine triphosphate-6 (ATP6-DF3, ATP6-
DR2, Chaves et al. 2012). DNA sequences were edited
and matched with reference samples from the Global
Felid Genetics Program at the American Museum of Nat-
ural History (New York, NY) using GENEIOUS, v. 6.1.5.
(Biomatters Ltd., Auckland, New Zealand).
For individual identification, we estimated probabili-
ties of identity (per locus and cumulative) for unrelated
individuals (P(ID)) and siblings (P(ID)sib) per species as
described by Waits et al. (2001) using GIMLET, version
1.3.3. (Valiere 2002). Cumulative P(ID) and P(ID)sib values
were calculated per species for screening multiplex 1,
and the minimum number of loci required for individual
identification was estimated following a criterion of P(ID)
sib < 0.010 as suggested by Mills et al. (2000) and Waits
et al. (2001).
Once consensus genotypes were finalized for multi-
plex 1, we used GENALEX, version 6.41 (Peakall & Smouse
2006) to determine the minimum number of individuals
per species by checking for repeated matching geno-
types, which if detected, were classified as recaptures of
individual felids. Near-matching genotypes, which dif-
fered at only one or two loci, were genotyped two more
times. We selected the scat sample with the highest PCR
product quality for each detected individual and
screened these using multiplex 2 (five loci) and multiplex
3 (two loci). We obtained consensus genotypes for the
final two multiplexes after performing an additional 2–6
PCR replicates per locus. Genotypes, which were only
detected once, were further examined using the software
RELIOTYPE (Miller et al. 2002) and maximum likelihood to
assess their reliability. If the accuracy of multilocus
scores was below 95%, additional PCR replicates were
conducted.
Data analysis
GENALEX, version 6.41 (Peakall & Smouse 2006) was used
to assess genetic variation per species at single loci and
across all loci by calculating the number of alleles (NA)
and estimating observed (HO) and expected heterozygos-
ities (HE). Additionally, we determined allelic richness
(AR) using the rarefaction method with HP-RARE, version
1.0 (Kalinowski 2005) and polymorphic information con-
tent (PIC) with CERVUS, version 3.0 (Kalinowski et al.
2007).
To calculate PCR amplification success, genotyping
accuracy and genotyping error rates, we selected the last
two PCR runs for all loci across all scat samples. We used
only the last two runs to standardize the number
included per sample. PCR amplification success rates
were assessed by calculating the percentage of successful
PCRs across all samples tested and for all samples with
finalized species identification. Genotyping accuracy
rates were estimated by calculating the percentage of
successful PCRs, which matched the finalized consensus
genotype. Genotyping error was quantified by calculat-
ing the rate of false alleles (FA) and allelic dropouts
(ADO) following the protocols of Broquet and Petit
(2004). False allele rates were calculated for all consensus
genotypes, and allelic dropout rates were estimated only
for heterozygous genotypes.
Hardy–Weinberg equilibrium and linkage disequi-
librium (LD) were tested for all three species with GENE-
POP, version 4.1 (Raymond & Rousset 1995) using
default settings for Markov chain parameters. The pres-
ence of null alleles was examined with MICRO-CHECKER
(Van Oosterhout et al. 2004). Data were tested for nor-
mality and homoscedasticity. Statistical differences
between groups were evaluated using nonparametric
Kruskal–Wallis and post hoc Wilcoxon rank-sum tests
in program R, version 3.0.1 (R Development Core Team
2009). All results for multiple significance tests were
adjusted by applying sequential Bonferroni correction
(Rice 1989).
Results
Sample detection
The total number of faecal DNA samples located by the
scat detector dog across all study sites was 1053, with
110 collected in MPR, 203 in RB, 223 in CBWS, 111 in
CFRNP, 217 in FB and 189 samples during several short-
term surveys across various sites (BF, BNR, BC, BRF, GS,
HVR, MH, MFR, STNP, SNP and TSB) in Belize.
Microsatellite selection
Microsatellite DNA from faecal samples of wild jaguars,
pumas and ocelots collected in MPR and RB amplified
across all 20 initially selected loci, confirming their cross-
species utility. Nonetheless, six microsatellite loci
(FCA032, FCA100, FCA124, FCA132, FCA212 and
FCA229) were omitted from the analysis due to low lev-
els of genetic variation (NA ≤ 2 and HE ≤ 0.5 for FCA100,
FCA132 and FCA212 in jaguars; NA = 1 and HE = 0 for
FCA032 and FCA212 in pumas; HE ≤ 0.5 for FCA132 in
ocelots) and overlapping allelic size ranges (FCA124 with
FCA043, FCA229 with FCA275). Based on P(ID)sib esti-
mates, loci FCA132 for jaguars, FCA032 and FCA212 for
pumas and FCA132 for ocelots were the least powerful
loci for individual identification among those tested. We
also assessed primer performance across 74 faecal sam-
ples collected in MPR and RB in terms of PCR amplifica-
tion success and genotyping error rates. Loci FCA032
and FCA100 had generally low PCR amplification suc-
cess rates. Loci FCA100 and FCA132 showed high rates
© 2014 John Wiley & Sons Ltd
NONINVASIVE TRACKING OF WILD FELIDS IN BELIZE 1175
of allelic dropout, and loci FCA100 and FCA229 pro-
duced high rates of false alleles.
Species and individual identification
After screening, 14 highly polymorphic microsatellite
loci were selected and used for species and individual
identification. Species-specific alleles and allelic ranges
were described for all target species using faecal samples
obtained from the wild in Belize (Table S1, Supporting
information). Across all finalized loci, for pumas, 70.3%
of the alleles described were species-specific followed by
64.1% for ocelots and 63.8% for jaguars. The most power-
ful loci for species assignment (100% of alleles were spe-
cies specific) were F124, FCA391, FCA096, FCA126 and
FCA741 for jaguars, F124, FCA096, F98 and FCA008 for
pumas, and F124, FCA043, FCA096 and F85 for ocelots.
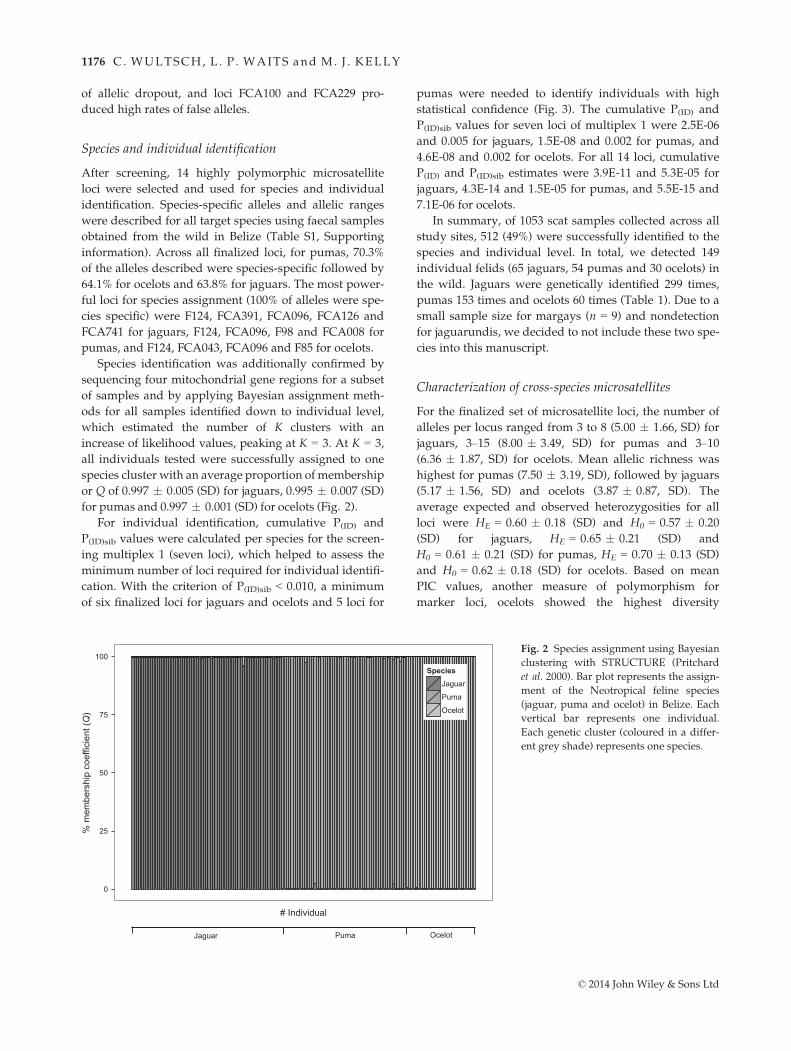
Species identification was additionally confirmed by
sequencing four mitochondrial gene regions for a subset
of samples and by applying Bayesian assignment meth-
ods for all samples identified down to individual level,
which estimated the number of K clusters with an
increase of likelihood values, peaking at K = 3. At K = 3,
all individuals tested were successfully assigned to one
species cluster with an average proportion of membership
or Q of 0.997 � 0.005 (SD) for jaguars, 0.995 � 0.007 (SD)
for pumas and 0.997 � 0.001 (SD) for ocelots (Fig. 2).
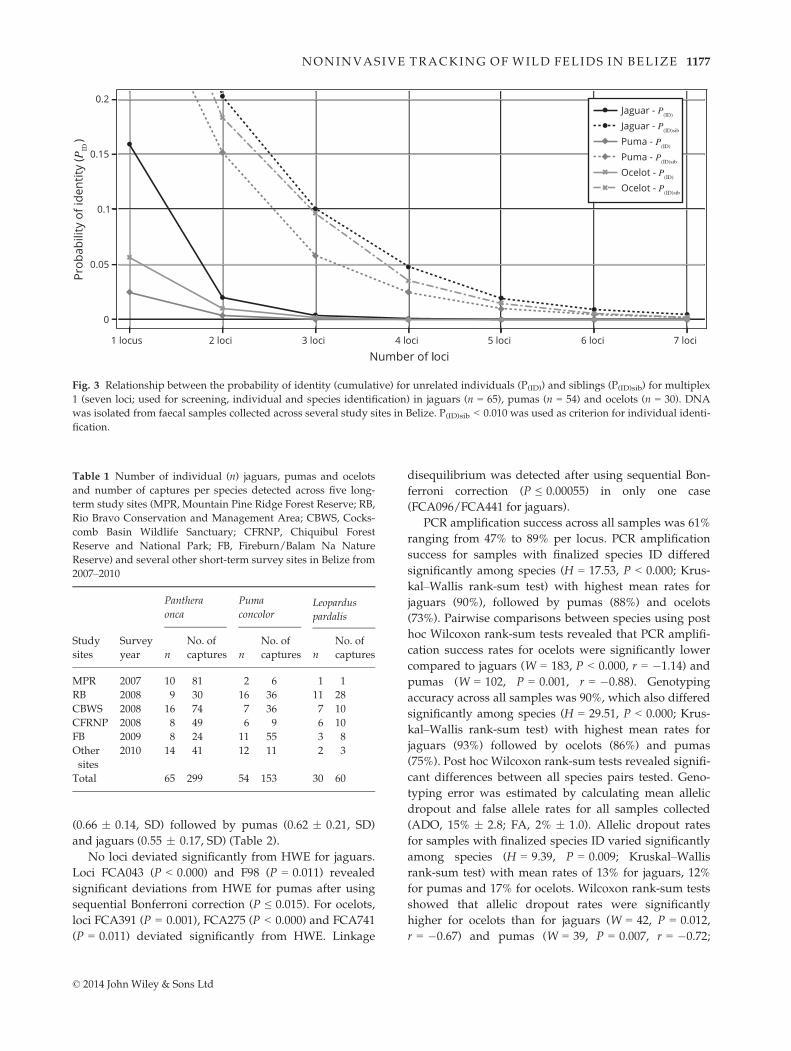
For individual identification, cumulative P(ID) and
P(ID)sib values were calculated per species for the screen-
ing multiplex 1 (seven loci), which helped to assess the
minimum number of loci required for individual identifi-
cation. With the criterion of P(ID)sib < 0.010, a minimum
of six finalized loci for jaguars and ocelots and 5 loci for
pumas were needed to identify individuals with high
statistical confidence (Fig. 3). The cumulative P(ID) and
P(ID)sib values for seven loci of multiplex 1 were 2.5E-06
and 0.005 for jaguars, 1.5E-08 and 0.002 for pumas, and
4.6E-08 and 0.002 for ocelots. For all 14 loci, cumulative
P(ID) and P(ID)sib estimates were 3.9E-11 and 5.3E-05 for
jaguars, 4.3E-14 and 1.5E-05 for pumas, and 5.5E-15 and
7.1E-06 for ocelots.
In summary, of 1053 scat samples collected across all
study sites, 512 (49%) were successfully identified to the
species and individual level. In total, we detected 149
individual felids (65 jaguars, 54 pumas and 30 ocelots) in
the wild. Jaguars were genetically identified 299 times,
pumas 153 times and ocelots 60 times (Table 1). Due to a
small sample size for margays (n = 9) and nondetection
for jaguarundis, we decided to not include these two spe-
cies into this manuscript.
Characterization of cross-species microsatellites
For the finalized set of microsatellite loci, the number of
alleles per locus ranged from 3 to 8 (5.00 � 1.66, SD) for
jaguars, 3–15 (8.00 � 3.49, SD) for pumas and 3–10
(6.36 � 1.87, SD) for ocelots. Mean allelic richness was
highest for pumas (7.50 � 3.19, SD), followed by jaguars
(5.17 � 1.56, SD) and ocelots (3.87 � 0.87, SD). The
average expected and observed heterozygosities for all
loci were HE = 0.60 � 0.18 (SD) and H0 = 0.57 � 0.20
(SD) for jaguars, HE = 0.65 � 0.21 (SD) and
H0 = 0.61 � 0.21 (SD) for pumas, HE = 0.70 � 0.13 (SD)
and H0 = 0.62 � 0.18 (SD) for ocelots. Based on mean
PIC values, another measure of polymorphism for
marker loci, ocelots showed the highest diversity
mem
bers
hip
coef
ficie
nt (Q
)
Fig. 2 Species assignment using Bayesian
clustering with STRUCTURE (Pritchard
et al. 2000). Bar plot represents the assign-
ment of the Neotropical feline species
(jaguar, puma and ocelot) in Belize. Each
vertical bar represents one individual.
Each genetic cluster (coloured in a differ-
ent grey shade) represents one species.
© 2014 John Wiley & Sons Ltd
1176 C. WULTSCH, L . P . WAITS and M. J . KELLY
(0.66 � 0.14, SD) followed by pumas (0.62 � 0.21, SD)
and jaguars (0.55 � 0.17, SD) (Table 2).
No loci deviated significantly from HWE for jaguars.
Loci FCA043 (P < 0.000) and F98 (P = 0.011) revealed
significant deviations from HWE for pumas after using
sequential Bonferroni correction (P ≤ 0.015). For ocelots,
loci FCA391 (P = 0.001), FCA275 (P < 0.000) and FCA741
(P = 0.011) deviated significantly from HWE. Linkage
disequilibrium was detected after using sequential Bon-
ferroni correction (P ≤ 0.00055) in only one case
(FCA096/FCA441 for jaguars).
PCR amplification success across all samples was 61%
ranging from 47% to 89% per locus. PCR amplification
success for samples with finalized species ID differed
significantly among species (H = 17.53, P < 0.000; Krus-
kal–Wallis rank-sum test) with highest mean rates for
jaguars (90%), followed by pumas (88%) and ocelots
(73%). Pairwise comparisons between species using post
hoc Wilcoxon rank-sum tests revealed that PCR amplifi-
cation success rates for ocelots were significantly lower
compared to jaguars (W = 183, P < 0.000, r = �1.14) and
pumas (W = 102, P = 0.001, r = �0.88). Genotyping
accuracy across all samples was 90%, which also differed
significantly among species (H = 29.51, P < 0.000; Krus-
kal–Wallis rank-sum test) with highest mean rates for
jaguars (93%) followed by ocelots (86%) and pumas
(75%). Post hoc Wilcoxon rank-sum tests revealed signifi-
cant differences between all species pairs tested. Geno-
typing error was estimated by calculating mean allelic
dropout and false allele rates for all samples collected
(ADO, 15% � 2.8; FA, 2% � 1.0). Allelic dropout rates
for samples with finalized species ID varied significantly
among species (H = 9.39, P = 0.009; Kruskal–Wallis
rank-sum test) with mean rates of 13% for jaguars, 12%
for pumas and 17% for ocelots. Wilcoxon rank-sum tests
showed that allelic dropout rates were significantly
higher for ocelots than for jaguars (W = 42, P = 0.012,
r = �0.67) and pumas (W = 39, P = 0.007, r = �0.72;
iP
ID
l
P(ID)
P(ID)sib
P(ID)sib
P(ID)sib
P(ID)
P(ID)
Fig. 3 Relationship between the probability of identity (cumulative) for unrelated individuals (P(ID)) and siblings (P(ID)sib) for multiplex
1 (seven loci; used for screening, individual and species identification) in jaguars (n = 65), pumas (n = 54) and ocelots (n = 30). DNA
was isolated from faecal samples collected across several study sites in Belize. P(ID)sib < 0.010 was used as criterion for individual identi-
fication.
Table 1 Number of individual (n) jaguars, pumas and ocelots
and number of captures per species detected across five long-
term study sites (MPR, Mountain Pine Ridge Forest Reserve; RB,
Rio Bravo Conservation and Management Area; CBWS, Cocks-
comb Basin Wildlife Sanctuary; CFRNP, Chiquibul Forest
Reserve and National Park; FB, Fireburn/Balam Na Nature
Reserve) and several other short-term survey sites in Belize from
2007–2010
Study
sites
Survey
year
Panthera
onca
Puma
concolorLeopardus
pardalis
n
No. of
captures n
No. of
captures n
No. of
captures
MPR 2007 10 81 2 6 1 1
RB 2008 9 30 16 36 11 28
CBWS 2008 16 74 7 36 7 10
CFRNP 2008 8 49 6 9 6 10
FB 2009 8 24 11 55 3 8
Other
sites
2010 14 41 12 11 2 3
Total 65 299 54 153 30 60
© 2014 John Wiley & Sons Ltd
NONINVASIVE TRACKING OF WILD FELIDS IN BELIZE 1177
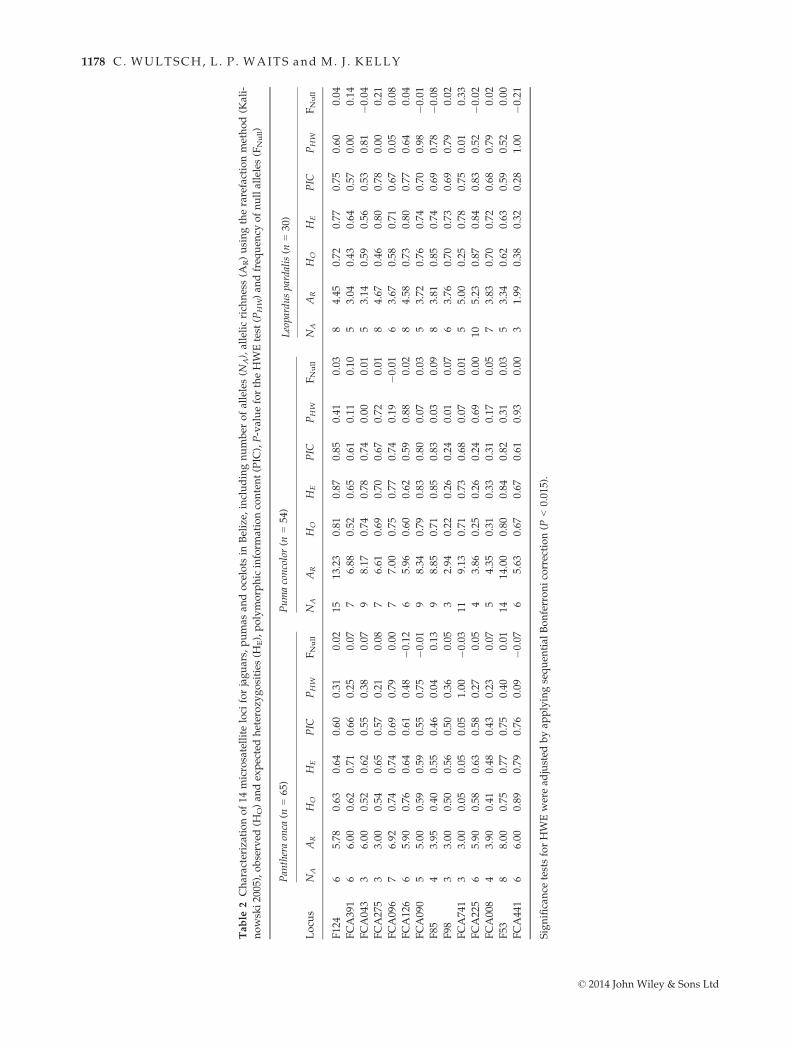
Table
2Characterizationof14
microsatelliteloci
forjaguars,pumas
andocelots
inBelize,
includingnumber
ofalleles(N
A),allelicrich
ness(A
R)usingtherarefactionmethod(K
ali-
nowski2005),observed
(HO)an
dexpectedheterozy
gosities
(HE),polymorphicinform
ationcontent(PIC
),P-valuefortheHWEtest
(PHW)an
dfreq
uen
cyofnullalleles(F
Null)
Locu
s
Pantheraonca
(n=65)
Pumaconcolor(n
=54)
Leoparduspardalis(n
=30)
NA
AR
HO
HE
PIC
PHW
FNull
NA
AR
HO
HE
PIC
PHW
FNull
NA
AR
HO
HE
PIC
PHW
FNull
F124
65.78
0.63
0.64
0.60
0.31
0.02
1513.23
0.81
0.87
0.85
0.41
0.03
84.45
0.72
0.77
0.75
0.60
0.04
FCA391
66.00
0.62
0.71
0.66
0.25
0.07
76.88
0.52
0.65
0.61
0.11
0.10
53.04
0.43
0.64
0.57
0.00
0.14
FCA043
36.00
0.52
0.62
0.55
0.38
0.07
98.17
0.74
0.78
0.74
0.00
0.01
53.14
0.59
0.56
0.53
0.81
�0.04
FCA275
33.00
0.54
0.65
0.57
0.21
0.08
76.61
0.69
0.70
0.67
0.72
0.01
84.67
0.46
0.80
0.78
0.00
0.21
FCA096
76.92
0.74
0.74
0.69
0.79
0.00
77.00
0.75
0.77
0.74
0.19
�0.01
63.67
0.58
0.71
0.67
0.05
0.08
FCA126
65.90
0.76
0.64
0.61
0.48
�0.12
65.96
0.60
0.62
0.59
0.88
0.02
84.58
0.73
0.80
0.77
0.64
0.04
FCA090
55.00
0.59
0.59
0.55
0.75
�0.01
98.34
0.79
0.83
0.80
0.07
0.03
53.72
0.76
0.74
0.70
0.98
�0.01
F85
43.95
0.40
0.55
0.46
0.04
0.13
98.85
0.71
0.85
0.83
0.03
0.09
83.81
0.85
0.74
0.69
0.78
�0.08
F98
33.00
0.50
0.56
0.50
0.36
0.05
32.94
0.22
0.26
0.24
0.01
0.07
63.76
0.70
0.73
0.69
0.79
0.02
FCA741
33.00
0.05
0.05
0.05
1.00
�0.03
119.13
0.71
0.73
0.68
0.07
0.01
55.00
0.25
0.78
0.75
0.01
0.33
FCA225
65.90
0.58
0.63
0.58
0.27
0.05
43.86
0.25
0.26
0.24
0.69
0.00
105.23
0.87
0.84
0.83
0.52
�0.02
FCA008
43.90
0.41
0.48
0.43
0.23
0.07
54.35
0.31
0.33
0.31
0.17
0.05
73.83
0.70
0.72
0.68
0.79
0.02
F53
88.00
0.75
0.77
0.75
0.40
0.01
1414.00
0.80
0.84
0.82
0.31
0.03
53.34
0.62
0.63
0.59
0.52
0.00
FCA441
66.00
0.89
0.79
0.76
0.09
�0.07
65.63
0.67
0.67
0.61
0.93
0.00
31.99
0.38
0.32
0.28
1.00
�0.21
Significance
testsforHWEweread
justed
byap
plyingsequen
tial
Bonferronicorrection(P
<0.015).
© 2014 John Wiley & Sons Ltd
1178 C. WULTSCH, L . P . WAITS and M. J . KELLY

Table 3). Feline species did not differ significantly
(H = 0.68, P = 0.711; Kruskal–Wallis rank-sum test) in
mean rates for FA of jaguars (1% � 1.0, SD), pumas
(1% � 1.2, SD) and ocelots (2% � 1.3, SD) (Table 3).
Discussion
Selection and performance of cross-species microsatelliteloci
Microsatellites represent a powerful type of neutral
genetic marker commonly used to answer a variety of
population genetic and ecological questions (e.g. Sun-
nucks 2000; Selkoe & Toonen 2006; Wang 2011; Allendorf
et al. 2013). Due to many conservation challenges, species
of concern often are studied in a comparative way and
cross-species microsatellites have been identified for sev-
eral different taxa (e.g. Barbara et al. 2007). We success-
fully cross-amplified 20 published microsatellite loci
developed for the domestic cat in three Neotropical
feline species. We conducted thorough screening of all
loci tested and selected 14 polymorphic markers, which
efficiently and reliably identified species and individuals
from field-collected, faecal DNA samples of three felid
species with highly variable DNA quality and quantity.
Proper selection of genetic markers is crucial because it
impacts all subsequent population genetic analyses (e.g.
Taberlet & Luikart 1999). To increase the cost efficiency
of our study, we arranged the 14 loci in three multiplexes
and configured multiplex 1 with 7 highly polymorphic
loci, which were used for sample screening, and species
and individual identification. Multiplexes 2 and 3 were
developed to add additional loci for fine-scale genetic
structure or parentage analyses not reported here and
were only run for one sample per individual.
The genotyping performance of the microsatellite loci
was tested based on several parameters including
genetic variation, PCR amplification success, genotyping
accuracy and genotyping error rates. Results of the cur-
rent study suggest that the cross-species microsatellite
set optimized here is an efficient and powerful tool for
conservation genetic studies of multiple Neotropical fe-
lids. The high variability indicates the potential useful-
ness for examining genetic structure of the target species.
Although we conducted this study in tropical Belize and
included all faecal samples detected by the scat detector
dog (n = 1053), many of which were highly degraded,
our analysis showed medium to high mean PCR amplifi-
cation success rates using nuclear loci (61% � 12.4, SD)
compared with other studies of Neotropical felids with
Table 3 Summary of PCR amplification success, genotyping accuracy and genotyping error rates for 14 microsatellite loci for all sam-
ples and all jaguar, puma and ocelot samples with finalized species ID detected across five study sites in Belize. PCR, % polymerase
chain reaction amplification success; GA, % genotyping accuracy; ADO, % allelic dropout; FA, % false alleles
Primer ID
All samples n = 1053* Panthera onca n = 299* Puma concolor n = 153* Leopardus pardalis n = 60*
PCR GA ADO FA PCR GA ADO FA PCR GA ADO FA PCR GA ADO FA
Multiplex 1
F124 56.22 89.49 13.45 0.69 93.08 92.21 10.51 0.42 89.23 68.42 9.30 1.28 81.67 85.71 16.67 1.02
FCA391 46.73 89.55 13.75 1.79 83.02 90.51 11.94 1.22 86.61 77.54 8.85 1.75 59.17 88.24 16.67 0.00
FCA043 54.24 89.28 14.65 1.53 83.04 93.97 8.20 0.75 76.43 69.01 15.85 0.51 81.90 88.37 13.11 2.33
FCA275 57.75 90.65 14.87 0.74 97.76 94.63 8.93 0.58 93.84 68.70 10.61 0.37 62.50 79.49 29.27 2.56
FCA096 52.99 86.86 18.02 2.00 89.18 88.69 17.72 1.33 86.82 60.00 13.27 1.73 77.50 88.10 21.88 3.57
FCA126 56.24 85.57 16.84 1.41 94.22 88.69 13.33 1.21 92.59 65.32 11.48 0.38 88.33 85.19 14.63 1.85
FCA090 59.76 88.96 15.21 1.32 92.75 90.27 14.58 0.63 91.14 70.97 10.19 0.39 82.50 89.80 13.11 2.04
Multiplex 2
F85 77.81 89.63 14.18 2.94 86.75 94.66 8.16 2.29 87.03 77.04 12.04 1.97 74.55 84.93 15.79 2.74
F98 80.77 91.24 17.62 1.39 88.55 93.23 12.12 1.59 89.02 92.92 16.33 0.00 83.93 87.50 16.36 0.00
FCA741 66.93 93.78 15.67 0.50 88.18 96.60 26.92 0.00 79.10 73.23 9.71 1.50 15.74 87.50 0.00 0.00
FCA225 76.17 86.19 20.45 2.53 85.24 89.31 15.48 1.53 86.77 81.30 16.87 2.56 74.11 81.69 19.23 2.82
FCA008 88.39 92.81 12.19 0.51 94.34 95.68 7.01 0.36 95.29 84.33 14.77 0.58 87.72 85.42 16.05 1.04
Multiplex 3
F53 73.47 88.41 13.46 3.77 83.95 91.72 8.51 4.14 81.60 70.93 10.00 3.23 72.00 82.61 23.26 2.90
FCA441 66.33 90.00 9.22 1.82 91.56 90.36 8.12 1.20 86.79 77.78 8.91 4.13 71.43 89.80 15.38 0.00
Mean 61.17 89.22 14.95 1.51 89.40 92.18 12.25 1.23 87.30 74.11 12.01 1.46 72.36 86.02 16.53 1.63
SD 12.37 2.30 2.75 0.95 4.68 2.64 5.32 1.03 5.37 8.45 2.88 1.22 18.43 3.08 6.48 1.27
*All samples were analysed with multiplex 1. Multiplex 2 and multiplex 3 were only used for samples with finalized individual ID.
© 2014 John Wiley & Sons Ltd
NONINVASIVE TRACKING OF WILD FELIDS IN BELIZE 1179
scat detector dogs (jaguars, 26 - 41%: Michalski et al.
2011) or without detector dogs (pumas, 5–45%, Miotto
et al. 2007). Other molecular scatology studies monitor-
ing leopards or tigers without scat detector dogs in tropi-
cal environments (e.g. Bhagavatula & Singh 2006;
Mondol et al. 2009a; Borthakur et al. 2011; Dutta et al.
2012) reported success rates similar to, or higher than,
our study (>60%). Mean genotyping error rates differ
widely among noninvasive felid studies focusing on
tigers (ADO = 0–3.5%, FA = 0, Mondol et al. 2009a;
ADO = 0–64.8%, FA = 0–9.0%, Bhagavatula & Singh
2006), leopards (ADO = 0–45.4%, FA = 0–7.6%, Dutta
et al. 2012; ADO = 0–7.4%, FA = 0–1.5%; Mondol et al.
2009b) and pumas (ADO = 10.6%, Miotto et al. 2007).
Mean genotyping error rates for this study
(ADO = 15% � 2.6; FA = 2% � 1.0) were relatively low
considering that low-quality faecal samples detected by
the scat detector dog were included to the analysis. PCR
amplification success and genotyping error rates for fae-
cal DNA samples often vary greatly among studies
depending on primer selection and design (e.g. Housley
et al. 2006), and due to various other factors including
faecal DNA quality and quantity, scat sample origin (e.g.
species, environmental factors), and the choice of field
and laboratory techniques (e.g. Wasser et al. 1997; Pig-
gott 2004; Beja-Pereira et al. 2009; Soto-Calderon et al.
2009; Stenglein et al. 2010). The detection method used
for scat sampling (humans or detector dogs) also affects
success and error rates because studies using scat detec-
tor dogs have the potential to locate deteriorated scat
samples not easily detectable by humans (e.g. Long et al.
2007).
Species and individual identification
Recent studies of Neotropical felids suggested that
techniques for individual identification of faecal sam-
ples need further improvement in field and laboratory
techniques (e.g. Michalski et al. 2011). We addressed
this by optimizing a powerful set of cross-species mi-
crosatellite loci, which can be used reliably for species
and individual identification of co-occurring jaguars,
pumas and ocelots based on field-collected faecal sam-
ples. In total, we collected 1053 scat samples from the
wild and successfully genotyped 49% of the scats to
the species level and individual level. We used proba-
bility of identity estimates to assess statistical confi-
dence for individual identification with P(ID)sib < 0.010
as the deciding criterion (Mills et al. 2000; Waits et al.
2001). The discriminatory power of the probability of
identity estimates for this primer set was high, which
indicates a strong resolving power between individuals,
even when close relatedness among study animals may
be an issue.
To increase the efficiency of this study, we used the
same nuclear markers to identify species by examining
species-specific alleles and applying Bayesian clustering
analysis to verify species assignment. The application of
species-specific alleles for species identification of faecal
samples collected in the field has been mainly used for
wildlife forensics to differentiate between several big cats
(e.g. Singh et al. 2004) or to detect hybridization between
two wild feline species (bobcat and lynx; Schwartz et al.
2004). Here, we demonstrated the potential of this
approach for individual-based monitoring of multiple
wild felid species on a local geographic scale; however,
before application in other areas, it will be important to
verify that these alleles remain species-specific. Besides
species identification, cross-species microsatellite loci
have a wide application and are especially useful when
several closely related species at risk need to be managed
and conserved simultaneously. Nonetheless, limitations
of this approach (e.g. Barbara et al. 2007) need to be con-
sidered.
In conclusion, we strongly encourage the develop-
ment of rigorous field and laboratory protocols espe-
cially for noninvasive genetic studies conducted in
tropical environments hostile to DNA samples. The com-
bination of the most informative markers and the assess-
ment of locus-specific success and error rates both within
and among three target species helped to optimize a set
of polymorphic nuclear primers, which improved our
ability to efficiently and accurately identify genotypes (at
the species and individual level) from often highly
degraded scat samples. Additionally, using a microsatel-
lite marker set that amplifies across species represents an
efficient and powerful way to study multiple co-occur-
ring species on both the individual and population lev-
els, and simultaneously to evaluate the conservation
status (demographics, genetic diversity and connectivity)
of potentially threatened species.
Acknowledgements
This work was funded by Panthera, National Geographic
Society/Waitt Grant, Wildlife Conservation Society/Jaguar Con-
servation Fund, Acorn Alcinda Foundation, Oregon Zoo Con-
servation Fund, Woodland Park Zoo/Jaguar Conservation
Fund, Philadelphia Zoo, Explorers Club/Exploration Fund, and
the Department of Fish and Wildlife Conservation, Virginia
Tech. We thank Kara Gebhardt for her help with laboratory
analysis and primer selection, and Drs. Michael R. Vaughan,
Eric Hallerman, Dean Stauffer and Packleader LLC for their
valuable comments and professional advice. We thank our
numerous technicians and volunteers in the field and laboratory
for their hard work. We also thank the Global Felid Genetics
program at the American Museum of Natural History for sup-
port with mitochondrial DNA analysis. We are most grateful for
the support of the Belize Forest Department and many other
local collaborators in Belize.
© 2014 John Wiley & Sons Ltd
1180 C. WULTSCH, L . P . WAITS and M. J . KELLY
References
Allendorf FW, Luikart G, Aitken SN (2013) Conservation and the Genetics of
Populations Blackwell Pub., Malden, MA; Oxford.
Barbara T, Palma-Silva C, Paggi GM et al. (2007) Cross-species transfer of
nuclear microsatellite markers: potential and limitations. Molecular
Ecology, 16, 3759–3767.
Beja-Pereira A, Oliveira R, Alves PC, Schwartz MK, Luikart G (2009)
Advancing ecological understandings through technological transfor-
mations in noninvasive genetics. Molecular Ecology Resources, 9, 1279–
1301.
Bhagavatula J, Singh L (2006) Genotyping faecal samples of Bengal tiger
Panthera tigris tigris for population estimation: a pilot study. BMC
Genetics, 7, 48.
Borthakur U, Barman RD, Das C et al. (2011) Noninvasive genetic moni-
toring of tiger (Panthera tigris tigris) population of Orang National Park
in the Brahmaputra floodplain, Assam, India. European Journal of Wild-
life Research, 57, 603–613.
Brinkman T, Schwartz M, Person D, Pilgrim K, Hundertmark K (2010)
Effects of time and rainfall on PCR success using DNA extracted from
deer fecal pellets. Conservation Genetics, 11, 1547–1552.
Broquet T, Petit E (2004) Quantifying genotyping errors in noninvasive
population genetics. Molecular Ecology, 13, 3601–3608.
Buckley-Beason VA, Johnson WE, Nash WG et al. (2006) Molecular evi-
dence for species-level distinctions in clouded leopards. Current Biol-
ogy, 16, 2371–2376.
Carmichael LE, Clark W, Strobeck C (2000) Development and character-
ization of microsatellite loci from lynx (Lynx canadensis), and their use
in other felids. Molecular Ecology, 9, 2197–2198.
Chaves PB, Graeff VG, Lion MB, Oliveira LR, Eizirik E (2012) DNA bar-
coding meets molecular scatology: short mtDNA sequences for stan-
dardized species assignment of carnivore noninvasive samples.
Molecular Ecology Resources, 12, 18–35.
Cossios D, Angers B (2006) Identification of Andean felid feces using
PCR-RFLP. Mastozoologia Neotropical, 13, 239–244.
Dutta T, Sharma S, Maldonado JE, Wood TC, Seidensticker J (2012) A
reliable method for individual identification and gender determination
of wild leopards (Panthera pardus fusca) using non-invasive samples.
Conservation Genetics Resources, 4, 665–667.
Farrell LE, Roman J, Sunquist ME (2000) Dietary separation of sympatric
carnivores identified by molecular analysis of scats. Molecular Ecology,
9, 1583–1590.
Grisolia AB, Moreno VR, Campagnari F et al. (2007) Genetic diversity of
microsatellite loci in Leopardus pardalis, Leopardus wiedii and Leopardus
tigrinus. Genetics and Molecular Research, 6, 382–389.
Haag T, Santos AS, De Angelo C et al. (2009) Development and testing of
an optimized method for DNA-based identification of jaguar (Panthera
onca) and puma (Puma concolor) faecal samples for use in ecological
and genetic studies. Genetica, 136, 505–512.
Hoss M, Kohn M, Paabo S, Knauer F, Schroder W (1992) Excrement
analysis by PCR. Nature, 359, 199.
Housley DJE, Zalewski ZA, Beckett SE, Venta PJ (2006) Design factors
that influence PCR amplification success of cross-species primers
among 1147 mammalian primer pairs. BMC Genomics, 7, 253.
Johnson WE, Slattery JP, Eizirik E et al. (1999) Disparate phylogeographic
patterns of molecular genetic variation in four closely related South
American small cat species. Molecular Ecology, 8, S79–S94.
Kalinowski ST (2005) HP-RARE 1.0: a computer program for performing
rarefaction on measures of allelic richness. Molecular Ecology Notes, 5,
187–189.
Kalinowski ST, Taper ML, Marshall TC (2007) Revising how the com-
puter program cervus accommodates genotyping error increases suc-
cess in paternity assignment. Molecular Ecology, 16, 1099–1106.
Kelly MJ, Betsch J, Wultsch C, Mesa B, Mills LS (2012) Noninvasive sam-
pling for carnivores. In: Carnivore Ecology and Conservation - A Handbook
of Techniques (eds Boitani L, Powell RA), pp. 47–69. Oxford University
Press, N.Y., US.
Kitano T, Umetsu K, Tian W, Osawa M (2007) Two universal primer sets
for species identification among vertebrates. International Journal of
Legal Medicine, 121, 423–427.
Kocher TD, Thomas WK, Meyer A et al. (1989) Dynamics of mitochon-
drial DNA evolution in animals - amplification and sequencing with
conserved primers. Proceedings of the National Academy of Sciences of the
United States of America, 86, 6196–6200.
Kohn MH, Wayne RK (1997) Facts from feces revisited. Trends in Ecology
& Evolution, 12, 223–227.
Linnell JDC, Strand O (2000) Interference interactions, co-existence and
conservation of mammalian carnivores. Diversity and Distributions, 6,
169–176.
Long RA, Donovan TM, Mackay P, Zielinski WJ, Buzas JS (2007) Effec-
tiveness of scat detection dogs for detecting forest carnivores. Journal of
Wildlife Management, 71, 2007–2017.
Maudet C, Beja-Pereira A, Zeyl E et al. (2004) A standard set of polymor-
phic microsatellites for threatened mountain ungulates (Caprini, Artio-
dactyla). Molecular Ecology Notes, 4, 49–55.
Menotti-Raymond M, O’Brien SJ (1995) Evolutionary conservation of ten
microsatellite loci in four species of Felidae. The Journal of Heredity, 86,
319–322.
Menotti-Raymond M, David VA, Lyons LA et al. (1999) A genetic linkage
map of microsatellites in the domestic cat (Felis catus). Genomics, 57,
9–23.
Menotti-Raymond M, David V, Wachter L, Butler J, O’Brien S (2005) An
STIR forensic typing system for genetic individualization of domestic
cat (Felis catus) samples. Journal of Forensic Sciences, 50, 1061–1070.
Michalski F, Valdez FP, Norris D et al. (2011) Successful carnivore identi-
fication with faecal DNA across a fragmented Amazonian landscape.
Molecular Ecology Resources, 11, 862–871.
Miller CR, Joyce P, Waits LP (2002) Assessing allelic dropout and geno-
type reliability using maximum likelihood. Genetics, 160, 357–366.
Mills LS, Citta JJ, Lair KP, Schwartz MK, Tallmon DA (2000) Estimating
animal abundance using noninvasive DNA sampling: promise and pit-
falls. Ecological Applications, 10, 283–294.
Miotto RA, Rodrigues FP, Ciocheti G, Galetti PM (2007) Determination of
the minimum population size of pumas (Puma concolor) through fecal
DNA analysis in two protected cerrado areas in the Brazilian South-
east. Biotropica, 39, 647–654.
Mondol S, Karanth KU, Kumar NS et al. (2009a) Evaluation of non-inva-
sive genetic sampling methods for estimating tiger population size.
Biological Conservation, 142, 2350–2360.
Mondol S, Navya R, Athreya V et al. (2009b) A panel of microsatellites to
individually identify leopards and its application to leopard monitor-
ing in human dominated landscapes. BMC Genetics, 10, 79.
Mondol S, Thatte P, Yadav P, Ramakrishnan U (2012) A set of miniSTRs
for population genetic analyses of tigers (Panthera tigris) with cross-
species amplification for seven other Felidae. Conservation Genetics
Resources, 4, 63–66.
Moore SS, Sargeant LL, King TJ et al. (1991) The conservation of dinucleo-
tide microsatellites among mammalian genomes allows the use of het-
erologous PCR primer pairs in closely related species. Genomics, 10,
654–660.
Moreno VR, Grisolia AB, Campagnari F et al. (2006) Genetic variability of
Herpailurus yagouaroundi, Puma concolor and Panthera onca (Mammalia,
Felidae) studied using Felis catus microsatellites. Genetics and Molecular
Biology, 29, 290–293.
Oliveira R, Godinho R, Randi E, Ferrand N, Alves PC (2008) Molecular
analysis of hybridisation between wild and domestic cats (Felis silves-
tris) in Portugal: implications for conservation. Conservation Genetics, 9,
1–11.
Peakall ROD, Smouse PE (2006) Genalex 6: genetic analysis in Excel. Pop-
ulation genetic software for teaching and research. Molecular Ecology
Notes, 6, 288–295.
Piggott MP (2004) Effect of sample age and season of collection on the
reliability of microsatellite genotyping of faecal DNA. Wildlife Research,
31, 485–493.
© 2014 John Wiley & Sons Ltd
NONINVASIVE TRACKING OF WILD FELIDS IN BELIZE 1181
Pilot M, Gralak B, Goszczynski J, Posluszny M (2007) A method of
genetic identification of pine marten (Martes martes) and stone marten
(Martes foina) and its application to faecal samples. Journal of Zoology,
271, 140–147.
Pritchard JK, Stephens M, Donnelly P (2000) Inference of population
structure using multilocus genotype data. Genetics, 155, 945–959.
R Development Core Team (2009) R: A Language and Environment for Sta-
tistical Computing. R Foundation for Statistical Computing, Vienna,
Austria.
Raymond M, Rousset F (1995) Genepop (Version -1.2) - Population-
genetics software for exact tests and ecumenicism. Journal of Heredity,
86, 248–249.
Rice WR (1989) Analyzing tables of statistical tests. Evolution, 43, 223–225.
Rodgers TW, Janecka JE (2013) Applications and techniques for non-inva-
sive faecal genetics research in felid conservation. European Journal of
Wildlife Research, 59, 1–16.
Roques S, Adrados B, Chavez C et al. (2011) Identification of Neotropical
felid faeces using RCP-PCR. Molecular Ecology Resources, 11, 171–175.
Schwartz MK, Pilgrim KL, McKelvey KS et al. (2004) Hybridization
between Canada lynx and bobcats: genetic results and management
implications. Conservation Genetics, 5, 349–355.
Selkoe KA, Toonen RJ (2006) Microsatellites for ecologists: a practical
guide to using and evaluating microsatellite markers. Ecology Letters, 9,
615–629.
Seutin G, White BN, Boag PT (1991) Preservation of avian blood and tis-
sue samples for DNA analyses. Canadian Journal of Zoology, 69, 82–90.
Singh A, Gaur A, Shailaja K, Bala BS, Singh L (2004) Novel microsatellite
(STR) marker for forensic identification of big cats in India. Forensic
Science International, 141, 143–147.
Soto-Calderon ID, Ntie S, Mickala P et al. (2009) Effects of storage type
and time on DNA amplification success in tropical ungulate faeces.
Molecular Ecology Resources, 9, 471–479.
Stenglein JL, De Barba M, Ausband DE, Waits LP (2010) Impacts of sam-
pling location within a faeces on DNA quality in two carnivore spe-
cies. Molecular Ecology Resources, 10, 109–114.
Sunnucks P (2000) Efficient genetic markers for population biology.
Trends in Ecology & Evolution, 15, 199–203.
Sunquist M, Sunquist F (2002) Appendix 3 - Olfactory communication in
felids. In: Wild Cats of the World (eds Sunquist M, Sunquist F), pp. 413–
420. The University of Chicago Press, Chicago, Illinois, US.
Taberlet P, Luikart G (1999) Non-invasive genetic sampling and individ-
ual identification. Biological Journal of the Linnean Society, 68, 41–55.
Taberlet P, Griffin S, Goossens B et al. (1996) Reliable genotyping of sam-
ples with very low DNA quantities using PCR. Nucleic Acids Research,
24, 3189–3194.
Taberlet P, Waits LP, Luikart G (1999) Noninvasive genetic sampling:
look before you leap. Trends in Ecology & Evolution, 14, 323–327.
Trigo TC, Freitas TRO, Kunzler G et al. (2008) Inter-species hybridization
among Neotropical cats of the genus Leopardus, and evidence for an
introgressive hybrid zone between L. geoffroyi and L. tigrinus in south-
ern Brazil. Molecular Ecology, 17, 4317–4333.
Valiere N (2002) GIMLET: a computer program for analysing genetic
individual identification data. Molecular Ecology Notes, 2, 377–379.
Van Oosterhout C, Hutchinson WF, Wills DPM, Shipley P (2004) MICRO-
CHECKER: software for identifying and correcting genotyping errors
in microsatellite data. Molecular Ecology Notes, 4, 535–538.
Vynne C, Baker MR, Breuer ZK, Wasser SK (2012) Factors influencing
degradation of DNA and hormones in maned wolf scat. Animal Conser-
vation, 15, 184–194.
Waits JL, Leberg PL (2000) Biases associated with population estimation
using molecular tagging. Animal Conservation, 3, 191–199.
Waits LP, Paetkau D (2005) Noninvasive genetic sampling tools for wild-
life biologists: a review of applications and recommendations for accu-
rate data collection. Journal of Wildlife Management, 69, 1419–1433.
Waits LP, Luikart G, Taberlet P (2001) Estimating the probability of iden-
tity among genotypes in natural populations: cautions and guidelines.
Molecular Ecology, 10, 249–256.
Wang IJ (2011) Choosing appropriate genetic markers and analytical
methods for testing landscape genetic hypotheses. Molecular Ecology,
20, 2480–2482.
Wasser SK, Houston CS, Koehler GM, Cadd GG, Fain SR (1997) Tech-
niques for application of faecal DNA methods to field studies of
Ursids. Molecular Ecology, 6, 1091–1097.
Wasser SK, Davenport B, Ramage ER et al. (2004) Scat detection dogs in
wildlife research and management: application to grizzly and black
bears in the Yellowhead Ecosystem, Alberta, Canada. Canadian Journal
of Zoology, 82, 475–492.
Williamson JE, Huebinger RM, Sommer JA, Louis EE, Barber RC (2002)
Development and cross-species amplification of 18 microsatellite
markers in the Sumatran tiger (Panthera tigris sumatrae). Molecular
Ecology Notes, 2, 110–112.
Wilting A, Buckley-Beason VA, Feldhaar H et al. (2007) Clouded leopard
phylogeny revisited: support for species recognition and population
division between Borneo and Sumatra. Frontiers in Zoology, 4, 15.
Zuercher GL, Gipson PS, Stewart GC (2003) Identification of carnivore
feces by local peoples and molecular analyses. Wildlife Society Bulletin,
31, 961–970.
C.W. conducted the field sampling, laboratory and data
analysis, data interpretation and wrote the manuscript.
L.P.W. assisted with laboratory protocols and study
design, data interpretation, and the preparation of the
manuscript. M.J.K. assisted with field study design, data
interpretation and the preparation of the manuscript.
Data Accessibility
Structure input file and mtDNA sequence alignments are
accessible via DRYAD database, doi:10.5061/dryad.
j248q.
Supporting Information
Additional Supporting Information may be found in the online
version of this article:
Table S1 Species-specific allele size ranges and allele sizes for
jaguars, pumas and ocelots in Belize using 14 microsatellite loci.
© 2014 John Wiley & Sons Ltd
1182 C. WULTSCH, L . P . WAITS and M. J . KELLY