Nonintrusive Fast Response Oxygen Monitoring …...Nonintrusive Fast Response Oxygen Monitoring...
68
NASA Contractor Report 4553 Nonintrusive Fast Response Oxygen Monitoring System for High Temperature Flows Daniel B. Oh and Alan C. Stanton Southwest Sciences, Inc. Santa Fe, New Mexico Prepared for Langley Research Center under Contract NAS1-19097 National Aeronautics and Space Administration Office of Management Scientific and Technical Information Program 1993 u'h P,_ u_ ,,,I" ,=_ _ 4" I ,'-- 4" 4" O O, r_ "I" https://ntrs.nasa.gov/search.jsp?R=19940013182 2020-06-05T16:11:14+00:00Z
Transcript of Nonintrusive Fast Response Oxygen Monitoring …...Nonintrusive Fast Response Oxygen Monitoring...
NASA Contractor Report 4553
Nonintrusive Fast Response
Oxygen Monitoring System
for High Temperature Flows
Daniel B. Oh and Alan C. Stanton
Southwest Sciences, Inc.
Santa Fe, New Mexico
Prepared for
Langley Research Center
under Contract NAS1-19097
National Aeronautics andSpace Administration
Office of Management
Scientific and Technical
Information Program
1993
u'h
P,_ u_ ,,,I",=_ _ 4"I ,'-- 4"
4" O O,
r_
"I"
https://ntrs.nasa.gov/search.jsp?R=19940013182 2020-06-05T16:11:14+00:00Z


PROJECT SUMMARY
The monitoring and control of molecular oxygen concentrations is important in the operation of high
temperature wind tunnels used in development and testing of hypersonic air-breathing engines.
Maintaining proper O 2 concentrations is important to avoid damage to test engines and to permit accurate
studies of engine performance. Fast time response in monitoring and control of 02 is required, since the
run time of large wind tunnels is often less than one minute. Also, experimental research on airbreathing
hypersonic propulsion requires new diagnostic capabilities for nonintrusive measurement of important flow
and engine performance parameters (e.g. inlet mass capture, combustion efficiency, thrust). Nonintrusive
measurement of species concentrations, gas temperature, and flow velocity can provide much of the
needed information. The purpose of this study is to investigate a new concept for nonintrusive, fast-
response measurement of 02 number density and other flow parameters in high speed wind tunnels, based
on absorption of near-infrared radiation from inexpensive commercial laser diodes used in the
optoelectronics industry.
In the Phase I research, laboratory breadboard instrumentation incorporating a standard commercial
GaAIAs diode laser was used to measure molecular oxygen in room air, in air heated by a tube furnace
at 1375 K, and in a methane-oxygen flame. The technique of high frequency laser modulation with
harmonic detection was used to obtain very high sensitivity for measurement of small optical absorptions.
In addition, the use of fiber optics in 02 monitoring instrumentation based on this technique was
investigated.
The primary goals of the Phase II research and development program have been to implement this
diagnostic approach in prototype instrumentation that can be used for nonintrusive in situ measurement
of O 2 concentration, gas temperature, and flow velocity in wind tunnel facilities at the NASA Langley
Research Center. The instrumentation is designed for simultaneous measurements along multiple lines
of sight accessed by fiber optics. Molecular oxygen concentration is measured from the magnitude of
absorption signals, gas temperature (rotational temperature) is determined from the intensity ratio of two
0 2 absorption lines, and flow velocity is measured from the Doppler shift of absorption line positions.
The prototype instrument has been tested extensively in laboratory flames, emphasizing assessment
of the instrument's capabilities for quantitative measurement of 0 2 concentration (mole fraction) and gas
temperature. Fuel-lean premixed methane/O 2 flames were studied, using a flat flame burner. The
spectroscopically determined temperatures were found to be in generally good agreement with
thermocouple measurements, while the spectroscopically derived values for 0 2 mole fraction were found
to be systematically lower than the values expected from flame stoichiometry. This latter result is shown
to be a consequence of nonuniform temperature profiles across the line of sight, particularly the cooler
edges of the flame. Careful selection of the 0 2 absorption line(s) used for concentration measurements,
based on approximate knowledge of the temperature field, can minimize the systematic errors due to
iii
PI_GIDINQ PAGE BLANK NOT FILMED

nonuniform temperature. The specific absorption lines used in this work are expected to be well suited
to measurements in systems with gas temperatures in the 600 to 1000 K range, but a different choice of
lines may be indicated for higher or lower temperature flows.
The detection sensitivity in the flame experiments corresponds to a minimum detectable absorbance
of about 4 x 10⁻⁶ at detection bandwidths of about t Hz. This sensitivity is achieved only by subtraction
of background interference fringes due to scattering from various optical surfaces in the fiber optic system,
especially the input and output coupling optics. At least an order of magnitude improvement in sensitivity
has been achieved when the fiber optics are removed from the system and the number of transmissive
optical components is minimized.
The near-infrared diode laser absorption techniques studied in this program may also be applied to
the measurement of other important gases in combustion, such as fuel or product species. Water vapor
is a natural candidate species that is important in hypersonic combustion and can be measured with high
sensitivity using near-IR InGaAsP lasers. Other potential applications of this technology include toxic or
contaminant gas detection, on-line monitoring of industrial processes, pollutant monitoring, and
atmospheric research.
iv

TABLE OF CONTENTS
1. INTRODUCTION..................................................... l
2. PHASE lI RESEARCH OBJECTIVES ....................................... 3
3. DESCRIPTION OF MEASUREMENT APPROACH ............................. 4
3.1 Overview ........................................................ 4
3.2 Absorption Spectroscopy of Molecular Oxygen Using Near-lR Diode Lasers ......... 4
3.3 High Frequency Wavelength Modulation Spectroscopy ......................... 6
3.4 Spectroscopic Measurement of 0 2 Concentration, Temperature, and Flow Velocity ..... 7
3.5 Laboratory Measurement of 0 2 Spectral Parameters ........................... 9
4. LABORATORY FLAME MEASUREMENTS ................................. 14
4.1 Introduction ..................................................... 14
4.2 Experimental Description ............................................ 14
4.3 Experimental Results ............................................... 17
4.4 Discussion ...................................................... 21
4.5 Conclusion ...................................................... 28
5. MULTI-CHANNEL FIBER OPTIC SYSTEM ................................. 29
5.1 Introduction ..................................................... 29
5.2 Optics and Electronics .............................................. 29
5.3 Data Acquisition .................................................. 30
6. CONCLUSIONS AND RECOMMENDATIONS ............................... 32
7. REFERENCES ....................................................... 33
APPENDIX : INSTRUMENT MANUAL FOR 02 DIAGNOSTIC SYSTEM

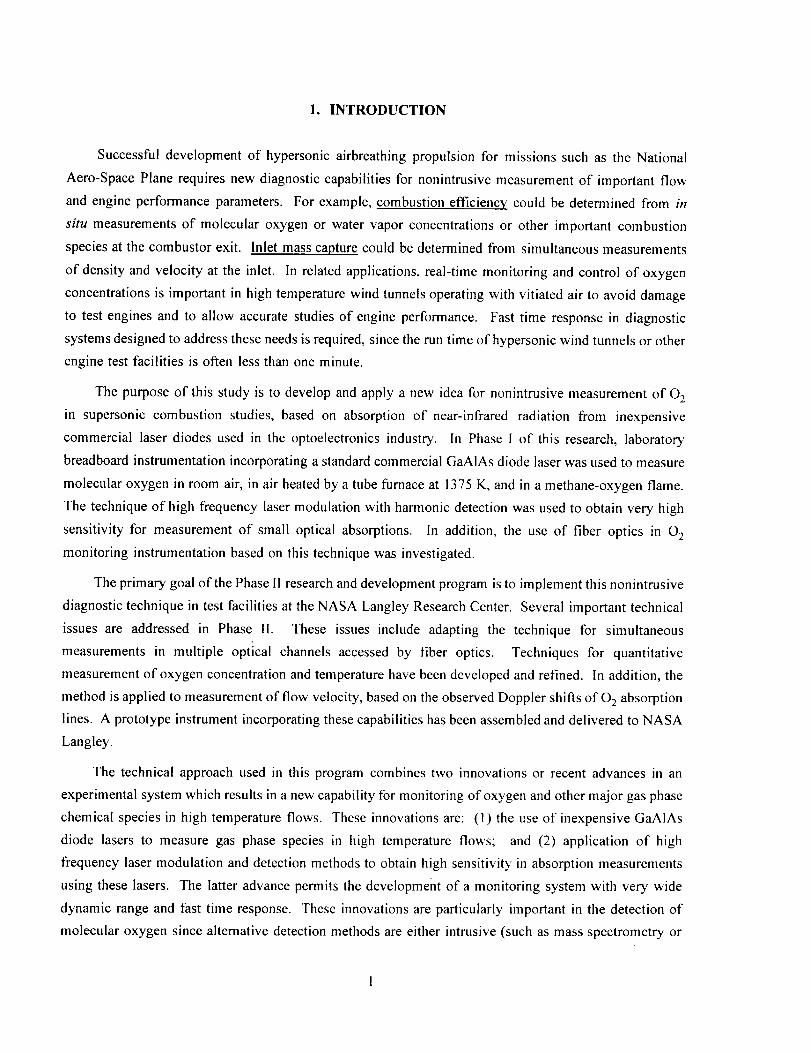
1. INTRODUCTION
Successful development of hypersonic airbreathing propulsion for missions such as the National
Aero-Space Plane requires new diagnostic capabilities for nonintrusive measurement of important flow
and engine performance parameters. For example, combustion efficiency could be determined from in
situ measurements of molecular oxygen or water vapor concentrations or other important combustion
species at the combustor exit. Inlet mass capture could be determined from simultaneous measurements
of density and velocity at the inlet. In related applications, real-time monitoring and control of oxygen
concentrations is important in high temperature wind tunnels operating with vitiated air to avoid damage
to test engines and to allow accurate studies of engine performance. Fast time response in diagnostic
systems designed to address these needs is required, since the run time of hypersonic wind tunnels or other
engine test facilities is often less than one minute.
The purpose of this study is to develop and apply a new idea for nonintrusive measurement of 02
in supersonic combustion studies, based on absorption of near-infrared radiation from inexpensive
commercial laser diodes used in the optoelectronics industry. In Phase I of this research, laboratory
breadboard instrumentation incorporating a standard commercial GaAIAs diode laser was used to measure
molecular oxygen in room air, in air heated by a tube furnace at 1375 K, and in a methane-oxygen flame.
The technique of high frequency laser modulation with harmonic detection was used to obtain very high
sensitivity for measurement of small optical absorptions. In addition, the use of fiber optics in 02
monitoring instrumentation based on this technique was investigated.
The primary goal of the Phase II research and development program is to implement this nonintrusive
diagnostic technique in test facilities at the NASA Langley Research Center. Several important technical
issues are addressed in Phase II. These issues include adapting the technique for simultaneous
measurements in multiple optical channels accessed by fiber optics. Techniques for quantitative
measurement of oxygen concentration and temperature have been developed and refined. In addition, the
method is applied to measurement of flow velocity, based on the observed Doppler shifts of 02 absorption
lines. A prototype instrument incorporating these capabilities has been assembled and delivered to NASA
Langley.
The technical approach used in this program combines two innovations or recent advances in an
experimental system which results in a new capability for monitoring of oxygen and other major gas phase
chemical species in high temperature flows. These innovations are: (1) the use of inexpensive GaA1As
diode lasers to measure gas phase species in high temperature flows; and (2) application of high
frequency laser modulation and detection methods to obtain high sensitivity in absorption measurements
using these lasers. The latter advance permits the development of a monitoring system with very wide
dynamic range and fast time response. These innovations are particularly important in the detection of
molecular oxygen since alternative detection methods are either intrusive (such as mass spectrometry or

electrochemicalmethods),l very expensive (non-linear laser methods such as CARS, or UV laser
absorption/laser induced fluorescence, 23 both of which require very costly lasers), or insufficiently
sensitive (UV absorption using lamps). While this effort is aimed at 02 monitoring, similar approaches
using diode lasers at other near-infrared wavelengths could be developed for detection of many other
species in high temperature flows, such as I-t20, CO 2, CO, or fuel species.
The objectives of the Phase II research are outlined briefly in the following section. The basis of
the experimental approach is described in detail in Section 3, and the results of measurements in laboratory
flames are discussed in Section 4. Section 5 provides a description of the multi-channel fiber optic system
designed specifically for the wind tunnel diagnostics. Section 6 provides a summary of the conclusions
reached in this program as well as a discussion of other applications of the diagnostic and
recommendations for further system improvements.

2. PHASE II RESEARCH OBJECTIVES
The primary objective of this Phase II research is to develop and demonstrate a prototype diagnostic
instrument for nonintrusive measurement of O2 concentration, temperature, and flow velocity in systems
used in supersonic combustion research. The instrument utilizes fiber optics to direct the diode laser
radiation into separate detection channels for simultaneous measurements along multiple lines of sight.
The profiles of flow properties derived from such measurements can be used to determine important
integrated performance parameters in scramjet propulsion testing, such as inlet mass capture and
combustion efficiency.
The essential technical objectives of the Phase II program are:
(1) Development and testing of a fiber optic detection system for simultaneous measurements along
multiple lines of sight.
(2) Laboratory calibration experiments to provide high accuracy for quantitative 0 2 detection.
(3) Optimization of techniques for temperature measurement based on measured ratios of absorption by
different 0 2 lines.
(4) Adaptation of the absorption measurement technique for determination of flow velocity from
observed Doppler shifts in the absorption line positions.
(5) Testing of a prototype instrument at the NASA Langley Research Center for measurement of 0 2
concentration, temperature, and flow velocity.
3

3. DESCRIPTION OF MEASUREMENT APPROACH
3.1 Overview
This section provides an overall description of the measurement approach, including a discussion of
the relevant molecular spectroscopy and a description of the operation of the near-IR diode lasers used
for the diagnostic. The technique of high frequency wavelength modulation spectroscopy, which is used
to achieve high sensitivity for measurement of small absorptions is then described. The technical approach
for using the 02 absorption measurements to determine 02 concentration, gas temperature, and flow
velocity is discussed. Finally, the laboratory measurement of critical spectral parameters (absorption line
strengths) is described. The specific designs developed in this program for implementing the diagnostic
for measurements in a flat flame burner and in wind tunnels are described in Sections 4 and 5,
respectively.
3.2 Absorption Spectroscopy of Molecular Oxygen Using Near-IR Diode Lasers
3.2.1 0 2 Atmospheric Bands
The measurement technique is based on the absorption of monochromatic near-infrared laser radiation
by molecular oxygen. Although vibrational bands ofO 2 are infrared-inactive, electronic bands in the near-
infrared spectral region can be used as the basis of an absorption diagnostic for measurement of 02
concentrations. In particular, the v '= 0 *-- v "= 0 band of the magnetic dipole transition from the X3E'g
ground electronic state to the excited blI2+g state occurs in a spectral region that is easily accessed by
commercial GaAIAs diode lasers operating in the 760 to 780 nm range. The bl_ ,--- xa[: band system
of oxygen, which is known as the 02 atmospheric band system, has been well characterized
spectroscopically. Several quantitative studies of the v "= 0 *-- v "= 0 band (sometimes called the "A" band)
have been performed, 4"6 yielding values for the line strength and line width parameters at room
temperature. Line parameters for this band are tabulated in the HITRAN database prepared by the Air
Force Phillips Laboratory/Geophysics Directorate] and very precise values for line strengths, self-
broadening, and air-broadening coefficients were obtained in the high resolution studies at room
temperature by Ritter and Wilkerson. 6 More detailed results including some temperature-dependent data
are available in the thesis by Ritter. 8
The O 2 A band consists of P and R branches, each composed of pairs of lines designated PP and PQ
(P branch) or RR and RQ (R branch). 9 These line pairs arise due to the splitting of the ground electronic
state rotational levels (designated by rotational quantum number K") into sublevels with total angular
momentum J" = K", K"+l, and K"-l, with only odd values of K" allowed. The upper electronic state has
only singlet levels with J' = K', where only even values of K" are allowed. The R branch spans a
wavelength region from approximately 759.5 to 762 rim, while the P branch occurs at wavelengths longer
than 762 rim. Commercially available diode lasers are better matched in wavelength to operation in the
4

R branch region. Laser operation in the R branch is advantageous for implementation of a temperature
diagnostic, as described in Section 3.4. All measurements of 02 in this program were made using lines
in the R branch.
3.2.2 Near-IR Diode Lasers for High Resolution Spectroscopy
The diode lasers used in this program are standard commercial GaAIAs devices manufactured by
Mitsubishi (Model ML4405) for applications such as compact disc players, bar code readers, and laser
printers. Because these lasers are manufactured in very high volume, the unit cost is quite low
(approximately $30 for small-quantity purchases). The ML4405 laser has a typical power of 3 mW, with
a nominal wavelength (at room temperature) of 750 nm. Lasers with similar operating characteristics are
available from other manufacturers (e.g., Sharp). The threshold current for these lasers is about 40 mA,
with the 3 mW output typically achieved at about 50 mA operating current. At 50 mA and higher
operating currents, the laser output spectrum is normally single mode; that is, the laser emission is
confined to a single frequency with a line width of approximately 100 MHz. The laser wavelength may
be coarsely tuned (tuning rate of approximately 0.25 nm °Cl) by varying the laser case temperature over
an operating range of-40 to +60 °C. Thus, by controlling the laser temperature, the wavelength may be
tuned into coincidence with many 02 absorption lines in the R branch region near 760 nm. We have
tested and used numerous of these lasers during the course of this research. The laser distributor (ILX
Lightwave) has been willing to pre-select lasers with room temperature wavelengths around 758 or 759
nm, so that only slight heating above room temperature (to temperatures of 25 to 30 °C) is required to
tune the lasers into the 02 absorption band.
High resolution tuning of the laser wavelength is accomplished by varying the laser diode injection
current using an ILX Lightwave Model LDX-3620 battery powered low-noise current source. The
instrumental width of the laser mode (-100 MHz, or 0.003 cm 1) is small compared to the spectral width
of the oxygen absorption lines (-0.04 cm l half width at half maximum for atmospheric pressure-
broadened lines at room temperature or Doppler-broadened lines at 2000 K). This small spectral line
width permits full resolution of the detailed molecular line shapes and also allows the selective
measurement of an individual 02 line without spectral interferences.
The laser as received is packaged in a hermetically-sealed window can (9 mm dia.). This package
also contains a photodiode for laser power monitoring from the rear facet of the laser diode. For all of
the experiments in this program, the laser package is housed in a commercial laser diode mount (ILX
Lightwave Model LDM-4412) which is designed for precision-controlled thermoelectric cooling or heating
of the laser (two TE coolers are contained in the mount). This mount is normally configured internally
with a 0.5 NA single-element lens for collimation of the laser output beam. The approximate size of the
mount is 2" (depth) × 4" (width) × 4" (height).

Thelasertemperatureisregulatedby acommercialcontrollersuppliedby ILX Lightwave(ModelLDT-5910B).Thisunitmonitorstheresistanceof acalibratedthermistorepoxiedto thelasermounting
plateandadjuststhecurrenttotheTEcoolerstoachieveadesiredsetpointtemperature.Thetemperaturestabilityof thissystemis betterthan0.01 °C.
The laser wavelength is calibrated using a Michelson interferometer wavelength meter (Burleigh
Wavemeter). The wavelength meter readings, combined with comparisons of measured and tabulated 02
spectra, are sufficient to permit unambiguous identification of the oxygen absorption lines. A confocal
etalon (TecOptics SA300, free spectral range = 300 MHz) establishes a frequency scale for measurement
of absorption line widths. A solid fused silica etalon (CVI Laser Corporation), with a free spectral range
of 2.04 GHz (0.068 cm q) and a finesse of 30, is used to measure shifts in line position for determining
flow velocity.
3.3 High Frequency Wavelength Modulation Spectroscopy
High frequency laser wavelength modulation spectroscopy (WMS) is used to measure the weak
absorption signals observed in these experiments. We have described this technique in considerable detail
in two recent publications, including comparisons with other high frequency diode laser detection methods
(e.g. one- and two-tone frequency modulation spectroscopy), l°-ll Briefly, this method, which is an
extension of diode laser "derivative spectroscopy" techniques widely used at kHz frequencies, 12 involves
superposition of a small sinusoidal modulation on the diode laser injection current. Typically, the
amplitude of the current modulation is chosen so that the induced wavelength modulation is comparable
to the width of the spectral feature under study. Phase-sensitive electronics are then used to demodulate
the detector photocurrent at the modulation frequency, f, or a harmonic, n]. By implementing this
technique at sufficiently high frequencies, laser noise is minimal and detector-limited (ideally, shot noise-
limited) sensitivity can be achieved. Our studies have shown that detection frequencies as low as 100 kHz
are often sufficient to achieve these objectives, although the optimum frequencies are laser dependent.
The distinction between WMS and FM spectroscopy (as described, for example, in Ref. 13) is mostly
semantic - FM spectroscopy is defined as using modulation frequencies comparable to the absorption
linewidths (-1 GHz or greater for the present experiment), whereas WMS uses modulation frequencies
much smaller than the absorption linewidths. The distinction becomes important for high temperature
measurements where Doppler broadened lines would require modulation frequencies well into the GHz
regime using the FM schemes.
In the present work, we use 50 kHz modulation with second harmonic detection. The detector output
is bandpass-filtered and amplified and sent to the RF input of a mixer (Minicircuits ZAD-8). The 50 kHz
sine wave for laser current modulation is generated by a Wavetek Model 191 signal generator and fed to
the external modulation input of the ILX laser current controller. The 50 kHz TTL reference output from
the Wavetek signal generator is sent to a phase shifter/frequency doubler (Evans Electronics Model 4114)
6
andthen used as the local oscillator input for 2f detection in the Minicircuits mixer. The mixer IF output
is amplified and low pass-filtered before digitization.
The data acquisition system utilizes a 20 MHz 80386-based microcomputer (Northgate). This system
uses a high speed 16-channel analog-to-digital converter board (Analog Devices RTI-860) that plugs into
the microcomputer bus. The laser wavelength is repetitively scanned with an analog voltage ramp
generated by a programmable waveform synthesizer (QuaTech WSB-10) which also plugs into the
computer bus. Each A/D cycle is synchronized with the repetitive scanning of the laser wavelength for
rapid averaging of the 2f signals. Typical parameters for a single scan are 512 data points, with a dwell
time of 50 #s per data point. For most data taken in this study, 1000 such scans are co-added.
Adaptation of this data acquisition system to multi-channel simultaneous detection is described in Section
5.
The second harmonic (2f) signals produced by WMS are directly proportional to absorbance, but the
factor relating the 2f signals to absorbance at line center is best determined by direct experimental
calibration. Ideally, such a calibration is done by comparing a direct transmission measurement of
absorption with a 2f measurement for the specific absorption feature under study. In the present study,
such calibrations are conveniently performed using suitable absorption path lengths in laboratory room air.
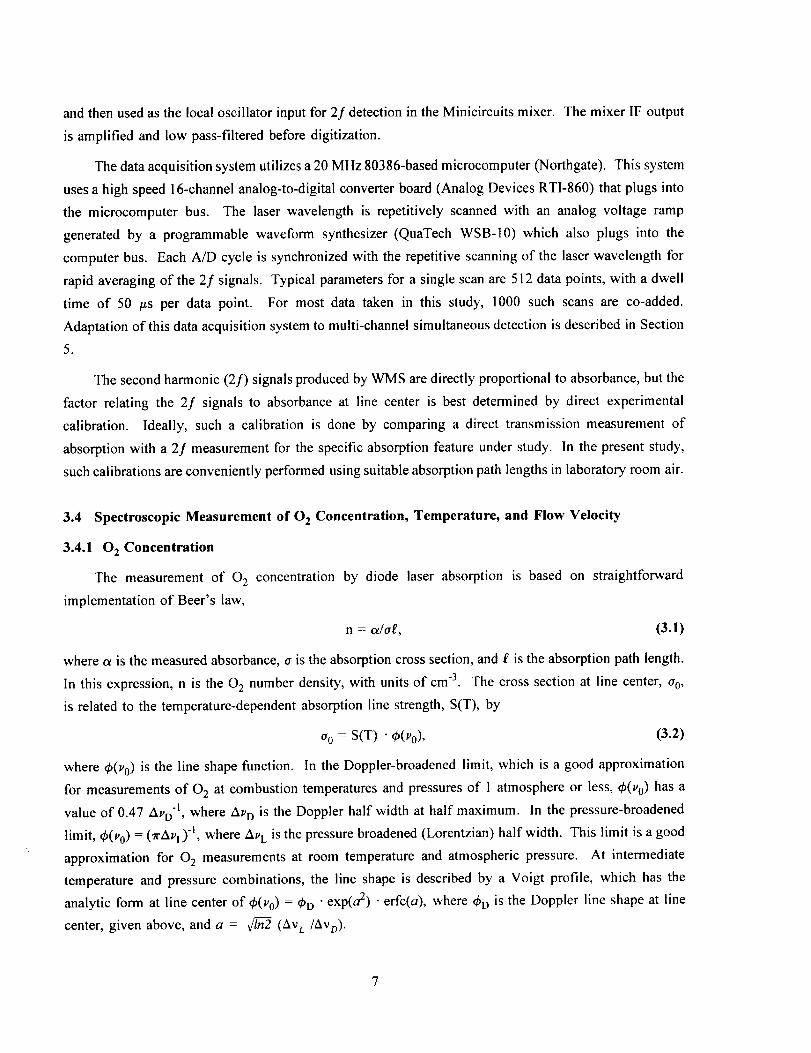
3.4 Spectroscopic Measurement of 0 2 Concentration, Temperature, and Flow Velocity
3.4.1 0 2 Concentration
The measurement of 0 2 concentration by diode laser absorption is based on straightforward
implementation of Beer's law,
n = a/of, (3.1)
where o_ is the measured absorbance, o is the absorption cross section, and f is the absorption path length.
In this expression, n is the 02 number density, with units of cm -3. The cross section at line center, %,
is related to the temperature-dependent absorption line strength, S(T), by
oo = S(T) • _b(%), (3.2)
where _b(u0) is the line shape function. In the Doppler-broadened limit, which is a good approximation
for measurements of 0 2 at combustion temperatures and pressures of 1 atmosphere or less, Oh(v0) has a
value of 0.47 AJ,D'I, where Ap D is the Doppler half width at half maximum. In the pressure-broadened
limit, 4_(u0) = ('/I'APL)'I, where AvE is the pressure broadened (Lorentzian) half width. This limit is a good
approximation for 0 2 measurements at room temperature and atmospheric pressure. At intermediate
temperature and pressure combinations, the line shape is described by a Voigt profile, which has the
analytic form at line center of _b(u0) = t_ o • exp(a 2) • erfc(a), where q_O is the Doppler line shape at line
center, given above, and a = _ (Av L /AVD).
7

Fromtheabovediscussion,one can see that the determination of 02 number density by the diode
laser absorption technique depends on spectroscopic parameters that are functions of temperature. The
temperature dependence of the line strength S(T) can be readily calculated to very high accuracy, as noted
below. Thus, this parameter is well known at all temperatures provided that it has been accurately
measured at one temperature. As described in Section 3.5, we conducted accurate laboratory
measurements of the relevant 02 line strengths at room temperature.
Two points should be noted concerning the temperature dependences contained in Eqs. 3.1 and 3.2.
First, since the cross section is temperature dependent, best accuracy in measurement of number density
requires knowledge of the gas temperature. In the present case, since gas temperature is itself a
measurement objective, this information can be obtained by the techniques described below. In the more
general case, where gas temperature may not be well characterized, uncertainties associated with imperfect
knowledge of temperature can be minimized by selecting an absorption line with a cross section that is
relatively insensitive to temperature over the range of temperatures expected. This point is discussed
further in Section 4.4.
The second important point regarding temperature dependences is that temperature inhomogeneities
along the line of sight may affect the accuracy of concentration measurements. The results of our flat
flame burner studies, presented in Section 4, contain an example of how the accuracy of 02 mole fraction
measurements is degraded by a nonuniform temperature distribution across the line of sight. Again, these
effects can be minimized by the careful selection of 02 absorption line(s), as described in Section 4.4.
3.4.2 Temperature
Flow temperatures are determined by measuring the ratio of absorption signals for two 0 2 absorption
lines. This ratio is proportional to the ratio of line strengths, which depends only on temperature and
known molecular parameters. The line strength ratio for two 0 2 absorption lines is
s, S,(To)
s (ro) -hcAF,o, 1 __o) ]exp[ k (T (3.3)
where T O is a reference temperature (room temperature, for example) and AEro t is the difference in lower
state rotational energy for the two 02 absorption lines. In the present study, we have mostly used a line
pair consisting of the RQ(23,24) and RQ(33,34) lines, with lower state rotational energies of 791.034 cm 1
and 1605.806 cm l, respectively. 7 Figure 3.1 shows the ratio of the strengths of these two lines as a
function of temperature. The sensitivity of temperature measurements using this line pair is best at
temperatures below 2000 K, where the line strength ratio changes more rapidly with temperature.

8
v
4
O
E2
0
500 1000] , i
1500 2000
Temperature (K)
Figure 3.1. Temperature dependence of the line strength ratio for the0 2 line pair used in temperature measurements.
3.4.3 Flow Velocity
Measurement of flow velocity is perhaps the simplest of the three measurement objectives in this
program. Velocity is determined by measuring the Doppler shift of the O 2 absorption line positions for
lines of sight that have a directional component along the flow axis. Various strategies can be adopted
for choosing the line of sight direction(s). An example is shown in Fig. 3.1. In this case two lines of
sight are chosen through the flow, at angles 0 and -0 measured with respect to a direction normal to the
flow. The line center of the absorption peak is separated by a frequency difference
Au = v0 • 2 sin 0 • v/c, (3.4)
where v is the directed flow velocity and c is the speed of light. An advantage of using two lines of sight
through the flow, rather than a reference line of sight through static gas, is that compensation for any
pressure-induced shifts in line position is automatic. An etalon is used to establish the frequency scale
in the spectral scans, as described in Section 3.2.2.
3.5 Laboratory Measurement of 0 2 Spectral Parameters
To permit quantitative measurement of 0 2 concentrations with minimum uncertainty, we sought
absorption lines with maximum line strengths under the high temperature conditions of interest. In order
for the absorption lines to be useful for measuring temperature simultaneously, however, the ratio of
strengths for a chosen line pair must exhibit good sensitivity to changes in temperature. Furthermore,
9

theselinesmustbesufficientlyseparatedfromone another so that they are free of interferences, yet they
must still be contained within the tuning range of a diode laser mode (typically -1 cmq). Requirements
for absorption lines to be used in velocity measurements are also covered by these constraints. Further
discussion of other considerations in selecting 0 2 absorption lines, depending on the measurement
objective, is provided in Section 4.4.
Gas Flow
t)
I
/--
P
A) B)
ApI I
I Il I
i l
A)
'AE II II It I
Figure 3.2. Determination of flow velocity by measurement of the separationof the Doppler shifted line center frequencies for two lines of sight.
As noted above, we chose the RQ(33,34) and RQ(23,24) absorption lines for the measurements of
O 2 concentration, temperature and flow velocity. Figure 3.3 shows an experimental absorption spectrum
of the RQ(33,34) and RQ(23,24) lines which was obtained with the wavelength modulation technique (50
kHz laser modulation, second harmonic detection). With line centers of the two absorption lines separated
by 0.41 cm t, these features are well separated, yet they are contained within the typical tuning range of
a single laser mode. The R-branch region of the 02 absorption band is particularly convenient for
temperature measurements, because absorption lines originating from rotational levels with significantly
different energies occur at closely spaced frequencies.
We undertook careful measurements of the line strengths of the chosen lines under room temperature
conditions in order to assess the reliability of previously reported cross sections and provide
experimentally determined reference values for calculating line strengths at higher temperature. Accurate
knowledge of the absorption line strengths provides the basis for quantitative measurement of 02 number
density and temperature using the diode laser instrumentation.
10

RQ(23,24)
(13163.7871 cm -1)
RQ(33,34)
(13164.1963 cm -1)
i'
,i
I'
ii
ii
0.4092 cm 1 i I
i II
iI
I
i I
I
"_,,, iI
'_, ,iI
I
!
I
I
/
Figure 3.3. Experimental absorption spectrum showing the two 02 linesselected for concentration, temperature, and velocity measurements.
For the line strength measurements, the diode laser output was divided by a 50/50 beamsplitter. One
beam was sent to the confocal etalon for calibration of changes in the laser wavelength as the laser current
is scanned. An optical isolator (lsowave 1-80-UHP-A), installed between the etalon and the laser diode,
eliminated optical feedback and enabled stable laser operation. The other beam was directed to a
multipass 02 cell (Herriott type; 1445 cm long, 30 passes), and the attenuation of the output intensity was
monitored by a silicon photodiode (Centronic BPX-65). The signal from the photodiode was filtered and
amplified (Stanford Research SR560), digitized with a transient digitizer (CAMAC Module DSP 2012S),
and then stored in a microcomputer for later analysis.
To record the absorption spectrum of the RQ(23,24) and RQ(33,34) lines, we used a rapid scan
method in which a train of saw tooth voltage ramps was applied to the laser current controller, resulting
in repetitive wavelength sweeps across the region of interest. At a scan repetition rate of 100 Hz,
averaging 1000 to 4000 sweeps resulted in direct absorption spectra with excellent signal to noise ratio
for the RQ(23,24) line. As the O 2 pressure was varied from 600 Torr to 5 Torr, the peak absorbance of
the RQ(23,24) line changed from 18% to 0.4% at 298 K. The peak absorbance of the RQ(33,34) line was
about 30 to 35 times lower than the RQ(23,24) peak absorbance at each pressure, rendering accurate
analysis of the weaker line difficult from direct absorption spectra. To improve the sensitivity of the
RQ(33,34) line strength measurement, we used wavelength modulation spectroscopy (50 kHz laser
modulation, second harmonic detection).
11

Directabsorptionspectraof theRQ(23,24)line,obtainedunderseveral02pressures,werefittedto
Voigtprofiles. Fromthefittedabsorptionlineshape,theintegratedabsorbancewasobtainedat each 0 2
pressure. Background absorbance, due to air in the laser beam path external to the absorption cell, was
measured by evacuating the cell and was subtracted from each spectrum. Figure 3.4 shows the plot of
integrated absorbance as a function of pressure as well as the fit obtained from a weighted linear least
squares procedure. The strength of the RQ(23,24) line at 298 K, obtained from the slope of the fitted line,
is 7.50 + 0.13 x 10⁻²⁵ cm 2 molecule "l cm °1. This result compares with the line strengths of 8.08 + 0.011
× 10.25 measured by Ritter and Wilkerson 6 and 7.11 × 10⁻²⁵ given in the HITRAN atmospheric line
parameters compilation. 7 The original source of the HITRAN data is not specified, and no uncertainty
estimates are available.
0.02_
o 0.015co_
oO.Ol
_ 0.005
0 LJ_0
Figure 3.4.
1 O0 200 300 400 500 600
Pressure (torr)
L
700
Measured integrated absorbance as a function of oxygen pressurefor the RQ(23,24) absorption line.
There was a small characteristic mismatch in line shape between the calculated Voigt profile and the
experimental absorption peak which could be attributed to collision-induced line narrowing. 6 Line shape
expressions such as the Galatry profile can be used to account for this process that the Voigt profile
ignores. 15 For the purpose of obtaining line strengths, however, we found the Voigt profile to be quite
adequate since the area under the best-fit Voigt profile and the experimental peak agreed to within 2 to
3 percent over the full range of O 2 pressure which we employed. In measuring the pressure broadening
coefficient, where the shape of the absorption peak and not the area determines the parameter, accounting
for the line narrowing effect becomes more important.
12

For measurementsof the weakerRQ(33,34)line using 50 kHz wavelength modulation, the
wavelength modulation amplitude was optimized for biggest second harmonic (2f) signal at each 02
pressure by actively monitoring the RQ(23,24) 2f signal on an oscilloscope while adjusting the current
modulation amplitude. Second harmonic spectra were recorded using the rapid scan method. Averaging
1000 to 4000 sweeps resulted in 2] spectra with good signal to noise for data analysis. The background
absorption spectrum from the room air path was recorded after each run with the Herriott cell evacuated.
This background was subtracted from each experimental spectrum.
To determine the RQ(33,34) line strength from the 2f spectra, we measured the relative integrated
2f signal strengths of the RQ(23,24) and RQ(33,34) lines at each 02 pressure. With the RQ(23,24) line
strength already determined absolutely, we could then obtain the RQ(33,34) line strength from the
measured ratio. In addition to the background subtraction, each 2f spectrum was normalized by the
detected laser intensity to account for the variation of laser power with current. The difference in the
pressure broadening coefficient for the RQ(23,24) and RQ(33,34) lines (0.0395 cm "l atm -1 and 0.033 cm q
atm -l, respectively, from Ritter and Wilkerson 6) was expected to affect the relative signal strengths of the
2f spectra. This effect was estimated by theoretical calculation, and a suitable correction was applied in
the data analysis. The wavelength modulation theory used in these calculations is discussed in detail in
Ref. 10. Weighted averaging of the measured signal strength ratios resulted in a ratio of the RQ(23,24)
to RQ(33,34) line strengths of 37.90 + 0.16. From this ratio, an RQ(33,34) line strength at 298 K of 1.98
± 0.04 x 10⁻²⁶ cm 2 molecule -1 cm -1 is obtained.
The HITRAN compilation reports the RQ(33,34) line strength as 1.911 × 10 -26, corresponding to a
line strength ratio of 37.19. Ritter and Wilkerson do not report a measurement of the RQ(33,34) line
strength, but they describe several theoretical expressions that are available for calculating the relative 02
line strengths. The theory that yields the best agreement with the Ritter and Wilkerson relative
experimental line strengths is due to Watson. Using the Watson expression, we calculate the expected
RQ(23,24)/RQ(33,34) line strength ratio at 298 K as 36.24. These comparisons indicate good agreement
between our measured line strengths with currently available experimental and theoretical values.
13

4. LABORATORY FLAME MEASUREMENTS
4.1 Introduction
Measurements of 02 concentration and temperature in premixed flames were performed using fuel-
lean CH4/O 2 mixtures in a laboratory flat flame burner. A single channel fiber optic system was used for
these experiments. The motivations for the flame measurements were l) to test the techniques for
measurement of O2 concentration and temperature, and 2) to assess the detection sensitivity of the fiber
optic GaAIAs diode laser spectrometer under high temperature atmospheric pressure conditions. In this
section, we describe the experimental details of the laboratory flame measurements, followed by
presentation and discussion of the results.
4.2 Experimental Description
A block diagram of the experimental arrangement is shown in Fig. 4.1. For the premixed flat flame
source, we used a burner from McKenna Products. The burner has a 6 cm diameter central core for the
flame surrounded by an 11 mm annular shroud region for an inert gas flow to isolate the flame from room
air. The CH 4 and O 2 gas flows are separately metered using Matheson variable area flow meters and then
mixed prior to introduction into the flame region of the burner. The flow rate of the argon shroud gas
is also metered using a Matheson flow meter. We limited our flame measurements to CH4/O 2 equivalence
ratios (_) of 0.4 and 0.6 because of very low O2 absorbance levels at higher equivalence ratios. Fuel-rich
flame conditions (_ = 1.1) are also sometimes used to check or to correct for background signals when
all of the flame 02 is consumed.
The burner is mounted on a vertical translation stage with a micrometer adjustment, allowing us to
probe 4 different heights (3, 5, 7, and l0 mm) above the burner surface. Since the flame is at atmospheric
pressure (about 600 Torr for our laboratory in Santa Fe, New Mexico), we are confident that we are
probing the post burn region. The gas flow rates for the premixed flames and the Ar shroud, and the O 2
mole fraction in the post bum region, are summarized in Table 4.1.
Table 4.1. The Gas Flow Rates and the 02 Mole Fractions in the Flame.
Equivalence CH 4 0 2 Ar 0 2 MoleRatio (_) (slm) (slm) (slm) Fraction
0.4
0.6
1.1
0.85 4.25 2.13
1.18 3.92 2.13
1.83 3.27 2.13
0.50
0.31
0.00
14

ARGONSHROUD
BURNER
[DC c
:f,_'
"-:_:_'/ ...V 0H4/02"::_':':J FLAME
so/so I ! I ACBEAM q_SPLITTER L i J
AID
A-B[-_ilOOkHBPF
FGRIN
I LENS
_/-_:-:ii Lt ., ,, I
I/
....==========================================SINGLE MODEOPTICAL FIBER
GRINLENS
Z _AMP
lOOkHz
r LO
_RF' IF
1
$!_1kHz ii LP !I
AMP
4,A/D
ISOLATOR
LASER
PORGE fl 'iii: fBOX
Figure 4.1. The experimental arrangement for measurements in the laboratorypremixed flame using a single channel fiber optic diode laser system.
The laser output is gently focused with a three element lens assembly (Rodenstock 1403. 108) and
passed through the optical isolator (Isowave 1-80-T(760); 2° angle polish on the input face) before
impinging on the input fiber coupling GRIN lens. Two flat mirrors are used to extend the beam path
length between the lens and the optical isolator, providing a small beam waist through the optical isolator
and better matching of the input GRIN lens numerical aperture. The input GRIN lens is fused onto a
single mode fiber and has a 6 ° angle polish on the front surface to minimize back reflection of the laser
beam. Typically, about 15-20% of the diode laser output is coupled into the 4.7 ktm single mode fiber
core. The entire laser-to-fiber coupling system including the optical isolator is housed inside a purge box
to remove the background oxygen in the optical path.
This design for coupling the laser output into the single mode fiber could be greatly simplified by
using a fiber pigtailed laser with integral optical isolator. Such a system would also eliminate the need
for a purge box. Unfortunately, such laser packaging in the 760 nm region is only available on a custom
15

basis.Ourtestsof twocustompackagesproducedby twodifferentvendorsrevealedunacceptablelevels
of backgroundinterferencefringes.
Fortheselaboratorymeasurementsof temperatureandconcentrationin theflame,weusedasinglechannelfiberopticsystem.Wetiltedeachopticalsurfaceat ananglealongthelaserbeampathon the
inputsidein orderto minimizeetalonfringes,butwestill foundresidualetaloneffectsarisingfrom theopticalisolatorsurfacesandfromtheoutputfibercollimatingGRINlenssurfaces.Theseetalonfringes,whichwereequivalentin amplitudeto absorbancesin thehigh10-5range,distortedthesecondharmonic
absorptionlineshapesandbaseline,renderingthedataanalysisdifficult. Therefore,wechoseto splitthelaserbeamexitingfromthesinglemodefiberwitha 50/50beamsplittersothatwecouldsubtractany
background02 or etalonsignals. Oneof the beamswasusedto probethe flamewhile the other(reference)beamtraversedashortpathof laboratoryair suchthattheambient02signalin thereferencepathmatchedtheambient02 signalin theprobebeampath. Thismatchingof backgroundsignalswasverifiedby operatingtheflameunderthecb= 1.1condition.
Thetwo laserbeams,aftertraversingeithertheflameregionor thereferencepath,impingedon
matchedSi P-I-N photodiodedetector/preamplifiermodules(AnalogModulesModel310-46). Thisdetector/preamplifiermoduleallowedusto monitorboththeAC output, with a gain of up to 60 dB, for
extracting the absorbance signal, and the DC output with a gain of 20 dB for monitoring the laser
intensity. The AC output from the reference leg was subtracted from that of the probe leg by combining
both signals in a 180 ° RF combiner/splitter (Mini-Circuits ZSCJ-2-2). The resulting signal was then band-
pass filtered at the 100 kHz second harmonic detection frequency and then fed to the RF port of a double
balanced RF mixer (Mini-Circuits ZAD-8).
The 50 kHz TTL output from a Wavetek (Model 20) function generator, which generated the 50 kHz
sine wave that was used to modulate the laser wavelength, was sent to a phase shifter/frequency doubler
(Evans Electronics Models 4110, 4111) and the resulting 100 kHz reference signal was fed to the LO port
of the RF mixer. The low frequency signal output from the IF port of the RF mixer was low-pass filtered
(1 kHz) and amplified (60 dB) with a battery operated low noise filter/amplifier (SRS 560). The
conditioned signal was then sent to an A/D port of the data acquisition system for storage and later
analysis. The modulation amplitude of the 50 kHz sine wave was set while measuring 02 at room
temperature and atmospheric pressure to yield the optimum peak-to-trough amplitude in the resulting 2f
signals; this modulation amplitude was maintained throughout the flame experiments.
The DC output from the detector/preamplifier was low-pass filtered and amplified and then fed to
an A/D port for laser power monitoring. The second harmonic absorption spectrum was later normalized
by the DC signal to account for variation in laser power as the laser current is scanned.
The data acquisition system consists of an 80386-based microcomputer (Northgate), fast multi-
channel A/D converter board (Analog Devices Model RTI-860), and custom-developed software to acquire
and store the data. The computer also controls a waveform synthesizer board (QuaTech Model WSB-10)
16

to generate a train of sawtooth shaped laser current ramps. The current ramp and the data acquisition
cycle are synchronized by the computer software. Typically, the absorption signals from 100 or more
current scans are coadded to improve the signal-to-noise of the acquired spectrum. For the flame
measurements, we coadded 1000 current scans with each scan consisting of 512 data points with a dwell
time per data point of 50 _s. The effective detection time constant is 50 ms (20 Hz detection bandwidth).
The flame temperature was measured at each equivalence ratio and vertical height with a Pt-
Pt/13%Rh thermocouple (.015" bead diameter) by scanning the thermocouple across the flame and
sampling the temperature at 2 mm radial intervals from the center of the flame through the Ar shroud to
the ambient air. The thermocouple readings were corrected for radiation loss, as described in the results
section below.
The flame measurements consisted of taking three runs of 02 absorption spectra in fuel-lean flames
at a given height and equivalence ratio, followed by a fuel-rich (_=l. 1) flame run to take the background
absorption spectrum. The equivalence ratio or the vertical height of the fuel-lean flame was then changed
and the procedure was repeated. The transmitted laser power as a function of laser current was recorded
at regular intervals from the DC output of the photodiode detector/preamplifier. After all the flame
measurements were made, two room temperature 02 absorption spectra were taken for use in absorbance
calibrations, as described below. Finally, the flame temperature at a given height and equivalence ratio
was measured using the thermocouple.
4.3 Experimental Results
4.3.1 Flame Temperatures
The second harmonic absorption spectra of 02 in fuel-lean flames were first processed by subtracting
fuel-rich (cI, = 1.1) background runs to remove etalon effects and then corrected for the laser power
variation (Io) across the spectrum by dividing by the DC output spectra. Figure 4.2 shows the 02 second
harmonic absorption spectra from the flame measurements after these corrections were applied.
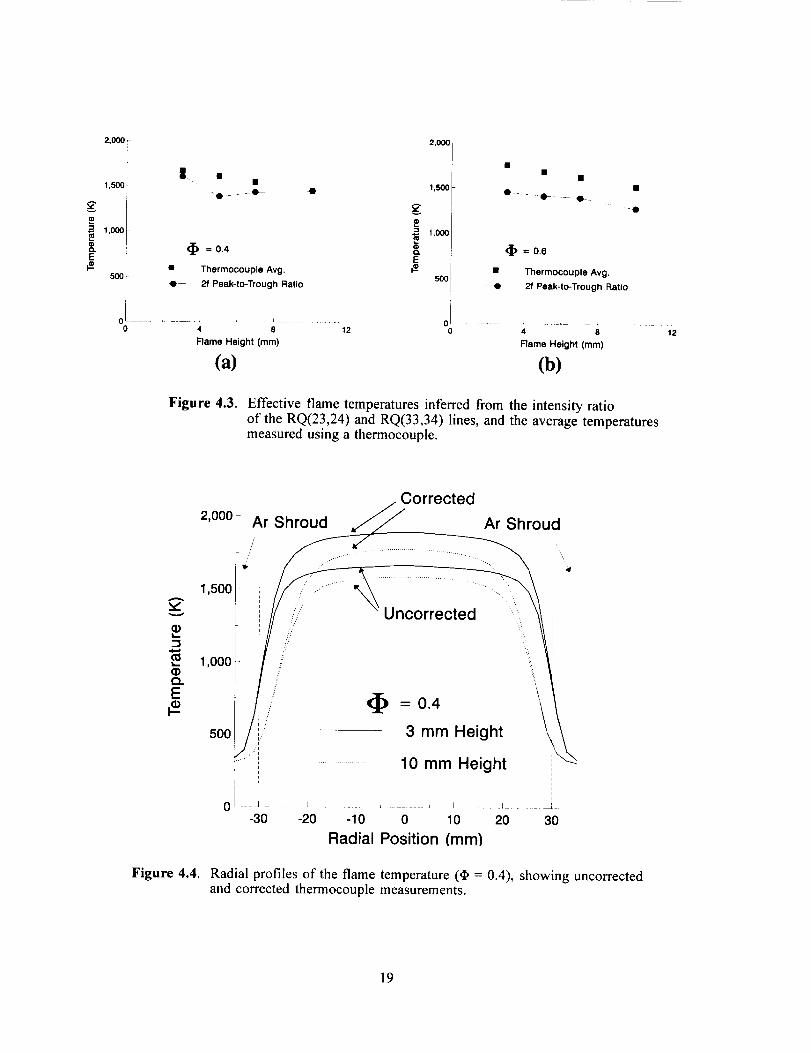
The ratio of intensities of the RQ(23,24) and RQ(33,34) lines, determined from the peak-to-trough
amplitudes of the 2f line shapes, was assumed equivalent to the line strength ratio, and the effective flame
temperatures were obtained from the known dependence of the line strength ratio on temperature. These
flame temperatures are indicated by the filled circles in Figure 4.3(a) and (b) for the ,I, = 0.4 and 0.6
flame, respectively. Shown for comparison are the averages of the thermocouple readings at each flame
height.
17

tI_ =0.4
RQ(33.34)
RQ(23,24)
//
/ "_
/'!
CI_ = 0.6
RQ(23,24)
RQ(33,34) /_
/ ,,, 10 mm
/," ,,,,,
,/4,\
.j, , ,_ ........ 7 mm'--' j/
/-"_ ' _, 5 mm
// ",
3 mm
Figure 4.2. Normalized second harmonic absorption spectra of the 0 2 RQ(23,24)and RQ(33,34) line pair for the cb = 0.4 and 0.6 flame conditions.
by n
The thermocouple measurements of the flame temperature profiles were corrected for radiation loss
AT _ 4 4= (T_-Ti) ,(N k)
(4.1)
where N u (Nusselt Number) = 2 + 0.236 Re 0'606 Pr 1/3, Re (Reynolds Number) = (p Vgasd)/#, Pr (Prandtl
Number) = (/_ co)&, a = Stefan-Boltzmann constant, e = thermocouple emissivity, d = thermocouple bead
diameter, Ttc = thermocouple temperature, T b = background temperature, p = gas density, Vgas= gas flow
velocity, # = gas viscosity, Cp = specific heat, and k = thermal conductivity. The Nusselt number was
taken from Ref. 17, while the emissivity for a Pt-Pt/13%Rh thermocouple was taken from Ref. 18. The
uncorrected and corrected thermocouple measurements for the cI,= 0.4 flame at two vertical positions are
shown in Figure 4.4. The magnitude of the radiation correction in the "flat" portion of the flame is about
180 K. We also observe that the temperature boundary layer expands as the flame propagates upward,
and the "flat" portion of the temperature drops about 100 K between flame heights of 3 mm and 10 mm.
18
2,000 r
1,500 • •
Eo
"_ 1,ooo
_- (_ = 0.4
• Thermocouple Avg.500
• 2f Peak-to-Trough Ratio
l
Ol - • _ J •
0 4 8 12
Flame Height (mm)
(a)
2,oooI
L " "1,500 • " Q----- O
E ,
"%® 1,000
o. ' CI_ = 0.6
E 500• Thermocouple Avg.
• 2f Peak-to-Trough Ratio
0 [ .... l
0 4 8
Flame Height (ram)
(b)
12
Figure 4.3. Effective flame temperatures inferred from the intensity ratioof the RQ(23,24) and RQ(33,34) lines, and the average temperaturesmeasured using a thermocouple.
. Corrected
2,000 Ar Shroud JJ Ar Shroud
_, 1,500 ........... "_ Uncorrected ...............iiiiii-i_
',oo! ..... ;coe2c\\.... ! .............................. - i
i
o i =-30 -20 -10 0 10 20 30
Radial Position (mm)
Figure 4.4. Radial profiles of the flame temperature (cI, = 0.4), showing uncorrectedand corrected thermocouple measurements.
19

The average thermocouple measurements plotted in Fig. 4.3 are simple unweighted arithmetic means
of these profiles. While the flame temperatures inferred from the 02 absorption spectra follow the
averaged thermocouple measurements at least qualitatively, we wish to examine the cause of the
discrepancies in greater detail. In deriving the spectroscopic flame temperatures, we have assumed that
the 2f peak-to-trough ratios are equivalent to the line strength ratios, without considering differences in
line broadening. Furthermore, the thermocouple measurements should be weighted by the variation of
02 density and peak cross sections across the flame in making comparisons with the spectroscopic
measurements. We will consider these issues in detail in Section 4.4.
4.3.2 0 2 Concentrations
The peak-to-trough amplitude of the 2f signal varies linearly with absorbance, but the calibration
factor relating the 2f signal to absorbance is best determined experimentally. In these measurements, we
used the room temperature 02 absorption spectra obtained in laboratory air for the absorbance calibration.
Transferring this calibration to the measurements taken under flame conditions requires proper accounting
for differences in the absorption line shapes between room temperature and flame temperatures. In
particular, the room temperature absorption lines used for calibration are predominantly pressure
broadened, whereas Doppler broadening dominates in the flame spectra.
We use the theoretical treatment of wavelength modulation spectroscopy presented by Silver l° of our
laboratory to calculate the appropriate corrections to the absorbance calibration measured at room
temperature. The second harmonic signal amplitude, for a fixed absorbance and a given line shape,
depends on the ratio of the wavelength modulation amplitude to the absorption line width (the modulation
index). At the modulation index producing the maximum room temperature second harmonic signal, the
calculated 2f signal amplitudes (peak-to-trough) relative to unit absorbance are 0.57 for the room
temperature line and 0.65 for the same 02 line at the spectroscopically determined temperature for the
= 0.4 flame at 3 mm. These and similarly calculated peak heights for the other flame conditions are used
as correction factors in transferring the room temperature calibration to flame conditions.
Having determined the experimental 02 absorbances (t_) in the flame using this procedure, the
experimental 02 number densities may be calculated from Beer's law, Eq. 3.1, where the absorption path
length is £ = 6 cm. The line center absorption cross section (%) for each flame height and stoichiometry
is calculated from the line strength ratio S(T) and the Voigt line shape for the flame pressure and
temperature. In these calculations, we use the spectroscopic effective flame temperatures, determined in
the manner described above, and we assume that pressure broadening coefficients scale as T'°76. 8 The
analysis is insensitive to this latter assumption, since Doppler broadening is dominant under our flame
conditions. Finally, experimental 02 mole fractions are obtained by dividing the 02 number densities from
Eq. 3.1 by the total gas number density in the flame (again using the spectroscopic effective flame
20
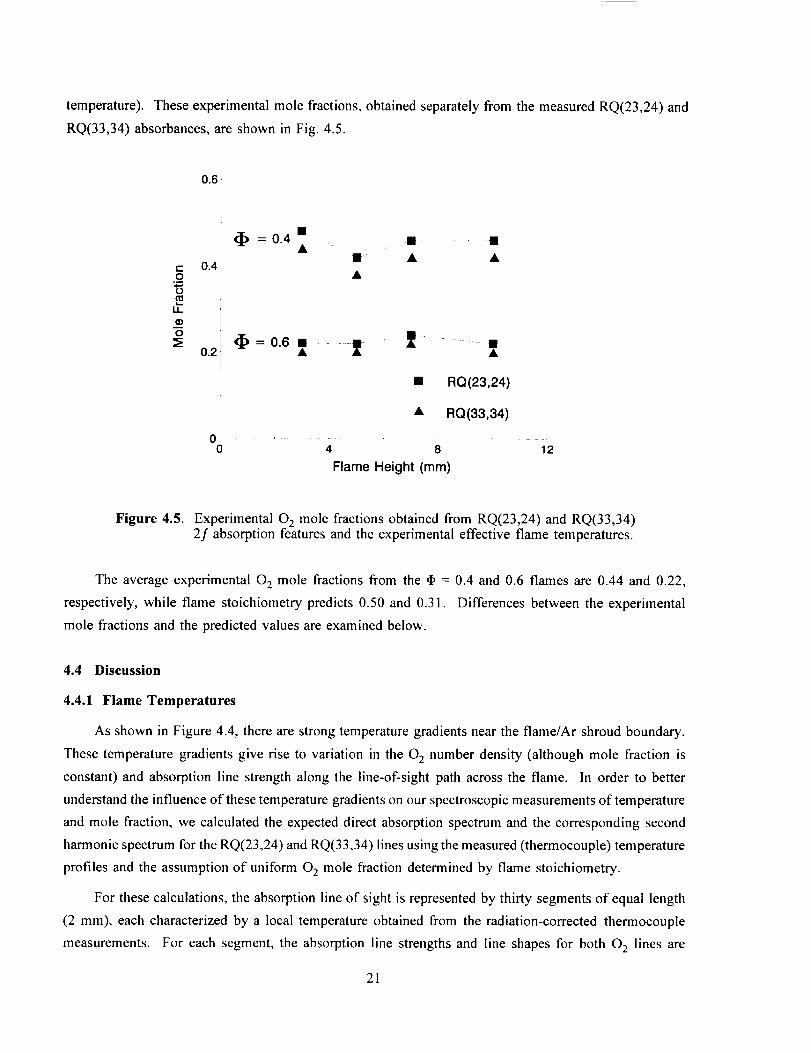
temperature).Theseexperimentalmolefractions,obtained separately from the measured RQ(23,24) and
RQ(33,34) absorbances, are shown in Fig. 4.5.
0.6
c: 0.4.fl
I..L
0
0.2
(I) 0.4 •= • •
,i, = o.6! It It •
• RQ(23,24)
• RQ(33,34)
0 _ l , J . j
0 4 8 12
Flame Height (mm)
Figure 4.5. Experimental 0 2 mole fractions obtained from RQ(23,24) and RQ(33,34)2f absorption features and the experimental effective flame temperatures.
The average experimental 02 mole fractions from the <I,= 0.4 and 0.6 flames are 0.44 and 0.22,
respectively, while flame stoichiometry predicts 0.50 and 0.31. Differences between the experimental
mole fractions and the predicted values are examined below.
4.4 Discussion
4.4.1 Flame Temperatures
As shown in Figure 4.4, there are strong temperature gradients near the flame/Ar shroud boundary.
These temperature gradients give rise to variation in the O 2 number density (although mole fraction is
constant) and absorption line strength along the line-of-sight path across the flame. In order to better
understand the influence of these temperature gradients on our spectroscopic measurements of temperature
and mole fraction, we calculated the expected direct absorption spectrum and the corresponding second
harmonic spectrum for the RQ(23,24) and RQ(33,34) lines using the measured (thermocouple) temperature
profiles and the assumption of uniform 02 mole fraction determined by flame stoichiometry.
For these calculations, the absorption line of sight is represented by thirty segments of equal length
(2 mm), each characterized by a local temperature obtained from the radiation-corrected thermocouple
measurements. For each segment, the absorption line strengths and line shapes for both 02 lines are
21

calculatedfrom theknowntemperature,andthe02 numberdensityis calculated from the known mole
fraction and total gas number density. The 02 line center absorbances within the segment are then
determined from Eq. 3.1. The absorption line profiles across the full line of sight are obtained by
summing the contributions of the thirty segments. The corresponding second harmonic spectra are
calculated using the theory described by Silver. ]° Since the 02 absorption line width varies across the
flame, an effective modulation index, which is the average of the modulation indices for the thirty
segments, is used in this latter calculation. This calculation procedure was performed for the conditions
corresponding to each of the laser absorption experiments.
The ratios of the calculated second harmonic peak-to-trough intensities were compared with the
calculated direct absorption area ratios for the RQ(23,24) and RQ(33,34) lines. The direct absorption area
ratio is, by definition, equal to the ratio of line strengths. The ratio of 2f intensities may be somewhat
different, however, due to differences in pressure broadening of the two lines. We used these calculated
ratios to correct the experimental 2f ratios in order to obtain a more accurate representation of the
experimental ratios of line strengths. These corrected experimental ratios were then used to derive a new
set of flame temperatures, plotted in Fig. 4.6. The effect of this correction is to slightly lower the
experimental temperature values. Also shown in the figure are the temperatures derived from the ratios
of absorption line areas obtained from our detailed piecewise calculations. Figure 4.6 should be viewed
as providing a comparison between our experimental temperature results and the "exact" line-of-sight
averaged temperatures, based on our knowledge of flame stoichiometry and temperature profiles.
2,oooi
!
1,50o,
1,0000e_
E
500
I ¸
lid =0.4
........• .......... Calculated
- • Experimental
2,000
1,500
'_ 1,ooo
EL
E
5OO
(I D =0.6
.........• ......... Calculated
Experimental
0 _ t = L J 0 J , _
0 4 8 12 0 4 8 12
Flame Height (mm) Flame Height (mm)
(a) (b)
Figure 4.6. Comparison of the experimental flame temperatures with the exactline-of-sight averaged temperatures (designated as "calculated" temperatures).
22
The radiation-correctedthermocouplemeasurements,which areusedin our exact calculation
procedure described above, are subject to errors arising from catalytic reactions between the Pt/Pt-13%
Rh thermocotiple and the flame, and surface contamination of the thermocouple at high temperature by
elements such as hydrogen and carbon. Some researchers have addressed these issues by applying
different types of protective coatings on the thermocouple bead. 19 We believe that fuel-lean CH4/O 2
premixed flames in the post burn region are not highly susceptible to these complications since methane,
carbon, or hydrogen should have completely reacted and formed stable combustion products (H20 and
CO2) in the post burn region, and the catalytic effects seem most severe in hydrogen-rich, low pressure
flames with stretched reaction zones. 19 Therefore, we estimate the uncertainty in the corrected
thermocouple temperatures to be about 10%, which is the approximate magnitude of the radiation
correction.
The experimental flame temperatures show the same qualitative trend as the calculated exact
temperatures in that the apparent temperature decreases as higher portions of the flame are probed. The
quantitative agreement between the experimental and exact temperatures for the • = 0.4 flame seems
satisfactory, but the experimental temperatures are systematically low for the cI,= 0.6 flame. In fact, the
experimental temperatures for the ff -- 0.6 flame are actually lower than for the • = 0.4 flame, even
though the thermocouple data indicate the expected result that the flame temperatures are higher. We
attribute the poorer agreement of the ,I, = 0.6 temperature data to the reduced 02 signal levels as compared
to the leaner flame. In particular, the magnitudes of the 02 signals and the background etalon fringes in
the • = 0.6 data are comparable, so that possible systematic errors in our background subtraction
procedure may be more significant.
4.4.2 02 Mole Fractions
As noted in Section 4.3, the 02 mole fractions derived from the spectroscopic data are lower than
the mole fractions calculated from flame stoichiometry. In this discussion, we examine the reasons for
this discrepancy by again referring to our "exact" calculations of O 2 absorbance along the flame lines of
sight. By comparing our measured absorbances with the calculated values, we find agreement to within
about 4% (averaged over the two 02 lines and the four heights that were probed) for the • = 0.4 flame
and to within about 15% for the • = 0.6 flame. Thus, the agreement between the measured and expected
values of absorbance for the given flame conditions is actually quite good, and the low experimentally
derived values for mole fraction cannot be attributed to poor accuracy in our measurements of 02
absorption.
We can analyze our exact calculations of line-of-sight absorbance and effective flame temperature
to derive "calculated" mole fractions, in a manner identical to our analysis of the spectroscopic data.
Figure 4.7 shows a comparison of the experimental and calculated mole fractions, and the mole fractions
expected from flame stoichiometry are also shown. In this case the "experimental" values for mole
23

fractionthatareplottedaredeterminedusingtherevisedexperimentaltemperatures that are shown in Fig.
4.6. Only the experimental results obtained from measurements using the RQ(23,24) absorption line are
plotted in Fig. 4.7. The disagreement between the calculated and experimental 02 mole fractions is
expected since we have noted some disagreement between the experimental and exact line-of-sight
temperatures, and the experimental absorbances differ slightly from the calculated absorbances as discussed
above. In fact, the values derived for mole fraction are quite sensitive to temperature, as can be seen by
comparing the experimental values shown in Fig. 4.7 with the values presented earlier in Fig. 4.5, where
somewhat higher flame temperatures were used in the analysis. The sensitivity of these measurements
to uncertainties in temperature, or even to temperature variation along the line of sight, can be minimized
by appropriate choice of 02 absorption line, as described below.
¢-
._o
ii
O
Figure 4.7
0.6
0.4
0.2
02 Mole Fraction = 0.50
(I _ = 0.4 •
0-_ 14_
0 2 Mole Fraction = 0.31
(I)= 0.6 •
• Calculated• - Experimental
0 4 8 12
Flame Height (mm)
Experimental and calculated line-of-sight integrated 02 mole fractions,and the expected 02 mole fractions from the flame stoichiometry.
In order to assess the sensitivity of the mole fraction measurements to the temperature gradient, we
can write Beer's law for the case of line shape dominated by Doppler broadening and uniform pressure
across the line of sight as
a = on e -- S(T) x°2P e _ _ (4.2)1.06Av o k--T- T l'5 x°£
Equation 4.2 shows that a single line of sight absorption measurement, under conditions where Doppler
broadening predominates, weights the 02 mole fraction by S(T) • T -15 , where S(T) is the temperature-
24

dependentlinestrength.In the case where the 0 2 mole fraction can be presumed uniform across the line
of sight, as in the premixed flat flame, the best chance of retrieving an accurate mole fraction from a line
of sight absorption measurement is achieved when the weighting function S(T) • Y-15 has minimal
variation across the line of sight. We can attempt to achieve this condition by choosing an absorption line
with lower state rotational energy such that d[S(T) • T-l5]/dT _=_0 over the range of temperatures
encountered across the line of sight. Carrying out this differentiation yields the result
5kT ve hey /kT÷ (4.3)
Er°t 2hc 1 - e hey/kr
where u = 1556 cm l is the 02 vibrational frequency.
At T = 1500 K, which is typical of flame temperatures in our experiments, Ero t = 3057 cm -l is
obtained from Eq. 4.3. An 02 absorption line with this approximate lower state rotational energy is the
RR(45,45) line, with Erot = 2956 cm -1.
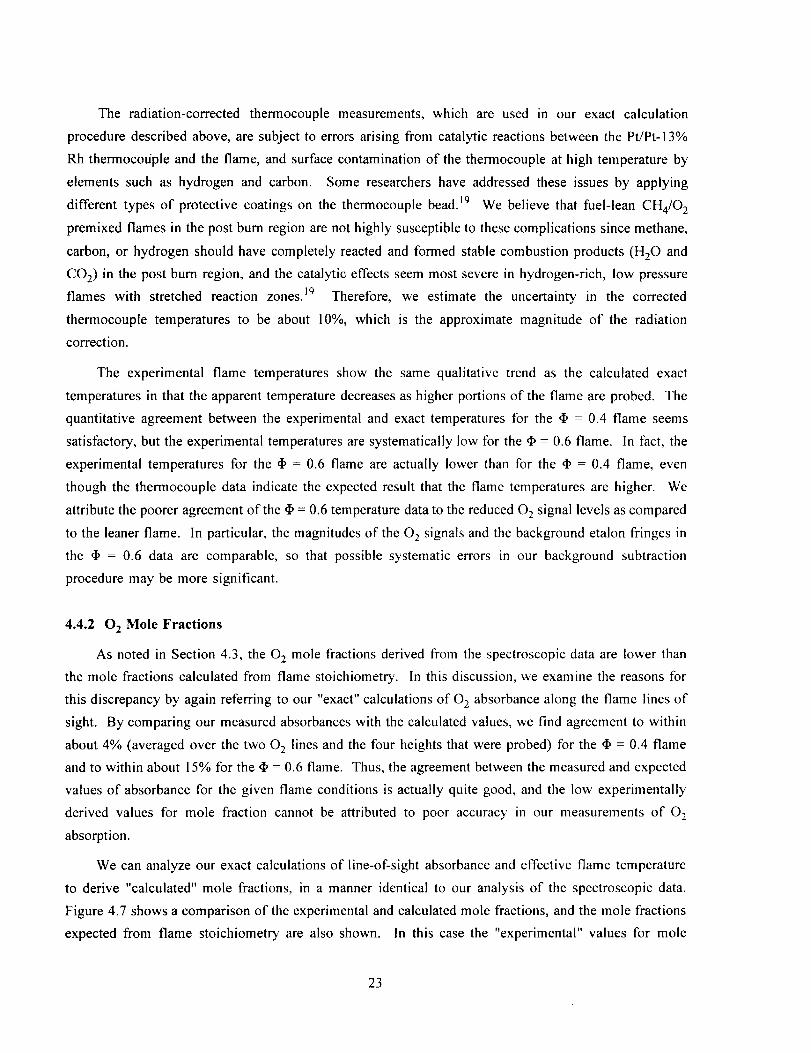
In Figs. 4.8 and 4.9, the weighting function S(T) • T-15 for the RQ(23,24) and RQ(33,34) lines,
normalized by its value at the center of the flame, is plotted as a function of flame radial position. The
weighting function is also plotted for the RR(45,45) rotational line. The flame temperature profiles
measured with the thermocouple for the _ = 0.4 flame are used in constructing these plots.
The plots in Fig. 4.8, at a height of 3 mm above the burner surface, show that both the RQ(23,24)
and RQ(33,34) lines weight the cooler edges of the flame more strongly than the uniform high temperature
region. Further, the mean value of the normalized weighting function is greater than unity so, from Eq.
4.2, we expect that measurements on either line would underestimate the true 02 mole fraction. In
contrast, we see that the normalized weighting function for the RR(45,45) line is very close to unity over
the entire optical path, dropping only at the very edge of the flame. Thus we expect that absorption
measurements using the RR(45,45) line should yield accurate results for 02 mole fraction at this height
above the burner.
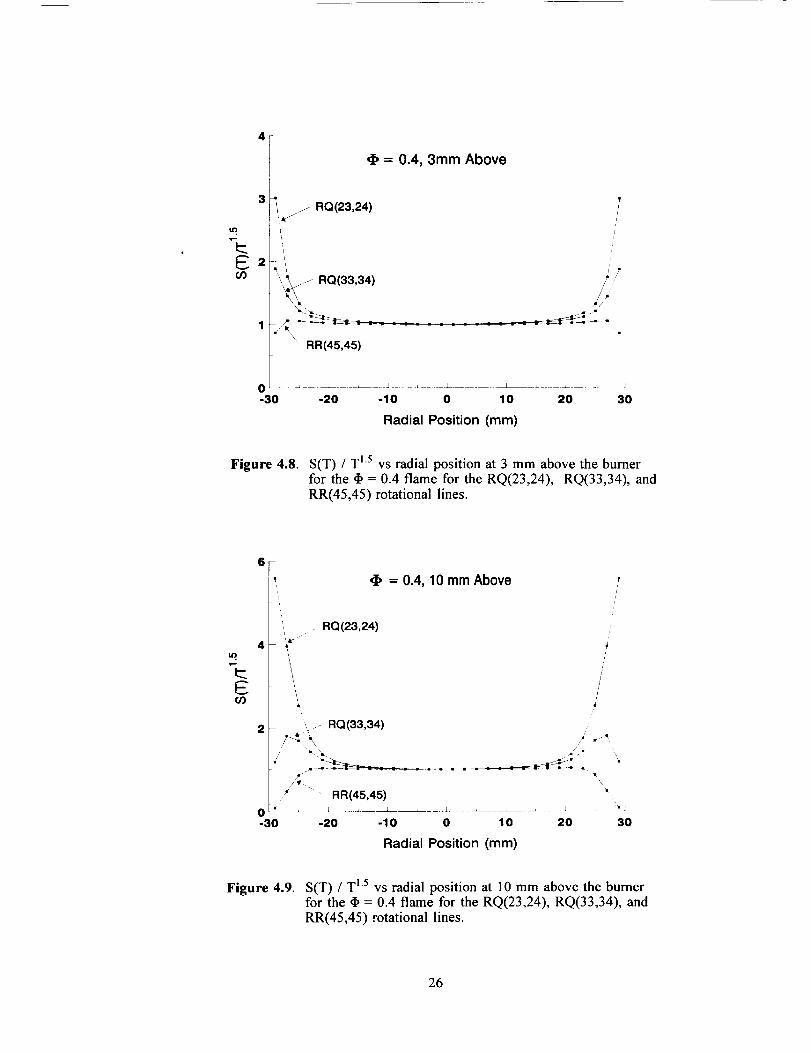
Figure 4.9, showing plots of the normalized weighting function for a height of 10 mm, indicates
again that both the RQ(23,24) and RQ(33,34) lines are expected to yield inaccurate values for O_ mole
fraction. The figure shows that the RR(45,45) line again has a value of the normalized weighting function
that is close to unity over a significantly broader region of the flame than either of the two lower energy
lines. Also, the weighting function for this line becomes small near the cool edges of the flame, showing
that the absorption line is really probing the hotter portion of the flame while ignoring most of the cooler
edges. Thus, a reasonably accurate value for 02 mole fraction might still be extracted in this case,
particularly if an effective path length somewhat shorter than the full path across the flame is used in the
data analysis. Figure 4.9 should be compared with Fig. 4.4 to understand the surprising extent to which
the appropriate choice of absorption line can compensate for the effects of a nonuniform temperature
profile.
25
Ea¢.O
4
= 0.4, 3mm Above
j RQ(23,24)i. j
'_,_J, RQ(33,34)
• RR(45,45)
i?
/
-30 -20 -10 0 10
Radial Position (mm)
L _ - J
20 30
Figure 4.8. S(T) / T 1'5 vs radial position at 3 mm above the burnerfor the • = 0.4 flame for the RQ(23,24), RQ(33,34), andRR(45,45) rotational lines.
tt)
E¢/)
6 -
_ ,_, = 0.4, 10 mm Above
.. RQ (23,24)
4 ,,
//
/'
i)
" RR(45,45)/
0 "--- _ l __ J-30 -20 -10
",
\ - RQ(33,34) .....
j, l
- '=
O 10 20 30
Radial Position (mm)
Figure 4.9. S(T) / T 15 vs radial position at 10 mm above the burnerfor the cI, = 0.4 flame for the RQ(23,24), RQ(33,34), andRR(45,45) rotational lines.
26
Unfortunately,for theconditionsthatapplyin ourpremixedflameexperiments,theabsorbanceof
theRR(45,45)line is expectedto beaboutsix timesweakerthanthatof theRQ(33,34)line. Giventhedifficultiesthatweexperiencedwithunwantedinterferencefringeeffects,signalto noiseisnotadequateto permittheuseof thisline in theflameunlessamultiplepassopticaldesignisused.Wefind fromEq.4.3thattheRQ(33,34)absorptionlineisexpectedtobewellsuitedto 02molefractionmeasurementsfor
averagetemperaturesaround700K. Thus,atleastfortheconditionsstudiedbytheUniversityof Virginiagroup,2°we expectthatthe RQ(33,34)line shouldbesuitablefor 02 molefractionmeasurementsinLangleywindtunnels.
4.4.3 2] Detection Sensitivity
Perhaps the most significant technical challenge that we faced during this Phase II effort was the
occurrence of unwanted etalon effects arising from pairs of optical surfaces along the laser beam path.
By minimizing the number of optical surfaces, we have previously achieved 3 x 10⁻⁷ minimum detectable
absorbance in a 1 Hz bandwidth. 2x This detection sensitivity is by far the best that we have observed with
near-IR GaAIAs laser diodes and was achieved in an optical path where no fiber optics were used.
The development of the fiber optic system used in this study resulted in the inclusion of several
optical surfaces along the laser beam path, includiog an optical isolator (Faraday rotating crystal and
polarizers), input and output collimating GRIN lenses, and the fiber splitter and connectors. These
surfaces, when not properly tilted at an angle with respect to the laser beam axis, create unwanted etalon
effects and greatly reduce the detection sensitivity. In the premixed flame measurements described in this
section, subtraction of background interference fringes from the acquired spectra was necessary before we
could start the data analysis.
Figure 4.2 shows 2f spectra of 02 in fuel-lean flames at different heights above the burner. The
weakest 2f absorption feature, the RQ(33,34) line in the cI, = 0.6 flame at 3 mm height, corresponds to
about 8.1 × 10⁻⁵ absorbance. With signal-to-noise of 20 to 1, we estimate the minimum detectable
absorbance to be about 4 x 10 -6. A 1 kHz low pass filter was used at the final stage of signal
conditioning, while the A/D conversion step utilized a dwell time of 50 #s per data point. Coadding 1000
scans results in a detection bandwidth of between 1 Hz and 20 Hz.
The level of background interference fringes as estimated from the fuel-rich flame runs appears to
be about 4 × 10⁻⁵ in equivalent absorbance. The spacing of the fringes is similar to the separation of the
two absorption features in our spectra. The separation of two surfaces responsible for creating such
fringes is about 8 mm for an index of refraction of 1.5. We believe the source of this etalon to be the
output collimating GRIN lens. Subtracting fringes of magnitude 4 x 10⁻⁵ from an absorbance spectrum
where the absorbance signal is only about 8 x 10⁻⁵ (as was the case for the _ = 0.6 flame at 3 mm height)
suggests the possibility of substantial systematic error being introduced in the data analysis. As we have
27

previouslydiscussed,suchsystematicerrormaybethe cause of larger discrepancies between the expected
and experimentally derived flame temperatures and mole fractions in the • = 0.6 flame.
4.5 Conclusion
The spectroscopic measurement of temperature and concentration ofO 2 in premixed flat flames, using
a fiber optic-coupled GaAIAs near-visible diode laser system was presented. The spectroscopically
measured flame temperatures were compared against the temperatures derived from calculated data, which
were based on the radiation corrected thermocouple measurements. These experimental and calculated
temperatures were found to agree to within about 7% in the cb = 0.4 flame and about 15% in the ff = 0.6
flame. The spectroscopic determination of 02 concentrations, expressed as mole fraction of 02 in the
flames, showed a 10 to 20% deviation from the expected mole fraction in the • = 0.4 flame and about
30% deviation in the • = 0.6 flame.
Our analysis based on the line-of-sight integrated spectral simulation using the thermocouple
temperatures showed that good agreement between spectroscopically determined mole fractions and the
values expected from flame stoichiometry should be possible at the 3 mm flame height but that the
agreement degrades at higher positions above the burner. This result was traced to the temperature
sensitivity of absorbance using the chosen absorption lines. Under the premixed flame conditions used
in this study, the RR(45,45) line shows substantially less sensitivity to the nonuniform temperature fields
encountered in the flame, but at a cost of a 6 times reduction in signal level compared to the RQ(33,34)
line.
Finally, the sensitivity expressed as minimum detectable absorbance was found to be 4 x 10⁻⁶ at a
detection bandwidth of 1 Hz or higher. This sensitivity was achieved only by subtraction of background
interference fringes, however.
28
5. MULTI-CHANNEL FIBER OPTIC SYSTEM
5.1 Introduction
Previous sections of the report have presented the technical approach and have described in detail
certain experimental configurations that were used in laboratory experiments at Southwest Sciences. In
this section, we briefly describe the design features of the diagnostic that are particularly related to multi-
channel measurements using a fiber optic system. A detailed step-by-step discussion of the operation of
this system is contained in the Instrument Manual, included as an appendix to this report.
5.2 Optics and Electronics
The "front end" of the optical system is quite similar to that described for the flat flame burner
measurements in Section 4. The output from the Mitsubishi ML4405 diode laser is coupled into a single
mode fiber in exactly the same manner previously described. In this case, however, a 30-meter length
of single mode fiber is used after the input coupling GRIN lens. This fiber is directly fusion spliced onto
the input of a 1 x 4 fiber splitter (Amphenol). A GRIN lens is fusion-spliced onto each of the four output
fibers (each output fiber is about 2 meters in length). With this arrangement, the 1 x 4 splitter is located
adjacent to the wind tunnel or other facility where diagnostic measurements are to be made, while the long
run of fiber cable on the input side allows the laser, controlling electronics, and data acquisition system
to be located in a separate control room.
The system described above results in output power levels of approximately 10/_W in each of the
four channels when approximately 1.5 mW of laser power is available at the output of the isolator. We
typically experience about 15 to 20% coupling efficiency into the single mode fiber, and the remaining
losses are due to transmission losses over the long fiber run and losses in the splitter. After first
experimenting with fiber connectors at various locations in the system, we elected to work with this
fusion-spliced system in order to minimize losses. We had initially tested a 1 x 8 splitter, however, the
available power in each output channel was too low. As higher power diode lasers become available in
this wavelength region, increasing the number of channels to 8 or higher may become feasible.
For the detector side of the optical system, we elected to collect the transmitted light directly on
large-area Si photodiodes. This design minimizes losses due to beam steering in the flow. Analog
Modules Model 310-46 preamplifiers with AC and DC outputs are used to condition the detector outputs,
as in the fiat-flame burner experiments described previously. RF mixers (Mini-Circuits ZAD-8) are used
to demodulate the AC signals at 2f, and the demodulated 2f signals and DC signals are further amplified
and low-pass filtered using Pacific Instruments Model 3100 signal conditioning amplifiers. The amplified
and filtered 2f signals are normalized by the detector DC outputs using Analog Devices divider chips (Part
No. AD 734). Finally, these normalized signals are sent to the fast A/D system described below for
digitization, signal averaging, and storage. The normalization of the 2f signals by transmitted laser power
29

accountsfor sucheffectsasvariationin the laser power as a function of wavelength, differences in laser
power in the four channels, and changes in transmitted laser power due to beam steering effects or
particulates in the flow. The 2f signals that are normalized in this fashion are directly proportional to
absorbance.
5.3 Data Acquisition
The instrument includes a PC-based data collection system that can handle up to sixteen data input
channels. Southwest Sciences has provided a program, OXY, to control the laser and to digitize and store
the 02 wavelength modulation spectra. Data collection is performed at nearly unit duty cycle and the
maximum running time is limited only by the amount of system RAM; typical set-up conditions permit
3½ minutes of continuous measurement. The data collection hardware includes a 2048-point arbitrary
waveform synthesizer (QuaTech WSB-10) and a 16-channel fast A/D converter with 12-bit resolution
(Analog Devices RTI-860) that are used to sweep the laser wavelength and to digitize the demodulated
signals, respectively. In addition, an inexpensive I/O board (Keithley-Metrabyte DAS-4) is included to
detect a hardware trigger signalling the start of an experiment.
OXY uses a graphic menu display allowing the user to select the number of input channels (up to
16), the number of digitizations per sweep, the dwell time per digitization (minimum 5/xs), the number
of sweeps to co-add per spectrum, and the fraction of each scan allocated as "dead time" for the laser and
electronics to settle between saw-tooth sweeps. The user can also select the number of data arrays to be
kept in memory which, in turn, varies the data collection duty cycle (see below). After leaving the set-up
menu with a "RUN" command the user is prompted for a descriptive tag (up to 64 characters) for the
experiment, then the program switches to idle mode which starts the laser-scanning ramp, performs
digitizations and displays averaged scans of all active input channels, but does not save the data to disk.
Idle mode is designed to allow the user to monitor the laser spectrometer while awaiting a hardware or
software trigger ('T' or 't' from the keyboard). Once a trigger is received the program switches to run
mode; the trigger time is noted and the data are now saved to a virtual disk whenever the data arrays are
filled. After writing to the virtual disk, the arrays are re-initialized and the data collection resumed.
Dumping data to the virtual disk circumvents the limitations of the standard DOS 640 kB memory barrier
without a significant loss of duty cycle. (OXY is restricted to conventional DOS real mode operation
because the proprietary drivers supplied with the Analog Devices RTI-860 digitizer board will only operate
in real mode.) Thus, the number of data arrays kept in memory determines, in part, how ot_en data are
written to the virtual disk and the amount of time required whenever the virtual disk is accessed. Data
collection continues until either the virtual disk is filled or the user types <ALT>-F 1. All of the data,
including the file created on the virtual disk, are then written to the hard disk for permanent storage and
OXY returns to the set-up menu.
30

OXYwaswritten in turboPascalandcompiledusingversion7.0of the Borland Pascal compiler.
In addition, we wrote a customized data handling subroutine that is incorporated into the terminate-and-
stay-resident program controlling the Analog Devices RTI-860 digitizer board. That subroutine, USCAN,
is written in assembly language and was assembled using the Borland Turbo Assembler (v 3.2).
UPROCOXY.OBJ is linked to object modules and libraries supplied by Analog Devices. The linker is
Borland TLINK (v 5.1). The resulting terminate-and-stay-resident program, PASLOADO, must be
invoked prior to running OXY and requires a set-up data file, CONF.DAT. We include a batch file,
OXY.BAT, which can be invoked from the DOS prompt and runs the programs in the required order.
31

6. CONCLUSIONS AND RECOMMENDATIONS
Most of the technical objectives of this program were met. A multi-channel diode laser/fiber optic
system capable of measuring 02 concentrations, gas temperature, and flow velocity in high temperature,
high speed wind tunnel flows was designed, constructed, and tested. The fundamental spectroscopic
parameters required for quantitative measurements using this system were measured in laboratory studies.
An extensive set of experiments in a fuel-lean premixed flat flame was performed in order to evaluate the
accuracy of temperature and concentration measurements based on the diode laser absorption technique.
These experiments permitted evaluation of the effects of a nonuniform temperature profile on
concentration measurements and suggested the need for careful selection of the 02 absorption lines used,
based on the particular characteristics of the system under study. Difficulties encountered with the
scheduling and availability of wind tunnel facilities at NASA Langley precluded our testing the system
on a wind tunnel during this phase of the work, however, the system delivered to NASA is ready for use
in this application.
Several areas can be identified where design improvements might improve the sensitivity and
reliability of the system. These areas include:
i) Laser power and reliability. Important advances are continually being made in the fabrication of
near-infrared and visible diode lasers. These advances are likely eventually to lead to the availability of
higher power single frequency lasers in the 760 nm region. In the present study, we found that the
available laser power, particularly after introduction into an optical fiber system, limited the number of
optical channels that we could successfully design into the system. Also, the spectroscopically useful
lifetime of the diode lasers was limited, as tuning characteristics would change over time so that a
particular spectral interval containing the desired 0 2 absorption lines might eventually become
inaccessible. An interim solution to this problem may be the use of short external cavity designs, such
as those due to Cassidy. 22 This design stabilizes the single mode spectral tuning parameters of the laser
while still permitting the fast wavelength modulation techniques that are required for high sensitivity.
ii) Multi-channel system. The fiber optic-based multichannel system developed in this program was
the source of much trial and error in design. Most of these difficulties arose because of the propensity
of the fiber system to induce unwanted etalon effects that limited measurement sensitivity. The need for
careful angling of optical surfaces relative to the optical axis has been described in this report. We believe
that direct fiber pigtailing of the laser, with an integral optical isolator, may alleviate many of the
problems we encountered. This technology is routine in the InGaAsP diode lasers used at longer near-lR
wavelengths for fiber optic communications, but it is rarely used with the shorter wavelength lasers
designed primarily for optoelectronic applications. Our attempts to develop such a design, utilizing the
fiber pigtailing services of two outside sources, did not yield positive results during this program, but we
believe that further persistence is justified.
32

7. REFERENCES
1. J.J. Singh, W. T. Davis, and R. L. Puster, "Proposed Fast-Response Oxygen Monitoring and ControlSystem for the Langley 8-Foot High-Temperature Tunnel," NASA TP-2218 (1983).
2. M.P. Lee, P. H. Paul, and R. K. Hanson, "Laser-Fluorescence Imaging of 02 in Combustion Usingan ArF Laser," Opt. Lett.ll, 7 (1986).
3. J.E.M. Goldsmith and R. J. M. Anderson, "Laser-Induced Fluorescence Spectroscopy and Imagingof Molecular Oxygen in Flames," Opt. Lett. 11, 67 (1986).
4. D.E. Burch and D. A. Gryvnak, "Strengths, Widths, and Shapes of the Oxygen Lines Near 13,100cm 1 (7620 A)," Appl. Opt. 8, 1493 (1969).
5. J. Miller, R. Boese, and L. Giver, "Intensity Measurements and Rotational Intensity Distribution for
the Oxygen A-Band," J. Quant. Spectrosc. Radiat. Transfer 9, 1507 (1969).
6. K.J. Ritter and T. D. Wilkerson, "High Resolution Spectroscopy of the Oxygen A Band," J. Mol.
Spectrosc. 121, 1 (1987).
7. L.S. Rothman, R. R. Gamache, R. H. Tipping, C. P. Rinsland, M. A. H. Smith, D. C. Benner, V.Malathy Devi, J.-M. Flaud, C. Camy-Peyret, A. Perrin, A. Goldman, S. T. Massie, L. R. Brown, andR. A. Toth, "The HITRAN Molecular Database: Editions of 1991 and 1992," 48, 469 (1992).
8. K.J. Ritter, "A High Resolution Spectroscopic Study of Absorption Line Profiles in the A-Band ofMolecular Oxygen," Ph. D. Dissertation, University of Maryland, 1986.
9. G. Herzberg, Molecular Spectra and Molecular Structure II. Spectra of Diatomic Molecules (VanNostrand Reinhold, New York, 1950).
10. J. Silver, "Frequency-Modulation Spectroscopy for Trace Species Detection: Theory and ComparisonAmong Experimental Methods," Appl. Opt. 31, 707 (1992).
11. D.S. Bomse, A. C. Stanton, and J. A. Silver, "Frequency Modulation and Wavelength ModulationSpectroscopies: Comparison of Experimental Methods Using a Lead-Salt Diode Laser," Appl. Opt.31, 718 (1992).
12. J. Reid, M. EI-Sherbiny, B. K. Garside, and E. A. Ballik, "Sensitivity Limits of a Tunable DiodeLaser Spectrometer, with Application to the Detection of NO 2 at the 100-ppt Level," Appl. Opt. 19,3349 (1980).
13. D. E. Cooper and R. E. Warren, "Two=Tone Heterodyne Spectroscopy with Diode Lasers: Theoryof Line Shapes and Experimental Results," J. Opt. Soc. Am. B 4, 470 (1987).
14. D. Herriott, H. Kogelnik, and R. Kompfner, "Off-Axis Paths in Spherical Mirror Interferometers,"Appl. Opt. 3, 523 (1964).
15. P.L. Varghese and R. K. Hanson, "Collisional Narrowing Effects on Spectral Line Shapes Measuredat High Resolution," Appl. Opt. 23, 2376 (1984).
16. K.C. Smyth, J. H. Miller, R. C. Dorfman, W. G. Mallard, and R. J. Santoro, "Soot Inception in aMethane/Air Diffusion Flame as Characterized by Detailed Species Profiles," Combust. and Flame62, 157 (1985), and references therein.
17. E.R.G. Eckert and R. M. Drake, Jr., Analysis of Heat andMass Transfer(McGraw Hill, New York,
1972), p. 414.
18. D. Bradley and A. Entwistle, "Determination of the Emissivity of Small Diameter Platinum - 10%Rhodium Wires in the Temperature Range 600 -1450 °C," Brit. J. Appl. Phys. 12, 708 (1961).
19. J.H. Kent, "A Noncatalytic Coating for Platinum-Rhodium Thermocouples," Combust. and Flame14, 279 (1970), and references therein.
33

20. J.R. VealeandT. F. Gallagher,"SpectroscopicMonitoringof 02",Final Report, Dept. of Physics,University of Virginia, (1992).
21. D.B. Oh, D. S. Bomse and A. C. Stanton, "Quantitative Measurement of 02 in Laboratory FlamesUsing Near-IR Diode Lasers", 1991 OSA Annual Meeting, San Jose, CA, (1991).
22. D. Bruce and D. T. Cassidy, "Detection of Oxygen Using Short External Cavity GaAs SemiconductorDiode Lasers," Appl. Opt. 29, 1327 (1990).
34

APPENDIX: INSTRUMENT MANUAL
Nonintrusive Fast Response Oxygen Monitoring Systemfor High Temperature Flows


TABLE OF CONTENTS
1. INTRODUCTION .............................................. A- 1
2. ELECTRONIC COMPONENTS .................................... A-2
3. OPTICAL COMPONENTS ........................................ A-9
4. SETUP PROCEDURE ........................................... A-11
5. OPERATION ................................................. A-14
6. DATA ANALYSIS ............................................. A-16
7. LIST OF SUPPLIERS ........................................... A-17
A-ii


1. INTRODUCTION
This manual, which is Appendix A of the Phase II SBIR final report, explains the physical layoutand the operating procedures for the Southwest Sciences multichannel fiber optic oxygen monitor. Themain body of the final report details the basic theory of wavelength modulation spectroscopy using near-infrared diode lasers, instrument design criteria, and the performance specifications of the instrument.Experimental results for temperature and concentration measurements of 0 2 in premixed fiat flames andestimates of detection sensitivity are also presented in the main body of the final report.
The fiber optic oxygen monitor uses optical absorption to measure temperature, oxygen concentration,and velocity in high temperature fast flows. Sections 2 and 3 of this manual describe the electronic andoptical components that make up the instrument. Section 4 describes the setup procedure for theinstrument while Section 5 details instrument operation including suggestions on how to optimize detectionsensitivity. Section 6 describes the procedure for retrieving and analyzing the acquired data from oxygenmeasurements in high temperature fast flows. Section 7 provides a list of suppliers for the variouscomponents used in the instrument.
Most questions regarding routine operation of the instrument are discussed in Section 5.
A-1

2. ELECTRONIC COMPONENTS
Laser Diode and Control Electronics
The Mitsubishi ML 4405 diode laser has a manufacturer-specified wavelength of 750 + 10 nm withnominal output power of 3 mW at room temperature and is available from several suppliers. Since theoxygen sensor is based on monitoring a pair of absorption features (RQ(23,24) at 13163.7871 cm l andRQ(33,34) at 13164.1963 cm l in the 02 A ,--- X (0,0) band), the instrument requires laser diodes that willcontinuously tune over the selected wavelength region. However, obtaining laser diodes preselectedforassured tuning across the wavelength range of interest is not generally possible. The typical procedurehas been to purchase several diode lasers from those suppliers (e.g. ILX Lightwave) who are willing tohand pick diode lasers with room temperature wavelengths close to 760 nm. The tuning behavior of theselasers is then characterized with a wavemeter (Burleigh W-100).
The laser chip is housed in a hermetically sealed TO-5 can, but it is quite susceptible to damage dueto static discharge. Therefore, proper grounding of the laser handler is essential to enable prolongedoperation of the laser diode. Grounding cables are provided to connect the laser diode handler and thelaser housing with the chassis ground port of the diode laser current controller. We recommend that thediode lasers be kept in their factory-provided envelopes with conductive inner surfaces when not in use.
The diode laser is housed in a commercial housing (ILX LDM-4412) with 9-pin subminiature D-connectors for the cables from the current and temperature controllers. In addition, a multi-elementcollimating lens assembly in front of the laser diode allows fine control of the focusing of the laser output.Detailed schematics of this commercial laser housing are available in the ILX manual.
The diode laser is connected to the current source by a 3-pin Teflon socket which in turn connectsto a 9 pin subminiature D-connector port. The connector pins of the diode laser are matched by the holepattern of the 3-pin Teflon socket. The laser diode is installed in a clearance hole of an aluminum plate,which is in thermal contact with a pair of thermoelectric coolers. The temperature controller is connectedto the thermoelectric coolers and a thermistor (imbedded in the aluminum plate) by a second 9-pinsubminiature D-connector port. These connections, which are standard for this laser housing, aredescribed in greater detail in the LDM-4412 manual.
The output wavelength of the diode laser varies with either the temperature or the applied currentlevel, with generally finer control to be had with variation of the current setting. The oxygen sensor isdesigned to operate at fixed diode laser temperature with a train of current ramps that scan the laserwavelength repetitively over the absorption feature of interest. The temperature of the diode lasermounting plate is monitored with an imbedded thermistor, which is read by the diode laser temperaturecontroller (ILX LDT-5910B). This controller also powers the two thermoelectric coolers that are inthermal contact with the laser mounting plate and adjusts the temperature of the plate to maintain aconstant laser temperature. The temperature of the diode laser mounting plate can be set and regulatedwithin +0.05 °C of the set temperature.
The thermistor (Dale Model 1T1002-5) is provided by ILX Lightwave Corporation along with thediode laser housing. A calibration table showing temperature vs. resistance is provided along with thethree constants that are used in the Steinhart-Hart equation for conversion of resistance to temperature bythe temperature controller. The Steinhart-Hart equation is 1/T = (C l x 10-3) + (C 2 x 10⁻⁴) (In R) + (C 3
7 3× 10 ) (In R ) . The thermistor installed in the diode laser mounting plate at time of delivery has part# DL 890232, and C l = 1.107, C 2 = 2.365, and C3 = 0.807. These constants are saved in the non-volatilememory of the temperature controller. The procedure of displaying or altering these constants is detailedin the temperature controller user manual.
A-2

After theILX LDT5910Btemperature controller is turned on, the desired temperature set point canbe established by pressing the "SET TEMP" button and then turning the main control knob. When the"LOCK" button is on, the temperature set point cannot be changed. When the "OUTPUT" switch is
pressed, the temperature control function is enabled. Further detailed description of the front panelswitches can be found in the ILX LDT-5910B instruction manual.
On the rear panel of the temperature controller, the "SELECT SENSOR" switch at the time ofinstrument delivery was set at 100 #A for operation in the -10 to 100 °C temperature range using the Dale10 kl] thermistor. This setting can be switched to 10 #A for -50 to 40 °C operation, if necessary. Thetemperature controller is connected to the diode laser housing by a 15-pin-to-9-pin connector cable.Further information on different temperature sensing applications can be found in the temperaturecontroller instruction manual.
The 15pin-to-9pin output cable from the LDT 5910B utilizes TE Module (+) and (-) connectors (pins1, 2 and 3, 4, respectively) and sensor (+) and (-) connectors (pins 7 and 8, respectively) to supply drivingcurrent to the thermoelectric coolers and to read the thermistor. This cable is connected to the 9-pinsocket on the LDM-4412 laser mount.
The laser diode current is supplied by an ILX ultra low noise current source (Model LDX-3620).This unit provides battery powered operation with < 850 nA noise and ripple for 5 Hz - 10 MHzbandwidth of operation. For operation of the ML4405 diode lasers, the current range is set at 0 - 200 mAwith a transfer function of 100 mA/V between the external modulation input and the output current.
Therefore, we would use 100 mV of voltage ramp to obtain 10 mA in current ramp.The DC power range and the powering of the current source are selected with a key switch on the
lower left-hand comer of the front panel. The "OUTPUT ON/OFF" push button on the lower right comerenables the current supply to the laser diode. The LCD display turns on when the power is "ON" thoughthe output switch is turned "OFF", thereby allowing adjustment of the current setting before powering thelaser. The "LIMIT CURRENT ADJUSTMENT" knob limits the maximum current supplied to the laserdiode, which is set at - 73 mA for the Mitsubishi ML 4405 diode lasers. The "MODULATION MODESELECT" switch is set at "EXT DC", which allows eternal modulation from DC to 1 MHz. The voltage
ramp (which is converted to a current ramp by the 100 mA/V transfer function), with 50 kHz sinusoidalmodulation, is connected to the "EXTERNAL MODULATION INPUT" by a BNC T-connector. Thecurrent level can be changed by two "OUTPUT ADJUST" knobs allowing coarse and fine control.
On the rear panel of the LDX 3620, the "OUTPUT" 9-pin connector allows a subminiature D-connector to mate and supply current to the laser diode in the housing. The "BANDWIDTH SELECTOR"switch is set at "HIGH" for the 50 kHz modulation frequency. The "AC POWER ON/OFF" switch isturned on when battery recharging is needed.
On the 9-pin output cable, only the current output (+) and (-) connectors (pins 8, 9 and 4, 5,respectively) are used to connect the current source to the laser diode with a cable connection to the 9-pinconnector on the diode laser housing. More detailed description of the current source can be found in theILX LDX-3620 instruction manual.
In order to characterize the laser diode tuning behavior, the laser temperature would be set at a given
temperature (preferably near room temperature) while the current setting is varied and the laser outputwavelength is monitored with a wavemeter. If no satisfactory tuning mode is located, the lasertemperature is changed and the process is repeated.
The typical operating temperature of the Mitsubishi ML 4405 laser diode in this application isbetween about i 8 °C to 30 °C depending on the tuning characteristic of each laser. Since higher operatingtemperatures increase the laser threshold current and reduce the output power of the laser at a givencurrent setting, we prefer to work with those diode lasers that operate at the desired wavelength near roomtemperature (or cooler if possible) and a current setting of 60 to 65 mA.
A-3
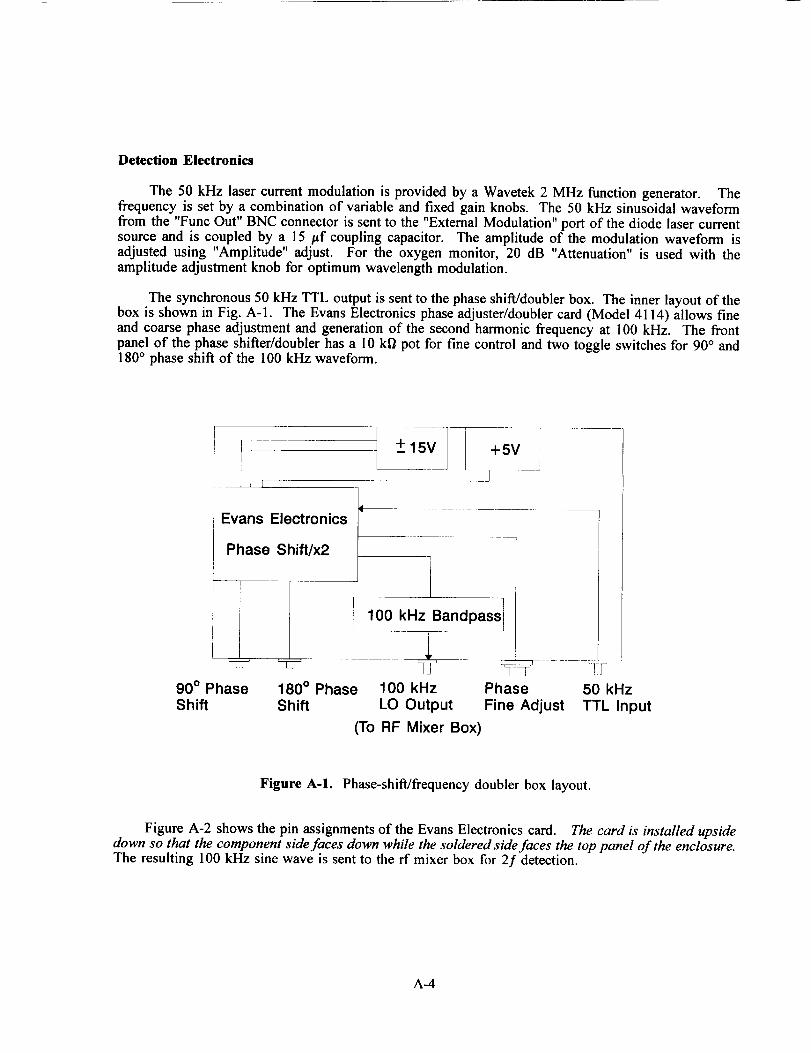
Detection Electronics
The 50 kHz laser current modulation is provided by a Wavetek 2 MHz function generator. Thefrequency is set by a combination of variable and fixed gain knobs. The 50 kHz sinusoidal waveformfrom the "Func Out" BNC connector is sent to the "External Modulation" port of the diode laser currentsource and is coupled by a 15 #f coupling capacitor. The amplitude of the modulation waveform isadjusted using "Amplitude" adjust. For the oxygen monitor, 20 dB "Attenuation" is used with theamplitude adjustment knob for optimum wavelength modulation.
The synchronous 50 kHz TTL output is sent to the phase shift/doubler box. The inner layout of thebox is shown in Fig. A-1. The Evans Electronics phase adjuster/doubler card (Model 4114) allows fineand coarse phase adjustment and generation of the second harmonic frequency at 100 kHz. The frontpanel of the phase shifter/doubler has a 10 kfl pot for fine control and two toggle switches for 90 ° and180 ° phase shift of the 100 kHz waveform.
Evans Electronics
Phase Shift/x2
90 ° Phase 180 ° PhaseShift Shift
+15V I-_ +5V
100 kHz Bandpass_
100 kHz Phase 50 kHz
LO Output Fine Adjust TTL Input
(To RF Mixer Box)
Figure A-1. Phase-shift/frequency doubler box layout.
Figure A-2 shows the pin assignments of the Evans Electronics card. The card is installed upsidedown so that the component side faces down while the soldered side faces the top panel of the enclosure.The resulting 100 kHz sine wave is sent to the rf mixer box for 2f detection.
A-4

DCCorn
Z Y X W V U T S _ P N M L K
22 21 20 19 18 17 16 15 14 131 12 11 10 9
'2 ,o./r 3. j 50kHz +5V
TTL Input-15V
+15V
C B A
2
,_,-
lOOkHzLO Output
Figure A-2. Evans Electronics phase shift card pin assignments.
The Si photodiode (Centronics Model OSD-5T), which is mounted on a 3-pin detector socket of theAnalog Modules detector/preamplifier box, monitors the laser beam. It has an active area of 5 mm 2, a
responsivity of 0.55 amp/watt, and a 7 ns rise time.
An Analog Modules detector/preamplifier (Model 310-46) provides AC and DC outputs forsimultaneous 2f detection of absorbance and laser beam intensity (Io) monitoring. Detailed schematicsof the detector/preamplifier are not available due to the manufacturer's refusal to supply them, but a
general schematic drawing is shown in Fig. A-3.
• i
681_ _i J
470 0
i2k
Si PIN
LM358
!
100kt3
L
DC
AC
Figure A-3. Schematic of the Analog Modules 310-46 detector/preamplifier.
A-5
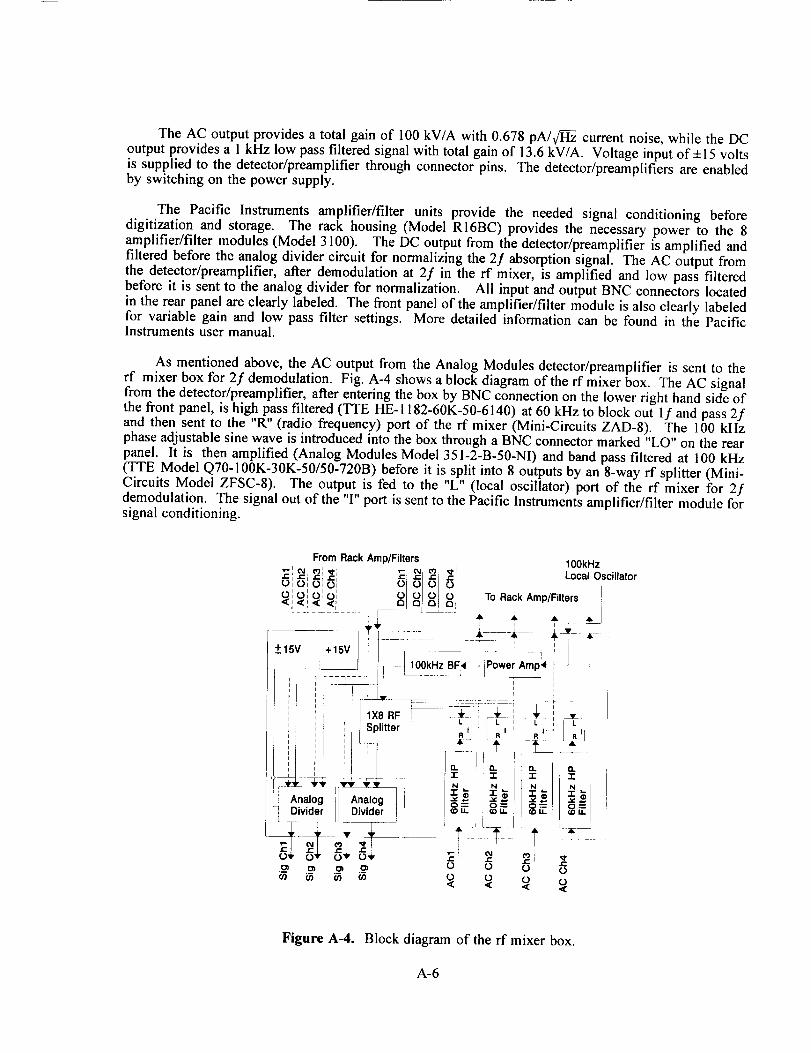
The AC output provides a total gain of 100 kV/A with 0.678 pA/v/--_ current noise, while the DCoutput provides a 1 kHz low pass filtered signal with total gain of 13.6 kV/A. Voltage input of+15 voltsis supplied to the detector/preamplifier through connector pins. The detector/preamplifiers are enabledby switching on the power supply.
The Pacific Instruments amplifier/filter units provide the needed signal conditioning beforedigitization and storage. The rack housing (Model R16BC) provides the necessary power to the 8amplifier/filter modules (Model 3100). The DC output from the detector/preamplifier is amplified andfiltered before the analog divider circuit for normalizing the 2f absorption signal. The AC output fromthe detector/preamplifier, aider demodulation at 2f in the rf mixer, is amplified and low pass filteredbefore it is sent to the analog divider for normalization. All input and output BNC connectors located
in the rear panel are clearly labeled. The front panel of the amplifier/filter module is also clearly labeledfor variable gain and low pass filter settings. More detailed information can be found in the PacificInstruments user manual.
As mentioned above, the AC output from the Analog Modules detector/preamplifier is sent to therf mixer box for 2f demodulation. Fig. A-4 shows a block diagram of the rf mixer box. The AC signalfrom the detector/preamplifier, after entering the box by BNC connection on the lower right hand side ofthe front panel, is high pass filtered (TTE HE-1182-60K-50-6140) at 60 kHz to block out If and pass 2fand then sent to the "R" (radio frequency) port of the rf mixer (Mini-Circuits ZAD-8). The 100 kHzphase adjustable sine wave is introduced into the box through a BNC connector marked "LO" on the rearpanel. It is then amplified (Analog Modules Model 351-2-B-50-NI) and band pass filtered at 100 kHz(TTE Model Q70-100K-30K-50/50-720B) before it is split into 8 outputs by an 8-way rf splitter (Mini-Circuits Model ZFSC-8). The output is fed to the "L" (local oscillator) port of the rf mixer for 2fdemodulation. The signal out of the 'T' port is sent to the Pacific Instruments amplifier/filter module forsignal conditioning.
100kHzLocal Oscillator
To Rack Amp/Filters ]
A A A A /
/
i i
---- t r ' - 7 !
/ I 10OkH;B_F _ Power Amp_
, I
I' :)litterii :
Analog AnalogDivider Divider
! F --_
Ov Ov 0.o oo o
Figure A-4. Block diagram of the rf mixer box.
A-6
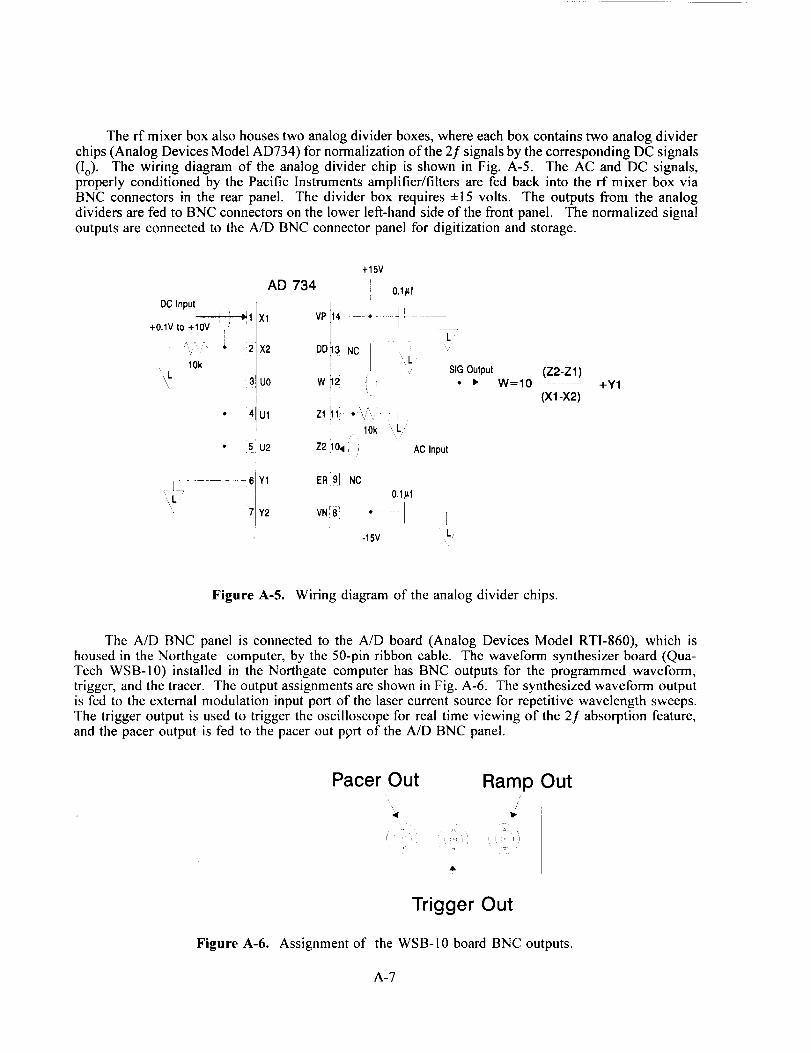
Therf mixerboxalsohousestwoanalogdividerboxes,whereeachboxcontainstwoanalogdividerchips(AnalogDevicesModelAD734)for normalizationof the2f signalsbythecorrespondingDCsignals(Io). Thewiring diagramof theanalogdividerchip is shownin Fig.A-5. The AC and DC signals,properly conditioned by the Pacific Instruments amplifier/filters are fed back into the rf mixer box viaBNC connectors in the rear panel. The divider box requires +15 volts. The outputs from the analogdividers are fed to BNC connectors on the lower let_-hand side of the front panel. The normalized signaloutputs are connected to the A/D BNC connector panel for digitization and storage.
AD 734
X1
+15V
0.1/_f
DD_13 NCL
SIG Output
W_12. • - • •
Z1111" o' _ '
10k L
Z2 t0_ AC Input
I • 16¥1 E, 9] .c
' _7Y2 v. 8 T °il"f 1,-15V
t I
(Z2-Zl)W=10 +Y1
(Xl -X2)
Figure A-5. Wiring diagram of the analog divider chips.
The A/D BNC panel is connected to the A/D board (Analog Devices Model RTI-860), which ishoused in the Northgate computer, by the 50-pin ribbon cable. The waveform synthesizer board (Qua-Tech WSB-10) installed in the Northgate computer has BNC outputs for the programmed waveform,trigger, and the tracer. The output assignments are shown in Fig. A-6. The synthesized waveform outputis fed to the external modulation input port of the laser current source for repetitive wavelength sweeps.The trigger output is used to trigger the oscilloscope for real time viewing of the 2f absorption feature,and the pacer output is fed to the pacer out pprt of the A/D BNC panel.
Pacer Out Ramp Out
/
Trigger Out
Figure A-6. Assignment of the WSB-10 board BNC outputs.
A-7

Data acquisition and storage, using the Northgate 386 computer, are described in Section 5.3 of themain body of the final report. The data acquisition program can be triggered to start data acquisitioneither by a keyboard command (by pressing "T") or by sending a trigger pulse (+2.5 Volts or greater, 100ns or longer) to an 8-bit A/D board (Keithley Metrabyte Model DAS-4). A BNC cable-to-36-pinconnector is provided for the external trigger pulse.
A-8

3. OPTICAL COMPONENTS
The light output from the diode laser is collimated and focused with a 3-element lens assembly(Rodenstock Model 830.1403.169.000), which is mounted on a threaded brass adapter of the diode laserhousing for fine control. The laser beam is coupled into the single mode fiber (3M FS-SN-4221) by acollimating GRIN lens, which is mounted on an XY-tilt/adjust stage (Newport Model F-915).
To reduce the feedback noise from the back-scattered laser beam off the GRIN lens/fiber assembly,
an optical isolator (Isowave Model 1-80-T4) is mounted between the diode laser and the input GRIN lens.Based on the Faraday rotation effect, the polarization of the linearly polarized input beam is rotated by45 ° as it passes through the isolator while the reflected beam is rotated by another 45 ° to be perpendicularto the input linear polarizer. Because of interferences observed between the input and output sides of theisolator surfaces, the input face was custom tilted by 2° . However, careful tilt adjustment is needed tominimize etalon effects in the signal baseline.
The laser beam is coupled into the single mode fiber by a GRIN lens attached to the tip of the fiber.The GRIN lens is fused onto the tip of the single mode fiber to reduce back reflection from the GRINlens-to-fiber junction. The GRIN lens is angle-polished at a 2° angle and AR coated to reduce the etalonbetween the GRIN lens and the optical isolator. A removable purge box can be installed over the laser
beam-to-fiber optic coupling assembly to purge background oxygen.
The single mode fiber (3M Model FS-SN-4221) used to carry the laser beam was manufactured by3M Specialty Fibers Division. It contains a 4.7 #m diameter fiber core, 125 #m diameter cladding, anda reinforced jacket outer shell to make the fiber rugged. The light attenuation at 760 nm is 4.5 dB/km,causing the laser power to drop -4% after 100 feet of fiber used to transport the light to the detectionregion.
The laser beam, after 100 feet of fiber optic cable, is split into 4 outputs with a l x4 fiber opticsplitter (Amphenol 945-999-1611). The four outputs from the fiber optic are collimated with a GRIN lens(OZ Optics, Ltd. Model LPC-01-760-5/125-0.4-1.8-45). The lens provides a 0.4 mm diameter beam witha divergence of 1.8 mrad. The surface of the GRIN lens was polished at 2° and AR coated to minimizethe etalon effects within the GRIN lens. Because of the angle polish on the GRIN lens surface, the laser
beam exiting from the GRIN lens has a small angular deviation from the GRIN lens axis. Therefore, theGRIN lens adapter to the wind tunnel facility was designed to compensate for the deviation.
Between optical components where the fiber optic cables are not continuous, the two fiber ends mustbe joined. One method is to attach a connector assembly on each fiber end and then join the fibers withan adapter. During initial development, ST-type connectors were used to make such connections.However, consistency in fiber-to-fiber coupling efficiency was lacking in such connectors. Therefore, allthe fiber joints were replaced with fusion splicing where the fiber ends are permanently joined. Althoughsome convenience in sensor setup may have been lost, the laser power level at each fiber output is nowdetermined by the input coupling efficiency alone.
The solid etalon assembly is used to generate accurate frequency markers during flow velocitymeasurements in the wind tunnel. A schematic diagram of the etalon assembly is shown in Fig. A-7. Thecollimated laser beam from the output GRIN lens is first expanded with a telescope, then it is sent througha 1" diameter solid etalon (CVI Model ET-25.4-50.0-760-90, 2.04 GHz FSR). Finally, the beam isfocused onto a Si photodiode mounted on an Analog Modules detector/preamplifier. The AC output fromthe detector is then processed for 2f detection and etalon fringes are recovered. For ease of visualizingthe interference ring pattern during initial alignment, a He-Ne tracer beam may be used.
A-9

Solid Etalon
Detector/Preamp fl=5cm (FSR=2.04GHz)fl=O.4cm
fl=5cm GRIN lensAdapter
J/
Figure A-7. Schematic drawing of the solid etalon assembly.
The optical alignment of the other detection channels may be verified or further optimized bymonitoring the DC output from each detector/preamplifier. The wind tunnel fiber adapter holds thetransmitting GRIN lenses and the receiving Si photodiode detectors in their positions during the windtunnel measurement. Although each detection port is prealigned, the GRIN lenses should be rotated withintheir holders to ensure optimum alignment.
A-10

4. SETUP PROCEDURE
This section describes the instrument setup procedure assuming each component is disassembled from
one another. Fig. A-8 shows the diagram of the assembled instrument.
A/D InterfaceBNC Connectors
RF Mixer Box
ILX TemperatureController
ILX CurrentController
Purge Box
! ,I ] f/EJ(;-:
I [ '_] i :I_T ',
[ ] rl -- [[ ] [-_ [ ] [ ] r I ": ";: I
i ,
, . _ y ; 7 1;17
Pacific Instrument• Rack Amp/Filters
Phase Shift/• Doubler
Wavetek FunctionGenerator
Figure A-8. The assembled oxygen sensor.
The installation begins with the optical setup of the laser beam-to-fiber coupling stage (see Fig. 4.1
of the main report for the schematic diagram). The laser diode housing is connected to the laser currentsource and the laser temperature controller by 9-pin D-sub connectors. The two flat beam steering mirrors
are positioned near two comers of a long end of the rectangular area defined with foam strips on top ofthe miniature breadboard. The XY-tilt/adjust stage, which houses the GRIN input lens, is set on the same
side as the laser housing, which is the opposite long side of the rectangle. The optical isolator is mountedon an XY translation stage, and it is positioned near the GRIN lens. The laser beam should be collimated
but gently focusing as it enters the GRIN lens. The idea is to match the 0.3 NA of the input GRIN lensfor optimum coupling efficiency. Finally, the linearly polarized diode laser beam needs to be matched
to the input polarization direction of the optical isolator for maximum transmission.
The breadboard containing the input coupling optics can be set onto the steel rack. Next, each rack
component is installed at the appropriate location. The current source, temperature controller, and function
generator are placed on the bottom space of the rack.
A-11

To optimize the laser beam-to-fiber coupling efficiency, one may wish to bring the Si photodiodedetector close to the GRIN collimating output lens. Make necessary adjustments with the mirrors and/or
XY fine adjustments built into the diode laser housing to bring the laser beam clear through the opticalisolator and centered on the GRIN lens mounting hole of the XY-tilt/adjust stage. While monitoring theDC output from the detector on an oscilloscope, a systematic adjustment of the XY tilt of the GRIN lens
mount should be made. This is often the most time consuming, but probably the most important, step insetting up the instrument.
The 50-pin ribbon connector from the BNC panel should be connected to the RTI-860 board in theNorthgate computer. The waveform output from the WSB-10 board should be connected to the lasercurrent source via the voltage divider. The trigger and tracer outputs from the WSB-10 board are
connected to the trigger port of an oscilloscope and the tracer out port of the BNC panel, respectively.The "Func Out" port from the Wavetek function generator should be combined with the voltage rampoutput from the WSB-10 board.
The TTL output from the 50 kHz function generator should be connected to the 50 kHz inputconnector on the back of the phase shifter box. The resulting 100 kHz sine wave from the front panelof the phase shifter box is fed to the "LO Input" BNC located on the rear panel of the rf mixer box.
The detector/preamplifier DC output is sent to the Pacific Instruments amplifier/filter module, andthen it is sent back to the "DC In" BNC connector on the rear panel of the rf mixer box. The AC outputfrom the detector/preamplifier is sent to the "Sig In" BNC connectors on the front panel of the rf mixerbox. The "AC Out" BNC on the rear panel of the rf mixer is connected to the Pacific Instruments
amplifier/filter and then back to the "AC In" BNC on the rear of the rf mixer box. The "Sig Out" fromthe front panel of the rf mixer box is connected to the A/D BNC panel for digitization. All these portsare marked with corresponding channel numbers, and consistent adherence to the channel number willprevent any confusion. In this section, we have assumed that internal BNC cables inside the rf mixer box
have not been disturbed. If the BNC cables inside the box need to be reconnected, Fig. A-4 should beconsulted for further details.
Use of the solid etalon assembly is straightforward when Fig. A-7 is consulted.
Finally, Table 1 summarizes the BNC coaxial cable connections that need to be made externallybetween components.
A-12

Table 1 - BNC Connections
From
DetectorDC
DetectorAC
rf Mixer
Sig Out
WavetekFunc Out
WavetekTTL Out
WSB-10Func Out
WSB-10TracerOut
-cable->
-cable->
-cable->
-cable->
-cable->
-cable->
-cable->
rack
amp/filter
rf Mixer
Sil_ In
A/DPanel
LDX3620Ext Mod
4_ControlLO In
VoltageDivider
A/DPanel
-cable-> rf MixerDC In
rf Mixer -cable->AC Out
LO Out
-cable->
-cable->
LDX3620Ext Mod
Rack
amp/filter
rf MixerLO In
-cable->
To
rf MixerAC In
A-13

5. OPERATION
The oxygen monitor, when set up and aligned with the procedures outlined in Section 4, should beready for operation. Begin by powering up each component, including the Northgate computer. The lasertemperature controller (ILX LDT-5910B) and laser current source (ILX LDX-3620) can be turned on, butthe output should be disabled for now. Next, enable the temperature controller output and verify that thelaser temperature stabilizes to the set point temperature. Take the synthesized ramp output from the WSB-l0 board, which is connected to the voltage divider for adjustment, to an oscilloscope and verify that theramp voltage does not exceed the maximum laser diode current limit. The voltage to current transferfunction is 100 mA/V for the 0-200 mA output setting, and the current setting on the Mitsubishi ML 4405diode laser should not exceed 70 mA. The ramp can be combined with the 50 kHz sine wave andconnected to the "Ext Mod Input" port of the current source.
Next, take the 2f signal (AC output) and the corresponding DC output from the Pacific Instrumentsamplifier/filter units and display them on the scope. By enabling the current output of the diode lasercurrent source, the laser will be powered up and the DC signal will appear on the scope. If there isoxygen along the laser beam path, some 2f absorption signal will be observed as well. At this point, theoptical alignment of the laser-to-fiber can be checked again and optimized further if necessary. As theDC signal increases due to improvements in the laser-to-fiber coupling efficiency, the 2f absorption signallevel will also increase. However, unwanted etalon fringe signals may also increase in amplitude as theoptical alignment is changed . It is important to strive for the optical alignment that produces the bestsignal-to-baseline noise ratio.
After the laser-to-fiber alignment is checked and aligned for the optimum signal-to-baseline noise,the 2f signals from the different detectors should be monitored simultaneously while the modulationfrequency is adjusted by + 10 kHz from the 50 kHz center frequency. Each detection channel, which uses60 kHz high pass filters to reject the If component and detect 2f, may have somewhat different frequencytransmission characteristics at the detected 2f frequency. We have found that a modulation frequency ofabout 40.5 kHz results in good 2f signal levels on all four channels. Once the modulation frequency isoptimized by observing all 4 detection channels simultaneously, no further adjustment will be necessaryin subsequent operation of the instrument.
The modulation depth (or index of modulation) is adjusted by changing the amplitude setting of theIf sine wave from the "Func Out" port of the frequency generator. The optimum modulation depth isdependent on the line width of the absorption feature, and it thus depends on the sample pressure andtemperature. The optimally modulated 2f signal exhibits no further increase in peak-to-trough level, butwidening of the trough-to-trough separation upon further increases in modulation amplitude can be seen.Therefore, the observed 2f signal must be calibrated with a known absorbance after the modulation
amplitude is optimized. Once a calibration is obtained for each detection channel, the 2f signal fromsubsequent measurements can be converted to absorbance. A measured path length of room air can beconveniently used for such calibrations.
The instrument is now ready to measure oxygen concentration, temperature, and flow velocity in thewind tunnel test facility. Data acquisition can be initiated by either a trigger pulse to the DAS-4 boardin the computer or by the keyboard command. Further description of the data acquisition software,including available options, can be found in Section 5.3 of the main portion of the final report.
The acquired data, which are saved on the hard drive of the Northgate computer, may be retrievedand analyzed using the data analysis routine supplied. Section 6 of this User Manual discusses the dataanalysis software, including its operation and built-in features.
The procedure of powering down the instrument is in reverse order of the powering up sequence.The diode laser current output should be disabled before any other actions are taken. The temperature
A-14

controlleroutputmaybedisabled,andthentherestof thecomponentsmaybepowereddown. Thebatteryinsidethediodelasercurrentsupplycanberechargedby switchingonthe "AC Power"button.
A-15

6. DATA ANALYSIS
The data files acquired and stored with the "OXY.EXE" program can be retrieved and displayed forfurther analysis using a program called "OXY.DAT". Written in the programming environment called"ASYST", this program allows the user to specify the data file, input channel, and the data array ofinterest. The program opens and retrieves the corresponding data, and then it displays the data as aspectral scan. In addition, the time marker that corresponds to the time that the data were acquired isdisplayed on the bottom of the spectral display in units of seconds. The procedure for running the"OXY.DAT" program as well as some of its features are outlined below.
First, data files saved by the "OXY.EXE" program should be located and copied to the hard drivedirectory called "ASY400". (It is presumed that the "OXY.DAT" program is saved in this same
directory.) Next, type "ASYST" at the DOS prompt to enter into the "ASYST" programmingenvironment. The "ASYST" logo and the message "Strike any keys to continue" will appear on thescreen. Upon hitting any key, the ASYST prompt "OK" will appear. At this prompt, type "LOADOXY.DAT". Dotted lines will appear and then the ASYST prompt "OK".
At this point the program is loaded and ready to run. Type "START.DATA" and the program willprompt with "ENTER DATA FILE NAME :". Now type the full data file name with the extension. Forinstance, the data file name 071693.001 stands for the first set of data acquired on July 16th, 1993. Theprogram returns with the data file description (up to 64 characters) and the prompt "ENTER DATACHANNEL NUMBER :" and then "ENTER DATA ARRAY NUMBER :". The data array is a 2-dimensional array with dimensions given by the number of input channels and the number of data bins
per spectral scan. The data array number runs from 1 to the total number acquired, and it also signifiesthe time elapsed during the measurement sequence. Upon entering the data channel number and the dataarray number, the program retrieves the specified spectral data and displays the data on the screen. Atthe bottom of the screen, "TIME MARKER (IN UNITS OF SECONDS) IS = xxx×.xxx,, will bedisplayed. The time marker can be used to assess the time elapsed from one data array to the next array.When one wishes to retrieve another spectral scan (i.e. different data channel number or array number),enter "GET.DATA" at the ASYST prompt "OK". After entering the data channel number and data arraynumber, the newly retrieved data will be displayed on the screen along with the time marker information.
If another data file (i.e. another extension of the same date or different date) is to be opened, type"START.DATA" upon the ASYST prompt "OK" and repeat the above procedure.
Whenever new data are retrieved and displayed on the screen, the displayed data segment is storedin a data array called "DATI". Therefore, the previous data segment is replaced by the latest one.Sometimes, one may wish to save retrieved data and retrieve a second data set for comparison. There arethree other data arrays of equal length called DAT2, DAT3, and DAT4 for such temporary storagepurpose. For instance, typing in " DAT1 DAT2 := " at the ASYST prompt "OK" will copy the currentlydisplayed data segment into the data array " DAT2 "
If one wishes to print the spectral data displayed on the screen, type " SCREEN.PRINT " after the
ASYST prompt "OK". The ASYST programming environment has many features and options gearedtoward scientific analysis, and a proficient programmer of ASYST will find many more options at his/hercommand (e.g. peak finding, data smoothing, etc.).
When data retrieval and analysis are complete, one can exit the ASYST programming environmentby typing " BYE " at the ASYST prompt "OK".
A-16

7. LIST OF SUPPLIERS
1. Diode Laser (Mitsubishi Diode Laser ML4405)
ILX Lightwave CorporationP. O. Box 6310
Bozeman, MT 58771(406) 586-1244
2. Diode Laser Housing, Temperature and Current Controllers
(Laser Housing Model ILX LDM-4412, Diode Laser Temperature Controller Model LDT-5910B, Current Controller Model ILX LDX-3620)
ILX Lightwave CorporationP. O. Box 6310Bozeman, MT 58771(406) 586-1244
3. Function Generator (Wavetek Model 20)
Wavetek San Diego, Inc.9045 Balboa Ave.
San Diego, CA 92123(619) 279-2200
3. Optical Isolator (Isowave Model 1-80-T4)
,
Isowave
64 Harding Ave.Dover, NJ 07801(201) 328-7000
Optical Isolator Mount Stage, Fiber Optic Holder, and Fiber Mode Scrambler(Newport Model 460A-XZ, Newport Model F-915, and Newport Model FM-1)
Newport Corp.1791 Deere Ave.
Irvine, CA 92714(714) 863-3144
5. Fused GRIN Input Collimating Lens
Optomec Design Co.1580 Center Dr.Santa Fe, NM 87505(505) 471-6516
A-17

6. Instrument Amplifiers/Filters (Pacific Instruments Model 3100 (Amp/Filter), R16BC (RackPower Source)
Pacific Instruments215 Mason CircleConcord, CA 94520(415) 827-9010
7. Phase Control Card (Evans Model 4114 Phase Control Card with 50 kHz Bandpass filter)
Evans ElectronicsP. O. Box 5055
Berkeley, CA 94705(415) 653-3083
8. Photodiode (Si) Detector (Centronic Model OSD36-5T)
Centronic Inc.E-O Division1829 DeHavilland Dr.
Newbury Park, CA 91320(805)499-5902
9. Detector/Preamplifier (Analog Modules 310-46)
Analog Modules, Inc.126 Baywood AvenueLongwood, FL 32750(407) 339-4356
10. Fiber Optic Cable (3M FS-SN-4221)
3M Specialty Optical Fiber420 Frontage Rd.W. Heaven, CT 06516(203) 934-7961
11. 1 x 4 Fiber Optic Splitter (Amphenol Model 945-999-1611)
Amphenol Corporation/Fiber Optic Products1925A Ohio St.
Lisle, IL 60532(708) 960-1010
12. Fiber Optic Collimator (OZ Optics Model LPC-01-760-5/125-0.4-1.8-45)
OZ Optics Ltd.PO Box 11218, Station 'H'Nepean, Ontario K2H 7T9 Canada(613) 831-0981
A-18

13. ThermoelectricCoolerfor LaserHeatSink(MelcorCP1.4-35-06L)
MaterialsElectronicProductsCorporation990SpruceStreetTrenton,NJ 08648(609)393-4178
14. ASYSTProgrammingEnvironment
ASYSTSoftwareTechnologies,Inc.100CorporateWoodsRochester,NY 14623(716)272-8211
15. A/D Board(AnalogDevicesModelRTI-860)
AnalogDevices,Inc.OneTechnologyWay,P.O.Box9106Norwood,MA 02061(617)329-4700
16. ProgrammableWaveformGenerator(QuaTechModelWSB-10)
QuaTech,Inc.478EastExchangeSt.Akron,OH 44304(216)434-3154
17. ExternalTriggerBoard(KeithleyMetrabyteDAS-4)
KeithleyInstruments,Inc.440MylesStandishBlvd.Taunton, MA 02780(508) 880-3000
18. Computer (Northgate 386)
Northgate Computer SystemsDept. EWP. O. Box 59175
Minneapolis, MN 55459(800) 648-6051
19. RF Mixer (Mini-Circuits ZAD-8), and 8-Way RF Splitter (Mini-Circuits ZFSC-8)
Mini-CircuitsP.O. Box 350166
Brooklyn, NY 11235(718) 934-4500
A-19

20. 60kHzHighPassFilter(TTE HE1182-60K-50-6140),and100kHzBandpassFilter (TTEQ70-100K-30K-50/50-720B)
TTEIncorporated2251BarryAve.LosAngeles,CA90064(310) 478-8224
21. SolidEtalon(CVI ModelET-25.4-50.0-760-90)
CVI Corp.200DoradoPI., S.E.Albuquerque,NM 87123(505)296-9541
A-20


REPORT DOCUMENTATION PAGE For,,ApprovedOMB No. 0704-0188
Pul_l¢ mpott_ t_Jrdon tot thi ¢o41ection o( intorw_tion ill _1imltlKI tO aV_w 1 hour per _llpOnle. itcit_iin(j the tirol lot ttvlewl N lt_tnJclionl. 14NlrClli_j I=lltl_ = IK_rcal.
_UlIGflng _ maJntobllng the _ needed, a_d corzlpl_ir_ _ rovm,_ the colloctton o_ tnfotrf_tioct. Sold comfxwntl regatcl_g lhll bu_4m qmlJmao ot any ,'_h_' _ od
¢lO_gC_k_ _ Jfl((N'mm_l_. il'l¢_JcIJt_ iu_|_o(tll |of _uc_g this burden, to Waihington Headquattom So*'vicet, DiteclO_lte for I_omtmlon O_olr=¢m and Reports. 1218 J_ O_
Hlghw_/. Suite 1204. ,_'in_on. VA 22202-4302. =m¢l to the Office of Management and BuDget. P_oo_ork Reducllo_ Proje<x (0704-O1M). Wa=hln_, DC
1. AGENCY USE ONLY (Leave blank) 2, REPORT DATE 3. REPORT TYPE AND DATES COVERED
October 1993 Contractor Report
4. TITLE AND SUBTITLE 5. FUNDING NUMBERS
Nonintrusive Fast Response Oxygen Monitoring System for High C NA51-19097Temperature Flows
6. AUTHOR(S) _ 324-02-01
Daniel B. Oh and Alan C. Stanton
7. PERFORMINGORGANIZATIONNAMEtB)ANDADDRESS(ES)Southwest Sciences, Inc.1570 Pacheco St., Suite E-11Santa Fe, NM 87501
9. SPONSORING/ MONITORINGAGENCYNAME(S)ANDADDRESS(ES)National Aeronautics and Space AdministrationLangley Research CenterHampton, VA 23681-0001
8. PERFORMING ORGANIZATION
REPORT NUMBER
NASA CR-4553
10. SPONSORING/MONITORING
AGENCY REPORT NUMBER
NASA CR-4553
`11.SUPPLEMENTARYNOTES
Langley Technical Monitor: Jag J. SinghFinal Report - Phase II
`12¢DISTRIBUTIONI AVAILABILITYSTATEMENT
Unclassified-Unlimited
Subject Category 35
12b. DISTRIBUTION CODE
13. ABSTRACT (Maximum 200 w_cls)
A new technique has been developed for nonintrusive insitu measurement of oxygen concentration, gastemperature, and flow velocity of the test media in hypersonic wind tunnels. It is based on absorption ofnear-infrared radiation from inexpensive GaA1As laser diodes used in optoelectronics industry. It is designedfor simultaneous measurements along multiple lines of sight accessed by fiber optics. Molecular oxygenconcentration is measured from the magnitude of absorption signals; rotational gas temperature from thisintensity ratio of two oxygen absorption lines; and the flow velocity from the Doppler shiftof the absorption linepositions. This report describes the results of an extensive senes of tests of the prototype instrument inlaboratory flames, emphasizing assessment of the instruments capabilities for quantitative measurement of 02concentration (mole fraction) and gas temperature.
_14. SUBJECT TERI_
Hypersonic vehicle development; NearolR diode lasers; High frequency wavelengthmodulation spectroscopy; Spectroscopic measurements of temperature andconcentration of Ozin pre-mixed flat flames
`17. SECURITY CLASSIFICATION `111.SECURITY CLASSIFICATION 'lg. SECURITY cLASSIFICATIONOF REPORT OF THIS PAGE OF ABSTRACT
Unclassified Unclassified
NSN 7540-01-280-5500
l& NUMBER OF PAGES
6816. PRICE COOE
A0420. UMITATION OF ABSTRACT
Standard Form 298 Z3=-I(Rev'S2"Sg)PrNcdbed by ANSi Sld.298-102