NON-TEXTILE MAJOR EXPORTS OF PAKISTAN
35
NON TEXTILE MAJOR EXPORTS OF PAKISTAN THE ECONOMY OF PAKISTAN
-
Upload
madiha-ehsan -
Category
Economy & Finance
-
view
203 -
download
3
Transcript of NON-TEXTILE MAJOR EXPORTS OF PAKISTAN
NON TEXTILE MAJOR EXPORTS OF PAKISTAN
THE ECONOMY OF PAKISTAN

THE EXPORTS Exports are one of the oldest forms of economic transfer, and
occur on a large scale between nations that have fewer restrictions
on trade, such as tariffs or subsidies. The exports performance of a
country is determined by two main factors that are demand and
supply side determinants.
The exports of Pakistan have been dominated by textile,
cotton and non-textile products our raw materials which are
part of our research project like leather, rice, cement other
foods and raw materials, mainly produced by resource based,
low technology, labour intensive industries (73% of exports).

Export Partners Of Pakistan:
RANKS NAMES Of COUNTRIES
1 United States
2 United Arab Emirates
3 United Kingdom
4 Germany
5 China
6 Italy
7 Hong Kong
8 Netherlands
9 Iran
10 Spain
11 Turkey
12 Saudi Arabia
13 Belgium
14 India
15 France
16 Oman
17 South Africa
18 Sri Lanka
19 Qatar
20 South Korea


Products Of Non-Textile Major Exports:
1. Rice.
2. Leather and leather products.
3. Surgical instruments.
4. Sports goods.
5. Vegetable, fruit and fish.
6. Engineering goods.
7. Chemicals and Pharmaceutical products.
8. Carpets, rugs and tents.
9. Household furnishings.
10. Cement.

Introduction to Procedure for Exports:
1. EvaluateYour Export Potential
2. Country/Market Research
3. Determine Entry Strategy and Pricing
4. Plan an Operating Environment:
5. Decide On The Appropriate Export Procedure:
6. Arranging Financing:

RICE: Pakistan is the fourth largest exporter of rice
in the World. Pakistan is one of the largest rice
producing countries, having annual production of
more than 6 million tons, Rice, after wheat, is the
second largest commodity consumed in the
country. Its annual local consumption crosses 2.5
million tons mark.
In year 2012 38,294 tones in January was exported.
Further according to official figures, rice exports during
2012-13 stood short by 235,832 metric tons which
fetched $1.837bn or $243m less in foreign exchange.

WHEAT
2010 1400 (1000 MT) 366.67 %
2011 1100 (1000 MT) -21.43 %
2012 850 (1000 MT) -22.73 %
2013 700 (1000 MT) -17.65 %
MARKETYEAR EXPORTS UNITS OF MEASURE GROWTH RATE
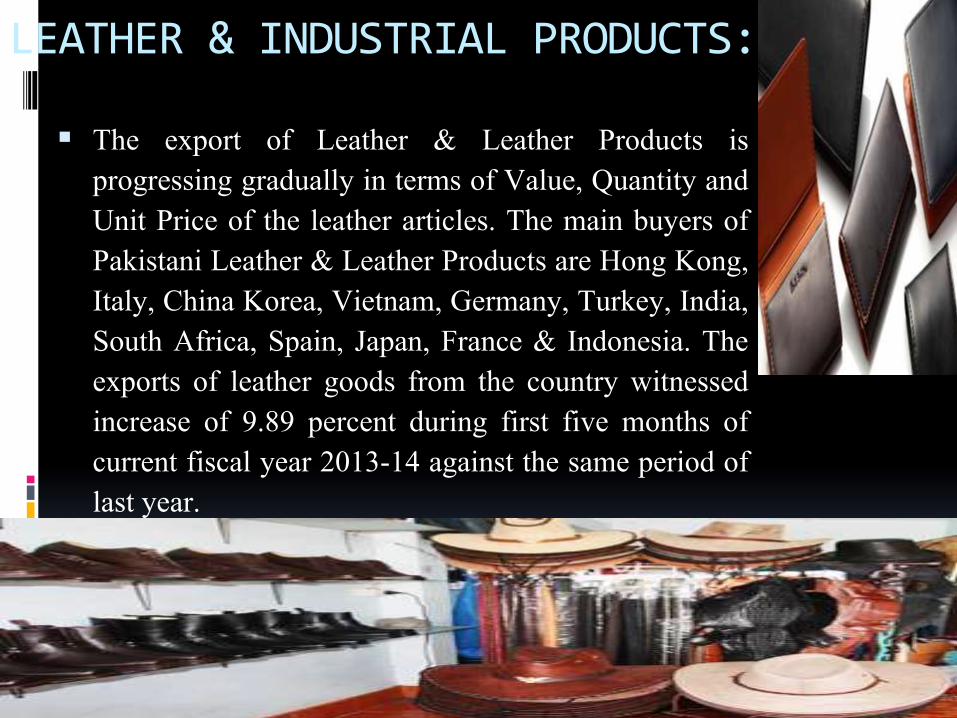
LEATHER & INDUSTRIAL PRODUCTS:
The export of Leather & Leather Products isprogressing gradually in terms of Value, Quantity andUnit Price of the leather articles. The main buyers ofPakistani Leather & Leather Products are Hong Kong,Italy, China Korea, Vietnam, Germany, Turkey, India,South Africa, Spain, Japan, France & Indonesia. Theexports of leather goods from the country witnessedincrease of 9.89 percent during first five months ofcurrent fiscal year 2013-14 against the same period oflast year.
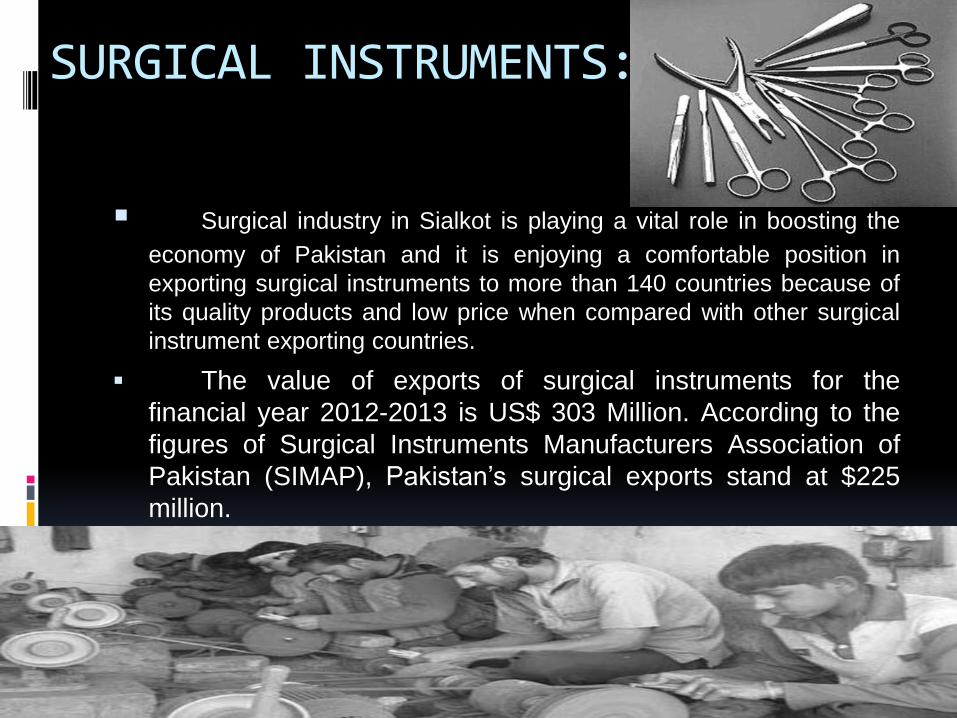
SURGICAL INSTRUMENTS:
Surgical industry in Sialkot is playing a vital role in boosting the
economy of Pakistan and it is enjoying a comfortable position in
exporting surgical instruments to more than 140 countries because of
its quality products and low price when compared with other surgical
instrument exporting countries.
The value of exports of surgical instruments for the
financial year 2012-2013 is US$ 303 Million. According to the
figures of Surgical Instruments Manufacturers Association of
Pakistan (SIMAP), Pakistan’s surgical exports stand at $225
million.

SPORTS GOODS
In 2013 sports goods exports increased
by 0.31 per cent. Exports of sports good
decreased by 3.08 percent during the first ten months of the current
fiscal year over the corresponding period of last year. The exports of
sports good during July-April (2012-13) were recorded at $263.247
million against the exports of $271.625 million during July-April
(2011-12), according to the data of Pakistan bureau of Statistics
(PBS).

VEGETABLES & FRUITS:
ARVI,ONION,GARLIC,TINDAS,POTATOES,
EGGPLANTS,MUSHROOMS,
BITTER GROUND, etc.
Pakistan annually produces about 1.5 million
tons of onions, with an increasing trend during the past 6 years.
Mangoes and citrus fruits (comprizes of different edible fruit species like
mandarin, oranges, grapefruit, lemons and limes.)
Pakistan is the sixth largest producer of Kinow (mandarin) and oranges in theworld, with 2.1 million tons.
There are around 400 known varieties of Mangoes in Pakistan. It is a deliciousfruit being grown in more than 100 countries of the world. The annual estimatedworld over production of mango is approximately over 25million tones.

TOTAL PRODUCTION AREA VISE(MANGOES)PROVINCE AREA
ACRES
PRODUCTION
(LAC TONS)
PERCENTAGE OF
TOTAL PRODUCTION
PUNJAB 1.19 5.82 63.82
SINDH 1.05 3.12 34.21
BALOCHISTAN 0.047 0.16 1.75
NWFP 0.005 0.02 0.22
PAKISTAN 2.29 9.12 100.00
Other exported fruits are: Oranges Apples, Bair, Checoo, Custard Apples, Grapes, Guava, Pomegranates, and Sugar Cane Cuts.

DOCUMENTATION FOR EXPORT OF MANGO:
If an exporter provide following things, thenbanks will be ready to open his account and hewill be able to do export from Pakistan to othercountries.1. Export license2. Sales tax No.3. N.T. NumberThen he, Request for E-form (N.O.C.) C & F certificate Invoice Packing list Air way Bill / Bill of lading Bill of exchange Certificate of origin
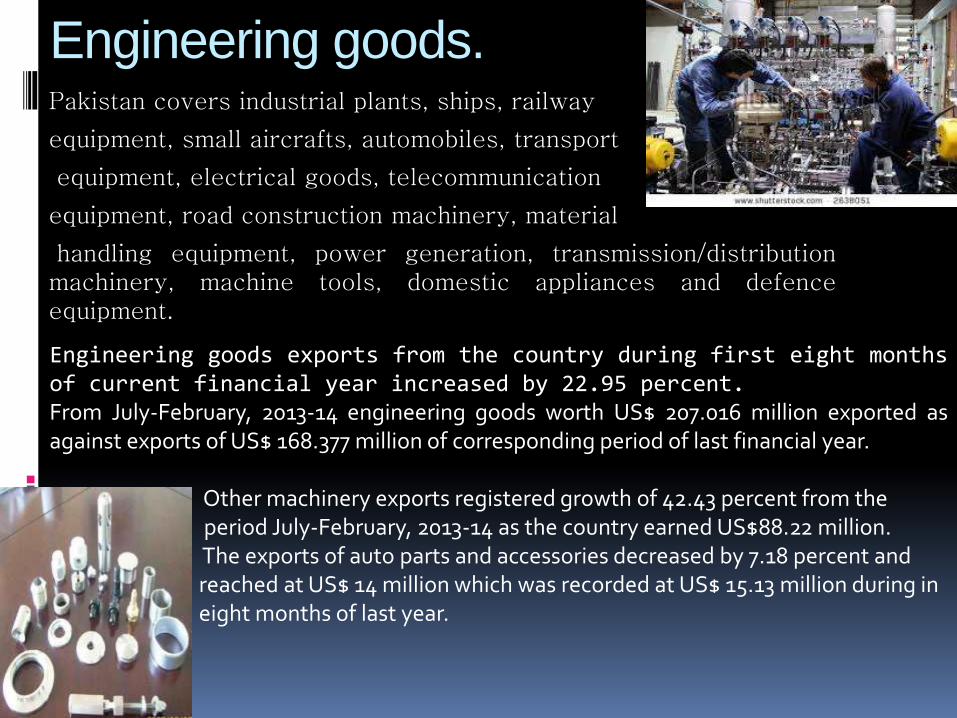
Engineering goods.Pakistan covers industrial plants, ships, railway
equipment, small aircrafts, automobiles, transport
equipment, electrical goods, telecommunication
equipment, road construction machinery, material
handling equipment, power generation, transmission/distributionmachinery, machine tools, domestic appliances and defenceequipment.
Engineering goods exports from the country during first eight monthsof current financial year increased by 22.95 percent.From July-February, 2013-14 engineering goods worth US$ 207.016 million exported asagainst exports of US$ 168.377 million of corresponding period of last financial year.
Other machinery exports registered growth of 42.43 percent from theperiod July-February, 2013-14 as the country earned US$88.22 million.The exports of auto parts and accessories decreased by 7.18 percent andreached at US$ 14 million which was recorded at US$ 15.13 million during ineight months of last year.

Chemicals and Pharmaceutical products.The value of pharmaceuticals sold nationwide exceeded
US$1.4 B in 2007 and US$2.3 B in 2012. The value of
medicines sold is expected to exceed US$3.2 B by 2014.
As of 2013, the total export value of Pakistani-
manufactured medicines around the world stood at
$500 million. Many different companies sell adiverse
range of drugs and pharmaceutical products.
In 2010, the overall rate of medicine, drugs and over-the-
Counter medicines has been calculated up to PKR
159.2bn (US$1.79bn). It has been observed that the medicine
sector have faced huge losses in FY10/11.This might be the
result of uncertainty in the industry. All the way through
to 2014, the value of market at consumer prices is expected to beat a compound annual growth rate (CAGR) of 7.13%.
However, growth will only be 3.50% in US dollar terms,
which would also proceed as prevention to foreign parti-
cipation. The situation can improve over the ten-year forecast
period, with CAGR rates as 8.84% and 6.98%, respectively.

Carpets, rugs and tents.
In FY 2013 the export of carpets, rugs etc witnessed a growth of 7.88pc during the first half of the current fiscal year from a year ago. The export of carpets, rugs etc witnessed a growth of 9.83pc during the first seven months of the fiscal year 2013 from a year ago.

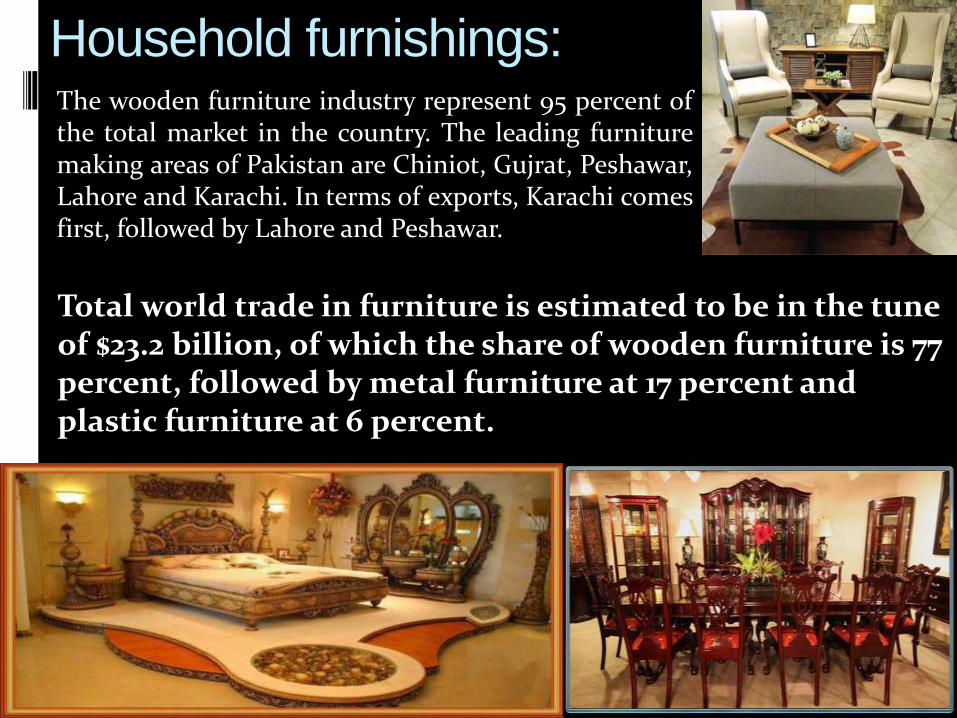
Household furnishings:The wooden furniture industry represent 95 percent ofthe total market in the country. The leading furnituremaking areas of Pakistan are Chiniot, Gujrat, Peshawar,Lahore and Karachi. In terms of exports, Karachi comesfirst, followed by Lahore and Peshawar.
Total world trade in furniture is estimated to be in the tune of $23.2 billion, of which the share of wooden furniture is 77 percent, followed by metal furniture at 17 percent and plastic furniture at 6 percent.

CEMENT:
YEARS
PRODUCTION
(MN.TONES)
EXPORT
(MN.TONES)
2007-2008 37.68 7.717
2008-2009 42.28 10.981
2009-2010 45.34 10.649
2010-2011 42.37 9.428
2011-2012 44.64 8.568
2012-2013 44.64 8.37
2013-2014 44.64 6.69

Export Documentation:
Negotiating Your Contract And Meeting Its Term.
Contract - Offer –Acceptance.
Contract Terms under U.S. Law compared to the Vienna Convention
Determining Your Price.
Selection Of Harmonized System Number And Tariff Consideration.
Choosing a Schedule B Number.
Considerations to Reduce Your Foreign Purchaser's Tariff Liability.
Dispute Resolution.
Other Contract Considerations.
TRANSPORTING YOUR PRODUCTS• Freight Forwarders• Ocean Carriers and Shipping Rates• Air Carriers and Shipping Rates• Surface (Truck and Rail)• Insurance

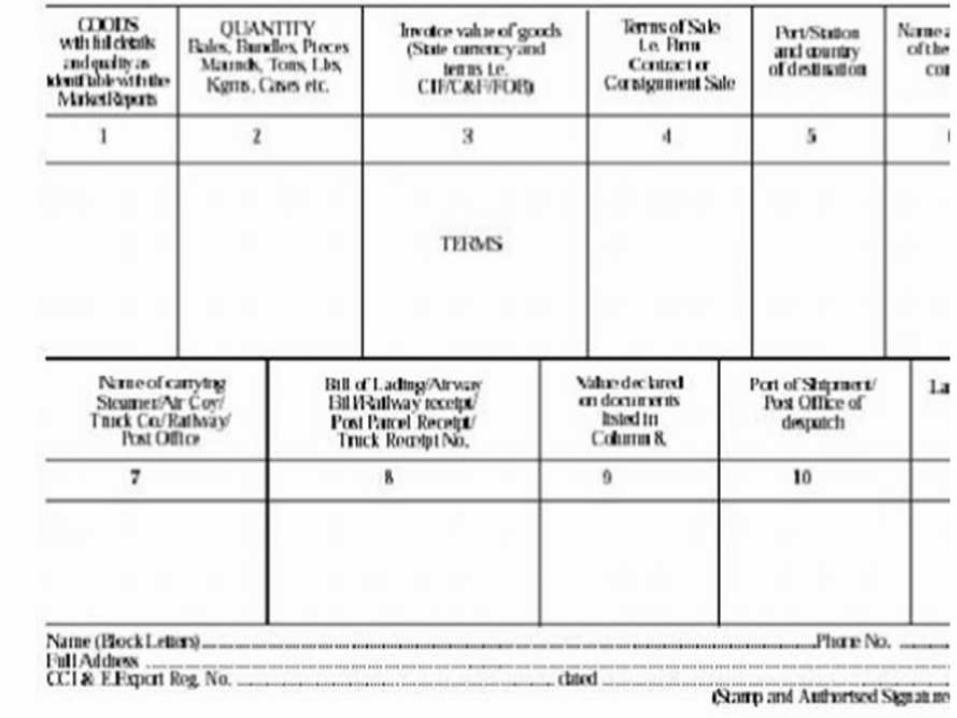
DOCUMENTATION FOR YOUR EXPORT SALE: Commercial Documents Commercial Invoice Packing List Air Waybill Dock Receipt, Warehouse Receipt Bills of Lading (Inland and Ocean) Insurance Certificate Shipper's Letter of Instructions (SLI) Documents for Foreign Customs Clearance Certificates of Origin Consular Invoice, Customs Invoice

SAMPLE EXPORT DOCUMENTS


EFFECT OF EXPORTS ON THE ECONOMEY OF PAKISTAN
To enhance exports the government secured theGeneralized Scheme of Preferences (GSP) Plus statusfrom the European Union (EU) in December 2013. Asper this scheme, Pakistan’s products will be givenaccess, which will be about 20 percent of exports atzero tariff and about 70 percent at preferential ratesto EU markets for three years (from January 1, 2014 toDecember 31, 2016) and hence will aid thestimulation of the economy. In 2013, Pakistan’s totalexport to the EU was about $ six billion, which, owingto the GSP Plus scheme, is expected to increase to $seven billion in 2014, as per an estimation done by theministry of commerce. Expectedly, more jobs will begenerated in the manufacturing sector of both large(e.g. textile) and small scale (e.g. sports, surgical,leather and cutlery) industry.
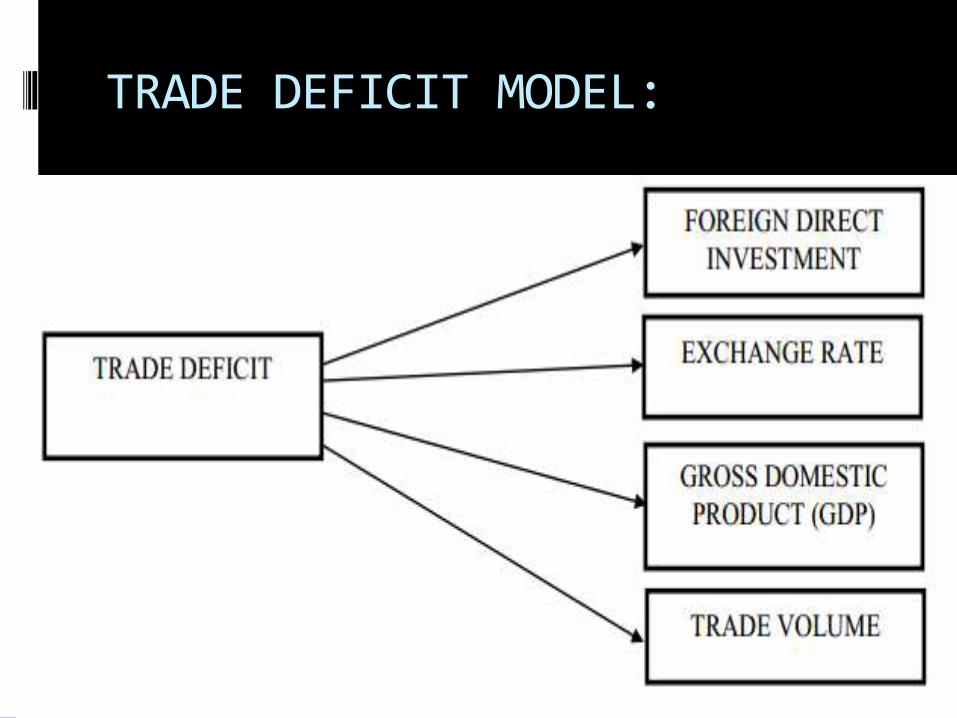
TRADE DEFICIT MODEL:

ADVANCE RELEASE ON EXTERNAL TRADE STATISTICS FOR THE MONTH OF JANUARY, 2014.
According to the provisional figures compiled by the Pakistan Bureauof Statistics, exports from Pakistan during January, 2014amounted to Rs.217,160 million (provisional) as against Rs.243,387 million(provisional) in December, 2013 and Rs.197,187million during January, 2013 showing a decrease of 10.78%overDecember,2013 but an increase of 10.13% over January, 2013.
In terms of US dollars the exports in January, 2014 was $ 2,061million (provisional) as compared to$ 2,275 million(provisional) in December, 2013 showing a decrease of 9.41%but an increase of 1.88% as compared to $ 2,023 million inJanuary, 2013.
The balance of trade figures cumulative from July - January,2013-2014 were (-) 1,165,351 million in terms of Rupees and (-)11,109million in US dollars.


POLITICAL FACTORS:
From the time of independence there has been very less time ofdemocracy in our country which has been a big hurdle in theforeign investments. Due to this entire scenario the foreigninvestors avoid investing in the Pakistan. Traders don’t want todo exports from Pakistan due to this uncertain environment.
ECONOMIC FACTORS:Pakistan’s economy is the world’s 27th largest economybased on its purchasing power. The country remainedimpoverished due to internal political disturbances andnegligible foreign investment, due to that economic growth isquite slow. Inflation is at its highest, while the interest ratesare at their highest. Terrorism and target killing has alsoeffects on the economy of Pakistan. Investors or traders areavoiding investing or trading in Pakistan due to the fear ofTerrorism and targeting killing.
SOCIAL FACTOR
Social factors are related to the culture of any country.soour culture doesn’t have impact on the economy or exportsof the country.
TECHONOLOGICAL FACTORS:
We are far behind developed and most of the developingcountries in respect of technology thus it has a negativeimpact on our exports.