Non-Tariff Measures (NTMs) · PDF fileexports in order to achieve legitimate non-trade...
39
-
Upload
hoangtuyen -
Category
Documents
-
view
222 -
download
2
Transcript of Non-Tariff Measures (NTMs) · PDF fileexports in order to achieve legitimate non-trade...

Outline
Introduction : an overview of NTMs
Classification of NTMs
Incidence statistics and data sources
Data exercise - I
Impact of NTMs
Data exercise – II
Conclusion
Definition
“Non-tariff measures (NTMs) are policy measures, other than
ordinary customs tariffs, that can potentially have an economic effect
on international trade in goods, changing quantities traded, or prices
or both”
Source: UNCTAD / GNTB-MAST

Non-Tariff Measures (Examples)
Quotas Technical requirements
Export subsidies
Import bans
Export restrictions
Minimum import price
Sanitary and phyto-sanitary conditions
Import licenses Voluntary Export Restraints
Determination of eligibility (geographical)
Quality conditions, and proofs
Certificate of Origin

Definition
• All policy-related trade costs incurred from production to the
final consumer, with the exclusion of tariffs
• Countries are allowed by the WTO to regulate their imports and
exports in order to achieve legitimate non-trade objectives.
They can be used for :
• Correcting various market failures such as informational
asymmetries, externalities and monopoly power (price ceiling)
• Protect consumer health (standards, certification, labelling)
• Safeguard the environment (import ban)
• Protection of national industries or infant industries (bailouts,
subsidy)

Emerging importance of NTMs
3
9
3 2 7
2 3 5
3
5
20
5 5
21
4 8
22
6
0
5
10
15
20
25
30
35
Total Ag. Mfg. Total Ag. Mfg. Total Ag. Mfg.
High income Middle income Low income
Ad
-val
ore
m e
qu
ival
en
t fa
ced
wh
en
ex
po
rtin
g
Non-Tariff Tariff
Source : UNCTAD

World average ad-valorem equivalent
of NTMs
16.1
19.3
10.2
11.4
5.6
6.4
3.9
1.7
8.1
5.2
9.5
8.5
5
4.3
4.1
8.9
11.7
7.8
3.4
7.7
12
10.9
4.8
2.5
3.2
2.4
1.2
2.3
0.7
3
1.9
1.6
4.9
2.8
1.8
2.1
2.9
4.5
3.5
0 5 10 15 20 25 30 35 40
Animals
Vegetables
Fats & oils
Beverages & tobacco
Minerals
Chemicals
Plastics
Leather
Wood products
Paper
Textile and clothing
Footwear
Stone & glass
Pearls
Metals
Machinery
Vehicles
SPS
TBT
Other NTMs
Source : Cadot and Gourdon (2015)

The SPS Agreement
• entered into force in 1995
• allows countries to adopt scientifically based measures in order to protect
human, animal and plant life or health
• it recognizes the sovereign rights of WTO Members to provide the level of
health protection they deem appropriate and it (tries) to ensure that NTMs are
not disguised restrictions on international trade
• encourages Members to base their measures on international standards (such
as FAO or WHO)
International agreements on NTMs

International agreements on NTMs
The TBT Agreement
• Signed in 1980 superseded by the 1995 WTO Agreement.
• Deals with technical requirements not covered by the SPS Agreement
• promotes the use of international standards and the mutual recognition of
requirements and of conformity assessment procedures between WTO
Members.
SPS vs TBT example

NTM overview
Barriers vs Measures:
• NTM is a neutral concept – the whole “universe”
• NTBs = subset of NTMs (no agreed definition/criteria)
• Negative effect (research, survey, complaints…), protectionist intent or
legality (WTO, FTA, …)
Procedural obstacles:
• Hardly any (NTM) policy comes without procedure… e.g customs
procedures, paperwork, delays in inspections
• Sometimes considered part of NTBs

Trade Facilitation:
• Mostly related to procedures (which come with every NTM)
• Low hanging fruit, as it is somehow independent of the policy
dimension and only relates to pure "costs"
Private standards:
• "Standards" are voluntary, a priori
• driven by consumer preferences (GAP, FairTrade) but can become de
facto mandatory and highly restrictive
• Governments can make them de jure mandatory (=NTM)

NTM overview
NTM policy universe NTB policy &
NTB procedures
Private
standards
Source : Knebel (2016)

Certain stylized facts on NTMs
• NTMs can actually be trade and/or welfare enhancing
• They can affect prices and quantities or both
• Even though applied indiscriminately, they can be discriminatory
• Among the different types of NTMs, sanitary and phytosanitary (SPS) and
Technical Barriers to Trade (TBTs) are most predominant
• On the whole, TBTs are more prevalent than SPS measures, but SPS more
prevalent on agri-food products than TBTs
• The exact extent of burden imposed by NTMs differ among export markets
• Mixed results on whether NTMs are complements on substitutes to tariffs
(differs by country and product groups)

NTM Classification

Multi-Agency Support Team (MAST)
2012 classification of NTMs

NTM classification
• Tree branch structure
• NTMs are classified into 16 chapters depending on their scope
and/or design (from A to P).
• Each chapter is further divided into sub-groups (up to three digits)
to allow a finer classification of the regulations affecting trade
• All chapters (except chapter P, which deals with exports) reflect
the requirements of the importing country with regard to its
imports

Let us look at a chapter : NTM
classification
Quick Activity
• Please open the file ‘UNCTAD NTM Classification’ in
your shared folder
• Please take few minutes to glance through the NTM
classification document

Analyzing NTMS
Incidence
Looking at individual measures
Incidence statistics (descriptive statistics) like coverage/frequency
ratio
Impact
Direct economic (on trade, prices)
Indirect economic (employment, poverty, …)
Non-economic! Environment, health…

Incidence statistics

Incidence statistics
Frequency ratio
• Share of HS6 lines (within a group) that are affected by at least
one measure
Coverage ratio
• Frequency ratio weighted by trade
• Share of value of HS6 lines (within a group) that are affected by at
least one measure
• Endogeneity issue

Frequency Ratio : Example 0
2040
6080
100
Perc
ent
BRN
CH
N
IDN
KHM
MY
S
SGP
THA
VNM
KAZ
AUS
CAN
EUN JP
N
NZL
US
A
ARG
BOL
BR
A
CHL
CO
L
ECU
GTM HN
D
ME
X
NIC
PAN
PER
PRY SL
V
URY IN
D
LKA
PAK
BEN
CIV
CPV ET
H
GIN
GM
B
NER
NG
A
SEN
Percentage of imported hs6 digit lines coveredby a non-technical NTM in agricultural products
East Asia Transition Economies
Developped Latin America
South Asia Sub-Saharan Africa

Coverage Ratio : Example 0
.2.4
.6.8
1
Per
cent
BRN
CH
N
IDN
KHM
MY
S
SGP
THA
VNM
KAZ
AUS
CAN
EUN JP
N
NZL
US
A
ARG
BOL
BR
A
CHL
CO
L
ECU
GTM HN
D
ME
X
NIC
PAN
PER
PRY SL
V
URY IN
D
LKA
PAK
BEN
CIV
CPV ET
H
GIN
GM
B
NER
NG
A
SEN
Percentage of imported value covered by anon-technical NTM in agricultural products
East Asia Transition Economies
Developped Latin America
South Asia Sub-Saharan Africa

Other Incidence statistics
• Number of distinct measures per product
• Focus on specific measure types

Data Sources
Data Sources
Official Measures
Survey Voluntary
WTO notifications
Legal texts
policy documents
Firm surveys
Mainly procedural
Private or
international
standards

Data Source I : i-tip.unctad.org

Data Source 2: wits.worldbank.org

Data exercise - I
Calculating descriptive statistics
Three Steps
1. Get UNCTAD NTM
data from WITS
Watch out for proper data
availability (only if the field
‘NTM Measures’ shows all
types of measures (A to P)
2. Get trade data from
WITS
3. Get full HS product
code list at 6 digits

Data exercise - I
We will calculate the frequency index and coverage ratio of NTMs
imposed by Japan in 2015 for imports from world.
We will replicate the methodology for a country of your choice.
See ‘NTM Data Exercise 1’ folder in your shared folder

Impact of NTMs

Impact of NTMs
The ad valorem equivalent (AVE) corresponds to the tariff
equivalent that has the same impact on trade. The AVE measures the
gap in the product’s price with and without the NTM.
Calculating ad valorem equivalent (AVE)
1. Direct method (using prices)
where pd is the domestic price (net of retailers’ margins), pw is the world price (net of producers’ and exporters’ margins), τ is the ad valorem tariff, and c represents all other costs such as transport or insurance costs

Calculating ad valorem equivalent : Direct Method
1. the "handicraft" approach – consists of collection of precise and
detailed data on all factors other than the NTM influencing the
domestic price of a product
2.The domestic price of a good is regressed on the world price, on
some importing country’s characteristics, and on tariffs and NTMs.
A simple dummy or a frequency index is usually used for the
measure of the NTMs. The estimated coefficient on this NTM
variable represents the AVE.
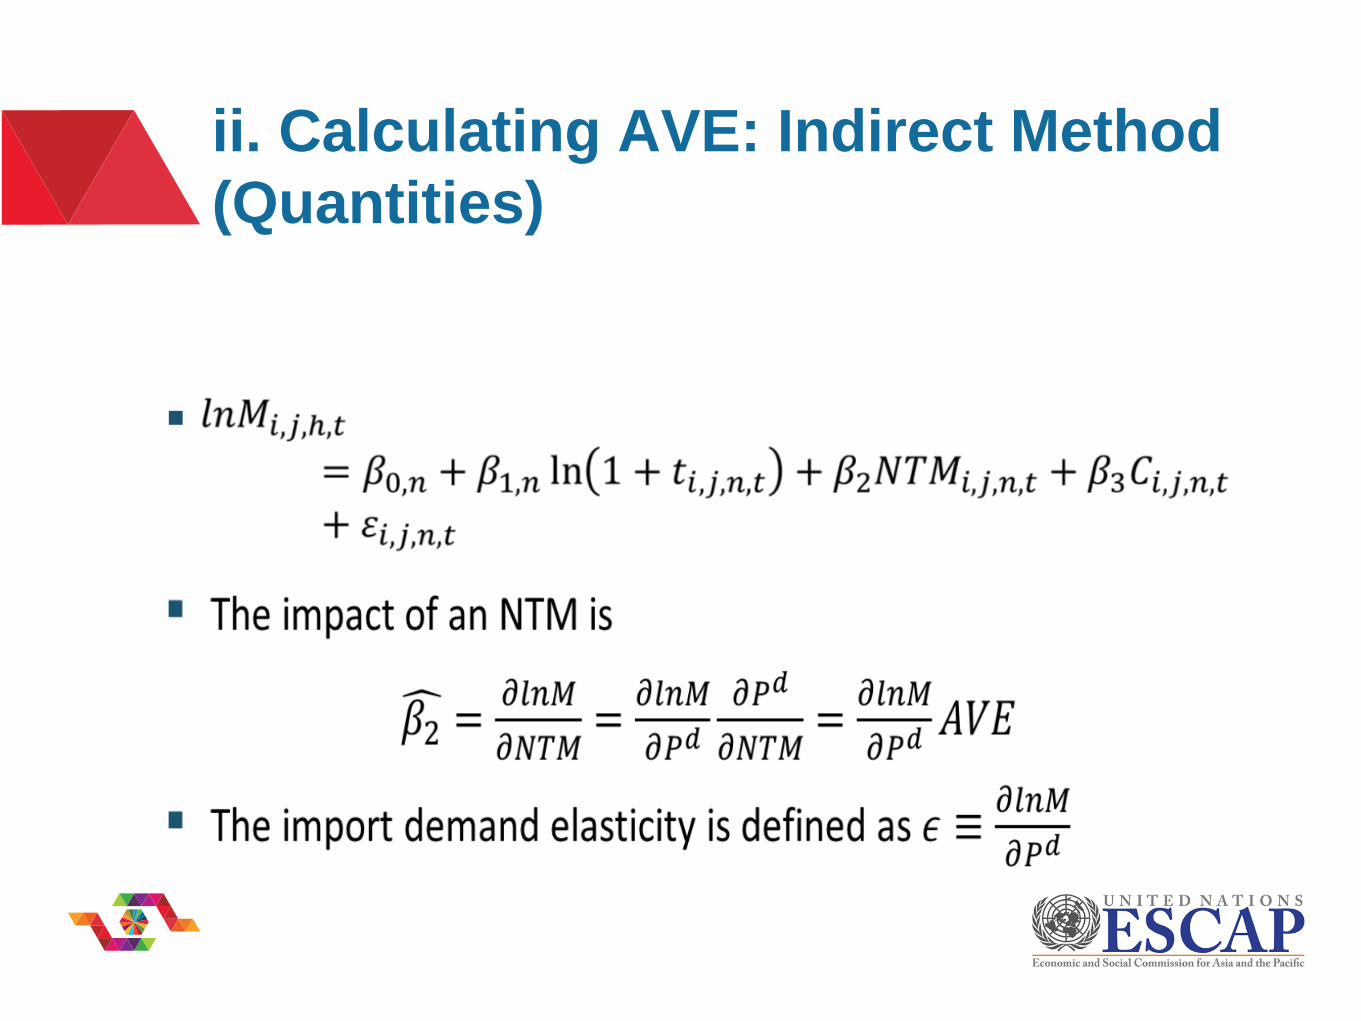
ii. Calculating AVE: Indirect Method
(Quantities)

DATA EXERCISE II
Open in STATA the data file in the shared folder called
“dataset_final.dta”
Open the do file “NTM in gravity model”
Wait for further instructions

Conclusion

NTM and SDGs
Indirect effect
• NTMs seen as trade costs
• Trade costs reduce trade opportunities
Direct effect
• NTMs are policies to protect human, animal and plant health, or to
protect the environment
• Example : food security (SDG 2), ensure sustainable production,
consumption (SDG 12)

Emerging Issues
Coherence
SDGs may lead to increased regulatory activity to "directly" influence
sustainability…but "indirect" linkages must not be ignored
Need to assess costs and benefits of NTMs for coherence
Convergence
Harmonization : both trading partners adopt a common NTM
Mutual recognition : the reciprocal acceptance of NTMs
Both can help reduce trade costs and (potentially) boost trade
Transparency is paramount
References
• Nicita A. and Gourdon, J., 2013, “A Preliminary Analysis on Newly Collected Data on Non-Tariff Measures”,
Policy Issues in International Trade and Commodities Study Series N°53, Geneva: UNCTAD.
• These slides borrow from the course content prepared by UNCTAD Virtual Institute course on ‘Economic
Analyses of NTMs’ and presentations made by UNCTAD (Mr. Christian Knebel) at the WTO/ESCAP-ARTNeT
Capacity Building Workshop on "Empirical methods in trade: Analyzing non-tariff measures”, 12 Dec 2016 to 16
Dec 2016 Bangkok, Thailand
• WTO-UNCTAD, 2012, A Practical Guide to Trade Policy Analysis, WTO-UNCTAD: Geneva. Chapter 2.
• WTO, 2012, World Trade Report 2012 - Trade and public policies: A closer look at non-tariff measures in the
21st century. Geneva: WTO.


![Introduction to the TBT and SPS AgreementsWTO]WTOí»s_SPS_and… · NTMs 9% NTMs can include: Technical Barriers to Trade (TBT), Sanitary and Phytosanitary Measures (SPS), quotas,](https://static.fdocuments.in/doc/165x107/5fa17496096c4b3b9e2fd425/introduction-to-the-tbt-and-sps-agreements-wtowtosspsand-ntms-9-ntms-can.jpg)