Non-Tariff Barriers on Goods and Services in India and...
31
Institute of Public Policy Beaconhouse National University Barriers on Trade in Pakistan and India by Aisha Ghaus-Pasha* *Professor/Director, Institute of Public Policy, Beaconhouse National University, Lahore
Transcript of Non-Tariff Barriers on Goods and Services in India and...
Institute of Public Policy Beaconhouse National University
Barriers on Trade in Pakistan
and India by
Aisha Ghaus-Pasha*
*Professor/Director, Institute of Public Policy, Beaconhouse National University, Lahore
Introduction
• Tariff Barriers
• Non Tariff Barriers (NTBs) Imposed by India and Pakistan
• Views of Exporters Regarding NTBs
• Quantification of the Impact of Tariff and Non-Tariff Barriers on
Trade Restrictiveness
• Policy Recommendations
Institute of Public Policy Beaconhouse National University
Tariff Barriers
Tariff Barriers
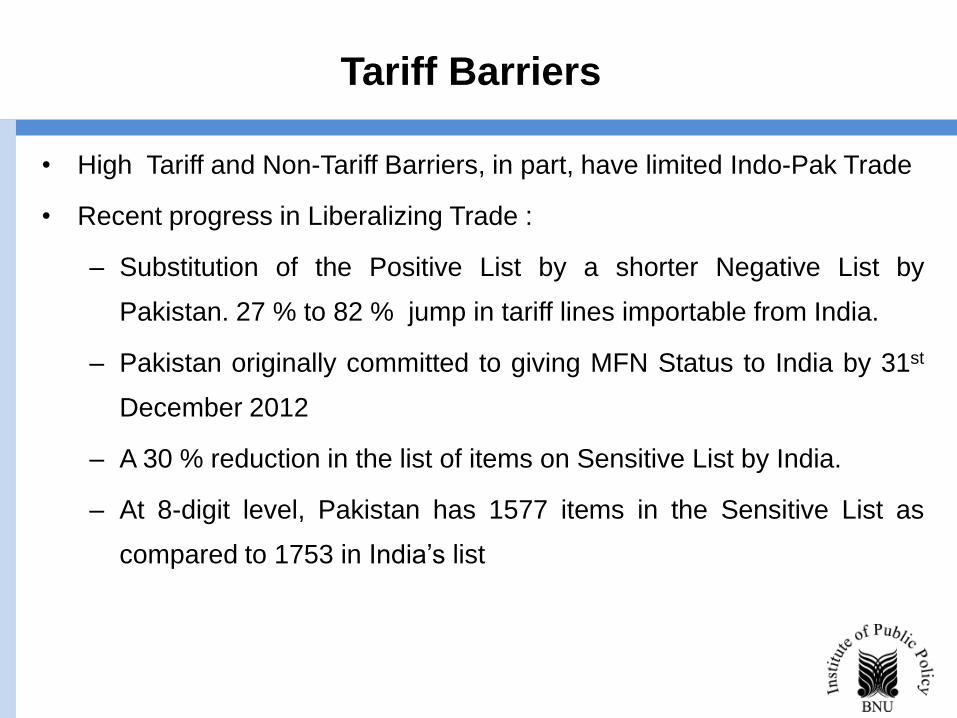
• High Tariff and Non-Tariff Barriers, in part, have limited Indo-Pak Trade
• Recent progress in Liberalizing Trade :
– Substitution of the Positive List by a shorter Negative List by
Pakistan. 27 % to 82 % jump in tariff lines importable from India.
– Pakistan originally committed to giving MFN Status to India by 31st
December 2012
– A 30 % reduction in the list of items on Sensitive List by India.
– At 8-digit level, Pakistan has 1577 items in the Sensitive List as
compared to 1753 in India’s list
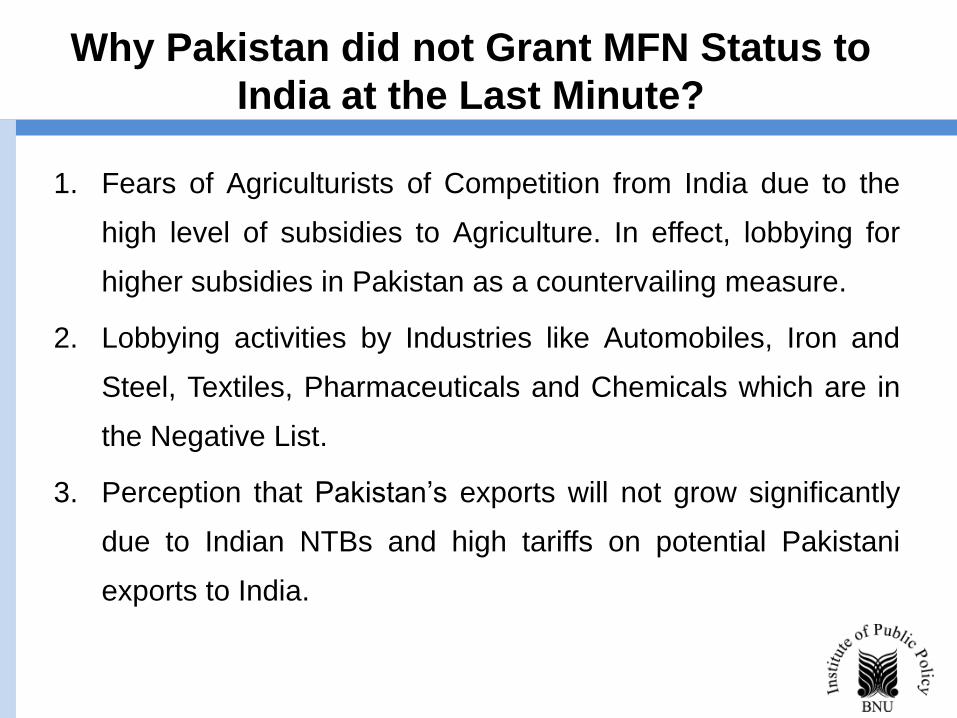
Why Pakistan did not Grant MFN Status to
India at the Last Minute?
1. Fears of Agriculturists of Competition from India due to the
high level of subsidies to Agriculture. In effect, lobbying for
higher subsidies in Pakistan as a countervailing measure.
2. Lobbying activities by Industries like Automobiles, Iron and
Steel, Textiles, Pharmaceuticals and Chemicals which are in
the Negative List.
3. Perception that Pakistan’s exports will not grow significantly
due to Indian NTBs and high tariffs on potential Pakistani
exports to India.
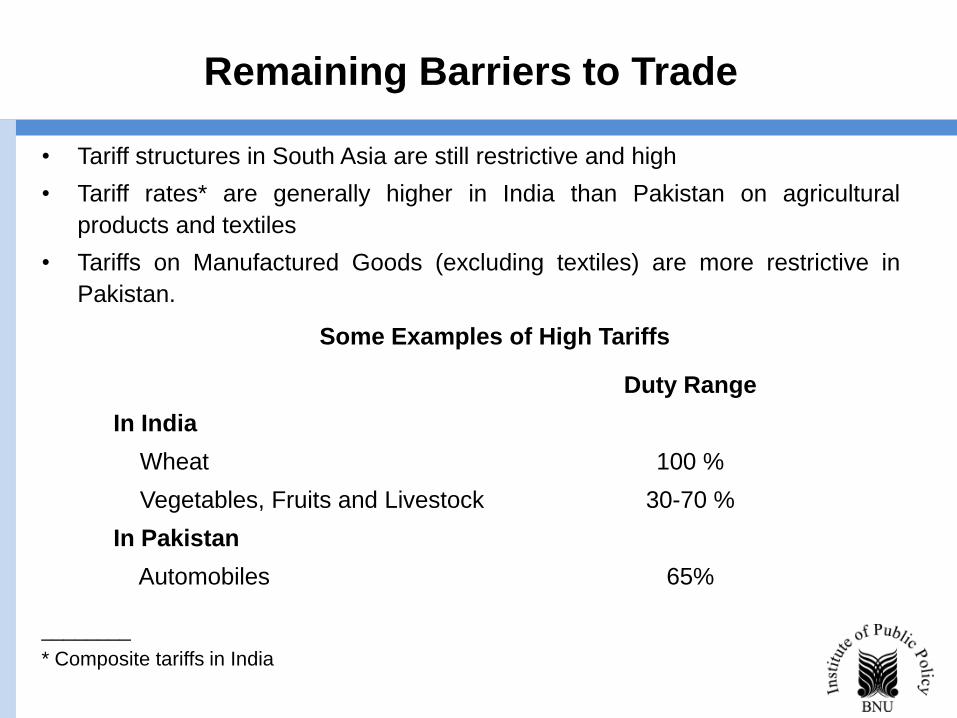
Remaining Barriers to Trade
• Tariff structures in South Asia are still restrictive and high
• Tariff rates* are generally higher in India than Pakistan on agricultural
products and textiles
• Tariffs on Manufactured Goods (excluding textiles) are more restrictive in
Pakistan.
________
* Composite tariffs in India
Some Examples of High Tariffs
Duty Range
In India
Wheat 100 %
Vegetables, Fruits and Livestock 30-70 %
In Pakistan
Automobiles 65%
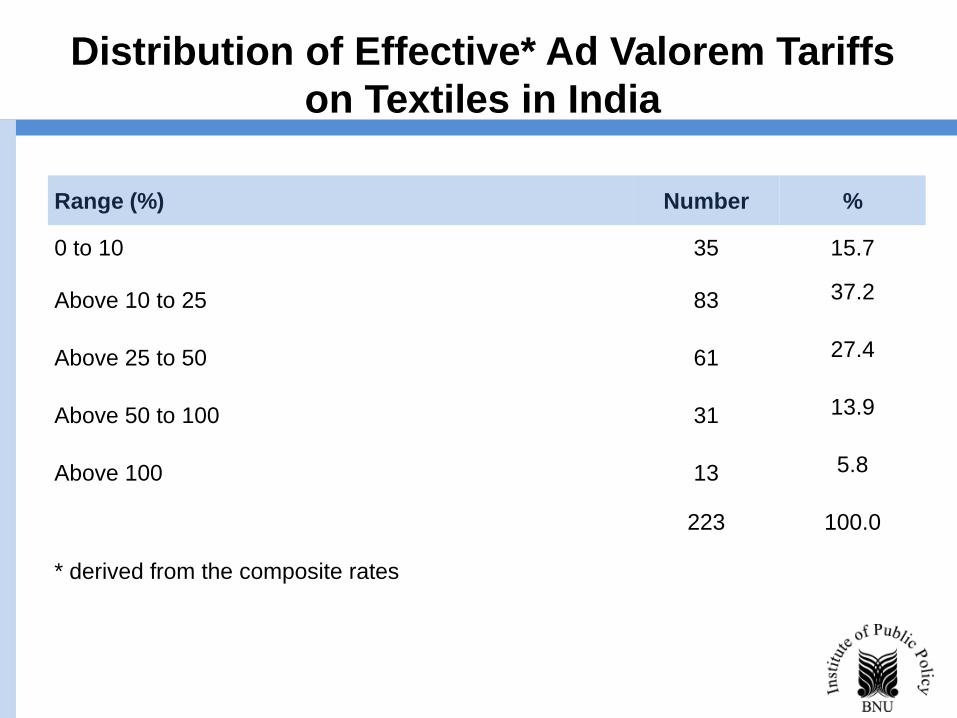
Distribution of Effective* Ad Valorem Tariffs
on Textiles in India
Range (%) Number %
0 to 10 35 15.7
Above 10 to 25 83 37.2
Above 25 to 50 61 27.4
Above 50 to 100 31 13.9
Above 100 13 5.8
223 100.0
* derived from the composite rates
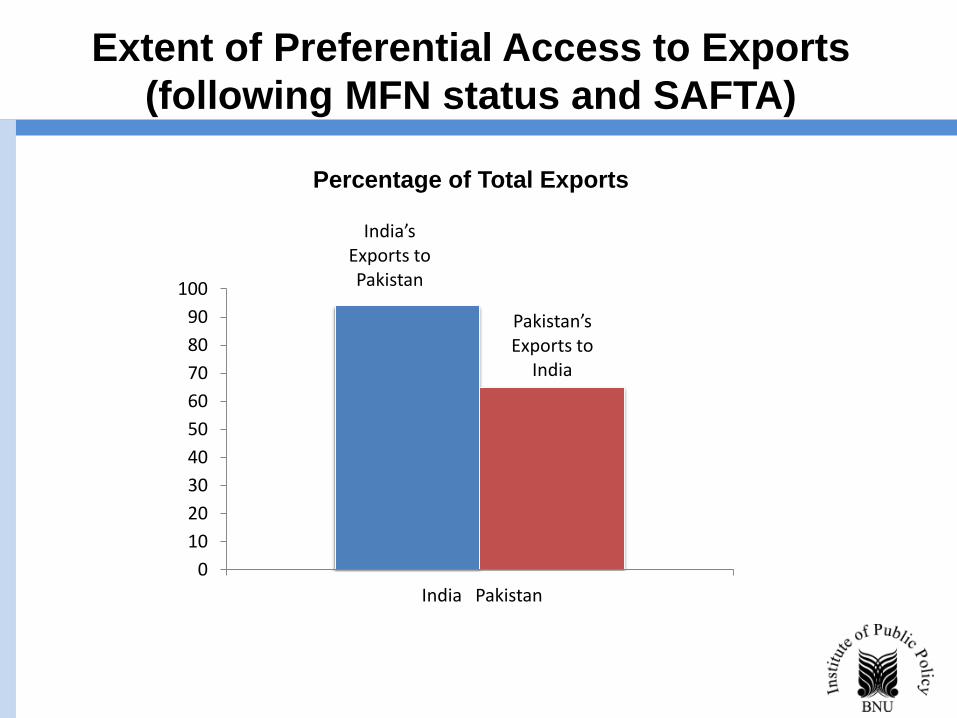
Extent of Preferential Access to Exports
(following MFN status and SAFTA)
India’s Exports to Pakistan
Pakistan’s Exports to
India
0
10
20
30
40
50
60
70
80
90
100
India Pakistan
Percentage of Total Exports
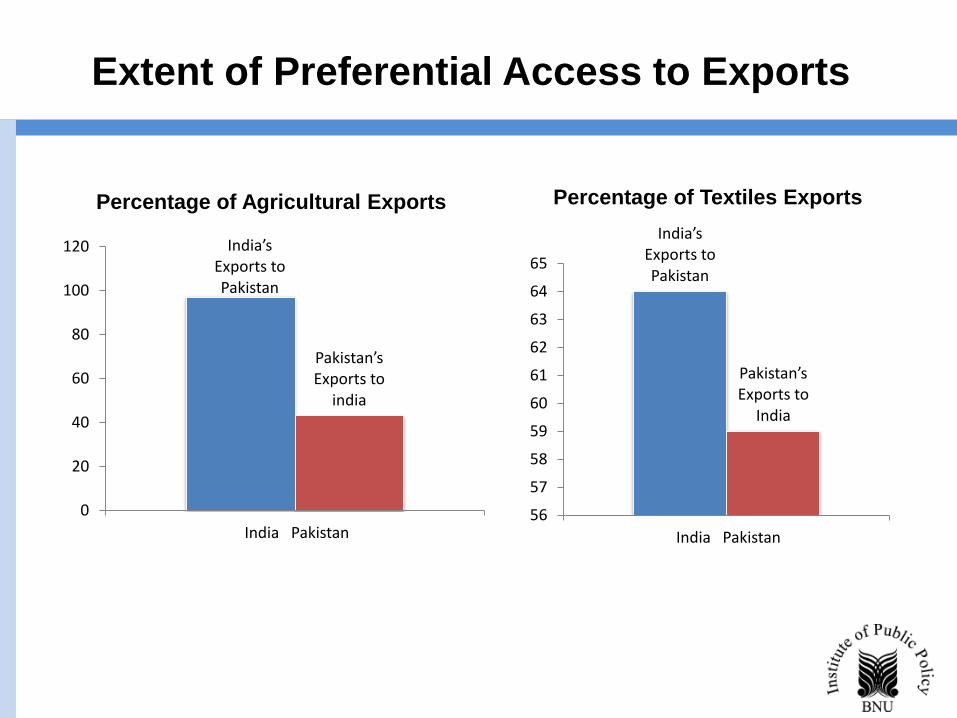
Extent of Preferential Access to Exports
India’s Exports to Pakistan
Pakistan’s Exports to
india
0
20
40
60
80
100
120
India Pakistan
India’s Exports to Pakistan
Pakistan’s Exports to
India
56
57
58
59
60
61
62
63
64
65
India Pakistan
Percentage of Textiles Exports Percentage of Agricultural Exports
Institute of Public Policy Beaconhouse National University
Non Tariff Barriers
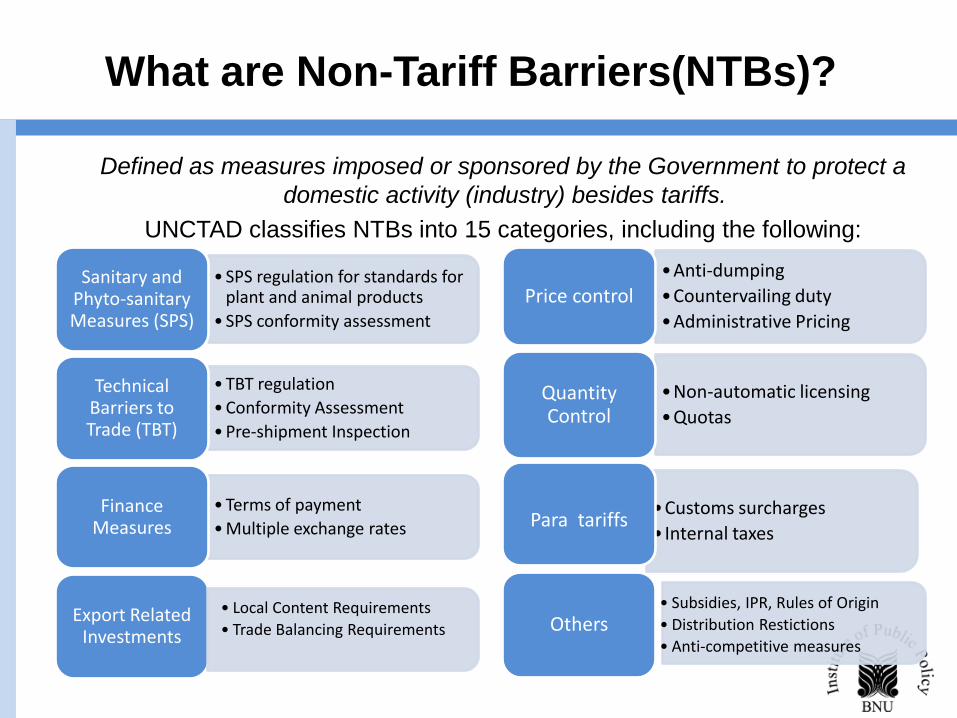
Defined as measures imposed or sponsored by the Government to protect a
domestic activity (industry) besides tariffs.
UNCTAD classifies NTBs into 15 categories, including the following:
• SPS regulation for standards for plant and animal products
• SPS conformity assessment
Sanitary and Phyto-sanitary Measures (SPS)
• TBT regulation
• Conformity Assessment
• Pre-shipment Inspection
Technical Barriers to Trade (TBT)
• Terms of payment
• Multiple exchange rates Finance
Measures
Export Related Investments
•Anti-dumping
•Countervailing duty
•Administrative Pricing
Price control
•Non-automatic licensing
•Quotas Quantity Control
•Customs surcharges
• Internal taxes Para tariffs
Others • Local Content Requirements
• Trade Balancing Requirements
• Subsidies, IPR, Rules of Origin
• Distribution Restictions
• Anti-competitive measures
What are Non-Tariff Barriers(NTBs)?

NTBs on Goods Applied by India
India is an active user of NTBs and varies
application of NTBs selectively on products.
• Rules of origin: Product specific rules
of origin on 180 products under SAFTA
• Pre-Shipment Inspection: metallic
waste and some textiles and clothing
items
• Para-Tariffs: On all goods (17 percent)
in some cases exceeding 30 percent
• Import-Prohibitions: On 51 items
including livestock products
• Reference Prices: for calculation of
custom duty on e.g. palm oil
• Import Licensing: 442 tariff lines,
primarily live animals, vegetable and
mineral products
• Minimum Import Price: 24 tariff lines
including tyres, cement bricks
• Transportation Restrictions: motor
vehicles and second hand cars.
• State Trading: 33 tariff lines including
wheat
• Anti-dumping measures: 207 anti-
dumping measures in force
• Import Quotas: On marble and monitoring
of 415 sensitive items
• Standards: 18623 Indian standards and
84 percent harmonized with international
standards
• Packaging and Labelling: for all food
items etc.
• Sanitary and Phytosanitary measures:
71 notifications on food items
• Special Quarantine Requirements:
animal and animal products, plants
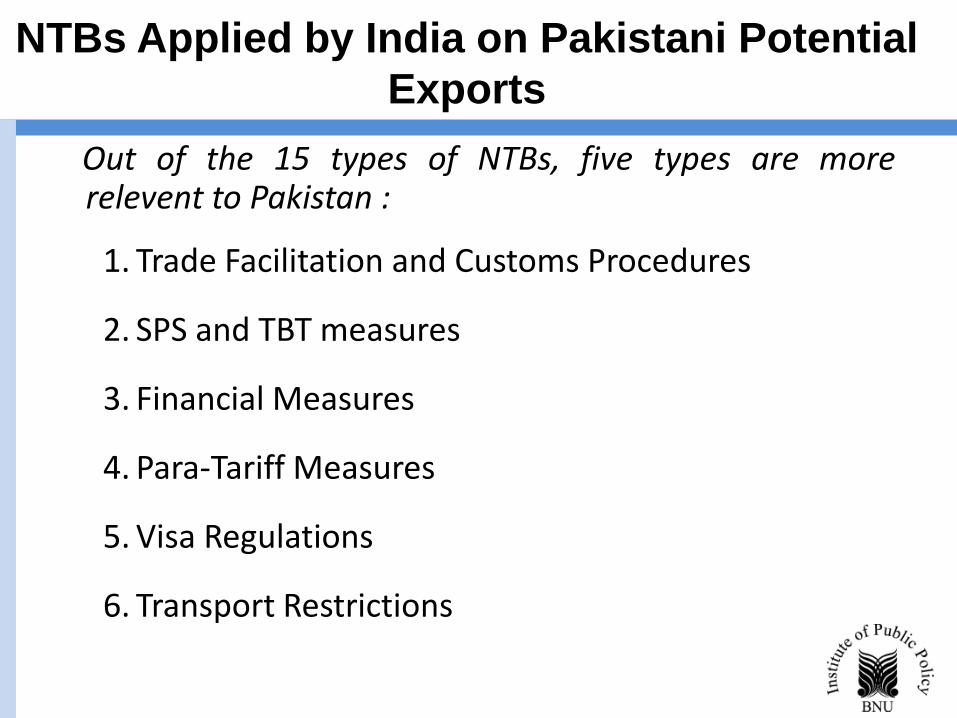
NTBs Applied by India on Pakistani Potential
Exports
Out of the 15 types of NTBs, five types are more relevent to Pakistan :
1. Trade Facilitation and Customs Procedures
2. SPS and TBT measures
3. Financial Measures
4. Para-Tariff Measures
5. Visa Regulations
6. Transport Restrictions
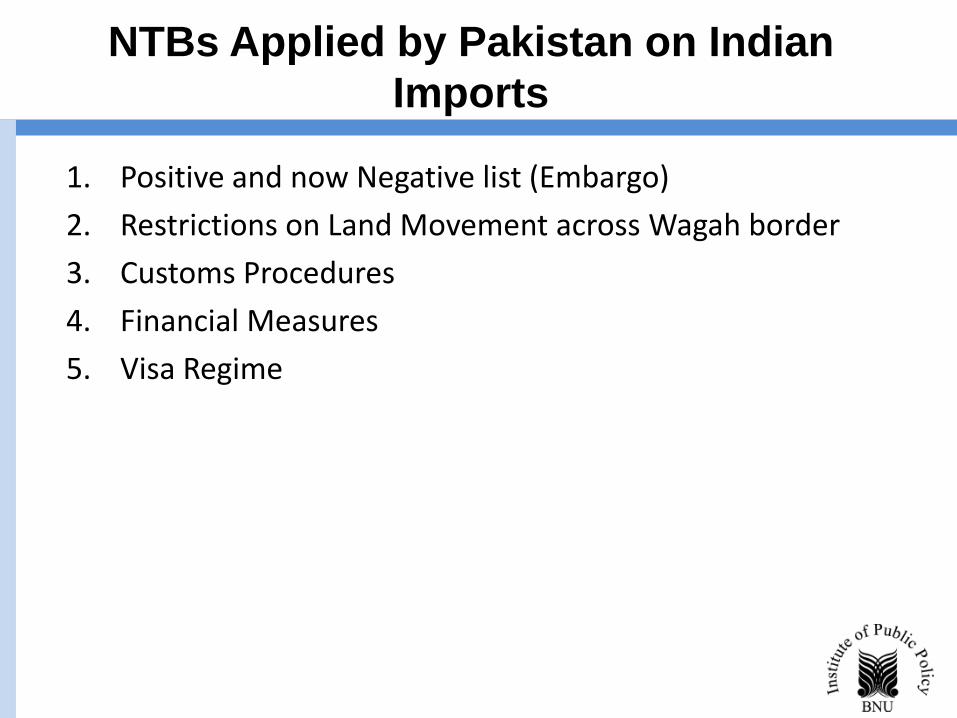
NTBs Applied by Pakistan on Indian
Imports
1. Positive and now Negative list (Embargo)
2. Restrictions on Land Movement across Wagah border
3. Customs Procedures
4. Financial Measures
5. Visa Regime
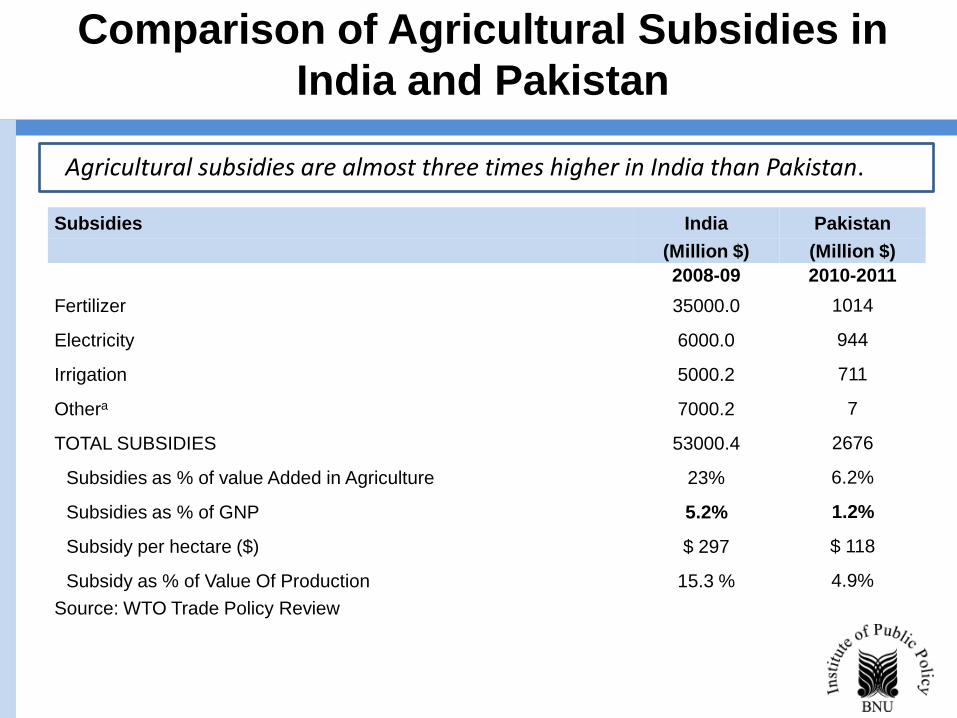
Comparison of Agricultural Subsidies in
India and Pakistan
Agricultural subsidies are almost three times higher in India than Pakistan.
Subsidies India Pakistan
(Million $) (Million $)
2008-09 2010-2011
Fertilizer 35000.0 1014
Electricity 6000.0 944
Irrigation 5000.2 711
Othera 7000.2 7
TOTAL SUBSIDIES 53000.4 2676
Subsidies as % of value Added in Agriculture 23% 6.2%
Subsidies as % of GNP 5.2% 1.2%
Subsidy per hectare ($) $ 297 $ 118
Subsidy as % of Value Of Production 15.3 % 4.9%
Source: WTO Trade Policy Review
Institute of Public Policy Beaconhouse National University
Views of Exporters Regarding
NTBs
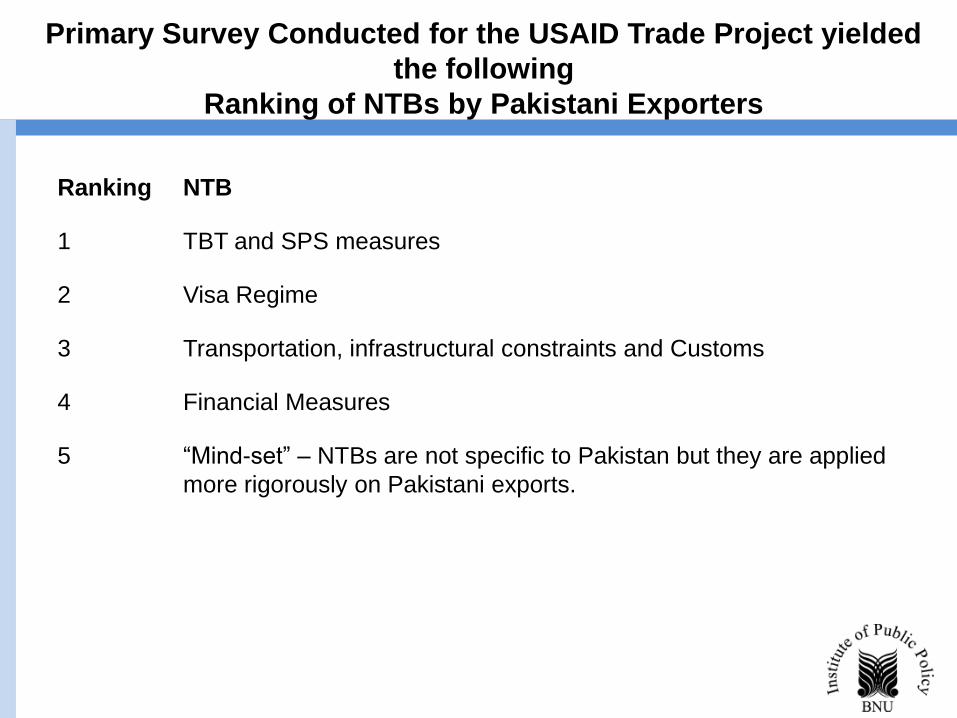
Primary Survey Conducted for the USAID Trade Project yielded
the following
Ranking of NTBs by Pakistani Exporters
Ranking NTB
1 TBT and SPS measures
2 Visa Regime
3 Transportation, infrastructural constraints and Customs
4 Financial Measures
5 “Mind-set” – NTBs are not specific to Pakistan but they are applied
more rigorously on Pakistani exports.
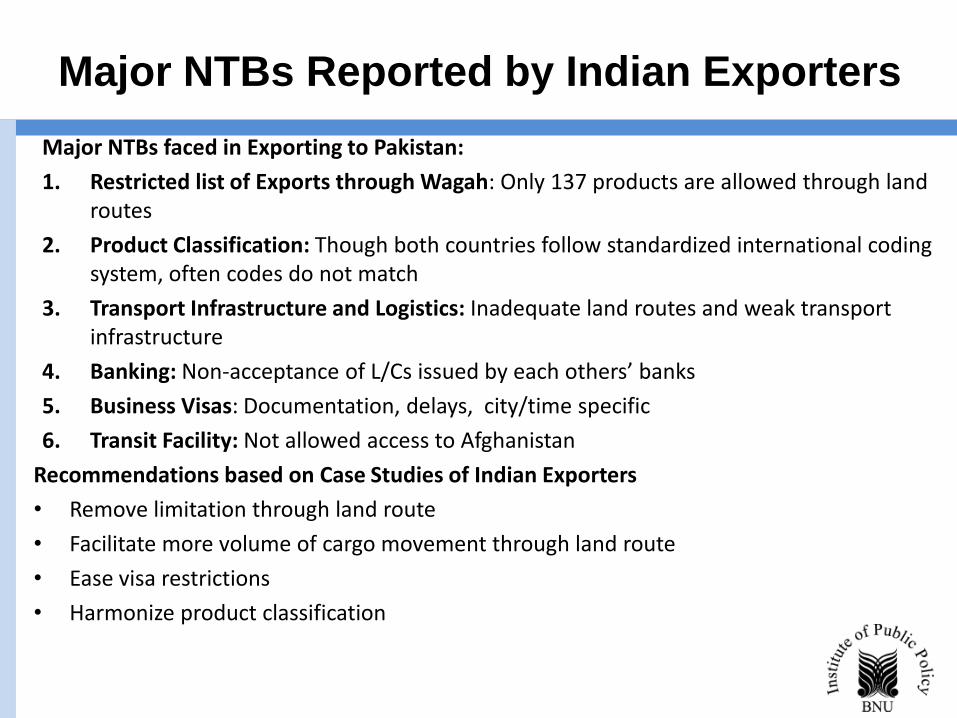
Major NTBs Reported by Indian Exporters
Major NTBs faced in Exporting to Pakistan:
1. Restricted list of Exports through Wagah: Only 137 products are allowed through land routes
2. Product Classification: Though both countries follow standardized international coding system, often codes do not match
3. Transport Infrastructure and Logistics: Inadequate land routes and weak transport infrastructure
4. Banking: Non-acceptance of L/Cs issued by each others’ banks
5. Business Visas: Documentation, delays, city/time specific
6. Transit Facility: Not allowed access to Afghanistan
Recommendations based on Case Studies of Indian Exporters
• Remove limitation through land route
• Facilitate more volume of cargo movement through land route
• Ease visa restrictions
• Harmonize product classification
Institute of Public Policy Beaconhouse National University
Quantification of Impact of Tariff and
Non-Tariff Barriers
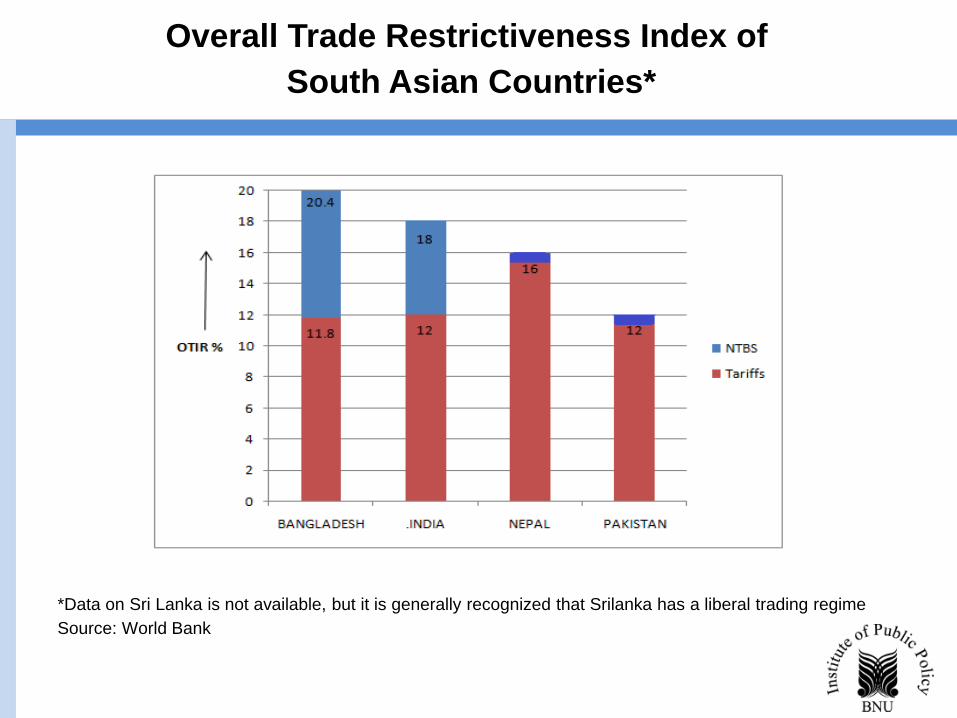
Overall Trade Restrictiveness Index of
South Asian Countries*
*Data on Sri Lanka is not available, but it is generally recognized that Srilanka has a liberal trading regime
Source: World Bank
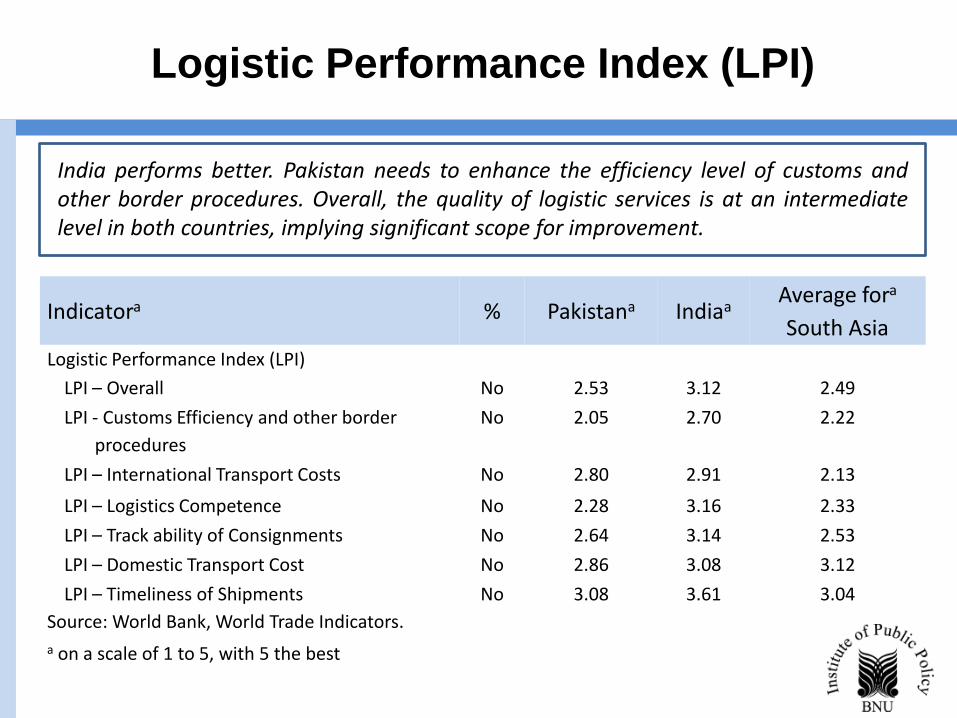
Logistic Performance Index (LPI)
India performs better. Pakistan needs to enhance the efficiency level of customs and other border procedures. Overall, the quality of logistic services is at an intermediate level in both countries, implying significant scope for improvement.
Indicatora % Pakistana Indiaa Average fora
South Asia
Logistic Performance Index (LPI)
LPI – Overall No 2.53 3.12 2.49
LPI - Customs Efficiency and other border
procedures
No 2.05 2.70 2.22
LPI – International Transport Costs No 2.80 2.91 2.13
LPI – Logistics Competence No 2.28 3.16 2.33
LPI – Track ability of Consignments No 2.64 3.14 2.53
LPI – Domestic Transport Cost No 2.86 3.08 3.12
LPI – Timeliness of Shipments No 3.08 3.61 3.04
Source: World Bank, World Trade Indicators.
a on a scale of 1 to 5, with 5 the best
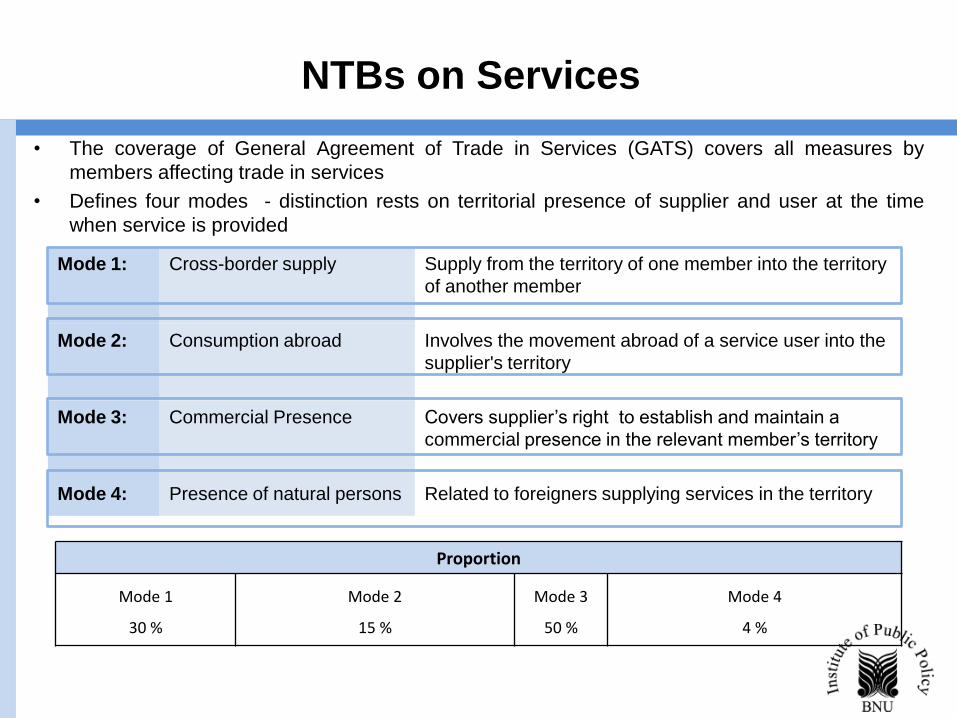
NTBs on Services
• The coverage of General Agreement of Trade in Services (GATS) covers all measures by
members affecting trade in services
• Defines four modes - distinction rests on territorial presence of supplier and user at the time
when service is provided
Mode 1: Cross-border supply Supply from the territory of one member into the territory
of another member
Mode 2: Consumption abroad Involves the movement abroad of a service user into the
supplier's territory
Mode 3: Commercial Presence Covers supplier’s right to establish and maintain a
commercial presence in the relevant member’s territory
Mode 4: Presence of natural persons Related to foreigners supplying services in the territory
Proportion
Mode 1
30 %
Mode 2
15 %
Mode 3
50 %
Mode 4
4 %
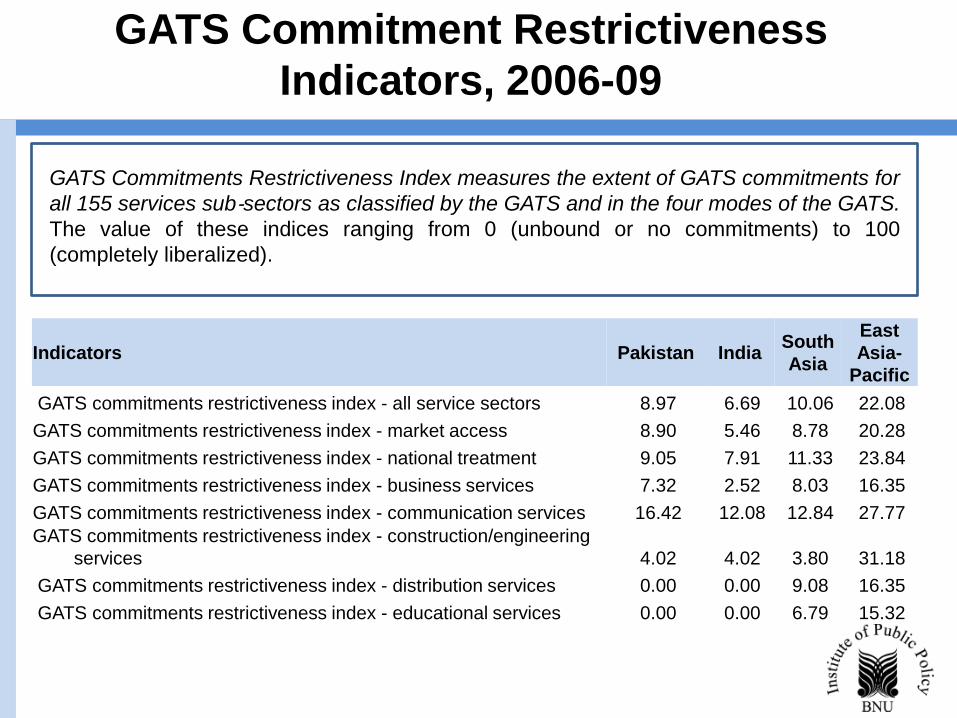
GATS Commitment Restrictiveness
Indicators, 2006-09
GATS Commitments Restrictiveness Index measures the extent of GATS commitments for
all 155 services sub‐sectors as classified by the GATS and in the four modes of the GATS.
The value of these indices ranging from 0 (unbound or no commitments) to 100
(completely liberalized).
Indicators Pakistan India South
Asia
East
Asia-
Pacific
GATS commitments restrictiveness index - all service sectors 8.97 6.69 10.06 22.08
GATS commitments restrictiveness index - market access 8.90 5.46 8.78 20.28
GATS commitments restrictiveness index - national treatment 9.05 7.91 11.33 23.84
GATS commitments restrictiveness index - business services 7.32 2.52 8.03 16.35
GATS commitments restrictiveness index - communication services 16.42 12.08 12.84 27.77
GATS commitments restrictiveness index - construction/engineering
services 4.02 4.02 3.80 31.18
GATS commitments restrictiveness index - distribution services 0.00 0.00 9.08 16.35
GATS commitments restrictiveness index - educational services 0.00 0.00 6.79 15.32
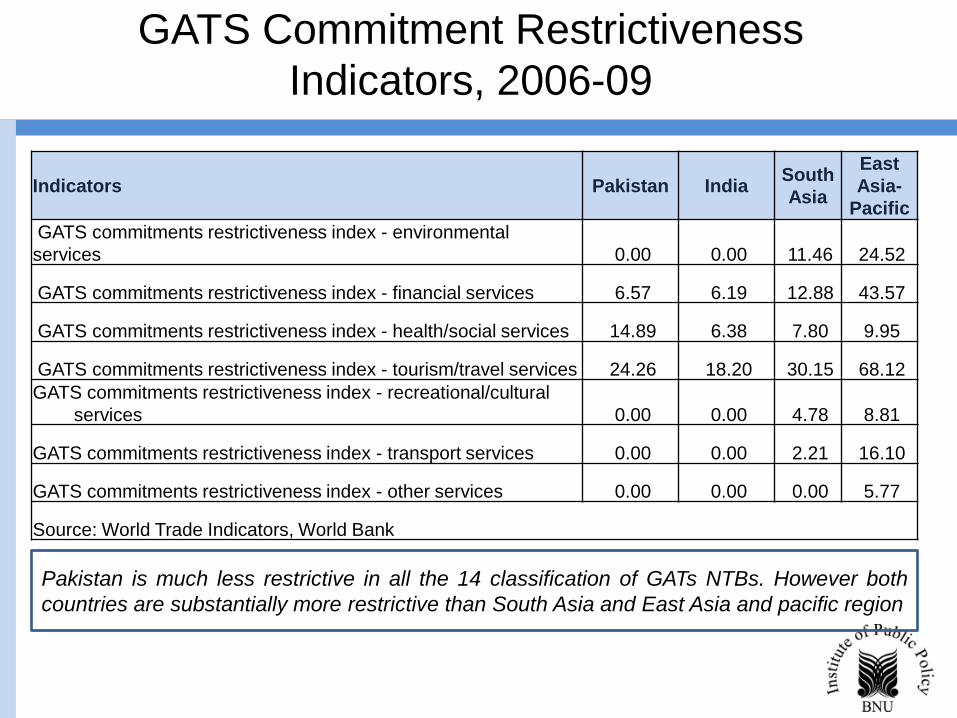
GATS Commitment Restrictiveness
Indicators, 2006-09
Pakistan is much less restrictive in all the 14 classification of GATs NTBs. However both
countries are substantially more restrictive than South Asia and East Asia and pacific region
Indicators Pakistan India South
Asia
East
Asia-
Pacific
GATS commitments restrictiveness index - environmental
services 0.00 0.00 11.46 24.52
GATS commitments restrictiveness index - financial services 6.57 6.19 12.88 43.57
GATS commitments restrictiveness index - health/social services 14.89 6.38 7.80 9.95
GATS commitments restrictiveness index - tourism/travel services 24.26 18.20 30.15 68.12
GATS commitments restrictiveness index - recreational/cultural
services 0.00 0.00 4.78 8.81
GATS commitments restrictiveness index - transport services 0.00 0.00 2.21 16.10
GATS commitments restrictiveness index - other services 0.00 0.00 0.00 5.77
Source: World Trade Indicators, World Bank
Institute of Public Policy Beaconhouse National University
Policy Recommendations
• Areas where Sensitive List of India needs to be reduced
• Areas where NTBs have to be further relaxed
• Improvements in Trade-Related Infrastructure
• Strengthening the Legal Framework
• Strengthening the Institutional Framework
Reduction of Sensitive List of India
As suggested by IPP [2012] in the study sponsored by USAID and by
Taneja [2013] the following items in which Pakistan has export
potential need to be taken out of the Sensitive List of India:
• Wheat, rice
• Mangoes
• Textile fabrics and made up textiles
Areas where NTBs have to be Further
Relaxed
• Harmonization of HC Code
• Reduction in delays in clearance of consignments
• More efficient and less documentation-intensive process by
customs including e-filling
• Some head way made; monitor the implementation of
Simplification of the SPS and TBT requirements by accepting
certification by PSQCA and pre-shipment agencies
• Continuation/Implementation of strengthening and simplification of
the visa regime for business men
Improvement in Trade Related
Infrastructure
• Opening of more routes, like Khokrapar
• More facilities at Wagah-Atari (W-A) Integrated Checkpost
• Increase in Capacity to handle trucks at W-A
• Increase in Railway Wagons by Pakistan
• More flights to facilitate tourism
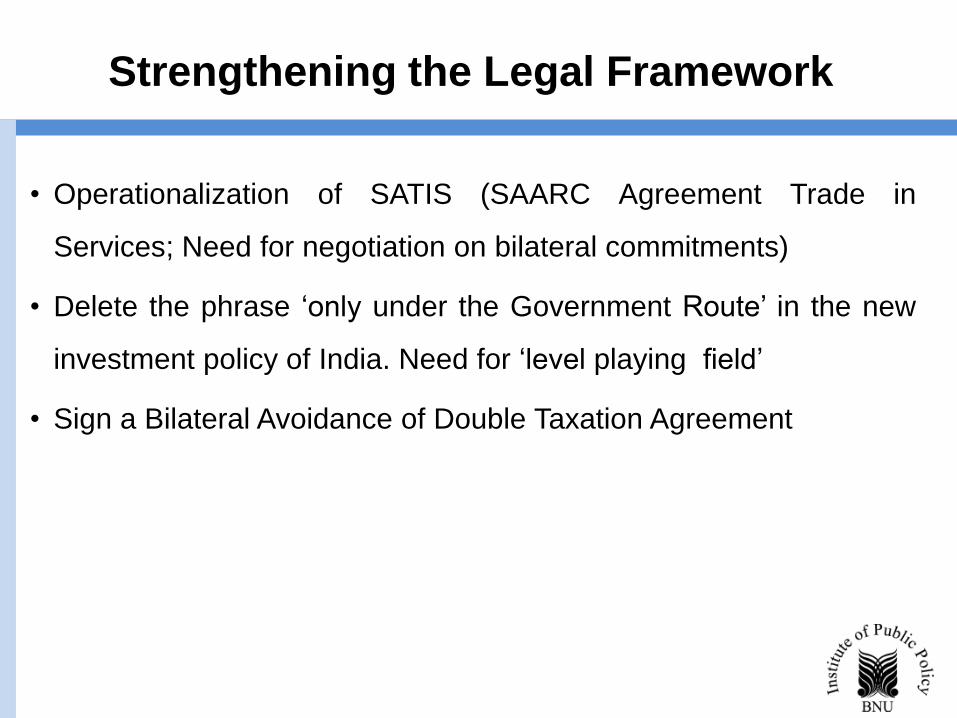
Strengthening the Legal Framework
• Operationalization of SATIS (SAARC Agreement Trade in
Services; Need for negotiation on bilateral commitments)
• Delete the phrase ‘only under the Government Route’ in the new
investment policy of India. Need for ‘level playing field’
• Sign a Bilateral Avoidance of Double Taxation Agreement
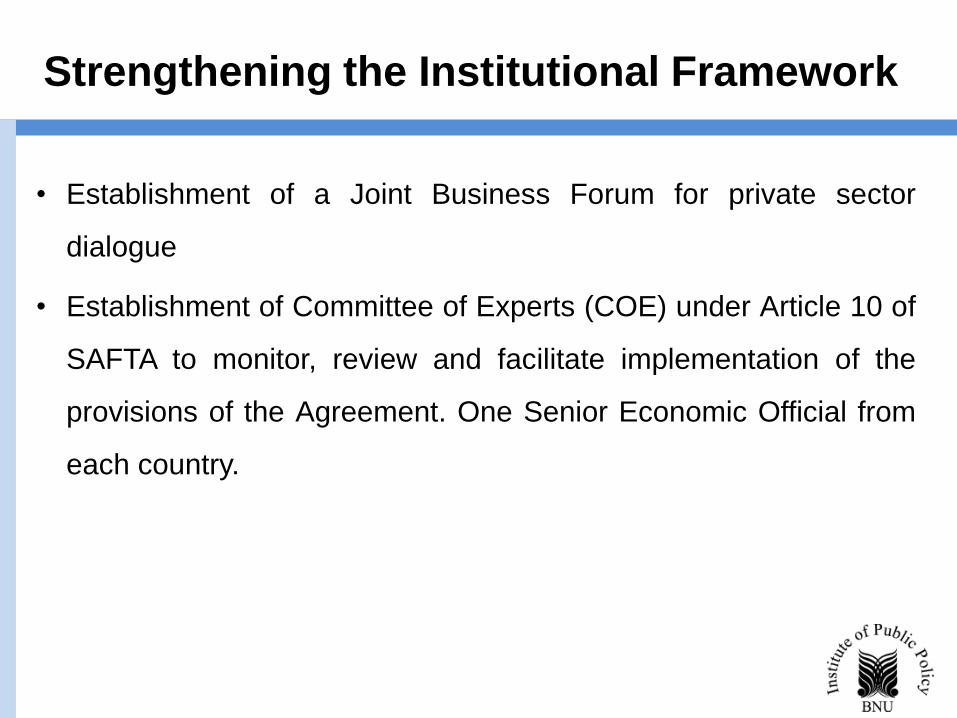
Strengthening the Institutional Framework
• Establishment of a Joint Business Forum for private sector
dialogue
• Establishment of Committee of Experts (COE) under Article 10 of
SAFTA to monitor, review and facilitate implementation of the
provisions of the Agreement. One Senior Economic Official from
each country.
Thank You