
Non-Revenue Water (NRW) – A Complex Topic - CMI Marseille · Non-Revenue Water (NRW) – A...
30
Non-Revenue Water (NRW) – A Complex Topic by Jan G. Janssens Retd. Program Manager Water, WBI [email protected] NRW Reduction in Urban Water Utilities Experiences and Challenges in the Mediterranean Region CMI, Marseille (France), 22 – 23 January 2013
Transcript of Non-Revenue Water (NRW) – A Complex Topic - CMI Marseille · Non-Revenue Water (NRW) – A...
Non-Revenue Water (NRW) – A Complex Topic
by
Jan G. Janssens Retd. Program Manager Water, WBI
NRW Reduction in Urban Water Utilities Experiences and Challenges in the Mediterranean Region
CMI, Marseille (France), 22 – 23 January 2013
Outline
Introduction
Understanding Non-Revenue Water
The Dynamics of Water Losses
Reducing Commercial Losses
NRW and Asset Management
Benchmarking for NRW, Choosing the Right Indicator
NRW Reduction, Management Models
The Way Forward
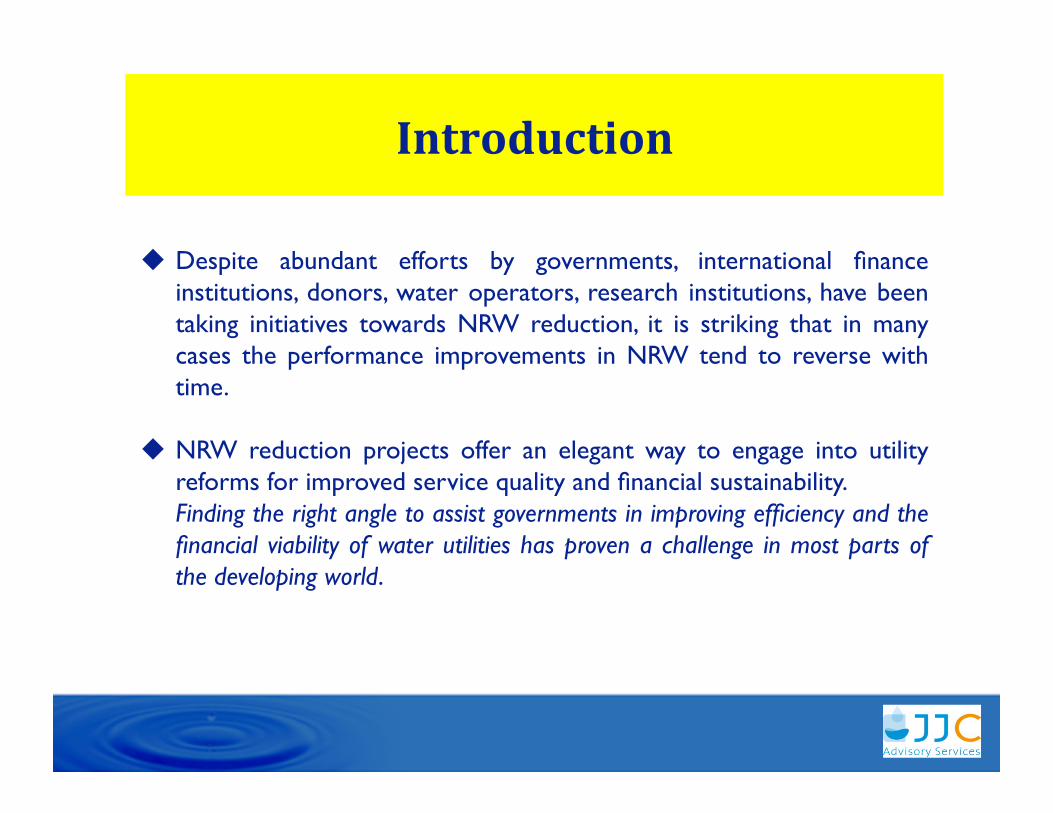
Introduction
Despite abundant efforts by governments, international finance institutions, donors, water operators, research institutions, have been taking initiatives towards NRW reduction, it is striking that in many cases the performance improvements in NRW tend to reverse with time.
NRW reduction projects offer an elegant way to engage into utility reforms for improved service quality and financial sustainability. ���Finding the right angle to assist governments in improving efficiency and the financial viability of water utilities has proven a challenge in most parts of the developing world.
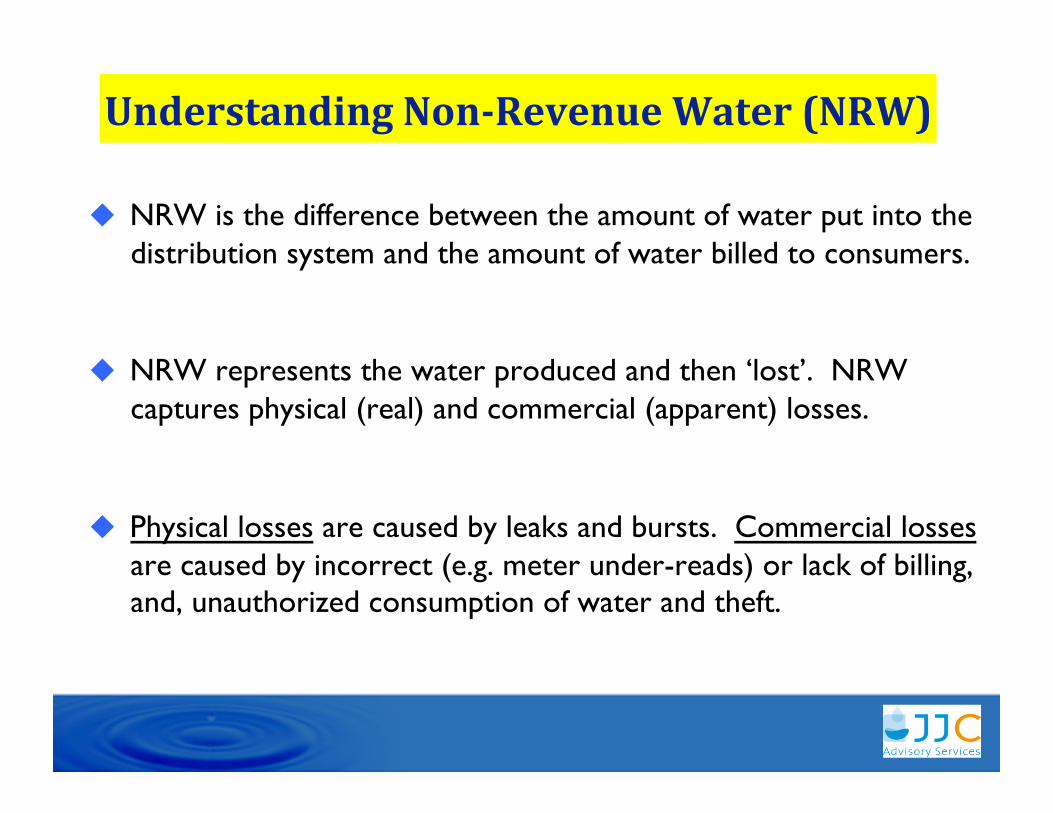
Understanding Non-Revenue Water (NRW)
NRW is the difference between the amount of water put into the distribution system and the amount of water billed to consumers.
NRW represents the water produced and then ‘lost’. NRW captures physical (real) and commercial (apparent) losses.
Physical losses are caused by leaks and bursts. Commercial losses are caused by incorrect (e.g. meter under-reads) or lack of billing, and, unauthorized consumption of water and theft. "
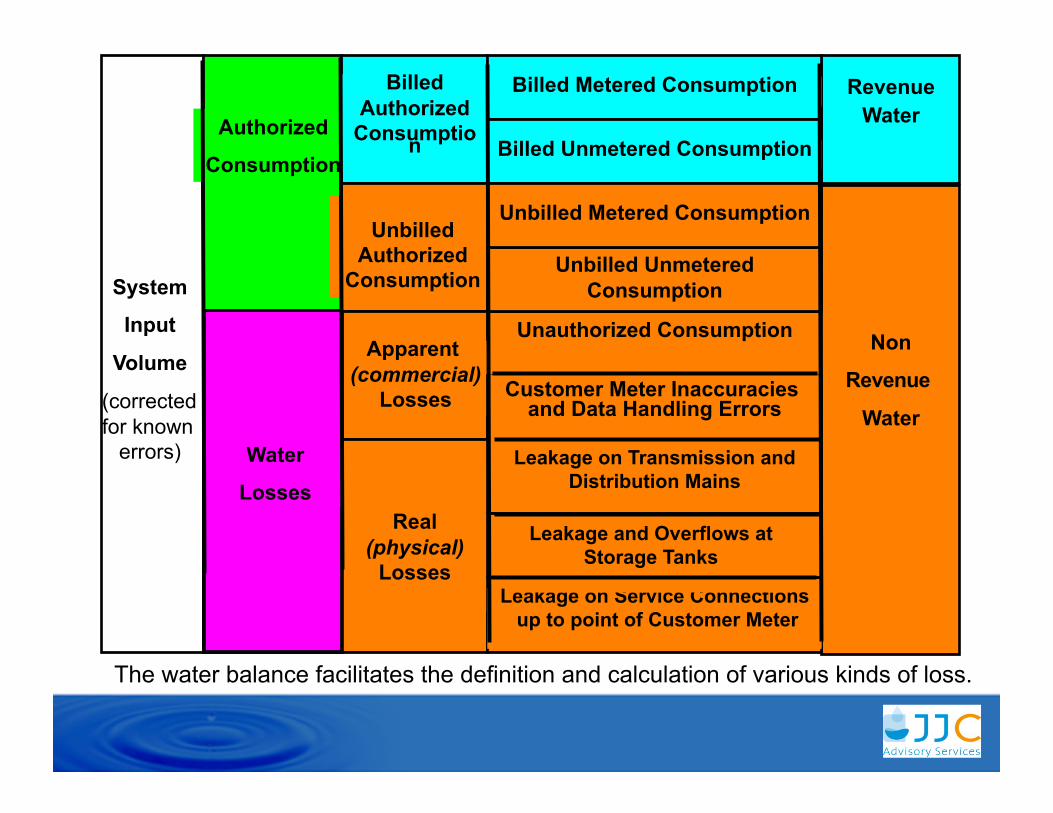
Unauthorized Consumption Non
Revenue
Water
Leakage on Transmission and Distribution Mains
System
Input
Volume
(corrected for known
errors)
Authorized
Consumption
Revenue Water
Billed Authorized
Consumption
Unbilled Authorized
Consumption
Apparent (commercial)
Losses
Real (physical)
Losses
Water
Losses
Billed Metered Consumption
Unbilled Unmetered Consumption
Customer Meter Inaccuracies and Data Handling Errors
Billed Unmetered Consumption
Leakage on Service Connections up to point of Customer Meter
Unbilled Metered Consumption
Leakage and Overflows at Storage Tanks
Unaccountedfor Water
Water
Losses
The water balance facilitates the definition and calculation of various kinds of loss.
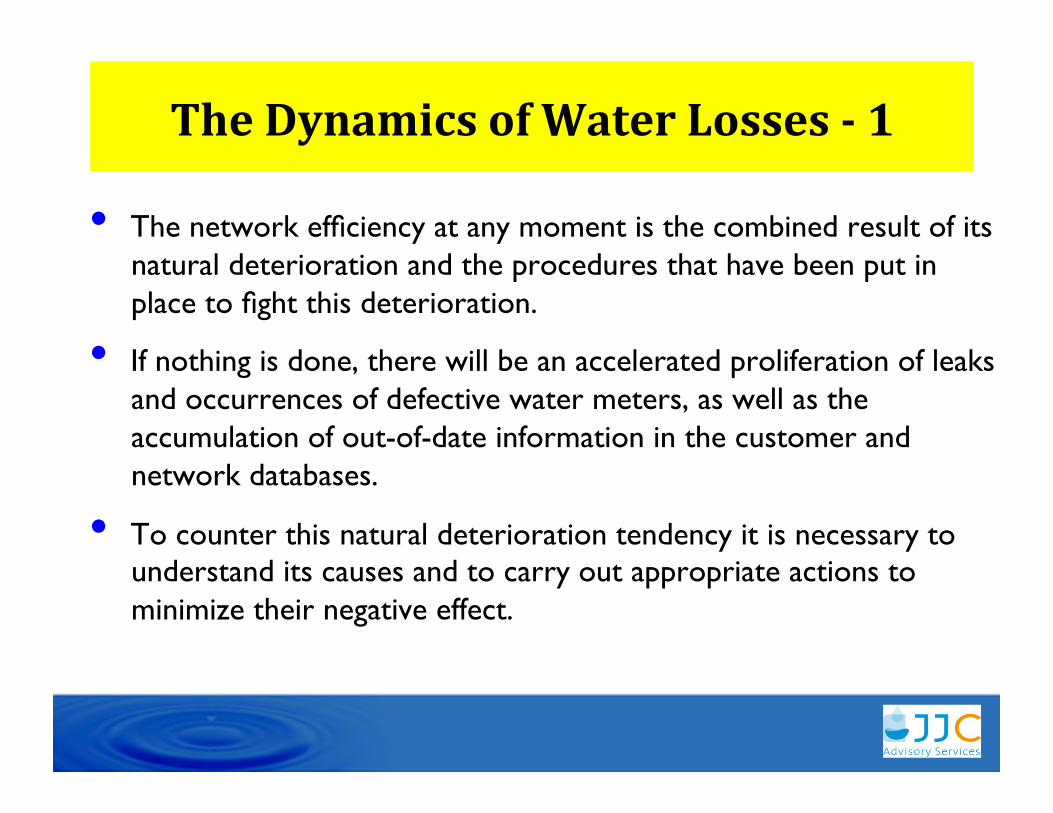
The Dynamics of Water Losses - 1
• The network efficiency at any moment is the combined result of its natural deterioration and the procedures that have been put in place to fight this deterioration.
• If nothing is done, there will be an accelerated proliferation of leaks and occurrences of defective water meters, as well as the accumulation of out-of-date information in the customer and network databases.
• To counter this natural deterioration tendency it is necessary to understand its causes and to carry out appropriate actions to minimize their negative effect.
Physical Losses
Commercial Losses
Adapted from M. Vermersch (2008)
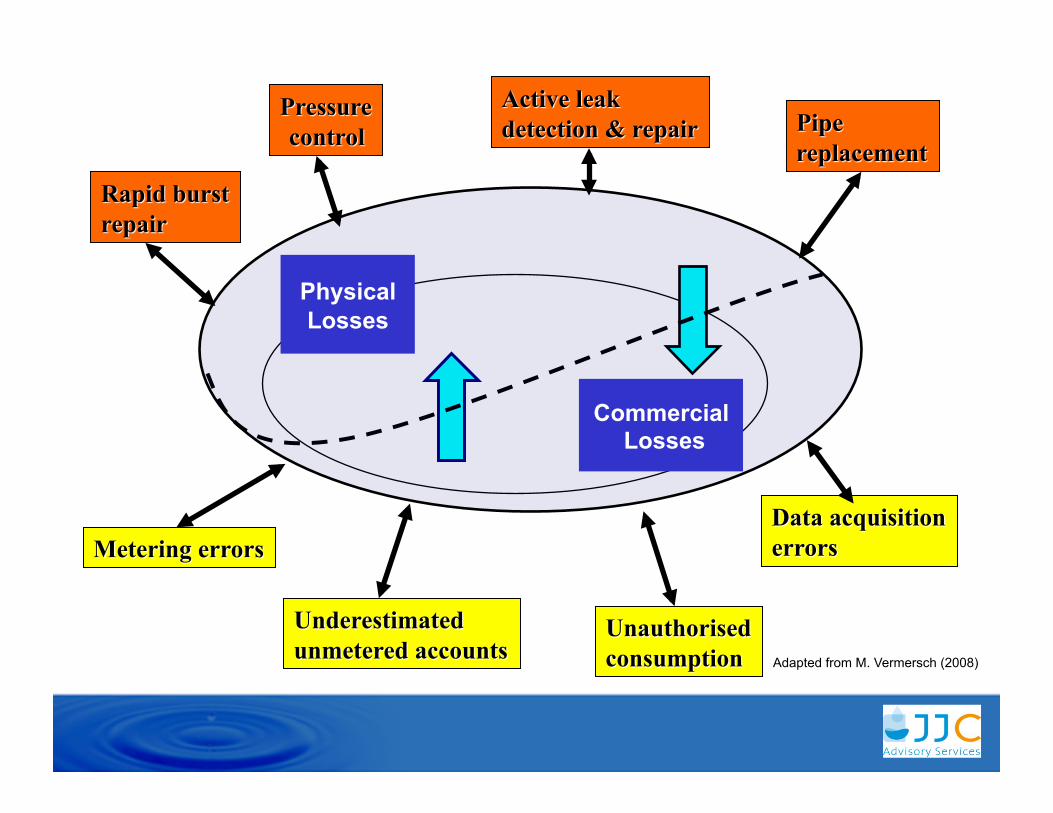
The Dynamics of Water Losses - 2
• The migratory nature of errors associated with the establishment of a water balance is such that errors in the measurement of water volumes can be incorrectly interpreted as physical (real) losses, which in turn results in failure to achieve NRW targets when implementing a NRW reduction strategy.
• Many practitioners make the common mistake by assuming that each time a leak is repaired, physical loss is reduced by the volume saved, and that, each time an illegal connection is regularized, the commercial loss will decrease by the associated consumption.
Reducing Commercial Losses
Commercial losses come from various (unrelated) sources. There are wide discrepancies in commercial losses among utilities and there does not exist a typical ratio for commercial vs. physical. There is no “economical level” of commercial losses: maximum tolerance is < 2% …
Commercial losses, sometimes called ‘apparent losses’, include water that is consumed but not paid for by the user.
Putting in place an adequate metering policy is a priority goal of an effective NRW reduction strategy. It is a pre-requisite for demand management and the only way to provide incentives to customers to reduce physical losses beyond utility network (after meter, internal plumbing).
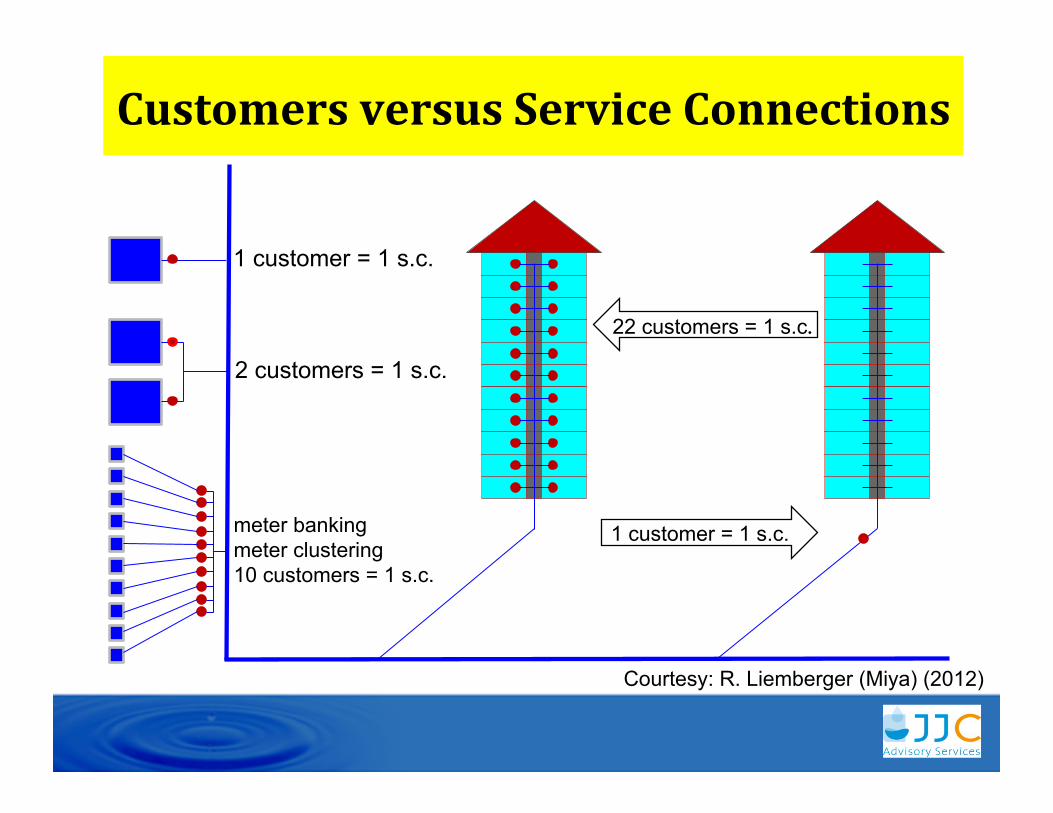
Customers versus Service Connections
1 customer = 1 s.c.
2 customers = 1 s.c.
meter banking meter clustering 10 customers = 1 s.c.
1 customer = 1 s.c.
22 customers = 1 s.c.
Courtesy: R. Liemberger (Miya) (2012)
Asset Management and NRW - 1
NRW is a critical and integral part of asset management. One of the root causes of high physical NRW levels is failing asset management of the distribution network.
An effective NRW reduction strategy implies finding the optimal mix of decision variables within given boundary conditions, including: repair vs. replace prioritization in time and space selection of pipe material pressure management.
This requires to piece solutions together by comparing alternatives and analyzing tradeoffs, by optimizing spending decisions.
Investments for reducing physical losses are significant, in particular at the outset, after which the investments required reduce to a level to maintain the gains of efficiency.
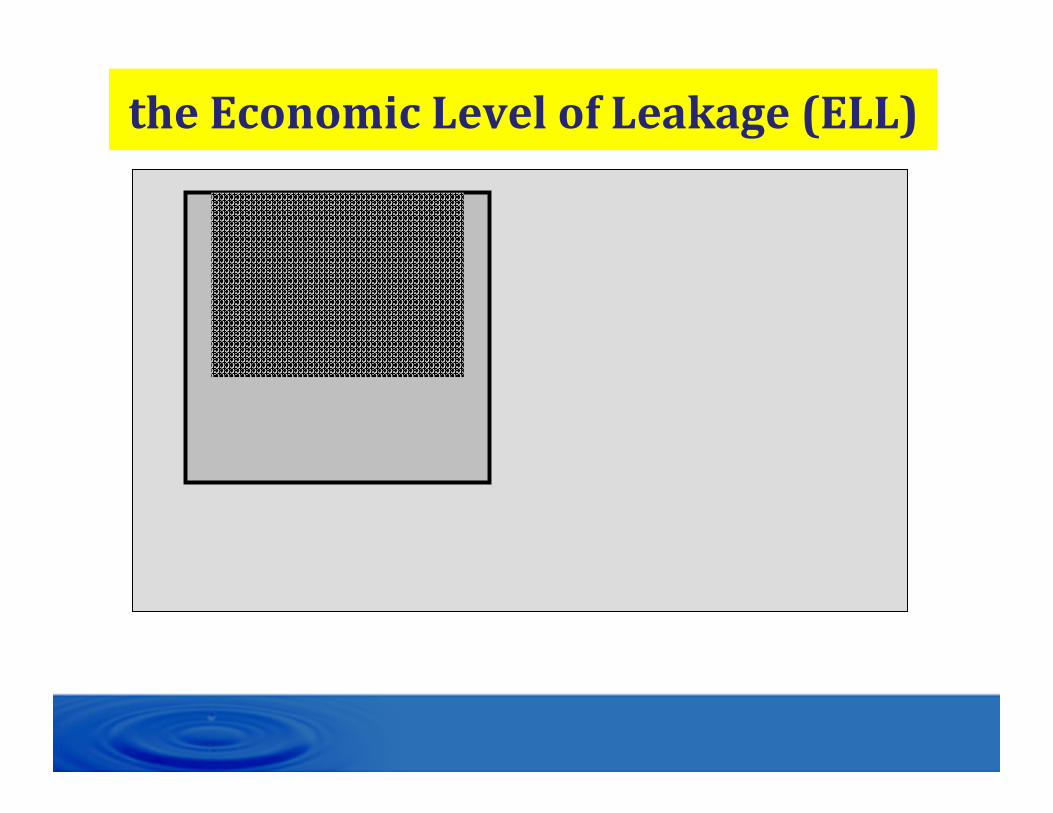
the Economic Level of Leakage (ELL)
Current Annual Volume of Real Losses
Economic Level of Leakage
Economically Recoverable Real Losses
Source: Roland Liemberger, 2002
Asset Management and NRW – 2
There is a level of leakage below which it is not cost effective to make further investments, or to use additional resources to drive leakage down further. The economic level of managing a network may however be different from the economic level of leakage (ELL)
The ELL may alter in periods of water shortage (drought) vis-à-vis periods of water abundance.
Management planning will change and move from reduction of leakage, highest in terms of volume saving potential (in time of scarcity), towards reduction of leakage, highest in terms of potential financial benefit from the zones with a higher unit cost of water.
The ELL is a useful indicator for optimization of leakage reduction. However, it will change according to the type of action implemented, the methods used, the operational conditions (network pressure) and the water tariff.
Any improvement of the commercial losses does not affect the ELL. The economic level of managing a network may hence be different from the economic leakage level
Asset Management and NRW – 3
Reducing pressures lowers consumption, in times of drought or scarcity. This does indeed give further water savings beyond the ELL, and the benefits are for ensuring that scarce supplies of water serve the community for a longer period, and hence is a distribution management strategy (but intermittent supply is not an option …!).
Pressure control (rather than pressure reduction) therefore provides a multiple list of both financial and water saving benefits, that can be invoked and intensified according to the supply control and/ or water loss control needs.
Installing pressure control rather than simply a pressure reduction scheme, creates a capability for dealing with drought issues whilst the utility is in the design stage of water loss projects. If a comprehensive analysis of return on investments includes drought benefits, environmental benefits and asset life extension, then the pay back period is considerably shorter, and provides the utility managers with options during times of water scarcity that other managers do not have.
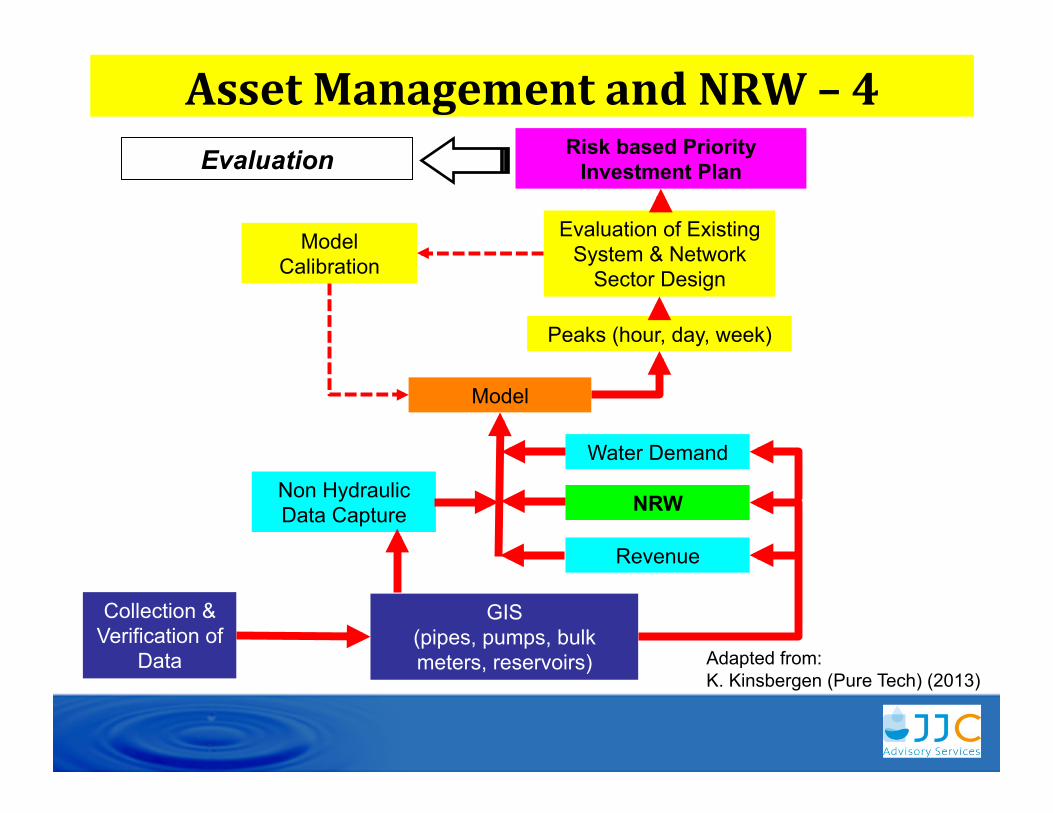
Collection & Verification of
Data
GIS (pipes, pumps, bulk meters, reservoirs)
Non Hydraulic Data Capture
Water Demand
NRW
Revenue
Model
Model Calibration
Evaluation of Existing System & Network
Sector Design
Peaks (hour, day, week)
Risk based Priority Investment Plan Evaluation
Asset Management and NRW – 4
Adapted from: K. Kinsbergen (Pure Tech) (2013)
Benchmarking for NRW – 1 Choosing the right indicator
The purpose of an indicator is to (i) help determine whether a given utility is performing well or badly, relative to others, and, (ii) provide guidance on setting a target level for performance improvement. In this, due consideration must be given to the specific circumstances of a given utility.
Selecting the appropriate performance indicator is key. The indicator must be easily measurable. Performance targets have to be realistic, but both challenging and achievable.
Targets for physical loss reduction shall either be expressed in volumetric terms (m3/d, m3/yr), or using traditional leakage performance indicators (such as liters/connection/day, or liters/length of network/day). Targets for commercial loss reduction might either be volumetric or expressed as additional revenue generated.
The standard “Percent Input Volume indicator”, or alternatively “Percent network efficiency”, is still widely utilized. It has the big advantage that it is easily understood in a policy dialogue. But it can be misleading because utilities with high levels of consumption or small networks can appear to be outperforming utilities with lower levels of consumption and extensive networks.
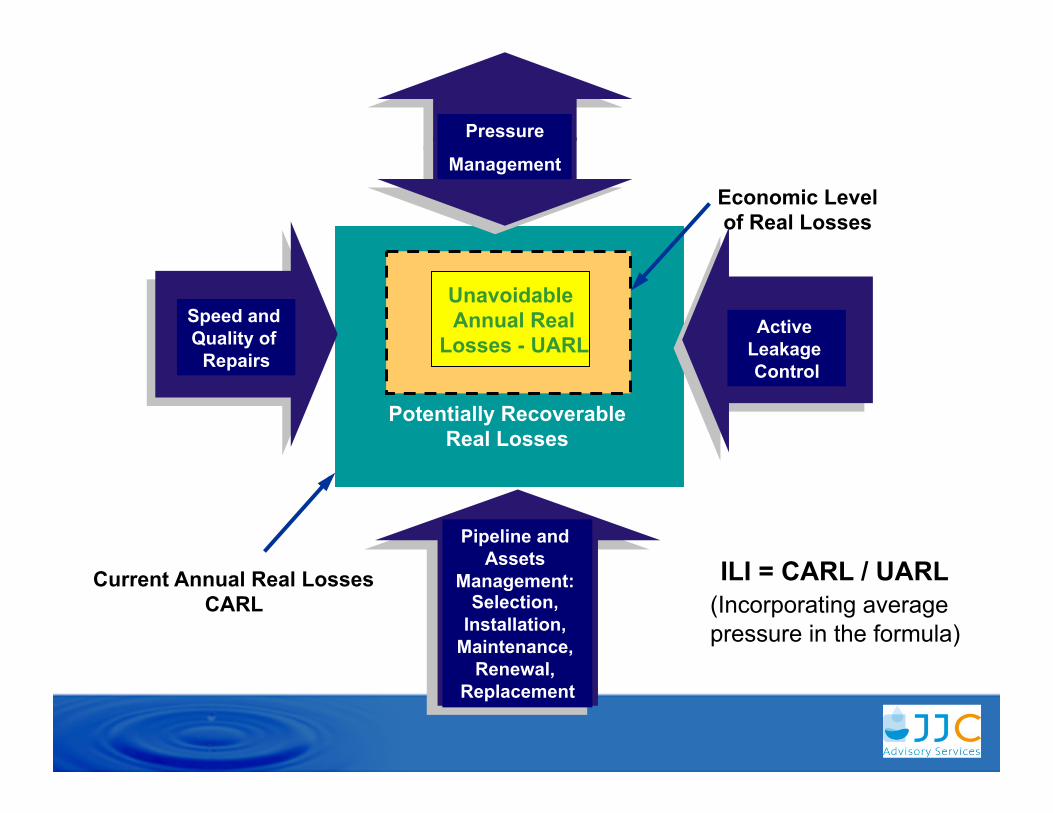
Current Annual Real Losses CARL
Potentially Recoverable Real Losses
Economic Level of Real Losses
Pressure
Management
Speed and Quality of
Repairs
Active Leakage Control
Pipeline and Assets
Management: Selection,
Installation, Maintenance,
Renewal, Replacement
Unavoidable Annual Real
Losses - UARL
ILI = CARL / UARL (Incorporating average pressure in the formula)
Benchmarking for NRW – 2 Choosing the right indicator
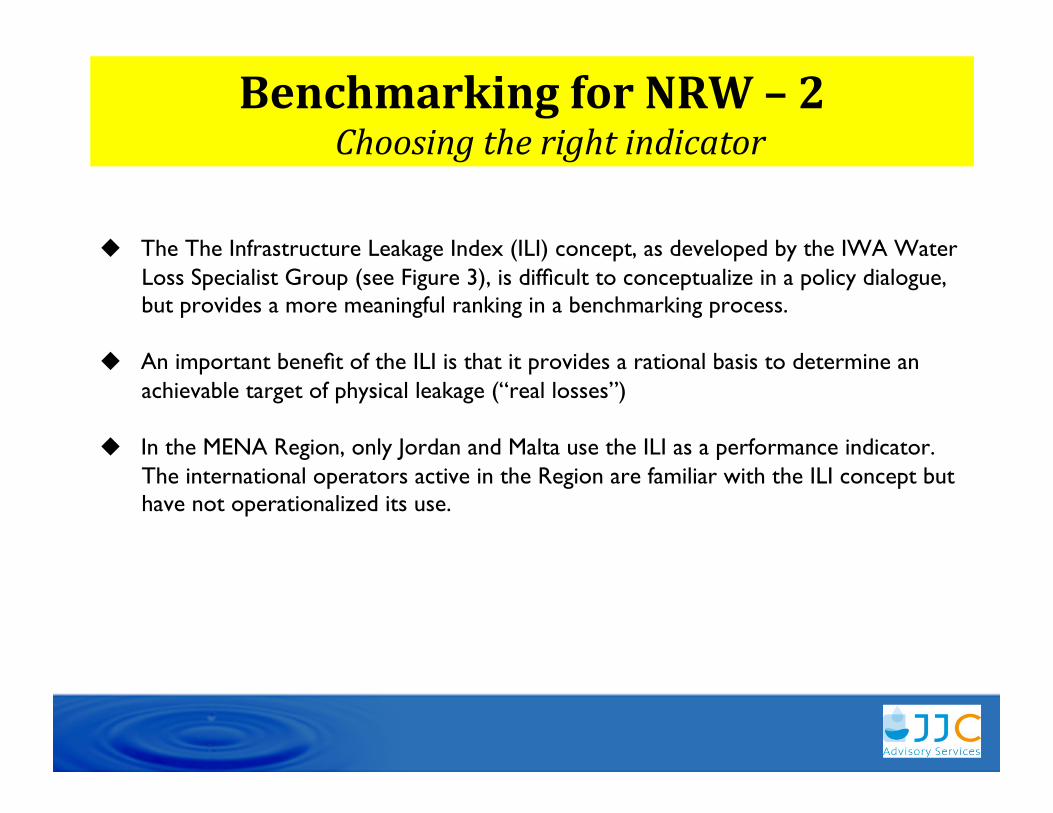
The The Infrastructure Leakage Index (ILI) concept, as developed by the IWA Water Loss Specialist Group (see Figure 3), is difficult to conceptualize in a policy dialogue, but provides a more meaningful ranking in a benchmarking process.
An important benefit of the ILI is that it provides a rational basis to determine an achievable target of physical leakage (“real losses”)
In the MENA Region, only Jordan and Malta use the ILI as a performance indicator. The international operators active in the Region are familiar with the ILI concept but have not operationalized its use.
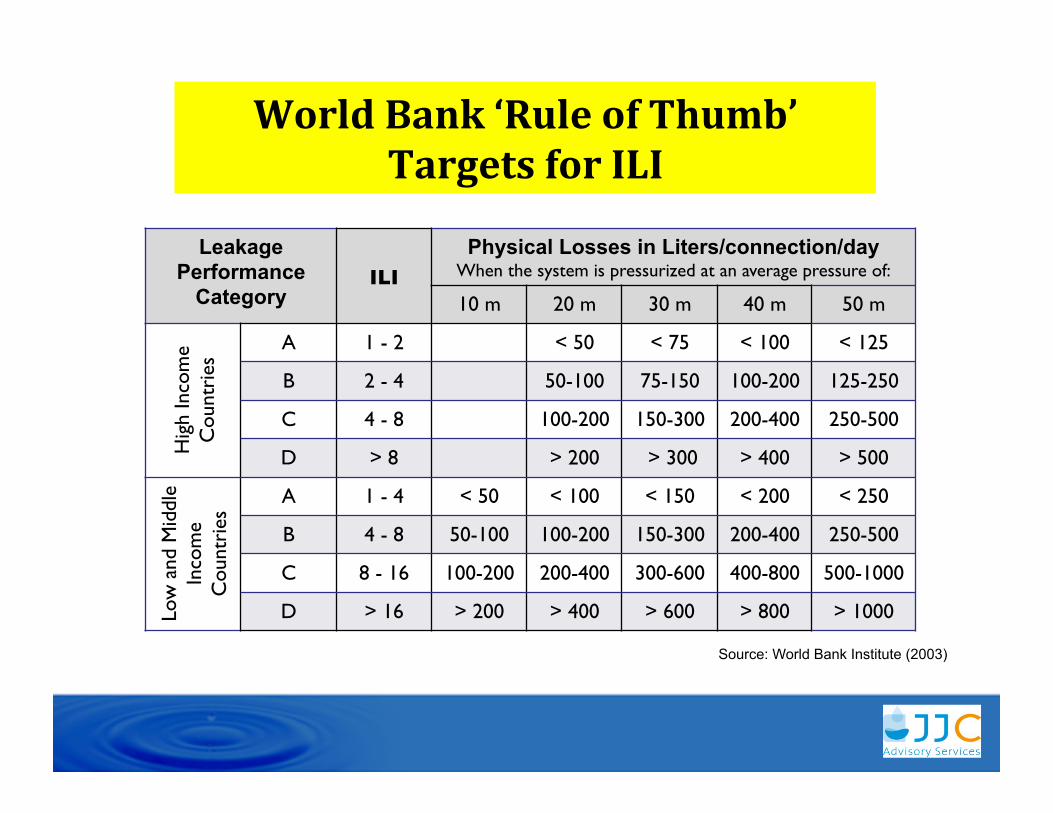
World Bank ‘Rule of Thumb’ Targets for ILI
Source: World Bank Institute (2003)
Leakage Performance
Category ILI
Physical Losses in Liters/connection/day When the system is pressurized at an average pressure of:
10 m 20 m 30 m 40 m 50 m
Hig
h In
com
e C
ount
ries A 1 - 2 < 50 < 75 < 100 < 125
B 2 - 4 50-100 75-150 100-200 125-250
C 4 - 8 100-200 150-300 200-400 250-500
D > 8 > 200 > 300 > 400 > 500
Low
and
Mid
dle
Inco
me
Cou
ntri
es A 1 - 4 < 50 < 100 < 150 < 200 < 250
B 4 - 8 50-100 100-200 150-300 200-400 250-500
C 8 - 16 100-200 200-400 300-600 400-800 500-1000
D > 16 > 200 > 400 > 600 > 800 > 1000
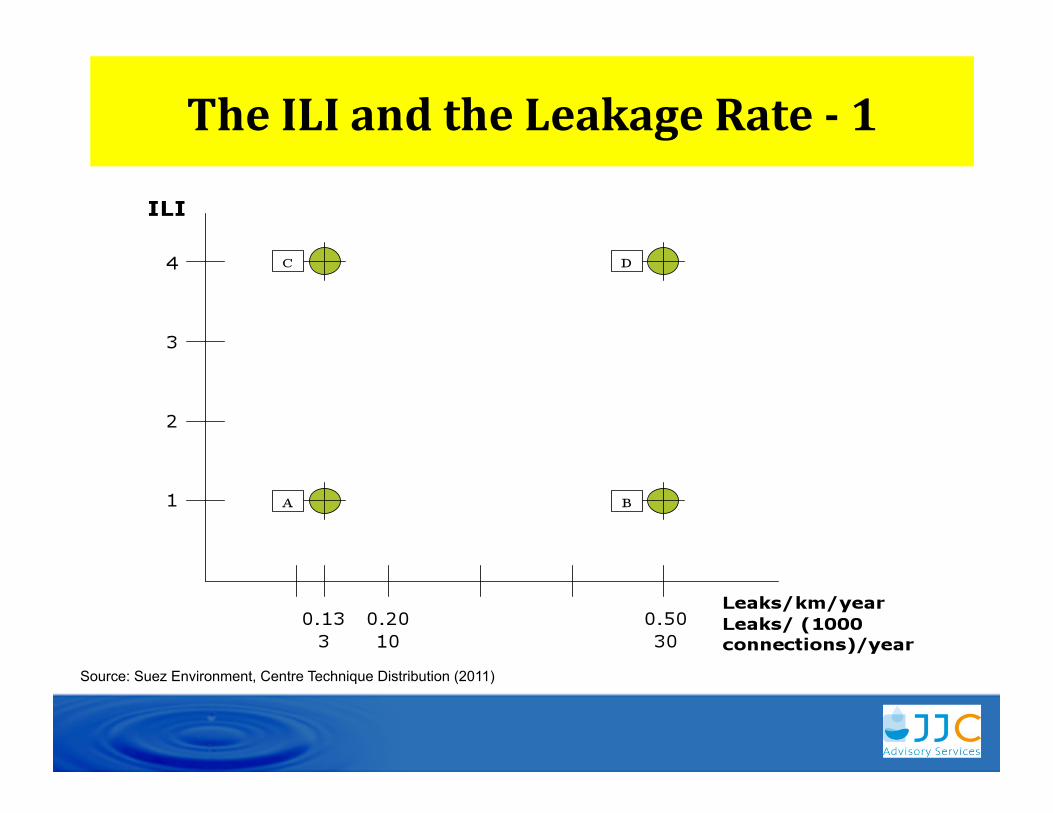
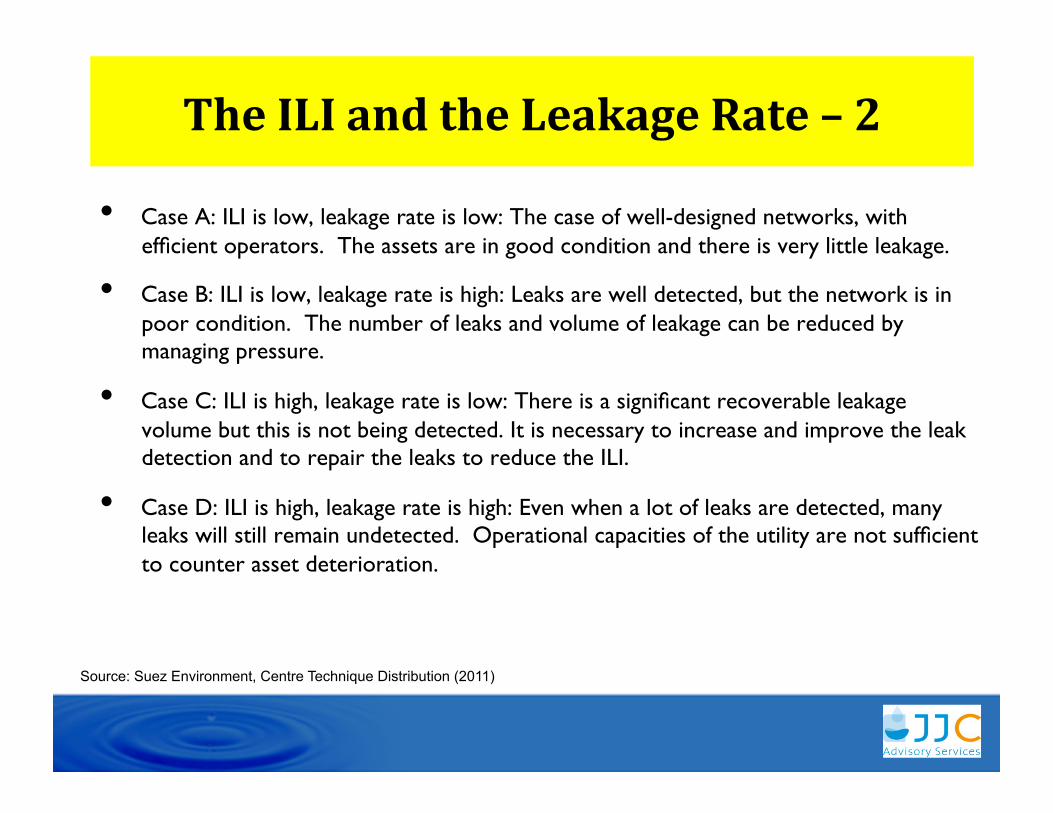
The ILI and the Leakage Rate - 1
Source: Suez Environment, Centre Technique Distribution (2011)
The ILI and the Leakage Rate – 2
• Case A: ILI is low, leakage rate is low: The case of well-designed networks, with efficient operators. The assets are in good condition and there is very little leakage.
• Case B: ILI is low, leakage rate is high: Leaks are well detected, but the network is in poor condition. The number of leaks and volume of leakage can be reduced by managing pressure.
• Case C: ILI is high, leakage rate is low: There is a significant recoverable leakage volume but this is not being detected. It is necessary to increase and improve the leak detection and to repair the leaks to reduce the ILI.
• Case D: ILI is high, leakage rate is high: Even when a lot of leaks are detected, many leaks will still remain undetected. Operational capacities of the utility are not sufficient to counter asset deterioration.
Source: Suez Environment, Centre Technique Distribution (2011)
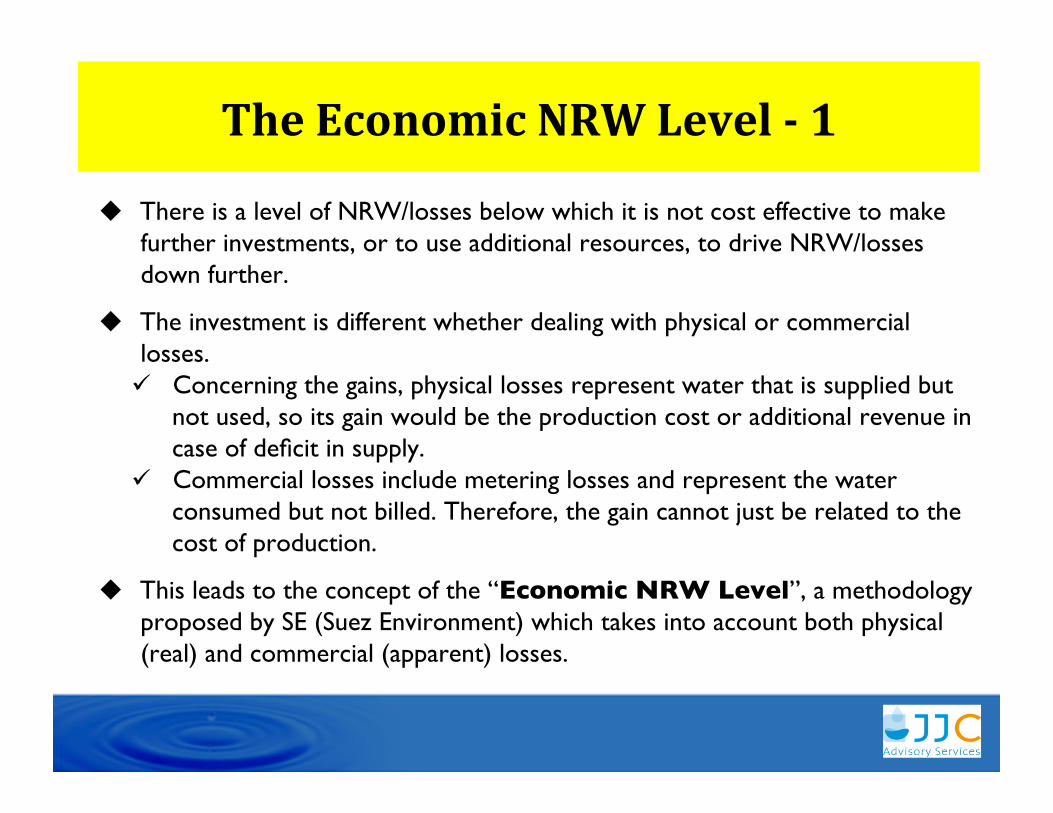
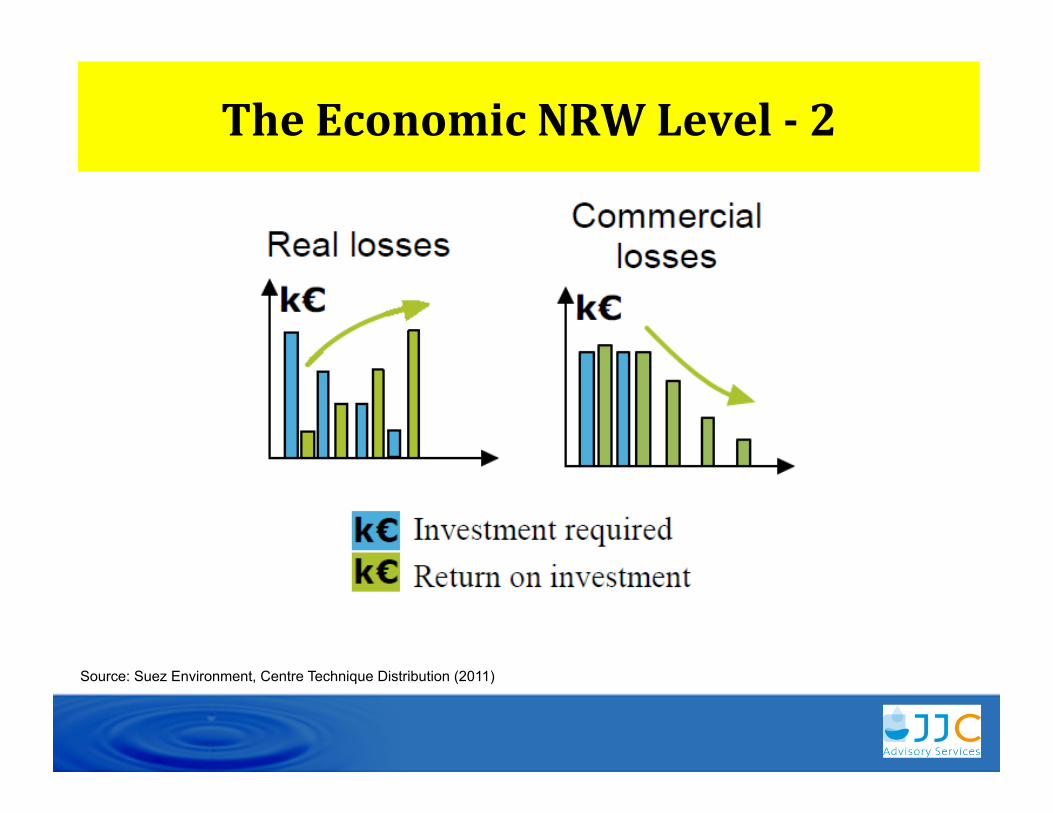
The Economic NRW Level - 1
There is a level of NRW/losses below which it is not cost effective to make further investments, or to use additional resources, to drive NRW/losses down further.
The investment is different whether dealing with physical or commercial losses. Concerning the gains, physical losses represent water that is supplied but
not used, so its gain would be the production cost or additional revenue in case of deficit in supply.
Commercial losses include metering losses and represent the water consumed but not billed. Therefore, the gain cannot just be related to the cost of production.
This leads to the concept of the “Economic NRW Level”, a methodology proposed by SE (Suez Environment) which takes into account both physical (real) and commercial (apparent) losses.
The Economic NRW Level - 2
Source: Suez Environment, Centre Technique Distribution (2011)
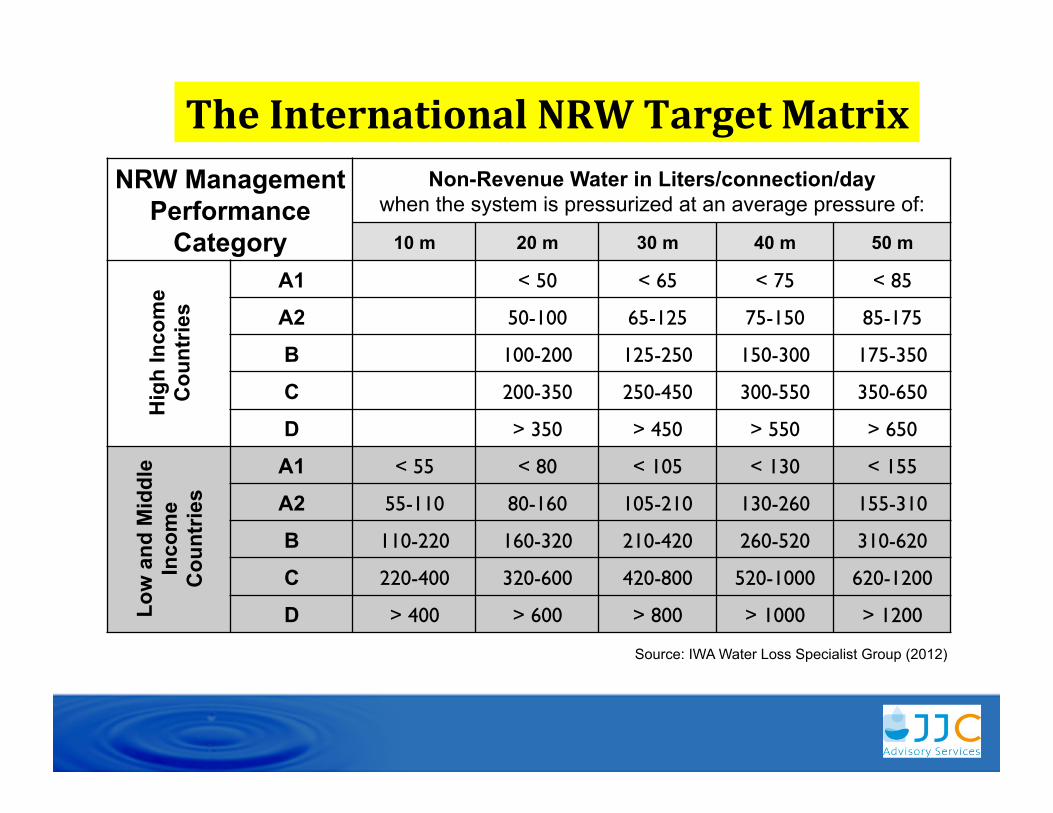
The International NRW Target Matrix
Source: IWA Water Loss Specialist Group (2012)
NRW Management Performance
Category
Non-Revenue Water in Liters/connection/day when the system is pressurized at an average pressure of:
10 m 20 m 30 m 40 m 50 m
Hig
h In
com
e C
ount
ries
A1 < 50 < 65 < 75 < 85
A2 50-100 65-125 75-150 85-175
B 100-200 125-250 150-300 175-350
C 200-350 250-450 300-550 350-650
D > 350 > 450 > 550 > 650
Low
and
Mid
dle
Inco
me
Cou
ntrie
s
A1 < 55 < 80 < 105 < 130 < 155
A2 55-110 80-160 105-210 130-260 155-310
B 110-220 160-320 210-420 260-520 310-620
C 220-400 320-600 420-800 520-1000 620-1200
D > 400 > 600 > 800 > 1000 > 1200
NRW Reduction, Management Models - 1
NRW provides a snapshot of a utility’s overall performance since low levels of NRW require an integrated management approach, combining elements of network maintenance, commercial practices, asset management, financial management and demand management.
NRW captures key elements of operational/financial efficiency and sustainability (service continuity, water quality, demand management, capacity augmentation, financial flows).
A utility with increasing NRW is a utility out of control … (e.g. poor management, lack of support from governing authorities, …)
NRW Reduction, Management Models - 2 Performance-based service contracts (PBC), helpful in situations
where capacity and finance gaps make in-house reductions difficult complete outsourcing of operations functions is not desirable or possible
But, short-term NRW reduction interventions need to be integrated within a vision, a strategy, and an action plan for phased implementation of long-term asset management.
Challenges with short-term (three to four year) performance-based NRW contracts: to have a validated base-line information which is a precondition
for an effective incentive structure with realistic time-bound performance targets
how to make gains of efficiency sustainable?
Recent experiences show a tendency to move away from short-term contracts (cf. Algeria (5.5+5 yrs), the Bahamas (5+5 yrs))
The Way Forward - 1
1. The conventional perspective addresses potable water, wastewater and storm water systems independently, failing to capitalize on the synergies existing between the systems.
2. Contextualizing NRW within an integrated urban water management (IUWM) framework results in NRW being viewed as a potential water source, encouraging water providers to consider an NRW management strategy as part of a wider portfolio of potential water sources.
The Way Forward - 2
3. A sustainable NRW management strategy needs to include the following key elements An estimate of realistic performance targets for NRW over the duration
of a PBC, including a time-bound NRW curve from base-line value to target value; (taking into account an eventual transition from intermittent supply to pressurized continuous supply).
Given the dynamics of water losses, a sustainable NRW management strategy needs to include combined action on physical an commercial losses
An assessment of (i) the network rehabilitation investment needs to make this possible, including a sensitivity analysis; and, (ii) the network renewal rate needed to maintain the targeted NRW performance.
An assessment of the realistic share of rehabilitation and renewal investments in the distribution network, to be recovered by the water tariff.
The Way Forward - 3
With regard to applied research and development in the domain of NRW, the emerging main focus areas include the following two important subjects:
Designing ‘smart’ networks for efficient operation: (i) Smart by design, incremental and adaptive design (to have networks that minimize leaks), (ii) Smart by control (leak indicators built into new networks), (iii) Smart by use of water - incorporating all resource streams in an Integrated urban systems .
Achieving optimized NRW conditions in networks: the system should inform of faults in a way that creates a speedy response, in more aggressively sensored -, and more small clustered networks.
Thank you


![The Challenge of Reducing Non-Revenue Water (NRW) in ... · water billed to consumers (also called “non-revenue water” [NRW]). High levels of NRW reflect huge volumes of water](https://static.fdocuments.in/doc/165x107/6052f3d9bc73d139b9240277/the-challenge-of-reducing-non-revenue-water-nrw-in-water-billed-to-consumers.jpg)