NON NATIVE ENGLISH SPEAKING TEACHERS' SELF ...NON NATIVE ENGLISH SPEAKING TEACHERS' SELF PERCEPTIONS...
104
Transcript of NON NATIVE ENGLISH SPEAKING TEACHERS' SELF ...NON NATIVE ENGLISH SPEAKING TEACHERS' SELF PERCEPTIONS...

NON NATIVE ENGLISH SPEAKING TEACHERS' SELF PERCEPTIONS OF THEIR PRONUNCIATION AND PRONUNCIATION TEACHING PRACTICES
The Graduate School of Education
of
Bilkent University
by
Nihal Yapıcı Sarıkaya
In Partial Fulfillment of the Requirements for the Degree of
Master of Arts
in
The Program of
Teaching English as a Foreign Language
Bilkent University
Ankara
May 2013

Dedicated to My Beloved Husband,
Alper Utku Sarıkaya
BİLKENT UNIVERSITY
THE GRADUATE SCHOOL OF EDUCATION
MA THESIS EXAMINATION RESULT FORM
May 24, 2013
The examining committee appointed by The Graduate School of Education
for the thesis examination of the MA TEFL student
Nihal Yapıcı Sarıkaya
has read the thesis of the student.
The committee has decided that the thesis of the student is satisfactory.
Thesis Title: Non Native English Speaking Teachers' Self
Perceptions of Their Pronunciation and
Pronunciation Teaching Practices
Thesis Advisor: Dr. Deniz Ortaçtepe
Bilkent University, MA TEFL Program
Committee Members: Asst. Prof. Dr. Julie Mathews-Aydınlı
Bilkent University, MA TEFL Program
Asst. Prof. Dr. Enisa Mede
Yeditepe University, Faculty of Education
iv
ABSTRACT
NON NATIVE ENGLISH SPEAKING TEACHERS' SELF PERCEPTIONS OF
THEIR PRONUNCIATION AND PRONUNCIATION TEACHING PRACTICES
Nihal Yapıcı Sarıkaya
M.A., Department of Teaching English as a Foreign Language
Supervisor: Dr. Deniz Ortaçtepe
May 24, 2013
Native English speaking teachers (NESTs) and non-native English speaking
teachers (NNESTs) have been studied by many researchers in the literature in
regards to the similarities and differences between these two types of teachers, their
perceptions of teaching English, as well as their language proficiency levels (Al-
Omrani, 2008; Arva & Medgyes, 2000; Ezberci, 2005; Lipovsky & Mahboob, 2007;
Merino, 1997; Shen & Wu, 2007; Tajino & Tajino, 2000). Yet, there is still a lack of
in-depth studies that solely focus on NNESTs' teaching of a specific skill and their
v
perceptions of their own language skills and the relationship between these two
aspects.
In this respect, the present study with 140 Turkish NNESTs aimed to examine
self perceptions of NNESTs about their pronunciation skills, their pronunciation
teaching practices and the relationship between their self perceptions of their English
pronunciation and their pronunciation teaching practices. The self perceptions and
pronunciation teaching practices of the NNESTs were also examined in regards to
the following factors; 1) Teaching Experience, 2) Degree of Education, 3) Taking
Phonology Classes, 4) Having a Native English Speaking Teacher, and 5) Time
Spent in English Speaking Countries. The data were collected through a five-point
Likert-scale questionnaire and analyzed quantitatively by means of statistical
measures.
The results revealed that having a native English speaking instructor, taking
phonology classes and spending time in English speaking countries are the factors
that affect NNESTs' perceptions and their teaching practices. While having a native
English speaking teacher and spending time in English speaking countries are the
factors that led the NNESTs rate their own pronunciation skills low, in terms of
classroom practices, the most influential factor is taking phonology classes which
positively affects the pronunciation teaching occurrence in their classes. The study
also revealed that there is no significant relationship between the self perceptions of
NNESTs and pronunciation teaching practices.

vi
Concerning the results above, this study implied that NNESTs a) should not
be underestimated about their pronunciation teaching; b) should be encouraged to
take phonology classes as part of their professional development.
Key words: NNESTs, pronunciation teaching, self perception, phonology.
vii
ÖZET
ANADİLİ İNGİLİZCE OLMAYAN İNGİLİZCE ÖĞRETMENLERİNİN KENDİ
TELAFFUZLARINI ALGILARI VE TELAFFUZ ÖĞRETİMLERİ
Nihal Yapıcı Sarıkaya
Yüksek Lisans, Yabancı Dil Olarak İngilizce Öğretimi Bölümü
Tez Yöneticisi: Dr. Deniz Ortaçtepe
24 Mayıs 2013
Ana dili İngilizce olan İngilizce öğretmenleri (NEST) ve ana dili İngilizce
olmayan İngilizce öğretmenleri (NNEST) birçok araştırmacı tarafından bu iki
öğretmen grubunun benzerlikleri ve farklılıkları, İngilizce öğretimi algıları, ve dil
yeterlilikleri açısından incelenmiştir (Al-Omrani, 2008; Arva & Medgyes, 2000;
Ezberci, 2005; Lipovsky & Mahboob, 2007; Merino, 1997; Shen & Wu, 2007;
Tajino & Tajino, 2000). Ancak, literatürde hala sadece ana dili İngilizce olmayan
İngilizce öğretmenlerinin belirli bir dil becerisini öğretmesini ve bu dil becerisindeki
viii
öz algılarını, ve bu iki faktörün arasındaki ilişkiyi inceleyen çalışmalar az sayıda
bulunmaktadır.
Bu bağlamda, 140 Türk İngilizce öğretmeni ile gerçekleştirilmiş olan bu
çalışma, ana dili İngilizce olmayan İngilizce öğretmenlerinin telaffuz becerileri ile
ilgili öz algılarını, telaffuz öğretimlerini ve bu öğretmenlerin öz algıları ile
öğretimleri arasındaki ilişkiyi araştırmayı amaçlamaktadır. Aynı zamanda, bu
öğretmenlerin öz algıları ve öğretimlerinin aşağıdaki faktörler ile ilişkileri de
incelenmiştir; 1) Öğretmenlik Deneyimi, 2) Eğitim Düzeyi, 3) Sesbilim dersi eğitimi,
4) Anadili İngilizce olan İngilizce Öğretmeninden eğitim almış olması 5) Ana dili
İngilizce olan ülkelerde bulunma süresi. Veriler 5 dereceli Likert ölçekli anket
aracılığıyla toplanmış ve istatiksel ölçümler yolu ile niteliksel olarak çözümlenmiştir.
Çalışmanın nitel bulguları, ana dili İngilizce olan bir İngilizce öğretmeni
tarafından eğitim görmek, ana dili İngilizce olan ülkelerde geçirilen süre ve sesbilim
eğitimi alma faktörlerinin ana dili İngilizce olmayan İngilizce öğretmenlerinin öz
algılarında ve öğretimlerinde etkileri olduğunu ortaya koymaktadır. Anadili İngilizce
olan İngilizce öğretmeninden eğitim almak ve İngilizce konuşulan ülkelerde
bulunmuş olmanın katılımcıların kendi telaffuz becerilerini düşük olarak
değerlendirmelerine yol açarken, sınıf uygulamaları bağlamında en önemli faktörün
ses bilim dersi almak olduğu ve bu dersleri alan öğretmenlerin derslerinde telaffuz
öğretimine, ses bilim dersi almayan öğretmenlere kıyasla daha fazla yer verdikleri
sonucu ortaya çıkmıştır. Çalışma aynı zamanda, ana dili İngilizce olmayan İngilizce
öğretmenlerinin öz algıları ile telaffuz öğretimleri arasında istatiksel olarak anlamlı
bir ilişki olmadığını kanıtlar niteliktedir.
ix
Yukarıdaki sonuçlar doğrusltusunda, bu çalışma ana dili İngilizce olmayan
İngilizce öğretmenlerinin a) telaffuz eğitimi konusunda azımsanmamalarının, b)
profesyonel gelişimlerinin bir parçası olarak ses bilim dersleri almaları konusunda
teşvik edilmelerinin gerekliliğini vurgulamaktadır.
Anahtar kelimeler: Ana dili İngilizce olmayan İngilizce öğretmenleri (NNESTs),
telaffuz eğitimi, öz algı, ses bilim.
x
ACKNOWLEDGEMENTS
It would not have been possible to write this thesis without the help and
support of the kind people around me.
I would like to express my deepest appreciation to my supervisor, Dr. Deniz
Oratçtepe, for her guidance, patience and encouragement. If it was not for her, this
thesis would not have been completed at all.
I would also like to thank my committee members, Asst. Prof. Dr. Julie
Mathews-Aydınlı and Asst. Prof. Dr. Enisa Mede, for their support and enlightening
feedback.
I owe much to Asst. Prof. Dr. Abdullah Ertaş, former director of Gazi
University School of Foreign Languages, for believing in me and giving me the
opportunity to take part in this program. He had been a great director and I will
always remember him as one of the greatest people I have ever met and had the
chance to work with.
I would like to express my deepest gratitude to Assoc. Prof. Dr. Mustafa
Sarıkaya, my father-in-law, for teaching me every single detail about data analysis.
Without his wisdom and constant support, everything about this thesis would have
been more difficult to handle.
I am indebted to Asst. Prof. Dr. Neslihan Özkan who has always been more
than an instructor for me. She not only encouraged, supported, and inspired me to go
on writing this thesis, but also was there for me no matter when and where. It is a
privilege to know her.
I also wish to thank my classmates at the MA TEFL program, Figen
İyidoğan, Ebru Gaganuş, Yıldız Albostan, Ayça Özçınar Durrant, and Elizabeth
xi
Pullen, for their invaluable friendship. They have always been at the end of the
phone to support me and help me with anything I needed. The days we spent together
throughout the year will be remembered as the most enjoyable ones.
I am grateful to my mother Süreyya Yapıcı and my father Mehmet Yapıcı
who have always been there for me from the very beginning of my life. They have
always believed in me and done everything for me to go on my education. Words are
not enough to express my gratitude for their sacrifices and love. I would also like to
thank my sister İclal Yapıcı Önal. She is the first and the most valuable friend I have
ever had. I will always appreciate her faith in me.
Above all, I would like to express my deepest gratitude to the love of my life,
my husband, Alper Utku Sarıkaya. He has been my most enthusiastic supporter
during this long and challenging journey. His existence in my life makes me feel
special and lucky every day, and I count myself fortunate for having such a great
soul mate.
xii
TABLE OF CONTENTS
Introduction ........................................................................................................1
Background of the Study .................................................................................... 2
Statement of the Problem ................................................................................... 5
Significance of the Study .................................................................................... 5
Research Questions ............................................................................................ 6
Conclusion .......................................................................................................... 7
Introduction . .......................................................................................................8
Students' Perceptions of NESTs and NNESTs ................................................... 8
Teachers' Perceptions of NESTs and NNESTs ................................................ 13
Students' and Teachers' Perceptions of NNESTs ............................................. 16
Pronunciation and NNESTs ............................................................................. 18
Conclusion ........................................................................................................ 24
Introduction . .....................................................................................................25
Setting and Participants .................................................................................... 26
Data Collection..................................................................................................26
ABSTRACT ........................................................................................................... iv
ÖZET ..................................................................................................................... vii
ACKNOWLEDGEMENTS .................................................................................... x
TABLE OF CONTENTS ...................................................................................... xii
LIST OF TABLES ................................................................................................ xv
CHAPTER I: INTRODUCTION ............................................................................ 1
CHAPTER II: LITERATURE REVIEW ................................................................ 8
CHAPTER III: METHODOLOGY ...................................................................... 25
xiii
The Construction of the Questionnaire....................................................26
The Pilot Study........................................................................................29
Data Analysis . ...................................................................................................30
Conclusion ........................................................................................................ 31
Introduction ...................................................................................................... 32
Findings ............................................................................................................ 33
Analysis of Research Question 1 ...................................................................... 33
Analyses of Research Questions 1.1 and 1.2 .................................................... 35
Teaching Experience ............................................................................... 35
Degree of Education ................................................................................ 38
Having a Native English Speaking Teacher ........................................... 40
Taking Phonology Classes ...................................................................... 43
Time Spent in English Speaking Countries ............................................ 45
Analysis of Research Question 2 ...................................................................... 48
Conclusion ........................................................................................................ 49
Introduction ...................................................................................................... 50
Findings and Discussion ................................................................................... 51
Pedagogical Implications of the Study ............................................................. 57
Limitations of the Study ................................................................................... 60
Suggestions for Further Research ..................................................................... 60
Conclusion ........................................................................................................ 61
CHAPTER IV: DATA ANALYSIS ..................................................................... 32
CHAPTER V: CONCLUSION .............................................................................50
xiv
APPENDIX 1: FOCUS GROUPS QUESTIONS ................................................. 70
APPENDIX 2: INDIVIDUAL INTERVIEW QUESTIONS ................................ 71
APPENDIX 3: QUESTIONNAIRE ...................................................................... 72
APPENDIX 4: SELF PERCEPTION SCALE ITEMS ......................................... 75
APPENDIX 5: PRONUNCIATION PRACTICE SCALE ITEMS ......................76
APPENDIX 6: NORMALITY TESTS RESULTS . ..............................................77
REFERENCES.......................................................................................................63
xv
LIST OF TABLES
Table
1. Results of the Descriptive Statistics on PPrS..........................................................33
2. Results of the Descriptive Statistics on SPS...........................................................34
3. Results of the Descriptive Statistics on PPrS and Teaching Experience ...............36
4. Results of One-Way ANOVA Related to PPrS and Teaching Experience ...........36
5. Results of the Descriptive Statistics Related to SPS and Teaching Experience.....37
6. Results of One-Way ANOVA Related to SPS and Teaching Experience ............. 37
7. Results of the Descriptive Statistics and the Independent Samples t-Test Related to
PPrS and Degree of Education………....................................................................39
8. Results of the Descriptive Statistics and the Independent Samples t-Test Related to
SPS and Degree of Education.................................................................................40
9. Results of the Descriptive Statistics and the Independent Samples t-Test Related to
PPrS and Having a Native English Speaking Teacher...........................................41
10. Results of the Descriptive Statistics and the Independent Samples t-Test Related
to SPS and Having a Native English Speaking Teacher .......................................42
11. Results of the Descriptive Statistics and the Independent Samples t-Test Related
to PPrS and Taking Phonology Classes..................................................................43
12. Results of the Descriptive Statistics and the Independent Samples t-Test Related
to SPS and Taking Phonology Classes...................................................................44
13. Results of the Descriptive Statistics and the Independent Samples t-Test Related
to PPrS and Time Spent in English Speaking Countries........................................46
14. Results of the Descriptive Statistics and the Independent Samples t-Test Related
to SPS and Time Spent in English Speaking Countries..........................................47

xvi
15. Results of the Pearson Correlation Analysis Related to Research Question 2.....48
1
CHAPTER I: INTRODUCTION
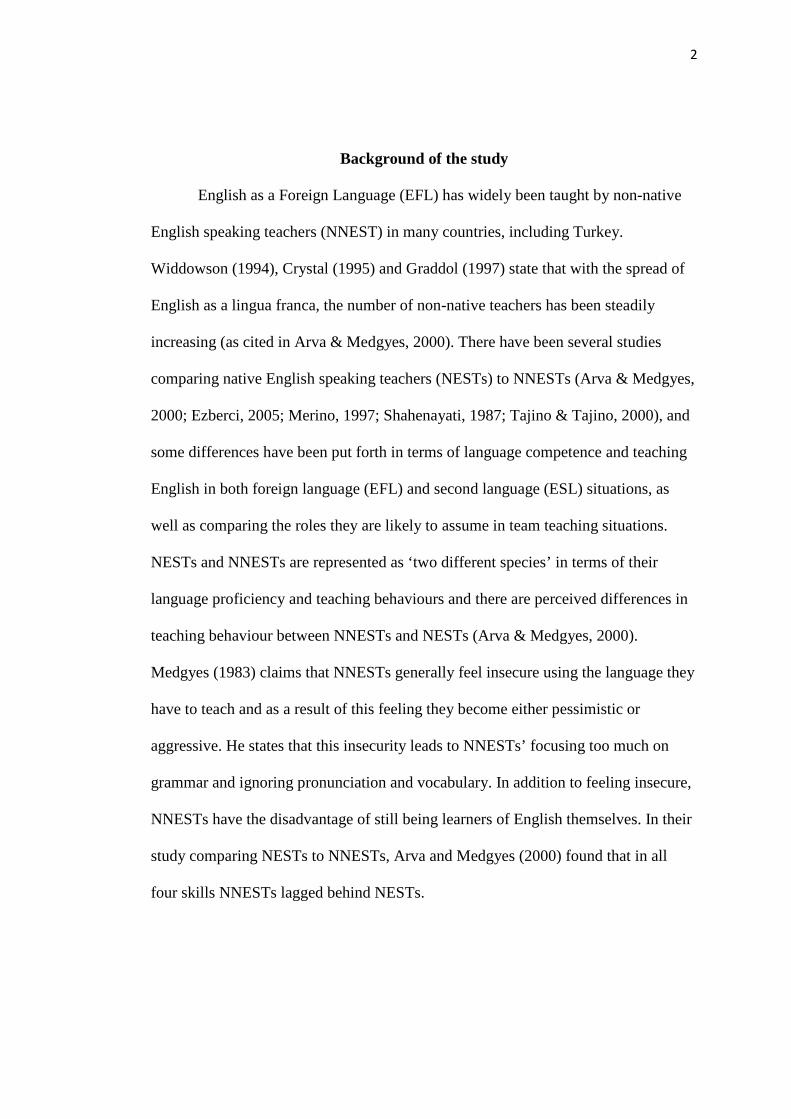
Introduction
In English language teaching contexts, a teacher whose L1 is English is called
a native English speaking teacher (NEST) and those whose L1 is not English are
called non-native English speaking teachers (NNESTs). “A native speaker of English
is traditionally defined as someone who speaks English as his or her native language,
also called mother tongue, first language, or L1” (Medgyes, 2001, p.430). These
teachers have been compared and studied by many researchers in the literature and
differences between these two types of teachers, as well as their similarities, their
perceptions of teaching English, and their language proficiency levels have been the
main focus of these studies. (Al-Omrani, 2008; Arva & Medgyes, 2000; Ezberci,
2005; Lipovsky & Mahboob, 2007; Merino, 1997; Shen & Wu, 2007; Shirvani
Shahenayatani, 1987; Tajino & Tajino, 2000).
As well as the comparison of these two types of teachers, there have also been
many studies which have focused on only NNESTs and various aspects of their
teaching experiences such as their self perceptions of proficiency and employability.
Yet, the literature on NNESTs still lacks in-depth studies on the teaching of specific
skills such as pronunciation, teachers’ perception of their own pronunciation skills
and the relationship between these two aspects. The aim of this study is to reveal a
picture of NNESTs’ styles of teaching pronunciation, their perceptions of their own
pronunciation skills, and the relationship between their perceptions and their reported
pronunciation teaching styles.
2
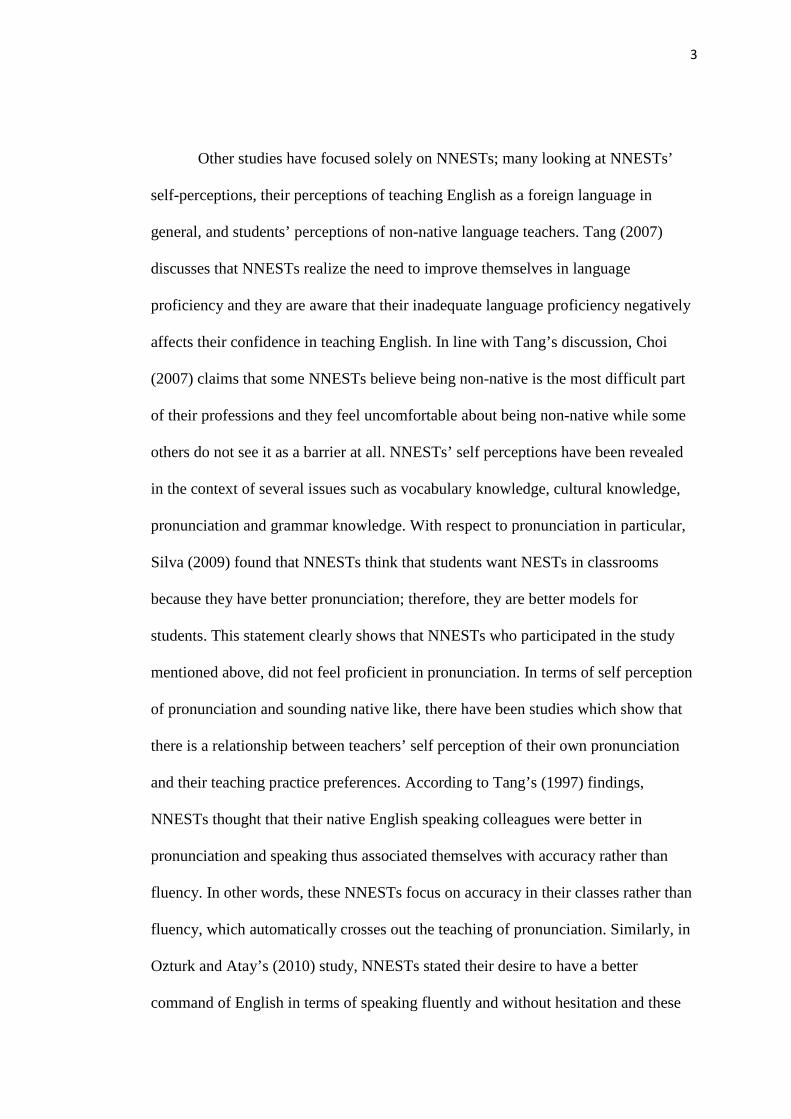
Background of the study
English as a Foreign Language (EFL) has widely been taught by non-native
English speaking teachers (NNEST) in many countries, including Turkey.
Widdowson (1994), Crystal (1995) and Graddol (1997) state that with the spread of
English as a lingua franca, the number of non-native teachers has been steadily
increasing (as cited in Arva & Medgyes, 2000). There have been several studies
comparing native English speaking teachers (NESTs) to NNESTs (Arva & Medgyes,
2000; Ezberci, 2005; Merino, 1997; Shahenayati, 1987; Tajino & Tajino, 2000), and
some differences have been put forth in terms of language competence and teaching
English in both foreign language (EFL) and second language (ESL) situations, as
well as comparing the roles they are likely to assume in team teaching situations.
NESTs and NNESTs are represented as ‘two different species’ in terms of their
language proficiency and teaching behaviours and there are perceived differences in
teaching behaviour between NNESTs and NESTs (Arva & Medgyes, 2000).
Medgyes (1983) claims that NNESTs generally feel insecure using the language they
have to teach and as a result of this feeling they become either pessimistic or
aggressive. He states that this insecurity leads to NNESTs’ focusing too much on
grammar and ignoring pronunciation and vocabulary. In addition to feeling insecure,
NNESTs have the disadvantage of still being learners of English themselves. In their
study comparing NESTs to NNESTs, Arva and Medgyes (2000) found that in all
four skills NNESTs lagged behind NESTs.
3
Other studies have focused solely on NNESTs; many looking at NNESTs’
self-perceptions, their perceptions of teaching English as a foreign language in
general, and students’ perceptions of non-native language teachers. Tang (2007)
discusses that NNESTs realize the need to improve themselves in language
proficiency and they are aware that their inadequate language proficiency negatively
affects their confidence in teaching English. In line with Tang’s discussion, Choi
(2007) claims that some NNESTs believe being non-native is the most difficult part
of their professions and they feel uncomfortable about being non-native while some
others do not see it as a barrier at all. NNESTs’ self perceptions have been revealed
in the context of several issues such as vocabulary knowledge, cultural knowledge,
pronunciation and grammar knowledge. With respect to pronunciation in particular,
Silva (2009) found that NNESTs think that students want NESTs in classrooms
because they have better pronunciation; therefore, they are better models for
students. This statement clearly shows that NNESTs who participated in the study
mentioned above, did not feel proficient in pronunciation. In terms of self perception
of pronunciation and sounding native like, there have been studies which show that
there is a relationship between teachers’ self perception of their own pronunciation
and their teaching practice preferences. According to Tang’s (1997) findings,
NNESTs thought that their native English speaking colleagues were better in
pronunciation and speaking thus associated themselves with accuracy rather than
fluency. In other words, these NNESTs focus on accuracy in their classes rather than
fluency, which automatically crosses out the teaching of pronunciation. Similarly, in
Ozturk and Atay’s (2010) study, NNESTs stated their desire to have a better
command of English in terms of speaking fluently and without hesitation and these
4
NNESTs’ felt inefficient when they compared themselves to their native English
speaking colleagues.
However, NNESTs’ perceptions of their own language skills do not always
show lack of confidence signs and this confidence obviously affects the way they
teach. In a recent study conducted by Kamhi-Stein, Aagard, Ching, Paik and Sasser
(2004), NNESTs, who work at primary and secondary school level, recorded that
they are confident in their pronunciation skills and language proficiency in general
(as cited in Moussu & Llurda, 2008). In a similar study, Llurda and Huguet (2003)
pointed out that NNESTs show confidence in their language proficiency in general if
they spent some time abroad. Those who had not spent time abroad seemed to think
that a NEST would be a better model for the students (as cited in Moussu & Llurda,
2008). Moreover, a similar study conducted by Arva and Medgyes (2000) showed
that NNESTs’ lack of confidence in teaching pronunciation was in vain as they
defined their pronunciation as ‘at near native level’ when they observed those
NNESTs during classroom practices.
When a context that includes only NNESTs is considered, it is important to
explore their self-perceptions about being non-native. There are studies on self-
perceptions of language proficiency in general. However, there are not studies on
perceptions of NNESTs about the issue of being non native and teaching
pronunciation in an EFL context. Moreover, in their article Moussu and Llurda
(2008) stated that the largest part of the literature is related to North American
situation and ESL contexts. At this point, it is important to look at the relationship
between the self-perception of Turkish NNESTs on pronunciation and oral
5
communication skills and their teaching practices in a specific area, namely
pronunciation.
Statement of the Problem
The place of non native English speaking teachers (NNESTs) and native
English speaking teachers (NESTs) in EFL and ESL contexts, the comparison of
their language proficiency, self-perceptions, and students’ perceptions about NESTs
versus NNESTs, have received great attention in recent literature and a great deal of
studies have been conducted on these issues (Al-Omrani, 2008; Arva & Medgyes,
2000; Ezberci, 2005; Lipovsky & Mahboob, 2007; Merino, 1997; Shen & Wu, 2007;
Shirvani Shahenayatani, 1987; Tajino & Tajino, 2000). There are also a number of
studies which focus on only NNESTs, including those looking at their self-
perceptions of their proficiency in language and their pedagogical knowledge in
general, as well as their identities, status, experiences and employability (Choi, 1993;
Clark & Paran, 2007; Cook, 1999; Griffler & Samimy, 1999; Hayes, 2009; Kim,
2009; Lee, 2010, Mahboob, 2003; Öztürk & Atay, 2010; Sahib, 2005; Silva, 2009;
Tang, 2007; Wen, 2009). However, the discipline still lacks studies investigating the
relationship between NNESTs' self-perceptions on a specific skill, namely
pronunciation, and their styles of teaching in this specific area.
Significance of the Study
There is a lack of research in the literature about NNESTs on the relationship
between their perceptions about being non native and teaching speaking and
pronunciation. The results of this study may contribute to this literature by revealing
a picture of NNESTs’ perceptions on being non native teachers of English, and
teaching an important part of a skill, pronunciation, which is arguably the most
6
distinctive skill that one is more likely to find a difference in being native or
sounding native-like. In that, how they perceive their own pronunciation of English
as a NNEST and to what extent their perceptions affect their classroom practices
regarding pronunciation teaching may explain the issue of NNESTs regarding
teaching pronunciation.
At the local level, this study attempted to reveal the picture of NNESTs’
perceptions of their own pronunciation skills and teaching pronunciation at a Turkish
state university. This information is essential for the institution as it will help the
institution see the extent to which its staff feels proficient and comfortable teaching
pronunciation. It will also be of great use in considering the needs, limits and ideas of
the instructors while adjusting the objectives of the institution.
Research Questions
1. What are the NNESTs’ perceptions of teaching pronunciation as a non
native English speaker?
1.1. Is there a significant difference between teachers’ reported practice
of teaching pronunciation and these factors separately: their years of
experience, their degree of education, whether or not they had a native
English speaking teacher, whether or not they took phonology classes,
and the time they spent in English speaking countries?
1.2. Is there a significant difference between teachers’ self-perceptions
of pronunciation and these factors separately: their years of experience,
their degree of education, whether or not they had a native English
speaking teacher, whether or not they took phonology classes, and the
time they spent in English speaking countries?
7
2. What is the relationship between NNESTs’ perceptions of their own
pronunciation and their reported teaching practices?
Conclusion
This chapter briefly explained the state of NNESTs and the studies which
reflect their situation in the literature. This chapter described the NESTs and
NNESTs specifically, introduced the topic of the study, described the statement of
the problem and the significance of the study. The second chapter will present the
literature review; the third chapter will describe the methodology of the study and in
the fourth chapter quantitative data analysis will be presented. In the fifth chapter, the
conclusions drawn from the data will be presented.
8
CHAPTER II: LITERATURE REVIEW
Introduction
In spite of the fact that English teaching in EFL contexts is mostly conducted
by non-native English speaking teachers (NNESTs), research exclusively on
NNESTs’ self-perceptions and students’ perceptions of NNESTs have been studied
for less than a decade. Braine (2005) explains this short period of research on
NNESTs as a consequence of NNEST issue’s being sensitive as previous research on
native English speaking teachers (NESTs) vs. NNESTs has often been favouring
NESTs and the results of these studies showed that NESTs have advantages over
NNESTs in terms of knowledge and performance. The studies comparing NESTs to
NNESTs have also been conducted in terms of cultural advantage, language
proficiency in general, comparison of self-perceptions of these teachers as well as
language learners' perceptions of these two different types of teachers. However,
NNESTs’ perceptions of their own pronunciation and their classroom practices of
teaching pronunciation have not been studied yet.
Students' Perceptions of NESTs and NNESTs
Research on NNESTs include studies that focused on only the perceptions of
students and examined their perceptions of NNESTs and NNESTs by looking at
many different aspects. Shen and Wu (2007) conducted a study with 357 university
students in Taiwan and sought for their perceptions of NESTs and NNESTs. Their
results suggested that students favoured NNESTs because they are good learner
models, their teaching methods are better than NESTs, they are more sensitive to the
students and they use the students' mother tongue. Participants also indicated that
NESTs should teach speaking rather than reading, writing or linguistics. The results
9
also show that according to these students NNESTs provided better vocabulary and
grammar knowledge. In the light of these results, Shen and Wu (2007) concluded
that NNESTs were persistent on grammar and vocabulary because they focused on
accuracy whereas NESTs focused on fluency. The study sheds a light on the NEST
vs. NNEST issue and addresses an important point which is NNESTs’ focusing on
grammar and vocabulary more than speaking.
Similarly, in his doctoral dissertation, Al-Omrani (2008) studied 100 Saudi
ESL/EFL students’ perceptions of NESTs and NNESTs. He focused on these
students’ ideas about the advantages and disadvantages of studying English with
teachers who have different backgrounds. His findings, gathered through
questionnaires and interviews, revealed that students’ perceptions of these two
different types of teacher differed in terms of the teaching areas. Participants’
statements revealed that they believe NESTs are more qualified at teaching oral skills
as it is their mother tongue and NNEST are more successful at teaching in general
because they themselves had been learners of this language before and they can make
connections more easily than their native speaking colleagues. Furthermore, the
results of this study showed that, according to the students, the negative features of
NNESTs are their oral skills and pronunciation as well as their overall language
proficiency.
Students’ perceptions of NESTs and NNESTs were also the focus of
Murahata and Murahata’s (2000) study on Japanese university level students’
expectations from NESTs and NNESTs. Researchers questioned if there was a
difference between the expectations from both types of teacher and if there was such
a difference, where the difference stemmed from. They conducted the study with 79
10
Japanese university students who were in their first or second year at university and
had both NESTs and NNESTs. The results revealed that these students expect
NESTs to focus on speaking and listening whereas they expect NNESTs to focus on
grammar and reading. These results show parallelism with Medgeys’ (1992) claims
about NESTs’ being more proficient in English and NNESTs’ focusing more on
grammar or being obsessed with grammar (Medgyes, 1983). However, this
parallelism between the students’ perceptions and Medgyes’ claims should be tested
from the perspective of the NNESTs themselves. Another important point mentioned
by the researchers is that the NNESTs in the Japanese context have difficulties in
being a good role model in a communicative class since they may easily make
mistakes while speaking and expressing themselves. The question which was about
the expectation of students from their NNESTs in terms of oral proficiency in
English has an interesting result that these students expect their NNESTs to try for a
‘near-native’ oral fluency with good pronunciation and intonation. However, whether
this expectation is fulfilled by NNESTs was not answered in this study. Another
analysis of NNESTs’ strengths and weaknesses in an EFL context was made by Ling
and Braine (2007). The main focus of their study was to examine the students’
perceptions of NNESTs in Hong Kong. They conducted a study with students from 7
different universities. Sixty students from each university answered a questionnaire
which included statements about the students’ feelings about learning from NNESTs
and communication with NNESTs. The results of this study showed that these
students’ perceptions of their NNESTs are mostly positive. The students’ responses
were also positive in the follow-up interview and NNESTs’ were described as being
11
knowledgeable in English language as well as having the ability to use mother
tongue in teaching, effective pedagogical skills and positive personality traits.
In their study, Lasagabaster and Sierra (2002) asked seventy-six university
students to complete questionnaires to find out these students' opinions about NESTs
and NNESTs’ language skills, grammar, vocabulary, pronunciation, learning
strategies, culture and civilization, attitudes and assessment. They had four
hypotheses and two of them were quite related to the results found in the studies
mentioned in this literature review. One hypothesis was that there would be a
preference for NESTs in vocabulary, pronunciation, speaking, culture and
civilization, attitudes and assessment areas and the other hypothesis was that the
preference for NNESTs would be in grammar, listening, reading and learning
strategies areas. Their hypotheses were supported by the results since the preference
for NNESTs was in grammar and reading teaching areas and for NESTs the
preference was for speaking, vocabulary and pronunciation.
With an attempt to see if there is a correspondence between the students’ and
teachers’ perceptions of the different teaching behaviours of NNESTs and NESTs,
Benke and Medgyes (2005) looked at the students’ perceptions of these two types of
teachers in Hungary. Their starting point was to see whether the results of Arva and
Medgyes’s (2000) previous study, which was conducted with teachers would
correspond with their study which was conducted with students. Four hundred and
twenty-two students were included in the study and their perceptions of these
teachers were asked in a five points Likert-scale questionnaire in addition to an open
ended section in which the students explained the advantages and disadvantages of
both teachers. The results of this study revealed that there is a correspondence
12
between the students’ and teachers’ perceptions of weaknesses/strengths of NESTs
and NNESTs. Moreover, when the answers given to the questions about NNESTs
were examined, participants mostly disagreed that NNESTs focus primarily on
speaking skills whereas this item has the highest percentage in the NESTs
questionnaire. Among the open ended questions, the researchers stated that they were
not surprised to see that according to the students the NNESTs are great grammar
teachers, but they criticized these teachers because of their poor pronunciation skills.
On the other hand, the students clearly stated the advantage of NESTs as they are
quite successful at teaching conversation classes and these teachers can serve as ideal
models for imitation. According to one of the participants, the advantage of NESTs is
this simple; “Pronunciation, pronunciation, pronunciation!” (p. 207) and another
quotation in the research clearly shows that these students love listening to NESTs;
“It is an acoustic delight to listen to them...” (p. 207). Both of these quotations
clearly indicate that the students' preference of NESTs is their pronunciation and
speaking skills.
In light of these studies, it is possible to have a broad idea about the
perceptions of the students exclusively. They also give a clear explanation of the
advantages and disadvantages of having an NNEST in the classroom from the
students’ point of view. However, since all these studies included both NESTs and
NNESTs, students’ perceptions reflect the results of their comparison rather than the
evaluation of NNESTs’ strengths and weaknesses separately. Furthermore, the
conclusions made by the researchers which showed that NNESTs were more
interested in accuracy than fluency and preferred to teach grammar rather than
speaking for the same reason were the result of the students’ responses and
13
preferences rather than NNESTs’ themselves (Al Omrani, 2008; Lasagabaster &
Sierra, 2002; Shen & Wu, 2007).
Teachers' Perceptions of NESTs and NNESTs
In addition to focusing solely on students' perceptions, many other
researchers studied NESTs and NNESTs by focusing on the teachers' perceptions. In
his book dedicated to NNESTs, Braine (2010) cited many studies focusing on many
aspects of NNESTs research such as student and teacher perceptions, self-
perceptions and professional development. In his chapter about self-perceptions of
NNESTs, he cited Kamhi-Stein, Aagard, Ching, Paik, and Sesser's (2004) study
which compared NESTs to NNESTs teaching at different levels in California. The
non native English speaking participants of this study marked their own language
skills "very good". However, the lowest rated-skill of these NNESTs was marked as
pronunciation. Moreover, one of the participants stated that NNESTs were afraid of
making mistakes while speaking. Rajagopalan (2005) states that as a result of NESTs
were claimed to be as reliable models for the people who are willing to learn English
as a second language, NNEST admitted their places and inferiority to NESTs. He
also states that these NNESTs got used to living with low self confidence rates and
job-related stress in accordance with this low self esteem.
Another comparison of NESTs to NNESTs was conducted by Arva and
Medgyes (2000) in Hungary. Their study included ten teachers and five of them were
NNESTs. The aim of the study was to find out the differences between NESTs and
NNESTs in terms of teaching behaviour and the difference between teachers’
perceptions and classroom realities. The study’s results do not show a different
perspective about either type of teachers. NNESTs reported that their native speaking
14
colleagues were far better than themselves in terms of colloquial expressions, idioms
and phrasal verbs. Moreover, NNESTs stated that they feel far more comfortable in
teaching grammar and they admitted that they had difficulties especially with
pronunciation, vocabulary and colloquial expressions. Surprisingly, in spite of
NNESTs' lack of confidence signs in pronunciation, the classroom realities of these
teachers showed that they were quite fluent and some of them were even described as
‘at near-native level’ by the researchers.
In her master thesis, Ezberci (2005) also studied the comparison of NESTs to
NNESTs in terms of their own perceptions of ELT as a career, the most important
qualifications of an English language teacher and their views about job opportunities,
strengths and weaknesses. In order to get answers to her questions, she conducted a
study with 172 participants from 10 different universities in Istanbul. The answers
regarding the strengths and weaknesses of NNESTs showed that ‘command of
English’ is the weakness of NNESTs as perceived by both NESTs and NNESTs.
Furthermore, the NNESTs who were involved in this study stated that NESTs’
strengths were their speaking skills and command of English. In the framework of a
comparison, this study gives clear information about NNESTs’ perceptions.
NNESTs’ responses to the weaknesses/strengths related questions indicate that they
are aware of the fact that there is a difference at the command of English level.
In her survey study, Tang (1997) asked NNESTs about their perceptions of
proficiency and competency of NESTs and NNESTs. Her results also showed that
NNESTs believed that NESTs were superior to NNESTs in terms of pronunciation,
vocabulary and reading. The percentage of the teachers (92%) who believe that
NESTs are superior in pronunciation clearly reveals the picture of NNESTs’ self-
15
perceptions of pronunciation. In addition, those NNESTs stated that they were
associated with accuracy rather than fluency. In light of these results, one can assume
that NNESTs may feel inferior in the aspects which are defined as strengths of
NESTs.
Ozturk and Atay (2010) also tried to show the challenges of being a NNEST
in their case study. Their subjects were three female Turkish teachers of English who
were all novice, at their first or second years in their professions. Their study was a
follow-up of Atay’s (2007) study which was carried out in Turkish setting and the
results of that study clearly showed that NNESTs believed that they cannot compete
with NESTs. Moreover, these teachers stated that they all wanted to have native-like
competence in English. The most important skill for them was to speak in English
‘fluently and without hesitations’ (as cited in Ozturk & Atay, 2010). Therefore, their
main focus was to find out NNESTs’ opinions about NEST/NNEST dichotomy and
if there had been any change in the opinions of these novice teachers when they
started to teach in different environments. According to these three novice teachers’
answers in interviews, there had been times that they felt their situation in teaching
would be totally different if they were native speakers. As the study looks from
employability perspective, the results indicated that these NNESTs felt inferior to
their native colleagues and believed that their employability situation is mostly
affected by NESTs’ being chosen by the institutions and also parents. The
researchers state that these NNESTs accept themselves as inefficient teachers even
without questioning and something should be done to help these teachers be aware of
themselves.
16
Literature from the teachers’ perceptions of these two types of teachers the
results of these studies indicated that NNESTs somehow feel inferior when they
compare themselves to their native English speaking colleagues. Therefore, the
results of a study which focuses on the self perceptions of NNESTs who work in a
NNEST environment in an EFL context would be different from this comparison as
it will include NNESTs only and they will be considering their own proficiency in
pronunciation and their teaching styles instead of comparing themselves to a native
English speaking colleague (Arva & Medgyes, 2000).
Students' and Teachers' Perceptions of NNESTs
When it comes to perceptions of NNESTs, students’ and teachers’
perceptions have been studied both in isolation and together and the results of these
studies mostly show that there is a lack of confidence of language proficiency in
general, speaking and pronunciation in particular. When Liu's (1999) participants
who worked in a major university in U.S. in terms were asked whether they saw
themselves as native or non-native speakers of English, they described themselves as
NNESTs in spite of the fact that they were in an ESL context, hence in a surrounding
which included native English speakers. However, according to Liu's (1999)
description these participants spoke English like native speakers.
In her survey study, Nemtchinova (2005) sought for host teachers’
perceptions of NNEST trainees’ strengths. She defines host teachers as “teachers in
various educational settings with whom MA TESOL students are paired to teach
their practicum classes.” (Nemtchinova, 2005, p. 236). The NNESTs evaluated in
this study were mostly novice teachers whose practicum teaching was their first
experience in teaching. Host teachers’ answers to the personal quality questions
17
showed that these NNESTs were mostly welcomed by the students and they had a
good rapport. The host teachers’ evaluations of these NNESTs in terms of personal
qualities, command of language, teaching organization, lesson implementation,
cultural awareness, feedback to students and self-evaluation were positive in general.
The negative evaluations of the host teachers were based on being novice rather than
being non native. They stated that these NNESTs were very willing to get feedback –
especially on pronunciation- and they were eager to make changes in their styles
according to the feedback. When they were asked about the overall strengths of these
NNEST trainees, host teachers indicated that they were very good at identifying
cultural and linguistic needs of ESL learners, therefore; they were able to develop
positive relationships with their students. Being a successful learner model is another
strength stated by the host teachers. However, when they were asked about what
NNEST trainees could have done better, most of the host teachers said
‘pronunciation’ as well as teaching skills and classroom behaviour. However, these
native speaking host teachers stated earlier in the study that the pronunciation issue
was not that important for classroom setting as the students already had a native
speaking model in the classroom. In this respect, the pronunciation issue was not
given that much importance and their suggestions did not go beyond focusing on oral
communication not necessarily for students but for themselves.
In his study conducted in Brazil, Rajagopalan (2005) found out that his
NNEST respondents agreed with the idea that spending time/living in a native
speaking environment is an important issue for them. Rajagopalan (2005) stated that
some of the most fluent teachers in the interviews were the ones who spent time
abroad. On the other hand, the ones who claimed having lived in English speaking
18
environments did not show that much fluency in English. According to Rajagopalan
(2005), the main difference came out because of the way NNESTs perceive
themselves and rate their own fluency. In addition, his findings revealed that the
experienced NNESTs were more worried about being a non-native teacher than their
less experienced colleagues and Rajagopalan (2005) also presumed that these less
experienced teachers are from a younger generation. The results mentioned in the
literature supported Rajagopalan’s (2005) emphasis on that a lot of work should be
done in order to empower the NNESTs and encourage them to rethink their own
roles in EFL contexts.
Similarly, in their study which aimed to reveal an international picture of
NNESTs, Reves and Medgyes (1994) mentioned that some of the non native speaker
participants who had been in frequent contact with native speakers judged their own
command of English severely and this interaction made these NNESTs more
conscious about the problems that result from their languages deficiencies.
Pronunciation and NNESTs
Kelly (2000) stated that pronunciation is a neglected part of English lessons
in most cases since the teachers are mostly uneasy about dealing with sounds and
intonation. Another reason he gave was that the teachers think they have too much to
do throughout their lessons and pronunciation teaching will make this process worse.
In line with Harmer’s argument but from a different perspective, Macdonald (2002)
also stated that many teachers do not teach pronunciation “because they lack
confidence, skills and knowledge” (p. 3). In his study which solely focused on
teachers' practices and views on pronunciation, Macdonald (2002) suggested that
most of his participants, who worked in adult ESL programs in Australia, indicated
19
that they were not good at teaching pronunciation and they were reluctant to teach it
for several reasons such as formal curricula, learner goals and assessment, teaching
in an integrated way and teaching and learning materials. He stated that most of his
participants focused on pronunciation teaching only when a need came up in the
classroom, otherwise they ignored it, and this reluctant behaviour should be
addressed through teacher training. As well as giving specific recommendations
related to these areas, Macdonald (2002) highlighted that teacher training in
pronunciation is a need both at pre-service stage and as part of ongoing professional
development programs. As Derwing and Munro (2005) emphasized in their article
about pronunciation teaching, most of the English language teachers are not provided
with essential training on teaching pronunciation and they are left with their own
intuitions about pronunciation teaching, and because of this lack of training, most of
the teachers are reluctant to teach pronunciation in their classrooms. In their study
which was aimed to identify how well the English language teachers are trained for
teaching pronunciation, Bradford and Kenworthy (1991) found out that most of their
participants were not content with phonology and pronunciation training they got
during their graduate studies. The participants stated that too little time had been
given to these areas and this had not been enough for them to decide the course
content and which methods to use in the classroom. (as cited in Lambacher, 2001).
In their article which included a review on several studies about
pronunciation teaching, Baker and Murphy (2011) highlighted the importance of the
relationship of teachers' knowledge, beliefs and their actual classroom practices.
Moreover, they focused on learner factors, curriculum factors and teacher factors as
the most frequently recurrent factors in the literature related to the key components
20
of pronunciation teaching and learning. Their review indicated that in addition to the
knowledge of curriculum and learner factors, the language teachers should also have
the knowledge of phonology and the techniques to be used to teach pronunciation
effectively.
There are also some studies which touched upon the importance of teaching
pronunciation in ESL and EFL contexts. Derwing and Munro (2005) stated that
teaching pronunciation could be useful in that students who learn L2 pronunciation
would benefit from explicit instruction of phonological forms that would help them
notice the difference between a proficient speakers’ production and their own
production. Bradlow, Pisoni, Akahane-Yamad and Takura’s (1997) study also
stressed the importance of showing the distinction between L1 and L2. Their
argument was that showing this difference may lead to automatic improvement in
production even if there is no production training (as cited in Derwing & Munro
2005). Yet, Derwing and Munro (2005) cautiously stressed that strategies that
teachers develop themselves for the sake of teaching pronunciation may turn out to
be useless. In that sense, having pronunciation training during or before their careers
becomes important for the language teachers, especially NNESTs who themselves
are still the learners of the language they teach (Medgyes, 1992).
In accordance with Derwing and Munro, Levis (2005) also stated that the
importance of pronunciation has not been based on research but on ideology and
intuition. He explained that most of the teachers have decided which parts of
pronunciation have the greatest effect on clarity and which parts are learnable in a
classroom setting by their intuition, and this could be dealt with only providing a
carefully formulated agenda to define which features of pronunciation affect
21
intelligibility, hence help the teachers in a more effective way on teaching
pronunciation.
Wong (1993) indicated that there are four myths about teaching pronunciation
one of which is that non-native speakers of English cannot teach pronunciation. She
argued that people have this idea because teaching pronunciation has the exact
pronunciation of vowel and consonant sounds as its main concern. However,
communicative effectiveness does not solely depend on the pronunciation of these
vowels and consonants. Wong (1993) stated that if a speaker is able to use the
rhythm and intonation of English, he/she is accepted as much more intelligible than
the one who pronounce vowels and consonants perfectly. Wong (1993) indicated
that this anxiety of NNESTs about teaching pronunciation can be reduced if they
become educated in teaching pronunciation and this will definitely help these
teachers feel more confident. In addition, Wong (1993) saw NNESTs as having
advantages over the native speaking teachers as they can receive and manipulate
more easily rhythm and intonation than the native speakers because the native
speakers are not even conscious of these features.
In her study, Jenkins (2005) studied eight NNESTs who have high level of
proficiency. She examined these teachers’ attitudes towards their own pronunciation
and their attitudes towards other NNS English accents. The participants’ answers to
the question of whether they feel comfortable about their own pronunciation clearly
showed that they are quite comfortable. Moreover, when they were asked how they
would feel if someone told them that their pronunciation is similar to a native
speaker’s, they reported that they would be happy or proud of themselves. The
results of this study showed that these NNESTs are content with their own
22
pronunciation indeed, but when asked about sounding ‘native like’, they did not deny
its being a good quality for a NNEST.
Medgyes’ (1992) claims about NNESTs and NESTs that their teaching
practice and language competence are different and the difference in language
competence explains the differences found in teaching practice. However, Medgyes’
(1992) explained that NESTs’ advantage is their mother tongue and this advantage
cannot be overshadowed by any other factors such as aptitude, motivation or
experience. Moreover, Medgyes (1992) stated that despite all their efforts, non-
natives cannot reach a native speaker’s competence. He also stated that non-natives
are not able to use English accurately and appropriately. His claim was that their
fluency does not and will not come up to natives’ level. Nevertheless, his main point
was that there are ideal types of both NESTs and NNESTs. According to Medgyes
(1992) the ideal NNEST is "the one who has achieved near-native proficiency in
English" (p.348). At this point, the question is how NNESTs perceive themselves in
terms of language proficiency and to what extent they agree with Medgyes’ (1992)
ideal NNEST definition. Self-perceptions of NNESTs are the key points that will
show a broader picture of NNEST situation.
Chiu (2008) pointed out in his study that NNESTs he interviewed showed a
certain extent of confidence in terms of their own pronunciation and accent. In
addition, these participants stated that a standard accent is equal to the native accent.
Similar to Jenkins’ (2005) participants, these Taiwanese instructors asserted that they
would feel uncomfortable if someone told them that their English bear a “Taiwanese
Flavour” and they actually do not believe that they have this flavour in their accents.
They also stated that NNESTs can perform as well as natives in terms of being a
23
model in the classroom. Moreover, Chui (2008) states that these NNESTs had been
able to verbalize their knowledge of the English phonological system better than the
NESTs interviewed. They had been able to use more terminology and in a more
systematic way, however; they seemed to have more knowledge of the segmental
level rather than the super segmental level.
With an attempt to investigate the Thai NNESTs’ ideas about hiring NESTs
for listening and speaking classes, Suwanarak (2010) studied with 16 Thai NNESTs
about their perceptions of and differences between NNESTs and NESTs. Suwanarak
(2010) based his study on the choice of Ministry of Education in Thailand which
started to hire NESTs for speaking and listening classes for they think that English
proficiency level of undergraduate students is important. Thai interviewees of the
study stated that NESTs are preferred because it is their native language but they also
stated that they would like to teach those skills. Ten out of 16 interviewees agreed
the notion which describes the ideal teacher of English as a native speaker of
English. Their statements also showed that they think interacting and practicing
communication skills with native speakers will be of great help to the students in
terms of useful expressions and correct pronunciation. They also think that NESTs
would be more accurate in pronunciation as well as the accents. In addition, some
participants stated that their English still has a Thai accent; therefore, a NEST would
be a better language user. On the other hand, six participants stated that there are
many factors that affect the situation of being an ideal teacher such as educational
background and teaching experience. They also stated that some NNESTs who can
achieve native-like English proficiency can be ideal teachers, too. They also believe
24
that NNESTs would be more successful in understanding the differences of phonetic
systems between two languages.
Conclusion
In this chapter, the literature relevant to NNESTs and NESTs are provided.
The studies included in this chapter revealed that many aspects of NNESTs had been
studied both from students' perspective and NNESTs perspectives. The studies also
touched upon the weaknesses and strengths of NESTs vs. NNESTs. The literature
included in this chapter indicate that NNESTs have both strong and weak qualities in
terms of language proficiency, both depending upon their own perceptions and their
students' and NEST colleagues' perceptions. Moreover, the literature includes many
studies conducted in contexts where NESTs and NNESTs worked together.
However, the NNESTs' perceptions should also be discovered by looking at their
own perceptions of a specific skill, namely pronunciation, and the relationship
between their self-perceptions and teaching practices. Thus, the current study aims to
provide a clear insight into the self-perceptions of NNESTs on their own
pronunciation skills and their teaching practices of pronunciation in their classrooms
in a context where there are only NNESTs.
25
CHAPTER III: METHODOLOGY
Introduction
The purpose of this study was to examine NNESTs’ perceptions of teaching
pronunciation in English as a foreign language and to find out the relationship
between their perceptions and actual teaching practices. The research questions
addressed for this study are as follows:
1. What are the NNESTs’ perceptions of teaching pronunciation as a non
native English speaker?
1.1. Is there a significant difference between teachers’ reported practice
of teaching pronunciation and these factors separately: their years of
experience, their degree of education, whether or not they had a native
English speaking teacher, whether or not they took phonology classes,
and the time they spent in English speaking countries?
1.2. Is there a significant difference between teachers’ self-perceptions
of pronunciation and these factors separately: their years of experience,
their degree of education, whether or not they had a native English
speaking teacher, whether or not they took phonology classes, and the
time they spent in English speaking countries?
2. What is the relationship between NNESTs’ perceptions of their own
pronunciation and their reported teaching practices?
This chapter presents the research methods used in the study as well as the
research design and data collection procedures. Information about the participants
and instruments will also be provided.
26
Setting and Participants
The study was conducted at four different Turkish state universities: Gazi
University School of Foreign Languages, Middle East Technical University (METU)
Modern Languages Department, Ankara University School of Foreign Languages
and Kocaeli University School of Foreign Languages. All of the instructors in these
four institutions are non-native speakers of English language. Like many other state
universities in Turkey, these institutions give all the responsibility of teaching
speaking or pronunciation to their NNEST staff as they do not have native English
speaking instructors. Therefore, these NNESTs are the primary role-models for
pronunciation in their classrooms. Furthermore, they all follow syllabi that are based
on the institution’s chosen main course book, and do the speaking and pronunciation
activities included in the book - if there are any. Decisions about whether to give
extra emphasis to pronunciation, or to skip pronunciation activities alltogether, rest
exclusively with the instructor. One hundred and forty NNESTs from these four
universities took part in the study. Thirty instructors from METU, 12 instructors
from Kocaeli University, 51 instructors from Gazi University, and 47 instructors
from Ankara University kindly completed the questionnaire.
Data Collection
The Construction of the Questionnaire
In this study, data were collected mainly through a Likert-scale questionnaire
developed by the researcher herself. In order to construct the items in the
questionnaire, the researcher followed these three steps. First, the researcher used an
online survey to construct focus groups and individual interviews. Focus group
27
discussions and individual interviews were recorded and completed, and then they
were transcribed to write questionnaire items.
As stated before, the first step to develop the questionnaire was to conduct an
online survey. The aim of this online survey was to group the instructors, and
subsequently conduct interviews and focus group discussions, which at the very end
helped gather ideas to form the questionnaire items. This online survey consisted of
two simple questions in line with the research questions of the study: 1) How do you
rate your pronunciation? 2) How much time do you spend teaching pronunciation in
class? The participants answered these questions on a scale of 1 to 10, where 1
represented the lowest and 10 represented the highest points for each question. The
survey was formed and sent using the survey software LimeSurvey to 61 instructors
at Gazi University School of Foreign Languages, and 26 instructors filled in the
survey. Instructors at this institution were chosen at this stage of the study as they
were relatively easier to reach by e-mail since the researcher was able to get hold of
the complete e-mail address list of the institution.
After examining the responses to this initial brief online survey, the
researcher grouped the participants according to their answers into two main groups.
For the two survey items, those who self-reported their pronunciation and teaching
practices to be between 8-10 were considered to be reporting high self-confidence
about pronunciation and giving more importance to teaching pronunciation.
Participants who self-reported their pronunciation and teaching practices to be
between 4-7 were considered to be in the middle group. Those who self-reported
their pronunciation and teaching practices to be between 1 to 3, however, were
considered to be in the low self-confidence group. Group discussions were held with
28
four participants in the high and middle groups. As for the low group, the
participants were not eager to take part in group discussions due to scheduling and
personal reasons. Nevertheless, one participant, who also happened to mark the
lowest among the participants, agreed to be interviewed individually.
The group discussions were held in Turkish in order to reduce the hesitations
which might have arisen due to the questions the researcher posed since they were
about pronunciation teaching and the group members might have felt uncomfortable
while speaking in English and talking about pronunciation teaching at the same time.
In these group discussions four open-ended questions (See Appendix 1) regarding
participants’ ideas about teaching pronunciation were asked. The questions primarily
functioned as rough outlines about where the discussion could go, and participants
were free to ponder about their ideas.
According to the same results of the online survey, one instructor whose
scores were the highest both in pronunciation and practice in the survey, one
instructor whose scores were the lowest on both measures in the survey and one
instructor whose scores were in the middle were chosen to be interviewed
individually. There were 10 main questions in the interviews (See Appendix 2);
however, the researcher asked additional questions depending on the responses.
These interviews were mainly about self-perception of these NNESTs about their
own pronunciation and about being non native teachers. The interviews were
recorded and later transcribed. The responses of the participants both in the focus
groups and in the individual interviews served to identify and construct the items
included in the final questionnaire.
29
When the interviews and focus group discussions were completed, the
recordings were transcribed and analyzed, and a Likert-scale questionnaire of
twenty-nine items was developed. The items were generated according to the
responses and ideas that arose from the group discussions and individual interviews.
Additionally, some of the items were adapted from some of the studies in the
literature (Arva & Medgyes, 2000; Ezberci, 2005; Jenkins, 2005; Medgyes, 1983;
Medgyes, 1992; Tang, 1997). The first section of the questionnaire includes
questions that help gather background information about the participants. In this
section, information about any time spent abroad, the number of years in EFL
teaching, age, academic degree, having native English speaking teachers while they
were learning the language, and having phonology classes as part of their degree
programs was gathered. The second section of the questionnaire included twenty-
nine items about pronunciation teaching practices, and self-perception of being
NNEST and perception of their own pronunciation skills (See Appendix 3).
The Pilot Study
Before conducting the final version of the questionnaire, the 29 item
questionnaire was piloted by the researcher with seventeen participants from Bilkent
University, Ankara who were not the participants of the main study, and only the
wording of some items was changed according to their feedback. In the pilot study,
the reliability and validity of the questionnaire were examined. Cronbach alpha
reliability coefficient was used to check for the internal consistency of items in the
questionnaire. The results revealed that cronbach alpha reliability coefficient was
.803. The value of .803 was considered as an adequate value for the internal
consistency since it was greater than 0.70 according to Nunnally (1978) criteria. The
30
content validity was assured by referring to the literature as well as receiving expert
opinion from the supervisor of the study.
After the necessary changes were made, the researcher distributed printed
copies of the final questionnaire to the participants and collected them a week later.
The importance of their participating in this study was explained on the first page of
the questionnaire along with a consent statement to be signed and dated. Twelve
complete questionnaires out of 30 from Kocaeli University, and 47 out of 70 from
Ankara University were collected. The other two universities sent back all the
questionnaires fully completed – 30 out of 30 from METU and 51 out of 51 from
Gazi University. A total of 140 completed questionnaires were received.
Data Analysis
As stated before, the questionnaire items were developed according to the
responses and ideas of those who participated in individual interviews and group
discussions. Since the online survey, group discussions and individual questions
were all focused on two main factors, the end product included statements for both of
these main topics – namely, self-perception of pronunciation and pronunciation
teaching practice. The questionnaire consisted of twenty-nine statements, which can
be categorized in two parts: fourteen of which were about participants’ self-
perception of their pronunciation, and fifteen of which were about their
pronunciation teaching practice. The researcher named these parts as Self-Perception
Scale (SPS) and Pronunciation Practice Scale (PPrS) in the data analysis chapter.
However, the titles for these two main factors were not made explicit in the
distributed questionnaire in order not to affect participants’ responses. The results
31
were analyzed according to these two main topics using the Statistical Package for
the Social Sciences 10.0 (SPSS).
The results of the analysis are presented in Chapter 4 under five variables: 1)
Teaching Experience, 2) Degree of Education, 3) Having a Native English Speaking
Teacher, 4) Taking Phonology Classes, 5) Time Spent in English Speaking
Countries. For each variable, normality tests were conducted through Kolmogorov-
Smirnov and Shaprio-Wilk tests (See Appendix 4). Since the normality assumptions
were met for all of the variables, One Way ANOVA and paired sample t-tests were
conducted to see if there were any statistical significant differences between each
factor and PPrS and SPS. When all these analyses were reported, the correlation
between the SPS and the PPrS was presented by using Pearson Correlation Analysis
Technique.
Conclusion
This chapter provided information about the study’s setting, participants, and
instruments used as well as the data collection and analysis procedures. The next
chapter will report the findings of the data analysis.
32
CHAPTER IV: DATA ANALYSIS
Introduction
This study investigated NNESTs’ self perceptions of their pronunciation and
teaching pronunciation practices in their classes through a 5 point Likert-Scale
questionnaire by addressing the following research questions:
1. What are the NNESTs’ perceptions of teaching pronunciation as a non
native English speaker?
1.1. Is there a significant difference between teachers’ reported practice
of teaching pronunciation and these factors separately: their years of
experience, their degree of education, whether or not they had a native
English speaking teacher, whether or not they took phonology classes,
and the time they spent in English speaking countries?
1.2. Is there a significant difference between teachers’ self-perceptions
of pronunciation and these factors separately: their years of experience,
their degree of education, whether or not they had a native English
speaking teacher, whether or not they took phonology classes, and the
time they spent in English speaking countries?
2. What is the relationship between NNESTs’ perceptions of their own
pronunciation and their reported teaching practices?
33
Findings
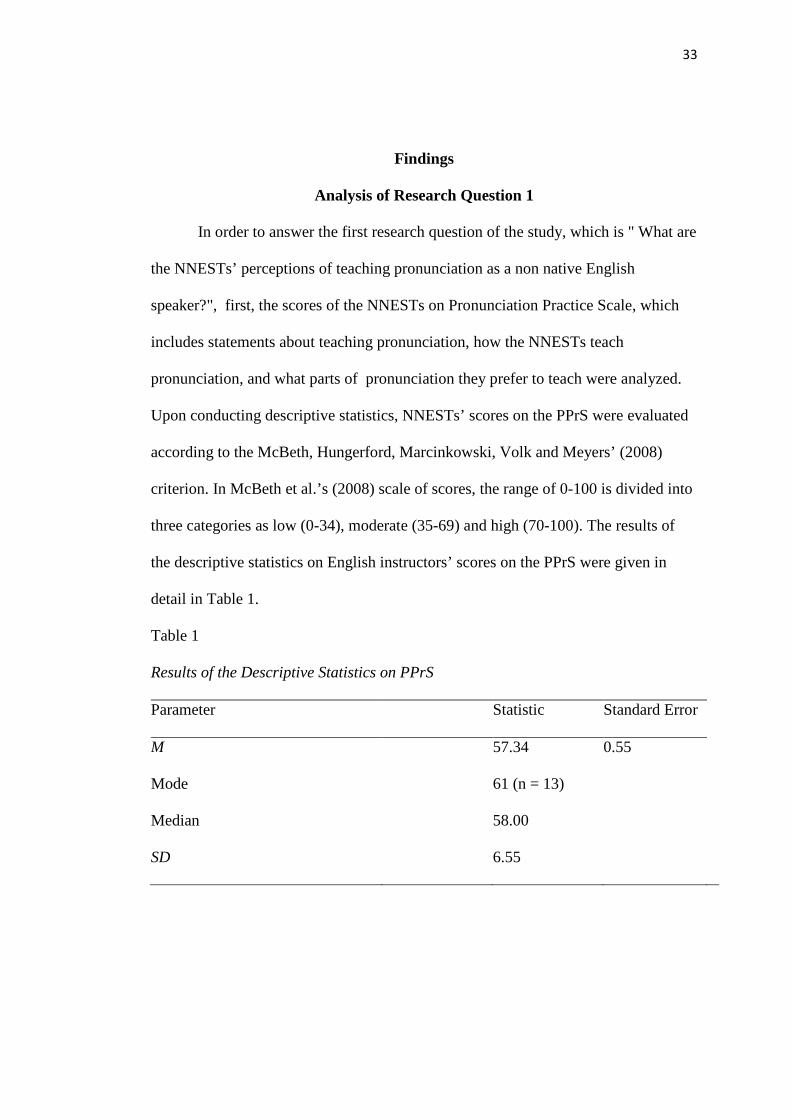
Analysis of Research Question 1
In order to answer the first research question of the study, which is " What are
the NNESTs’ perceptions of teaching pronunciation as a non native English
speaker?", first, the scores of the NNESTs on Pronunciation Practice Scale, which
includes statements about teaching pronunciation, how the NNESTs teach
pronunciation, and what parts of pronunciation they prefer to teach were analyzed.
Upon conducting descriptive statistics, NNESTs’ scores on the PPrS were evaluated
according to the McBeth, Hungerford, Marcinkowski, Volk and Meyers’ (2008)
criterion. In McBeth et al.’s (2008) scale of scores, the range of 0-100 is divided into
three categories as low (0-34), moderate (35-69) and high (70-100). The results of
the descriptive statistics on English instructors’ scores on the PPrS were given in
detail in Table 1.
Table 1
Results of the Descriptive Statistics on PPrS
Parameter Statistic Standard Error
M 57.34 0.55
Mode 61 (n = 13)
Median 58.00
SD 6.55
34
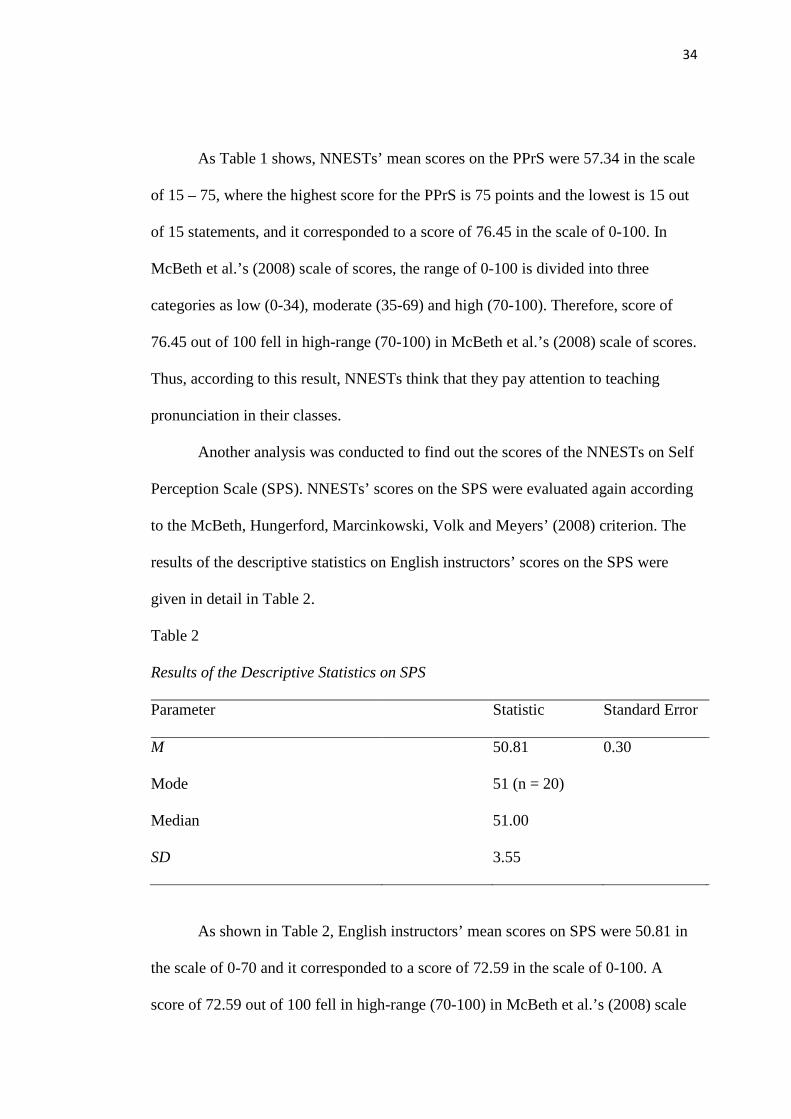
As Table 1 shows, NNESTs’ mean scores on the PPrS were 57.34 in the scale
of 15 – 75, where the highest score for the PPrS is 75 points and the lowest is 15 out
of 15 statements, and it corresponded to a score of 76.45 in the scale of 0-100. In
McBeth et al.’s (2008) scale of scores, the range of 0-100 is divided into three
categories as low (0-34), moderate (35-69) and high (70-100). Therefore, score of
76.45 out of 100 fell in high-range (70-100) in McBeth et al.’s (2008) scale of scores.
Thus, according to this result, NNESTs think that they pay attention to teaching
pronunciation in their classes.
Another analysis was conducted to find out the scores of the NNESTs on Self
Perception Scale (SPS). NNESTs’ scores on the SPS were evaluated again according
to the McBeth, Hungerford, Marcinkowski, Volk and Meyers’ (2008) criterion. The
results of the descriptive statistics on English instructors’ scores on the SPS were
given in detail in Table 2.
Table 2
Results of the Descriptive Statistics on SPS
Parameter Statistic Standard Error
M 50.81 0.30
Mode 51 (n = 20)
Median 51.00
SD 3.55
As shown in Table 2, English instructors’ mean scores on SPS were 50.81 in
the scale of 0-70 and it corresponded to a score of 72.59 in the scale of 0-100. A
score of 72.59 out of 100 fell in high-range (70-100) in McBeth et al.’s (2008) scale
35
of scores.This result indicated that NNESTs believe that their pronunciation of
English language is good enough and they feel comfortable with the way they speak
in English. In other words, they do not think that being a NNEST is a hindrance in
terms of teaching pronunciation and believe that they can teach it without hesitation.
Analyses of Research Questions 1.1 and 1.2
Teaching Experience
One of the variables regarding the demographic information of the
participants’ was their teaching experience since the study aimed to see if there is a
relationship between their teaching experience and their perceptions and their
reported teaching practices of pronunciation. First analysis was conducted in order to
see if the NNESTs’ level of scores on the Pronunciation Practice Scale (PPrS) would
change depending upon their teaching experience. Since the normality assumption
could be met (See Appendix 4), the data on the PPrS of English instructors’ groups
of the teaching period were analyzed using a parametric test called One-Way
Analysis of Variance (One-Way ANOVA). The results of the descriptive statistics
and One-Way ANOVA are given in Table 3 and Table 4, respectively.
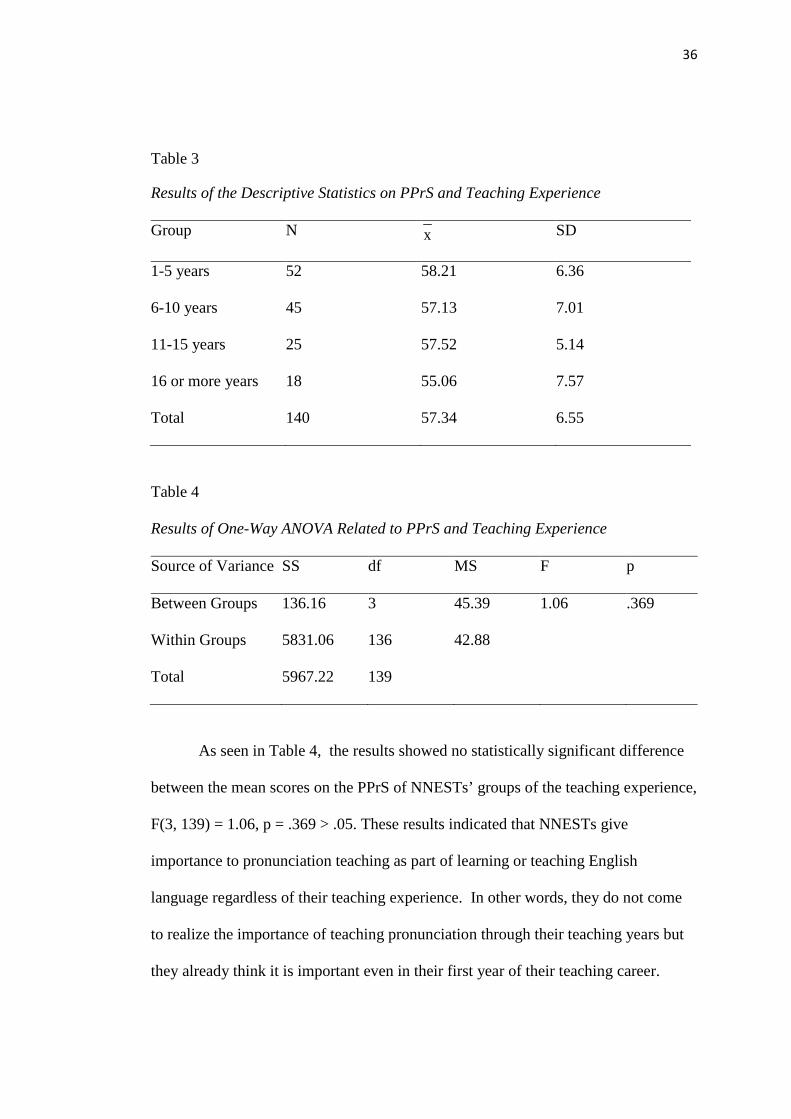
36
Table 3
Results of the Descriptive Statistics on PPrS and Teaching Experience
Group N x SD
1-5 years 52 58.21 6.36
6-10 years 45 57.13 7.01
11-15 years 25 57.52 5.14
16 or more years 18 55.06 7.57
Total 140 57.34 6.55
Table 4
Results of One-Way ANOVA Related to PPrS and Teaching Experience
Source of Variance SS df MS F p
Between Groups 136.16 3 45.39 1.06 .369
Within Groups 5831.06 136 42.88
Total 5967.22 139
As seen in Table 4, the results showed no statistically significant difference
between the mean scores on the PPrS of NNESTs’ groups of the teaching experience,
F(3, 139) = 1.06, p = .369 > .05. These results indicated that NNESTs give
importance to pronunciation teaching as part of learning or teaching English
language regardless of their teaching experience. In other words, they do not come
to realize the importance of teaching pronunciation through their teaching years but
they already think it is important even in their first year of their teaching career.
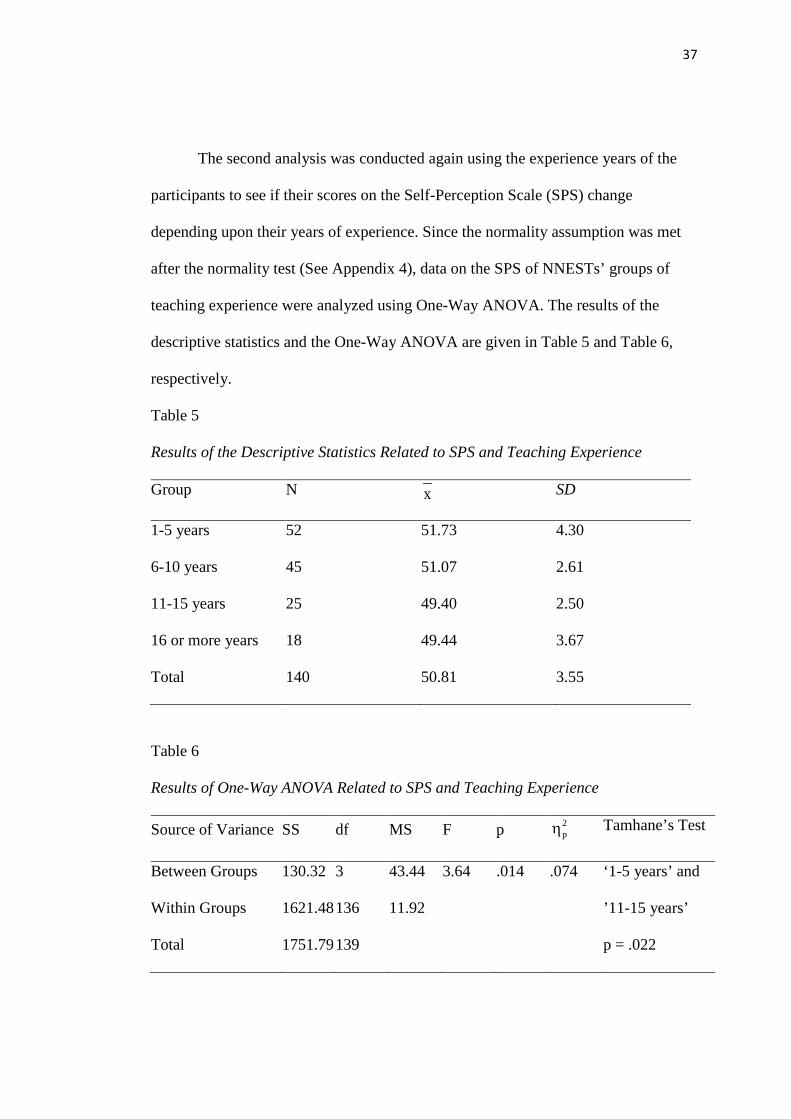
37
The second analysis was conducted again using the experience years of the
participants to see if their scores on the Self-Perception Scale (SPS) change
depending upon their years of experience. Since the normality assumption was met
after the normality test (See Appendix 4), data on the SPS of NNESTs’ groups of
teaching experience were analyzed using One-Way ANOVA. The results of the
descriptive statistics and the One-Way ANOVA are given in Table 5 and Table 6,
respectively.
Table 5
Results of the Descriptive Statistics Related to SPS and Teaching Experience
Group N x SD
1-5 years 52 51.73 4.30
6-10 years 45 51.07 2.61
11-15 years 25 49.40 2.50
16 or more years 18 49.44 3.67
Total 140 50.81 3.55
Table 6
Results of One-Way ANOVA Related to SPS and Teaching Experience
Source of Variance SS df MS F p 2pη Tamhane’s Test
Between Groups 130.32 3 43.44 3.64 .014 .074 ‘1-5 years’ and
’11-15 years’ Within Groups 1621.48 136 11.92
Total 1751.79 139 p = .022
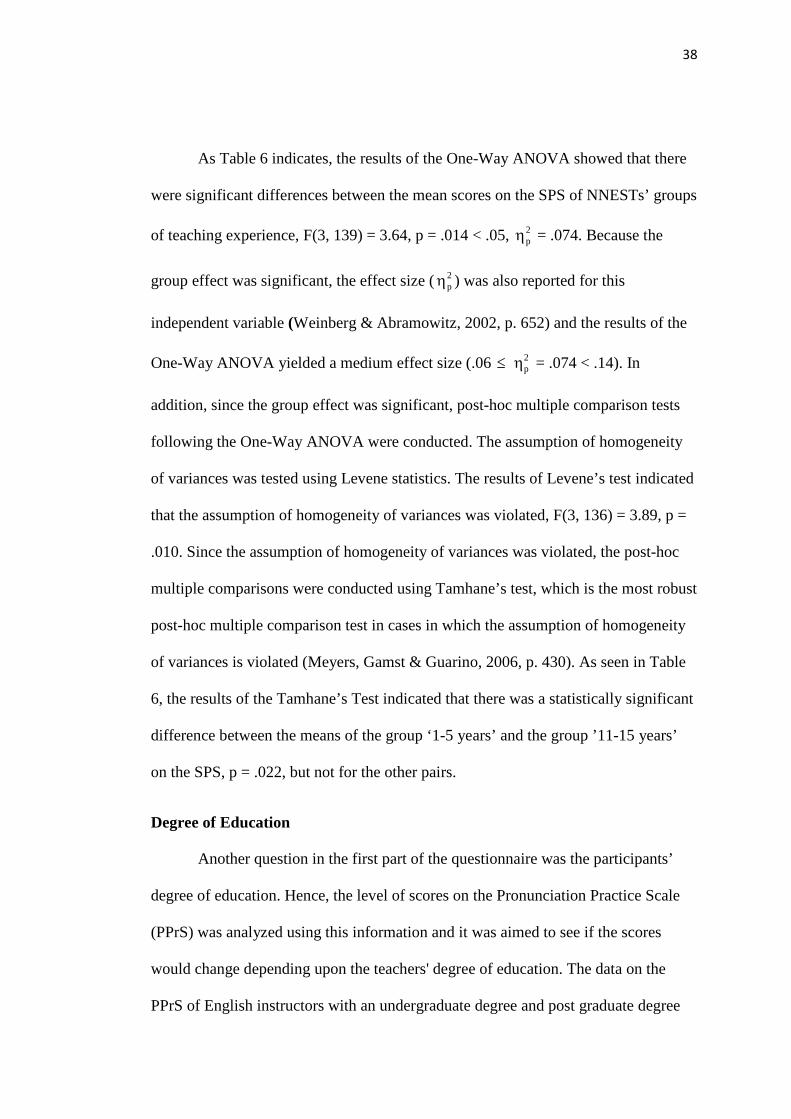
38
As Table 6 indicates, the results of the One-Way ANOVA showed that there
were significant differences between the mean scores on the SPS of NNESTs’ groups
of teaching experience, F(3, 139) = 3.64, p = .014 < .05, 2pη = .074. Because the
group effect was significant, the effect size ( 2pη ) was also reported for this
independent variable (Weinberg & Abramowitz, 2002, p. 652) and the results of the
One-Way ANOVA yielded a medium effect size (.06 ≤ 2pη = .074 < .14). In
addition, since the group effect was significant, post-hoc multiple comparison tests
following the One-Way ANOVA were conducted. The assumption of homogeneity
of variances was tested using Levene statistics. The results of Levene’s test indicated
that the assumption of homogeneity of variances was violated, F(3, 136) = 3.89, p =
.010. Since the assumption of homogeneity of variances was violated, the post-hoc
multiple comparisons were conducted using Tamhane’s test, which is the most robust
post-hoc multiple comparison test in cases in which the assumption of homogeneity
of variances is violated (Meyers, Gamst & Guarino, 2006, p. 430). As seen in Table
6, the results of the Tamhane’s Test indicated that there was a statistically significant
difference between the means of the group ‘1-5 years’ and the group ’11-15 years’
on the SPS, p = .022, but not for the other pairs.
Degree of Education
Another question in the first part of the questionnaire was the participants’
degree of education. Hence, the level of scores on the Pronunciation Practice Scale
(PPrS) was analyzed using this information and it was aimed to see if the scores
would change depending upon the teachers' degree of education. The data on the
PPrS of English instructors with an undergraduate degree and post graduate degree
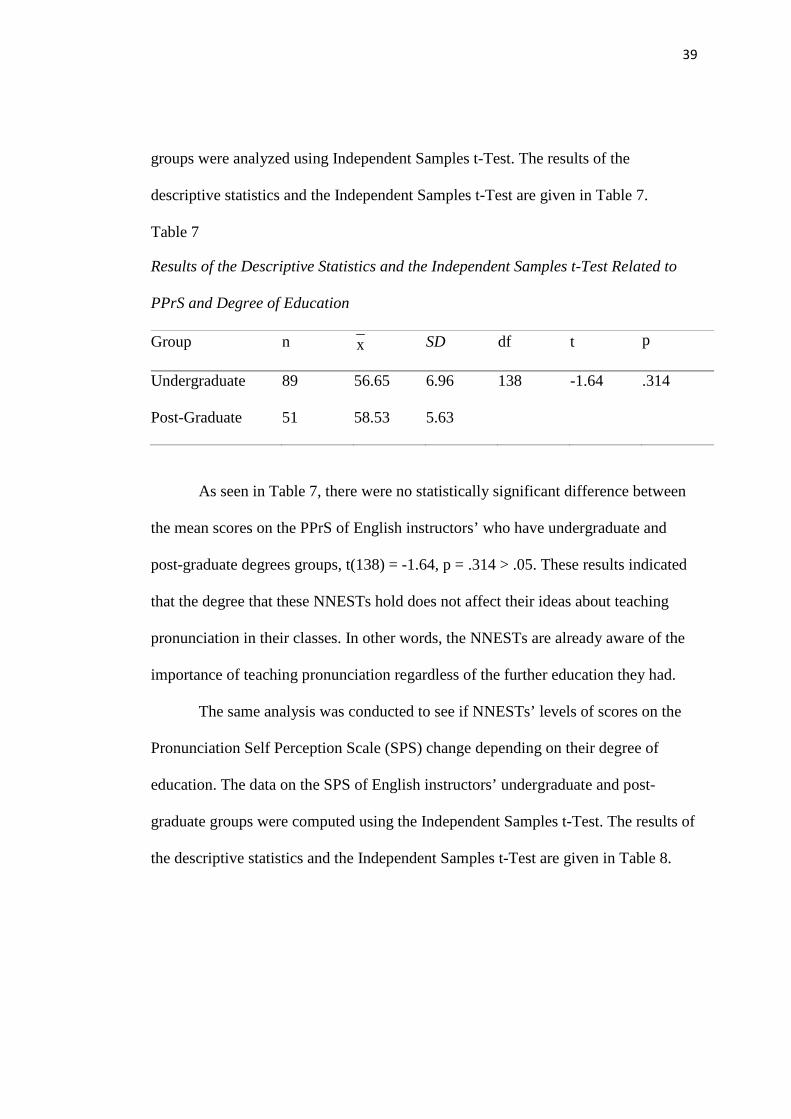
39
groups were analyzed using Independent Samples t-Test. The results of the
descriptive statistics and the Independent Samples t-Test are given in Table 7.
Table 7
Results of the Descriptive Statistics and the Independent Samples t-Test Related to
PPrS and Degree of Education
Group n x SD df t p
Undergraduate 89 56.65 6.96 138 -1.64 .314
Post-Graduate 51 58.53 5.63
As seen in Table 7, there were no statistically significant difference between
the mean scores on the PPrS of English instructors’ who have undergraduate and
post-graduate degrees groups, t(138) = -1.64, p = .314 > .05. These results indicated
that the degree that these NNESTs hold does not affect their ideas about teaching
pronunciation in their classes. In other words, the NNESTs are already aware of the
importance of teaching pronunciation regardless of the further education they had.
The same analysis was conducted to see if NNESTs’ levels of scores on the
Pronunciation Self Perception Scale (SPS) change depending on their degree of
education. The data on the SPS of English instructors’ undergraduate and post-
graduate groups were computed using the Independent Samples t-Test. The results of
the descriptive statistics and the Independent Samples t-Test are given in Table 8.
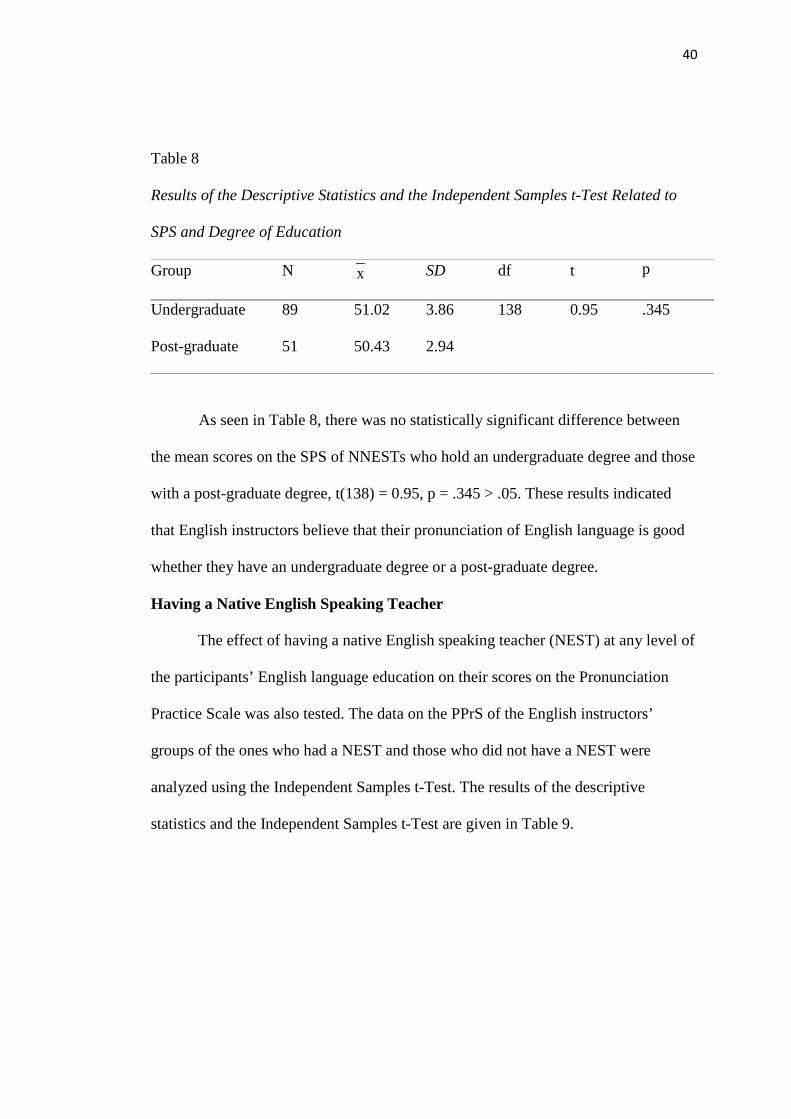
40
Table 8
Results of the Descriptive Statistics and the Independent Samples t-Test Related to
SPS and Degree of Education
Group N x SD df t p
Undergraduate 89 51.02 3.86 138 0.95 .345
Post-graduate 51 50.43 2.94
As seen in Table 8, there was no statistically significant difference between
the mean scores on the SPS of NNESTs who hold an undergraduate degree and those
with a post-graduate degree, t(138) = 0.95, p = .345 > .05. These results indicated
that English instructors believe that their pronunciation of English language is good
whether they have an undergraduate degree or a post-graduate degree.
Having a Native English Speaking Teacher
The effect of having a native English speaking teacher (NEST) at any level of
the participants’ English language education on their scores on the Pronunciation
Practice Scale was also tested. The data on the PPrS of the English instructors’
groups of the ones who had a NEST and those who did not have a NEST were
analyzed using the Independent Samples t-Test. The results of the descriptive
statistics and the Independent Samples t-Test are given in Table 9.
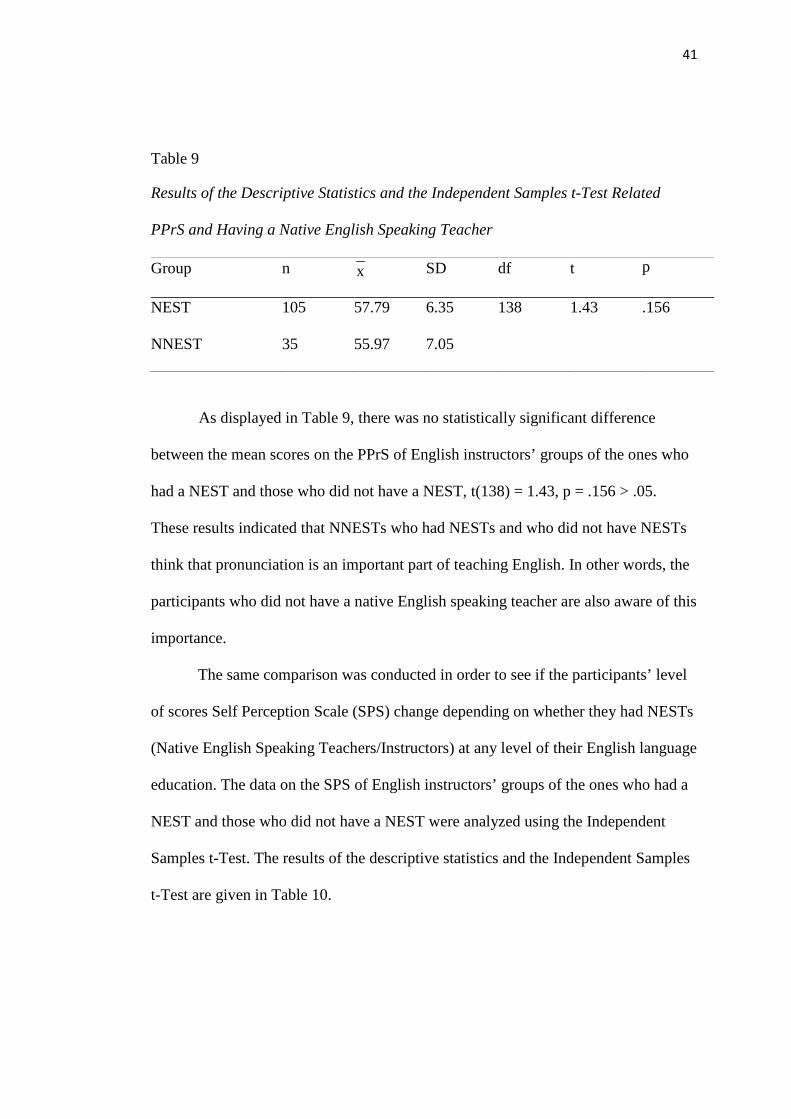
41
Table 9
Results of the Descriptive Statistics and the Independent Samples t-Test Related
PPrS and Having a Native English Speaking Teacher
Group n x SD df t p
NEST 105 57.79 6.35 138 1.43 .156
NNEST 35 55.97 7.05
As displayed in Table 9, there was no statistically significant difference
between the mean scores on the PPrS of English instructors’ groups of the ones who
had a NEST and those who did not have a NEST, t(138) = 1.43, p = .156 > .05.
These results indicated that NNESTs who had NESTs and who did not have NESTs
think that pronunciation is an important part of teaching English. In other words, the
participants who did not have a native English speaking teacher are also aware of this
importance.
The same comparison was conducted in order to see if the participants’ level
of scores Self Perception Scale (SPS) change depending on whether they had NESTs
(Native English Speaking Teachers/Instructors) at any level of their English language
education. The data on the SPS of English instructors’ groups of the ones who had a
NEST and those who did not have a NEST were analyzed using the Independent
Samples t-Test. The results of the descriptive statistics and the Independent Samples
t-Test are given in Table 10.
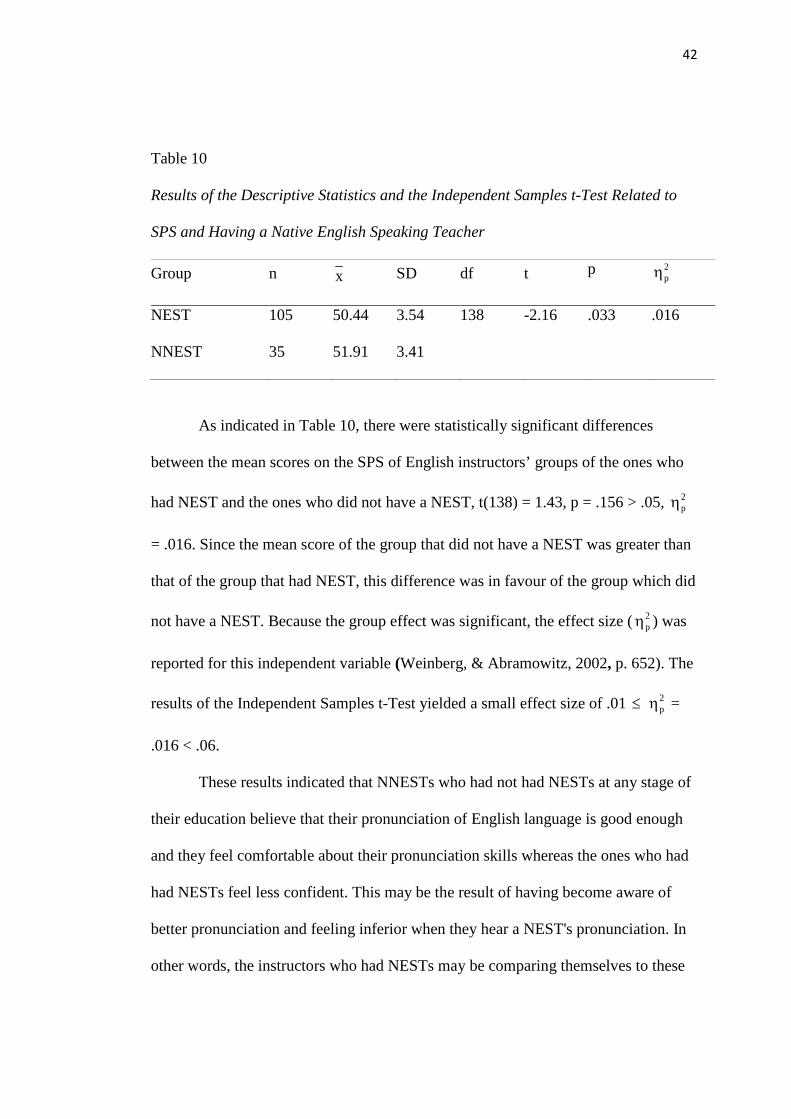
42
Table 10
Results of the Descriptive Statistics and the Independent Samples t-Test Related to
SPS and Having a Native English Speaking Teacher
Group n x SD df t p 2pη
NEST 105 50.44 3.54 138 -2.16 .033 .016
NNEST 35 51.91 3.41
As indicated in Table 10, there were statistically significant differences
between the mean scores on the SPS of English instructors’ groups of the ones who
had NEST and the ones who did not have a NEST, t(138) = 1.43, p = .156 > .05, 2pη
= .016. Since the mean score of the group that did not have a NEST was greater than
that of the group that had NEST, this difference was in favour of the group which did
not have a NEST. Because the group effect was significant, the effect size ( 2pη ) was
reported for this independent variable (Weinberg, & Abramowitz, 2002, p. 652). The
results of the Independent Samples t-Test yielded a small effect size of .01 ≤ 2pη =
.016 < .06.
These results indicated that NNESTs who had not had NESTs at any stage of
their education believe that their pronunciation of English language is good enough
and they feel comfortable about their pronunciation skills whereas the ones who had
had NESTs feel less confident. This may be the result of having become aware of
better pronunciation and feeling inferior when they hear a NEST's pronunciation. In
other words, the instructors who had NESTs may be comparing themselves to these
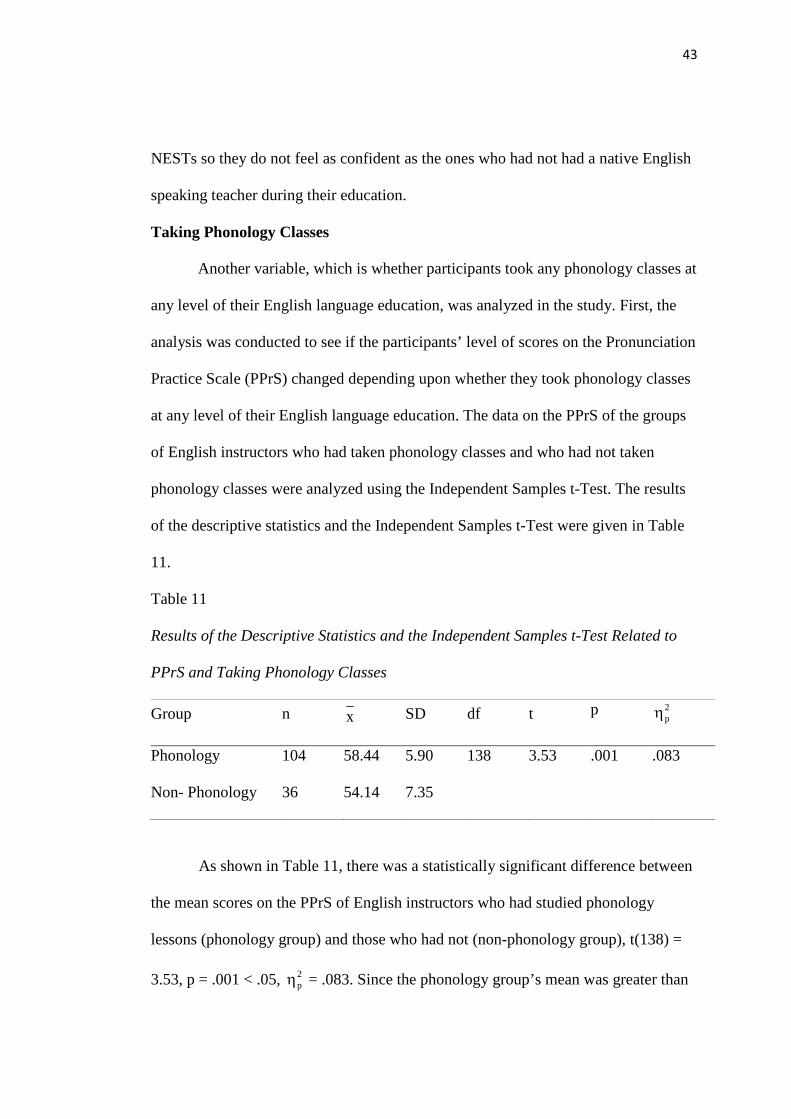
43
NESTs so they do not feel as confident as the ones who had not had a native English
speaking teacher during their education.
Taking Phonology Classes
Another variable, which is whether participants took any phonology classes at
any level of their English language education, was analyzed in the study. First, the
analysis was conducted to see if the participants’ level of scores on the Pronunciation
Practice Scale (PPrS) changed depending upon whether they took phonology classes
at any level of their English language education. The data on the PPrS of the groups
of English instructors who had taken phonology classes and who had not taken
phonology classes were analyzed using the Independent Samples t-Test. The results
of the descriptive statistics and the Independent Samples t-Test were given in Table
11.
Table 11
Results of the Descriptive Statistics and the Independent Samples t-Test Related to
PPrS and Taking Phonology Classes
Group n x SD df t p 2pη
Phonology 104 58.44 5.90 138 3.53 .001 .083
Non- Phonology 36 54.14 7.35
As shown in Table 11, there was a statistically significant difference between
the mean scores on the PPrS of English instructors who had studied phonology
lessons (phonology group) and those who had not (non-phonology group), t(138) =
3.53, p = .001 < .05, 2pη = .083. Since the phonology group’s mean was greater than
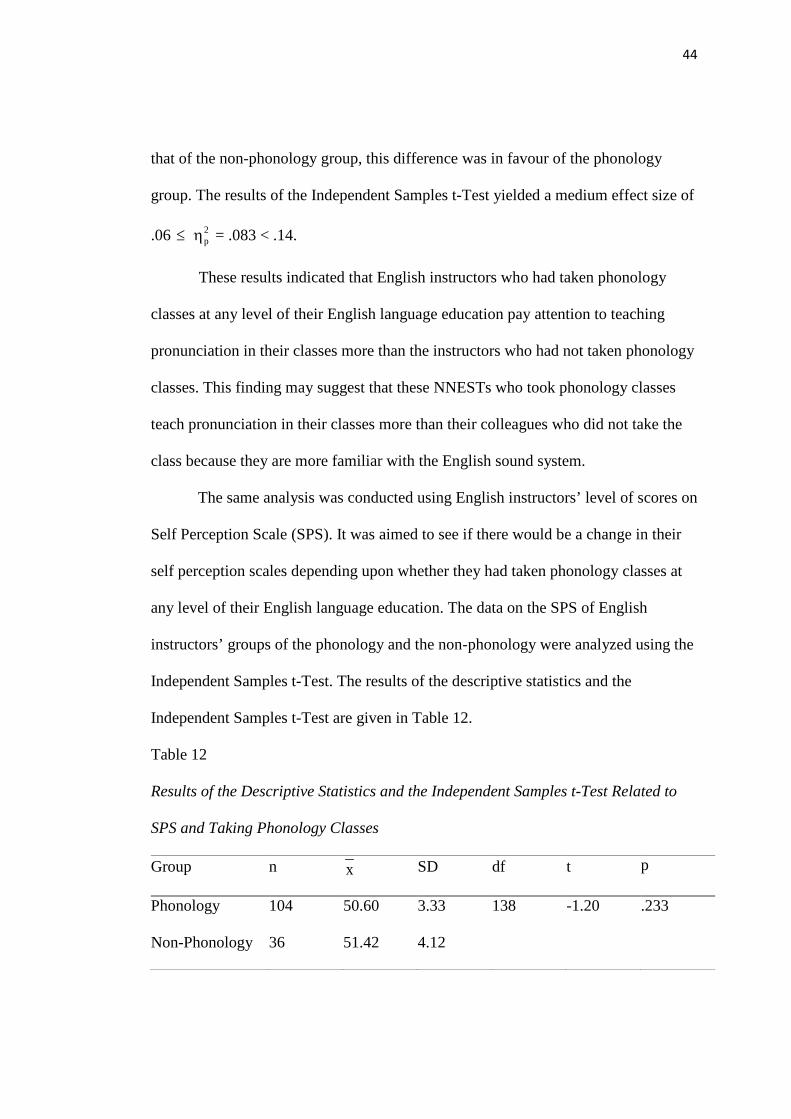
44
that of the non-phonology group, this difference was in favour of the phonology
group. The results of the Independent Samples t-Test yielded a medium effect size of
.06 ≤ 2pη = .083 < .14.
These results indicated that English instructors who had taken phonology
classes at any level of their English language education pay attention to teaching
pronunciation in their classes more than the instructors who had not taken phonology
classes. This finding may suggest that these NNESTs who took phonology classes
teach pronunciation in their classes more than their colleagues who did not take the
class because they are more familiar with the English sound system.
The same analysis was conducted using English instructors’ level of scores on
Self Perception Scale (SPS). It was aimed to see if there would be a change in their
self perception scales depending upon whether they had taken phonology classes at
any level of their English language education. The data on the SPS of English
instructors’ groups of the phonology and the non-phonology were analyzed using the
Independent Samples t-Test. The results of the descriptive statistics and the
Independent Samples t-Test are given in Table 12.
Table 12
Results of the Descriptive Statistics and the Independent Samples t-Test Related to
SPS and Taking Phonology Classes
Group n x SD df t p
Phonology 104 50.60 3.33 138 -1.20 .233
Non-Phonology 36 51.42 4.12
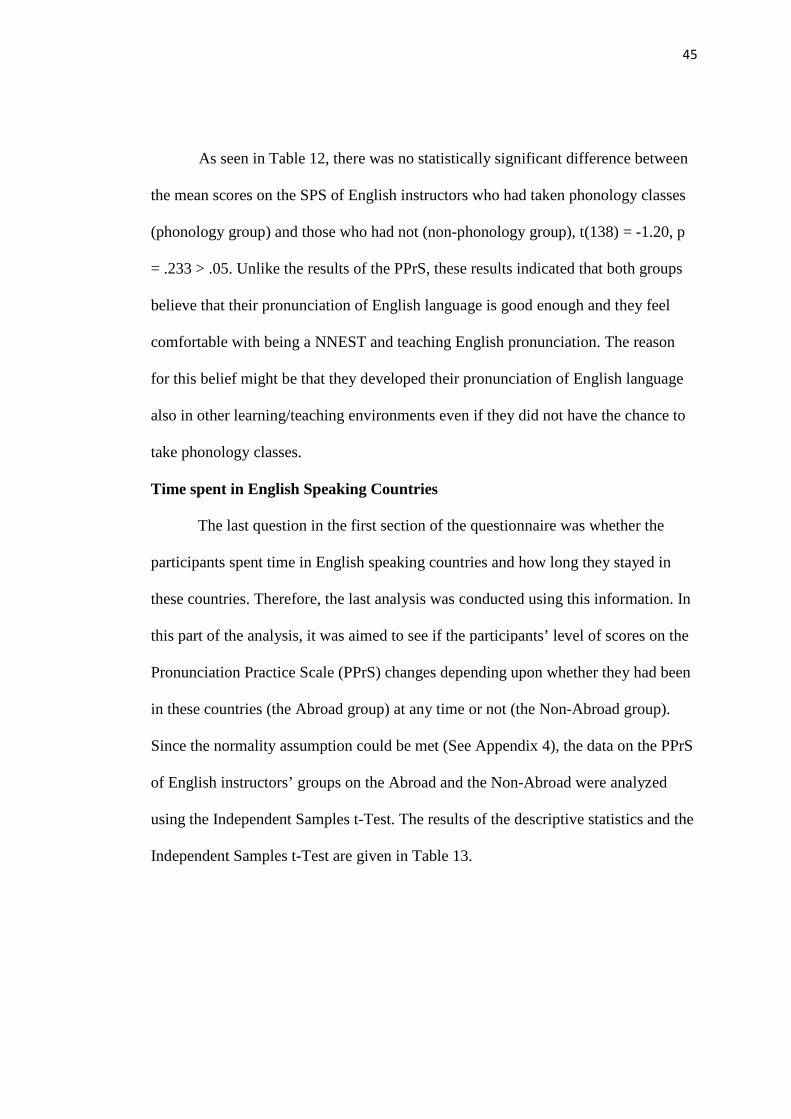
45
As seen in Table 12, there was no statistically significant difference between
the mean scores on the SPS of English instructors who had taken phonology classes
(phonology group) and those who had not (non-phonology group), t(138) = -1.20, p
= .233 > .05. Unlike the results of the PPrS, these results indicated that both groups
believe that their pronunciation of English language is good enough and they feel
comfortable with being a NNEST and teaching English pronunciation. The reason
for this belief might be that they developed their pronunciation of English language
also in other learning/teaching environments even if they did not have the chance to
take phonology classes.
Time spent in English Speaking Countries
The last question in the first section of the questionnaire was whether the
participants spent time in English speaking countries and how long they stayed in
these countries. Therefore, the last analysis was conducted using this information. In
this part of the analysis, it was aimed to see if the participants’ level of scores on the
Pronunciation Practice Scale (PPrS) changes depending upon whether they had been
in these countries (the Abroad group) at any time or not (the Non-Abroad group).
Since the normality assumption could be met (See Appendix 4), the data on the PPrS
of English instructors’ groups on the Abroad and the Non-Abroad were analyzed
using the Independent Samples t-Test. The results of the descriptive statistics and the
Independent Samples t-Test are given in Table 13.
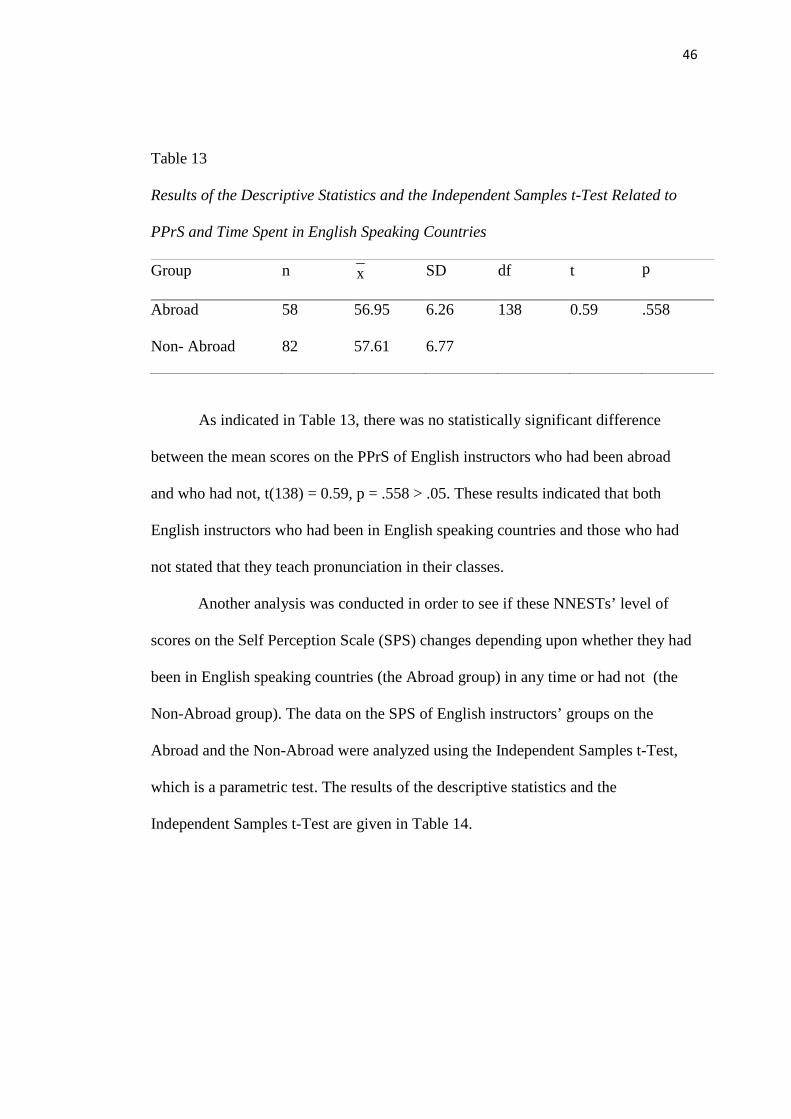
46
Table 13
Results of the Descriptive Statistics and the Independent Samples t-Test Related to
PPrS and Time Spent in English Speaking Countries
Group n x SD df t p
Abroad 58 56.95 6.26 138 0.59 .558
Non- Abroad 82 57.61 6.77
As indicated in Table 13, there was no statistically significant difference
between the mean scores on the PPrS of English instructors who had been abroad
and who had not, t(138) = 0.59, p = .558 > .05. These results indicated that both
English instructors who had been in English speaking countries and those who had
not stated that they teach pronunciation in their classes.
Another analysis was conducted in order to see if these NNESTs’ level of
scores on the Self Perception Scale (SPS) changes depending upon whether they had
been in English speaking countries (the Abroad group) in any time or had not (the
Non-Abroad group). The data on the SPS of English instructors’ groups on the
Abroad and the Non-Abroad were analyzed using the Independent Samples t-Test,
which is a parametric test. The results of the descriptive statistics and the
Independent Samples t-Test are given in Table 14.
47
Table 14
Results of the Descriptive Statistics and the Independent Samples t-Test Related to
SPS and Time Spent in English Speaking Countries
Group n x SD df t p 2pη
Abroad 58 49.90 3.64 138 2.60 .010 .047
Non- Abroad 82 51.45 3.36
As demonstrated in Table 14, there were statistically significant differences
between the mean scores on the SPS of English instructors who had been in English
speaking countries and who had not, t(138) = 2.60, p = .010 < .05. Since the non-
abroad group’s mean was greater than that of the abroad group, this difference was in
favour of the non-abroad group. Because the group effect was significant, the effect
size ( 2pη ) was reported for this independent variable (Weinberg, & Abramowitz,
2002, p. 652).
These results indicated that English instructors who had not been in English
speaking countries believe that their pronunciation of English language is good when
compared to the results of the ones who had been in these countries. In other words,
NNESTs who had not been in English speaking countries feel comfortable about
their pronunciation skills but their colleagues who had been in English speaking
countries do not think so about their own pronunciation skills. This may be the result
of the fact that these NNESTs feel comfortable because they did not have the chance
to see the difference between their own pronunciation skills and the native speakers’.
In that sense, they are confident about their own pronunciation when they compare
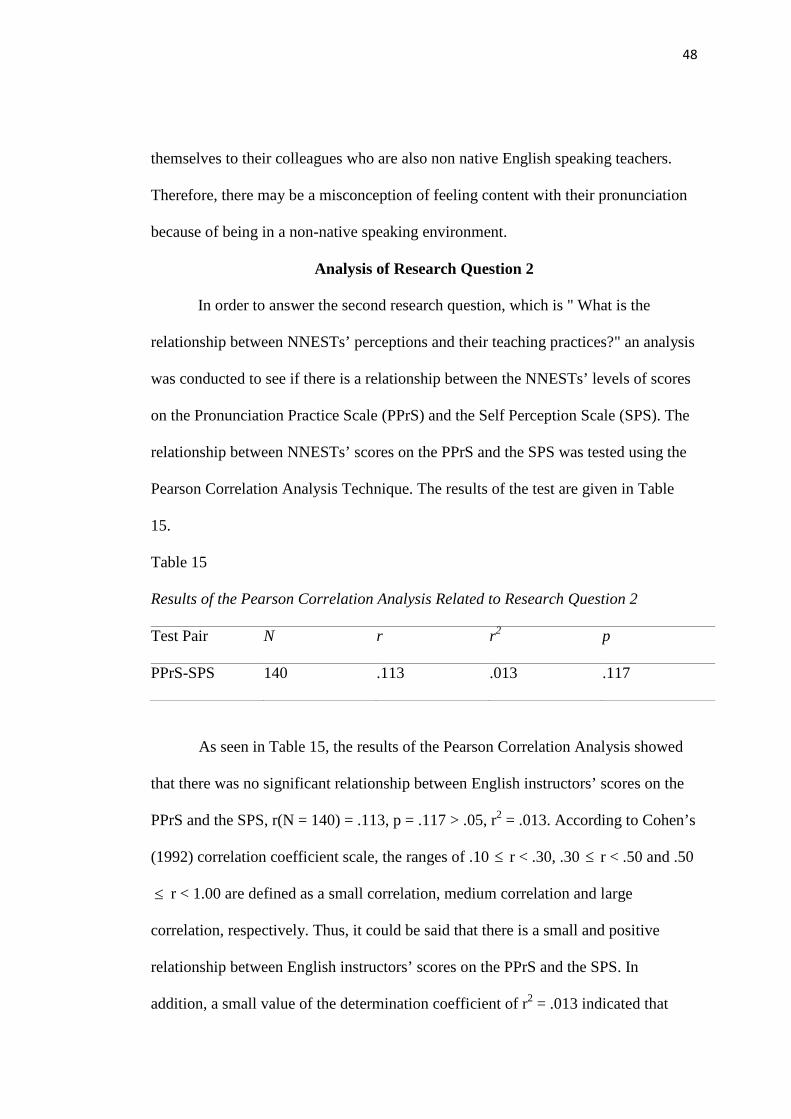
48
themselves to their colleagues who are also non native English speaking teachers.
Therefore, there may be a misconception of feeling content with their pronunciation
because of being in a non-native speaking environment.
Analysis of Research Question 2
In order to answer the second research question, which is " What is the
relationship between NNESTs’ perceptions and their teaching practices?" an analysis
was conducted to see if there is a relationship between the NNESTs’ levels of scores
on the Pronunciation Practice Scale (PPrS) and the Self Perception Scale (SPS). The
relationship between NNESTs’ scores on the PPrS and the SPS was tested using the
Pearson Correlation Analysis Technique. The results of the test are given in Table
15.
Table 15
Results of the Pearson Correlation Analysis Related to Research Question 2
Test Pair N r r2 p
PPrS-SPS 140 .113 .013 .117
As seen in Table 15, the results of the Pearson Correlation Analysis showed
that there was no significant relationship between English instructors’ scores on the
PPrS and the SPS, r(N = 140) = .113, p = .117 > .05, r2 = .013. According to Cohen’s
(1992) correlation coefficient scale, the ranges of .10 ≤ r < .30, .30 ≤ r < .50 and .50
r < 1.00 are defined as a small correlation, medium correlation and large
correlation, respectively. Thus, it could be said that there is a small and positive
relationship between English instructors’ scores on the PPrS and the SPS. In
addition, a small value of the determination coefficient of r2 = .013 indicated that
≤
49
NNETs’ scores on the PPrS and the SPS explained only 1.3 percent of the variation
on each other. Yet, these results are not significant which means it might have
occurred by chance.
These results indicated that there is no relationship between English
instructors’ scores on the PPrS and their scores on the SPS. In other words, an
English instructor's self perception of pronunciation skills has no relation with his /
her classroom practices.
Conclusion
This study examined the NNESTs’ self perceptions of their pronunciation
skills and their pronunciation teaching practices in their classes. A five-point Likert
Scale questionnaire was given to 140 NNESTs in four different universities and a
number of t-tests and correlations were carried out. This chapter presented the
analyses of the questionnaire in detail. The next chapter will discuss the findings,
reflect on limitations of the study and provide ideas for further research.
50
CHAPTER V: CONCLUSION
Introduction
This study investigated the non-native English speaking teachers' (NNEST)
perceptions of their own pronunciation skills, their styles of teaching pronunciation
as NNEST, and the relationship between their pronunciation teaching styles and their
self-perceptions. Their perceptions and teaching styles were also examined together
with the following five factors; 1) Teaching Experience, 2) Degree of Education, 3)
Having a Native English Speaking Teacher, 4) Taking Phonology Classes, and 5)
Time Spent in English Speaking Countries. In this respect, the study attempted to
answer the following research questions:
1. What are the NNESTs’ perceptions of teaching pronunciation as a non
native English speaker?
1.1. Is there a significant difference between teachers’ reported practice
of teaching pronunciation and these factors separately: their years of
experience, their degree of education, whether or not they had a native
English speaking teacher, whether or not they took phonology classes,
and the time they spent in English speaking countries?
1.2. Is there a significant difference between teachers’ self-perceptions
of pronunciation and these factors separately: their years of experience,
their degree of education, whether or not they had a native English
speaking teacher, whether or not they took phonology classes, and the
time they spent in English speaking countries?
2. What is the relationship between NNESTs’ perceptions of their own
pronunciation and their reported teaching practices?
51
This chapter will present the findings and discussion, the implications as well
as the limitations of the study, and suggestions for further research.
Findings and Discussion
The statements in the questionnaire were classified into two main groups:
statements that refer to self-perceptions (SPS) and the statements that refer to
pronunciation practices (PPrS) of the participants. These two main groups were
analyzed according to the first part of the questionnaire which included background
information of the participants, namely, their teaching experience, their degree of
education, whether or not they had ever had a native English speaking teacher,
whether or not they had ever taken phonology classes and whether or not they had
ever been in an English speaking country.
In order to see if there is a relationship between the participants’ years of
experience and their pronunciation teaching practices, the participants were
categorized into four main groups according to the years of teaching experience (1-5
years, 6-10 years, 11-15, 16 and more). When the participants’ responses to the PPrS
statements were analyzed in relation to their years of experience, the results indicated
no statistically significant difference among the groups. The results revealed that
both the experienced and novice NNESTs pay attention to teaching pronunciation in
their classrooms. The same result was also observed in the analysis of the self-
perception scale (SPS). The responses to the SPS statements indicated that both
experienced and inexperienced non-native speaking English teachers feel
comfortable with their own pronunciation. However, among the groups, there was a
statistical difference between the 1-5 years group and 11-15 years group (p = .022).
The results of these two groups showed that the 1-5 years group is more confident
52
about being a NNEST and their own pronunciation skills. This result is in line with
Rajagopalan’s (2005) findings in which experienced NNESTs were more worried
about being a non-native teacher than their less experienced colleagues. One
probable reason for this finding can be that being experienced means being exposed
to more challenges about pronunciation in or outside of the classroom over time
when compared to their less experienced colleagues. The challenges awaiting a new
teacher may lead to a decrease in the level of self-confidence about one's
pronunciation skills.
As far as the participants’ degree of education and its relationship to their
practice of teaching pronunciation are concerned, the results indicated that regardless
of the degree that NNESTs hold (undergraduate or post graduate degrees), they all
pay attention to teaching pronunciation in their classes and feel comfortable about
teaching pronunciation as non-native teachers of English. The participants did not
show any signs of lack of confidence in terms of their own pronunciation skills as
well. This may be an indicator that the perceptions of these NNESTs and their
pronunciation teaching practice skills do not develop or change during their
education periods. In that, these NNESTs already have their own terms about
teaching pronunciation and their perceptions do not change in time according to the
further education they receive such as a graduate degree. When Bradford and
Kenworthy's study (1991) is considered in which the participants stated that the
pronunciation and phonology had been almost neglected in their training courses at
the graduate level, it can be concluded that most teachers do not get sufficient
training in their graduate level; therefore, they build their own ways of teaching
pronunciation (as cited in Lambacher, 2001). Moreover, the results also support
53
Levis's (2005) claim that the importance of pronunciation has been based on the
intuition of most teachers who decide what to teach by considering what is learnable
in a classroom setting.
The factor of whether the NNESTs had ever had a native English speaking
instructor throughout their education at any level revealed an interesting finding.
According to the results, the NNESTs who had not had the chance to be taught by a
native English speaking instructor displayed more confidence about their own
pronunciation skills when compared to the ones who had had native English
speaking instructors. These results may be interpreted with the help of Liu's (1999)
study which focused on the perception of the participants who worked in a major
university in U.S. in terms of whether they see themselves as native or non-native
speakers of English. Some of Liu's (1999) participants described themselves as
NNESTs, but according to Liu's (1999) description they spoke English like native
speakers. Both of these participants had received an MA degree in the U.S. from
which it can be concluded that they had at least one NEST throughout their
education. In addition, before going to the U.S., both of the participants were first
exposed to English in EFL contexts. In short, like the participants of the current
study, Liu's (1999) participants had the chance to compare themselves with native
English speakers and they did not think they were at the same level with them. Still,
the perceptions of the participants in Liu's (1999) study may also be the result of
being in a country where English is the first language (L1) rather than simply having
had a native English speaking instructor. Despite this significant difference in
NNESTs's confidence in pronunciation, the results of the pronunciation practice
54
scale (PPrS) revealed that having a native English speaking instructor or not does not
relate to the participants' teaching practices in their classrooms.
When the participants' responses were analyzed according to whether they
had taken phonology classes or not at any level of their English language education,
the results indicated that instructors who had taken phonology classes pay more
attention to teaching pronunciation than their colleagues who had not had the chance
to take phonology classes. In that sense, the results concur with the literature. For
instance, Macdonald's study (2002) indicated that some of the participants in his
study were reluctant to teach pronunciation not only because they do not like
teaching it but also because they had not received any previous training on teaching
it. While Macdonald (2002) mainly focused on the pedagogical training on teaching
pronunciation, taking phonology classes as part of professional development could
have some positive effects on teachers. This way, the NNESTs could have more self
confidence about teaching pronunciation and learning how to teach pronunciation.
The results of the current study indicated that taking phonology classes can
positively affect teachers' willingness to teach pronunciation in their classes.
However, the participants' self-perception results did not reveal any difference; in
other words, both groups see their own pronunciation skills as being good enough
and they are self-confident with respect to their own pronunciation skills as NNESTs.
As for the last factor, which was whether the participants had been in an
English speaking country or not, there was no statistically significant difference in
their results on the teaching practice scale (PPrS). Both groups' results indicated that
they pay attention to teaching pronunciation in their classes. However, their results
on the self-perception scale (SPS) showed significant differences. The participants
55
who stated that they had been in an English speaking country are not as comfortable
with their own pronunciation skills when compared to the other group which has not
been abroad. This finding concurs with Arva and Medgyes's (2000) study which
found that despite having been to English speaking countries, the participants stated
that they have problems with competence, especially with pronunciation, vocabulary
and colloquial expressions. Even the non-native participants of Kamhi-Stein, Aagard,
Ching, Paik, and Sesser's study (2004), most of whom had lived in the US for more
than ten years, stated that their pronunciation skills were their weakest feature of
their English (as cited in Braine, 2010). This result is also in line with the findings of
having a native English speaking instructor factor, as in both cases, the participants
who somehow had the chance to communicate with native English speakers and
compare themselves to the native speakers of the language are more aware of their
deficiencies when compared to the ones who did not have this chance. The
participants who had not been to English speaking countries, therefore, may have a
higher confidence rate because of the fact that they mostly experience a NNES-
NNES communication. However, this higher confidence rate may also be interpreted
as their being exposed to a variety of resources rather than only communicating with
the native speakers of the language. These results indicate that the participants of this
study match with Medgyes' (1992) description of the ideal NNEST, as he states that
an ideal NNEST is the one who achieved near-native proficiency in English and the
participants of this study revealed that they do not seem pleased with their own
pronunciation skills, and they feel that they still need some improvement in terms of
pronunciation in order to achieve near-native proficiency.
56
Concerning the relationship between the self-perceptions of the NNESTs and
their classroom practices, the results of this study showed there was no significant
relationship between the classroom practices of the participants and their self-
perceptions about pronunciation. This finding contradicts with Kelly's (2001) claim
that pronunciation is a neglected part of English because most of the teachers are not
comfortable with dealing with the sounds and intonation. According to this result,
one can infer that however the instructors feel about their own pronunciation skills,
their self perceptions do not have any effect on their pronunciation teaching
practices. The result also contradicts with Samimy and Griffler's (1999) results in
which most of the participants stated that their difficulties with language affected
their classroom practices (as cited in Braine, 2010).
The results of the study did not reveal far different results than those that
already existed in the literature. The overall picture of NNESTs in this study is that
teachers' years of experience and their degree of education do not have a negative
effect on their self-perceptions and their teaching practices except for two groups out
of four which had different results in the teaching experience year analysis where the
teachers with 1-5 years of experience had a higher score on self-perception scale
when compared to the teachers with 11-15 years of experience. This is an expected
result when Rajagapolan’s (2005) findings are considered in which experienced
NNESTs felt less confident about being a NNEST when compared to their more
junior colleagues.
On the other hand, having a native English speaking instructor, taking
phonology classes and spending time in English speaking countries can affect
NNESTs' perceptions and their teaching practices. In terms of self-perception, having
57
a native English speaking teacher and spending time in English speaking countries
affect the self-perceptions of the NNESTs as the participants who had had a NEST
and been in English speaking countries showed a lower self-confidence rate about
their own pronunciation skills. This result is in line with Medgyes and Reves's study
(1994) in which they suggested that NNESTs who had been in frequent contact with
native speakers perceived their own command of English relatively low, and this
perception may be the result of the participants' judging their own command of
English more severely because of this frequent contact. In terms of classroom
practices, the only difference was seen in the analysis of taking phonology classes.
The results of the responses provided by the participants who claimed to have taken
phonology classes indicated that these NNESTs pay more attention to teaching
pronunciation in their classes. This result also adds on and contributes to Wong's
(1993) explanation which shows that it is possible to reduce the anxiety of NNESTs
about teaching pronunciation if these teachers become educated in teaching
pronunciation. Moreover, the results are also in line with Macdonald's study (2002)
in which he claims that in order to teach pronunciation confidently, effectively and
more often, NNESTs need ongoing development.
Pedagogical Implications of the Study
The results of the current study suggest considerably important implications
to the issue of NESTs and NNESTs. Regarding self-perceptions, NNESTs in
preparatory schools of universities are not affected by their degree of education and /
or their years of experience. The NNESTs felt comfortable in teaching the language
in general and teaching pronunciation in particular; therefore, there is no need to
favour NESTs for only speaking English as their first languages.
58
As for the classroom practices aspect of this study, results indicated that
taking phonology classes has a positive effect on NNESTs and they pay more
attention to teaching pronunciation when compared to their colleagues who did not
take such courses. If taking phonology classes has such a positive effect on teaching
pronunciation, then NNESTs should be encouraged to take these classes and some
courses which only deal with phonology and pronunciation should be added in
teacher training programmes. Moreover, in-service training should also be provided
specific to the needs of these NNESTs. As Braine (2010) states, low levels of
proficiency or fluency are not enough for language teachers as the teachers are not
only the users of the language but also its teachers and role models for students.
Training and encouraging professional development in terms of language proficiency
in general, pronunciation in particular should be the starting point for the NNESTs in
Turkey. If knowledge of phonology is considered to be one of the two especially
important factors for teaching pronunciation (Baker & Murphy, 2011), then it can be
concluded that NNESTs in prep schools of Turkey should be trained well in this area
before learning the other important factor, which is the techniques and approaches
for teaching pronunciation. Moreover, the institutions which believe that
pronunciation teaching should be emphasized more in EFL should consider re-
designing their curriculum accordingly. Phonology courses should also be included
in BA and MA programs of ELT departments in order to prepare English language
teachers who are interested in pronunciation teaching in a professional manner.
As Jenkins (2004) stated, nowadays pronunciation teaching research has been
focusing on supersegmental features as well as the segmental features. Jenkins
(2004) also indicated that pronunciation is not treated to be an isolated linguistic
59
phenomenon any more, on the contrary, it is linked to the other aspects of language
and language teaching by many researchers. Considering this change, administrators
of the intensive language programs may consider designing curriculum which neither
excludes pronunciation teaching as a whole nor focuses on segmental levels too
much. According to Jenkins (2004), research on English as an International
Language (EIL) also suggests that pronunciation is an important factor that prevents
breakdowns in communication between speakers, and the intelligibility of a NNS-
NNS communication is elevated by pronunciation. In light of this information,
institutions and administrators may evaluate how much emphasis they should put on
pronunciation and which parts of pronunciation are important for an intelligible
communication; therefore, the results of this study may help the institutions and
administrators create or re-organise their curriculum in line with their decisions.
Considering the relationship between the self-perceptions of the NNESTs and
their classroom practices, the results of the study showed that there was no
significant relationship between the self perceptions of the participants and their
classroom practices. According to Medgyes (1992), there is more than language
competence to define a NEST superior to his / her NNEST colleague. Therefore,
having more or less confidence about language competency, pronunciation in this
case, should not be related to the NNESTs' teaching practices and they should not be
defined as inferior to their NEST colleagues in these terms. The results of this study
indicated that factors other than the self perceptions of the NNESTs about their
pronunciation skills should be considered as the factors that affect the reported
classroom practices of the NNESTs. Furthermore, the comparison of NEST vs.
NNEST should be reconsidered as the results showed that NNESTs put as much
60
effort as they can in their classes regardless of their self-perceptions of pronunciation
skills.
Limitations of the Study
The aim of the study was to examine non native English speaking teachers'
(NNEST) self-perceptions of being non-native and their own pronunciation skills and
the relationship between their perceptions and their teaching practices. The study was
conducted in four different universities in Ankara, Turkey. If the time and resources
had been available to reach other universities in Turkey, the study could have
explained the situation of NNESTs in prep schools of universities in Turkey more
clearly.
If an in-depth interview session had been conducted with at least five
participants whose scores on the questionnaire had differed, it could have given
more information about the participants' preferences and given the researcher the
chance to explain the results in light of these findings. Classroom observations would
also have been a good support to the results and would have given the researcher the
chance to compare the reported behaviour with their actual behaviour (Arva &
Medgyes, 2000). However, time constraints prevented the researcher from doing
either.
Suggestions for Further Research
The study was limited to the data gathered through questionnaires since due
to time constraints it was not possible to conduct a classroom observation or an in-
depth interview session. This study could be enlarged with classroom observations or
in-depth interview sessions. It could also include more instructors from different
61
universities in different cities of Turkey to get a clearer picture of Turkish non-native
English speaking instructors' perceptions and practices.
Moreover, the questionnaire could be revised and expanded with more
statements and more factors to be analyzed such as age and/or gender of the
participants, which part of the pronunciation teaching is more difficult or easier for
them to teach. As much of the literature focused on the NEST vs. NNESTs also from
the students' perspectives, it is also possible to include students' ideas about their
NNESTs in an environment which does not include native English speaking teachers.
Seeing the students' perspectives and getting their ideas about their teachers could
also provide more information for both the NNESTs and the institutions.
Conclusion
The study attempted to shed light onto NNESTs' self-perceptions and
classroom practices of teaching pronunciation in an environment which does not
include native English speaking colleagues. The results showed that only interaction
with the native English speakers (having a native English speaking teacher and
spending time in English speaking countries) affect the self-perception of the
NNESTs, which also supports the literature which compare native English speaking
teachers to non-native English speaking teachers working in the same institution
(Arva & Medgyes, 2000; Ezberci, 2005; Ozturk & Atay, 2010; Tang, 1997) where,
the NNESTs feel less confident when they compare themselves to their native
English speaking colleagues.
Being a non native speaker is a challenge to all language instructors
especially while teaching pronunciation. Additionally, there are so many different
factors that affect NNESTs' motivation to teach pronunciation and their level of

62
confidence in their own pronunciation skills. However, the NNESTs can both benefit
from being a NNEST while teaching English as a foreign language and provide the
necessary pronunciation training in their classes by either receiving some training
particularly in pronunciation teaching or learning how to deal with their self
perceptions of pronunciation which hinder their pronunciation teaching.
63
REFERENCES
Al-Omrani, A. H. (2008). Perceptions and attitudes of Saudi ESL and EFL students
toward native and nonnative English-speaking teachers. (Doctoral dissertation).
Retrieved from ProQuest Dissertations and Theses databese. (UMI No.
3303340).
Altun-Evci, H. (2010). International English teachers' perceptions of English as an
international language (Master's thesis). Retrieved from
http://www.thesis.bilkent.edu.tr/0003966.pdf.
Baker, A. A., & Murphy, J. (2011). Knowledge base of pronunciation teaching:
staking out the territory. TESL Canada Journal, 28(2), 29–50.
Benke, E., & Medgyes, P. (2005). Differences in teaching behaviour between native
and non-native speaker teachers: As seen by the learners. In E. Llurda (Ed.),
Non-native language teachers: Perceptions, challenges and contributions to the
profession (pp. 195-215). New York, NY: Springer.
Braine, G. (2005). A history of research on non-native speaker English teachers. In
E. Llurda (Ed.), Non-native language teachers. Perceptions, challanges and
contributions to the profession (pp. 13–23). New York, NY: Springer.
Braine, G. (2010). Nonnative speaker English teachers: Research, pedagogy, and
professional growth. New York, NY: Routledge.
Brutt-Griffler, J., & Samimy, K. K. (1999). Revisiting the Colonial in the
Postcolonial: Critical praxis for nonnative-English-speaking teachers in a
TESOL Program. TESOL Quarterly, 33(3), 413–431.
Chiu, H. H. W. (2008). Practical understandings: Teachers' beliefs and practices in
pronunciation teaching (Master's thesis). Retrieved from
64
http://dspace.uta.edu/bitstream/handle/10106/1651/Chiu_uta_2502M_10027.pdf.
Choi, S. J. (2007). The experiences of non-native English speaking teachers and their
professional identity constructions in an ESL context (Doctoral dissertation).
Retrieved from ProQuest Dissertations and Theses database. (UMI No.
3301115).
Clark, E., & Paran, A. (2007). The employability of non-native-speaker teachers of
EFL: A UK survey. System, 35, 407–430. doi:10.1016/j.system.2007.05.002.
Cook, V. (1999). Going beyond the native speaker in language teaching. TESOL
Quarterly, 33(2), 185–209.
Derwing, T., & Munro, M. (2005). Second language accent and pronunciation
teaching: A research based approach. TESOL Quarterly, 39(3), 379–397.
doi:10.2307/3588486
Ezberci, E. (2005). Native English speaking teachers and non-native English
speaking teachers in Istanbul: A perception analysis (Master's thesis). Retrieved
from http://www.thesis.bilkent.edu.tr/0002851.pdf.
Hayes, D. (2009). Non-native English-speaking teachers, context and English
language teaching. System, 37(1), 1–11. doi:10.1016/j.system.2008.06.001.
Hui-Wen, C. (2009). An Examination of the personal, socio-cultural, language
learning and professional experiences that influence Taiwanese English
cultural as foreign language teachers’ identities (Doctoral dissertation).
Retrieved from ProQuest Dissertations and Theses database. (UMI No.
3360678).
65
Jenkins, J. (2005). Implementing an international approach to English pronunciation:
The role of teacher attitudes and identity. TESOL Quarterly, 39(3), 535–543.
Retrieved from http://onlinelibrary.wiley.com/doi/10.2307/3588493/abstract.
Kelly, G. (2000). How to teach pronunciation. Essex: Pearson Education Limited.
Kim, E.-Y. (2009). Do non-native speakers make good ESL teachers? The Journal of
Adventist Education, 40–42.
Lambacher, S. (2001). A brief guide to resources for developing expertise in the
teaching of pronunciation. Prospect, 16(1), 63–70.
Lasagabaster, D., & Sierra, J. M. (2002). University students’ perceptions of native
and non-native speaker teachers of English. Language Awareness, 11(2), 132–
142. doi:10.1080/09658410208667051.
Lee, J. (2010). Nonnative English-speaking teachers’ experiences and their pedagogy
in the ESL classroom. WATESOL NNEST Caucus Annual Review, 1, 22–42.
Levis, J. M. (2005). Changing contexts and shifting paradigms in pronunciation
teaching. TESOL Quarterly, 39(3), 369–377. doi:10.2307/3588485.
Ling, C. Y., & Braine, G. (2007). The attitudes of university students towards non-
native speakers English teachers in Hong Kong. RELC Journal, 38(3), 257–277.
doi:10.1177/0033688207085847.
Liu, J. (1999). Nonnative English speaking professionals in TESOL. TESOL
Quarterly, 33(1), 85–102. Retrieved from
http://onlinelibrary.wiley.com/doi/10.2307/3588192.
Llurda, E. (2005). Non-native language teachers perceptions, challenges and
contributions to the profession. New York, USA: Springer.
66
Macdonald, S. (2002). Pronunciation:Views and practices of reluctant teachers.
Prospect, 17(3), 3–18.
Mahboob, A., & Lipovsky, C. (2007). Examining attitudes towards NESTs and
NNESTs: A comparison of a thematic vs an appraisal analysis. In C. Gitsaki
(Ed.), Language and languages: Global and local tensions (pp. 1–13).
Newcastle upon Tyne: Cambridge Scholars Publishing.
Mahboob, A. (2005). Beyond the native speaker in TESOL. Culture, context, &
communication. Retrieved from
http://www.moussu.net/nnest/articles/Mahboob.pdf.
McBeth, W., Hungerford, H., Marcinkowski, T., Volk, T., & Meyers, R. (2008).
National environmental literacy assessment project: Year 1, national baseline
study of middle grades students. Final report. (Report to the US
Environmental Protection Agency, National Oceanic and Atmospheric
Administration, and North American Association for Environmental
Education under grant NA06SEC4690009). Retrieved May 15, 2013 at
http://www.oceanleadership.org/wp-content/uploads/2009/08/environmental-
literacy.pdf.
Medgyes, P., & Arva, V. (2000). Native and non-native teachers in the classroom.
System, 28, 355–372.
Medgyes, P. (1983). The schizophrenic teacher. ELT Journal, 37(1), 2–6.
Medgyes, P. (1992). Native or non-native: who’s worth more? ELT Journal, 46(4),
340–349.
67
Medgyes, P. (2001). When the teacher is a non-native speaker. In M. Celce-Murcia
(Ed.), Teaching English as a second or foreign language (pp. 429–442) Boston,
MA: Heinle & Heinle.
Merino, I. G. (1997). Native English-speaking teachers versus non-native English-
speaking teachers. Revista Alicantina de Estudios Ingleses, 10, 69–79.
Meyers, L. S., Gamst, G., & Guarino, A. J. (2006). Applied multivariate research:
Design and interpretation. London: Sage Publications.
Moussu, L., & Llurda, E. (2008). Non-native English-speaking English language
teachers: History and research. Language Teaching, 41(3), 315–348.
doi:10.1017/S0261444808005028.
Murahata, G., & Murahata, Y. (2000). Perceived aspects of native and non-native
English speaking teachers by Japenese learners of English. Research Reports of
Department of International Studies, Faculty of Humanities and Economics,
Kochi University, 1, 103-118.
Nemtchinova, E. (2005). Host teachers’ evaluations of nonnative English speaking
teacher trainee: A perspective from the classroom. TESOL Quarterly, 235–261.
Retrieved from http://onlinelibrary.wiley.com/doi/10.2307/3588310/abstract.
Nunnally, J. C. (1978). Psychometric theory. New York: McGraw-Hill.
Ozturk, U., & Atay, D. (2010). Challenges of being a non-native English teacher.
Educational Research, 1(5), 135–139.
Pallant, J. (2001). SPSS survival manual: A step by step guide to data analysis using
SPSS for Windows (Version 10 and 11). Philadelphia: Open University Press.
Rajagopalan, K. (2005). Non-native speaker teachers of English and their anxieties:
Ingredients for an experiment in action research. In E. Llurda (Ed.), Non-native
68
language teachers: Perceptions, challenges and contributions to the profession
(pp. 283–303). New York, NY: Springer.
Reves, T., & Medgyes, P. (1994). The Non-native English speaking EFL/ ESL
teacher’s self-image: An international survey. System, 22(3), 353–367.
Sahib, A. (2005). “The unfluency of my language”: Non-native English-speaking
Teachers’ self-image and confidence in second language teacher education
programs (Master's thesis). Retrieved from
http://scholar.google.com/scholar?hl=en&btnG=Search&q=intitle:.
Scarcella, R. (1994). Second language pronunciation: State of the art in instruction.
System, 22(2), 221–230. doi:10.1016/0346-251X(94)90058-2.
Shen, L., & Wu, H. (2007). On NESTs and Non-NESTs. Chia-Nan Annual Bulletin,
33, 371–382.
Shirvani Shahenayatani, S. Z. (1987). A comparison of native and non-native
English-speaking teaching assistants (Doctoral dissertation). Retrieved from
ProQuest Dissertations and Theses database. (UMI No. 8713979).
Silva, L. P. (2009). Students’ expectations and attitudes towards nonnative-English-
speaking teachers in ESL and EFL settings: Teachers' and students' own
perceptions (Master's thesis). Retrieved from ProQuest Dissertations and Theses
database. (UMI No. 1478773).
Suwanarak, K. (2010). Can only native English speaking teachers teach aural and
oral skills? ABAC Journal, 30(2), 43–63.
Tabachnick, B.G., & Fidell, L.S. (2007). Using multivariate statistics. New York:
Pearson.
69
Tajino, A., & Tajino, Y. (2000). Native and non-native: What can they offer?
Lessons from team-teaching in Japan. ELT Journal, 54(January), 3–11.
Tang, C. (1997). The identity of the nonnative ESL teacher on the power and status
of nonnative ESL teachers. TESOL Quarterly, 31(3), 577–580.
Tang, T. (2007). Investigating NNS English teachers’ self-assesed language
proficiency in an EFL context (master's thesis). Retrieved from
http://digitool.library.mcgill.ca/view/action/singleViewer.do?dvs=137139074
1642~390&locale=tr_TR&show_metadata=false&VIEWER_URL=/view/act
ion/singleViewer.do?&DELIVERY_RULE_ID=6&adjacency=N&applicatio
n=DIGITOOL-3&frameId=1&usePid1=true&usePid2=true.
Weinberg, S., & Abramowitz, S. (2002). Data analysis for the behavioural sciences
using SPSS. Cambridge: Cambridge University Press.
Wong, R. (1993). Pronunciation myths and facts. Forum, 31(4), 45–46. Retrieved
from
http://scholar.google.com/scholar?hl=en&btnG=Search&q=intitle:Pronunciation
+Myths+and+Facts#0.

70
APPENDIX 1: FOCUS GROUPS QUESTIONS
1) How important is pronunciation teaching to you?
2) What is the amount of time you spend teaching pronunciation in class?
3) How do you decide on this amount?
4) How do you teach pronunciation?
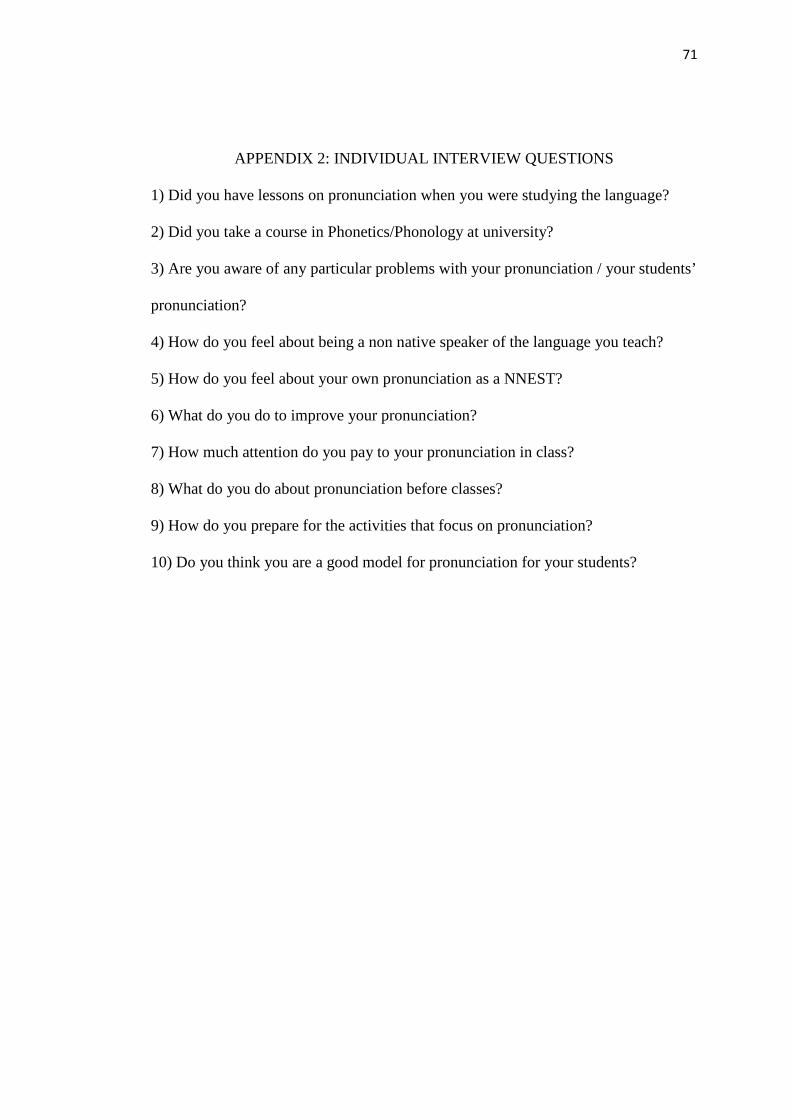
71
APPENDIX 2: INDIVIDUAL INTERVIEW QUESTIONS
1) Did you have lessons on pronunciation when you were studying the language?
2) Did you take a course in Phonetics/Phonology at university?
3) Are you aware of any particular problems with your pronunciation / your students’
pronunciation?
4) How do you feel about being a non native speaker of the language you teach?
5) How do you feel about your own pronunciation as a NNEST?
6) What do you do to improve your pronunciation?
7) How much attention do you pay to your pronunciation in class?
8) What do you do about pronunciation before classes?
9) How do you prepare for the activities that focus on pronunciation?
10) Do you think you are a good model for pronunciation for your students?
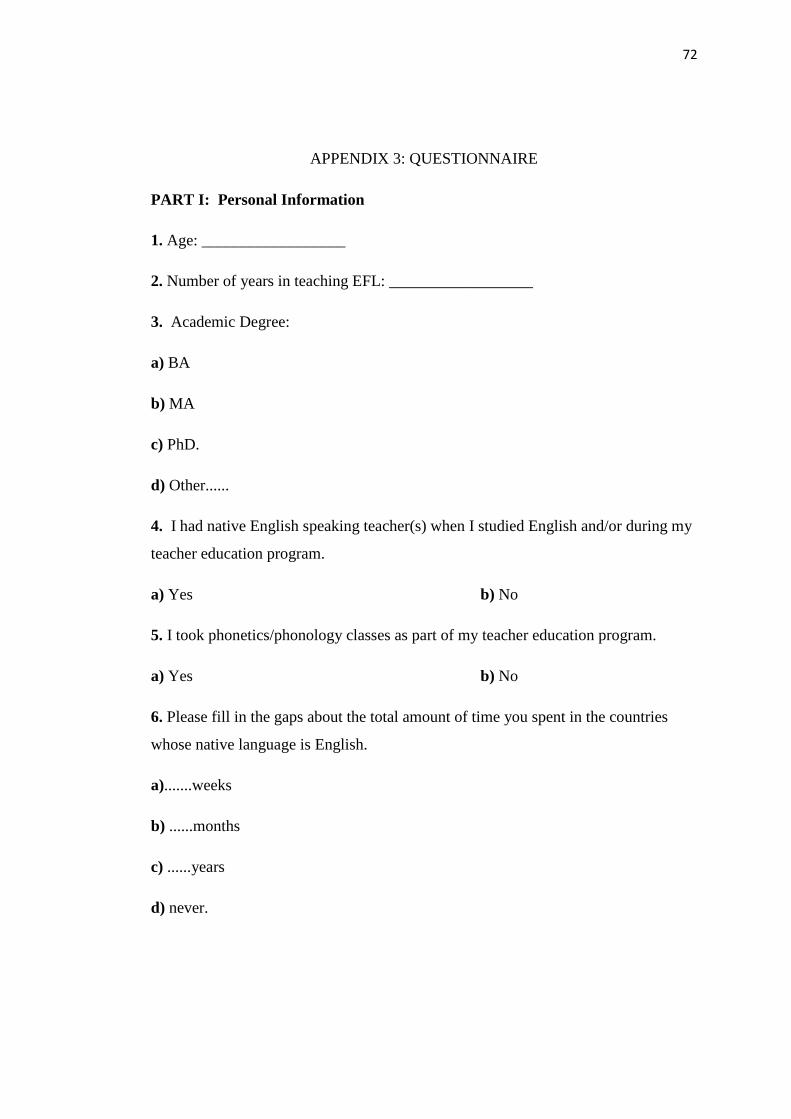
72
APPENDIX 3: QUESTIONNAIRE
PART I: Personal Information
1. Age: __________________
2. Number of years in teaching EFL: __________________
3. Academic Degree:
a) BA
b) MA
c) PhD.
d) Other......
4. I had native English speaking teacher(s) when I studied English and/or during my
teacher education program.
a) Yes b) No
5. I took phonetics/phonology classes as part of my teacher education program.
a) Yes b) No
6. Please fill in the gaps about the total amount of time you spent in the countries
whose native language is English.
a).......weeks
b) ......months
c) ......years
d) never.
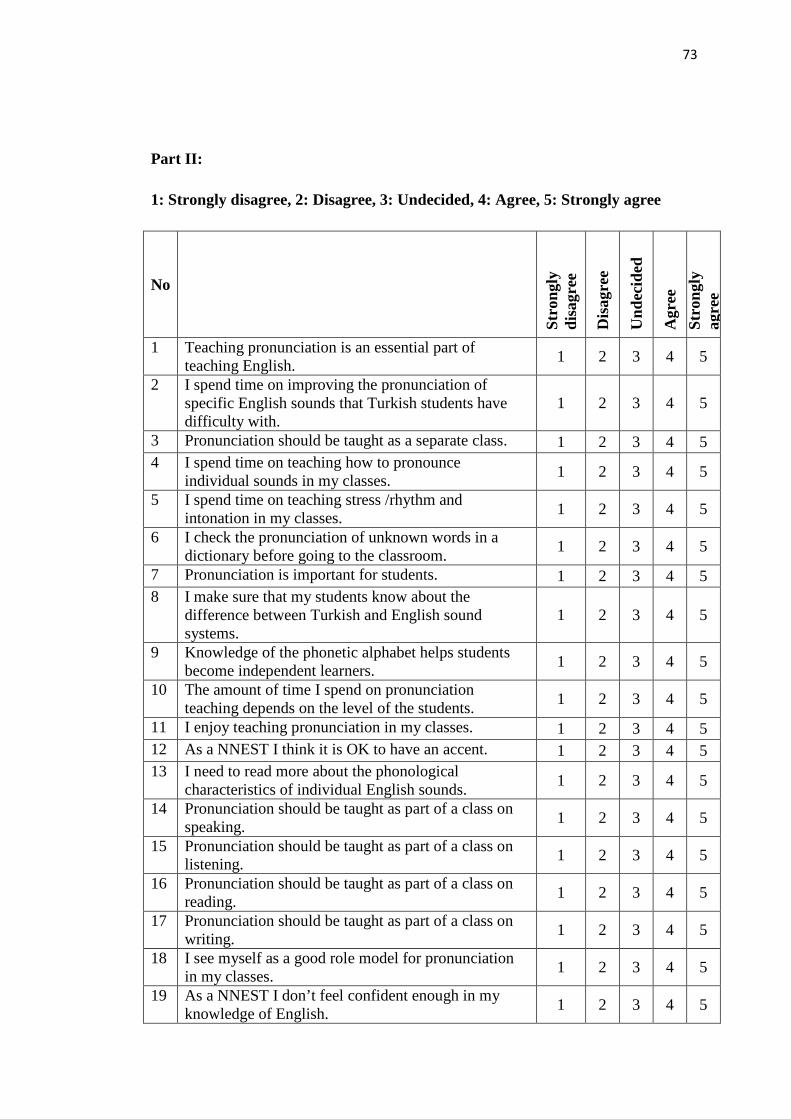
73
Part II:
1: Strongly disagree, 2: Disagree, 3: Undecided, 4: Agree, 5: Strongly agree
No
Stro
ngly
di
sagr
ee
Dis
agre
e
Und
ecid
ed
Agr
ee
Stro
ngly
ag
ree
1 Teaching pronunciation is an essential part of teaching English. 1 2 3 4 5
2 I spend time on improving the pronunciation of specific English sounds that Turkish students have difficulty with.
1 2 3 4 5
3 Pronunciation should be taught as a separate class. 1 2 3 4 5 4 I spend time on teaching how to pronounce
individual sounds in my classes. 1 2 3 4 5
5 I spend time on teaching stress /rhythm and intonation in my classes. 1 2 3 4 5
6 I check the pronunciation of unknown words in a dictionary before going to the classroom. 1 2 3 4 5
7 Pronunciation is important for students. 1 2 3 4 5 8 I make sure that my students know about the
difference between Turkish and English sound systems.
1 2 3 4 5
9 Knowledge of the phonetic alphabet helps students become independent learners. 1 2 3 4 5
10 The amount of time I spend on pronunciation teaching depends on the level of the students. 1 2 3 4 5
11 I enjoy teaching pronunciation in my classes. 1 2 3 4 5 12 As a NNEST I think it is OK to have an accent. 1 2 3 4 5 13 I need to read more about the phonological
characteristics of individual English sounds. 1 2 3 4 5
14 Pronunciation should be taught as part of a class on speaking. 1 2 3 4 5
15 Pronunciation should be taught as part of a class on listening. 1 2 3 4 5
16 Pronunciation should be taught as part of a class on reading. 1 2 3 4 5
17 Pronunciation should be taught as part of a class on writing. 1 2 3 4 5
18 I see myself as a good role model for pronunciation in my classes. 1 2 3 4 5
19 As a NNEST I don’t feel confident enough in my knowledge of English. 1 2 3 4 5
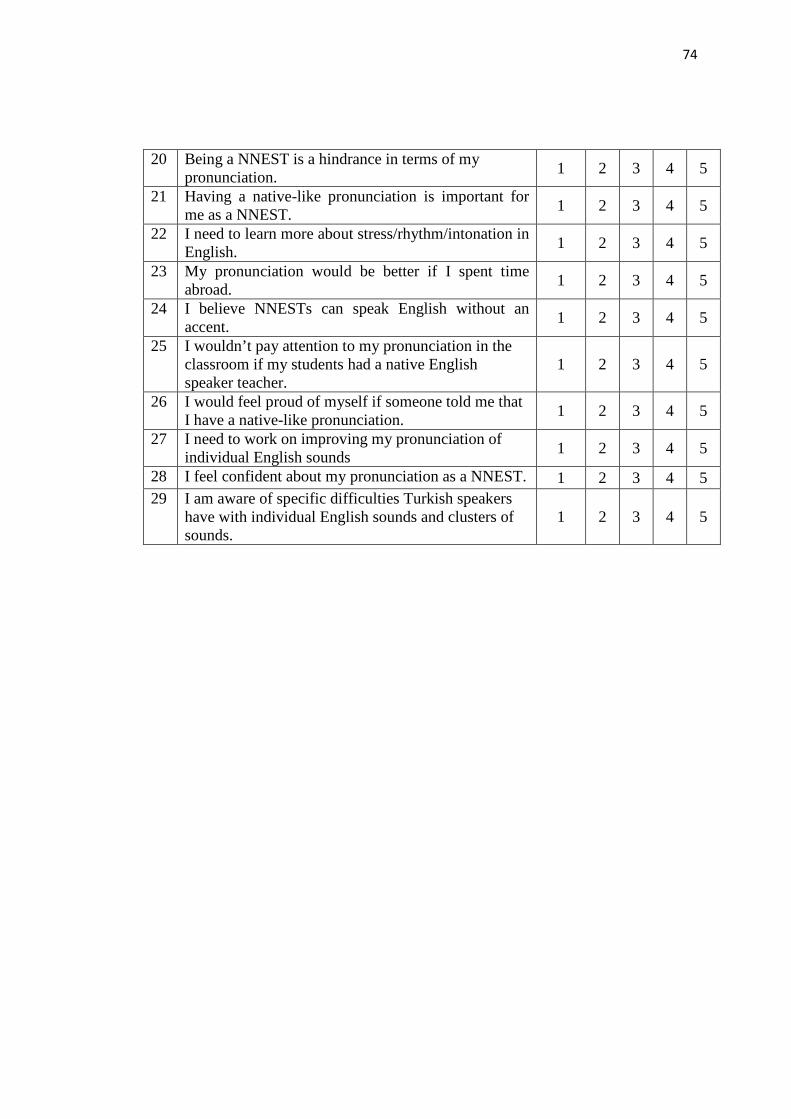
74
20 Being a NNEST is a hindrance in terms of my pronunciation. 1 2 3 4 5
21 Having a native-like pronunciation is important for me as a NNEST. 1 2 3 4 5
22 I need to learn more about stress/rhythm/intonation in English. 1 2 3 4 5
23 My pronunciation would be better if I spent time abroad. 1 2 3 4 5
24 I believe NNESTs can speak English without an accent. 1 2 3 4 5
25 I wouldn’t pay attention to my pronunciation in the classroom if my students had a native English speaker teacher.
1 2 3 4 5
26 I would feel proud of myself if someone told me that I have a native-like pronunciation. 1 2 3 4 5
27 I need to work on improving my pronunciation of individual English sounds 1 2 3 4 5
28 I feel confident about my pronunciation as a NNEST. 1 2 3 4 5 29 I am aware of specific difficulties Turkish speakers
have with individual English sounds and clusters of sounds.
1 2 3 4 5
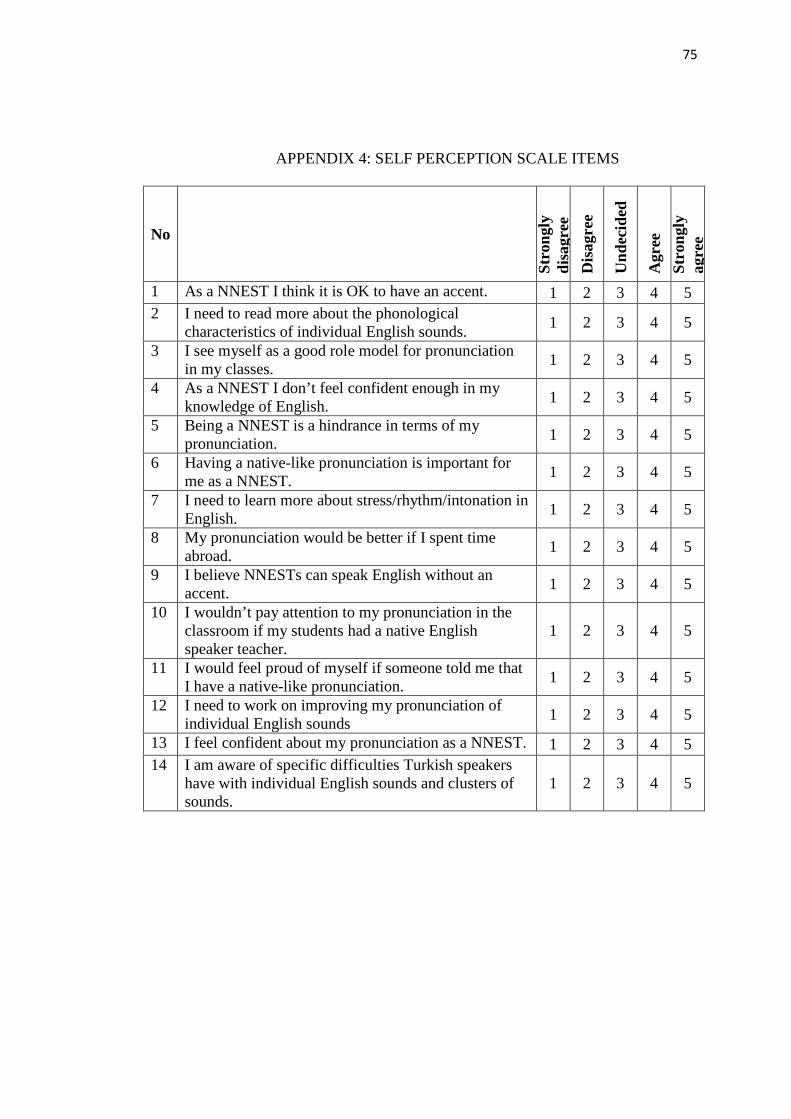
75
APPENDIX 4: SELF PERCEPTION SCALE ITEMS
No
Stro
ngly
di
sagr
ee
Dis
agre
e
Und
ecid
ed
Agr
ee
Stro
ngly
ag
ree
1 As a NNEST I think it is OK to have an accent. 1 2 3 4 5 2 I need to read more about the phonological
characteristics of individual English sounds. 1 2 3 4 5
3 I see myself as a good role model for pronunciation in my classes. 1 2 3 4 5
4 As a NNEST I don’t feel confident enough in my knowledge of English. 1 2 3 4 5
5 Being a NNEST is a hindrance in terms of my pronunciation. 1 2 3 4 5
6 Having a native-like pronunciation is important for me as a NNEST. 1 2 3 4 5
7 I need to learn more about stress/rhythm/intonation in English. 1 2 3 4 5
8 My pronunciation would be better if I spent time abroad. 1 2 3 4 5
9 I believe NNESTs can speak English without an accent. 1 2 3 4 5
10 I wouldn’t pay attention to my pronunciation in the classroom if my students had a native English speaker teacher.
1 2 3 4 5
11 I would feel proud of myself if someone told me that I have a native-like pronunciation. 1 2 3 4 5
12 I need to work on improving my pronunciation of individual English sounds 1 2 3 4 5
13 I feel confident about my pronunciation as a NNEST. 1 2 3 4 5 14 I am aware of specific difficulties Turkish speakers
have with individual English sounds and clusters of sounds.
1 2 3 4 5
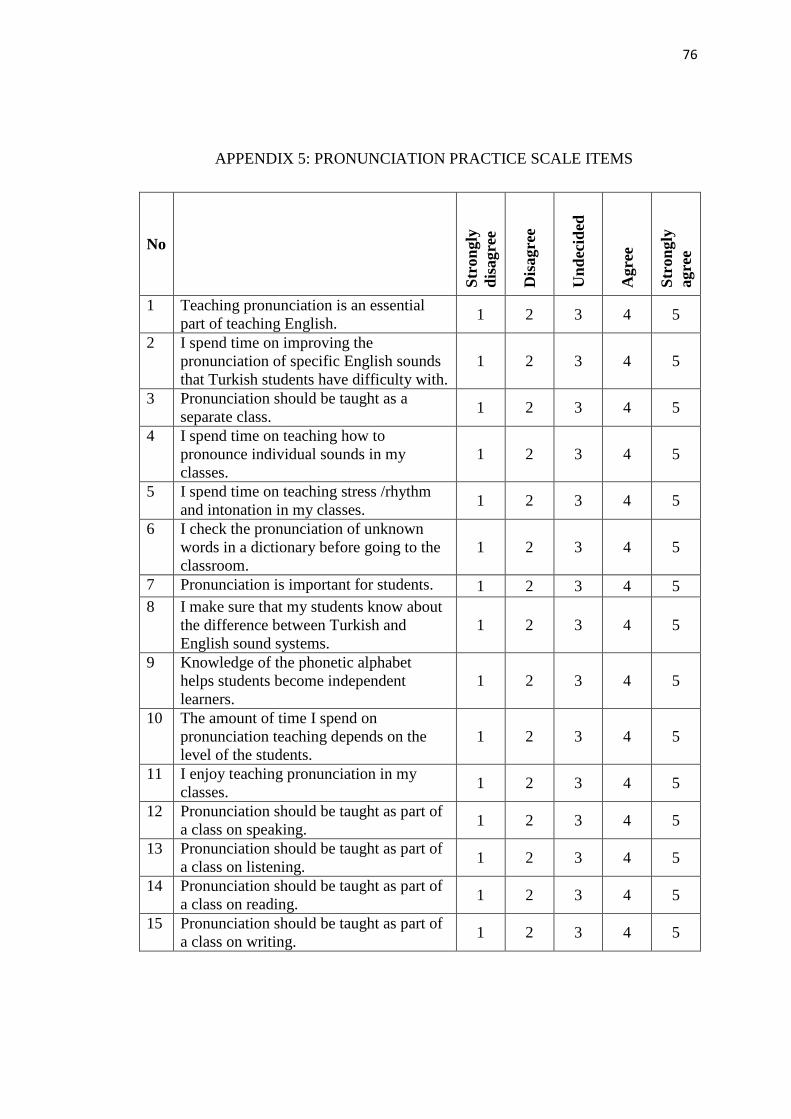
76
APPENDIX 5: PRONUNCIATION PRACTICE SCALE ITEMS
No
Stro
ngly
di
sagr
ee
Dis
agre
e
Und
ecid
ed
Agr
ee
Stro
ngly
ag
ree
1 Teaching pronunciation is an essential part of teaching English. 1 2 3 4 5
2 I spend time on improving the pronunciation of specific English sounds that Turkish students have difficulty with.
1 2 3 4 5
3 Pronunciation should be taught as a separate class. 1 2 3 4 5
4 I spend time on teaching how to pronounce individual sounds in my classes.
1 2 3 4 5
5 I spend time on teaching stress /rhythm and intonation in my classes. 1 2 3 4 5
6 I check the pronunciation of unknown words in a dictionary before going to the classroom.
1 2 3 4 5
7 Pronunciation is important for students. 1 2 3 4 5 8 I make sure that my students know about
the difference between Turkish and English sound systems.
1 2 3 4 5
9 Knowledge of the phonetic alphabet helps students become independent learners.
1 2 3 4 5
10 The amount of time I spend on pronunciation teaching depends on the level of the students.
1 2 3 4 5
11 I enjoy teaching pronunciation in my classes. 1 2 3 4 5
12 Pronunciation should be taught as part of a class on speaking. 1 2 3 4 5
13 Pronunciation should be taught as part of a class on listening. 1 2 3 4 5
14 Pronunciation should be taught as part of a class on reading. 1 2 3 4 5
15 Pronunciation should be taught as part of a class on writing. 1 2 3 4 5
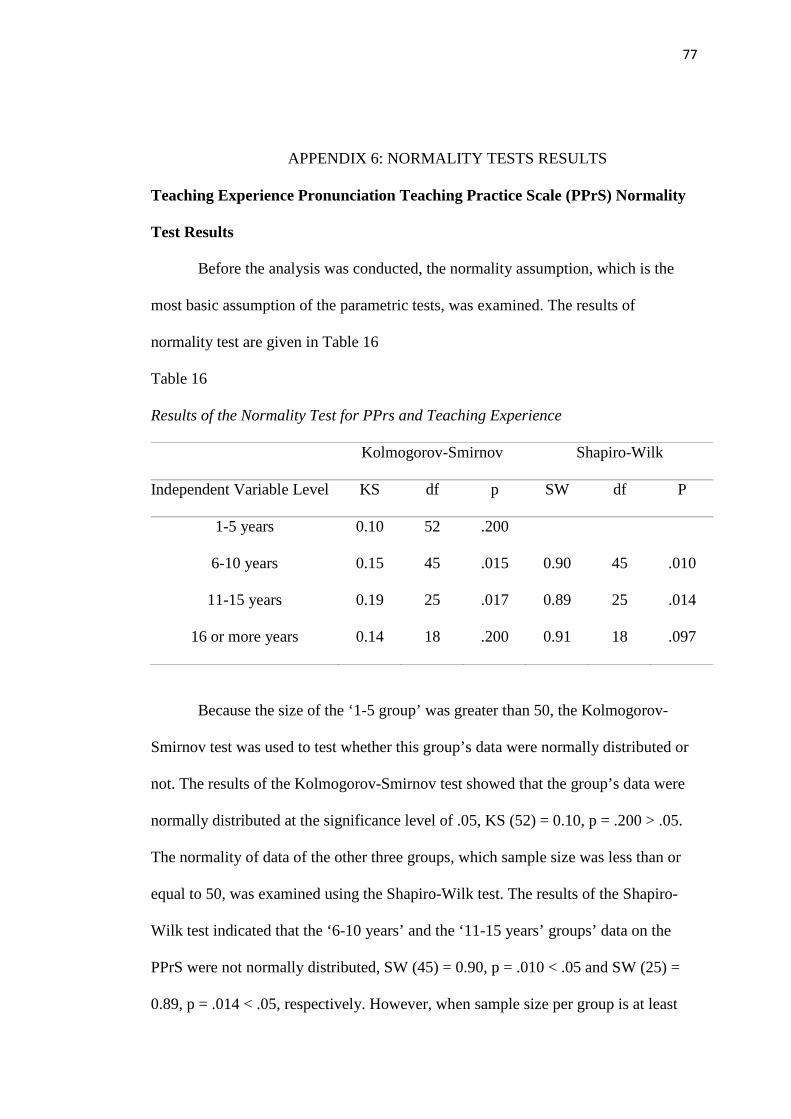
77
APPENDIX 6: NORMALITY TESTS RESULTS
Teaching Experience Pronunciation Teaching Practice Scale (PPrS) Normality
Test Results
Before the analysis was conducted, the normality assumption, which is the
most basic assumption of the parametric tests, was examined. The results of
normality test are given in Table 16
Table 16
Results of the Normality Test for PPrs and Teaching Experience
Kolmogorov-Smirnov Shapiro-Wilk
Independent Variable Level KS df p SW df P
1-5 years 0.10 52 .200
6-10 years 0.15 45 .015 0.90 45 .010
11-15 years 0.19 25 .017 0.89 25 .014
16 or more years 0.14 18 .200 0.91 18 .097
Because the size of the ‘1-5 group’ was greater than 50, the Kolmogorov-
Smirnov test was used to test whether this group’s data were normally distributed or
not. The results of the Kolmogorov-Smirnov test showed that the group’s data were
normally distributed at the significance level of .05, KS (52) = 0.10, p = .200 > .05.
The normality of data of the other three groups, which sample size was less than or
equal to 50, was examined using the Shapiro-Wilk test. The results of the Shapiro-
Wilk test indicated that the ‘6-10 years’ and the ‘11-15 years’ groups’ data on the
PPrS were not normally distributed, SW (45) = 0.90, p = .010 < .05 and SW (25) =
0.89, p = .014 < .05, respectively. However, when sample size per group is at least
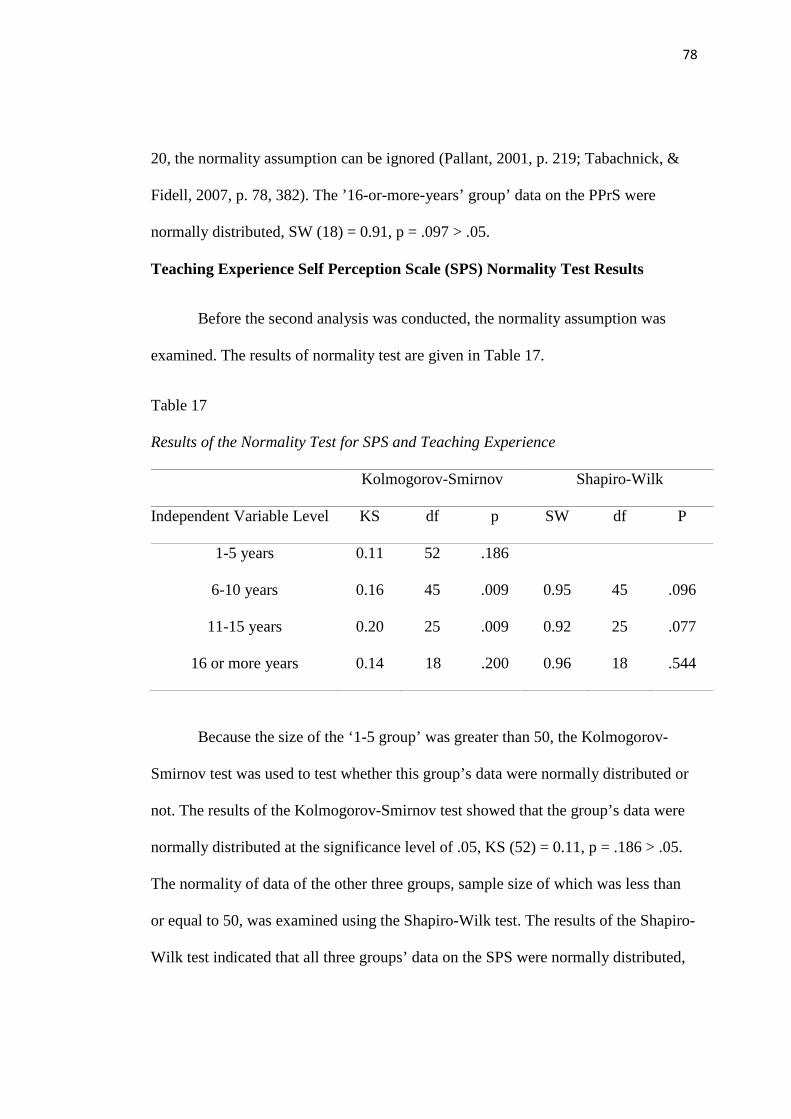
78
20, the normality assumption can be ignored (Pallant, 2001, p. 219; Tabachnick, &
Fidell, 2007, p. 78, 382). The ’16-or-more-years’ group’ data on the PPrS were
normally distributed, SW (18) = 0.91, p = .097 > .05.
Teaching Experience Self Perception Scale (SPS) Normality Test Results
Before the second analysis was conducted, the normality assumption was
examined. The results of normality test are given in Table 17.
Table 17
Results of the Normality Test for SPS and Teaching Experience
Kolmogorov-Smirnov Shapiro-Wilk
Independent Variable Level KS df p SW df P
1-5 years 0.11 52 .186
6-10 years 0.16 45 .009 0.95 45 .096
11-15 years 0.20 25 .009 0.92 25 .077
16 or more years 0.14 18 .200 0.96 18 .544
Because the size of the ‘1-5 group’ was greater than 50, the Kolmogorov-
Smirnov test was used to test whether this group’s data were normally distributed or
not. The results of the Kolmogorov-Smirnov test showed that the group’s data were
normally distributed at the significance level of .05, KS (52) = 0.11, p = .186 > .05.
The normality of data of the other three groups, sample size of which was less than
or equal to 50, was examined using the Shapiro-Wilk test. The results of the Shapiro-
Wilk test indicated that all three groups’ data on the SPS were normally distributed,
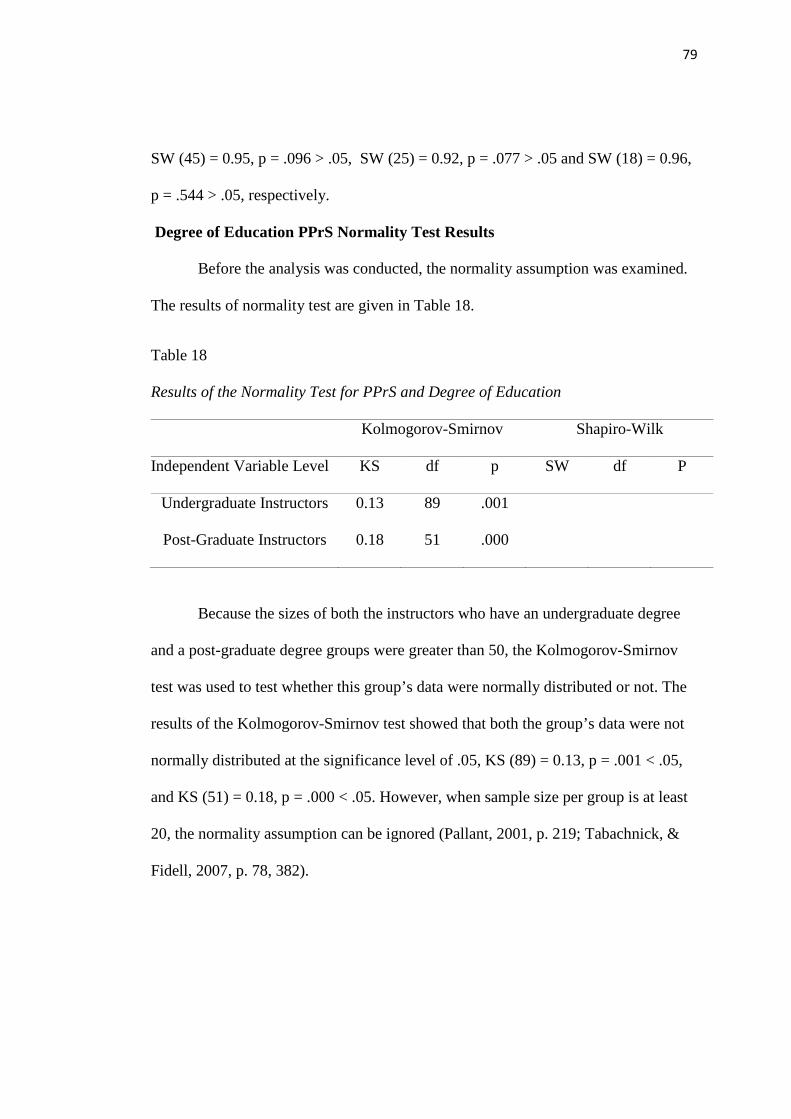
79
SW (45) = 0.95, p = .096 > .05, SW (25) = 0.92, p = .077 > .05 and SW (18) = 0.96,
p = .544 > .05, respectively.
Degree of Education PPrS Normality Test Results
Before the analysis was conducted, the normality assumption was examined.
The results of normality test are given in Table 18.
Table 18
Results of the Normality Test for PPrS and Degree of Education
Kolmogorov-Smirnov Shapiro-Wilk
Independent Variable Level KS df p SW df P
Undergraduate Instructors 0.13 89 .001
Post-Graduate Instructors 0.18 51 .000
Because the sizes of both the instructors who have an undergraduate degree
and a post-graduate degree groups were greater than 50, the Kolmogorov-Smirnov
test was used to test whether this group’s data were normally distributed or not. The
results of the Kolmogorov-Smirnov test showed that both the group’s data were not
normally distributed at the significance level of .05, KS (89) = 0.13, p = .001 < .05,
and KS (51) = 0.18, p = .000 < .05. However, when sample size per group is at least
20, the normality assumption can be ignored (Pallant, 2001, p. 219; Tabachnick, &
Fidell, 2007, p. 78, 382).
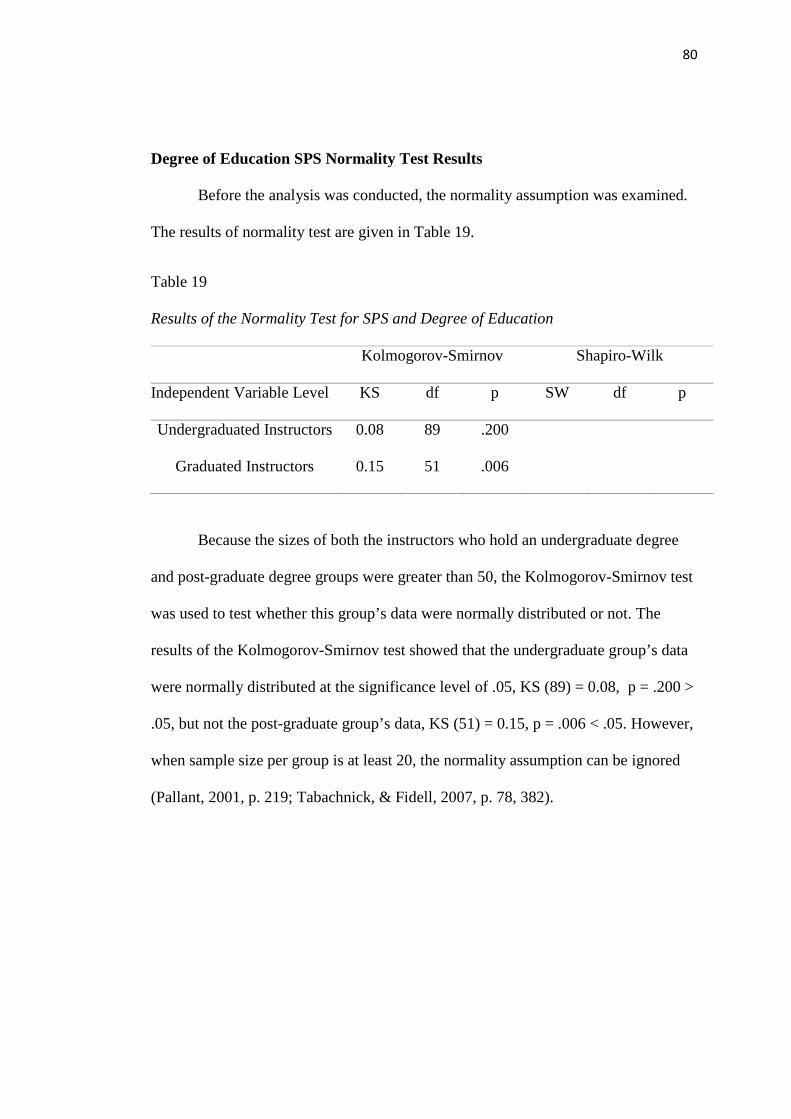
80
Degree of Education SPS Normality Test Results
Before the analysis was conducted, the normality assumption was examined.
The results of normality test are given in Table 19.
Table 19
Results of the Normality Test for SPS and Degree of Education
Kolmogorov-Smirnov Shapiro-Wilk
Independent Variable Level KS df p SW df p
Undergraduated Instructors 0.08 89 .200
Graduated Instructors 0.15 51 .006
Because the sizes of both the instructors who hold an undergraduate degree
and post-graduate degree groups were greater than 50, the Kolmogorov-Smirnov test
was used to test whether this group’s data were normally distributed or not. The
results of the Kolmogorov-Smirnov test showed that the undergraduate group’s data
were normally distributed at the significance level of .05, KS (89) = 0.08, p = .200 >
.05, but not the post-graduate group’s data, KS (51) = 0.15, p = .006 < .05. However,
when sample size per group is at least 20, the normality assumption can be ignored
(Pallant, 2001, p. 219; Tabachnick, & Fidell, 2007, p. 78, 382).
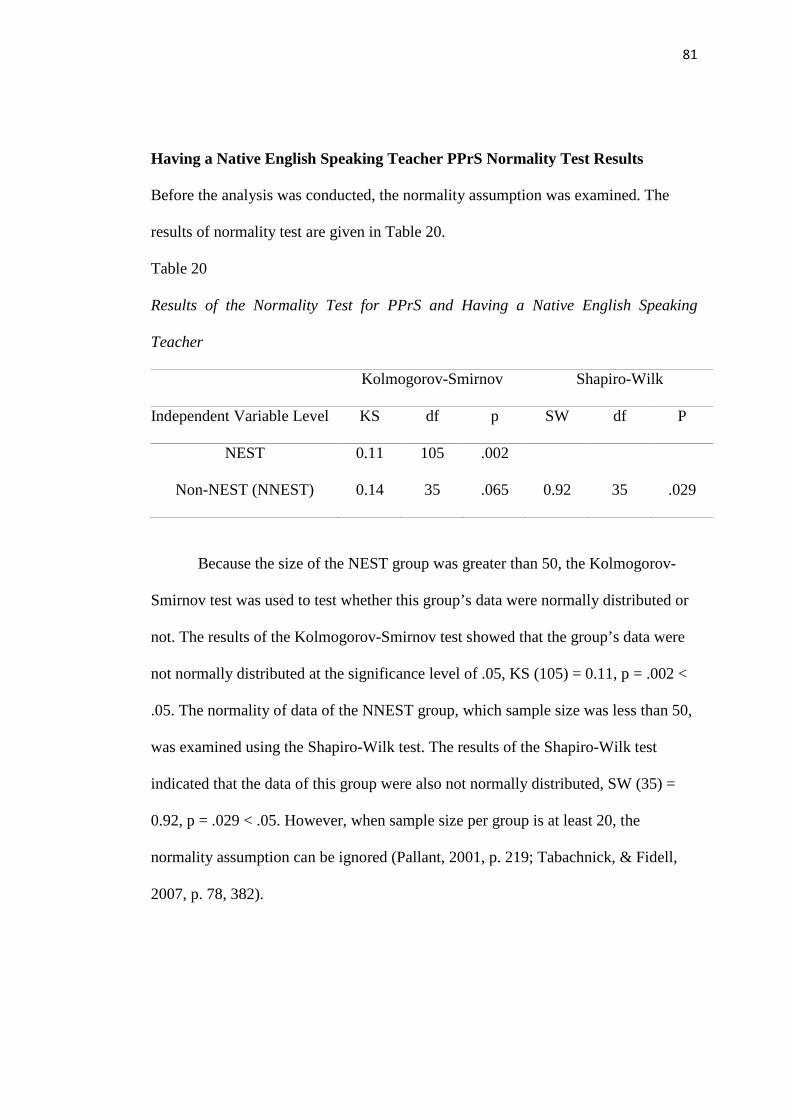
81
Having a Native English Speaking Teacher PPrS Normality Test Results
Before the analysis was conducted, the normality assumption was examined. The
results of normality test are given in Table 20.
Table 20
Results of the Normality Test for PPrS and Having a Native English Speaking
Teacher
Kolmogorov-Smirnov Shapiro-Wilk
Independent Variable Level KS df p SW df P
NEST 0.11 105 .002
Non-NEST (NNEST) 0.14 35 .065 0.92 35 .029
Because the size of the NEST group was greater than 50, the Kolmogorov-
Smirnov test was used to test whether this group’s data were normally distributed or
not. The results of the Kolmogorov-Smirnov test showed that the group’s data were
not normally distributed at the significance level of .05, KS (105) = 0.11, p = .002 <
.05. The normality of data of the NNEST group, which sample size was less than 50,
was examined using the Shapiro-Wilk test. The results of the Shapiro-Wilk test
indicated that the data of this group were also not normally distributed, SW (35) =
0.92, p = .029 < .05. However, when sample size per group is at least 20, the
normality assumption can be ignored (Pallant, 2001, p. 219; Tabachnick, & Fidell,
2007, p. 78, 382).
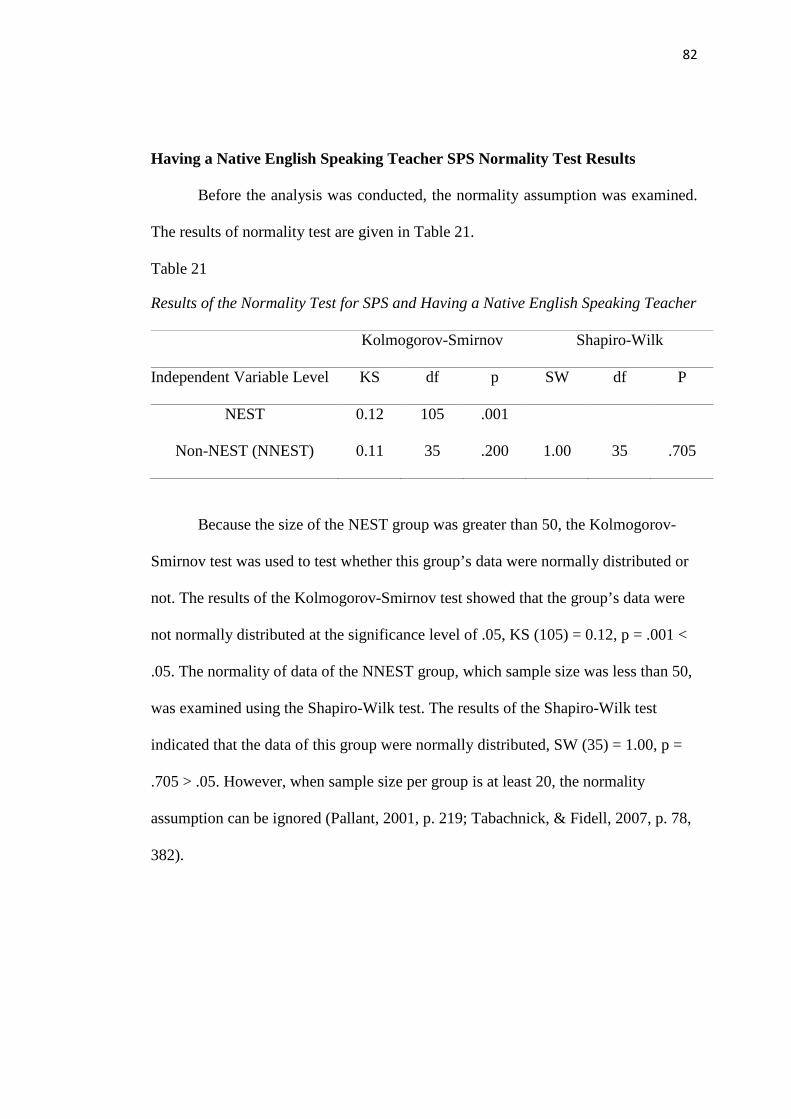
82
Having a Native English Speaking Teacher SPS Normality Test Results
Before the analysis was conducted, the normality assumption was examined.
The results of normality test are given in Table 21.
Table 21
Results of the Normality Test for SPS and Having a Native English Speaking Teacher
Kolmogorov-Smirnov Shapiro-Wilk
Independent Variable Level KS df p SW df P
NEST 0.12 105 .001
Non-NEST (NNEST) 0.11 35 .200 1.00 35 .705
Because the size of the NEST group was greater than 50, the Kolmogorov-
Smirnov test was used to test whether this group’s data were normally distributed or
not. The results of the Kolmogorov-Smirnov test showed that the group’s data were
not normally distributed at the significance level of .05, KS (105) = 0.12, p = .001 <
.05. The normality of data of the NNEST group, which sample size was less than 50,
was examined using the Shapiro-Wilk test. The results of the Shapiro-Wilk test
indicated that the data of this group were normally distributed, SW (35) = 1.00, p =
.705 > .05. However, when sample size per group is at least 20, the normality
assumption can be ignored (Pallant, 2001, p. 219; Tabachnick, & Fidell, 2007, p. 78,
382).
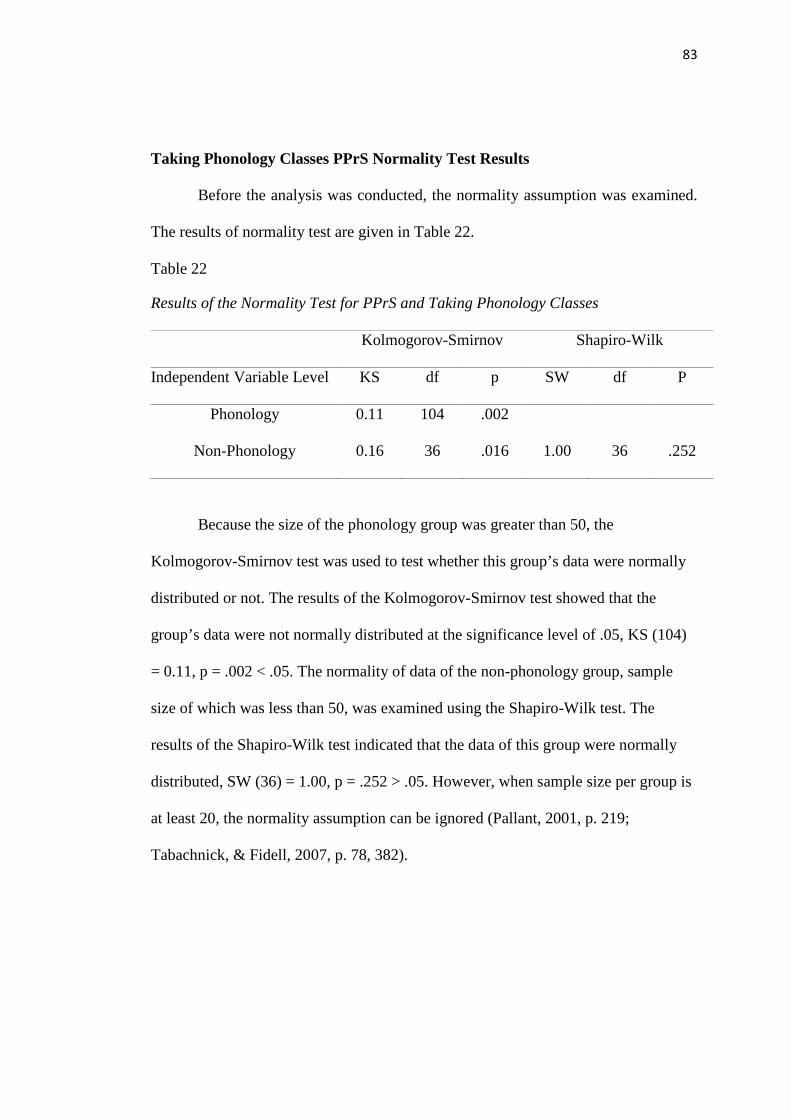
83
Taking Phonology Classes PPrS Normality Test Results
Before the analysis was conducted, the normality assumption was examined.
The results of normality test are given in Table 22.
Table 22
Results of the Normality Test for PPrS and Taking Phonology Classes
Kolmogorov-Smirnov Shapiro-Wilk
Independent Variable Level KS df p SW df P
Phonology 0.11 104 .002
Non-Phonology 0.16 36 .016 1.00 36 .252
Because the size of the phonology group was greater than 50, the
Kolmogorov-Smirnov test was used to test whether this group’s data were normally
distributed or not. The results of the Kolmogorov-Smirnov test showed that the
group’s data were not normally distributed at the significance level of .05, KS (104)
= 0.11, p = .002 < .05. The normality of data of the non-phonology group, sample
size of which was less than 50, was examined using the Shapiro-Wilk test. The
results of the Shapiro-Wilk test indicated that the data of this group were normally
distributed, SW (36) = 1.00, p = .252 > .05. However, when sample size per group is
at least 20, the normality assumption can be ignored (Pallant, 2001, p. 219;
Tabachnick, & Fidell, 2007, p. 78, 382).
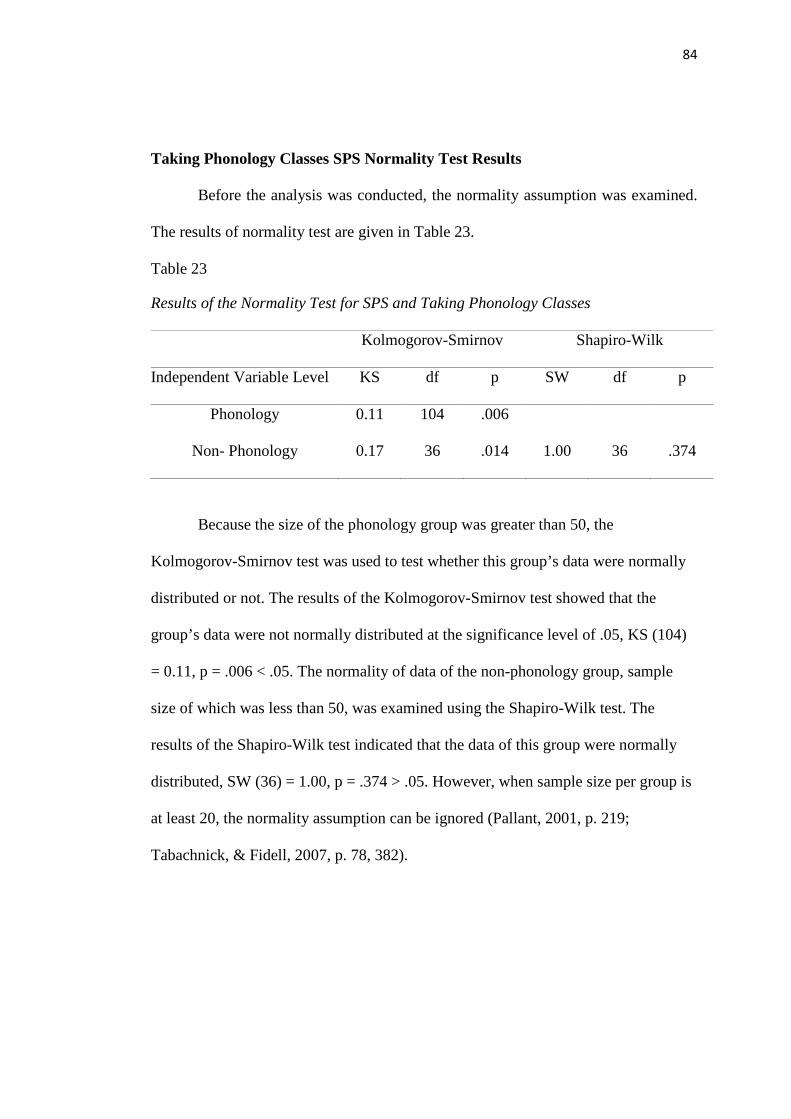
84
Taking Phonology Classes SPS Normality Test Results
Before the analysis was conducted, the normality assumption was examined.
The results of normality test are given in Table 23.
Table 23
Results of the Normality Test for SPS and Taking Phonology Classes
Kolmogorov-Smirnov Shapiro-Wilk
Independent Variable Level KS df p SW df p
Phonology 0.11 104 .006
Non- Phonology 0.17 36 .014 1.00 36 .374
Because the size of the phonology group was greater than 50, the
Kolmogorov-Smirnov test was used to test whether this group’s data were normally
distributed or not. The results of the Kolmogorov-Smirnov test showed that the
group’s data were not normally distributed at the significance level of .05, KS (104)
= 0.11, p = .006 < .05. The normality of data of the non-phonology group, sample
size of which was less than 50, was examined using the Shapiro-Wilk test. The
results of the Shapiro-Wilk test indicated that the data of this group were normally
distributed, SW (36) = 1.00, p = .374 > .05. However, when sample size per group is
at least 20, the normality assumption can be ignored (Pallant, 2001, p. 219;
Tabachnick, & Fidell, 2007, p. 78, 382).
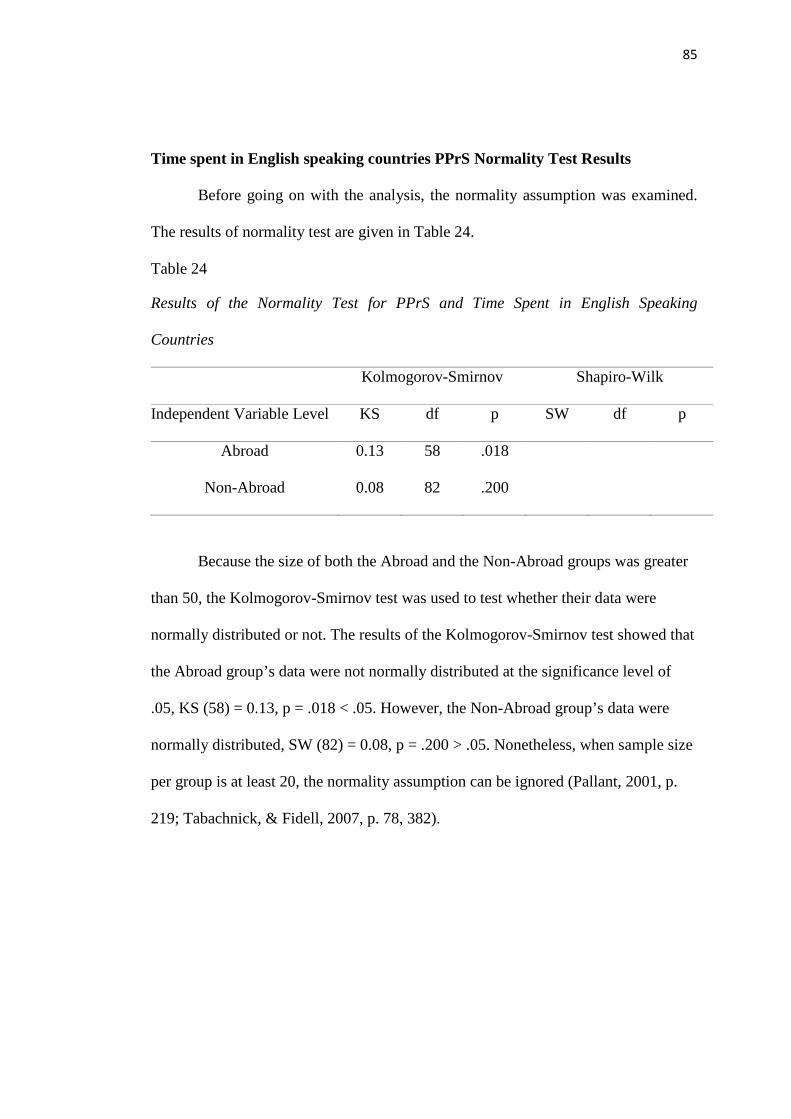
85
Time spent in English speaking countries PPrS Normality Test Results
Before going on with the analysis, the normality assumption was examined.
The results of normality test are given in Table 24.
Table 24
Results of the Normality Test for PPrS and Time Spent in English Speaking
Countries
Kolmogorov-Smirnov Shapiro-Wilk
Independent Variable Level KS df p SW df p
Abroad 0.13 58 .018
Non-Abroad 0.08 82 .200
Because the size of both the Abroad and the Non-Abroad groups was greater
than 50, the Kolmogorov-Smirnov test was used to test whether their data were
normally distributed or not. The results of the Kolmogorov-Smirnov test showed that
the Abroad group’s data were not normally distributed at the significance level of
.05, KS (58) = 0.13, p = .018 < .05. However, the Non-Abroad group’s data were
normally distributed, SW (82) = 0.08, p = .200 > .05. Nonetheless, when sample size
per group is at least 20, the normality assumption can be ignored (Pallant, 2001, p.
219; Tabachnick, & Fidell, 2007, p. 78, 382).
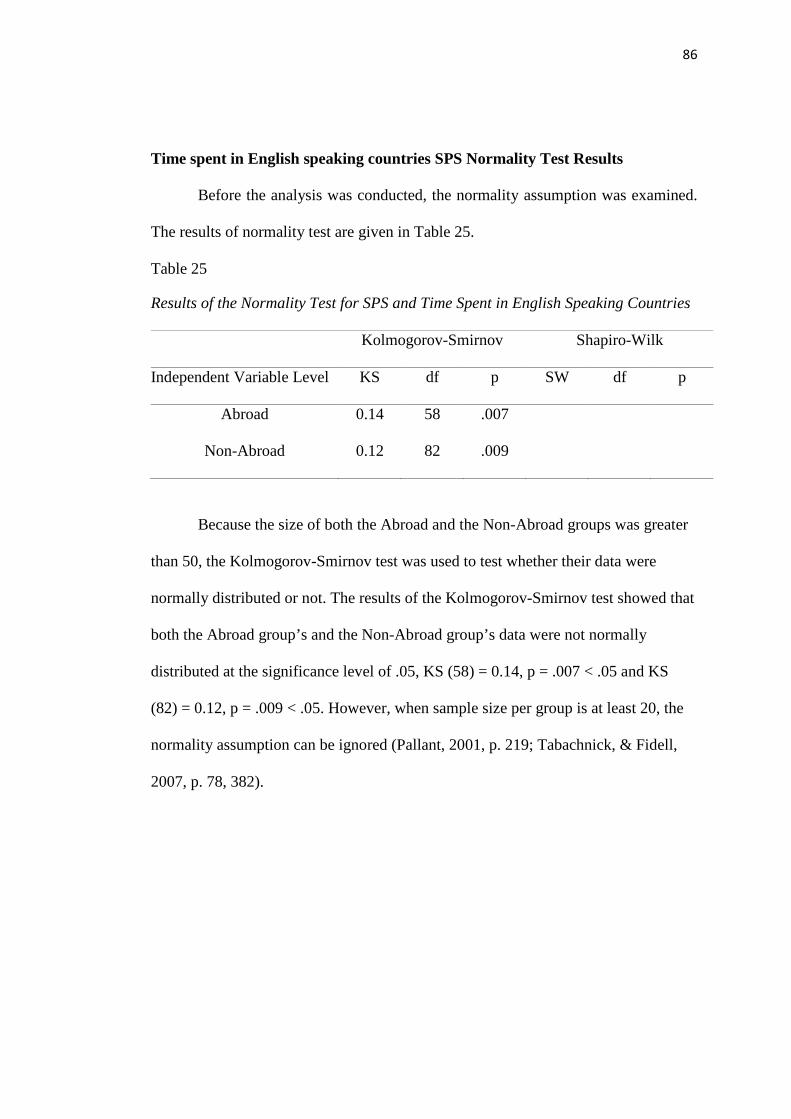
86
Time spent in English speaking countries SPS Normality Test Results
Before the analysis was conducted, the normality assumption was examined.
The results of normality test are given in Table 25.
Table 25
Results of the Normality Test for SPS and Time Spent in English Speaking Countries
Kolmogorov-Smirnov Shapiro-Wilk
Independent Variable Level KS df p SW df p
Abroad 0.14 58 .007
Non-Abroad 0.12 82 .009
Because the size of both the Abroad and the Non-Abroad groups was greater
than 50, the Kolmogorov-Smirnov test was used to test whether their data were
normally distributed or not. The results of the Kolmogorov-Smirnov test showed that
both the Abroad group’s and the Non-Abroad group’s data were not normally
distributed at the significance level of .05, KS (58) = 0.14, p = .007 < .05 and KS
(82) = 0.12, p = .009 < .05. However, when sample size per group is at least 20, the
normality assumption can be ignored (Pallant, 2001, p. 219; Tabachnick, & Fidell,
2007, p. 78, 382).
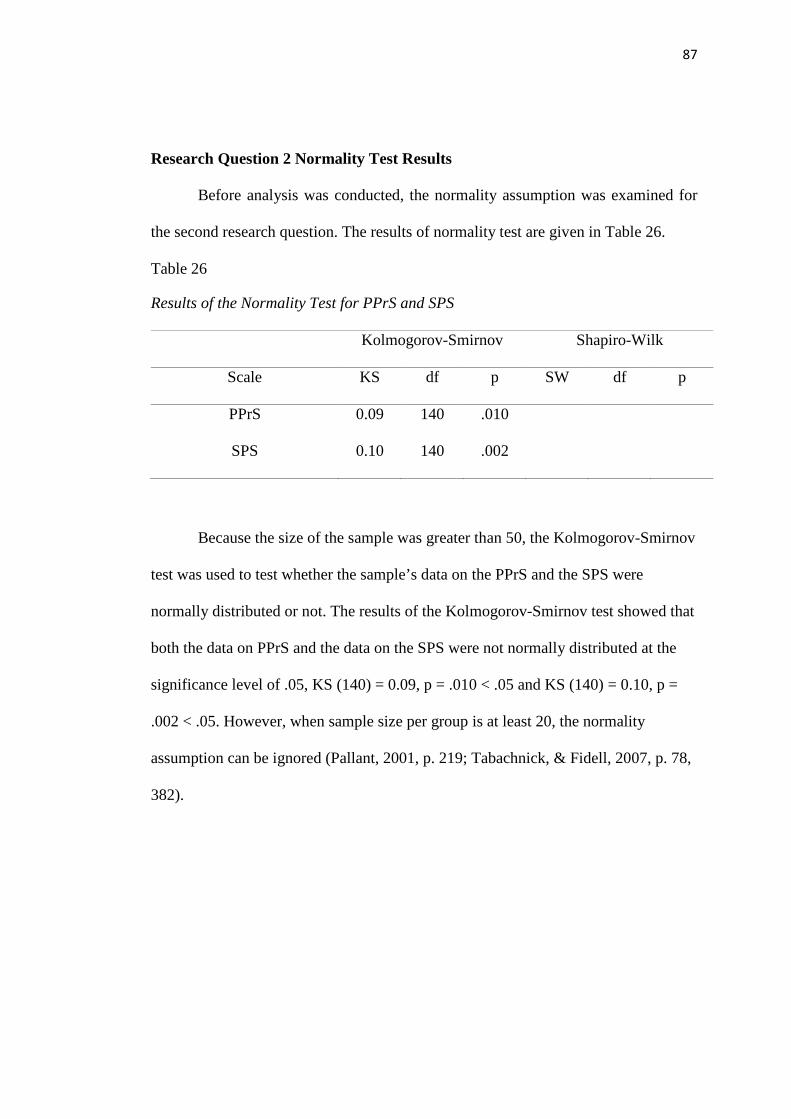
87
Research Question 2 Normality Test Results
Before analysis was conducted, the normality assumption was examined for
the second research question. The results of normality test are given in Table 26.
Table 26
Results of the Normality Test for PPrS and SPS
Kolmogorov-Smirnov Shapiro-Wilk
Scale KS df p SW df p
PPrS 0.09 140 .010
SPS 0.10 140 .002
Because the size of the sample was greater than 50, the Kolmogorov-Smirnov
test was used to test whether the sample’s data on the PPrS and the SPS were
normally distributed or not. The results of the Kolmogorov-Smirnov test showed that
both the data on PPrS and the data on the SPS were not normally distributed at the
significance level of .05, KS (140) = 0.09, p = .010 < .05 and KS (140) = 0.10, p =
.002 < .05. However, when sample size per group is at least 20, the normality
assumption can be ignored (Pallant, 2001, p. 219; Tabachnick, & Fidell, 2007, p. 78,
382).