Florian Schroff, Antonio Criminisi & Andrew Zisserman ICCV 2007
date post
19-Dec-2015Category
view
224download
1
Non-metric affinity propagation for unsupervised image categorization
Delbert Dueck and Brendan J. FreyICCV 2007

Outline
1. Introduction2. Comparison of the NIPS (2006) and Science
(2007) Algorithms3. Unsupervised Categorization of Olivetti Face
Images4. Unsupervised Categorization of Caltech101
Images Using SIFT Features5. Conclusions

Outline
1. Introduction2. Comparison of the NIPS (2006) and Science
(2007) Algorithms3. Unsupervised Categorization of Olivetti Face
Images4. Unsupervised Categorization of Caltech101
Images Using SIFT Features5. Conclusions

Introduction
• Many vision tasks– produce as output a categorization of input features– require unsupervised categorization of input
features as a preprocessing step• A powerful approach to representing image
categories is to identify exemplars1. high-order statistics2. represented efficiently as pointers into the training
data

Introduction
• N training cases 1, …, N• Denoting the index of the exemplar
representing training case by • similarity between training case and by • the fitness function is• An example of metric similarity• If training case is an exemplar
is not computed in the same way as
i ic
i k ( , )s i k
1( ) ( , )
N
iiS c s i c
2( , ) || ||i ks i k x x
i
( , )s i i ( , )s i k

Introduction
• Maximizing w.r.t , subject to the constraints that for all
• This problem is NP-hard [12]
• In [10], the input similarities need not be metric (i.e., need not be symmetric or satisfy the triangle inequality)
( )S c ci
[12] M. Charikar, S. Guha, A. Tardos, D. B. Shmoys 2002. J. Computer and System Science 65, 129.[10] K. Toyama, A. Blake 2002. Probabilistic tracking with exemplars in a metric space. Int. J. of Computer Vision 48:1, 9-19.
Introduction
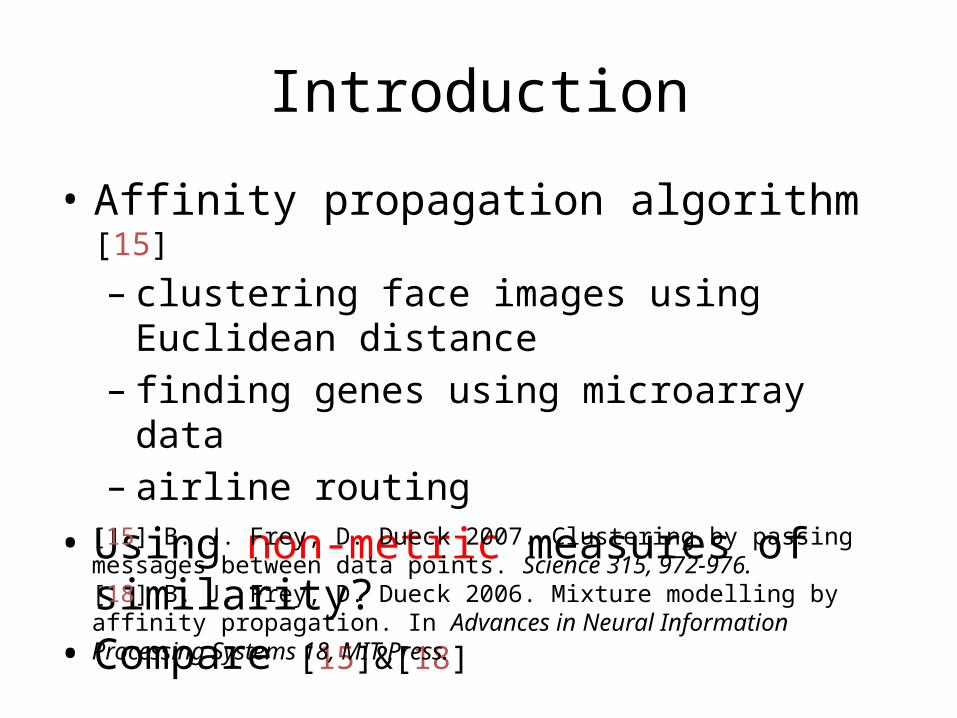
• Affinity propagation algorithm [15]
– clustering face images using Euclidean distance– finding genes using microarray data– airline routing
• Using non-metric measures of similarity?• Compare [15]&[18]
[15] B. J. Frey, D. Dueck 2007. Clustering by passing messages between data points. Science 315, 972-976.[18] B. J. Frey, D. Dueck 2006. Mixture modelling by affinity propagation. In Advances in Neural Information Processing Systems 18, MIT Press.

Introduction
• Affinity propagation– “responsibility” r(i,k), sent from data point i to
candidate exemplar point k, reflects the accumulated evidence for how well-suited point k is to serve as the exemplar for point i
– “availability” a(i,k), sent from candidate exemplar point k to point i, reflects the accumulated evidence for how appropriate it would be for point i to choose point k as its exemplar

Introduction

Introduction

Outline
1. Introduction2. Comparison of the NIPS (2006) and Science
(2007) Algorithms3. Unsupervised Categorization of Olivetti Face
Images4. Unsupervised Categorization of Caltech101
Images Using SIFT Features5. Conclusions

Comparison of the NIPS (2006) and Science (2007) Algorithms
• NIPS (2006) disallows singleton clusters• To compare the two algorithms– clustering patches taken from an image [18]
– a tiling of 24 × 24 non-overlapping patches– translation-invariant similarities were computed
by comparing smaller 16 × 16 windows– similarity measure: the lowest squared error
between windows (over all possible translations)

Comparison of the NIPS (2006) and Science (2007) Algorithms
• 100,000 k-centers clustering for each K

Outline
1. Introduction2. Comparison of the NIPS (2006) and Science
(2007) Algorithms3. Unsupervised Categorization of Olivetti Face
Images4. Unsupervised Categorization of Caltech101
Images Using SIFT Features5. Conclusions

Unsupervised Categorization of Olivetti Face Images
• Olivetti face database– ten 64 × 64 grey-scale images of each of 40 individuals– extracted a centered 50 × 50 region– normalized the pixel intensities
• To examine the effect of a wider range in image variation for each individual– extracting the images of 10 individuals, applying 3 in-
plane rotations and 3 scalings, producing a data set of 900 images
• equal to the same common value( , )s i i
Unsupervised Categorization of Olivetti Face Images
• Performance on squared error• Performance on unsupervised image
classification• Performance using non-metric similarities

Performance on squared error
• Using the 900 images including rotations and scales
• similarity between image and image to the negative of the sum of squared pixel differences
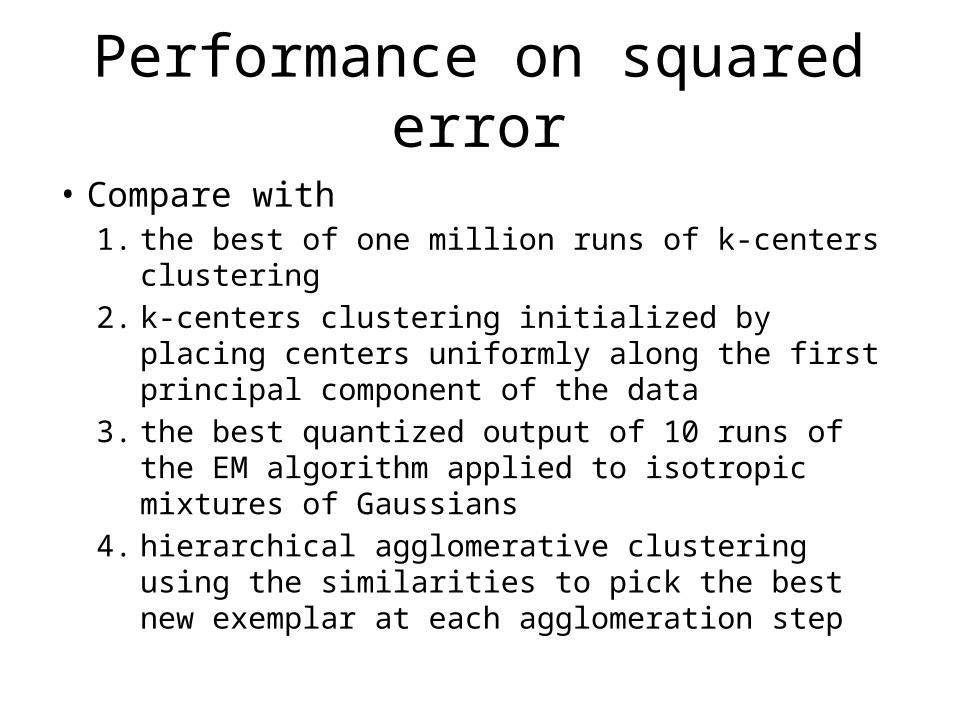
• 10,000 runs of k-centers clustering• defined the baseline error to be the 1st
percentile of error found by the 10,000 runs of k-centers clustering
i k
Performance on squared error
• Compare with1. the best of one million runs of k-centers clustering2. k-centers clustering initialized by placing centers
uniformly along the first principal component of the data
3. the best quantized output of 10 runs of the EM algorithm applied to isotropic mixtures of Gaussians
4. hierarchical agglomerative clustering using the similarities to pick the best new exemplar at each agglomeration step

Performance on squared error

Performance on unsupervised image classification
• Two approaches to measuring the unsupervised classification error1. Each learned category is associated with the true
category that accounts for the largest number of training cases
2. ‘rate of true association’, pairs of images from the same true category‘rate of false association’, pairs of images from different true categories

Performance on unsupervised image classification

Performance using non-metric similarities
• When comparing two face images– Euclidean distance ignores the fact that certain
facial features may appear in different positions• Making the similarity non-metric can achieve
higher classification rates

Performance using non-metric similarities
• Previous similarity:• non-metric similarity :
: window out of the center of the image : window of a fixed size
2( , ) || ||i ks i k x x
20( , ) min || ||i k
Ts i k T x Tx
T0T
0T T

Performance using non-metric similarities
Outline
1. Introduction2. Comparison of the NIPS (2006) and Science
(2007) Algorithms3. Unsupervised Categorization of Olivetti Face
Images4. Unsupervised Categorization of Caltech101
Images Using SIFT Features5. Conclusions

Unsupervised Categorization of Caltech101 Images Using SIFT Features
• Caltech101 image dataset• SIFT– For each local feature from the first image, the
nearest and second nearest features are found in the second image (Euclidean distance)
– If the distance ratio between the nearest and second-nearest neighbors is greater than 0.8, the match is considered significant

Unsupervised Categorization of Caltech101 Images Using SIFT Features
• : the number of significant feature matches found comparing image with image
• • selected 20 of the 101 classes– faces, motorbikes, binocular, brain, camera,
garfield, pagoda, snoopy, stapler, stop sign, …– 1230 images
( , )m i k
i k
1 1
1 1( , ) ( , ) ( , ) ( , )
n n
j js i k m i k m i j m j k
n n

An example of a category learned by affinity propagation

Unsupervised Categorization of Caltech101 Images Using SIFT Features

Outline
1. Introduction2. Comparison of the NIPS (2006) and Science
(2007) Algorithms3. Unsupervised Categorization of Olivetti Face
Images4. Unsupervised Categorization of Caltech101
Images Using SIFT Features5. Conclusions

Conclusions
• Affinity propagation can be used to achieve high classification rates
• Using non-metric similarity functions increases classification rates