Non-invasive 13 C-glucose breath test using residual gas analyzer-mass spectrometry: a novel tool...
8
This content has been downloaded from IOPscience. Please scroll down to see the full text. Download details: IP Address: 134.48.29.181 This content was downloaded on 15/08/2014 at 21:12 Please note that terms and conditions apply. Non-invasive 13 C-glucose breath test using residual gas analyzer-mass spectrometry: a novel tool for screening individuals with pre-diabetes and type 2 diabetes View the table of contents for this issue, or go to the journal homepage for more 2014 J. Breath Res. 8 036001 (http://iopscience.iop.org/1752-7163/8/3/036001) Home Search Collections Journals About Contact us My IOPscience
Transcript of Non-invasive 13 C-glucose breath test using residual gas analyzer-mass spectrometry: a novel tool...

This content has been downloaded from IOPscience. Please scroll down to see the full text.
Download details:
IP Address: 134.48.29.181
This content was downloaded on 15/08/2014 at 21:12
Please note that terms and conditions apply.
Non-invasive 13C-glucose breath test using residual gas analyzer-mass spectrometry: a novel
tool for screening individuals with pre-diabetes and type 2 diabetes
View the table of contents for this issue, or go to the journal homepage for more
2014 J. Breath Res. 8 036001
(http://iopscience.iop.org/1752-7163/8/3/036001)
Home Search Collections Journals About Contact us My IOPscience
1 © 2014 IOP Publishing Ltd Printed in the UK
Chiranjit Ghosh1, Abhijit Maity1, Gourab D Banik1, Suman Som1, Arpita Chakraborty2, Chitra Selvan2, Shibendu Ghosh3, Barnali Ghosh4, Subhankar Chowdhury2 and Manik Pradhan1,5
1 Department of Chemical, Biological and Macromolecular Sciences, S. N. Bose National Centre for Basic Sciences, Salt Lake, JD Block, Sector III, Kolkata-700098, India2 Department of Endocrinology, Institute of Post Graduate Medical Education & Research and SSKM Hospital, 244 A.J.C Bose Road, Kolkata-700020, India3 Department of Medicine, Vivekananda Institute of Medical Sciences, 99 Sarat Bose Road, Kolkata-700027, India4 Department of Condensed Matter Physics and Material Sciences, S. N. Bose National Centre for Basic Sciences, Salt Lake, JD Block, Sector III, Kolkata-700098, India5 Thematic Unit of Excellence on Nanodevice Technology, S.N. Bose National Centre for Basic Sciences, Salt Lake, JD Block, Sector III, Kolkata-700098, India
Email: [email protected]
Received 25 February 2014, revised 10 May 2014Accepted for publication 27 May 2014Published 19 June 2014
AbstractWe report, for the first time, the clinical feasibility of a novel residual gas analyzer mass spectrometry (RGA-MS) method for accurate evaluation of the 13C-glucose breath test (13C-GBT) in the diagnosis of pre-diabetes (PD) and type 2 diabetes mellitus (T2D). In T2D or PD, glucose uptake is impaired and results in blunted isotope enriched 13CO2 production in exhaled breath samples. Using the Receiver operating characteristics (ROC) curve analysis, an optimal diagnostic cut-off point of the 13CO2/12CO2 isotope ratios expressed as the delta-over-baseline (DOB) value, was determined to be δDOB
13C‰ = 28.81‰ for screening individuals with non-diabetes controls (NDC) and pre-diabetes (PD), corresponding to a sensitivity of 100% and specificity of 94.4%. We also determined another optimal diagnostic cut-off point of δDOB
13C‰ = 19.88‰ between individuals with PD and T2D, which exhibited 100% sensitivity and 95.5% specificity. Our RGA-MS methodology for the 13C-GBT also manifested a typical diagnostic positive and negative predictive value of 96% and 100%, respectively. The diagnostic accuracy, precision and validity of the results were also confirmed by high-resolution optical cavity enhanced integrated cavity output spectroscopy (ICOS) measurements. The δDOB
13C‰ values measured with RGA-MS method, correlated favourably (R2 = 0.979) with those determined by the laser based ICOS method. Moreover, we observed that the effects of endogenous CO2 production related to basal metabolic rates in individuals were statistically insignificant (p = 0.37 and 0.73) on the diagnostic accuracy. Our findings suggest that the RGA-MS is a valid and sufficiently robust method for the 13C-GBT which may serve as an alternative non-invasive point-of-care diagnostic tool for routine clinical practices as well as for large-scale diabetes screening purposes in real-time.
Keywords: breath analysis, residual gas analyzer, diabetes, glucose breath test
S Online supplementary data available from stacks.iop.org/JBR/8/036001/mmedia
(Some figures may appear in colour only in the online journal)
Journal of Breath Research
Non-invasive 13C-glucose breath test using residual gas analyzer-mass spectrometry: a novel tool for screening individuals with pre-diabetes and type 2 diabetes
C Ghosh et al
Printed in the UK
036001
jbr
© 2014 IOP Publishing Ltd
2014
8
j. breath res.
jbr
1752-7155
10.1088/1752-7155/8/3/036001
Papers
3
journal of breath research
IOP
1752-7155/14/036001+7$33.00
doi:10.1088/1752-7155/8/3/036001J. Breath Res. 8 (2014) 036001 (7pp)

C Ghosh et al
2
1. Introduction
Type 2 diabetes mellitus is the most common deleterious metabolic disease in the 21st century and has become one of the most pressing human health concerns all over the world, with an estimated high prevalence of 101 million individuals by the year 2030 in India [1–3]. Several pieces of evidence suggest that insulin resistance and pancreatic β-cell dysfunc-tion play an important role in the pathogenesis of type 2 diabetes [4, 5]. Insulin resistance is also associated with a cluster of risk factors (referred to as metabolic syndromes) for increased cardiovascular disease [6]. It is still the sub-ject of debate when or how to recognize individuals at high risk of altered insulin action or during the preclinical phase of type 2 diabetes [7]. Hence an accurate and fast practical diagnosis of pre-diabetes prior to the onset of type 2 diabetes remains a challenge.
Recently, the 13C-glucose breath test (13C-GBT) [8] has been proposed as a non-invasive method for assessing impaired glucose tolerance in comparison to the gold standard direct invasive method called the hyperinsulinemic-euglycemic clamp [5, 8] and the surrogate methods, such as homeostasis model assessment (HOMA) and quantita-tive insulin sensitivity check index (QUICKI) [9], estimated from the measurement of blood glucose and plasma insulin. The 13C-GBT is based on the principle that when a dose of 13C-labelled glucose substrate is orally ingested and metab-olized, 13CO2 is exhaled by the respiratory system. In dia-betes mellitus, it is expected that less 13CO2 will be exhaled because of impaired glucose uptake by the cells. However, the widespread clinical efficacy of the 13C-GBT, exhibiting diagnostic sensitivity, specificity, test accuracy, and positive and negative predictive values along with optimal diagnostic cut-off points for large-scale screening individuals with non-diabetes, pre- diabetes and type 2 diabetes mellitus, has not yet been explored. Furthermore, to the best of our knowledge, no studies to date have elucidated whether endogenous CO2 production related to the basal metabolic rates (BMR) in indi-viduals would affect the diagnostic accuracy of the 13C-GBT for pre-diabetes and type 2 diabetes. Therefore there is a pressing need to accurately evaluate the 13C-GBT for routine clinical practice.
The 13C-GBT is used to determine the 13CO2/12CO2 iso-tope ratios in exhaled breath samples, usually expressed as the delta-over-baseline (DOB) values i.e. δDOB
13C‰, and have previously been demonstrated using conventional high-precision gas-chromatography coupled with isotope ratio mass-spectrometry (GC-IRMS [8]). Although traditional GC-IRMS methodologies are highly reliable, there remain some intrinsic drawbacks. In particular, GC-IRMS systems are fairly costly, not portable, require specialized expertise to operate and maintain, and are not suitable for real-time on-line measurements—facts that have hindered significantly the widespread applicability of GC-IRMS systems for breath analysis as a daily decision-making tool for use at point-of-care (POC) facilities. It is therefore of immense interest to develop a simple, robust and cost-effective alternative non-invasive diagnostic tool for the 13C-GBT that can reliably and
accurately analyze breath samples in real-time at the point-of-care. We have recently developed and validated a simple, low-cost residual gas analyzer-mass spectrometry (RGA-MS) method for non-invasive diagnosis of H. pylori infection [10]. The aim of the present study was therefore to standardize and validate this novel analytical RGA-MS method in the 13C-GBT for non-invasive assessment of pre-diabetes and type 2 diabetes mellitus in real time, and eventually to explore its true potential for routine clinical practice.
In the present study, we report for the first time the clinical utility of the 13C-GBT using a simple RGA-MS system as an alternative non-invasive method for screening individuals at risk for diabetes. The diagnostic accuracy and the feasibility of 13C-GBT by RGA-MS were also validated by comparison with an established laser-based cavity-enhanced absorption technique called integrated cavity output spectroscopy (ICOS). Finally, we determined numerous diagnostic, statistically significant parameters of the 13C-GBT including sensitivity, specificity, and the optimal cut-off point for the δDOB
13C‰ values to delineate the applicability of the RGA-MS technique as a POC non-invasive diagnostic tool for large-scale diabetes screening tests.
2. Materials and methods
2.1. Subjects
Sixty-five individuals (n = 18 non-diabetes controls, n = 22 pre-diabetes, n = 25 type 2 diabetes) within the age group of 25–79 yrs (mean age 48.98 ± 14.37 yrs) were selected for the present 13C-GBT. Individuals with a previous history of diabetes, smoking, abuse of drugs and alcohol, or taking any medication which could alter glucose or lipid metabolism, were strictly excluded from the present study. Patients with history of any chronic respiratory disorders or on any inhalers were also excluded. On the basis of their 2-h oral glucose tolerance test (OGTT) blood glucose levels and glycosylated haemoglobin (HbA1c) measurements, subjects were classi-fied into three different groups: non-diabetes controls (NDC) (2-h OGTT < 140 mg dl−1 and HbA1c <5.7), pre-diabetes (PD) (2-h OGTT, 140–199 mg dl−1 and 5.7 ⩽ HbA1c <6.5) and type 2 diabetes (T2D) (2-h OGTT ⩾ 200 mg dl−1 and HbA1c ⩾ 6.5) as outlined by the American Diabetes Association [11]. The detailed description of the subject characteristics is presented in table 1 and also described in the supporting information (available online at stacks.iop.org/JBR/8/036001/mmedia). All participants gave their written informed consent before participating in the study. The whole protocol was approved by the Institutional Ethics Committee of Post Graduate Medical Education & Research (IPGMER), Kolkata (Memo No. Inst/IEC/275). The study also received administrative approval from the S.N. Bose Centre, Kolkata (Ref. No: SNB/PER-2-6001/13–14/1769).
2.2. Breath sample collection
Following an overnight fast (~10–12 hr), a baseline breath sample was collected in a breath sample collection bag
J. Breath Res. 8 (2014) 036001

C Ghosh et al
3
(QUINTRON, USA, SL No.QT00892) from each subject. Then the subjects were instructed to ingest a test drink containing 75 mg U-13C6 labelled D-glucose (CIL-CLM-1396-CTM, Cambridge Isotope Laboratories, Inc. USA) along with 75 gm normal glucose dissolved in 150 ml water. All subjects were asked to move within the room and were not allowed to take any food or drink during the study. Post-dose breath samples were collected in breath sample collection bags after 120 min of glucose load. Breath collec-tion bags were designed in such a way that the oral-breath first passed into a dead space and then the endogenously produced deep-breath (end expiratory breath) entered into the 750 ml reservoir bags through a one-way valve. Breath samples were drawn from the reservoir bags by an air tight syringe (QUINTRON) fitted with a T-connector onto the bags. All breath samples were repeated and analyzed immediately by both RGA-MS and ICOS systems for cross verification and validation of the experimental results as described below.
2.3. Residual gas analyzer-mass spectrometry (RGA-MS)
We employed the residual gas analyzer-mass spectrometry (RGA-MS) that exploits a conventional quadrupole mass filter technology with a Faraday cup detector to measure the masses of 13C16O16O (45 amu) and 12C16O16O (44 amu) iso-topes in exhaled breath samples. A schematic diagram of the RGA-MS system for the analysis of exhaled breath samples is depicted in figure 1.
The RGA-MS system and its potential for measuring carbon isotopes with a typical precision of ±0.25‰ in breath samples has been described in detail in our previous study [10]. In brief, an RGA was coupled with a high vacuum chamber (~9.0 × 10⁻⁸ Torr) and the baseline vacuum was achieved by two turbo-molecular pumps backed up with a diaphragm pump. The vacuum chamber was equipped with two all-metal leak valves and a manually actuated gate valve to control flow of breath samples into the vacuum chamber as well as to sustain the working pressure (2.1–2.4 × 10⁻⁷ Torr) for the measurements. The ion currents for the masses 44 and 45 amu were measured with a scanning rate of 0.1 s amu−1 by Quadera software (Prisma plus, version 4.50) in the selected multiple ion current detection (MID) mode. Typically a total number of 15–20 data points were recorded for each mass to calculate the δ13C‰ values and subsequently the results were reported as the δDOB
13C‰ values, i.e. the difference in
the δ13C‰ values between the baseline and 120 min breath samples as defined below:
⎡⎣⎢
⎛⎝⎜
⎞⎠⎟
⎤⎦⎥δ = − ×
R
RC‰ 1 1000DOB
13 sample
standard (1)
δ δ δ= −= =C ( C‰) ( C‰)t t tDOB13
13‰13
min13
0 min (2)
where Rsample is the 13C/12 C isotope ratio of the sample and Rstandard is the international standard Pee Dee Belemnite (PDB) value i.e. 0.0112372.
2.4. Integrated cavity output spectroscopy (ICOS)
The results of the RGA-MS system were further validated by a well-established high-resolution isotopic CO2 integrated cavity output spectrometer (ICOS). The technical details of the ICOS system (CCIA 36-EP, Los Gatos research, USA) and its capability of measuring high-precision 13CO2/12CO2 isotope ratios in breath samples have previously been reported [12–14]. In brief, the ICOS system is comprised of a 59 cm long high-finesse optical cavity with two high reflectivity mir-rors (R~99.98%) at the two ends which allows the laser light to move back and forth several times inside the cavity pro-viding an effective optical path-length of 3 km. A continuous wave distributed feedback diode laser operating at ~2.05 μm was used in the ICOS instrument and the laser frequency was tuned over 20 GHz to scan simultaneously the R(28) and P(16) rotational lines of 12CO2 and 13CO2, respectively, in the (2,00,1)←(0,00,0) vibrational combination band of the CO2 molecule. The real-time ro-vibrational absorption features were fitted with Voigt profiles and subsequently Beer’s law was used to determine the absolute concentrations of 12CO2 and 13CO2 in the breath samples.
2.5. Validation of δDOB13C‰ measurements by RGA-MS and
ICOS for 13C-GBT
We utilized three certified standard calibration gases of 5% CO2 in air with different δ13C‰ values (i.e. δ13C‰ = −22.8‰, −13.22‰ and −7.3‰, Cambridge Isotope Laboratory, CIL, USA) to verify the precision and accuracy of the measurements by both the RGA-MS and ICOS systems for δDOB
13C‰ values in the exhaled breath samples. The typical precision of the RGA-MS and ICOS system was 0.25‰ and 0.15‰, respec-tively in the δ13C‰ measurements of calibration standards
Table 1. Characteristics of study subjects. Data are expressed as mean ± SD. The abbreviations M and F stand for male and female, respectively. *Represents statistically significant difference among normal, pre-diabetes and type 2 diabetes.
Non-diabetes control (NDC) (n = 18)
Pre-diabetes (PD) (n = 22)
Diabetes (T2D) (n = 25) p values
Sex (M/F) 11/7 12/10 15/10Age (years) 41.72 ± 11.5 51.45 ± 15.3 50.08 ± 15.4 0.083Weight (kg) 59.45 ± 9.5 63.51 ± 7.8 59.96 ± 11.4 0.342BMI (kg m−2) 23.37 ± 0.8 23.83 ± 0.7 23.36 ± 1.2 0.148Fasting blood glucose (mg dl−1) 98.61 ± 11.8 110.64 ± 10.8 221.52 ± 80.3 <0.001*Fasting plasma insulin (μ IU ml−1) 4.5 ± 0.6 9.22 ± 0.6 23.65 ± 1.2 0.0015*2-h postload plasma glucose 133.16 ± 12.4 182.27 ± 12.5 307.56 ± 42.8 <0.001*HbA1c (%) 5.28 ± 0.2 6.11 ± 0.2 9.63 ± 1.6 <0.001*
J. Breath Res. 8 (2014) 036001

C Ghosh et al
4
with accuracy in the range of 98–99%. The detailed results for the analysis are described in the supporting information.
2.6. Statistical analysis
Results were expressed as mean ± SD. One way analysis of variance (ANOVA) was used to compare normally distributed variables whereas non-normal distributed data were analyzed by the Kruskal–Wallis and Mann–Whitney tests. Receiver operating characteristic curves (ROC) [15] were constructed by plotting sensitivity (true positive rate) versus 1-specificity (false positive rate) to obtain the different cut-off points of the δDOB
13C‰ values. The optimal diagnostic cut-off point was chosen at the point which exhibited maximum sensitivity and specificity after taking into consideration HbA1c and 2-h OGTT tests as the gold standard methods for the diagnosis of type 2 diabetes. Statistical analyses were performed using Origin Pro 8.0 (Origin Lab Corporation, USA) and Analyse-it Method Evaluation software (Analyse-it Software Ltd, UK,
version 2.30). A two sided p-value of less than 0.05 was con-sidered as statistically significant.
3. Results and discussion
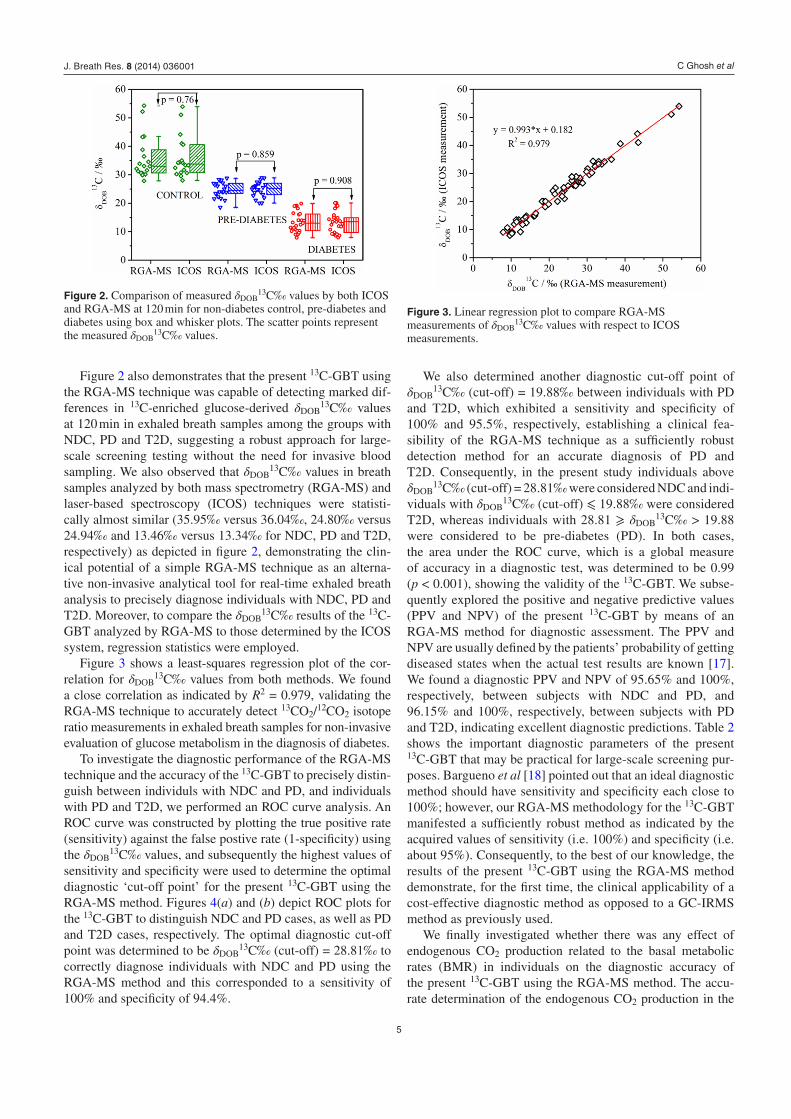
In the present study, box and whisker plots were utilized to assess the distribution of 13CO2 enrichments in exhaled breath samples for NDC, PD and T2D individuals. Figure 2 illus-trates the box and whisker plots of δDOB
13C‰ values mea-sured by both RGA-MS and ICOS methods. We observed that the mean DOB value for the group with T2D (mean δDOB
13C‰ = 13.46‰) measured by RGA-MS was signifi-cantly lower (p < 0.001) compared to the groups with NDC (mean δDOB
13C‰ = 35.94‰) and PD (mean δDOB13C‰ =
24.80‰). In cases of T2D and pre-diabetes, glucose uptake would be impaired because of diminished pancreatic insulin secretion or impaired insulin action on the target tissue [16], resulting in blunted glucose oxidation and consequently the reduced rate of generation of 13CO2 in exhaled breath samples.
Figure 1. A residual gas analyzer-mass spectrometer (RGA-MS) coupled with a high vacuum (HV) chamber for breath analysis. Abbreviations AMLV and TMP stand for all metal leak valve and turbo molecular pump respectively.
J. Breath Res. 8 (2014) 036001
C Ghosh et al
5
Figure 2 also demonstrates that the present 13C-GBT using the RGA-MS technique was capable of detecting marked dif-ferences in 13C-enriched glucose-derived δDOB
13C‰ values at 120 min in exhaled breath samples among the groups with NDC, PD and T2D, suggesting a robust approach for large-scale screening testing without the need for invasive blood sampling. We also observed that δDOB
13C‰ values in breath samples analyzed by both mass spectrometry (RGA-MS) and laser-based spectroscopy (ICOS) techniques were statisti-cally almost similar (35.95‰ versus 36.04‰, 24.80‰ versus 24.94‰ and 13.46‰ versus 13.34‰ for NDC, PD and T2D, respectively) as depicted in figure 2, demonstrating the clin-ical potential of a simple RGA-MS technique as an alterna-tive non-invasive analytical tool for real-time exhaled breath analysis to precisely diagnose individuals with NDC, PD and T2D. Moreover, to compare the δDOB
13C‰ results of the 13C-GBT analyzed by RGA-MS to those determined by the ICOS system, regression statistics were employed.
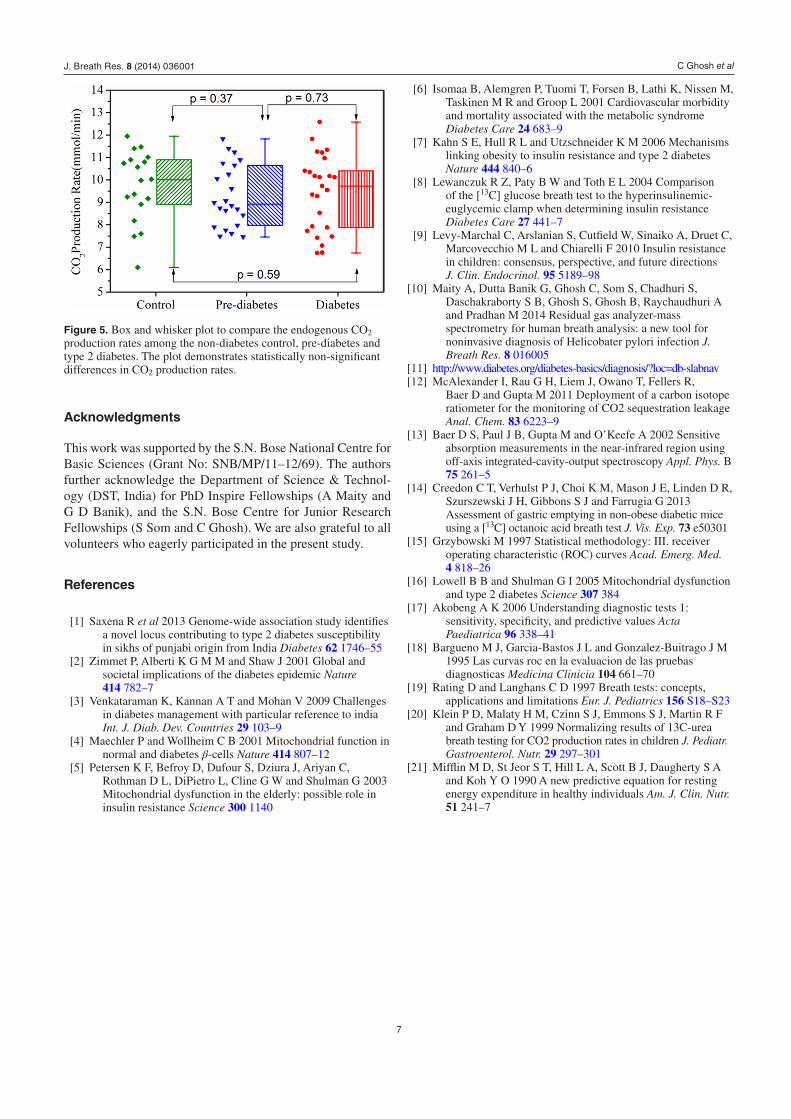
Figure 3 shows a least-squares regression plot of the cor-relation for δDOB
13C‰ values from both methods. We found a close correlation as indicated by R2 = 0.979, validating the RGA-MS technique to accurately detect 13CO2/12CO2 isotope ratio measurements in exhaled breath samples for non-invasive evaluation of glucose metabolism in the diagnosis of diabetes.
To investigate the diagnostic performance of the RGA-MS technique and the accuracy of the 13C-GBT to precisely distin-guish between individuls with NDC and PD, and individuals with PD and T2D, we performed an ROC curve analysis. An ROC curve was constructed by plotting the true positive rate (sensitivity) against the false postive rate (1-specificity) using the δDOB
13C‰ values, and subsequently the highest values of sensitivity and specificity were used to determine the optimal diagnostic ‘cut-off point’ for the present 13C-GBT using the RGA-MS method. Figures 4(a) and (b) depict ROC plots for the 13C-GBT to distinguish NDC and PD cases, as well as PD and T2D cases, respectively. The optimal diagnostic cut-off point was determined to be δDOB
13C‰ (cut-off) = 28.81‰ to correctly diagnose individuals with NDC and PD using the RGA-MS method and this corresponded to a sensitivity of 100% and specificity of 94.4%.
We also determined another diagnostic cut-off point of δDOB
13C‰ (cut-off) = 19.88‰ between individuals with PD and T2D, which exhibited a sensitivity and specificity of 100% and 95.5%, respectively, establishing a clinical fea-sibility of the RGA-MS technique as a sufficiently robust detection method for an accurate diagnosis of PD and T2D. Consequently, in the present study individuals above δDOB
13C‰ (cut-off) = 28.81‰ were considered NDC and indi-viduals with δDOB
13C‰ (cut-off) ⩽ 19.88‰ were considered T2D, whereas individuals with 28.81 ⩾ δDOB
13C‰ > 19.88 were considered to be pre-diabetes (PD). In both cases, the area under the ROC curve, which is a global measure of accuracy in a diagnostic test, was determined to be 0.99 (p < 0.001), showing the validity of the 13C-GBT. We subse-quently explored the positive and negative predictive values (PPV and NPV) of the present 13C-GBT by means of an RGA-MS method for diagnostic assessment. The PPV and NPV are usually defined by the patients’ probability of getting diseased states when the actual test results are known [17]. We found a diagnostic PPV and NPV of 95.65% and 100%, respectively, between subjects with NDC and PD, and 96.15% and 100%, respectively, between subjects with PD and T2D, indicating excellent diagnostic predictions. Table 2 shows the important diagnostic parameters of the present 13C-GBT that may be practical for large-scale screening pur-poses. Bargueno et al [18] pointed out that an ideal diagnostic method should have sensitivity and specificity each close to 100%; however, our RGA-MS methodology for the 13C-GBT manifested a sufficiently robust method as indicated by the acquired values of sensitivity (i.e. 100%) and specificity (i.e. about 95%). Consequently, to the best of our knowledge, the results of the present 13C-GBT using the RGA-MS method demonstrate, for the first time, the clinical applicability of a cost-effective diagnostic method as opposed to a GC-IRMS method as previously used.
We finally investigated whether there was any effect of endogenous CO2 production related to the basal metabolic rates (BMR) in individuals on the diagnostic accuracy of the present 13C-GBT using the RGA-MS method. The accu-rate determination of the endogenous CO2 production in the
Figure 2. Comparison of measured δDOB13C‰ values by both ICOS
and RGA-MS at 120 min for non-diabetes control, pre-diabetes and diabetes using box and whisker plots. The scatter points represent the measured δDOB
13C‰ values.
Figure 3. Linear regression plot to compare RGA-MS measurements of δDOB
13C‰ values with respect to ICOS measurements.
J. Breath Res. 8 (2014) 036001

C Ghosh et al
6
13C-breath test is still a controversial issue [19]. Endogenous CO2 production is usually influenced by age (adults > chil-dren), weight, height and sex (male > female) [20] and con-sequently the δDOB
13C‰ values are also expected to vary in accordance with these factors. Therefore to assess the effect of endogenous CO2 production in the present 13C-GBT, we applied the Mifflin–St Joer equations [21] to calculate the BMR based on age, weight and height of either sex and the following equations [20] were used:
=××
VCO production rate (mmol / min)
1000
24 602
CO2 (3)
=V (mol / day)Energy expenditure (EE)
134.25CO2 (4)
=
×
Energy expenditure (EE)(kcal / day) Physical activity
level(PAL) BMR (5)
Figure 5 depicts box and whisker plots of the endogenous CO2 production rate for three different groups of subjects. We observed that there were no statistically significant differences (p = 0.37 and 0.73) among the endogenous CO2 production rates estimated for normal, pre-diabetes and type 2 diabetes, indicating the negligible effect of BMR-based endogenous CO2 production on diagnostic accuracy.
4. Conclusion
This study confirms the clinical feasibility of a novel RGA-MS method for accurate evaluation of the 13C-GBT in the diag-nosis of non-diabetes control, pre-diabetes and type 2 diabetes in real-time, thus making it a valid and potentially robust non-invasive diagnostic tool for routine clinical practices at the point-of-care. Our results also suggest that the 13C-GBT using a simple RGA-MS method can reliably assesses the changes in glucose metabolism in real time. The present 13C-breath analysis instrument is compact, easy-to-run, more portable and inexpensive compared to currently avail-able optical spectroscopy and MS-based detection methods, suggesting a simple alternative non-invasive screening tool for the measurement of high-precision δDOB
13C‰ values in exhaled breath samples, not only from diabetes or non-dia-betes, but also from any other disease or metabolic disorder. However, the cost of the 13C-glucose breath test may be con-sidered to be of concern from the economic point of view, since 13C-glucose is much more expensive than blood sugar analysis. This is the main limitation of the 13C-glucose breath test (13C-GBT) for screening diabetes. Nevertheless, utilizing the RGA-MS methodology rather than GC-IRMS, the overall cost of the 13C-GBT will likely not be prohibitive in the near future in order to screen diabetes even in economically devel-oping countries like India.
Table 2. Important diagnostic parameters of 13C-GBT by RGA-MS for screening non-diabetes control (NDC), pre-diabetes (PD) and type 2 diabetes (T2D). AUC: area under the curve; PPV: positive predictive value; NPV: negative predictive value.
GroupsCut-off points δDOB
13C‰ Sensitivity Specificity PPV NPV AUC Accuracy
NDC vs PD 28.81‰ 100% 94.4% 95.65% 100% 0.99 97.5%PD vs T2D 19.88‰ 100% 95.5% 96.15% 100% 0.99 97.87%
Figure 4. Receiver operating characteristic (ROC) curves used to obtain the optimal cut-off points of δDOB13C‰ for screening (a) non-diabetes
control (NDC) and pre-diabetes (PD) and (b) pre-diabetes (PD) and type 2 diabetes (T2D).
J. Breath Res. 8 (2014) 036001
C Ghosh et al
7
Acknowledgments
This work was supported by the S.N. Bose National Centre for Basic Sciences (Grant No: SNB/MP/11–12/69). The authors further acknowledge the Department of Science & Technol-ogy (DST, India) for PhD Inspire Fellowships (A Maity and G D Banik), and the S.N. Bose Centre for Junior Research Fellowships (S Som and C Ghosh). We are also grateful to all volunteers who eagerly participated in the present study.
References
[1] Saxena R et al 2013 Genome-wide association study identifies a novel locus contributing to type 2 diabetes susceptibility in sikhs of punjabi origin from India Diabetes 62 1746–55
[2] Zimmet P, Alberti K G M M and Shaw J 2001 Global and societal implications of the diabetes epidemic Nature 414 782–7
[3] Venkataraman K, Kannan A T and Mohan V 2009 Challenges in diabetes management with particular reference to india Int. J. Diab. Dev. Countries 29 103–9
[4] Maechler P and Wollheim C B 2001 Mitochondrial function in normal and diabetes β-cells Nature 414 807–12
[5] Petersen K F, Befroy D, Dufour S, Dziura J, Ariyan C, Rothman D L, DiPietro L, Cline G W and Shulman G 2003 Mitochondrial dysfunction in the elderly: possible role in insulin resistance Science 300 1140
[6] Isomaa B, Alemgren P, Tuomi T, Forsen B, Lathi K, Nissen M, Taskinen M R and Groop L 2001 Cardiovascular morbidity and mortality associated with the metabolic syndrome Diabetes Care 24 683–9
[7] Kahn S E, Hull R L and Utzschneider K M 2006 Mechanisms linking obesity to insulin resistance and type 2 diabetes Nature 444 840–6
[8] Lewanczuk R Z, Paty B W and Toth E L 2004 Comparison of the [13C] glucose breath test to the hyperinsulinemic-euglycemic clamp when determining insulin resistance Diabetes Care 27 441–7
[9] Levy-Marchal C, Arslanian S, Cutfield W, Sinaiko A, Druet C, Marcovecchio M L and Chiarelli F 2010 Insulin resistance in children: consensus, perspective, and future directions J. Clin. Endocrinol. 95 5189–98
[10] Maity A, Dutta Banik G, Ghosh C, Som S, Chadhuri S, Daschakraborty S B, Ghosh S, Ghosh B, Raychaudhuri A and Pradhan M 2014 Residual gas analyzer-mass spectrometry for human breath analysis: a new tool for noninvasive diagnosis of Helicobater pylori infection J. Breath Res. 8 016005
[11] http://www.diabetes.org/diabetes-basics/diagnosis/?loc=db-slabnav[12] McAlexander I, Rau G H, Liem J, Owano T, Fellers R,
Baer D and Gupta M 2011 Deployment of a carbon isotope ratiometer for the monitoring of CO2 sequestration leakage Anal. Chem. 83 6223–9
[13] Baer D S, Paul J B, Gupta M and O’Keefe A 2002 Sensitive absorption measurements in the near-infrared region using off-axis integrated-cavity-output spectroscopy Appl. Phys. B 75 261–5
[14] Creedon C T, Verhulst P J, Choi K M, Mason J E, Linden D R, Szurszewski J H, Gibbons S J and Farrugia G 2013 Assessment of gastric emptying in non-obese diabetic mice using a [13C] octanoic acid breath test J. Vis. Exp. 73 e50301
[15] Grzybowski M 1997 Statistical methodology: III. receiver operating characteristic (ROC) curves Acad. Emerg. Med. 4 818–26
[16] Lowell B B and Shulman G I 2005 Mitochondrial dysfunction and type 2 diabetes Science 307 384
[17] Akobeng A K 2006 Understanding diagnostic tests 1: sensitivity, specificity, and predictive values Acta Paediatrica 96 338–41
[18] Bargueno M J, Garcia-Bastos J L and Gonzalez-Buitrago J M 1995 Las curvas roc en la evaluacion de las pruebas diagnosticas Medicina Clinicia 104 661–70
[19] Rating D and Langhans C D 1997 Breath tests: concepts, applications and limitations Eur. J. Pediatrics 156 S18–S23
[20] Klein P D, Malaty H M, Czinn S J, Emmons S J, Martin R F and Graham D Y 1999 Normalizing results of 13C-urea breath testing for CO2 production rates in children J. Pediatr. Gastroenterol. Nutr. 29 297–301
[21] Mifflin M D, St Jeor S T, Hill L A, Scott B J, Daugherty S A and Koh Y O 1990 A new predictive equation for resting energy expenditure in healthy individuals Am. J. Clin. Nutr. 51 241–7
Figure 5. Box and whisker plot to compare the endogenous CO2 production rates among the non-diabetes control, pre-diabetes and type 2 diabetes. The plot demonstrates statistically non-significant differences in CO2 production rates.
J. Breath Res. 8 (2014) 036001


![Development of a Compact, IoT-enabled Electronic Nose for ... · [1] Westhoff, M. et al. Ion mobility spectrometry for the detection of VOCs in exhaled breath of patients with lung](https://static.fdocuments.in/doc/165x107/5f760734f4d11a15454bfffc/development-of-a-compact-iot-enabled-electronic-nose-for-1-westhoff-m-et.jpg)