Non-Intrusive Electrodynamic Characteristic Measurement for...
5
Non-Intrusive Electrodynamic Characteristic Measurement for Circular Shape Electrode M. R. Ghazali, W. I. Ibrahim Faculty of Electrical and Electronic Engineering, Universiti Malaysia Pahang, 26600 Pekan, Pahang, Malaysia. [email protected] M. F. Rahmat Department of Control and Instrumentation Engineering, Faculty of Electrical Engineering, Universiti Teknologi Malaysia, 81310 Skudai Johor, Malaysia. [email protected] Abstract—The electrostatic sensor was used in process industry because of low cost and robust designed.Three types of electrode available in particular application such as pin shape, quarter ring shape and ring shape. The paper was focused on the investigation of the pin shape structure and the characteristic of the circular shape by using different size of structure. Non- instrusive method with circular electrode will be designed and applied to the shape.The sensitivity and spatial filtering effect of sensor will be investigated by using different size of electrodes.Then, the model will be proposed and compared with experimental result. Keywords-electrostatic, electrodynamic, circular, mass flow, non intrusive, sensitivity, spatial filtering effect. I. INTRODUCTION The flow of particle in pipeline generates an electrostatic charge. Electrostatics charge can be detected using sensing device or electrode and convert into voltage by associated electronic or electrodynamics transducer. The measurement is based on charge detected by the sensor as the charged particles flow past it. Sensors generally consist of metal or electrode insulated from the walls of the conveyor. The process measurement of the ring electrodes are widely used and have been thoroughly investigated [3, 4]. Electrostatic transducer are robust and low cost application, so it has high the potential to be applied for process tomography. In process tomography [5] several identical transducers are positioned around the vessel being interrogated to provide measurements which are used to reconstruct dynamic images of the movement of the material being monitored.In large numbers of sensors the ring electrode is no longer applicable and small sensors as pin electrode consisting of either rectangular or circular section are more appropriate. The applications where the process is varying rapidly, for example pneumatically conveyed of solids particle, the measurement of the system parameters should be known. This paper investigates the relationships between sensor size of circular electrode, sensor sensitivity and the frequency bandwidth and termed the spatial filtering effect [6] of the transduced signals. The principle of measurement techniques based on electrostatic phenomena in pneumatics pipelines is contains information of velocity and mass flow rate of particles. The information of particle is depend on large particle will carry higher charge on its surface than a smaller one [1]. This charge level will be detected by using electrostatic sensing and convert it to voltage signal. The charge level can be represented by: () () Vt qt α = ∑ (1) where, q =amount of electronic charge carried on each particle α=constant depend the design of the charge amplifier circuit. V (t) =the resulting voltage signal As mention earlier, the fiction and collisions of particle in pipeline are entirely random. So, the value of V(t) is the result voltage of un deterministic signal captured by electrostatic transducer and change it to discrete times sequence, V(n) at suitable sampling frequency where n= 0,1, 2 and so on. In the electrostatic sensor design, the different term was used to describe the electrostatic sensing technology, tri bioelectric, electrodynamics and electrostatic. II. THEORY A. The Electrode Sensitivity Electrodes sensitivity is a change output of the electrodynamics transducer which is average voltage due to a change in the mass flow rate. Mass flow rate of the pneumatic conveying plant can be calculated by doing the experiment on calibration in order to find relation of mass flow rate with flow indicator. The unit of sensitivity is volts/gram/second. International Conference on Electrical, Control and Computer Engineering Pahang, Malaysia, June 21-22, 2011 978-1-61284-230-1/11/$26.00 ©2011 IEEE 12
Transcript of Non-Intrusive Electrodynamic Characteristic Measurement for...

Non-Intrusive Electrodynamic Characteristic Measurement for Circular Shape Electrode
M. R. Ghazali, W. I. Ibrahim Faculty of Electrical and Electronic Engineering,
Universiti Malaysia Pahang, 26600 Pekan, Pahang, Malaysia.
M. F. Rahmat Department of Control and Instrumentation Engineering,
Faculty of Electrical Engineering, Universiti Teknologi Malaysia, 81310 Skudai Johor, Malaysia.
Abstract—The electrostatic sensor was used in process industry because of low cost and robust designed.Three types of electrode available in particular application such as pin shape, quarter ring shape and ring shape. The paper was focused on the investigation of the pin shape structure and the characteristic of the circular shape by using different size of structure. Non-instrusive method with circular electrode will be designed and applied to the shape.The sensitivity and spatial filtering effect of sensor will be investigated by using different size of electrodes.Then, the model will be proposed and compared with experimental result.
Keywords-electrostatic, electrodynamic, circular, mass flow, non intrusive, sensitivity, spatial filtering effect.
I. INTRODUCTION The flow of particle in pipeline generates an electrostatic
charge. Electrostatics charge can be detected using sensing device or electrode and convert into voltage by associated electronic or electrodynamics transducer. The measurement is based on charge detected by the sensor as the charged particles flow past it. Sensors generally consist of metal or electrode insulated from the walls of the conveyor. The process measurement of the ring electrodes are widely used and have been thoroughly investigated [3, 4].
Electrostatic transducer are robust and low cost
application, so it has high the potential to be applied for process tomography. In process tomography [5] several identical transducers are positioned around the vessel being interrogated to provide measurements which are used to reconstruct dynamic images of the movement of the material being monitored.In large numbers of sensors the ring electrode is no longer applicable and small sensors as pin electrode consisting of either rectangular or circular section are more appropriate.
The applications where the process is varying rapidly, for
example pneumatically conveyed of solids particle, the measurement of the system parameters should be known. This paper investigates the relationships between sensor size of circular electrode, sensor sensitivity and the frequency
bandwidth and termed the spatial filtering effect [6] of the transduced signals.
The principle of measurement techniques based on
electrostatic phenomena in pneumatics pipelines is contains information of velocity and mass flow rate of particles. The information of particle is depend on large particle will carry higher charge on its surface than a smaller one [1]. This charge level will be detected by using electrostatic sensing and convert it to voltage signal. The charge level can be represented by:
( ) ( )V t q tα= ∑ (1)
where, q =amount of electronic charge carried on each particle α=constant depend the design of the charge amplifier circuit. V (t) =the resulting voltage signal
As mention earlier, the fiction and collisions of particle in pipeline are entirely random. So, the value of V(t) is the result voltage of un deterministic signal captured by electrostatic transducer and change it to discrete times sequence, V(n) at suitable sampling frequency where n= 0,1, 2 and so on. In the electrostatic sensor design, the different term was used to describe the electrostatic sensing technology, tri bioelectric, electrodynamics and electrostatic.
II. THEORY
A. The Electrode Sensitivity
Electrodes sensitivity is a change output of the electrodynamics transducer which is average voltage due to a change in the mass flow rate. Mass flow rate of the pneumatic conveying plant can be calculated by doing the experiment on calibration in order to find relation of mass flow rate with flow indicator. The unit of sensitivity is volts/gram/second.
International Conference on Electrical, Control and Computer Engineering Pahang, Malaysia, June 21-22, 2011
978-1-61284-230-1/11/$26.00 ©2011 IEEE 12
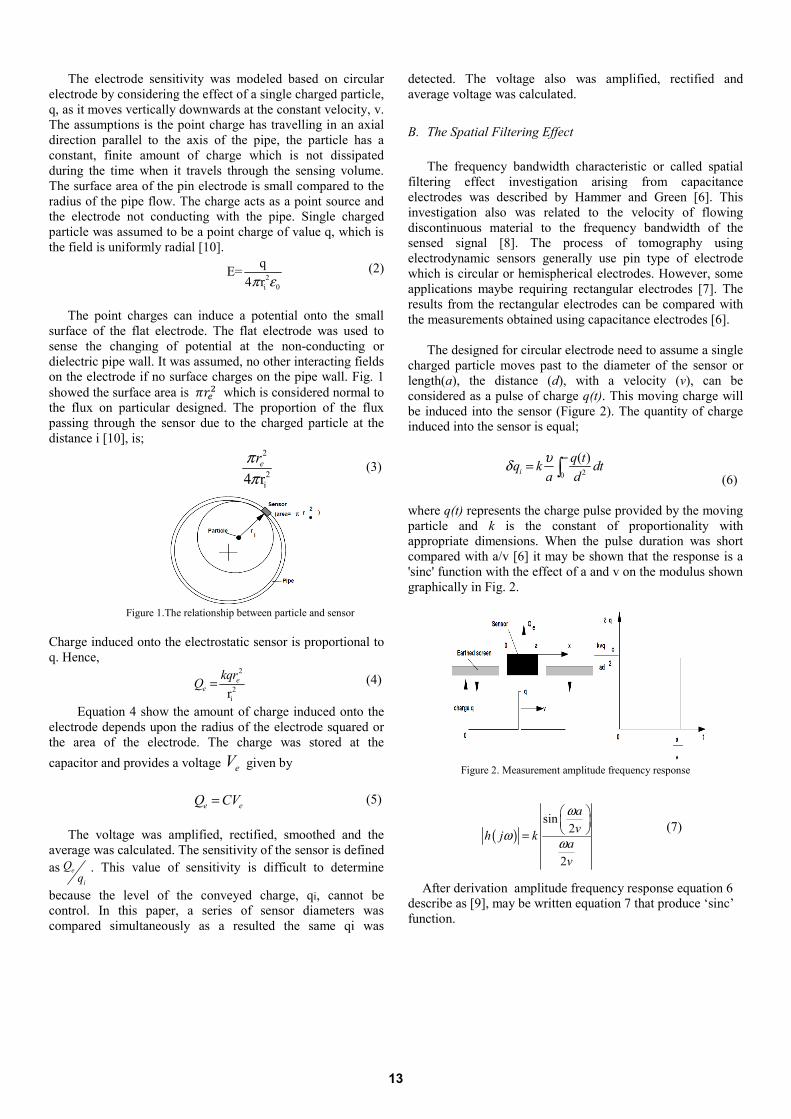
The electrode sensitivity was modeled based on circular electrode by considering the effect of a single charged particle, q, as it moves vertically downwards at the constant velocity, v. The assumptions is the point charge has travelling in an axial direction parallel to the axis of the pipe, the particle has a constant, finite amount of charge which is not dissipated during the time when it travels through the sensing volume. The surface area of the pin electrode is small compared to the radius of the pipe flow. The charge acts as a point source and the electrode not conducting with the pipe. Single charged particle was assumed to be a point charge of value q, which is the field is uniformly radial [10].
2i 0
qE=4 rπ ε
(2)
The point charges can induce a potential onto the small
surface of the flat electrode. The flat electrode was used to sense the changing of potential at the non-conducting or dielectric pipe wall. It was assumed, no other interacting fields on the electrode if no surface charges on the pipe wall. Fig. 1 showed the surface area is which is considered normal to the flux on particular designed. The proportion of the flux passing through the sensor due to the charged particle at the distance i [10], is;
2
2i4 r
erππ
(3)
Figure 1.The relationship between particle and sensor
Charge induced onto the electrostatic sensor is proportional to q. Hence,
2
2ir
ee
kqrQ = (4)
Equation 4 show the amount of charge induced onto the electrode depends upon the radius of the electrode squared or the area of the electrode. The charge was stored at the capacitor and provides a voltage eV given by e eQ CV= (5)
The voltage was amplified, rectified, smoothed and the average was calculated. The sensitivity of the sensor is defined as e
i
. This value of sensitivity is difficult to determine
because the level of the conveyed charge, qi, cannot be control. In this paper, a series of sensor diameters was compared simultaneously as a resulted the same qi was
detected. The voltage also was amplified, rectified and average voltage was calculated.
B. The Spatial Filtering Effect
The frequency bandwidth characteristic or called spatial filtering effect investigation arising from capacitance electrodes was described by Hammer and Green [6]. This investigation also was related to the velocity of flowing discontinuous material to the frequency bandwidth of the sensed signal [8]. The process of tomography using electrodynamic sensors generally use pin type of electrode which is circular or hemispherical electrodes. However, some applications maybe requiring rectangular electrodes [7]. The results from the rectangular electrodes can be compared with the measurements obtained using capacitance electrodes [6].
The designed for circular electrode need to assume a single
charged particle moves past to the diameter of the sensor or length(a), the distance (d), with a velocity (v), can be considered as a pulse of charge q(t). This moving charge will be induced into the sensor (Figure 2). The quantity of charge induced into the sensor is equal;
20
( )i
q tq k dta dυδ
∞= ∫
(6) where q(t) represents the charge pulse provided by the moving particle and k is the constant of proportionality with appropriate dimensions. When the pulse duration was short compared with a/v [6] it may be shown that the response is a 'sinc' function with the effect of a and v on the modulus shown graphically in Fig. 2.
Figure 2. Measurement amplitude frequency response
(7)
After derivation amplitude frequency response equation 6 describe as [9], may be written equation 7 that produce ‘sinc’ function.
( )sin
2
2
avh j k a
v
ω
ω ω
⎛ ⎞⎜ ⎟⎝ ⎠=
13

III. METHODOLOGY
The process of measurement the static charge by electrostatic sensor consist the design of the electrode or sensing device in circular shape. The several sizes were implementing or assemble to pneumatic conveying plant of plastic bead. The electrical charge was detected from electrode then converts to voltage by electrodynamics transducer or associated electronic. The calibration curve of gravity flow rig is important for calibration of pneumatic conveying plant to measure the mass flow rate of the plastic beads at solid loading. Further process can be preceding after find the flow rate.
The experiment of measurement using non-intrusive
electrode circular can be setup by reading and converting electrodynamics transducer. The system was interfaced by data acquisition system. Further analyses were carried out using computer software.
A. Electrodynamic Sensor
The diagram of the electrodynamic sensor (Fig. 3) consists of a plain metal rod called as electrode. The designed was isolated from the metal conveying pipe walls by the insulator such as glass or plastic. This electrode has a capacitance to earth. The value is very small (fraction of a pico Farad) but the values is different due to manufacturing tolerances. A low value of capasitor (several pico farad) was connected in parallel to minimise the effect of capacitance. The resistor was connected in parallel with the capacitors to provide a charge/discharge path [10]. The charged particles in the pipe flow the electrode and produces inducing charge into the process. The current flow through the resistor due to the induce charge cause voltage vary. The voltage then was buffered by a unity gain non inverting amplifier. The output provides a driven guard for the input circuitry and was amplified and conditioned by others circuitry.
Figure 3. The transducer circuit
IV. RESULT AND DISCUSSION
The sensitivity can be determined by using different size of sensor. The solid particle flows passing each of the circular electrodes (Fig. 4). The level of charge on the flowing
solid particle is very difficult to quantify, however since the sensors are evaluated at the same time their outputs may be compared directly. The small diameter electrode at each end of the array checks that the flowing particle does not change its characteristics as it traverses the section.
Figure 4. Arrangement of circular electrodes for sensitivity measurements
A series of different particle flow rates was applied to the electrodes and the output was determined. Results for the sensor sensitivity (2 mm to 9 mm) diameter electrode were collected and the result of several size electrode shown in Fig. 5 to Fig. 7. A linear regression line is fitted to the measured values. The gradient of this line provides the overall sensitivity of the sensor (V/gm/s) and summarized in Table 1 and Fig. 8.
Figure 5. Sensitivity for 2 mm circular electrode.
Figure 6. Sensitivity for 6 mm circular electrode.
Figure 7. Sensitivity for 9 mm circular electrode.
14
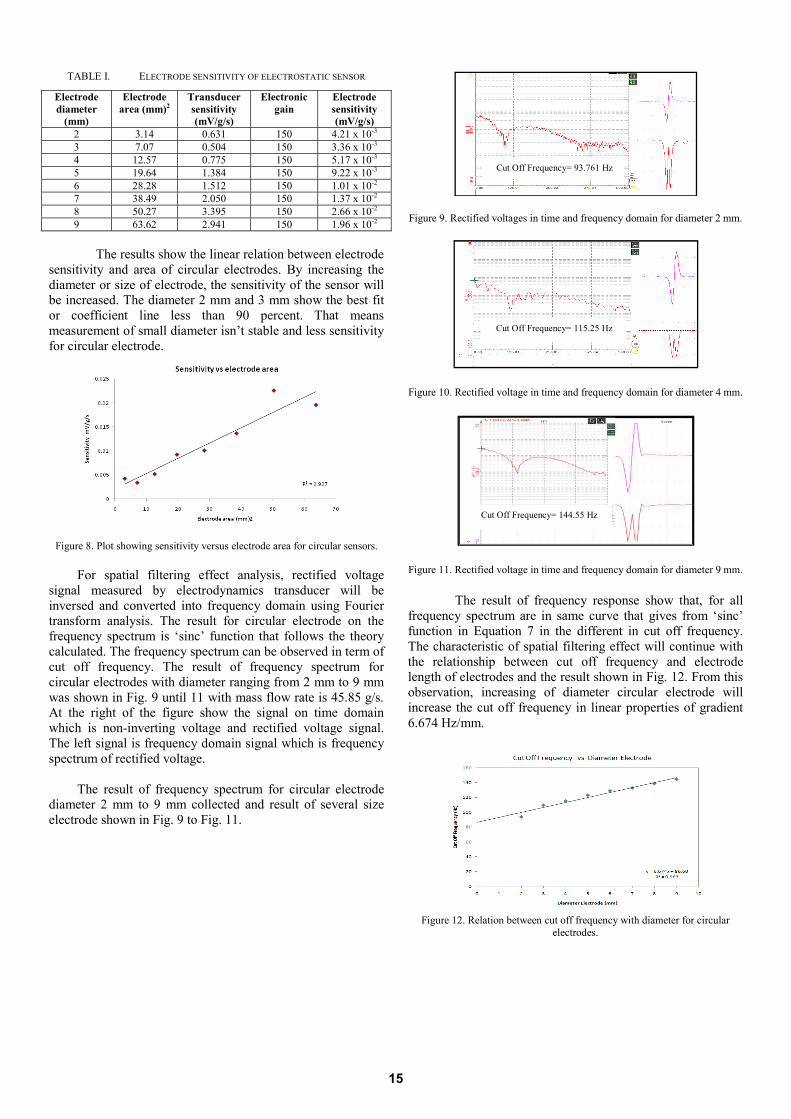
TABLE I. ELECTRODE SENSITIVITY OF ELECTROSTATIC SENSOR
Electrode diameter
(mm)
Electrode area (mm)2
Transducer sensitivity (mV/g/s)
Electronic gain
Electrode sensitivity (mV/g/s)
2 3.14 0.631 150 4.21 x 10⁻³ 3 7.07 0.504 150 3.36 x 10⁻³ 4 12.57 0.775 150 5.17 x 10⁻³ 5 19.64 1.384 150 9.22 x 10⁻³ 6 28.28 1.512 150 1.01 x 10⁻² 7 38.49 2.050 150 1.37 x 10⁻² 8 50.27 3.395 150 2.66 x 10⁻² 9 63.62 2.941 150 1.96 x 10⁻²
The results show the linear relation between electrode sensitivity and area of circular electrodes. By increasing the diameter or size of electrode, the sensitivity of the sensor will be increased. The diameter 2 mm and 3 mm show the best fit or coefficient line less than 90 percent. That means measurement of small diameter isn’t stable and less sensitivity for circular electrode.
Figure 8. Plot showing sensitivity versus electrode area for circular sensors.
For spatial filtering effect analysis, rectified voltage signal measured by electrodynamics transducer will be inversed and converted into frequency domain using Fourier transform analysis. The result for circular electrode on the frequency spectrum is ‘sinc’ function that follows the theory calculated. The frequency spectrum can be observed in term of cut off frequency. The result of frequency spectrum for circular electrodes with diameter ranging from 2 mm to 9 mm was shown in Fig. 9 until 11 with mass flow rate is 45.85 g/s. At the right of the figure show the signal on time domain which is non-inverting voltage and rectified voltage signal. The left signal is frequency domain signal which is frequency spectrum of rectified voltage.
The result of frequency spectrum for circular electrode
diameter 2 mm to 9 mm collected and result of several size electrode shown in Fig. 9 to Fig. 11.
Figure 9. Rectified voltages in time and frequency domain for diameter 2 mm.
Figure 10. Rectified voltage in time and frequency domain for diameter 4 mm.
Figure 11. Rectified voltage in time and frequency domain for diameter 9 mm.
The result of frequency response show that, for all frequency spectrum are in same curve that gives from ‘sinc’ function in Equation 7 in the different in cut off frequency. The characteristic of spatial filtering effect will continue with the relationship between cut off frequency and electrode length of electrodes and the result shown in Fig. 12. From this observation, increasing of diameter circular electrode will increase the cut off frequency in linear properties of gradient 6.674 Hz/mm.
Figure 12. Relation between cut off frequency with diameter for circular
electrodes.
Cut Off Frequency= 93.761 Hz
Cut Off Frequency= 115.25 Hz
Cut Off Frequency= 144.55 Hz
15

ACKNOWLEDGMENT The authors wish to thank for the support given to this
research by Universiti Teknologi Malaysia (UTM), which made this collaborative work possible.
REFERENCES [1] A.M. Featherstone, R.G. Green, M.E. Shackleton, "Yarn velocity
measurement." J Physics E: Sci Instrum, vol. 16, 1983. [2] P.W. King, "Mass flow measurement of conveyed solids, by
monitoring of intrinsic electrostatic noise levels." 2nd. Int. Conf. on the Pneumatic Transport of Solids in Pipes, Cranfield, 1973.
[3] Shackleton ME, "Electrodynamic sensors for process measurement." Mphil Thesis, University of Bradford, 1981.
[4] Y Yan, B Byrne, S Woodhead, J Coulthard, (1995), "Velocity measurement of pneumatically conveyed solids using electrodynamic sensors." Meas. Sci. Technol. 6, 515-537.
[5] “Process Tomography: Principles, Techniques and Applications”, Ed R.A.Williams and M.S.Beck, Butterworth-Heinemann, 1995, 101-118.
[6] E.A.Hammer, R.G.Green, (1982) "The spatial filtering effect of capacitance transducer electrodes". J.Phys.E:Sci. Instrum., 16, No. 5, 438-443.
[7] Machida, M., Scarlett, B., “Process Tomography System by Electrical Charge Caried by Particle”, IEEE Sensors Journal. Vol. 5, No. 2, , April 2005, p252-259.
[8] Yang, W.Q, Lihui Peng, Review Article : “Image reconstruction Alogrithms for Electrical Capacitance Tomography, Measurement Science and Technology”, Institute of Physics Publiching 14 (2003) p1-R13
[9] M. F. Rahmat, (1996). “Instrumentation of Particle Conveying Using Electrical Charge Tomography”. Doctor Philosophy, Sheffield Hallam University, United Kindom.
[10] M. F. Rahmat and N.S. Kamaruddin,(2009). ”An electrodynamics sensor for electrostatic charge measurement”. International Journal on Smart Sensing and Intelligent Systems, Vol. 2, No. 2, June
[11] M. D. Isa, M. F. Fua’ad, K. Jusoff, T. A. R. Hussin (2009). “Validation Process for Electrical Charge Tomography System Using Digital Imaging Technique”. Applied Physics Research, Vol. 1 No. 2, November.
[12] M. F. Rahmat, M. D. Isa, R. A. Rahim, T. A. R. Hussin (2009). “Electrodynamics Sensor for the Image Reconstruction Process in an Electrical Charge Tomography System”. Sensor, 9, 10291-10308; doi:10.3390/s91210291.
16