Non-Discretionary S&P 500 Options Trading Systems Backtest By
24
Transcript of Non-Discretionary S&P 500 Options Trading Systems Backtest By

1
SUMMARY
Using an Options Data Base engine and an actual options data base provided by IVolatility, a backtest of several options strategies was accomplished producing equity streams of trades taken in the test. These equity streams were compared to results obtained by trading the underlying index and futures contract with the same trading system used to trade the options strategies. Both Long Only strategies (only buying puts and calls), Short Only strategies (only selling puts and calls) as well as several spread and hedging strategies were evaluated. Theoretical tests underestimated the returns in the Short Only Options case and overestimated the returns in the Long Only Options case primarily due to underestimation of Theta decay in the Bjerksund and Stensland approximation model for American Puts. Additionally a dynamic rehedging strategy, holding delta neutral, was developed. The results indicated that Long Only and Short Only strategies were the most viable strategies. Spread strategies and dynamic rehedging strategies were shown not to be as viable (on S&P 500 data using the employed trading system) on a risk to reward basis using both a directional trading strategy, for those strategies that benefited the most from directional correctness, or using a trading system that traded volatility, for those strategies that benefited the most from volatility based directional correctness. Results using the theoretical options backtest engine are presented in Appendix 1. Summary options results using the actual bid/ask options data are presented in Appendix 2. The performance of the underlying trading system on the S&P 500 Futures contract from 1982 to 2004 is presented in Appendix 3. The results of Short Only Option trading over the S&P 500 futures contract using the SPX options data as a proxy with a 250 multiplier verses a 100 multiplier is presented in Appendix 4.
INTRODUCTION
Option trading is perhaps one of the least understood trading vehicles. The complexity of analyzing option data and combinations contributes to this lack of understanding. Moreover, a trader can be correct on direction, yet still lose money because one or more of the other forecasted dimensions (i.e. volatility and time) were incorrectly forecasted. With time working against an option holder, the other dimensions must move well in his favor to extract a profit. On the other side, the longer a seller of an option can remain correctly positioned, the higher his probability of a profit. In fact, my studies here confirm that a seller of options runs a higher percent accuracy over simply applying the trading system directly on the underlying security, primarily due to the Theta decay of the option and the price waning effect of delta. There are countless options combinations and spreads using options alone and in concert with a position in the underlying commodity or security. Many books have been written on strategies surrounding limited loss options positions like spreads, straddles, strangles, ratio backspreads, condors, butterflies as well as simple long only positions (only buying puts and calls). Many software products are available that will assist you in determining the least expensive option or option combination to enter given your market sentiment or

2
outlook. Using volatilities that are “implied” from the current option chain price data, scenarios employing various option types, strike prices and expiration dates can be sorted and screened for optimum use. Despite this significant analytical capability, an option trader has several substantial limitations facing him:
1. He must still be correct on direction, or if a directionless strategy, like straddles, or ratio backspreads are employed, the movement in one direction has to be substantial enough to compensate for the decay in the other dimensions.
2. Although the theoretical profit of an option position may be evaluated quite easily, there remains no quantitative way to actually “backtest” a strategy using actual option chain data, much like we routinely backtest a pattern or indicator on actual stock or commodity market data. Thus options investigations are limited to only a prediction of the theoretical movement of an option position based on a snapshot of only current quotes.
There are substantial problems for the option trading system developer: 1. There is a full 3 dimensional array of prices required for each DAY of history. 2. There will be many missing option prices due to liquidity issues particularly at the far out of the money (OTM) options. 3. Interpolation between missing strike prices needs to be accomplished as required. 4. The size of the data base is massive, with approximately 5-16MB of data required per year per symbol, depending on the data reduction techniques employed. 5. The cleansing and error checking of the data becomes a serious problem since large sets of data may be corrupted and this would only become evident when the strategy calls for data within that data area. 6. Although theoretical options data may be used to produce a backtest, using price data alone and underlying volatilities as inputs to options models has proven to be inaccurate. 7. Rollovers prior to option expiration must be accomplished and, if necessary, a resetting of the optimum strike price should be accomplished. 8. Optimization of expiration and strike price for each option strategy must be employed. 9. Once the developer has created a final trading system, that system must be implemented and traded in the real world since that is the final goal of this development process. Despite these obstacles, I decided to develop a backtest engine from which I could evaluate the efficiency of using directional and volatility based mechanical trading strategies as an option trading approach. This paper is not intended to be an exhaustive analysis and “definitive conclusion” based paper. Trading System development is too vague a discipline with many surprises that come up along the way…some pleasant and some not so pleasant. Actual implementation is yet another issue and my analysis is well

3
rooted in the “this has to work in the real world” thinking. My opinions presented herein are just that; however they are based on empirical testing and evidence derived during and after the development of this engine. Since there is no commercially available convenient testing platform that accomplishes what I have accomplished here, this project remains a “work in progress” and the opinions presented herein are “subject to change”. The main purpose of this paper is to document this effort, to raise interest in mechanical options trading and to show that a mechanical option trading is ready for implementation and actual trading.
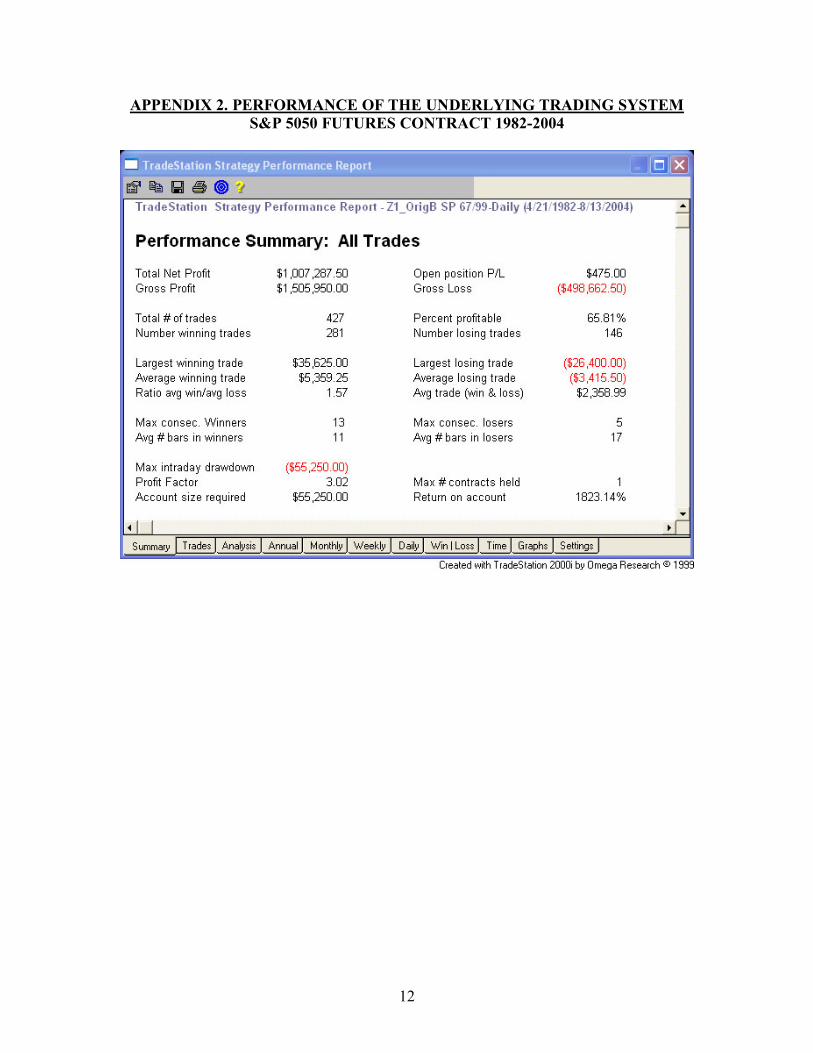
THE UNDERLYING TRADING SYSTEM The underlying trading system makes use of a primary counter trending mode incorporating a pattern and non-linear filter triggering a buy or sell. The system is a stop and reverse (SAR) type system and is always in the market. Optional stop loss and profit exits, adaptive volatility based, were evaluated for inclusion and some improvement was observed, however only a large stop loss was included in the tested system. The performance of the base underlying system is presented in Appendix 2. It should be noted that the typical “bend” in the equity curve beginning in the 1996 time frame is present in this equity curve. Most momentum based systems, like opening range breakout, have this characteristic knee as well. Of course, opening range breakout type systems do not produce robust equity streams prior to 1996 and they are noted to have decaying equity streams post 2002 as well. This system has a relatively smooth equity stream from 1982 to 2004 and an approximately 100:1 trade to parameter ratio tested on one market. The system equity curve is similar on ND, DJ, RU, SG, SP, MD, ES, NQ markets.
ENGINEERING DEVELOPMENT BACKGROUND Using DLL extensions, TradeStation PS2000i and an actual options data base provided by IVolatility, a backtest of several options strategies was accomplished producing equity streams of trades taken in the backtest. These equity streams are compared to results obtained by trading the underlying index with the same trading system used to trade the options strategies. Both long only strategies (only buying puts and calls), short only strategies (only selling puts and calls) as well as several spread and hedging strategies were evaluated. Additionally, a dynamic rehedging strategy, holding delta neutral, was developed. The results indicated that long only and short only strategies were the most viable strategies. Spread strategies and dynamic rehedging strategies (on the S&P 500 index and futures) were shown not to be as viable on a risk to reward basis using both a directional trading, for those strategies that benefited the most from directional correctness, or using a trading system that traded volatility directionally, for those strategies that benefited the most from volatility based directional correctness. The testing window was from 1/1/2001 to 8/13/2004 for the options strategies and 4/21/1982 to 8/13/2004 for the testing of the underlying trading system on the S&P 500 futures contract.

4
THEORETICAL AND DATA BASE ENGINE DEVELOPMENT The development approach took two paths. First, a theoretical backtesting engine was developed using various options models, including the generalized Black-Scholes for American Calls and the Bjerksund and Stensland approximation model for American Puts. Results of the theoretical backtest engine are presented in Appendix 1. In the second phase of this effort, initial trials using large options data bases proved cumbersome and optimization became difficult, however later models using reduced IVolatility data, proved excellent, fast and reliable. The bottom line goal was to develop a testing engine that could be used to test an options strategy from “end to end” of the data window. In other words, backtested trading must replicate real world trading as much as possible, including buying on the ask and selling on the bid, assuming that the data being used contained the bid/ask spread. For each entry signal, the appropriate bid/ask data must be looked up for the selected Put/Call, strike and expiration. When the positions became unwound, or reversed as in our case, the net profit/loss of the exiting position must be stored and the new position initiated. At the end of the run, a typical set of summary statistics must be developed which is common to any testing platform. Optimization over expiration date, strike price, as well as internal system parameters and criteria must be accomplished. The theoretical options testing engine provided an excellent way to evaluate quickly various strategies and this engine was used to test hundreds of stocks and dozens of directional and volatility options strategies. Initial studies using this engine showed that simple directional strategies involving buying puts or calls, or simple selling of puts and calls offered the optimum return to risk. Spread strategies and dynamic rehedging approaches were shown to be less efficient when compared to other strategies. It is believed that when the underlying directional trading strategy is efficient, as measured by its performance when applied directly on the underlying, limiting profit as is the case with spreads or attempting to trade volatility proves to be less optimum. Simply put, from a mechanical trading system viewpoint, take a good trading system and either:
a. Trade the underlying directly using the base mechanical trading system or b. Trade options directionally by going long puts and long calls as appropriate or c. Trade options directionally by going short puts or short calls as appropriate.
Limitations of the Theoretical Engine were primarily due to the underestimation of the decay of option prices resulting in higher returns than was noted with later data base engines. With this fast theoretical options trading system engine now developed, I unleashed it on a basket of stocks representing the 100 most liquid option-able stocks based on relative
5
volume of all options contracts traded over a 1 year period. Some results for this test are presented in Appendix 1. Following the theoretical backtest engine development, I undertook the development and testing of an integrated options data base read engine and trading system. Several subs or functions needed to be developed including: GetStrike: Allows for the designation of strike prices at either in the money (ITM) or out of the money (OTM) for any underlying price. GetOptPriceIVa: Performs the options data base lookup for a predefined expiration date, strike and type option and returns the bid/ask and any required greeks needed for the trading or rehedging system. Interpolation: Should the data base lookup result in a strike price that was not present, an interpolation needed to be done to return the correct option price. Rollovers: The capability to optimize on the rollover criteria needed to be implemented so that a rollover to a new contract and strike may be accomplished at a predefined number of days prior to expiration. Of course commissions generated at this time needed to be taken into account. Error Handling: Should an option strike group not be present at all, the read engine needs to return values that will trigger awareness that a trade might be in error. It should be noted that NO fatal error messages occurred during my tests. Depending on the distance to expiration chosen, one half to one third of the options was located directly in the data base while the remaining option prices were interpolated for. Additionally, date stamp reformatting and comparison needed to be done within the DLL to allow for proper comparison of date stamps during the search, within memory, following the uploading of the historical options prices. The following chart shows the comparison of a Short Only Options Strategy using Theoretical options data and Actual Options price data. The Theoretical Options data under estimated returns in the Short Only Options case due primarily to the underestimation of Theta decay in the options that were bought back. An over estimation of returns for the Long Only Options case occurs as well, again due to the underestimation of Theta decay.

6
SHORT ONLY OPTIONS TRADING SYSTEM THEORETICAL VERSES ACTUAL PRICE DATA RETURNS
Theoretical Option System vs Data Base Option System(1/2001-8/2004)
$20,000
$0
$20,000
$40,000
$60,000
$80,000
$100,000
$120,000
$140,000
1010
130
1010
330
1010
531
1010
731
1011
003
1011
203
1020
204
1020
405
1020
605
1020
805
1021
003
1021
203
1030
204
1030
404
1030
605
1030
805
1031
003
1031
203
1040
204
1040
405
1040
604
1040
805
Date
Net P
rofit
Data Base option SystemTheoretical Option System
In my Short Only tests a protective stop loss was set at 7 times the 4 day average true range, basis the underlying index. This is a wide, adaptive stop and was not hit during the test. Nevertheless, it offers a protection from significant adverse movement and complements the advantage that waning dimensions offers us.
FUTURE PLANS This options mechanical trading system is ready for trading, however as is the case with all research, one is never done. One of my highest priorities is to empirically calibrate the Theoretical Options Model using actual options data. The second highest priority item is the development of an optimum strategy search engine which will allow the sorting of various option combinations, sentiment dependent, prior to the position being implemented in the backtest engine. In other words, at any entry point in time, the most efficient option or combination of options will be chosen.

7
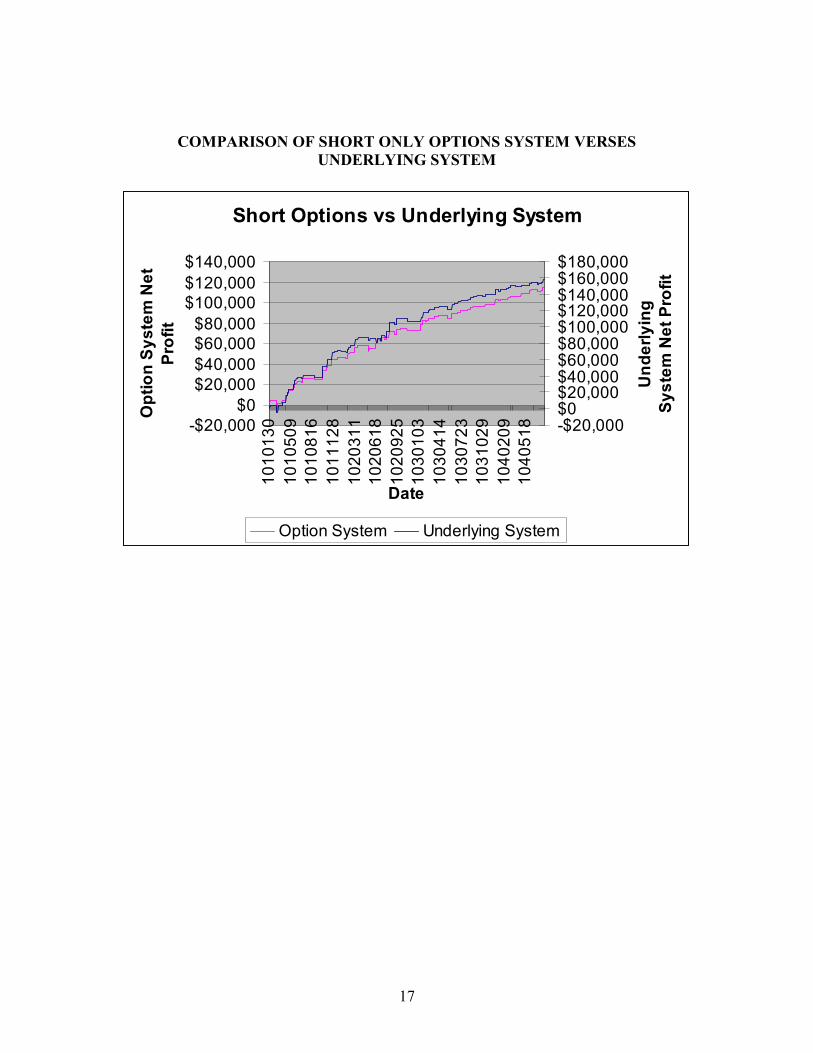
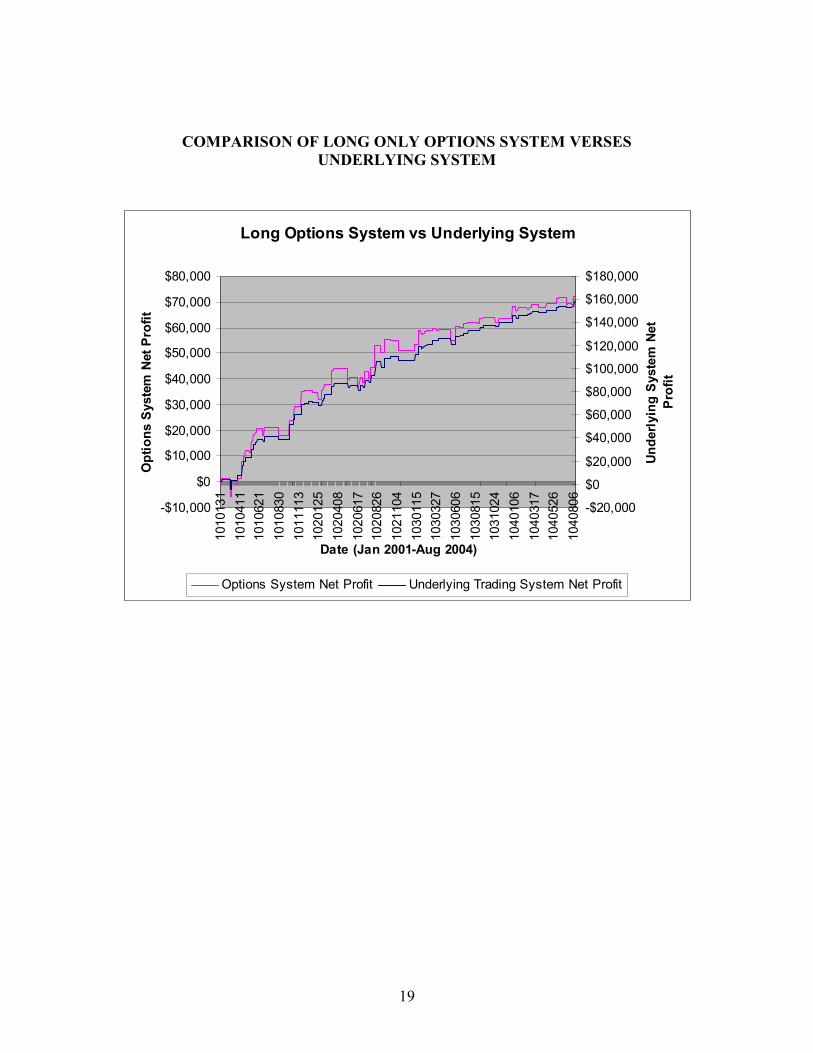
CONCLUSIONS The relative smoothness of the options systems backtest equity curves for both the Long only and Short only case was noted. Only a slight difference in the ex post Sharpe Ratio was noted. Of particular interest was the fact that the percent accuracy of the Short Only case was well above the both Long Only case and the underlying trading system. Due to waning dimensions, the Long Only case had its percent profitable below the underlying case. Also noted was the fact that the net profit to drawdown ratio for the Short Only case was approximately equal to the Underlying System, whereas the net profit to drawdown ratio for the Long Only case was well below both other cases. Finally, a key element was noted that when the Short Only case was wrong on direction, the losses, as evident by the max drawdown and largest loss numbers, were lower than in the underlying system case. This is due to the fact that the decay in premium due to Theta decay was working well in your favor as the position was moving against you. In addition, the lower delta helped mitigate the losses even more when compared to the Underlying System case. Merging a robust directional trading system and an options testing engine as demonstrated here has shown that simple mechanically based trading strategies for options are viable. The Short Only option strategy is a viable trading approach and presents a lower risk profile than trading the underlying with the same directional trading system. Per trade risk may be even further mitigated with adaptive stops positioned on the underlying which will trigger unwinding of the current position.

8
APPENDIX 1- OPTIONS 2.0 TRADING SYSTEM-THEORETICAL SYSTEM
SCREEN SHOT OF THE THEORETICAL OPTIONS TRADING SYSTEM

9
S&P 500 FUTURES OPTIONS EQUITY CURVE-THEORETICAL OPTIONS
Cum P/L
-100000
0
100000
200000
300000
400000
500000
600000
700000
800000
900000
8207
01
8311
01
8503
01
8607
01
8711
02
8903
01
9007
02
9111
01
9303
01
9407
01
9511
01
9703
03
9807
01
9911
01
1010
301
1020
701
Cum P/L
The above shows the Theoretical Options Model integrated with Multi-Market Directional Adaptive Trading System tested on S&P 500 Futures data from 1982 to 2003.
• Sharpe Ratio = 1.6 • Theoretical Return per Year on Required Equity = 1987% • Pessimistic Return Per Year on Required Equity = 400% • Total Years in test = 21 • Total Trades in test = 542 • Average Yearly Reward/Risk = 8.0 • Options Model = Bjerk-Stens • Options Positions = Directional • Trading System-Adaptive Trend/Countertrend • Long Puts and Long Calls only

10
S&P 500 FUTURES OPTIONS TRADE BY TRADE-Theoretical Model SystemName Calls=1/Puts=-1 Roll EntDate ExDate EqReq StkEntPr
Options2.0 -1 0 820607 820614 945.09125 512.65002Options2.0 1 1 820614 820712 945.09125 512.59998Options2.0 1 0 820713 820802 237.50305 515.84998Options2.0 -1 -1 820802 820913 237.50305 514.04999Options2.0 -1 -1 820914 821011 625 527.5Options2.0 -1 0 821012 821025 1350.84534 537.84998Options2.0 1 0 821025 821103 587.4939 537.25Options2.0 -1 0 821103 821108 1515.96069 547.65002Options2.0 1 0 821108 821206 712.4939 546Options2.0 -1 0 821206 821220 1182.09082 547.15002Options2.0 1 0 821220 821227 524.9939 540.04999Options2.0 -1 0 821227 830103 1602.84424 547.90002Options2.0 1 0 830103 830110 774.9939 542.20001Options2.0 -1 0 830110 830124 1621.42944 551.90002Options2.0 1 0 830124 830131 1149.9939 544.84998Options2.0 -1 -1 830131 830214 1149.9939 550.40002Options2.0 -1 0 830215 830222 1463.95117 552.54999Options2.0 1 1 830222 830314 1463.95117 549.45001
StkEntPr StkExPr ExpMonth DaysToExpEnt Strike2Ent Price2Ent DaysToExpEx Strike2Ex512.65002 512.59998 7 39 515 2.34998 32 515512.59998 516.29999 7 32 515 3.78036 4 515515.84998 514.04999 9 38 515 3.75055 18 515514.04999 527.90002 9 46 515 0.95001 4 515
527.5 539.59998 10 31 515 2.5 4 515537.84998 537.25 11 38 540 2.15002 25 540
537.25 547.65002 12 25 535 5.40338 16 535547.65002 546 12 44 550 2.34998 39 550
546 547.15002 1 39 545 6.06384 11 545547.15002 540.04999 1 46 550 2.84998 32 550540.04999 547.90002 1 32 540 4.72836 25 540547.90002 542.20001 2 25 550 2.09998 18 550542.20001 551.90002 2 46 540 6.41138 39 540551.90002 544.84998 2 39 555 3.09998 25 555544.84998 550.40002 2 25 540 6.48572 18 540550.40002 554.15002 2 18 540 4.59998 4 540

11
Strike2Ex Price2Ex Comm P/L Trade Cum P/L515 2.40002 45 -32.48779 -32.48779515 6.30801 45 586.91223 554.42444515 1.673 45 -564.38629 -9.96185515 0 45 -282.50305 -292.4649515 0.00018 45 -669.95422 -962.41913540 2.75 45 104.9939 -857.42523535 13.01834 45 1858.73999 1001.3147550 4 45 367.5061 1368.8208545 4.30136 45 -485.62042 883.20038550 9.95001 45 1730.00916 2613.20947540 9.2468 45 1084.60815 3697.81763550 7.79999 45 1380.00305 5077.8208540 12.96765 45 1594.0686 6671.88965555 10.15002 45 1717.51221 8389.40234540 10.65997 45 998.56384 9387.96582540 0.84998 45 -982.5 8405.46582
STOCK BASKET TESTING-Theoretical Model
12
APPENDIX 2. PERFORMANCE OF THE UNDERLYING TRADING SYSTEM S&P 5050 FUTURES CONTRACT 1982-2004

13
UNDERLYING TRADING SYSTEM MONTE CARLO SIMULATIONS-ODDS OF DRAWDOWM

14
UNDERLYING TRADING SYSTEM MONTE CARLO SIMULATIONS-ODDS OF PROFIT

15
UNDERLYING TRADING SYSTEM-EQUITY CURVE (1982-2004)

16
APPENDIX 3-PERFORMANCE RESULTS OF DATA BASE OPTIONS ENGINE SHORT ONLY STRATEGY ON SPX OPTIONS 1/2001-8/2004 (Puts and Calls are sold short)
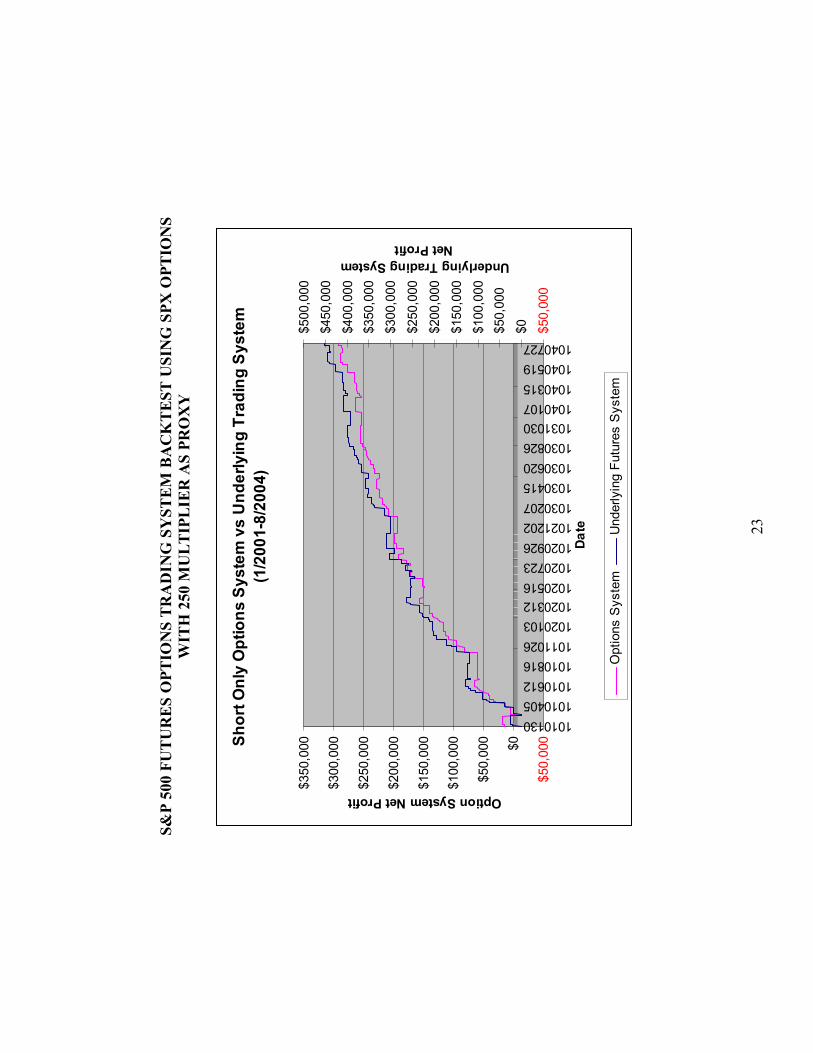
(subset of trade by trade report) 20040802 OptData Yr= 2004 MoOpt= 10 StrikePr=1065 AssetPrice= 1106.60 Ask= 58.54 Bid= 56.54 InterpolationCodes= 1.00 20040802 SellCall at= 56.54 ExpDate= 20041016.00 PremiumAccepted= 5654.00 20040809 OptData Yr= 2004 MoOpt= 10 StrikePr=1065 AssetPrice= 1065.20 Ask= 32.20 Bid= 30.20 InterpolationCodes= 1.00 20040809 BuyBackCall at= 32.20 DaysToExp= 68 NetTrade$= 2434.00 Cum$= 114505.00 %Ret= 75.59 Cum%Ret= 58262.80 RollReq?= FALSE 20040809 OptData Yr= 2004 MoOpt= 10 StrikePr=1110 AssetPrice= 1065.20 Ask= 58.10 Bid= 56.10 InterpolationCodes= 1.00 20040809 SellPut at= 56.10 ExpDate= 20041016.00 PremiumAccepted= 5610.00 20040813 OptData Yr= 2004 MoOpt= 10 StrikePr=1110 AssetPrice= 1064.80 Ask= 55.58 Bid= 53.88 InterpolationCodes= 1.00 20040813 BuyBackPut at= 55.58 DaysToExp= 64 NetTrade$= 52.00 Cum$= 114557.00 %Ret= 0.94 Cum%Ret= 58263.70 RollReq?= FALSE >>>>>>>>>>>>>SHORT ONLY OPTIONS SYSTEM SUMMARY<<<<<<<<<<< Last Date = 20040813 Symbol = SPX Net$ = 114,557.00 TotTrades = 82 AvgTrade = 1397.04 NetPuts = 53473.70 NetCalls = 61083.80 MaxDrawdown = 6694.00 Net/DD = 17.11 %Correct = 78.05 MaxLoss = -6694.00 Commission = 0.00 YearsInTest = 3.67 %NPft/yr/3*DD = 155.58 SR = 0.36
17
COMPARISON OF SHORT ONLY OPTIONS SYSTEM VERSES UNDERLYING SYSTEM
Short Options vs Underlying System
-$20,000$0
$20,000$40,000$60,000$80,000
$100,000$120,000$140,000
1010
130
1010
509
1010
816
1011
128
1020
311
1020
618
1020
925
1030
103
1030
414
1030
723
1031
029
1040
209
1040
518
Date
Opt
ion
Syst
em N
et
Prof
it
-$20,000$0$20,000$40,000$60,000$80,000$100,000$120,000$140,000$160,000$180,000
Und
erly
ing
Syst
em N
et P
rofit
Option System Underlying System

18
LONG ONLY STRATEGY ON SPX OPTIONS 1/2001-8/2004 (Puts and Calls are purchased)
(subset of trade by trade report) 20040802 OptData Yr= 2004 MoOpt= 10 StrikePr=1150 AssetPrice= 1106.60 Ask= 55.60 Bid= 53.60 InterpolationCodes= 0.00 20040802 BuyPut at= 55.60 ExpDate= 20041016.00 EquityRequired= 5560.00 20040809 OptData Yr= 2004 MoOpt= 10 StrikePr=1150 AssetPrice= 1065.20 Ask= 89.30 Bid= 87.30 InterpolationCodes= 0.00 20040809 ExitPut at= 87.30 DaysToExp= 68 NetTrade$= 3170.00 Cum$= 72414.10 %Ret= 57.01 Cum%Ret= 1130.60 RollReq?= FALSE ErrCode= 0.00 20040809 OptData Yr= 2004 MoOpt= 10 StrikePr=1025 AssetPrice= 1065.20 Ask= 58.40 Bid= 56.40 InterpolationCodes= 0.00 20040809 BuyCall at= 58.40 ExpDate= 20041016.00 EquityRequired= 5840.00 20040813 OptData Yr= 2004 MoOpt= 10 StrikePr=1025 AssetPrice= 1064.80 Ask= 58.30 Bid= 56.30 InterpolationCodes= 0.00 20040813 ExitCall at= 56.30 DaysToExp= 64 NetTrade$= -210.00 Cum$= 72204.10 %Ret= -3.60 Cum%Ret= 1127.00 RollReq?= FALSE ErrCode= 0.00 >>>>>>>>>>>>>LONG ONLY OPTIONS SYSTEM SUMMARY<<<<<<<<<<< Last Date = 20040813 Symbol = SPX Net$ = 72204.10 TotTrades = 82 AvgTrade = 880.54 NetPuts = 51269.40 NetCalls = 20934.70 MaxDrawdown = 6874.00 Net/DD = 10.50 %Correct = 64.63 MaxLoss = -5882.00 Commission = 0.00 YearsInTest = 3.67 %NP/yr/3*DD = 95.49 SR = 0.23
19
COMPARISON OF LONG ONLY OPTIONS SYSTEM VERSES UNDERLYING SYSTEM
Long Options System vs Underlying System
-$10,000
$0
$10,000
$20,000
$30,000
$40,000
$50,000
$60,000
$70,000
$80,000
1010
131
1010
411
1010
621
1010
830
1011
113
1020
125
1020
408
1020
617
1020
826
1021
104
1030
115
1030
327
1030
606
1030
815
1031
024
1040
106
1040
317
1040
526
1040
806
Date (Jan 2001-Aug 2004)
Opt
ions
Sys
tem
Net
Pro
fit
-$20,000
$0
$20,000
$40,000
$60,000
$80,000
$100,000
$120,000
$140,000
$160,000
$180,000
Unde
rlyin
g Sy
stem
Net
Pr
ofit
Options System Net Profit Underlying Trading System Net Profit

20
T
able
1. O
PTIM
IZA
TIO
N O
F ST
RIK
E P
RIC
E IT
M-S
HO
RT
ON
LY
OPT
ION
TR
AD
ING
SY
STE
M
Sym
bol
EndD
ate
Net
$Tr
ades
AvgT
rade
Max
DDN
P/DD
% C
orre
ctNP
/yr/3
*DD
Max
Loss
Days
ToEx
pPu
t Dis
t ITM
Call
Dist
ITM
SPX
1040
813
9978
9.1
8212
16.9
449
9020
81.7
118
1.8
-499
060
3911
SPX
1040
813
9325
582
1137
.26
4990
18.6
982
.93
169.
89-4
990
6035
11SP
X10
4081
310
9045
8213
29.8
258
7018
.58
80.4
916
8.88
-587
060
3915
SPX
1040
813
1025
1182
1250
.14
5870
17.4
681
.71
158.
76-5
870
6035
15SP
X10
4081
386
134.
782
1050
.42
4990
17.2
684
.15
156.
92-4
990
6031
11SP
X10
4081
311
4557
8213
97.0
466
9417
.11
78.0
515
5.58
-669
460
3919
SPX
1040
813
9539
0.8
8211
63.3
5870
16.2
582
.93
147.
73-5
870
6031
15SP
X10
4081
310
8023
8213
17.3
666
9416
.14
79.2
714
6.7
-669
460
3519
SPX
1040
813
1009
0382
1230
.52
6694
15.0
780
.49
137.
03-6
694
6031
19
T
able
2. O
PTIM
IZA
TIO
N O
F ST
RIK
E P
RIC
E-L
ON
G O
NL
Y O
PTIO
N T
RA
DIN
G S
YST
EM
Sym
bol
EndD
ate
Net$
Trad
esAv
gTra
deM
axDD
NP/D
D%
Cor
rect
NP/y
r/3*D
DM
axLo
ssDa
ysTo
Exp
Put D
ist I
TMCa
ll Di
st IT
MSP
X10
4081
362
893.
982
767
5320
11.8
263
.41
107.
47-5
6060
4921
SPX
1040
813
6780
7.6
8282
6.92
6136
11.0
564
.63
100.
46-5
882
6049
25SP
X10
4081
372
204.
182
880.
5468
7410
.564
.63
95.4
9-5
882
6049
29SP
X10
4081
354
088.
482
659.
6153
2010
.17
63.4
192
.43
258
6045
21SP
X10
4081
359
002.
182
719.
5461
369.
6264
.63
87.4
2-5
508
6045
25SP
X10
4081
363
398.
682
773.
1569
31.3
39.
1564
.63
83.1
5-3
9060
4529
SPX
1040
813
4571
5.3
8255
7.5
5320
8.59
62.2
78.1
2-5
068
6041
21SP
X10
4081
350
628.
982
617.
4361
368.
2563
.41
75.0
1-5
068
6041
25SP
X10
4081
355
025.
482
671.
0471
23.3
37.
7263
.41
70.2
221
060
4129
Tab
le 3
. OV
ER
AL
L S
UM
MA
RY
-LO
NG
AN
D S
HO
RT
OPT
ION
S-SP
X
Sy
stem
From
ToN
ET$
Trad
esAv
erag
e Tr
ade
Dra
wdo
wn
Perc
ent C
orre
ctNe
t/DD
Net
Pft/y
r/(3*
DD)
Max
Loss
SRB
ase
Und
erly
ing
1/1/
2001
8/13
/200
415
8103
8019
76.2
992
4076
.25
17.1
115
9.17
-924
00.
2Lo
ng O
nly
Opt
ions
1/1/
2001
8/13
/200
472
204
8288
0.54
6874
64.6
10.5
95.4
9-5
882
0.2
Sho
rt O
nly
Opt
ions
1/1/
2001
8/13
/200
411
4557
8213
97.0
466
9478
.05
17.1
155.
58-6
694
0.36

21
Not
es:
Tabl
e 1-
2:
NP/
yr/3
*DD
is th
e ne
t per
cent
retu
rn p
er y
ear o
n an
acc
ount
siz
ed a
t 3 ti
mes
the
max
clo
sed
trade
dra
wdo
wn.
Not
e th
at th
is do
es n
ot
addr
ess t
he m
inim
um m
argi
n re
quire
men
ts fo
r the
selli
ng o
f opt
ions
, how
ever
stud
ies h
ave
show
n th
at it
is re
sults
in a
clo
se
appr
oxim
atio
n to
cal
cula
tions
usi
ng th
e ex
chan
ge li
sted
mar
gin
requ
irem
ents
. Pu
t Dis
t IT
M/C
all D
ist I
TM
is th
e di
stan
ce in
strik
e pr
ices
that
an
optio
ns st
rike
pric
e w
as c
hose
n to
be,
igno
ring
the
first
dig
it, a
nd
is ba
sed
on st
rike
pric
es a
t 5 p
oint
inte
rval
s. E
.g.:
A 3
9 Pu
t Dist
ITM
mea
ns th
at th
e st
rike
pric
e w
as c
hose
n to
be
9 st
rikes
in th
e m
oney
. Th
ere
is no
com
mis
sion
in th
ese
num
bers
. Pur
chas
es a
re a
ssum
ed to
occ
ur a
t the
Ask
and
sale
s are
ass
umed
to o
ccur
at t
he B
id.
Tabl
e 3:
SR
is b
ased
on
ex p
ost S
harp
Rat
io c
alcu
latio
ns.

22
APP
EN
DIX
4 -
S&P
500
FUT
UR
ES
OPT
ION
S B
AC
KT
EST
>>
>>>>
>>>>
>>>>
>>>>
>>>>
>>S&
P 50
0 FU
TU
RE
S O
PTIO
NS
BA
CK
TE
ST S
UM
MA
RY
<<<<
<<<<
<<<<
<<<<
<<<<
<<<<
<<
Las
t Dat
e
= 2
0040
813
Sy
mbo
l
= S
P 67
/99
Net
$
=
292
433.
00
Tot
Tra
des
=
80
A
vgT
rade
= 3
655.
41
Net
Puts
= 1
4421
1.00
N
etC
alls
= 1
4822
1.00
M
axD
raw
dow
n =
217
85.0
0
Net
/DD
=
13.
42
%C
orre
ct
=
80.
00
Max
Los
s
=
-21
785.
00
Com
mis
sion
= 0
.00
Y
ears
InT
est
=
3.6
7 %
NP/
yr/3
*DD
=
122
.03
SR
=
0.1
9
23
S&
P 50
0 FU
TU
RE
S O
PTIO
NS
TR
AD
ING
SY
STE
M B
AC
KT
EST
USI
NG
SPX
OPT
ION
S W
ITH
250
MU
LT
IPL
IER
AS
PRO
XY
Shor
t Onl
y O
ptio
ns S
yste
m v
s U
nder
lyin
g Tr
adin
g Sy
stem
(1/2
001-
8/20
04)
$50,
000$0
$50,
000
$100
,000
$150
,000
$200
,000
$250
,000
$300
,000
$350
,000
10101301010405101061210108161011026102010310203121020516102072310209261021202103020710304151030620103082610310301040107104031510405191040727
Date
Option System Net Profit
$50,
000
$0$50,
000
$100
,000
$150
,000
$200
,000
$250
,000
$300
,000
$350
,000
$400
,000
$450
,000
$500
,000
Underlying Trading System Net Profit
Opt
ions
Sys
tem
Und
erly
ing
Futu
res
Sys
tem