Non-Destructive Container Closure Integrity Testing
40
Non‐Destructive Container Closure Integrity Testing Presented at the New England Chapter of the PDA March 11, 2009 Heinz Wolf PTI Inspection Systems
Transcript of Non-Destructive Container Closure Integrity Testing

Non‐Destructive Container Closure Integrity TestingPresented at the New England
Chapter of the PDA March 11, 2009
Heinz Wolf
PTI Inspection Systems
Outline
Prefilled Syringe Artificial Defects
ASTM F2338‐09 Round Robin Study
Dye Ingress Comparison
Airborne Ultrasonic Technology
Test method for Tyvek Tray
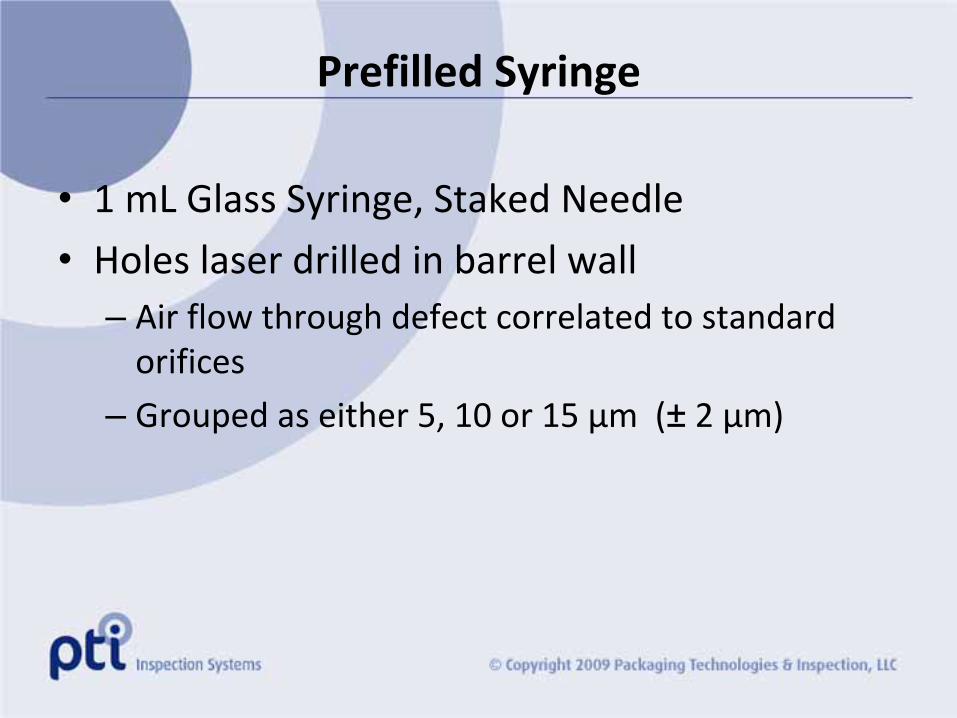
Prefilled Syringe
• 1 mL Glass Syringe, Staked Needle
• Holes laser drilled in barrel wall – Air flow through defect correlated to standard
orifices
– Grouped as either 5, 10 or 15 µm (± 2 µm)

Defects by Lenox Laser1 mL glass syringes, staked needle
Nominal hole size 5 µm
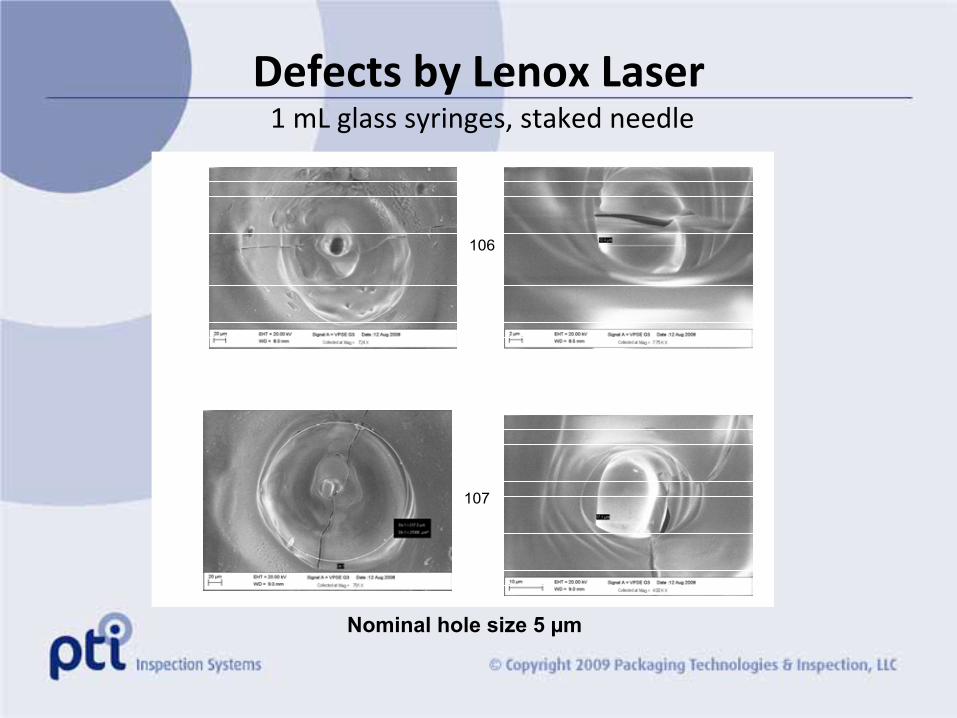
Defects by Lenox Laser1 mL glass syringes, staked needle
106
107
Nominal hole size 5 µm

Defects by Lenox Laser1 mL glass syringes, staked needle
124
136
Nominal hole size10 µm
Nominal hole size15 µm

ASTM F2338‐09 Standard Test Method for Non‐destructive Detection of Leaks in
Packages by Vacuum Decay Method
• Pharmaceutical, food, medical device packages
• Recognized Consensus Standard by the US FDA, CDRH, March, 2006
• Precision and bias (P&B) studies for scope expansion– Prefilled syringes – Air or Liquid Leaks

ASTM Vacuum DecayRound Robin P&B Tests
– Packages• 1mL BD glass syringes
• Positive controls: nominal holes 5, 10, 15 µm
– Leak tests• Study 4 Air‐filled syringes
• Study 5 Water‐filled syringes
– Logistics• 3 Test sites
• 3 Instruments PTI VeriPac 325‐LV
• 3 Replicates of ea. study at ea. site (2 days per site)
• Samples randomized within ea. study

PTI VeriPac 325/LV
Control Touch Screen

Single Package Test Fixture Concept
Vacuum Decay Test Method Parameters
• Total Test Time ~ 18 sec
• Differential Pressure Pass/Fail Limit (dP Ref)
NMT 25 Pa
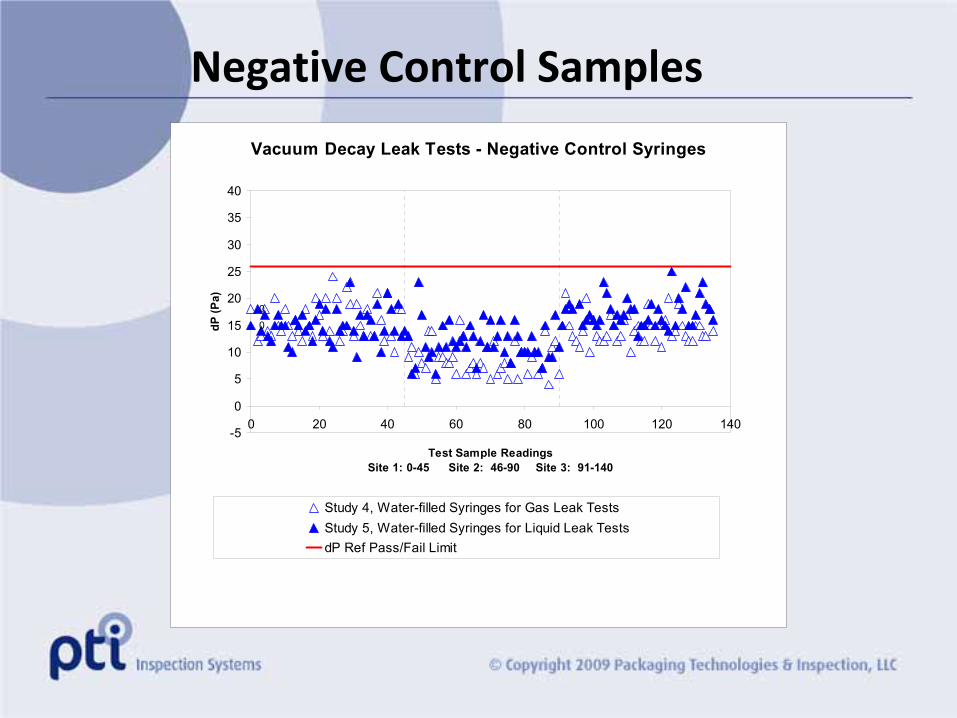
Vacuum Decay Leak Tests - Negative Control Syringes
00
-5
0
5
10
15
20
25
30
35
40
0 20 40 60 80 100 120 140
Test Sample ReadingsSite 1: 0-45 Site 2: 46-90 Site 3: 91-140
dP (P
a)
Study 4, Water-filled Syringes for Gas Leak TestsStudy 5, Water-filled Syringes for Liquid Leak TestsdP Ref Pass/Fail Limit
Negative Control Samples

Vacuum Decay Liquid Leak Test, Air-filled vs Water-filled Syringes
0
20
40
60
80
100
120
140
160
180
200
4.6 4.7 4.8 4.9 5 5.1 5.2 5.3 5.4 5.5 5.6 5.7 5.8
Nominal Hole Size (microns)
dP (P
a)
Study 4, Air-filled Syringes Study 5, Water-filled Syringes dP Ref Pass/Fail Limit
Nominal 5 µm holes
Air‐Filled vs. Water Filled Syringes

Vacuum Decay Liquid Leak Test, Air-filled vs Water-filled Syringes
0
100
200
300
400
500
600
7 8 9 10 11 12 13 14 15 16 17
Nominal Hole Size (microns)
dP (P
a)
Study 4, Air-filled Syringes Study 5, Water-filled Syringes dP Ref Pass/Fail Limit
ABORT assigned 599 mbar
Nominal 10-15 µm holes
Air‐Filled vs. Water Filled Syringes

Vacuum Decay Conclusions ASTM Round Robin P&B Studies
• PTI VeriPac 325/LV Test Method Sensitivity– ≥ 5.0 µm hole detected
• Pass/Fail Criteria– Quantitative readings (Pa)
– No baseline drift
– No calculations or algorithms required
– Same settings across instruments and test sites

Dye Ingress Comparison
Test Requirements
USP 31 <381>Ph.Eur. 3.2.9
ISO 8362-5 Annex C
Modified Method
Dye 0.1% aq. Methylene Blue
0.1% aq. Methylene Blue
0.1% aq. Methylene Blue
Vacuum -27 KPa -25 KPa -37 KPa
Time at Vacuum 10 min 30 min 30 min
Time at Atmospheric
Pressure
30 min 30 min 30 min

Inspector Capability Tests
Test Syringes Syringes Correctly ID’d
Dye Conc.(ppm)
No. Syringes
Inspector 1
Inspector 2
Inspector 3
0 3 3 3 30.1 3 0 0 10.2 3 0 0 30.3 3 1 0 30.4* 3 3 3 3
* LOD for Test Site

Inspector Capability Tests
Test Syringes Syringes Correctly ID’d
Dye Conc.(ppm)
No. Syringes
Inspector 7
Inspector 8
Inspector 10
0 3 2 3 30.1 3 0 0 0
0.2 3 1 2 00.3 3 2 2 10.4 3 2 3 30.5* 3 3 3 3
* LOD for Test Site

Test Samples
Air-filled Syringe Vacuum Decay
dP (Pa)
USP/Ph.Eur. Dye TestYES (Dye visible) or NO (Not visible)
Pass or Fail Inspector 1 Inspector 2 Inspector 3
Negative Controls
11 No No No
10 No No No
12 No No No
9 No No No
9 No No No
5 µm 25 (4.7 µm) No No Yes
71 No Yes Yes
80 No Yes Yes
43 No No No
42 No No Yes
10 µm 217 Yes Yes Yes
177 Yes Yes Yes
264 Yes Yes Yes
231 No No Yes
161 No No No
15 µm ABORT No No Yes
344 Yes Yes Yes
342 Yes Yes Yes
350 Yes Yes Yes
281 Yes Yes Yes
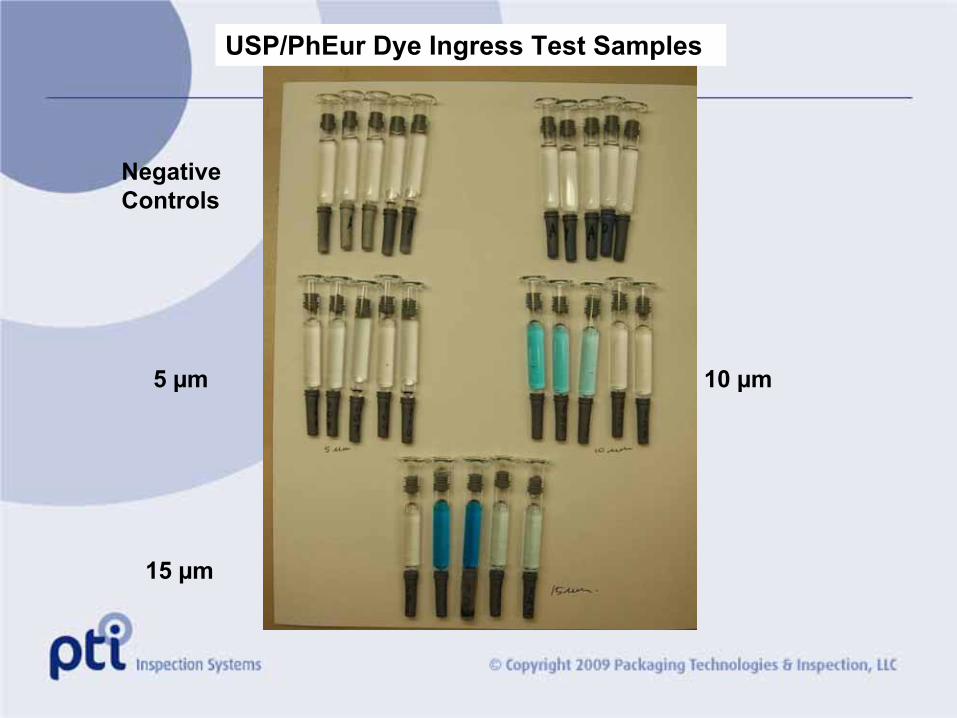
NegativeControls
10 µm5 µm
15 µm
USP/PhEur Dye Ingress Test Samples

Test Samples
Air-filled SyringeVacuum Decay
dP (Pa)
ISO Dye TestYES (Dye visible) or NO (Not visible)
Pass or Fail Inspector 1 Inspector 2 Inspector 3
Negative Controls
7 No No No
6 No No No
7 No No No
6 No No No
7 No No No
5 µm 22 (4.7 µm) No No No
66 No No Yes
79 No Yes Yes
44 No No Yes
42 No No No
10 µm 205 Yes Yes Yes
175 Yes Yes Yes
260 Yes Yes Yes
221 No No Yes
154 No No No
15 µm 388 Yes Yes Yes
346 Yes Yes Yes
335 Yes Yes Yes
337 Yes Yes Yes
301 Yes Yes Yes

Test Samples
Air-filled SyringeVacuum Decay
dP (Pa)
MODIFIED Dye TestYES (Dye visible) or NO (Not visible)
Pass or Fail Inspector 7 Inspector 8 Inspector 10
Negative Controls
9 No Yes No
9 No Yes No
10 No No Yes
9 No Yes Yes
17 Yes No No
5 µm 57 Yes Yes Yes
96 Yes Yes Yes
43 Yes Yes Yes
41 Yes Yes Yes
51 Yes Yes Yes
10 µm ABORT Yes Yes Yes
191 Yes Yes Yes
ABORT Yes Yes Yes
ABORT Yes Yes Yes
188 Yes Yes Yes
15 µm ABORT Yes Yes Yes
ABORT Yes Yes Yes
ABORT Yes Yes Yes
ABORT Yes Yes Yes
ABORT Yes Yes Yes

NegativeControls
10 µm
5 µm
15 µm
Modified Dye Ingress Test Samples

Dye Ingress ConclusionsUSP/Ph.Eur. and ISO methods
• PTI 325/LV Vacuum Decay Method is– More sensitive
– More reliable
– Provides quantitative pressure readings (Pa)
– Not subject to human interpretation
…than USP/Ph.Eur. or ISO closure self‐seal dye ingress methods
– Dye tests can be made more sensitive, but false positive risks remain

Medical Device Packaging
Non-Destructive, Non-Invasive
Inspection Methodologies
Packaging Technologies & Inspection
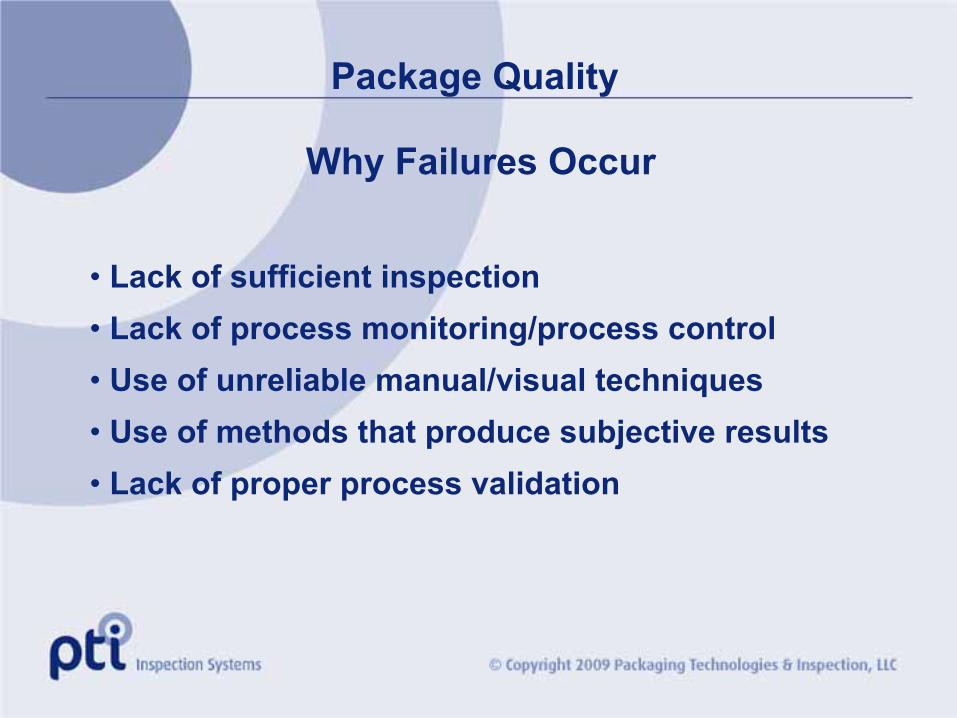
Package Quality
Why Failures Occur
• Lack of sufficient inspection• Lack of process monitoring/process control• Use of unreliable manual/visual techniques • Use of methods that produce subjective results • Lack of proper process validation

Inspection Methods
Choose the right method!
• Assess specific needs to verify package integrity • Ensure package maintains integrity until product is used• Determine how, when and why packages fail• Evaluate inspection method and results • Determine how results correlate to packaging process • Quality control / process control
Seal Quality Inspection with Seal-Scan™
based on
Airborne Ultrasonic Technology

Seal-Scan™ TechnologyUltrasonic signal is transmitted along the X-axis through seal and signal is recorded
Signal measurement is quantitative and correlates to color gauge, creating high resolution image of seal structure and quality.
Strong signal
Weak Signal
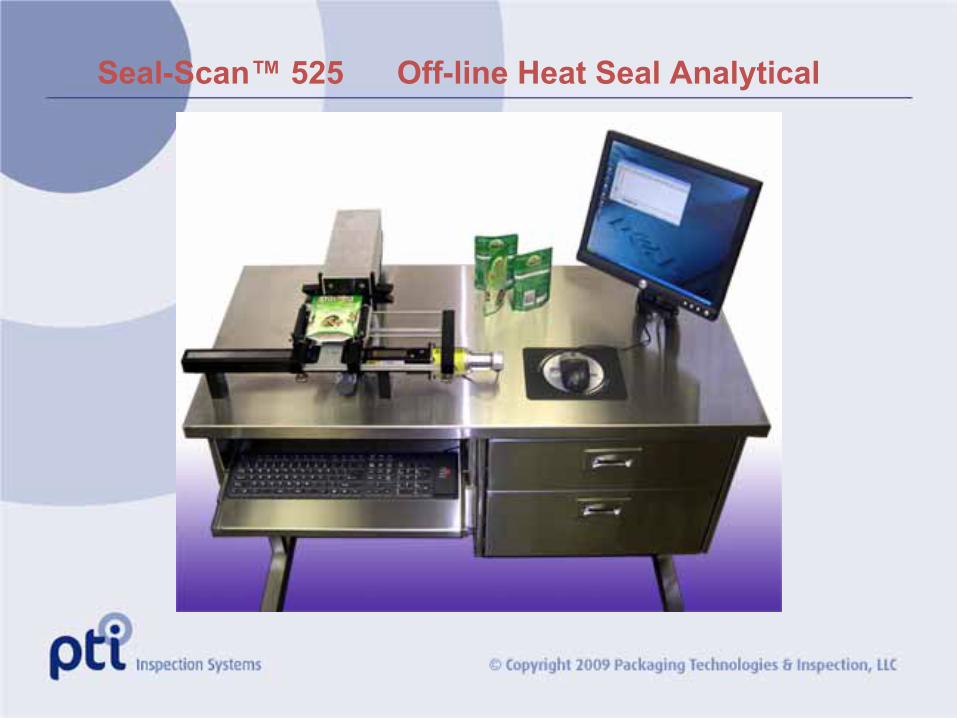
Seal-Scan™ 525 Off-line Heat Seal Analytical

C-Scan Analytical Tools
10 mm
135 mm128 mm
6 mm3.5 mm
C-Scan window statistics within the rectangular box
Modified L-Scan
How to analyze a heatseal
Optimizing the Sealing Process
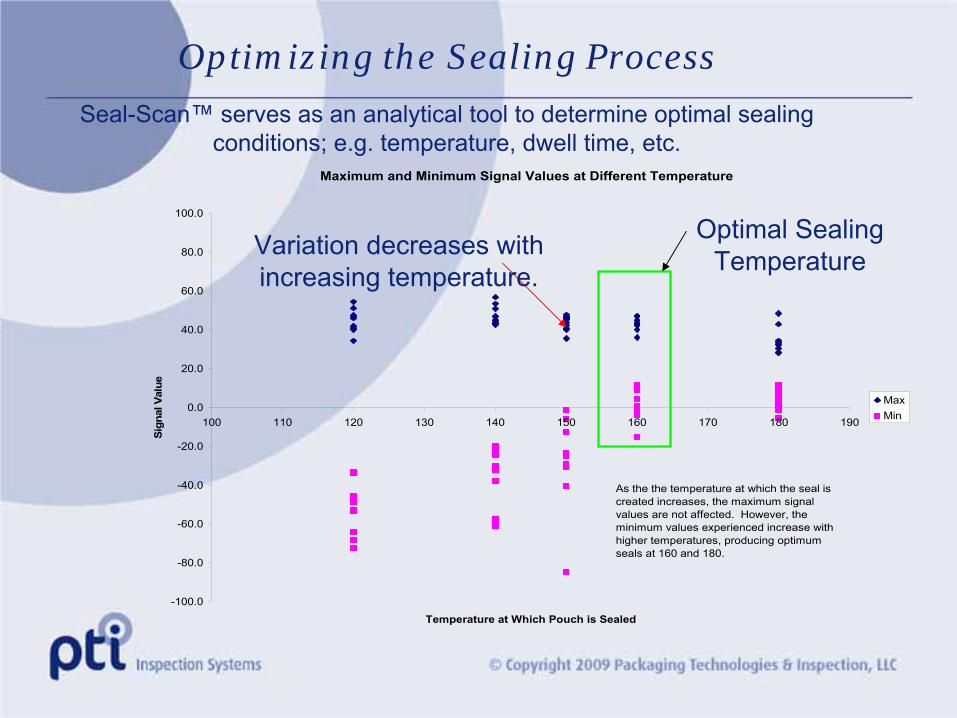
Maximum and Minimum Signal Values at Different Temperature
-100.0
-80.0
-60.0
-40.0
-20.0
0.0
20.0
40.0
60.0
80.0
100.0
100 110 120 130 140 150 160 170 180 190
Temperature at Which Pouch is Sealed
Sign
al V
alue
MaxMin
As the the temperature at which the seal is created increases, the maximum signal values are not affected. However, the minimum values experienced increase with higher temperatures, producing optimum seals at 160 and 180.
Variation decreases with increasing temperature.
Optimal Sealing Temperature
Seal-Scan™ serves as an analytical tool to determine optimal sealing conditions; e.g. temperature, dwell time, etc.

105 C HDPE 105 C HDPE 105 C HDPE 105 C HDPE 105 C HDPE
128 C HDPE 128 C HDPE 128 C HDPE 128 C HDPE 128 C HDPE
108 C TYVEK 108 C TYVEK 108 C TYVEK 108 C TYVEK 108 C TYVEK
134 C TYVEK 134 C TYVEK 134 C TYVEK 134 C TYVEK 134 C TYVEK
Material Analysis
HDPE exhibits better sealing uniformity and
quality at higher
temperatures.
TYVEK®exhibited weaker
bonding at higher
temperatures.
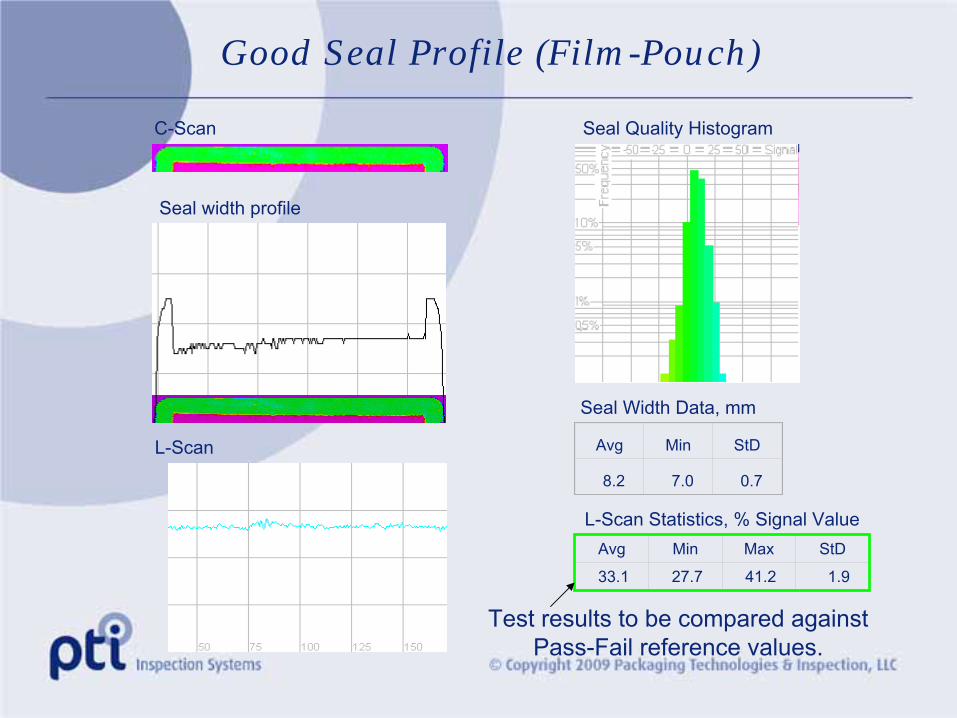
Good Seal Profile (Film-Pouch)
C-Scan
Seal width profile
L-Scan
Seal Width Data, mm
L-Scan Statistics, % Signal Value
Avg Min StD
8.2 7.0 0.7
Avg Min Max StD
33.1 27.7 41.2 1.9
Seal Quality Histogram
Test results to be compared against Pass-Fail reference values.

Seal-Scan™ Defect GalleryBlisterAbrasion Channel
Compressed Overheated Seal
Contamination Crooked Seal Cut

Applications of Seal-Scan™ Ultrasound Inspection
• On-line defect detection • Analyzes seal quality of pouches• Characterizes bonded materials• Works with all materials: film, alu, paper, Tyvek® or composite• Process control• On-line Inspection• Quality control• R&D for package/seal parameters optimization

ASTM F2338-09
Test method development for Tyvek®

Test Set-Up for Tyvek® Tray

Product 1 10/11/2003Tyveck
Tray
TStroke 2.00 Notes: 020-5381
TEqual 0.10
Vac. 400.0 TTest 3.00 000-1001Vacuum,
mbdP/dt, mbar/s TFill, s 1
Ref 349.9 25.1 0.50 HW
Min 356.4 14.3 0.09 PTI
Avg 364.4 16.0 0.10 LabMax 369.8 18.6 0.10 90 PSI
10 pass 10 no leak 450 mbar5 fail FALSE 5 leak
15 total 15 total
Test #Vacuum,
mbdP/dt, Pa/s Time Pass/Fail V.Ref, mb
dP/dt Ref, Pa/s TFill Ref, s
Leak, ccm
Sample ID
Comments
1 369.8 14.3 3:56 PM P 349.9 25.1 0.50 good2 368.8 15.0 3:56 PM P 349.9 25.1 0.50 good3 365.2 15.9 3:57 PM P 349.9 25.1 0.50 good4 356.4 18.6 3:57 PM P 349.9 25.1 0.50 good5 361.3 16.6 3:57 PM P 349.9 25.1 0.50 good6 363.9 16.3 3:58 PM P 349.9 25.1 0.50 good7 363.6 16.6 3:58 PM P 349.9 25.1 0.50 good8 365.5 15.3 3:59 PM P 349.9 25.1 0.50 good9 363.3 16.6 3:59 PM P 349.9 25.1 0.50 good
10 366.2 15.3 3:59 PM P 349.9 25.1 0.50 good
11 349.1 39.1 3:59 PM F 349.9 25.1 0.50
.005" channel
leak
12 351.6 29.9 4:00 PM F 349.9 25.1 0.50
.003" channel
leak
13 328.3 48.7 4:00 PM F 349.9 25.1 0.50
.005" leak in
tray
14 280.3 96.4 4:01 PM F 349.9 25.1 0.50blown seal
15 315.9 62.5 4:01 PM F 349.9 25.1 0.50dot
pattern
2) Optional numeric data for information only
Target Leak , ccm
Test location
Main Air supply, bVacuum supply, mb
Test conditions
Stage
Operator
3)The right part of the table to be filled by operator
Microcalibrator S/N
Product Code
Software Rev.
Tester S/NP225
1) The left part of the table for automatic data recording only Chamber S/N

Thank you!