
Non-connected analyst presentation - Just Retirement
110
13 January 2014 Just Retirement Non-connected analysts presentation www.justretirementgroup.com
Transcript of Non-connected analyst presentation - Just Retirement

13 January 2014
Just Retirement Non-connected analysts presentation
www.justretirementgroup.com

Disclaimer
1
For the purposes of this notice, "document" means this document any oral presentation, any question and answer session and any written or oral material discussed or distributed by the Company during the presentation. This document has been prepared and issued by and is the sole responsibility of Just Retirement Group Plc (the “Company”).
This document does not constitute or form part of any offer or invitation to sell or issue, or any solicitation of any offer to purchase or subscribe for, any securities of the Company or any related company nor shall it or any part of it nor the fact of its distribution form the basis of, or be relied on in connection with, any contractual commitment or investment decision in relation thereto nor does it constitute a recommendation regarding any securities. This document, which speaks as of the date hereof only, is intended to present background information on the Company, its business and the industry in which it operates and is not intended to provide complete disclosure upon which an investment decision could be made. The merit and suitability of an investment in the Company should be independently evaluated and any person considering such an investment in the Company is advised to obtain independent advice as to the legal, tax, accounting, financial, credit and other related advice prior to making an investment.
This document and any materials distributed in connection with this document may include certain “forward-looking statements”, beliefs or opinions, including statements with respect to the Company’s business, financial condition and results of operations. These statements, which may contain the words “anticipate”, “believe”, “intend”, “estimate”, “expect” and words of similar meaning, reflect the directors’ beliefs and expectations and involve risk and uncertainty because they relate to events and depend on circumstances that will occur in the future. No representation is made that any of these statements or forecasts will come to pass or that any forecast results will be achieved. There are a number of factors that could cause actual results and developments to differ materially from those expressed or implied by these statements and forecasts. Past performance of the Company cannot be relied on as a guide to future performance. Forward-looking statements speak only as at the date of this document and the Company expressly disclaims any obligations or undertaking to release any update of, or revisions to, any forward-looking statements in this document. No statement in this document is intended to be a profit forecast. As a result, you are cautioned not to place any undue reliance on such forward-looking statements.
To the extent available, the industry, market and competitive position data contained in this document has come from official or third party sources. Third party industry publications, studies and surveys generally state that the data contained therein have been obtained from sources believed to be reliable, but that there is no guarantee of the accuracy or completeness of such data. While the Company believes that each of these publications, studies and surveys has been prepared by a reputable source, the Company has not independently verified the data contained therein. In addition, certain of the industry, market and competitive position data contained in this document come from the Company's own internal research and estimates based on the knowledge and experience of the Company's management in the market in which the Company operates. While the Company believes that such research and estimates are reasonable and reliable, they, and their underlying methodology and assumptions, have not been verified by any independent source for accuracy or completeness and are subject to change without notice. Accordingly, undue reliance should not be placed on any of the industry, market or competitive position data contained in this document. All projections, valuations and statistical analyses are provided to assist the recipient in the evaluation of the matters described herein. They may be based on subjective assessments and assumptions and may use one among alternative methodologies that produce different results and to the extent that they are based on historical information, they should not be relied upon as an accurate prediction of future performance.
The document has not been independently verified and no representation or warranty, express or implied, is made or given by or on behalf of the Company, or its directors, officers, advisers or any person acting on their behalf, as to, and no reliance should be placed for any purposes on, the accuracy, completeness or fairness of the information or opinions contained in this document and no responsibility or liability whatsoever for any loss howsoever arising from any use of this document or its contents otherwise arising in connection therewith is assumed by any such persons for any such information or opinions or for any errors or omissions. The Company is under no obligation to update or keep current information contained in this document, to correct any inaccuracies which may become apparent, or to publicly announce the result of any revision to the statements made herein except where they would be required to do so under applicable law, and any opinions expressed in them are subject to change without notice.

Agenda
1. Introduction to Just Retirement Rodney Cook
2. Market potential and a scalable operating model David Cooper
3. Unrivalled proprietary IP Shayne Deighton
Coffee Break
4. Demonstration of PrognoSysTM Dr. Tim Crayford
5. A robust financial model and strong track record Simon Thomas
6. Conclusion and outlook Rodney Cook
Drinks
2

Today’s presenting team
Joined Just Retirement in July 2010
Formerly Managing Director of Life and Pensions at Liverpool Victoria (LV=)
Previously at AMP, Pearl, Zurich Insurance Group and Prudential
A qualified actuary with over 34 years experience in financial services
Joined Just Retirement in October 2008 and has held positions as Group Chief Actuary and CRO
Formerly Group Financial Management Director at Aviva and UK Life Finance Director at Zurich Financial Services
With over 32 years experience, Shayne has also been a Partner at E&Y and Principal at Tillinghast
Joined Just Retirement in May 2011
Formerly Chief Medical Advisor to The Department for Transport & Medical Director at Croydon Primary Care NHS Trust
Has over 25 years of medical experience and academic epidemiological knowledge
Joined Just Retirement in April 2006
Over 30 years in financial services including retail banking, actuarial consulting and retirement
Previously at GE Capital, Centrica plc and Bradford & Bingley
Joined Just Retirement in July 2006
Formerly Finance and Customer Services Director at Canada Life
Spent 10 years at Nationwide Building Society, latterly as Group Financial Controller
A qualified Chartered Accountant with over 13 years experience in the UK life assurance industry
Rodney Cook
Chief Executive Officer
Shayne Deighton
Group Chief Actuary
Dr. Tim Crayford
Medical Director
David Cooper
Group Distribution & Marketing Director
Simon Thomas
Group Finance Director
3

Agenda
1. Introduction to Just Retirement Rodney Cook
2. Market potential and a scalable operating model David Cooper
3. Unrivalled proprietary IP Shayne Deighton
Coffee Break
4. Demonstration of PrognoSysTM Dr. Tim Crayford
5. A robust financial model and strong track record Simon Thomas
6. Conclusion and outlook Rodney Cook
Drinks
4

Market leading and fast-growing provider of Individually Underwritten
Annuities (“IUA”) and Lifetime Mortgages (“LTM”) in the United Kingdom
– IUA: Offer better rates (compared to standard annuities) to those who
suffer from conditions which may detrimentally impact life expectancy
– LTM: Designed for individuals in retirement who wish to realise some of
the equity value in their home
Innovative provider of other retirement income products with significant
market potential, including DB de-risking, fixed-term annuities and care
annuities
Established in August 2004, acquired by funds advised by Permira LLP in
November 2009
Office: Reigate, United Kingdom
Employees: 819 as at 30 June 2013
Customers: Over 240,000 customers
Management: Over 100 years of combined relevant experience
Total annuity premiums £1,344m
Lifetime mortgage advances £310m
IFRS new business operating profit £59m
IFRS in-force operating profit £41m
Total IFRS underlying operating profit £100m
Embedded value £504m
Assets under management £6,037m
What we are Award winning product and service propositions
Key financials (year ended June 2013)
Overview of Just Retirement
Annuity provider
Mortgage provider
Financial service provider
Top 100 company to work for
5
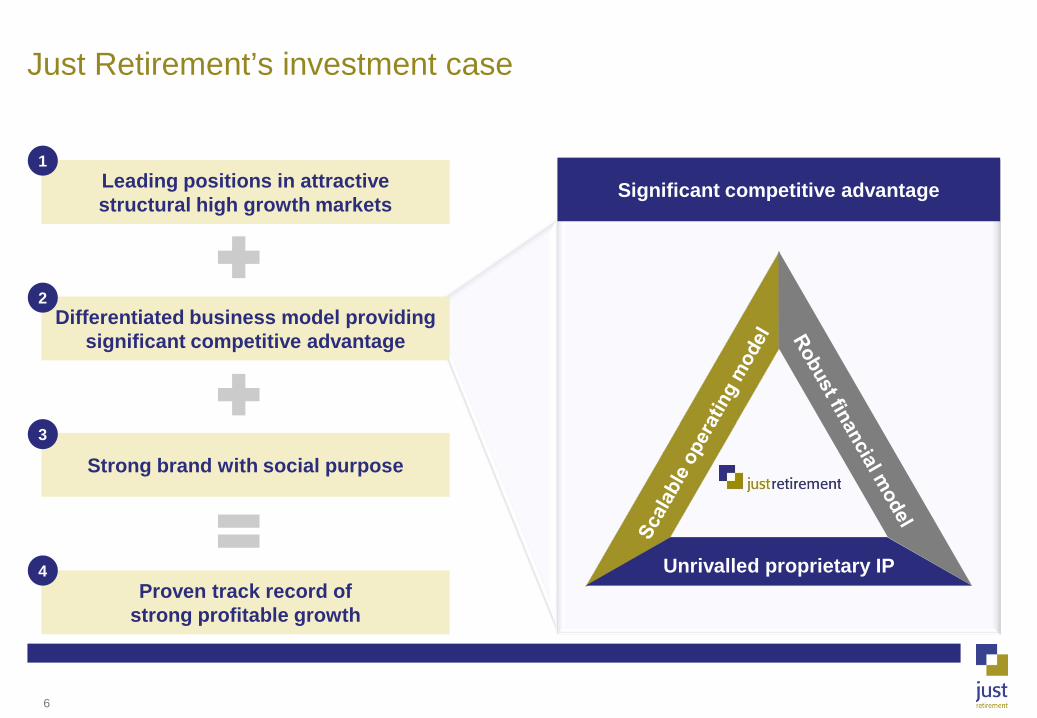
Just Retirement’s investment case
Leading positions in attractive structural high growth markets
1
Differentiated business model providing significant competitive advantage
2
Proven track record of strong profitable growth
4
Significant competitive advantage
Unrivalled proprietary IP
Strong brand with social purpose 3
6

Leading positions in attractive structural high growth markets
Source: ABI, Equity Release Council, management estimates. Forecasts based on management estimates. 1. Market share excludes fixed term annuities.
1
The fast-growing UK annuity market UK lifetime mortgage market
9.9% market share (2012)(1)
31.0% market share (2012) Principal focus on largest and fastest growing segments (medically enhanced / lifestyle) Significant share in smaller impaired segment
IUA
Standard
+24%
+22%
+15%
Total annuities
Individually underwritten
annuities
#3
#1
30.1% market share (2012)
c.£300bn potential opportunity
45.7% market share (2012)
Total lifetime mortgages
Drawdown lifetime
mortgages
#2
#1
CAGR CAGR
+19%
7
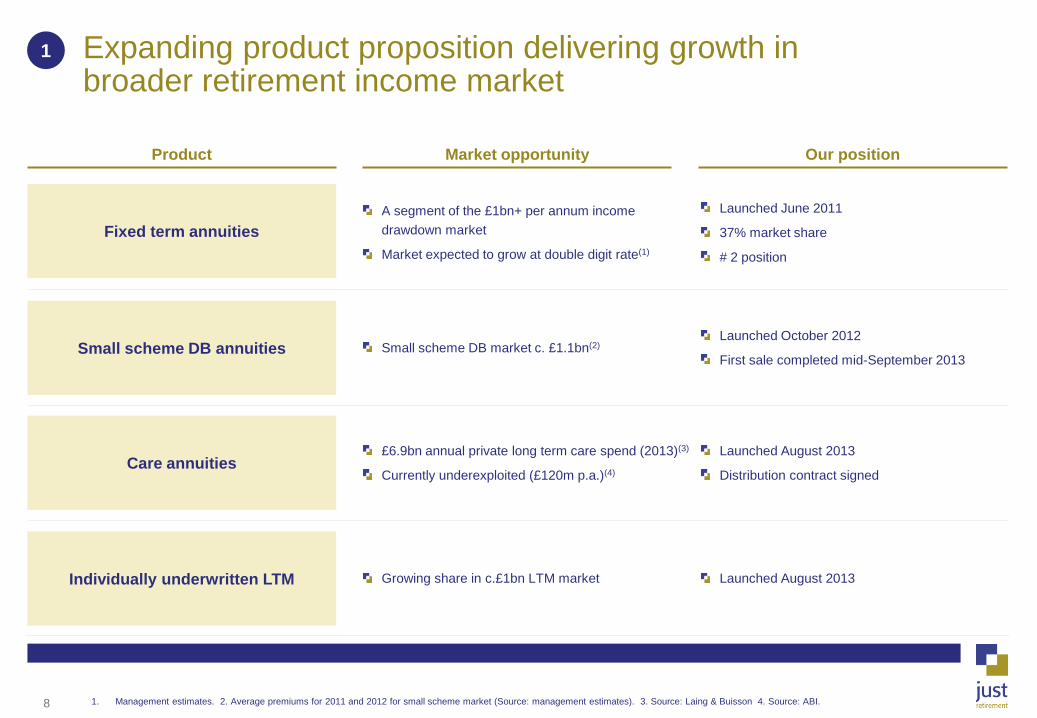
A segment of the £1bn+ per annum income drawdown market
Market expected to grow at double digit rate(1)
Launched June 2011
37% market share
# 2 position
Small scheme DB market c. £1.1bn(2) Launched October 2012
First sale completed mid-September 2013
£6.9bn annual private long term care spend (2013)(3)
Currently underexploited (£120m p.a.)(4)
Launched August 2013
Distribution contract signed
Growing share in c.£1bn LTM market Launched August 2013
Product Market opportunity Our position
Expanding product proposition delivering growth in broader retirement income market
1. Management estimates. 2. Average premiums for 2011 and 2012 for small scheme market (Source: management estimates). 3. Source: Laing & Buisson 4. Source: ABI.
Small scheme DB annuities
Fixed term annuities
Individually underwritten LTM
Care annuities
1
8

Differentiated business model providing significant competitive advantage
Capital efficient model
Sophisticated investment management strategy
Fully embedded financial risk management
Highly automated processes
Multi-channel distribution
Leading service
Experienced and motivated team
Strong operational risk management
2
Unrivalled proprietary IP
Unrivalled proprietary data in the core IUA segments
Experienced medical team
Next generation underwriting system: PrognoSysTM
9
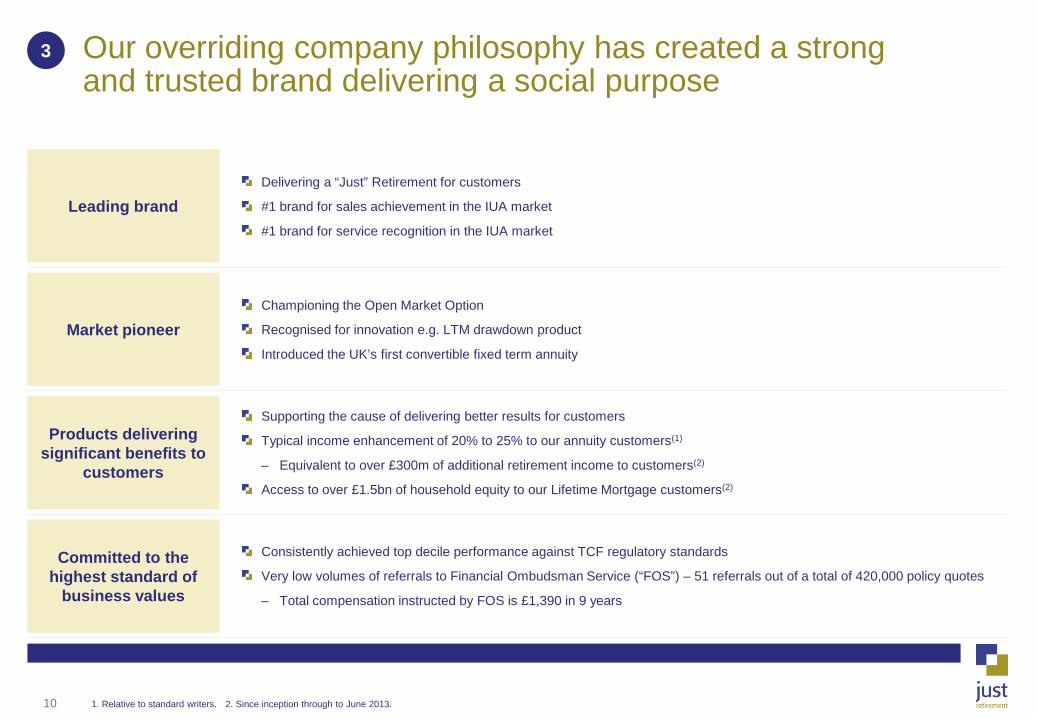
Delivering a “Just” Retirement for customers
#1 brand for sales achievement in the IUA market
#1 brand for service recognition in the IUA market
Championing the Open Market Option
Recognised for innovation e.g. LTM drawdown product
Introduced the UK’s first convertible fixed term annuity
Supporting the cause of delivering better results for customers
Typical income enhancement of 20% to 25% to our annuity customers(1)
– Equivalent to over £300m of additional retirement income to customers(2)
Access to over £1.5bn of household equity to our Lifetime Mortgage customers(2)
Consistently achieved top decile performance against TCF regulatory standards
Very low volumes of referrals to Financial Ombudsman Service (“FOS”) – 51 referrals out of a total of 420,000 policy quotes
– Total compensation instructed by FOS is £1,390 in 9 years
Our overriding company philosophy has created a strong and trusted brand delivering a social purpose
1. Relative to standard writers. 2. Since inception through to June 2013.
3
Leading brand
Market pioneer
Products delivering significant benefits to
customers
Committed to the highest standard of
business values
10

Proven track record of strong profitable growth
Source: Just Retirement. Note: FY represents Just Retirement's financial year to 30 June. 1. 2006 figure is Just Retirement’s IFRS pre-tax profit. 2007 – 2010 IFRS operating profit figures as stated in Just Retirement published accounts. Figures from 2011 onwards are Just Retirement’s underlying operating profit. 2. Normalised new business operating profit for the year ended 30 June 2011 shown (excludes exceptional profit of £14m). 3. Excluding IPO proceeds. 4. CAGR excludes £40m of capital injected over 2011-13.
4
New business sales (FY) IFRS underlying operating profit (FY)(1) Embedded value (FY)
£m £m £m
(2)
(3)
11

Strategy is to provide positive outcomes for all key stakeholders
Continue to strengthen and leverage unrivalled IP
Implement Phase II of PrognoSysTM rollout in 2014
– Apply innovative individual mortality curve underwriting approach to pricing
– Improve competitive pricing and profitability in core IUA market
– Aim to increase share of segments currently under-represented
Further embed service and solutions into key intermediary partners
– Secure increased share from existing channels
Develop emerging distribution channels
– Continue to establish long-term distribution agreements with affinity brands / life insurers
– Further access to digital channels
Use unrivalled IP to extend products in retirement income market
– Complex issues faced by retirees: generally poorly served
– Already demonstrated track record of innovation: LTM drawdown, FTAs, Individually Underwritten LTMs
Expand internationally: exclusive arrangements to enter one new country (modest investment required)
Continue to optimise robust and capital efficient model:
– Investment management: further diversify portfolio by currency / industry via BlackRock
– Continue to seek “best-of-breed” reinsurance agreements
– Continue to improve operating model efficiency
Intellectual property
Distribution
Product development
Operating model
12

Agenda
1. Introduction to Just Retirement Rodney Cook
2. Market potential and a scalable operating model David Cooper
3. Unrivalled proprietary IP Shayne Deighton
Coffee Break
4. Demonstration of PrognoSysTM Dr. Tim Crayford
5. A robust financial model and strong track record Simon Thomas
6. Conclusion and outlook Rodney Cook
Drinks
13
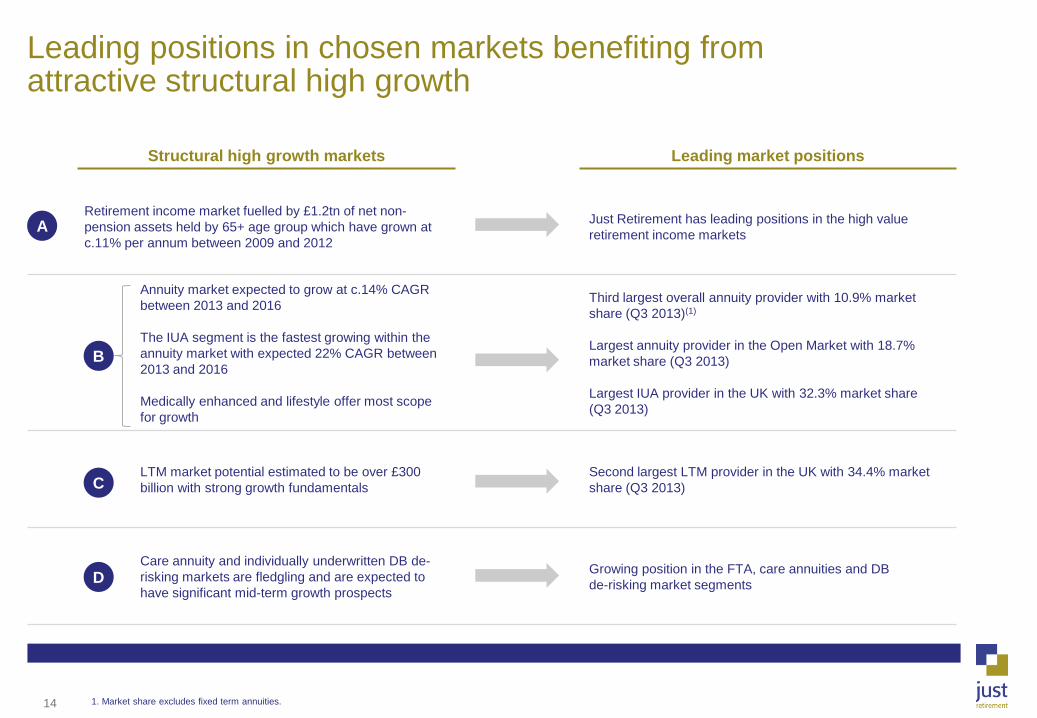
Structural high growth markets Leading market positions
Leading positions in chosen markets benefiting from attractive structural high growth
1. Market share excludes fixed term annuities.
Retirement income market fuelled by £1.2tn of net non-pension assets held by 65+ age group which have grown at c.11% per annum between 2009 and 2012
Just Retirement has leading positions in the high value retirement income markets
Annuity market expected to grow at c.14% CAGR between 2013 and 2016 The IUA segment is the fastest growing within the annuity market with expected 22% CAGR between 2013 and 2016 Medically enhanced and lifestyle offer most scope for growth
Third largest overall annuity provider with 10.9% market share (Q3 2013)(1)
Largest annuity provider in the Open Market with 18.7% market share (Q3 2013) Largest IUA provider in the UK with 32.3% market share (Q3 2013)
LTM market potential estimated to be over £300 billion with strong growth fundamentals
Second largest LTM provider in the UK with 34.4% market share (Q3 2013)
Care annuity and individually underwritten DB de-risking markets are fledgling and are expected to have significant mid-term growth prospects
Growing position in the FTA, care annuities and DB de-risking market segments
B
C
D
A
14

UK population is ageing(1)
Sustainable growth in retirement assets being driven by long-term demographic trends
Source: ABI, ONS. 1. Data from 2012 report using ONS 2010-based population projections. 2. Data derived from ONS (mid-2012 figures) and ABI (Q1 2013 figures).
Baby boomers approaching retirement(2)
A
23% 23% 24% 26% 28% 29%
15

Distribution Product
Current distribution and product segmentation for annuities
Source: ABI, management estimates. 1. Data for a 65-year-old male. Just Retirement analysis.
Standard annuities
Based on a limited number of rating factors (e.g. age, post code)
Take no account of individual lifestyle or medical conditions
Typical life expectancy(1) – 25 years
Individually underwritten annuities
Take account of individual circumstances: significant number of rating factors
IUA market: £4.5bn (32%)
B
2012 total annuities: £14.0bn
Open market option (“OMO”)
At retirement, customers have the option of shopping around for the best annuity rate on offer in the open market
Regulatory and industry bodies supportive in promoting the use of the open market option with customers
OMO penetration is increasing
Greater OMO usage driving increasing IUA penetration
Captive internal vestings
At retirement, customers’ accumulated pension pots are converted into their existing pension provider’s annuity products
Core IUA: for medical / lifestyle factors which may lead to shortened life expectancy (e.g. Angina, asthma, smoking)
– Typical life expectancy(1): 17-24 years
Impaired: for significant medical conditions that impair life expectancy (e.g. cancer, Parkinson’s)
– Typical life expectancy(1): 5 – 16 years
(68%)
(39%)
(61%)
16

Increasing OMO penetration of a growing annuity market
Source: ABI. Note: Forecasts based on management estimates. Calendar year data for the market.
OMO penetration of a growing annuities market is increasing
Overall annuity market: – Continuing high number of retirees
– Increasing amount of assets held in individual DC pension schemes
– Unwind of deferrals and minimum age changes
– Continued demand for annuities relative to other retirement income choices
Increase in OMO: – Pressure from political, regulatory and industry
bodies to encourage shopping around, e.g.:
– ABI code of conduct on retirement choices
– FCA thematic review of annuity pricing
– “Treating customers fairly”
Short-term impact in 2012/2013 from: – RDR
– Gender neutral pricing
– Increases to GAD limit (allowing people to take higher pension incomes from their drawdown funds)
Key drivers of growth
B
OMO % of total annuity
Increased penetration
5.7 5.4 5.9 6.3 8.5 7.6
9.3 11.0
12.9
5.8 5.4 5.2 4.8
5.65.2
5.6
5.8
5.8
11.5 10.8 11.1 11.2
14.0
12.8
14.9
16.8
18.7
2008 2009 2010 2011 2012 2013e 2014e 2015e 2016e
£bn
OMO Non-OMO
CAGR
‘08–12 ‘12–13e
’13e–16e
Total annuities 5% (9%) 14%
Non-OMO (1%) (8%) 4%
OMO 10% (10%) 19%
50% 50% 62%60%57%53% 60% 69%66%
17

IUA is the fastest growing segment of the annuity market
Source: ABI. Note: Forecasts based on management estimates. Market data shown for calendar year. 1. Penetration by value of policies. 2. Includes captive IUA sales. Estimated as £0.2bn in 2012, £0.4bn in 2013, £0.5bn in 2014, £0.7bn in 2015 and £0.8bn in 2016.
B
IUA penetration is increasing
Increasing number of customers becoming aware of the benefits of IUA
– IUA generally offers better rates to people with certain lifestyle / medical conditions resulting in a higher number of OMO customers opting for IUA
– Greater media attention
FCA thematic review into annuity pricing also positive for IUA writers
ABI code of conduct should also be positive for IUA writers: compulsory questions on medical and lifestyle conditions
Key drivers of growth
Increased penetration(1)
CAGR
‘08–12 ‘12–13e
’13e–16e
Total annuities 5% (9%) 14%
Non-OMO
standard (2%) (12%) 2%
OMO Standard (1%) (8%) 17%
IUA(2) 33% (8%) 22%
Total IUA % of total annuity
41% 12% 16% 32% 32% 27% 22% 35% 38%
(2)
18

Large and underpenetrated potential market – Potential £300bn(1) of home equity available for release
Government support – “Ready for Ageing” Select Committee Paper Demand-side drivers – Supplement low savings rates / retirement income – Repay outstanding debt / mortgages (particularly interest only) – Trusted brand names (e.g. Saga) entering the market
Changing attitudes toward retirement – New retiree generation less concerned about leaving wealth to offspring
Supply-side drivers – Increased number of market participants – Product innovation (e.g. drawdown)(2)
– Broadening distribution
Key drivers of growth Strong annual lifetime mortgage market growth(3)
Favourable conditions supporting LTM market growth
Source: Equity Release Council. 1. Management estimates, based on Pensions Policy Institute, Retirement income and assets: outlook for the future, February 2010. 2. Drawdown LTM allows cash to be released based on a pre-agreed time period and overall drawdown limit (which may be reviewed as property price increases). 3. Data based on calendar year. Forecasts are management estimates. 4. Includes reversion sales.
C
(4)
19

Fixed term annuities Small scheme DB annuities Care annuity Individually underwritten LTM products
Fixed-term guaranteed income (within government limits)
Guaranteed maturity amount at end of agreed term
Defined benefit de-risking solutions
Guaranteed income to pay residential care home fees
Tax free if paid to care home
Lump sum lifetime mortgage
Maximum LTV
A segment of the £1bn+ per annum income drawdown market
Estimated total DB market size of c.£4.4bn(1), of which small scheme DB market £1.1bn p.a.(2)
Small schemes offer most scope for medical underwriting
£6.9bn(3) annual private long term care spend in 2013
Care annuity size only £120m p.a. (2011)(4)
Significant growth potential given underlying demographic trends and declining State funding
Growing share of the c.£1bn LTM market
New product with attractive conversion feature
Enables Just Retirement to capture customers seeking to defer buying annuities and build IUA pipeline
Introduced the first deep underwritten approach aimed at smaller schemes
Supported by tele-underwriting
New product with shortened sales process and exclusive long-term distribution arrangement with Saga
Individually underwritten LTM product
Single solution which maximises LTV on either underwritten or non-underwritten basis
Grown to New Business Sales of £79m in 2012/13 since launch
in June 2011
First sale completed mid-September 2013 Launched in August 2013 Launched in August 2013
Expanding product proposition to extend future growth in broader retirement income market
Product description
Market opportunity
Just Retirement proposition
Progress
1. Source: Lane, Clark & Peacock. 2. Source: Management estimate. 3. Source: Laing & Buisson. 4. Source: ABI data.
D
20

Scalable operating model
Fully automated and highly scalable underwriting systems Efficient data capture and turnaround times
Continued efficiency benefits as business grows No substantial investment planned to maintain current capabilities
Not dependent on customers preferred route to buy Well positioned for digital channels
Maintains top line growth and market share Delivers sales from emerging channels
Award winning service proposition
Creates trusted intermediary relationships supporting top line growth Very low customer complaints / redress costs
Management team has over 100 years of combined experience Sunday Times “Top 100 Employer”
Capitalise on growth opportunities Reduced staff turnover costs
Strong risk management compliance culture Three lines of defence
Controlled risk taking to maximise profits £1,390 FOS directed compensation in 9 years
Key features Benefits
Unrivalled proprietary IP
Automated processes
Leading service
Multi-channel distribution
Operational risk
management
Experienced and motivated
team
21
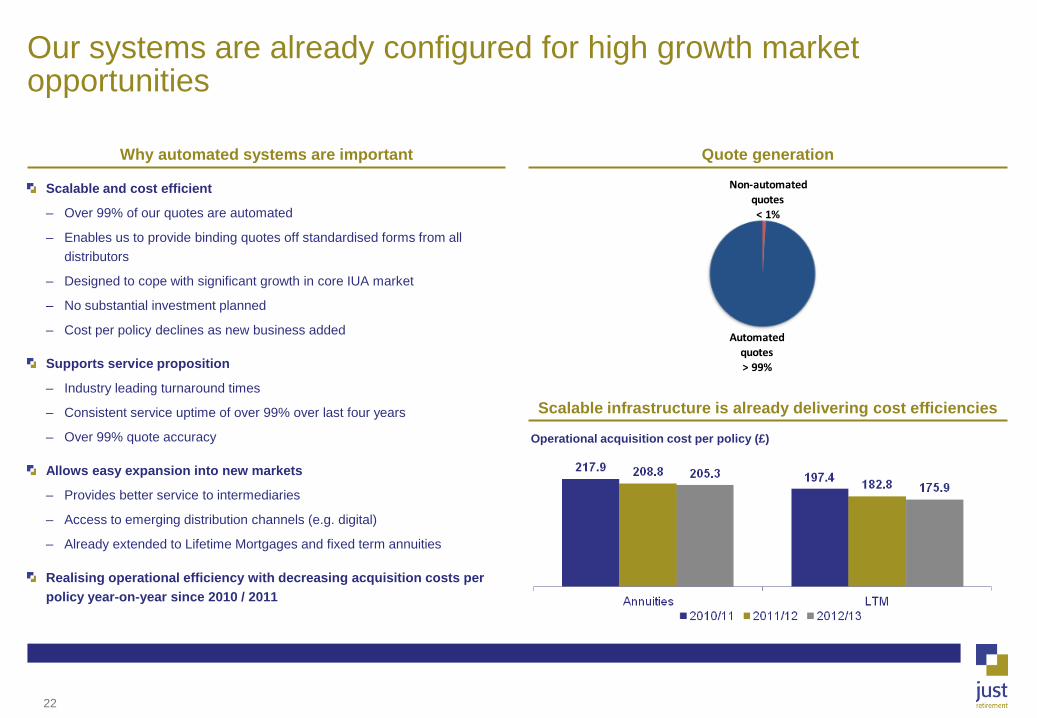
Our systems are already configured for high growth market opportunities
Scalable and cost efficient
– Over 99% of our quotes are automated
– Enables us to provide binding quotes off standardised forms from all distributors
– Designed to cope with significant growth in core IUA market
– No substantial investment planned
– Cost per policy declines as new business added
Supports service proposition
– Industry leading turnaround times
– Consistent service uptime of over 99% over last four years
– Over 99% quote accuracy
Allows easy expansion into new markets
– Provides better service to intermediaries
– Access to emerging distribution channels (e.g. digital)
– Already extended to Lifetime Mortgages and fixed term annuities
Realising operational efficiency with decreasing acquisition costs per policy year-on-year since 2010 / 2011
Why automated systems are important Quote generation
Scalable infrastructure is already delivering cost efficiencies
Non-automated quotes< 1%
Automated quotes> 99%
Operational acquisition cost per policy (£)
22

Distribution strategy configured to accelerate IUA penetration
Active lobbying with government and media to drive positive reform to the way annuities are sold
Execute strategies to promote market transparency and open architecture distribution
Promoting benefits of multiple provider panels
Utilise technology to embed Just Retirement’s key advantages into intermediary processes
Delivery of training and promotional materials to support IFAs through RDR transition
Deploying The Open Market Annuity Service (“TOMAS”) with volume annuity distributors to promote an efficient, open and transparent market
Equipping largest trustees with turn-key shopping around service
Continue working with leading EBCs to gain access to growing volume trustee based DC schemes
Leverage relationship with 1 of the 4 main price comparison websites
Continue to invest in the Annuity Service to access customer bases of powerful consumer brands entering the market, to penetrate the affinity sector and fast emerging digital / aggregator channels
Action Strategy
Increase awareness and
accessibility to IUAs
Deepen relationships with
financial intermediaries
Leverage growth in
workplace distribution
Prepare for shift in consumer
buying behaviour
Awar
enes
s an
d ac
cess
Pe
netr
atio
n D
iver
sific
atio
n
23

Multi-channel distribution for IUAs
1. Includes Honister and Openwork. Honister closed to new business in July 2012, Openwork lost contract in November 2012. 2. Includes direct sales.
Channel Outlook on future importance
% of JR premiums Examples of JR relationships
2011/12 2012/13
- Networks(1) 62.6% 56.1%
- Regionals 15.2% 15.0%
15.1% 19.9%
5.1% 4.1%
0.3% 2.3%
0.7% 1.7%
0.8% 0.9%
Financial intermediaries
Specialists
Employee benefit consultants
Banks & building societies
Life insurance companies
Price comparison websites(2)
Trad
ition
al c
hann
els
Emer
ging
ch
anne
ls
24
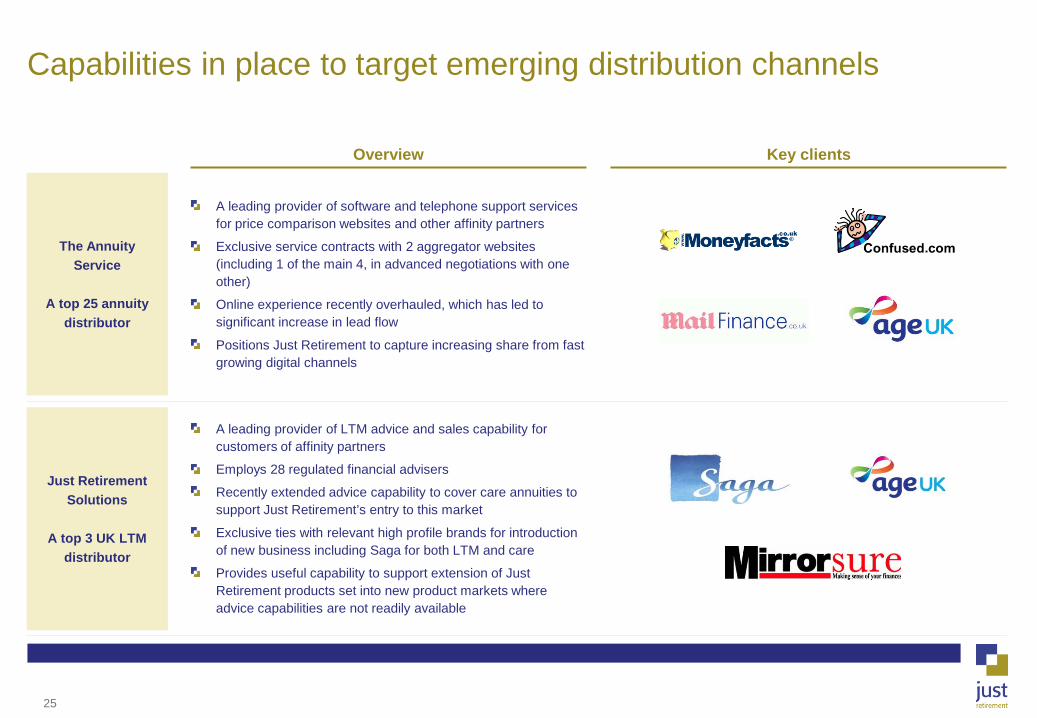
A leading provider of software and telephone support services for price comparison websites and other affinity partners
Exclusive service contracts with 2 aggregator websites (including 1 of the main 4, in advanced negotiations with one other)
Online experience recently overhauled, which has led to significant increase in lead flow
Positions Just Retirement to capture increasing share from fast growing digital channels
A leading provider of LTM advice and sales capability for customers of affinity partners
Employs 28 regulated financial advisers
Recently extended advice capability to cover care annuities to support Just Retirement’s entry to this market
Exclusive ties with relevant high profile brands for introduction of new business including Saga for both LTM and care
Provides useful capability to support extension of Just Retirement products set into new product markets where advice capabilities are not readily available
Overview Key clients
Capabilities in place to target emerging distribution channels
The Annuity Service
A top 25 annuity
distributor
Just Retirement Solutions
A top 3 UK LTM
distributor
25

Financial Adviser awards Customer feedback
Financial advisers consistently recognise the strength of Just Retirement’s sales and service execution
“The reason I’m writing to you is to say a big THANK YOU for what you did for me. I never thought I'd meet someone as warm and friendly as you in the world of finance and pensions”
“We would like to take this opportunity to thank you for all the help and advice given by you in a way which made it possible for us to feel relaxed and completely confident in a matter totally outside our experience”
“The title “Just” Retirement is very fitting!”
“[Competitor 1] just spoke gobbledygook. Just Retirement explained everything in plain English and gave me different quotes to compare.”
26

Differentiated service proposition supports strong relationships with distributors and customers
Processes which are robust, tailored and scalable Continuing strong service levels
Consistent top decile performance against TCF regulatory standards Strong set of underpinning values, attitudes and behaviours
Organised feedback Focus groups Fully integrated complaints process
New service features delivered in the last 12 months include:
– Online age verification – Improved end customer 1st call resolution – 1 day SLA for death processing
A differentiated approach IUA providers – overall average service quality ratings
Key performance indicators
Key performance indicator Just
Retirement targets
Just Retirement
actual
1 24 hour quote production ≥90% 98%
2 Quote accuracy ≥98% 99%
3 Annuity cycle time 24 days 22 days
4 Post-sale complaints as % of transactions ≤0.5% 0.41%
Source: 2013 ORC annuity tracker results.
Service oriented systems
Embedded service culture
Genuine customer insights
Continual improvement
27

Agenda
1. Introduction to Just Retirement Rodney Cook
2. Market potential and a scalable operating model David Cooper
3. Unrivalled proprietary IP Shayne Deighton
Coffee Break
4. Demonstration of PrognoSysTM Dr. Tim Crayford
5. A robust financial model and strong track record Simon Thomas
6. Conclusion and outlook Rodney Cook
Drinks
28
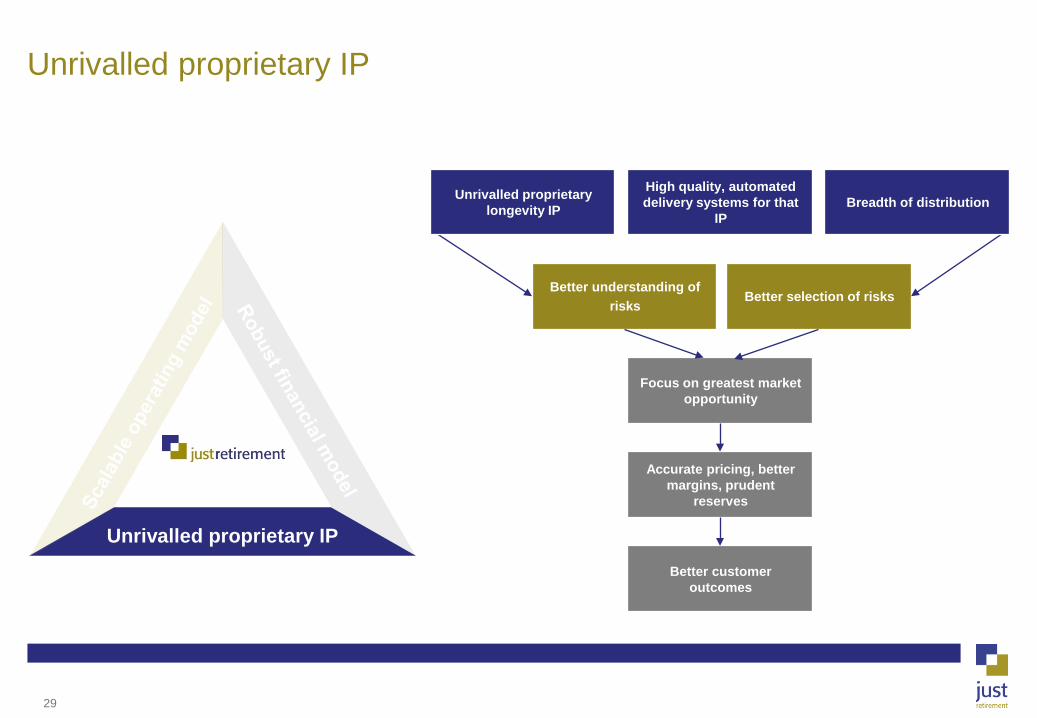
Unrivalled proprietary IP
Better customer outcomes
Better understanding of risks
Unrivalled proprietary IP
High quality, automated delivery systems for that
IP
Better selection of risks
Focus on greatest market opportunity
Accurate pricing, better margins, prudent
reserves
Breadth of distribution Unrivalled proprietary longevity IP
29

Continual evolution of approach to IP and underwriting
Continued improvements to Merica
Increased Just Retirement involvement
Extension of Just Retirement underwriting levels into both more healthy and more impaired
Medical Director recruited
Begins to build team
PrognoSysTM plan built
PrognoSysTM Phase II
Planned standalone use from July 2014
Continued evolution
Healthy lives
More impaired lives
Different ages
Horizon scanning
Launched with Hannover Re relationship
JR Merica fully integrated into new business platform
Potential for manual underwriting of more impaired
Mortality basis agreed but JR free to change for pricing
Planning begins for next generation underwriting
Increased penetration of impaired segment
PrognoSysTM Phase I completed
Use alongside Merica initially
2004 2009 2011 2013 2014+
Reserving and underwriting begins to
reflect new IP
30

Our IP is difficult to replicate
I
Largest database in core IUA market segments (over 600,000 person-years) Rapidly expanding at 15,000 person-years per month 250 rating factors captured per quote Proprietary data
New players / reassurers have no data Standard players have no relevant data
8-strong in-house team lead by Dr. Tim Crayford Consists of epidemiologists, doctors, biostatistical modellers, underwriters and actuaries
Relevant mix of skills difficult to find Integration of team into business Protection of IP
Bespoke underwriting system Fully owned, operated and serviced by Just Retirement Sophisticated biostatistical modelling of unrivalled proprietary data
Full automation difficult to achieve from start up due to market sophistication The “number crunching” within PrognoSysTM is bespoke
Market tracking processes consistent with IP Integrated actuarial longevity / pricing IP Rapid pricing ability
Medical and actuarial teams integrated Tracking processes refined over 9 years Pricing integrated within IRIS
Unrivalled proprietary data in the core IUA
segments
Next generation
underwriting system,
PrognoSysTM
Experienced medical team
Four critical building blocks
Ability to deliver IP to
market
Strategic asset Barrier to replication
31

JR Merica system only sees standard information in pooled format
As such, granularity of data gained through experience remains with Just Retirement
Just Retirement’s view: current underwriting process Hannover Re’s view
Underwriting process already uses PrognoSysTM and keeps data proprietary
JR Merica
Candidate specific questions
(may include GP reports) Decline
Just Retirement’s proprietary database
Level
Date of death only
Application form
250 screening questions
Standard form
IRIS pricing system
Customer quote
Customer death
PrognoSysTM overlay
Customer experience data
32

Statistic (June 2013) Total
Years of data collection 9 years
Lives assessed per month(1) 21,365
Total lives assessed to date c.1,130,000
Total number of annuity policies 124,817
Total number of lives written 192,882
Current average number of deaths per month(2) 133
Increasing experience data Key statistics
Just Retirement has the largest experience database focused on the core IUA market
1. Average of 12 months to June 2013. 2. Average of 6 months to June 2013.
Over 600,000 person-years of experience Increasing at 15,000 person-years per month
Systems
Bespoke experience analysis system allows unlimited slicing and dicing of
data
System under development to interrogate CPRD, giving Just Retirement
access to much wider pool of population medical and death data
Actuarial reserving systems capable of processing complex mortality bases
(including curves)
33
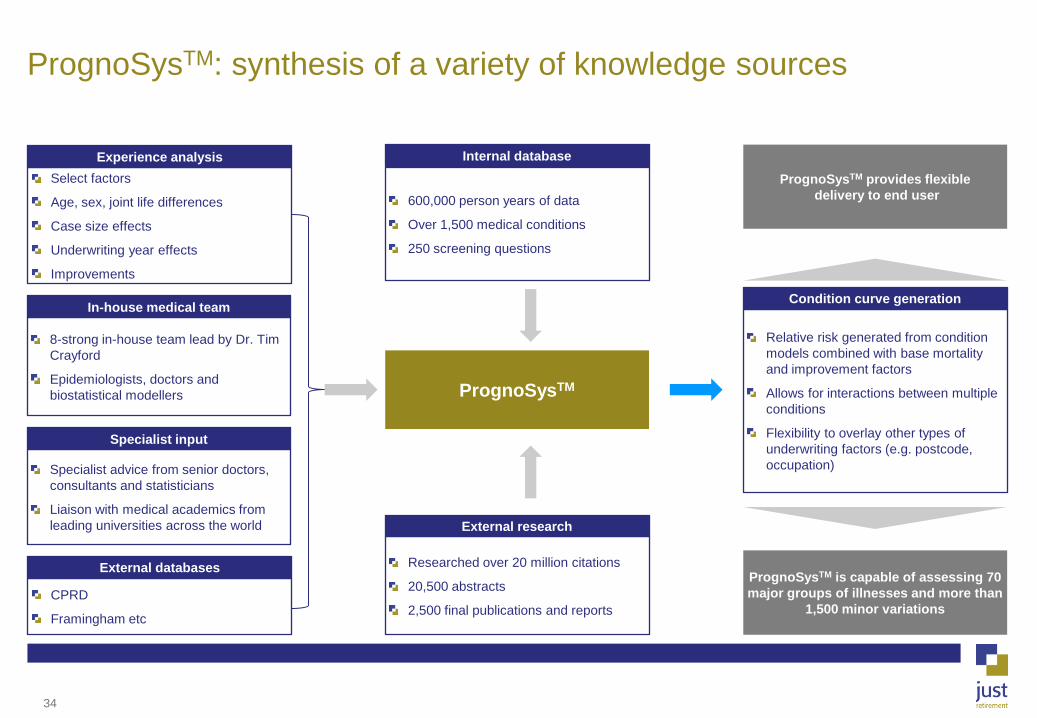
PrognoSysTM: synthesis of a variety of knowledge sources
PrognoSysTM
Internal database
600,000 person years of data
Over 1,500 medical conditions
250 screening questions
External research
Researched over 20 million citations
20,500 abstracts
2,500 final publications and reports
Specialist input
Specialist advice from senior doctors, consultants and statisticians
Liaison with medical academics from leading universities across the world
Condition curve generation
Relative risk generated from condition models combined with base mortality and improvement factors
Allows for interactions between multiple conditions
Flexibility to overlay other types of underwriting factors (e.g. postcode, occupation)
PrognoSysTM is capable of assessing 70 major groups of illnesses and more than
1,500 minor variations
Experience analysis Select factors
Age, sex, joint life differences
Case size effects
Underwriting year effects
Improvements
External databases
CPRD
Framingham etc
PrognoSysTM provides flexible delivery to end user
In-house medical team
8-strong in-house team lead by Dr. Tim Crayford
Epidemiologists, doctors and biostatistical modellers
34
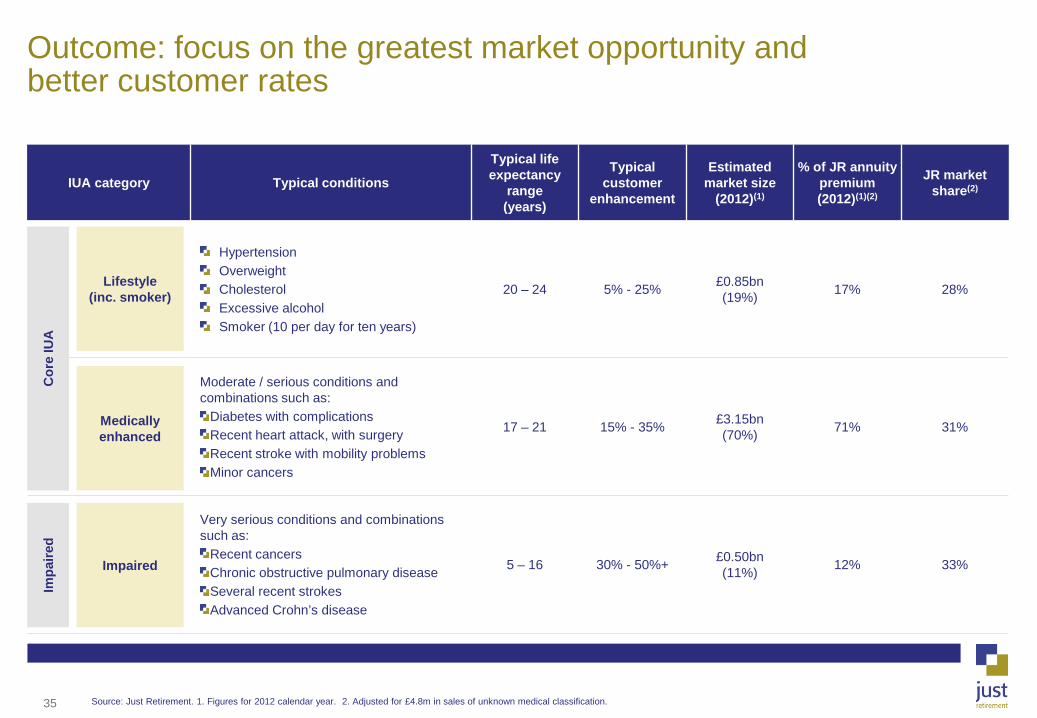
Outcome: focus on the greatest market opportunity and better customer rates
Source: Just Retirement. 1. Figures for 2012 calendar year. 2. Adjusted for £4.8m in sales of unknown medical classification.
IUA category Typical conditions
Typical life expectancy
range (years)
Typical customer
enhancement
Estimated market size
(2012)(1)
% of JR annuity premium (2012)(1)(2)
JR market share(2)
Hypertension Overweight Cholesterol Excessive alcohol Smoker (10 per day for ten years)
20 – 24 5% - 25% £0.85bn (19%) 17% 28%
Moderate / serious conditions and combinations such as:
Diabetes with complications Recent heart attack, with surgery Recent stroke with mobility problems Minor cancers
17 – 21 15% - 35% £3.15bn (70%) 71% 31%
Very serious conditions and combinations such as:
Recent cancers Chronic obstructive pulmonary disease Several recent strokes Advanced Crohn’s disease
5 – 16 30% - 50%+ £0.50bn (11%) 12% 33%
Cor
e IU
A Im
paire
d
Lifestyle (inc. smoker)
Medically enhanced
Impaired
35

Outcome: accuracy of reserving
Annuity historical mortality experience by year of death (IFRS lives basis)(1)
Change to reserving approach due to impact of
PrognoSysTM research
Just Retirement target 10% buffer over best
estimate mortality table in IFRS reserve
assumptions
Further buffers exist in the mortality improvement
assumptions
Actual vs. expected on this basis has accurately
tracked 110% in recent years and has always
been in excess of 100%
This prudent buffer is released over time
contributing to the in-force profits (along with
unwind of default provision)
It also provides a cushion for future adverse
mortality experience
Even larger buffers exist in the Pillar 1 reserve
assumptions
Prudent IFRS reserving basis
Source: Just Retirement. 1. Shown by calendar years. 2013 data for 6 months to June. 36

Peer analysis: Margin for adverse deviation – base mortality
Just Retirement’s prudent buffer for mortality is at the conservative end of peers
Source: Towers Watson / Just Retirement analysis. Peers are under Pillar 1 basis, which would be the same or weaker under IFRS basis. Excludes Just Retirement in number of respondents.
1
2
3 3
1
2% - 4% 5% 6% - 9% 10% 11% - 15%
Num
ber o
f res
pond
ents
Just Retirement IFRS basis
Just Retirement Pillar 1 basis
Prudent buffer over best estimate assumptions (Pillar 1)
37

Importance of using curves
Merica produces a simple multiple of base mortality. On a relative risk graph,
this can be shown as a horizontal line
Proper biostatistical modelling of the relative risk of medical conditions does
NOT yield horizontal lines
Interpreting historic experience data without this insight leads to the wrong
conclusion, even if the horizontal line is “right” on average
– If the curve is above the horizontal line in the early years, A / E will look
good and could lead to unjustified reserve releases
If the curve slopes down, reserves in early years have to be higher to allow
for this
Impact on reserving Condition curves
Overall mortality curves
Source: Indicative curves. Just Retirement analysis. 38

Just Retirement’s approach to reinsurance
Summary of reinsurance cover
Diversity of reinsurers
Leveraging IP, experience and strong relationships to gain commercially attractive contracts
Using reinsurer expertise to support entry into new markets
Approach to reinsurance
1. Treaty with Achmea Re now closed.
IUA business
Reinsurer Hannover Re RGA Achmea Re Total cover
Mortality risk of qualifying IUA business covered
46.2% 19.8% 19.8%(1) 66%
Investment risk 100% retained 100% retained 100% retained
Comment Exclusive access to JR Merica
Replaced Achmea Re cover
Withdrew from UK longevity reinsurance
DB scheme de-risking Care annuities
Reinsurer RGA General Re
% reserves reinsured (mortality only)
Up to 55% Up to 90%
Comment Structured on a swap basis Provides significant risk transfer for this new market opportunity
Benefits of reinsurance
De-risks annuity portfolio through the transfer of the majority (66%) of longevity risk of qualifying IUA business
Flexibility to re-capture if mortality is higher than expected: one way option for Just Retirement
Facilitates strong and sustainable growth with minimal cash and capital strain
Enhances returns through the retention of investment risk
39

Questions?
Coffee break

Agenda
1. Introduction to Just Retirement Rodney Cook
2. Market potential and a scalable operating model David Cooper
3. Unrivalled proprietary IP Shayne Deighton
Coffee Break
4. Demonstration of PrognoSysTM Dr. Tim Crayford
5. A robust financial model and strong track record Simon Thomas
6. Conclusion and outlook Rodney Cook
Drinks
41

Medical IP development team
Epidemiologist Statistician Underwriter
Medical Director
Post-doctoral Health researchers I.T. External consultants
6 people 5 people 12 people
Mathematics, biostatistics, pure statistics, actuarial
mathematics
Medical / epidemiological backgrounds
6 x I.T. developers 6 x system testers
Professors, readers, assistant professors
6 people
42

Our experience and data sets us apart
1. Selected companies shown just as examples
Every IUA provider receives the same input data from the industry standard common quotation form The difference is we have: – Entered it; – Stored it; and – Analysed it
600,000 person-years of data from the core IUA market – more than any other provider Framingham Heart Study 1948
Growing at over 15,000 person-years every month
High blood pressure, high cholesterol
Smoking
Heart conditions – angina, bypass surgery
Diabetes
Strokes
Cancer, leukaemia, lymphoma, growths, tumours
Respiratory, lung disease
Multiple sclerosis
Neurological conditions
Common Quotation Form (CQF)(1)
43

Amplifying the value of the raw data
1. Gold stands for Global Initiative on Obstructive Lung Disease.
Discontinuous
20 million citations
20,000+ abstracts screened
2,500+ publications and reports reviewed and used
Data carefully transcribed
Additional, unpublished data obtained from authors
COPD = Chronic Obstructive Pulmonary Disease
– Gold(1) Stage I
– Gold (1) Stage II
– Gold (1) Stage III
– Gold (1) Stage IV
Continuous functions
44

Level 0 +25%
Level 1 +25%
Level 2 +20%
Level 3 +27%
Level 4 +26%
Level 5 +42%
Level 6 +10%
Level 7 +35%
Level 8 +31%
PrognoSysTM: the shape of a life
PrognosysTM: continuum of risk assessment
Underwriting levels
Standard systems - STATIC
Roots in general insurance
Categorise annuitants into discontinuous levels
Traditional systems: divided into levels
45
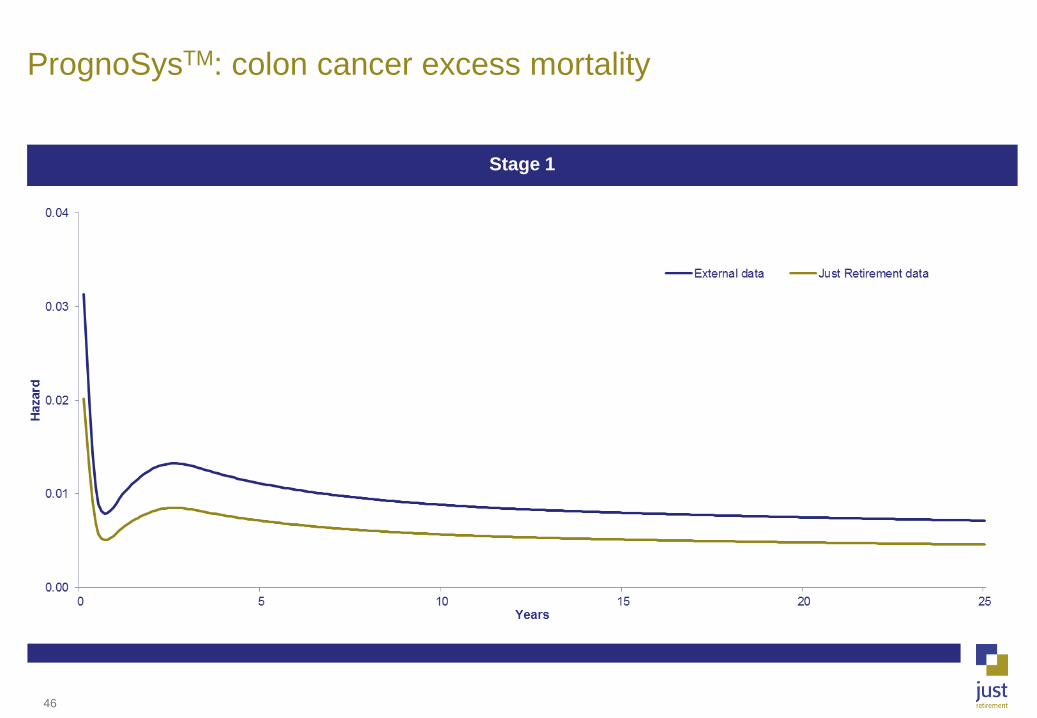
PrognoSysTM: colon cancer excess mortality
Stage 1
46

Stage 1 Stage 2
Stage 3 Stage 4
PrognoSysTM: colon cancer excess mortality
47

Demonstration of PrognoSysTM
PrognoSysTM
48

Agenda
1. Introduction to Just Retirement Rodney Cook
2. Market potential and a scalable operating model David Cooper
3. Unrivalled proprietary IP Shayne Deighton
Coffee Break
4. Demonstration of PrognoSysTM Dr. Tim Crayford
5. A robust financial model and strong track record Simon Thomas
6. Conclusion and outlook Rodney Cook
Drinks
49
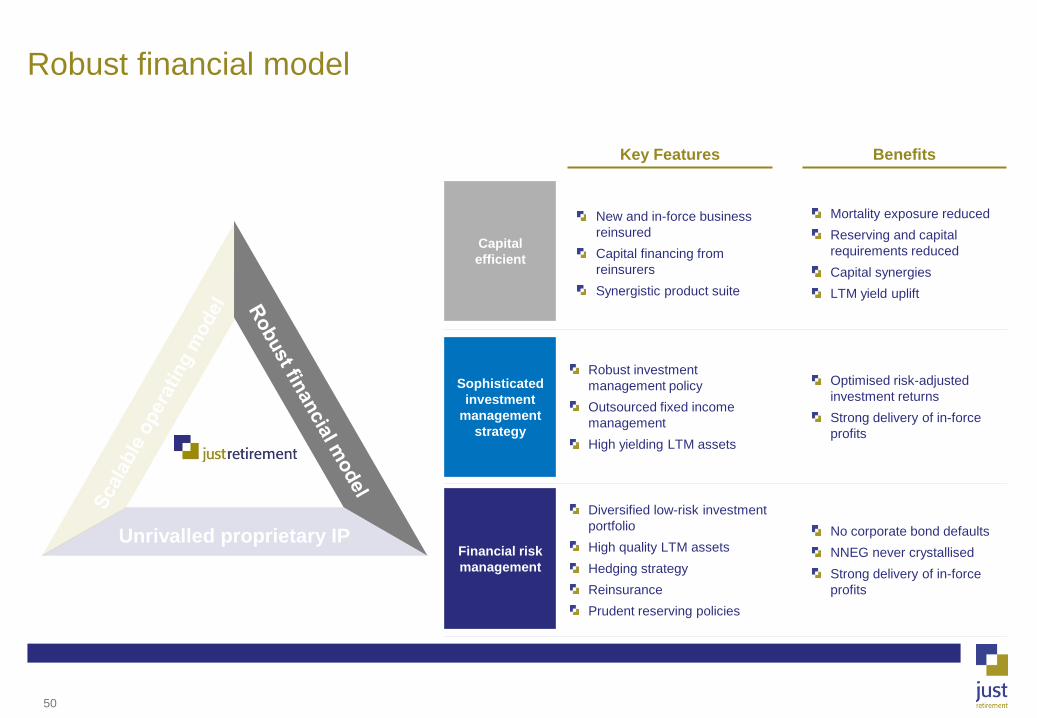
Robust financial model
Unrivalled proprietary IP
New and in-force business reinsured Capital financing from reinsurers Synergistic product suite
Mortality exposure reduced Reserving and capital requirements reduced Capital synergies LTM yield uplift
Robust investment management policy Outsourced fixed income management High yielding LTM assets
Optimised risk-adjusted investment returns Strong delivery of in-force profits
Diversified low-risk investment portfolio High quality LTM assets Hedging strategy Reinsurance Prudent reserving policies
No corporate bond defaults NNEG never crystallised Strong delivery of in-force profits
Key Features Benefits
Capital efficient
Sophisticated investment
management strategy
Financial risk management
50
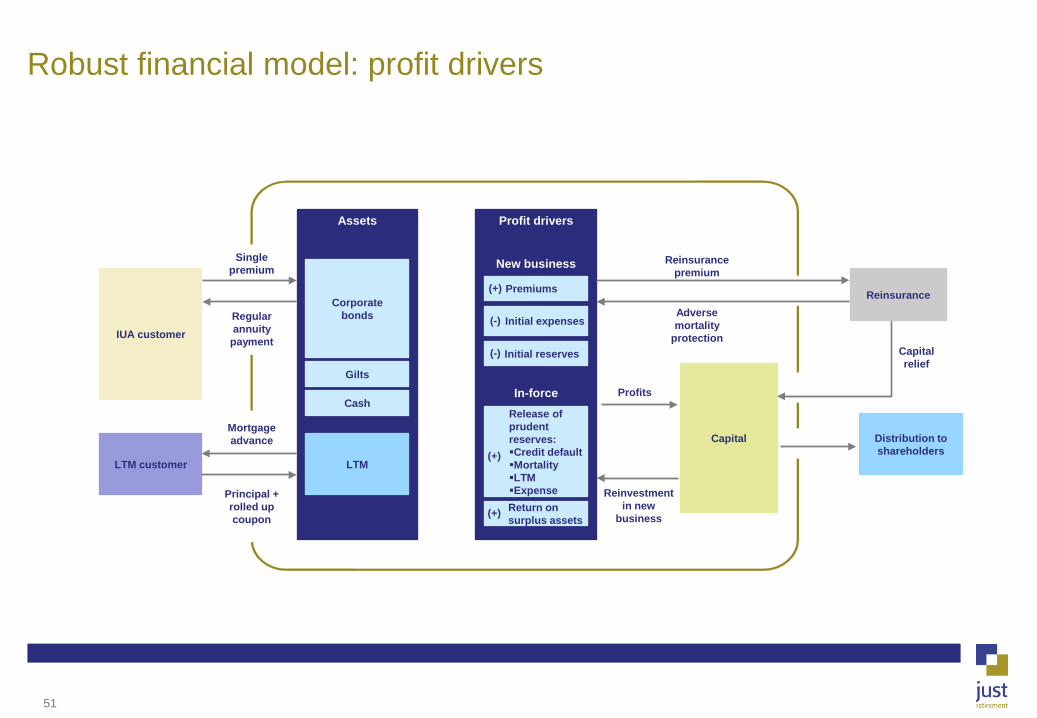
Robust financial model: profit drivers
Assets
Corporate bonds
Gilts
Cash
IUA customer
LTM customer
Profit drivers
New business
In-force
(+)
Regular annuity
payment
Single premium
Mortgage advance
Principal + rolled up coupon
Capital relief
Reinsurance premium
Adverse mortality
protection
1 LTM
Capital
Reinsurance Premiums
Initial expenses
Initial reserves
Release of prudent reserves: Credit default Mortality LTM Expense Return on surplus assets
Profits
Reinvestment in new
business
Distribution to shareholders (+)
(+)
(-)
(-)
(+)
51

Total investment portfolio by asset class
No defaults on any of corporate bonds
No exposure to Euro sovereign bonds, No equities, RMBS or CDOs and no direct exposure to Ireland, Greece, Portugal or Cyprus
– Exposure to Italy and Spain constitutes only 2.1% of total bond portfolio
– 0.3% of total investment portfolio rated below BBB-
Asset / liability matching directed by Just Retirement
“Buy and Maintain” strategy:
– Majority of bonds are held-to-maturity in order to capture illiquidity spread
– Target percentages by credit grade leads to an average spread of approximately A grade
Regular review of the market and investment performance with Blackrock and Robeco on a weekly basis
Fixed income portfolio by asset quality(1) LTM Breakdown by LTV(1)(4)
Robust investment policy
Source: Just Retirement accounts. 1. As at 30 June 2013. 2. Includes BBB+ and below as well as £37.1m of derivative assets. 3. Includes rolled-up interest. 4. Based on total outstanding (original advance plus accrued interest to date). 5. For financial year 2012 / 13.
311 corporate bonds held across 133 counterparties Total size: £6,037m(1)
(2)
Fixed income bond portfolio of which c.68% A or above
(3)
30 64 111 156 257
26%
Average LTV at commencement: 18%
Average loan size: £39K(5) vs. average property value: £227K(5)
Out of 31K mortgages, only 5 have an LTV over 75%
NNEG never been triggered
98% of loans sourced from individuals
Robust financial model
52

Consistently applied methodology
No defaults experienced to date
Default provision
– Pillar 1: 81 bps
– Economic capital: 81 bps
Equivalent to a 45% spread over swaps
NNEG never been triggered
Pillar 1: NNEG provision represents 8% of total portfolio
Economic capital allows for:
– 2.5% NNEG provision; and
– An immediate and permanent fall of 37% in property values in stress test
Investment portfolio conservatively provided for
1. Based on gross LTM portfolio under Pillar 1 basis.
Fixed income portfolio
(30 June 2013)
LTM portfolio 30 June 2013
Default provision (Pillar 1) £221m
Default provision as % of portfolio 5.9%
NNEG provision (Pillar 1) £213m
NNEG provision as % of portfolio(1) 7.9%
53
Higher net yield than gilts / corporate bonds even after NNEG(1)
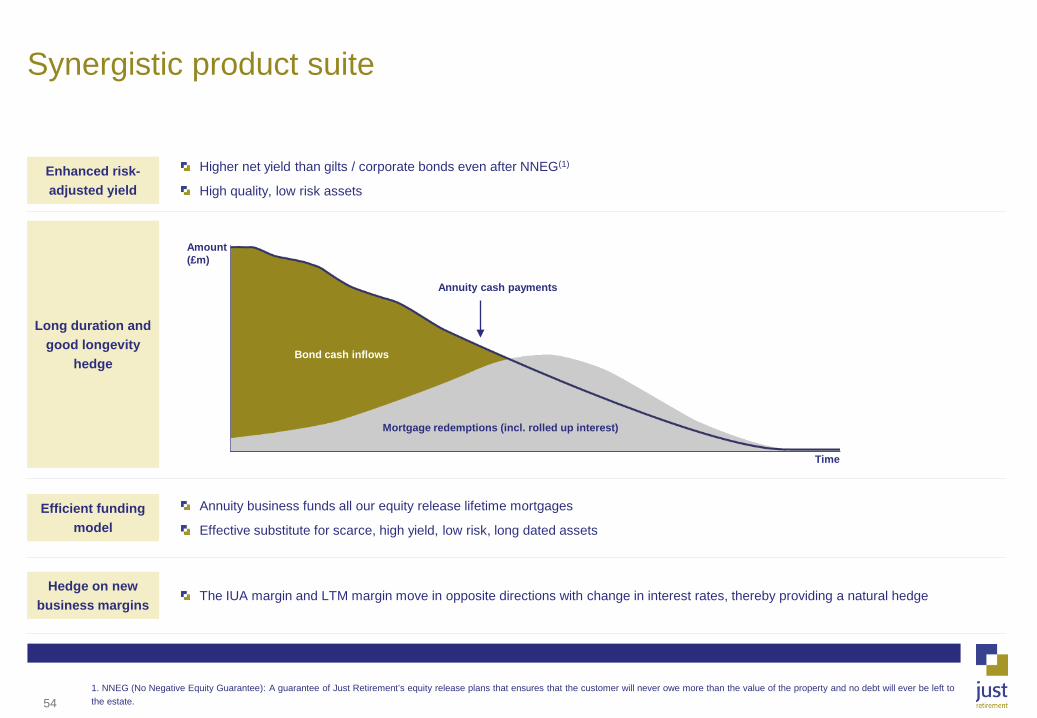
High quality, low risk assets
Annuity business funds all our equity release lifetime mortgages
Effective substitute for scarce, high yield, low risk, long dated assets
The IUA margin and LTM margin move in opposite directions with change in interest rates, thereby providing a natural hedge
Synergistic product suite
1. NNEG (No Negative Equity Guarantee): A guarantee of Just Retirement’s equity release plans that ensures that the customer will never owe more than the value of the property and no debt will ever be left to the estate.
Amount (£m)
Bond cash inflows
Mortgage redemptions (incl. rolled up interest)
Annuity cash payments
Time
Efficient funding model
Enhanced risk-adjusted yield
Hedge on new business margins
Long duration and good longevity
hedge
54

Summary IFRS results
IFRS operating profit (£m, FY) 2011 2012 2013
IFRS new business operating profit(1) 50 55 59
IFRS in-force operating profit 26 33 41
IFRS underlying operating profit 76 88 100
Operating variances and assumption changes (1) 11 (12)
Reinsurance and bank finance costs (8) (8) (9)
IFRS operating profit 67 90 79
Non-recurring and project expenditure (5) (7) (7)
Investment and economic profits/(losses) (25) (21) 49
Profit before tax (Group) 37 62 121
Finance and other costs incurred by HoldCo(2) (35) (37) (43)
Profit before tax (HoldCo) 3 25 78
Source: Just Retirement. Note: FY represents Just Retirement’s Financial Year to 30 June. Some differences may appear due to rounding. 1. Normalised new business operating profit for the year ended 30 June 2011 shown (excludes exceptional profit of £14m). 2. No longer incurred following reorganisation of the Group structure at IPO. 55

Summary of key performance indicators
(£m, FY) 2011 2012 2013 CAGR 11 – 13
Total annuity premiums 893 1,195 1,344 23%
LTM advances 242 270 310 13%
Total new business sales 1,135 1,465 1,654 21%
IFRS new business operating profit 50(1) 55 59 9%(2)
IFRS in-force operating profit 26 33 41 26%
IFRS underlying operating profit 76 88 100 15%
Group embedded value 344 365 504(3) 16%(4)
Source: Just Retirement. Note: FY represents Just Retirement’s Financial Year to 30 June. 1. Normalised new business operating profit for the year ended 30 June 2011 shown (excludes exceptional profit of £14m). 2. Normalised CAGR over 2011 – 13. 3. Excluding IPO proceeds 4. CAGR excludes £40m of capital injected over 2011-13.
1a
1b
2
3
4
5
KPIs
56
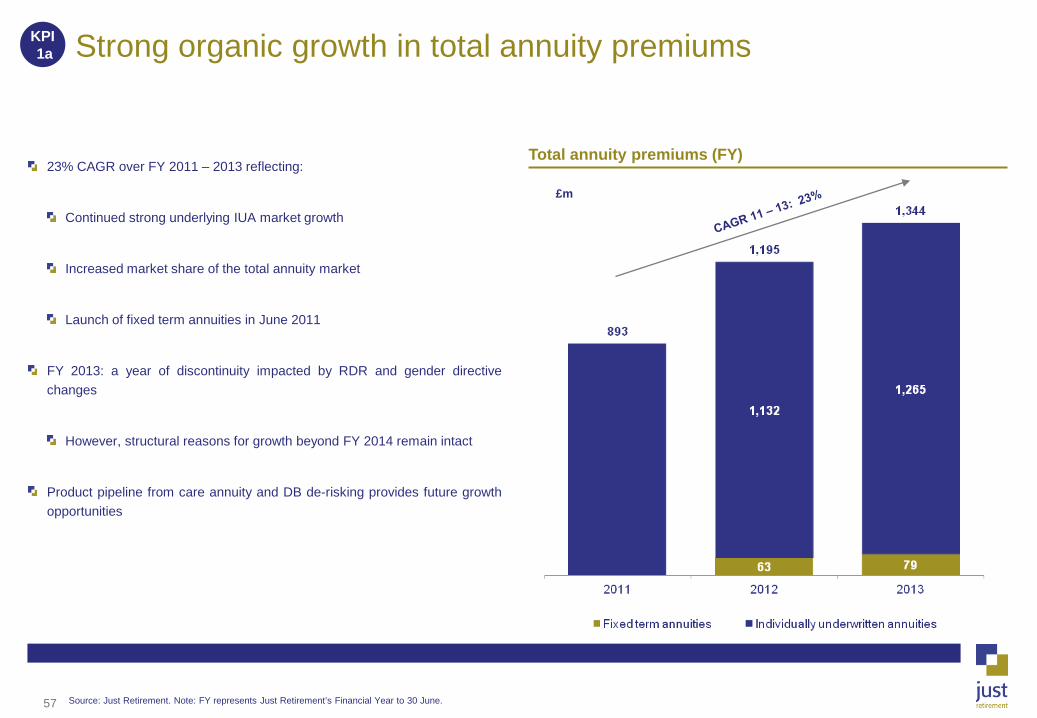
23% CAGR over FY 2011 – 2013 reflecting:
Continued strong underlying IUA market growth
Increased market share of the total annuity market
Launch of fixed term annuities in June 2011
FY 2013: a year of discontinuity impacted by RDR and gender directive changes
However, structural reasons for growth beyond FY 2014 remain intact
Product pipeline from care annuity and DB de-risking provides future growth opportunities
Strong organic growth in total annuity premiums
Total annuity premiums (FY)
Source: Just Retirement. Note: FY represents Just Retirement’s Financial Year to 30 June.
KPI 1a
£m
57

651 775 800 790 949 1,044 1,171 1,321 982 915 984
2,008 2,004
2,204 1,948
2,145 2,328
2,493 2,565
2,241 2,160 1938
2,659 2,778
3,004
2,739
3,094
3,371
3,664
3,887
3,223 3,075
2,922
Q1 Q2 Q3 Q4 Q1 Q2 Q3 Q4 Q1 Q2 Q3
1,034
1,476
Just Retirement’s annuity premium sales in context of the market
Source: Just Retirement. Note: CY represents Calendar Year to 31 December. Some differences may appear due to rounding. 1. Includes sales of individually underwritten annuities and fixed term annuities.
£m
CY 2012 CY 2011
Total annuity premiums
Just Retirement – total annuity premiums(1) (CY)
11,180
14,016 £m
CY 2012 CY 2011
Market – total annuity premiums (CY)
IUA
3,016
4,485
KPI 1a
IUA
Total annuity premiums
Standard annuities
CY 2013 CY 2013
58

Market forecasts: regulatory changes distort short-term progression but growth trend beyond FY 2014 remains intact
Market forecasts (FY)
Source: ABI, Management estimates. Note: FY represents Just Retirement’s Financial Year to 30 June.
KPI 1a
IUA Standard annuities
£bn
59

34 44 55
208 226
255
242
270
310
0
50
100
150
200
250
300
350
2011 2012 2013 Further advances New sales
14%
Consistent growth in LTM advances
Target LTM advances to represent around 25% of Just Retirement’s total new business sales
13% CAGR over FY 2011 – 2013 reflecting:
Growth in the LTM market
Just Retirement’s desire to achieve appropriate business mix
In FY 2011, we experienced unusually strong demand for LTM at very attractive margins
Normalising FY 2011 LTM advances to 25% of total annuity premiums would imply 18% CAGR over FY 2011 – 2013
Growing proportion of total advances met by further drawdowns on existing LTM advances provides highly predictable underpin to volumes
LTM advances (FY)
As % of total IUA
premiums 27% 24% 25%
16% 18%
Source: Just Retirement. SHIP/ERC (Data supplied to SHIP/ERC excludes sales through More2LIfe except for 2013). Note: FY represents Just Retirement’s Financial Year to 30 June
KPI 1b
£m
60

IFRS new business operating profit
9%(1) CAGR over FY 2011 – 2013 as a result of significant growth in
new business volumes
Margins and pricing continuously monitored to take into account interest
rates, bond spreads, competition, pricing movements and demand
FY 2011 normalised to remove impact of unusually high volume of LTM
advances and margin
LTM advances normalised to 25% of total annuity premiums
New business operating profit (FY)
Margin (%, FY)
893 1,132 1,265 New IUA business (£m)(2)
Source: Just Retirement. Note: FY represents Just Retirement’s Financial Year to 30 June. 1. Normalised CAGR. 2. Excludes FTA products. 3. Normalised new business operating profit for the year ended 30 June 2011 shown (excludes exceptional profit of £14m).
£m
(3)
(3)
KPI 2
61

Prudent recognition of IFRS new business operating margin
Source: Just Retirement. Note: FY represents Just Retirement’s Financial Year to 30 June. 1. IFRS new business operating profit divided by new IUA business (excluding fixed term annuities).
KPI 2
FY 2013 IFRS new business operating margin (pre tax)(1)
Prudence which will be released into in-force profit in later
years
4.7%
8.6% 13.3%
IFRS new business operating margin
Prudent reserves for mortality, credit defaults and LTM (NNEG, early redemptions)
Discounted "best estimate" IFRS new business operating margin
62

Significant and growing contribution from IFRS in-force operating profit
26% CAGR over FY 2011 – 2013 driven primarily by release of prudent reserves above best estimates
IFRS in-force operating profit is a function of:
Corporate bond spread income
Mortality margin income
Emergence of prudent margins on LTM
Expense
Expected return on surplus assets
Large and growing in-force book creates a high quality and predictable earnings stream which will increase over time
Reduced dependency on new business earnings
Relatively stable margin on gross reserves over FY 2011 – 2013
Typically 90-100bp of gross reserves
Margins in FY 2013 impacted by tightening of bond spreads
IFRS in-force operating profit (FY)
Gross reserves (FY)
104 bps 101 bps 89 bps Margin(1)
Source: Just Retirement. Note: FY represents Just Retirement’s Financial Year to 30 June. 1. As percentage of opening gross reserves (pre tax basis).
£m
£m
KPI 3
63

High quality and predictable IFRS underlying operating profit
IFRS underlying operating
profit
Source: Just Retirement. Note: FY represents Just Retirement’s Financial Year to 30 June.
Underlying operating profit (£m, FY)
IFRS new business operating profit IFRS in-force operating profit
KPI 4
66% 62% 59%
34%
38% 41%
0
25
50
75
100
2011 2012 2013
As
% o
f und
erly
ing
oper
atin
g pr
ofit
64

Source: Just Retirement. Note: FY represents Just Retirement’s Financial Year to 30 June.
Movement in embedded value at Group level
£m
Strong new business contribution driven by higher sales of both annuities and LTM products
Increase in return on opening embedded value in FY 2013, as a result of growth in the size of the overall book and achievement of spreads
Operating variances and assumption changes primarily due to strengthening of the mortality assumptions, reflecting insights gained from Phase I of PrognoSys™
Positive economic variance resulting mainly from tightening of credit spreads
Conservative approach to liquidity premium
EEV (30 June 2013) Liquidity premium Implied default
rate
£504m 77bps 104bps
£590m 131bps 50bps
Movement in embedded value in FY 2013 (post tax, pre IPO proceeds)
KPI 5
EEV sensitivity
65

Pillar 1 capital and coverage ratio(1) – Just Retirement Limited Economic Capital position and coverage ratio(2) - Just Retirement Group Plc
Capital ratios
(£m) June 2013
Pro Forma
Total capital available 586
Capital required 241
Excess surplus 345
Pillar 1 coverage ratio 243%
Source: Just Retirement. 1. At Just Retirement Limited level. 2. At Group level.
(£m) June 2013
Pro Forma
Total capital available 858
Capital required 467
Excess surplus 391
Economic Capital coverage ratio 184%
66

A progressive dividend policy having regard to:
The future underlying earnings of the Group
Its ongoing capital requirements
Dividend payments to be made on a 1/3 : 2/3 split for interim and final dividends respectively
Dividend payments to start with a dividend in respect of the six months to 30 June 2014, representing a full final dividend for the year to 30 June 2014, payable in the second half of calendar year 2014
If the company had been listed during the full year to 30 June 2013 (having benefited from the net proceeds of the Offer from 1 July 2012) the Directors would have declared a dividend of £15m for the full year
Initial dividend payment of the year to 30 June 2014 expected to be set at a level consistent with the Group's strategy of reinvestment in new business growth
Progressive dividend policy expected
Source: Just Retirement. 67

Agenda
1. Introduction to Just Retirement Rodney Cook
2. Market potential and a scalable operating model David Cooper
3. Unrivalled proprietary IP Shayne Deighton
Coffee Break
4. Demonstration of PrognoSysTM Dr. Tim Crayford
5. A robust financial model and strong track record Simon Thomas
6. Conclusion and outlook Rodney Cook
Drinks
68

Just Retirement – total annuity premiums(1) (CY)
Further detail on Just Retirement’s annuity premium sales
Source: Just Retirement. Note: CY represents Calendar Year to 31 December. 1. Includes sales of individually underwritten annuities and fixed term annuities. 2. CAGR calculated on a y-o-y basis.
CY 2009 CY 2010 CY 2011 CY 2012 CY 2013
69

New business sales
Proven track record of strong organic growth with a 23%
CAGR over FY 2011 – 2013
Strong organic growth of LTM advances (13% CAGR over FY
2011 – 2013)
Successful launch of FTAs, long-term care and DB de-risking
in FY 2011 – 2013
Market disruption in 2013 will impact the growth rate in the FY
2014
Growth beyond FY 2014 driven by long term growth in the IUA
market
New products will provide incremental growth opportunity
New business operating profit Recent margins at around 4.7% Seek to maintain margins through the pricing of new business
In-force operating profit
Relatively stable margin over 2011 – 2013, between 89bps and
104bps of gross reserves
Expectations in line with historical levels, dependent upon
credit spread
Embedded value 16%(1) CAGR over FY 2011 – 2013 Value creation in the business drives further growth
Historical trends
Outlook
Source: Just Retirement. Note: FY represents Just Retirement’s Financial Year to 30 June. 1. Excluding IPO proceeds; CAGR excludes £40m of capital injected over 2011-13.
Outlook
70

Just Retirement’s investment case
Leading positions in attractive structural high growth markets
1
Differentiated business model providing significant competitive advantage
2
Proven track record of strong profitable growth
4
Significant competitive advantage
Unrivalled proprietary IP
Strong brand with social purpose 3
71

Questions?

Agenda
1. Introduction to Just Retirement Rodney Cook
2. Market potential and a scalable operating model David Cooper
3. Unrivalled proprietary IP Shayne Deighton
Coffee Break
4. Demonstration of PrognoSysTM Dr. Tim Crayford
5. A robust financial model and strong track record Simon Thomas
6. Conclusion and outlook Rodney Cook
Drinks
73

Appendix

Strong, experienced management team
* Executive Board Director ** Founding Directors
Name Title
Year joined
Relevant industry experience
Previous employers
2010
34 years
LV=, AMP, Pearl, Zurich, Prudential
Rodney Cook* CEO
Simon Thomas* Group Finance
Director
2006
23 years
Canada Life Nationwide Price Waterhouse
Shayne Deighton* Group Chief Actuary
2008
32 years
Aviva Zurich Financial Services Ernst & Young Tillinghast
Alex Duncan Chief Risk Officer
2012
24 years
Old Mutual Swiss Re KPMG
David Cooper Group Distribution and
Marketing Director
2006
29 years
GE Capital Centrica Bradford and Bingley
Steve Kyle** Group Regulatory & Audit Director
2004
33 years
Commercial Union Aviva Britannic Group
Chris Berryman** Group Operations
Director
2004
22 years
NPI GE Capital Britannic Group
Anne Ridge Group HR Director
2010
25 years
Marks & Spencer BP Britannic Group
Dr. Tim Crayford Medical Director
2011
15 years
Department of Transport Croydon Primary Care NHS Trust
75

Typically offered to people at retirement but can be taken from age 55
Premium is large up-front payment (funded from annuitant’s accumulated
pension fund)
Insurer provides a series of guaranteed regular payments until death
Individually Underwritten Annuities (“IUAs”)
– Enhanced annuities: medical and / or lifestyle factors (e.g. smoking)
which may lead to shortened life expectancy, and;
– Impaired annuities: significant medical conditions that impair life
expectancy (e.g. heart attacks or cancer)
Care annuities: guaranteed income to pay residential care home fees
(tax free if paid to care home)
Allow home owners to release cash from home ownership
Lifetime mortgages, where cash advanced is secured against the equity
in the property
– Roll Up: the original advance and any subsequent advances are rolled
up at a fixed rate of interest. The loan is payable on death or upon
vacation of the property into nursing care
– Individually Underwritten LTM: provide customers with the
opportunity to achieve a higher loan value compared to a standard roll-
up LTM
– Interest Choice: similar to roll up, except customers can choose to pay
part of the interest in cash per month and over what term
Both roll up and interest choice products are available as lump sum and
draw down variants
Annuities Lifetime mortgages
What are annuities and lifetime mortgages?
76

Annual wealth flowing into the at-or-in retirement market is growing Large market opportunity
Assets held by people at-or-in retirement are over £1.2tn and growing fast
Source: Watson Wyatt study (Strategic Planning for the At-Retirement Market), ABI, Just Retirement analysis, HMRC. 1. Net non-pension assets held by people aged 65 and over (latest data available: 2008-2010). 2. Management estimate.
A
CAGR 2009–12
11%
6%
16%
10%
Annuities: £14.0bn
Income Drawdown: £1.2bn Tax free cash(2): £5.1bn
Converted into:
Total assets held by people aged 65+: £1.2tn(1) Annual inflow in retirement income by type
Securities and insurance policies
£177bn
Focus areas
77

Government support for private savings (e.g. auto-enrolment and NEST) – Just Retirement is one of only five providers on NEST’s annuity panel
State pension entitlement as % of pre-retirement earnings (Male) Shift in private pension provisions from DB to DC schemes
Fundamental shifts in pension provisions driving growth of retirement income market
Source: Towers Watson, OECD pensions statistics, management estimates.
CAGR
2005–10 2010–15e
6% 4%
4% 1%
11% 7%
A
Total OECD average: 68.8
78

Within the IUA segment, medically enhanced and lifestyle offer greater scope for growth
Source: Management estimates.
B
Core IUA:
As more conditions are underwritten, we expect the medically enhanced and lifestyle segments to grow faster than the smaller impaired segment
– At present, 60% of annuitants are eligible for some form of enhancement, although only 21% of annuitants currently take up an individually underwritten annuity
Increasing life expectancy results in increased number of people with medical conditions who take out annuity later in life
2012 total IUA market: £4.50bn
Impaired annuity segment has existed for a long time; awareness of impaired annuities already exists among intermediaries
79

Just Retirement is the market leader in the IUA segment
Source: ABI. 1. Market share excludes fixed term annuities.
B
Just Retirement is the largest provider of individually underwritten annuities (2012)
Market share evolution
Total annuities Individually underwritten annuities OMO new business
3rd 2nd 1st
c. £8.5bn c. £14.0bn c. £4.5bn Total market size:
Total market(1) OMO market
(1)
80

Potential market evolution plays to Just Retirement’s strengths as a specialist IUA writer
Source: Management estimates.
B
Low
High
% O
pen
Mar
ket (
OM
O)
High % Individually underwritten
Unhealthy lives subsidise healthy IUA expected to expand to whole market over time
£4.1bn £4.3bn
£5.4bn £0.2bn
Under threat due to regulatory pressure
Outsource opportunities for IUA provider
Captive – standard annuities
OMO – standard annuities OMO – individually underwritten annuities
Captive – individually underwritten annuities
2012 market size £14.0bn Positive segment outlook (proportion of total market) Negative segment outlook (proportion of total market)
81

Key success factors Just Retirement
Standard annuity writers do not have the capabilities to capture material market share in the IUA market
B
Established market position
IP-led automated underwriting expertise
Trusted IUA brand amongst key distributors
Strong distribution relationships
Unrivalled proprietary IP
Share of IUA
market
82

Addressable market potential for lifetime mortgages is material and increasing
Potential equity available for release of c. £300bn The majority of over-65s
own their property
Source: General lifestyle survey, ONS, PPI and Just Retirement analysis.
C
Assuming LTV of 30%
75% in private ownership
83

Just Retirement is a leader in the LTM market
Source: Equity Release Council. 1. Data based on calendar year. 2. New sales including subsequent drawdowns.
Just Retirement is the 2nd largest lifetime mortgage provider (2012)
Market share evolution
Drawdown LTM(1) All LTM
C
(2)
Overall LTM Drawdown LTM
1st 2nd
84

Broadly based sales via intermediaries (Q2 2013) Growing share of key intermediary networks
Growing market share in leading intermediary networks
Source: Touchstone. 1. Includes St James’s Place as a newcomer. 2. Just Retirement’s top 10 networks.
(2)
(1)
85
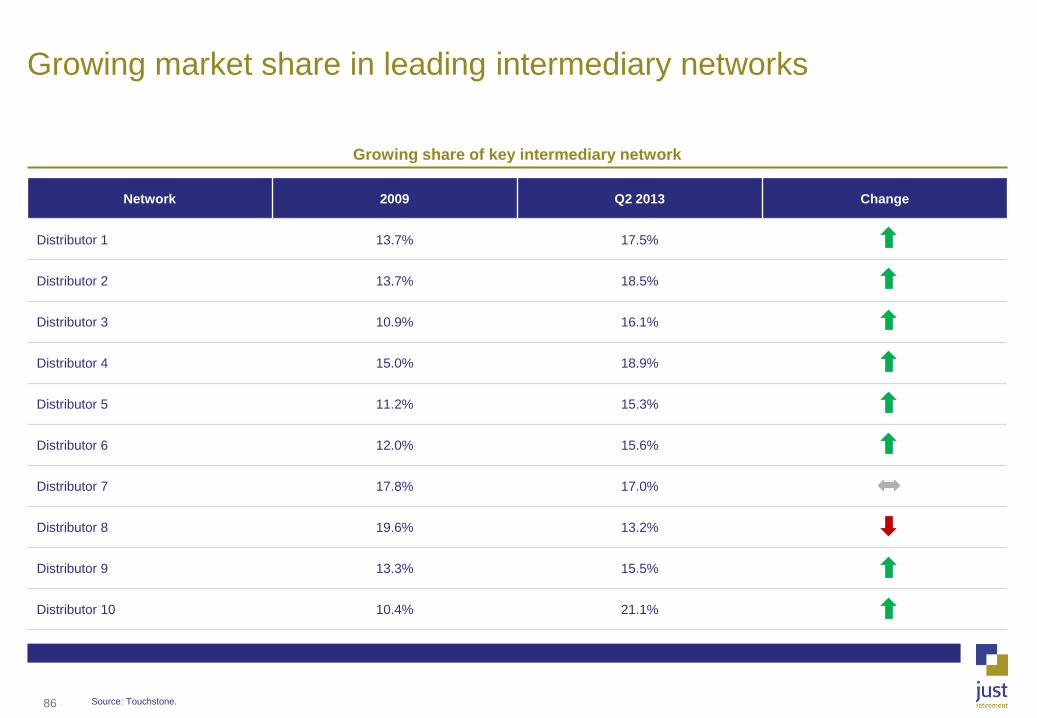
Network 2009 Q2 2013 Change
Distributor 1 13.7% 17.5%
Distributor 2 13.7% 18.5%
Distributor 3 10.9% 16.1%
Distributor 4 15.0% 18.9%
Distributor 5 11.2% 15.3%
Distributor 6 12.0% 15.6%
Distributor 7 17.8% 17.0%
Distributor 8 19.6% 13.2%
Distributor 9 13.3% 15.5%
Distributor 10 10.4% 21.1%
Growing share of key intermediary network
Growing market share in leading intermediary networks
Source: Touchstone. 86

The Open Market Annuity Service (“TOMAS”) was acquired in
November 2010
Provides bespoke and standard software and telephone support services
enabling its B2B customers to deliver innovative whole-of-market annuity
broking services
Supports Group distribution strategy
Majority-owned but managed as an independent business
In 12 months ending August 2013, over £500m of new annuity sales (more
than 6% of the intermediated market) were brokered by TOMAS
– Provides annuity purchasing solutions for 11 of the FTSE 100 pension
schemes
– 35% of volume of the top 20 financial intermediary brokers of annuities is
via firms that use TOMAS service and software solutions
TOMAS capabilities are extendable to additional markets
TOMAS overview Key clients
TOMAS keeps the annuity market open and transparent
EBC
Banking
Intermediaries
Direct to corporate
87

PrognoSysTM – exhaustive global research
88
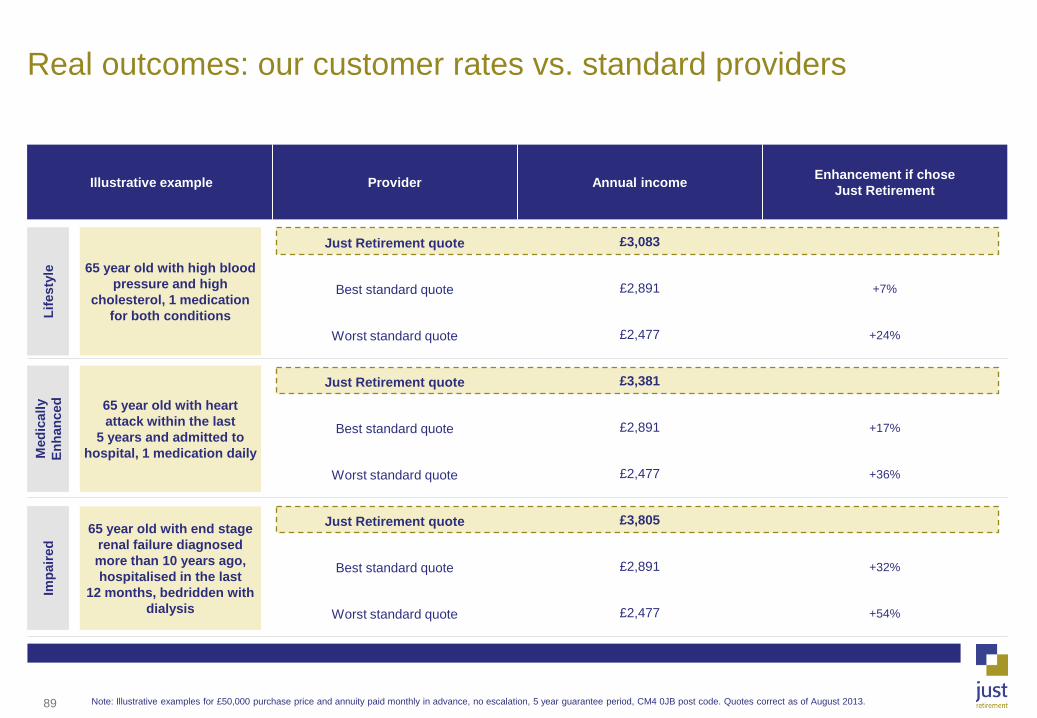
Illustrative example Provider Annual income Enhancement if chose Just Retirement
Just Retirement quote £3,083
Best standard quote £2,891 +7%
Worst standard quote £2,477 +24%
Just Retirement quote £3,381
Best standard quote £2,891 +17%
Worst standard quote £2,477 +36%
Just Retirement quote £3,805
Best standard quote £2,891 +32%
Worst standard quote £2,477 +54%
Real outcomes: our customer rates vs. standard providers
Note: Illustrative examples for £50,000 purchase price and annuity paid monthly in advance, no escalation, 5 year guarantee period, CM4 0JB post code. Quotes correct as of August 2013.
65 year old with high blood pressure and high
cholesterol, 1 medication for both conditions
65 year old with heart attack within the last
5 years and admitted to hospital, 1 medication daily
65 year old with end stage renal failure diagnosed more than 10 years ago, hospitalised in the last
12 months, bedridden with dialysis
Med
ical
ly
Enha
nced
Li
fest
yle
Impa
ired
89

Fixed income portfolio is lower risk than iBoxx
Bond portfolio split by geography(1)
Bond portfolio split by sector(1)
Lower risk than iBoxx
1. As at 30 June 2013.
High risk
Low risk
Total iBoxx
Total JRL
JR: 6.5 years average duration iBoxx: 8.0 years average duration
Shorter bond portfolio duration
Low investment in risky areas
98% of the portfolio is in Sterling denominated bonds
90

We source almost all of our LTM business directly from customers, retaining greater control over asset quality & flow
Just Retirement clients are typically not owners of properties hardest hit by the recessionary decline in the property market (i.e. inner city new build flats)
Just Retirement’s lending criteria are very robust, resulting in the maintenance of a strong portfolio of good quality properties:
– Each property is inspected by an independent valuer from an established panel made up of the UK’s major firms (including Countrywide and Connells)
– Valuation reports are reviewed and underwritten by internal Property team, who have extensive experience in the property and LTM market and are able to maintain rigorous objectivity
– Any property issues (such as structural concerns) must be investigated and resolved prior to agreeing any advance
– A check is made to ensure that the applicant maintains buildings insurance throughout the life of the mortgage
– Title insurance is maintained by Just Retirement to protect against losses arising from problems with the ownership of the property
Specific limits on lending (age dependent)
Rigorous sales process ensures we have strong understanding of risks Source of LTM (2010 – 2012)
Limits
Maximum loan £1.5 million
Maximum initial LTV range 20% – 52%
91

LTM portfolio is low risk – LTV of 26%
Just Retirement has been active in the LTM market since 2005
Average age of customer: 71 years at commencement, 73 years now(1)
– Expected life expectancy on current book: 18 years
Average LTV at commencement very prudent at 18%
Even with mortgage interest, current average LTV still only 26%
Very low collateral risk – average UK house price growth (y-o-y) over successive 18 year periods has not been below 5% in over 40 years
Just Retirement has not had a mortgage case that has crystallised a NNEG
Out of 31,323 mortgages, only 5 have an LTV over 75%
Average loan size(2): £39,602
Average property value(2): £227,549
Key statistics Historic UK house price growth
LTM & LTV breakdown by geography(3)
Source: Just Retirement, Nationwide House Survey. 1. As at 30 June 2013. 2. For financial year 2012 / 13. 3. As at 30 June 2013. Based on total outstanding (original advance plus accrued interest to date). 92
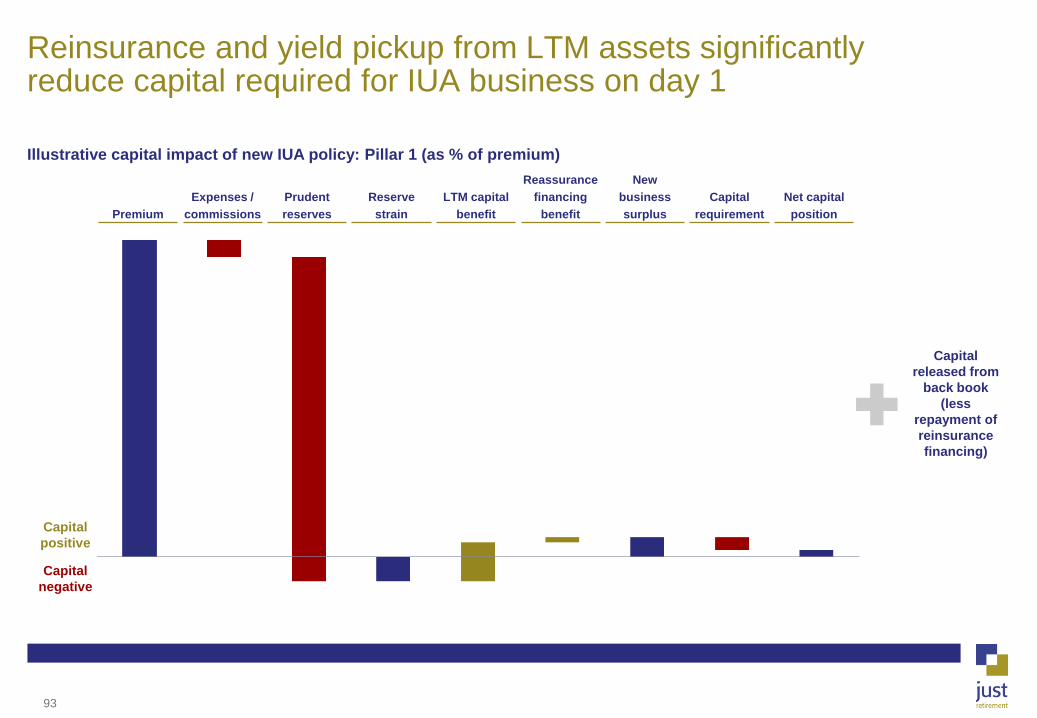
Illustrative capital impact of new IUA policy: Pillar 1 (as % of premium)
Reinsurance and yield pickup from LTM assets significantly reduce capital required for IUA business on day 1
Capital released from
back book (less
repayment of reinsurance financing)
Capital positive
Capital negative
Premium Prudent reserves
LTM capital benefit
Reassurance financing
benefit Capital
requirement Net capital
position Expenses /
commissions Reserve
strain
New business surplus
93

253
552 605 591
805
893
1,195
1,344
2006 2007 2008 2009 2010 2011 2012 2013
Strong growth in new business sales
LTM advances (FY) Total annuity premiums(1) (FY)
Source: Just Retirement . Note: FY represents Just Retirement’s Financial Year to 30 June. 1. Includes sales of individually underwritten annuities and fixed term annuities.
£m £m
94

38
143 149 140
289
344 365
504
2006 2007 2008 2009 2010 2011 2012 2013
Group embedded value(3) (FY)
Strong growth in IFRS underlying operating profit and embedded value
Source: Just Retirement. Note: FY represents Just Retirement's financial year to 30 June. 1. 2006 figure is Just Retirement’s IFRS pre-tax profit. 2007 – 2010 IFRS operating profit figures as stated in Just Retirement published accounts. Figures from 2011 onwards are Just Retirement’s underlying operating profit. 2. Normalised new business operating profit for the year ended 30 June 2011 shown (excludes exceptional profit of £14m). 3. Excluding IPO proceeds. 4. CAGR excludes £40m of capital injected over 2011-13.
£m
IFRS underlying operating profit(1) (FY)
£m
(2)
IFRS operating profit IFRS underlying operating profit
(3) IFRS new business operating profit
In-force IFRS operating profit
50 55 59
26
33
41
4
26
46 45
74 76
88
100
2006 2007 2008 2009 2010 2011 2012 2013
IFRS operating profit
95

Approach to IFRS underlying operating profit
IFRS new business operating profit drivers
(+) Annuity premium
(-) New business acquisition expenses
(-) Initial reserves:
• Discounted at rate reflecting investment yield and asset mix (including LTM)
• Incorporates prudent reserves above best estimate for
- Credit defaults on bond portfolio
- LTM (NNEG, early redemptions)
- Mortality
= IFRS new business operating profit
IFRS in-force operating profit drivers
(+) Corporate bond spread (unwind of prudent default provision)
(+) Mortality spread (unwind of prudent reserve)
(+) Emergence of prudent margins on LTM
(+) Expense
(+) Expected return on surplus assets
= IFRS in-force operating profit
+
=
IFRS underlying operating profit
Source: Just Retirement. 96

Operating expenses at the life company level (FY)
Expenses in line with sales growth despite significant recent investment
3.9% 3.9% Operating expenses
as % of total new business
sales
Source: Just Retirement. Note: FY represents Just Retirement’s Financial Year to 30 June.
£m
4.0%
44
57
66
Operating expenses include new business and in-force operating costs but exclude commissions
22% CAGR in operating expenses over FY 2011-13, broadly in line with total sales growth of 21% over the same period, despite:
Significant investment in our financial, risk and actuarial teams
Significant investment in regulatory projects of Solvency 2, RDR and gender directive
Significant investment in new projects development, including PrognoSysTM, fixed term annuities, care annuity and DB de-risking
Prudent approach to capitalisation
Scale effect driving reduced acquisition cost per policy
74% 67%
75%
10%
17%
12%
5%
2%
1%
11%
13%
12%
2011 2012 2013
Acquisition New business development
Amortisation of intangibles Maintenance
97

0.047
9.8%
4.7%
8.6% 13.3%
(3.5)%
IFRS new business operating margin
Prudent reserves for mortality, credit
defaults and mortgage return
Discounted "best estimate" IFRS new business operating
margin
Liquidity premium assumption
EEV new business operating margin
Just Retirement’s approach to EEV
Just Retirement uses a bottom-up EEV approach, although largely consistent with MCEV principles
EEV assumptions based on “best estimate” (compared to prudent IFRS assumptions) with the exception of liquidity premium
Key debate for annuities is use of liquidity premiums in discount rate
Liquidity premium set as 50% x (iBOXX sterling corporate spread – 40bps) in accordance with CFO Forum
Liquidity premium for in-force at 30 of June 2013 was 77bps, implying a very prudent default rate of 104bps, or 57.5% of the spread
Source: Just Retirement. 1. EEV new business operating margin includes contribution from fixed term annuities
Embedded value is a valuable KPI KPI 5
Prudence which will be released
into in-force profit in later years
Prudent recognition of EEV new business operating margin (pre tax)
(1)
98

Capital management policy
Group capital managed on Economic Capital basis
Life company to meet regulatory requirements under Pillar 1 and Pillar 2 regimes
Objective of ensuring appropriate level of capitalisation and solvency with respect to underlying risk drivers, regulatory
requirements and the Board’s risk appetite
Economic Capital Board’s realistic internal assessment of capital required to maintain an appropriate balance sheet after sustaining adverse
events(1)
Minimum target ratio of 140%, under normal circumstances
Pillar 1 Calculated at the life company level
Calculated by applying fixed percentages to reserves
Pillar 2 Individual capital assessment (ICA) framework set by PRA
Results not publicly disclosed
Capital management Use of reinsurance significantly reduces longevity exposure and provides regulatory capital funding
£55m of senior debt used to improve Pillar 1 and Pillar 2 capital position in the life company
Solvency 2 Just Retirement’s Solvency 2 project significantly advanced
Although implementation not expected before 2016 at the earliest
Capital management policy
Source: Just Retirement. 1. Adverse events of sufficient severity such that they would be expected to occur once every 200 years (i.e. to a 99.5 per cent. confidence level over a one-year time horizon). Should not be construed as capital required by regulators or other third parties. May not be directly comparable to similarly named metrics used by other companies.
Capital management policy
Economic Capital
Pillar 1
Pillar 2
Capital management
Solvency 2
99

Benchmarking Just Retirement’s Economic Capital position – selected peers(1)
Benchmarking Just Retirement’s Economic Capital position
Source: Companies data (as at 30 June 2013). Notes: 1. May not be directly comparable to similarly named metrics used by other companies. 2. Swiss Solvency Test.
(2)
100
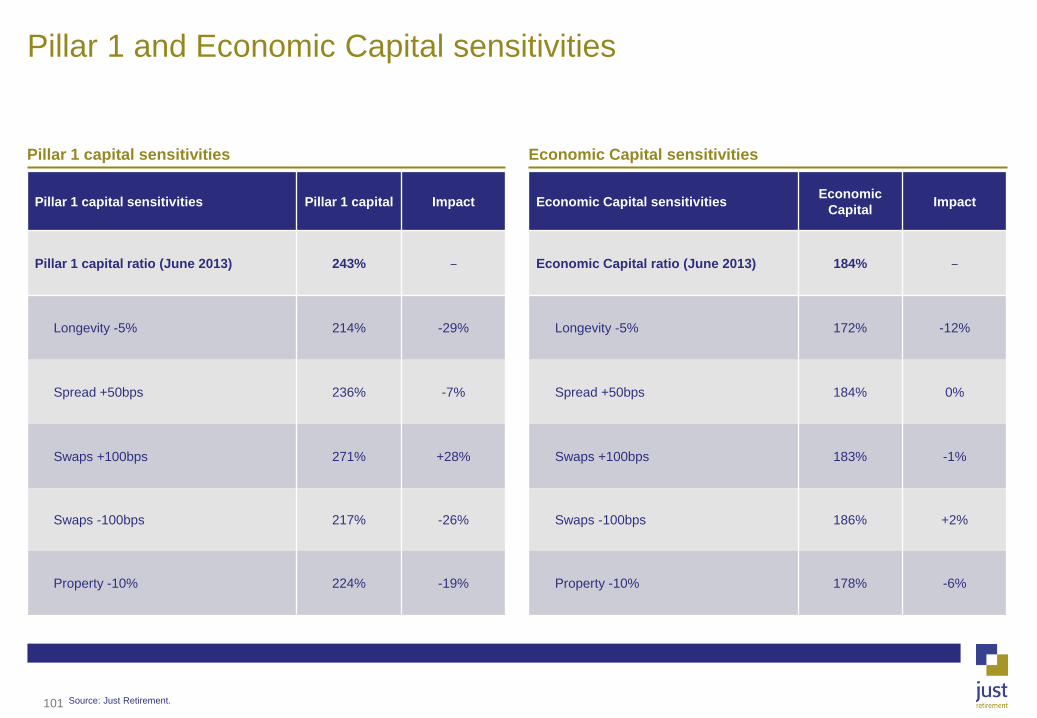
Pillar 1 and Economic Capital sensitivities
Pillar 1 capital sensitivities Pillar 1 capital Impact
Pillar 1 capital ratio (June 2013) 243% ‒
Longevity -5% 214% -29%
Spread +50bps 236% -7%
Swaps +100bps 271% +28%
Swaps -100bps 217% -26%
Property -10% 224% -19%
Pillar 1 capital sensitivities Economic Capital sensitivities
Economic Capital sensitivities Economic Capital Impact
Economic Capital ratio (June 2013) 184% ‒
Longevity -5% 172% -12%
Spread +50bps 184% 0%
Swaps +100bps 183% -1%
Swaps -100bps 186% +2%
Property -10% 178% -6%
Source: Just Retirement. 101

IFRS profit – protected from mortality risk by prudent reserving and reinsurance
IFRS EEV
Mortality basis “Prudent” “Best estimate”
Reinsurance impact 66%(1) Assumed no impact
Prudent buffer over best estimate reserves? Yes No
Release of prudent mortality reserves into in-force profit? Yes No
Source: Just Retirement. 1. Of qualifying IUA business.
102

Company history
Just Retirement commences operations Mission: "To be recognised and trusted as the provider of financial solutions for people at and in retirement“ Launches lifetime mortgage plans Staff numbers close to 100; revenue grows to over £100m
Launch Just Retirement Solutions – offering advice on equity release in conjunction with inaugural partner Saga Lists on the AIM valued at £422m Revenue grows to £500m per year Voted ‘5 star’ in the Mortgage Lenders and Packagers category for the first time
Permira (Avalon Acquisitions) acquires Just Retirement for £228m, injects £25m for growth Rodney Cook named CEO of Just Retirement New vision: “To be the leading retirement brand known and trusted for enriching our customers’ lives” Acquires The Open Market Annuity Service (TOMAS) from Kerr Henderson Voted as one of the best companies to work for by The Sunday Times
Core medical team recruited Launches Fixed term annuity with unique conversion feature Total annual volume of new business annuity policies sold by Just Retirement passes £1bn
Mortality curves recalculated using PrognoSysTM
Launches its defined benefit de-risking solutions proposition in the market Total financial assets reach c.£5.0bn
PrognoSysTM being used alongside JR Merica and other reinsurers during development phase Signs partnership deals with Origen Financial Services and NFU Mutual Enters long term care and individually underwritten LTM markets
2004- 2005
2006- 2008
2009- 2010
2011
2012
2013
103

Chairman and Executive Board members
Appointed as a Non–Executive Director of Just Retirement in October 2006 and became Chairman on its admission to AIM Formerly Chief Executive Officer of ABN AMRO Asset Management and Chief Executive Officer of Lazard Brothers Asset Management (prior to joining ABN in 1997) Currently a Non–Executive Director of Phoenix Group Holdings, Artemis Alpha Trust Plc and a Non–Executive member of the Management Committee of Artemis Investment Management LLP
Joined Just Retirement in July 2010 Formerly Managing Director of Life and Pensions at Liverpool Victoria (LV=) Previously at AMP, Pearl, Zurich Insurance Group and Prudential A qualified actuary with over 34 years experience in financial services
Appointed Finance Director of Just Retirement in July 2006 Formerly Finance and Customer Services Director at Canada Life Spent 10 years at Nationwide Building Society, latterly as Group Financial Controller A qualified Chartered Accountant with over 13 years experience in the UK life assurance industry
Appointed Group Chief Actuary of Just Retirement in October 2008 and also acted as Chief Risk Officer until October 2012 Formerly Group Financial Management Director at Aviva and UK Life Finance Director at Zurich Financial Services With over 32 years experience, Shayne has also been a Partner at E&Y and Principal at Tillinghast
Rodney Cook Chief Executive
Officer
Shayne Deighton Group Chief Actuary
Simon Thomas Finance Director
Tom Cross Brown Independent Non-
Executive Chairman
104

Other Executive management
Founded Just Retirement (with five other directors) in 2004 and was appointed as Regulatory & Audit Director in January 2010 Previously in senior roles at Commercial Union, Aviva and Britannic Retirement Solutions Director of the Equity Release Council and member of various ABI groups Over 30 years life and pensions experience in the United Kingdom and Europe
Founded Just Retirement (with five other directors) in 2004 Previously worked at NPI, GE and Britannic Group 20 years’ experience in the Financial Services industry, 15 of which have been in the retirement sector
Joined Just Retirement in 2006 Previously at GE Capital, Centrica plc and Bradford & Bingley Over 30 years in Financial Services including retail banking, actuarial consulting and retirement
Joined Just Retirement in September 2012 Previously at Old Mutual, where he spent eight years in a number of positions including Head of UK acquisitions, Head of Corporate Finance and Development and, for the last four years, Director of Finance – Capital
Joined Just Retirement in March 2010 as an interim Head of HR and was appointed HR Director in September 2010 Previously worked at Marks & Spencer, BP and the Britannic Group Fellow of the Chartered Institute of Personnel and Development with over 25 years’ experience in Human Resources
Joined Just Retirement in May 2011 Formerly Chief Medical Advisor to The Department for Transport & Medical Director at Croydon Primary Care NHS Trust Has over 25 years of medical experience and academic epidemiological knowledge
Chris Berryman Group Operations
Director
David Cooper Group Distribution & Marketing Director
Steve Kyle Regulatory & Audit
Director
Alex Duncan Chief Risk Officer
Anne Ridge HR Director
Dr. Tim Crayford Medical Director
105

Headcount (FTE)(1)
Total staff turnover excluding redundancies and FTC Staff absence
Growing workforce remains highly motivated and engaged
1. At the end of each financial year ending 30 June. 2. Industry benchmark as defined by ABI.
(2) (2)
Employee Awards
106

Just Retirement Group plc
Initial public offering of ordinary shares (comprising primary and secondary capital)
Avallux Sàrl (“Avallux”; investment vehicle for funds advised by Permira Advisers LLP)
Other minority shareholders, including management
London Stock Exchange (premium listing)
FTSE250 index eligibility anticipated
Institutional offering under Reg. S outside the US and under Rule 144A within the US
Primary raise of £300m
Secondary raise £43m
180 days in respect of Avallux
365 days in respect of the directors and senior management
The IPO was priced at 225p, in the middle of the 200-250p range. Conditional dealings commenced 12/11/13
Offer structure summary
Issuer
Selling shareholders
Listing
Offering structure
Offering size
Lock-Up
Distribution
107

IPO proceeds support growth to capture market opportunity
– £175m allocated to life company to:
Support growth in new business
Strengthen capital ratios
Better position company to accommodate future regulatory changes (including Solvency 2)
– Remaining £125m for Group solvency and liquidity, general corporate purposes and issue costs(1)
Strengthening profile and market position
– Raises Just Retirement's profile and enhances brand
– Improves perception of financial strength and rating due to access to public market capital
Listed equity supports continued recruitment and retention of key staff
Provides liquidity for shareholders
1. Estimated issue costs of £20m.
Use of proceeds
Other benefits
What the IPO achieves for Just Retirement
108

Contact and next results
James Pearce
Director – Investor Relations
Just Retirement Group
01737 827 245
www.justretirementgroup.com
INTERIM RESULTS 28th FEBRUARY
109