Non-Alcoholic Fatty Liver Disease and the Gut Microbiome ...
48
University of Central Florida University of Central Florida STARS STARS Honors Undergraduate Theses UCF Theses and Dissertations 2020 Non-Alcoholic Fatty Liver Disease and the Gut Microbiome: The Non-Alcoholic Fatty Liver Disease and the Gut Microbiome: The Effects of Gut Microbial Metabolites on NAFLD Progression in a Effects of Gut Microbial Metabolites on NAFLD Progression in a 2-Organ Human-on-a-Chip Model 2-Organ Human-on-a-Chip Model Rachel H. Boone University of Central Florida Part of the Microbiology Commons Find similar works at: https://stars.library.ucf.edu/honorstheses University of Central Florida Libraries http://library.ucf.edu This Open Access is brought to you for free and open access by the UCF Theses and Dissertations at STARS. It has been accepted for inclusion in Honors Undergraduate Theses by an authorized administrator of STARS. For more information, please contact [email protected]. Recommended Citation Recommended Citation Boone, Rachel H., "Non-Alcoholic Fatty Liver Disease and the Gut Microbiome: The Effects of Gut Microbial Metabolites on NAFLD Progression in a 2-Organ Human-on-a-Chip Model" (2020). Honors Undergraduate Theses. 678. https://stars.library.ucf.edu/honorstheses/678
Transcript of Non-Alcoholic Fatty Liver Disease and the Gut Microbiome ...

University of Central Florida University of Central Florida
STARS STARS
Honors Undergraduate Theses UCF Theses and Dissertations
2020
Non-Alcoholic Fatty Liver Disease and the Gut Microbiome: The Non-Alcoholic Fatty Liver Disease and the Gut Microbiome: The
Effects of Gut Microbial Metabolites on NAFLD Progression in a Effects of Gut Microbial Metabolites on NAFLD Progression in a
2-Organ Human-on-a-Chip Model 2-Organ Human-on-a-Chip Model
Rachel H. Boone University of Central Florida
Part of the Microbiology Commons
Find similar works at: https://stars.library.ucf.edu/honorstheses
University of Central Florida Libraries http://library.ucf.edu
This Open Access is brought to you for free and open access by the UCF Theses and Dissertations at STARS. It has
been accepted for inclusion in Honors Undergraduate Theses by an authorized administrator of STARS. For more
information, please contact [email protected].
Recommended Citation Recommended Citation Boone, Rachel H., "Non-Alcoholic Fatty Liver Disease and the Gut Microbiome: The Effects of Gut Microbial Metabolites on NAFLD Progression in a 2-Organ Human-on-a-Chip Model" (2020). Honors Undergraduate Theses. 678. https://stars.library.ucf.edu/honorstheses/678

NON-ALCOHOLIC FATTY LIVER DISEASE AND THE GUT MICROBIOME: THE
EFFECTS OF GUT MICROBIAL METABOLITES ON NAFLD PROGRESSION IN A 2-
ORGAN HUMAN-ON-A-CHIP MODEL
by
RACHEL H. BOONE
A thesis submitted in partial fulfilment of the requirements
for the Honors Undergraduate Thesis Program in Biomedical Sciences
in the College of Medicine
and in the Burnett Honors College
at the University of Central Florida
Orlando, Florida
Spring Term
2020
Thesis Chair: Dr. James J. Hickman, Ph.D.

i
ABSTRACT
Using a novel, adipose-liver, two-organ, human-on-a-chip system, the metabolic disease
non-alcoholic fatty liver disease was modeled. This model was then used to test the effects of the
gut microbiome on NAFLD progression. Two products of the gut microbiome, Trimethylamine-
n-oxide and butyrate, were selected as representatives of potentially harmful and potentially
beneficial compounds. A dose response, adipocyte and hepatocyte monocultures controls, and
HoaC systems were run for 14 days. Through this experimentation, it was found that a dysbiosis
of the gut microbiome could be influencing NAFLD progression. Additionally, further
development and discovery regarding adipose-liver systems was added to the ongoing
conversation of HoaC systems and their usages.

ii
ACKNOWLEDGMENTS
I would like to express my deepest appreciation for the many people who have helped me in the
process of completing my research. First, I must thank my thesis chair Dr. Hickman who has
provided for me the guidance and tools needed for my research. Special thanks go out to Dr.
John Rumsey and Victoria Slaughter who have mentored and trained me from when I first
started researching through the present day. Finally, I would like to thank my family who have
been a source of endless support. To these people, thank you; without you I would not have
accomplished so much nor have become the person I am.

iii
TABLE OF CONTENTS
CHAPTER 1: INTRODUCTION ................................................................................................... 1
NAFLD and Its Progression ........................................................................................................ 1
The Gut Microbiome ................................................................................................................... 2
Disease Models ........................................................................................................................... 5
CHAPTER 2: MEDIA FORMULATION ...................................................................................... 7
CHAPTER 3: DOSE RESPONSE .................................................................................................. 9
Purpose ........................................................................................................................................ 9
Cell Culture ................................................................................................................................. 9
Steatosis....................................................................................................................................... 9
Results ....................................................................................................................................... 10
CHAPTER 4: CELL CULTURE AND ASSAY METHODOLOGY .......................................... 12
Cell Culture ............................................................................................................................... 12
HoaC Systems ........................................................................................................................... 12
Hepatic Steatosis ....................................................................................................................... 14
Hepatic Enzyme Activity .......................................................................................................... 14
Adipocyte Cytokine Secretion .................................................................................................. 15
Adipocyte Insulin Resistance .................................................................................................... 15
CHAPTER 5: MONOCULTURE RESULTS .............................................................................. 17
Culture Health ........................................................................................................................... 17
Hepatic Steatosis ....................................................................................................................... 19
Hepatic Enzyme Activity .......................................................................................................... 22

iv
Adipocyte Cytokine Secretion and Insulin Resistance ............................................................. 22
CHAPTER 6: HOAC SYSTEM RESULTS ................................................................................. 25
Culture Health ........................................................................................................................... 25
Hepatic Steatosis ....................................................................................................................... 27
Hepatic Enzyme Activity .......................................................................................................... 30
Adipocyte Cytokine Secretion and Insulin Resistance ............................................................. 30
CHAPTER 7: DISCUSSION AND CONCLUSION ................................................................... 33
Adipose-Liver HoaC Systems and NAFLD .............................................................................. 33
The Gut Microbiome’s Role in NAFLD ................................................................................... 36
Conclusion................................................................................................................................. 38
REFERENCES ............................................................................................................................. 39

v
LIST OF TABLES
TABLE 1: Blood Memetic Media Condition Composition ............................................................ 8
TABLE 2: Dose Response to TMAO and Butyrate Summarized ................................................ 11

vi
LIST OF FIGURES
FIGURE 1: Dose Response to TMAO and Butyrate .................................................................... 11
FIGURE 2: Adipose-Liver Systems Design ................................................................................. 13
FIGURE 3: Quantification of Steatosis Using ImageJ ................................................................. 14
FIGURE 4: Cell Health of Hepatocytes in Monoculture .............................................................. 18
FIGURE 5: Cell Health of Adipocytes in Monoculture ............................................................... 19
FIGURE 6: Steatosis of Hepatocytes in Monoculture .................................................................. 21
FIGURE 7: CYP3A4 Activity of Hepatocytes in Monoculture ................................................... 22
FIGURE 8: Adipocyte Secretion of Cytokine in Monoculture .................................................... 23
FIGURE 9: Expression of GLUT-4 and Insulin Receptor in Monoculture .................................. 24
FIGURE 10: Cell Health of Adipose-Liver Systems, TMAO ...................................................... 25
FIGURE 11: Cell Health of Adipose-Liver Systems, Butyrate .................................................... 27
FIGURE 12: Steatosis of Hepatocytes in Adipose-Liver Systems ............................................... 29
FIGURE 13: CYP3A4 Activity of Hepatocytes in Adipose-Liver Systems ................................ 30
FIGURE 14: Adipocyte Secretion of Cytokines in Adipose-Liver Systems ................................ 31
FIGURE 15: Expression of GLUT-4 and Insulin Receptor in Adipose-Liver Systems, TMAO . 32

1
CHAPTER 1: INTRODUCTION
NAFLD and Its Progression
Non-alcoholic fatty liver disease (NAFLD) is a metabolic disease highly correlated with
type 2 diabetes mellites and obesity. It is characterized by the accumulation of fat, in the form of
triglycerides, in the liver (hepatic steatosis). NAFLD can progress to disease states such as non-
alcoholic Steatohepatitis (NASH), fibrosis, cirrhosis, and liver cancer [1, 2]. This is especially
concerning considering that NAFLD is becoming more prevalent in the United States, with rates
being reported as high as 46% [3]. NASH and cirrhosis due to NAFLD are increasing in
frequency as indications for liver transplantation, with NASH already being the third most
common indication in the United States [2-4].
A “multiple hit hypothesis” has been developed to describe NAFLD progression. This
hypothesis asserts that excess free fatty acids (FFA), insulin resistance (IR), adipocyte
dysfunction, and dysbiosis (an imbalance in the population of the gut microbiome (GM)), along
with genetic, epigenetic, and dietary factors can all contribute to liver steatosis [1, 5].
Triglycerides, which are formed by the esterification of FFAs, are normally stored briefly
in the liver, but high-fat diets, obesity, and IR resistance can increase the FFA concentration and
lead to lipotoxicity. IR resistance can increase the storage of triglycerides through two main
mechanisms: in adipocytes, IR can lead to the impaired inhibition of lipolysis, and IR in
hepatocytes increases hepatic de novo lipogenesis. [1, 6, 7].
In addition to increasing FFA levels, obesity and IR can lead to the dysfunction of
adipokine secretion. Adipokines, such as leptin and adiponectin, are hormones secreted by
adipose tissue. Leptin is an adipokine involved in the prevention of lipid storage in non-

2
adipocyte tissue and has pro-inflammatory properties. Obesity leads to an upregulation in plasma
leptin concentration, causing the body to grow resistant to leptin’s latter effects while still being
susceptible to the former. Adiponectin is an anti-inflammatory adipokine which can also improve
IR and has an anti-fibrotic effect. However, adiponectin is downregulated in obesity. Thus, the
dysfunction of adipokine secretion, caused by disease states such as obesity, can play a major
part in the development of hepatic steatosis and the progression of NAFLD [1, 7, 8].
Hepatic inflammation through the JNK-AP-1 and IKK-NF-κB pathways can also drive
NAFLD pathogenesis [9, 10]. Adipocytes contribute to low grade inflammation with the
production of IL-6 and TNF-α [8, 9]. When there is adipocyte damage or an increase in adipose
tissue volume, such as in obesity, the secretion of these compounds is upregulated [10].
Similarly, hepatic tissue damage can increase the inflammatory response. Finally, endotoxins and
other pathogen-associated molecular patterns (PAMPS) produced by the GM can make their way
into the liver through a “leaky gut” and they can initiate inflammation through Toll-like receptors
[1, 11].
The Gut Microbiome
The gut microbiome consists of the fungi, viruses, and the roughly 3.9 x 10¹³ bacteria,
belonging to thousands of operational taxonomic units, which live in the human colon [11, 12].
The GM plays an active role in the health of the host, producing many metabolic products and
signaling molecules. These products include metabolites such as bile acids, choline derivatives,
short chain fatty acids (SCFAs), alcohols, and endotoxins, which can have a range of effects on
the host [1, 5, 13].

3
In recent years, the effects of gut microbial compounds on humans has been an area of
interest in the research community. There is strong evidence that GM can influence mental
health and disorders such as major depressive disorder [14]. Similarly, higher concentrations of
trimethylamine-n-oxide (TMAO), which is produced by the GM, has been identified as a risk
factor for strokes, and the dysbiosis in the GM has been associated with cardiovascular disease
development [15]. When it comes to NAFLD, problems with the GM is one of the main “hits” in
the multiple hit hypothesis. While NAFLD and NASH are often associated with metabolic
problems like obesity or high caloric diets, NAFLD is also present in patients who do not present
with other diseases like obesity, and it is hypothesized that the GM could be responsible for these
cases [16].
Although studies differ in exact results, they show that the microbial population is often
different between healthy individuals and those with NAFLD, and they most commonly show
differences in the population of Bacteroidetes and Firmicutes [17]. It has also been observed that
healthy patients have more bacteria from the phyla Bacteroidetes and a more diverse gut
population than individuals with NAFLD [18]. The change in gut population is one of the main
reasons why dysbiosis of the GM is believed to be a major driver of NAFLD, especially in
patients without other disease states [16].
There are a number of ways in which dysbiosis could be influencing liver health. The
first way is by the introduction of endotoxin and other compounds to the liver through a leaky
gut. In a healthy colon, the epithelial cells form a tight barrier which bacteria and their products
are unable to cross unless transported. However, in certain disease states such as chronic
inflammation, or even high rates of alcohol production by microbes due to dysbiosis in the GM,

4
the gut enterocytes can become damaged and this barrier can become permeable to compounds
such as endotoxin (lipopolysaccharide, LPS), which is produced by Gram negative bacteria as
part of their cell walls. LPS, as well as other PAMPS, can then cause inflammation through
activation of Toll-like receptors [1, 5, 11, 17].
Additionally, the low choline levels in the liver, due to poor diet or microbial
metabolization of choline into trimethylamine (TMA), can promote liver damage and NAFLD
[17, 19]. Bile acids’ pool size and composition can influence liver health and is regulated in part
by the GM [17, 20]. The digestion and metabolism of starch and non-starch polysaccharides by
microbes into short chain fatty acids (SCFAs) account for a significant portion of energy
adsorption by humans. It is hypothesized that a change in the population of the GM to favor the
microbes that produce more SCFAs could increase this energy production and lead to obesity [1,
21].
Changes in the microbial population could be causing the concentrations of other
metabolites to be altered as well. Many of these metabolites, such as TMAO and butyrate, could
have direct interactions with hepatic tissue, and thus an alteration in their concentration could be
influencing hepatic health [13, 17].
TMAO is a derivative of choline. Humans consume choline and the gut microbes
metabolize the dietary choline into trimethylamine (TMA) as well as other products [19]. TMA
is then absorbed by the gut and is transported to the liver where it is further metabolized by
hepatocytes into TMAO [15]. TMAO is a proinflammatory molecule previously associated with
cardiovascular disease and NAFLD [13, 15, 22]. In addition to possibly inducing inflammation,
TMAO has been shown to modulate reverse cholesterol transport and sterol metabolism [23].

5
Butyrate is a SCFA produced by gut microbes shown to be absorbed by the
gastrointestinal tract and transported to the liver [24]. In addition to affecting the health of
intestinal epithelial cells, butyrate has anti-inflammatory properties through the inhibition of NF-
κB [25]. In mouse models, butyrate has also been shown to improve insulin signaling [26]. If
dysbiosis of the GM can drive changes in the concentration of potentially beneficial compounds
like butyrate or harmful compounds like TMAO, the pathogenesis of NAFLD could be
promoted.
Disease Models
Today, science relies heavily on animal models, primarily rodent models, to model
human diseases. These animals act as surrogates for humans for the testing of new drugs or to
model diseases. Although these models have made major advances in medicine possible, there
are also limitations to their utility. Animal behavior and physiology can be impacted by
laboratory conditions that result in stress for the animals including repeated handling.
Additionally, the physiology and genetics of animal models as well as the pathology of animal
disease models is not identical to humans and human diseases and thus presents differently
between the species. The difference between animal models and humans is so great that around
90 percent of drugs which pass in animal testing fail to be effective in humans due to toxicity
issues [27, 28]. Another objection to the use of animal models is the question of ethics. Despite
the limitations of animal models, as of 2005 more than 115 million animals were used annually
in the biomedical industry [29].
As an alternative to traditional animal models, human-on-a-chip (HoaC)
microphysiological systems have been developed. These systems consist of human primary or

6
stem cell-derived cells organized into functional “organs” which share feeding medium, dosed
drugs, and metabolites through the microfluidic system housing. HoaC systems combine
biomedical sciences with the fields of engineering and chemistry to create in vitro models which
contain relevant human cell types, limited variability, and the ability to obtain both functional
and molecular readouts of not only the target pathway but also the peripheral effects while
avoiding animal testing and allowing for more complexity than traditional 2-D models would
provide [30-33]. HoaC systems also allow for phenotypic drug discovery (PDD) as opposed to
target-based drug discovery (TDD). While most drug testing today requires TDD, where
knowledge or a hypothesis as to what effects a drug may have is needed beforehand, PDD offers
the ability to determine the effects of a drug outside the limited predicted effects [34]. Already,
HoaC systems have been created to emulate the blood brain barrier, lung, heart, intestine and
many more organ systems including larger, more complex systems such as a four organ model
containing cardiac, muscle, neuronal, and liver modules [30, 32].

7
CHAPTER 2: MEDIA FORMULATION
A serum free, defined medium, described in previous studies, was used as the base for
each condition’s respective medium [32]. The Blood Memetic Medium (BMM) was modified for
this study with a change in glucose and insulin concentrations. Additionally, Neurobasal-A
medium -D-glucose, - sodium pyruvate (Life Technologies, A24775-01) 1x B27 – insulin (Life
Technologies, A1895601), and 0.22mM sodium pyruvate (Sigma, S8636) were used. This
change was used to create more physiologically relevant conditions to NAFLD so that the
control medium (healthy, h, hBMM) contained significantly less glucose and insulin, while the
diabetic condition (+d, dBMM) had a higher concentration of glucose and insulin.
Since there are several disease states which have been shown to correlate if not contribute
to the pathogenesis of NAFLD, multiple conditions were emulated through the addition of
factors to the medium. These media formulations were designed to mimic the serum of a patient
with the specified health condition. The healthy condition was the base BMM. The diabetic
condition had higher concentrations of glucose and insulin. The supplementation of the FFAs
BSA-conjugated palmitate (Sigma, A8806) and oleate (Sigma, O3880) characterized the obese
condition (+lipids, hBMMlipids). The condition emulating an inflamed state (+TNF-α, +TNF,
hBMMTNF) was supplemented with the cytokine TNF-α (Sigma, T0157). The last condition
was the diabetic, inflamed, and obese condition (dBMMTNFlipids). [35]

8
TABLE 1: BLOOD MEMETIC MEDIA CONDITION COMPOSITION
Condition Condition
Abbreviation Added Factors
Concentration of
Condition Factors
Healthy h
hBMM
Glucose 5mM
Insulin 1nM
Palmitate 0M
Oleate 0M
TNF-α 0M
Diabetic +d
dBMM
Glucose 25mM
Insulin 69μM
Palmitate 0M
Oleate 0M
TNF-α 0M
Inflammation
+TNF-α
+TNF
hBMMTNF
Glucose 5mM
Insulin 1nM
Palmitate 0M
Oleate 0M
TNF-α 10μM
Obese +lipids
hBMMTNFlipids
Glucose 5mM
Insulin 1nM
Palmitate 45μM
Oleate 65μM
TNF-α 0M
Inflamed, Obese, and
Diabetic dBMMTNFlipids
Glucose 25mM
Insulin 69μM
Palmitate 45μM
Oleate 65μM
TNF-α 10μM TABLE 1: Blood Memetic Media Condition Composition

9
CHAPTER 3: DOSE RESPONSE
Purpose
In an in vitro study, the physiological concentration of the chosen microbial metabolites,
TMAO and butyrate, may not be significant enough to cause a measurable effect over the course
of a 14 day dosing, and thus a dose response was performed to determine the appropriate
concentration of TMAO and butyrate for in vitro testing. The goal was to find a concentration
which would produce in vitro changes in steatosis but was not so concentrated as to lose
physiological relevance or cause cell death.
Cell Culture
For the dose response, human hepatocellular carcinoma (HepG2/C3A) (ATCC® CRL-
10741™) cells were used. This line of cells was used for this preliminary data because of their
ease of culture and low cost. HepG2 cells were plated on 15mm diameter round glass coverslips,
sterilized in 70% isopropyl alcohol (IPA) and allowed to dry, at a plating density of 6 × 10⁴ cells
per coverslip in Dulbecco's Modified Eagle Medium (DMEM). The following day, the cells were
moved to BMM +/- d and +/- lipids conditions and varying concentrations of TMAO or butyrate.
The cultures were fed and dosed regularly over the course of 14 days.
Steatosis
The cells were washed with phosphate buffered saline (PBS) and then fixed using 4%
paraformaldehyde (PFA) for 10 minutes at room temperature. After another wash with PBS, the
coverslips were covered with a 3:2 Oil Red O dye (Sigma, O1391) to deionized water (diH2O)
solution for 30 minutes at room temperature. Additional washes with PBS were used to remove
the excess dye and precipitate. The cells were then imaged at 100x using a phase microscope. Oil

10
Red O is a lipid soluble dye which stains lipids a deep red color. Thus, an increase of red in the
images correlates to an increase in the fat being stored by the cells, an increase in steatosis. For
the dose response, the steatosis was not quantified but was analyzed qualitatively along with the
general health of the cultures.
Results
As expected, the dBMM conditions had more steatosis than their respective hBMM
controls. Similarly, the +lipids conditions had more steatosis than their respective -lipids
controls. These results indicated that the hepatocytes do store different levels of lipids based on
the condition. They also show that the +d and +lipids conditions induced an increase in steatosis
as they theoretically should.
The +1μM TMAO conditions did not appear to store more lipids than their respective
controls. The +100µM TMAO conditions showed an increase in lipid storage compared to their
respective controls. However, this concentration of TMAO seemed to cause some cell death.
Based on these results and the concentration of TMAO found in the literature, the concentration
of 10μM TMAO was chosen as the dosing concentration for the remainder of study.
Both the +1nM butyrate and +1µM butyrate conditions had less steatosis than their
respective controls. The +1mM butyrate conditions had more steatosis than their respective
controls. This switch from storing less lipids to storing more lipids with an increase in
concentration of butyrate is most likely caused by the fact that butyrate both has anti-
inflammatory properties and can act as a source of energy. It is possible that the great excess of
energy in the form of butyrate in the +1mM butyrate conditions caused a greater effect than the
signaling of butyrate could. It was thus concluded that a dosing concentration closer to the lower

11
two was desired. Based on these results and the literature, a concentration of 10μM butyrate was
chosen as the dosing concentration for the remainder of the study.
FIGURE 1: Dose Response to TMAO and Butyrate.
(A) HepG2 cells were fed for 14 days with hBMM, hBMMlipids, dBMM, dBMMlipids, dBMM+1μM TMAO,
dBMMlipids+1µM TMAO, dBMM+100μM TMAO, and dBMMlipids+100µM TMAO. The cells were fixed with 4%
PFA and stained with Oil Red O dye. Images were taken at 100X on a phase microscope. (B) HepG2 cells were fed
for 14 days with dBMM, dBMMlipids, dBMM+100nm butyrate, dBMMlipids+100nm butyrate, dBMM+1μM butyrate,
dBMMlipids+1μM butyrate, dBMM+1mM butyrate, and dBMMlipids+1mM butyrate. The cells were fixed with 4%
PFA and stained with Oil Red O dye. Images were taken at 100X on a phase microscope FIGURE 1: Dose Response to TMAO and Butyrate
. TABLE 2: DOSE RESPONSE TO TMAO AND BUTYRATE SUMMARIZED
<10μM 10μM >10μM
TMAO Limited Effect Visible Increase in
Steatosis Cell Death
Butyrate Limited Effect Visible Decrease in
Steatosis
Visible Increase in
Steatosis TABLE 2: Dose Response to TMAO and Butyrate Summarized

12
CHAPTER 4: CELL CULTURE AND ASSAY METHODOLOGY
Cell Culture
Primary hepatocytes from Massachusetts General Hospital (MGH) (Lot# 54.1) were
plated on 15mm coverslips at a cell density of approximately 250,000 cells/cs in vendor
recommended medium. The coverslips were prepared by sterilization in 70% IPA and then
incubated with ECL Cell Attachment Matrix (Millipore Sigma, 08-110) diluted in PBS for 1
hour, then washed with PBS. The cells were then allowed to recover, being fed regularly, for 5-9
days.
Primary human cardiac preadipocytes (Cell Applications, Sigma, No. 802H-05A) were
plated on 15mm coverslips at a cell density of approximately 90,000 cells/cs. The cells were
allowed to grow to confluency and recover for 24-48 hours. Human Preadipocyte Growth
Medium (Cell Applications, Sigma, 811-500) was used for both the plating and the recovery.
After the preadipocytes had grown confluent, they were moved to Human Adipocyte
Differentiation Medium (Cell Applications, Sigma, 811D-250) and allowed to differentiate,
being fed regularly, for 12-16 days.
After the cells had recovered and differentiated, they were moved to BMM conditions +/-
10μM TMAO or Butyrate. They were fed and dosed regularly for 14 days. Alternatively, the
coverslips were assembled into adipose-liver (A-L) systems and allowed to recover in hBMM for
16-24 hours before being dosed with BMM conditions +/- TMAO or Butyrate for 13-14 days.
HoaC Systems
A two-organ HoaC system was used to model NAFLD in these experiments. The systems
themselves consisted of a top and a bottom gasket between a top and a bottom housing fastened

13
with screws. The housings and gaskets were designed to form two wells for 15mm coverslips
(one for the white adipose tissue (WAT) module and one for the liver module), two access ports,
and a channel connecting the modules and access ports.
Before assembly, the systems were cleaned with 1% tergazyme 48 hours prior to
assembly and all components were sterilized in 70% IPA and dried fully. In response to toxicity
issues, a more thorough cleaning was done by sonicating in 1% tergazyme 3x 30 minutes and in
deionized water 3x 30 minutes followed by sterilization.
To assemble, 1ml of hBMM was added to the bottom housing+gasket. The coverslips
were then transferred to their appropriate wells cell side up. The top housing+gasket was
secured, and the access ports filled with hBMM so that total medium volume was roughly 1.5ml.
The systems were stored on a rocker with a 1° tilt to allow the medium to flow between the
modules.
FIGURE 2: Adipose-Liver Systems Design.
(A) Schematic of the two-organ adipose-liver systems. The systems consist of two access ports, two wells for the
organ modules, and a channel connecting them. (B) The liver and white adipose tissue modules before system
assembly and after 14 days. Images taken at 100X and 200X using a phase microscope. FIGURE 2: Adipose-Liver Systems Design

14
Hepatic Steatosis
To determine the amount of steatosis in each condition, the hepatocytes were stained with
Oil Red O dye as done in the dose response. The coverslips were them imaged at 100X and
200X using a phase microscope. Several 200X images were taken of each condition and then
processed using the image processing software ImageJ [36]. Images were converted to 8-bit, the
threshold was set so that background was removed, and the setting “Watershed” was turned on to
separate particles. The setting “Black Background” under both the “Image>Adjust>Threshold”
and “Process>Binary>Options” tabs was unselected. This produced images which were pixelated
and binary with the red stain in black and the background in white. The %Area of the black in
the images was then recorded. Places of low cell confluency or high debris were avoided for
quantification. %Area was average for each condition and normalized to the Average %Area of
the Healthy control condition.
FIGURE 3: Quantification of Steatosis Using ImageJ.
Hepatic cells stained with Oil Red O were imaged under a phase microscope at 200X. The image processing
software, ImageJ, was used to convert the image into a pixelated, black and white version which could be quantified
by taking the %Area. FIGURE 3: Quantification of Steatosis Using ImageJ
Hepatic Enzyme Activity
The activity of the enzyme CYP3A4 was measured as an indicator of liver function. This
was done with the P450-Glo™ CYP3A4 Assay and Screening System (Promega, V900). In the

15
first reaction of this assay the CYP3A4 enzyme in the hepatocytes metabolizes the Luciferin-IPA
reagent into luciferin. In the second reaction, a luciferase enzyme metabolizes luciferin and
produces light as one of the products.
On the endpoint day of dosing, the hepatocytes were washed with PBS to remove the
phenol red, and were moved to a 24 well plate. 180ul of a 12μM solution of the Lucifern-IPA
diluted in DMEM -phenol red (ThermoFisher, 11054020) was added to each well. After an hour
of incubation, the solution was removed and stored at -20°C. 50μL of each sample, standard, and
blank were added to a white, opaque, 96 well plate. 50μL of the Luciferin Detection Reagent was
added to each well and incubated for 20 minutes in the dark. The luminescence was measured
using a plate reader.
Adipocyte Cytokine Secretion
To determine the effects of the conditions on adipokine secretion, the production of leptin
and adiponectin was measured using an enzyme-linked immunosorbent assay (ELIZA). At day
14, the medium from each condition was collected and stored at -20°C. The Human Leptin
ELISA Kit (Abcam, ab179884) and Human Adiponectin ELISA Kit (Abcam, ab9996) were then
used to assay the collected medium.
Adipocyte Insulin Resistance
The presence, or lack thereof, of GLUT-4 and insulin receptor were used as indications of
insulin resistance. Immunocytochemistry (ICC) was used to measure the presence of these two
markers. On day 14, the adipocyte coverslips were washed with PBS and fixed using 4% PFA
for 10 minutes. After being washed twice more with PBS, the coverslips were incubated in
blocking buffer consisting of PBS + 1% Bovine Serum Albumin (BSA) and 5% Fetal Bovine

16
Serum (FBS) for one hour. Rabbit anti-α-insulin receptor antibody, β subunit (Sigma, 07-724)
was used to detect insulin receptor and mouse anti-GLUT4 antibody (Invitrogen, MA5-17176)
was used for the detection of GLUT-4. A 1:1000 dilution of these antibodies in the blocking
buffer was made and the adipocytes were incubated in this solution overnight at 4°C. They were
then washed with PBS and incubated in the dark for 2 hours at room temperature in a 1:1000
solution of the secondary antibodies, Donkey anti-Mouse IgG Alexa Fluor 488 (Invitrogen,
A21202) and Goat anti-Rabbit IgG Alexa Fluor 568 (Invitrogen, A11036), and the blocking
buffer. They were then washed 3x 5 minutes with PBS and stained with a solution of 4′,6-
diamidino-2-phenylindole (DAPI) for 5 minutes in the dark at room temperature. After another
3x 5 minutes washes with PBS, the coverslips were mounted onto glass slides using ProLong
Diamond Antifade Mountant (Invitrogen, P36970), set to dry in the dark overnight, and stored in
the dark at 4°C until imaged at 200X on a confocal microscope.
To quantify the amount of GLUT-4 and insulin receptor being expressed, the images
were processed using the ImageJ software. The images (in Tiff format) were separated using the
“Images>Stacks>Stacks to Images” setting. The Mean Grey Values of 488 and 568 images
(green and red, GLUT-4 and insulin receptor) were then measured.

17
CHAPTER 5: MONOCULTURE RESULTS
Culture Health
Hepatocytes in the BMM proved to be viable up to 14 days in monoculture. The
exception to this were the hBMMtnf conditions which showed significant cell death. The
conditions using dBMM +/- other factors appeared to have more confluency. This is likely due to
the energy source, glucose, having a higher concentration and thus being more readily available
for the cells in these conditions.
The monoculture hepatocytes dosed with +/- butyrate were cut off at 7 days to better
reflect the+/- butyrate adipose-liver systems. All conditions appeared confluent and healthy at 7
days. The cultures cut off at 7 days appeared to be more confluent than the 14-day cultures.

18
FIGURE 4: Cell Health of Hepatocytes in Monoculture.
(A) MGH hepatocytes were fed for 14 days with hBMM, hBMMtnf, hBMMlipids, dBMM, dBMMtnflipids +/- 10μM
TMAO. The condition dBMM was not included. The cells were imaged at 100X using a phase microscope. (B) MGH
hepatocytes were fed for 14 days with hBMM, hBMMtnf, hBMMlipids, dBMM, dBMMtnflipids +/- 10μM butyrate.
Images were taken at 100X on a phase microscope.
FIGURE 4: Cell Health of Hepatocytes in Monoculture
Adipocytes in the BMM were viable and confluent through 14 days. This was
independent of condition. All conditions also showed proper morphology and stored lipids.
Qualitatively, the hBMMtnf +/- TMAO/Butyrate conditions stored less lipids than the other
conditions, which may speak to the health of the cells.

19
FIGURE 5: Cell Health of Adipocytes in Monoculture.
(A) Adipocytes were fed for 14 days with hBMM, hBMMtnf, hBMMlipids, dBMM, dBMMtnflipids +/- 10μM TMAO.
The cells were imaged at 100X using a phase microscope. (B) Adipocytes were fed for 14 days with hBMM,
hBMMtnf, hBMMlipids, dBMM, dBMMtnflipids +/- 10μM butyrate. Images were taken at 100X on a phase
microscope.
FIGURE 5: Cell Health of Adipocytes in Monoculture
Hepatic Steatosis
As expected, the hBMMlipids, dBMM, and dBMMtnflipids +/- TMAO conditions were
all higher in steatosis than the hBMM +/- TMAO conditions in hepatocyte monoculture when
dosed for 14 days. Because of the poor morphology of the hBMMtnf +/- TMAO conditions, they
were not included in the quantification. Very little change was observed between the -TMAO
and +TMAO conditions and results remain inconclusive at this time.
As expected, the hBMMlipids, dBMM, and dBMMtnflipids +/- Butyrate conditions were
also higher than the hBMM +/- Butyrate conditions in the hepatocytes dosed for 7 days in
20
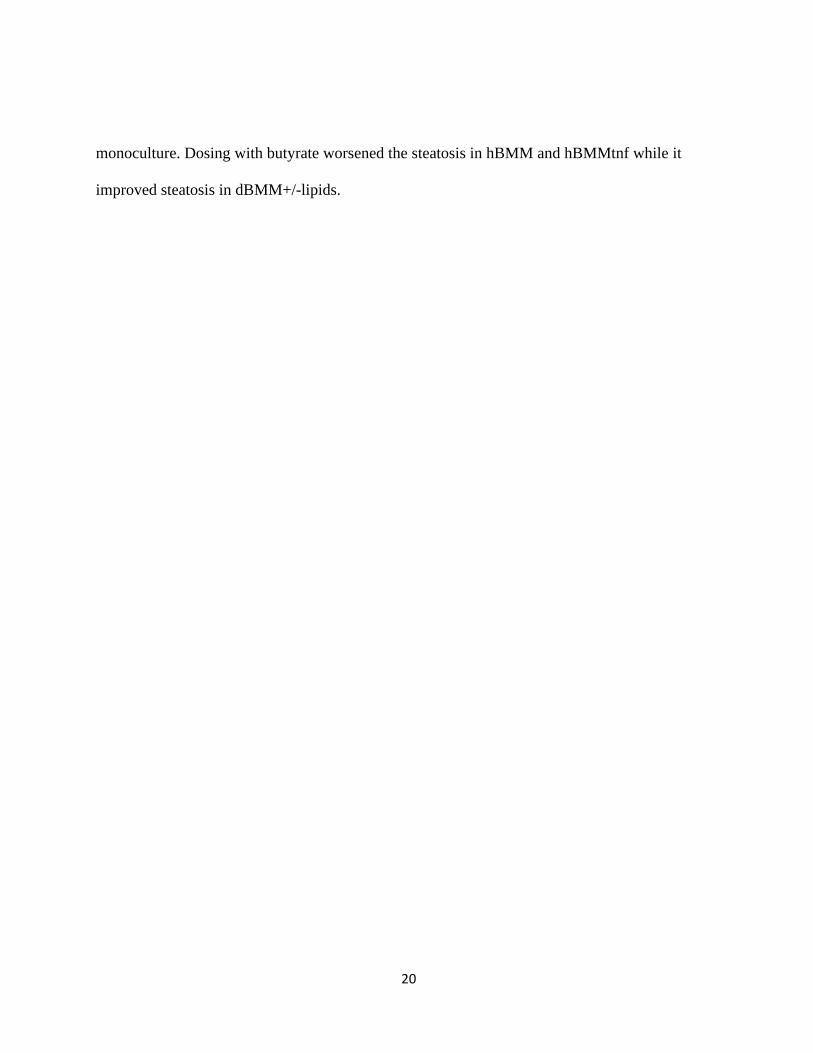
monoculture. Dosing with butyrate worsened the steatosis in hBMM and hBMMtnf while it
improved steatosis in dBMM+/-lipids.
21
FIGURE 6: Steatosis of Hepatocytes in Monoculture.
(A) MGH hepatocytes were fed for 14 days with hBMM, hBMMtnf, hBMMlipids, dBMM, dBMMtnflipids +/- 10μM
TMAO. The condition dBMM was not included. The cells were fixed with 4% PFA and stain with Oil Red O dye. The
cells were imaged at 100X and 200X using a phase microscope. (B) MGH hepatocytes were fed for 14 days with
hBMM, hBMMtnf, hBMMlipids, dBMM, dBMMtnflipids +/- 10μM butyrate. The cells were fixed with 4% PFA and
stain with Oil Red O dye. Images were taken at 100X and 200X on a phase microscope. (C) The steatosis expressed
in monoculture hepatocytes +/- TMAO was quantified by taking the %Area of the 200X images using the ImageJ
software. The %Area was normalized to the hBMM control. N=1 for all conditions except hBMMtnf +/- TMAO and
dBMM which were not included. (D) The steatosis expressed in monoculture hepatocytes +/- Butyrate was
quantified by taking the %Area of the 200X images using the ImageJ software. The %Area was normalized to the
hBMM control. N=1 for all conditions.
FIGURE 6: Steatosis of Hepatocytes in Monoculture

22
Hepatic Enzyme Activity
The most prominent result from the CYP3A4 assay was that the conditions with +TNF
had almost no activity. In the conditions of hBMMtnf +/- TMAO, this was not surprising
considering the poor health of the cells, but this result was seen in the other +TNF conditions as
well. In the +/-TMAO cultures which were taken to 14 days, the hBMMlipids and dBMM +/-
TMAO were higher than the hBMM conditions, while the +/- Butyrate conditions, which were
cultured for 7 days, demonstrated the opposite pattern. It is also uncertain why the activity of the
+/- Butyrate monocultures had such higher activity levels than any other culture with as high as
60-fold+ more activity.
FIGURE 7: CYP3A4 Activity of Hepatocytes in Monoculture.
(A) Hepatocytes were fed for 14 days with hBMM, hBMMtnf, hBMMlipids, dBMM, dBMMtnflipids +/- 10μM
TMAO. On day 14, the CYP3A4 activity of the cultures was measured. N=1 for all conditions except dBMM which
was not included. (B) Hepatocytes were fed for 7 days with hBMM, hBMMtnf, hBMMlipids, dBMM, dBMMtnflipids
+/- 10μM Butyrate. On day 7, the CYP3A4 activity of the cultures was measured. N=1 for all conditions.
FIGURE 7: CYP3A4 Activity of Hepatocytes in Monoculture
Adipocyte Cytokine Secretion and Insulin Resistance
Limited patterns were observed regarding the secretion of leptin and adiponectin in
monoculture. Additional replicates are needed. GLUT-4 and insulin receptor expression was
increased with the dosing of TMAO in monoculture in most conditions. The opposite was
observed for butyrate which appeared to lower GLUT-4 and insulin receptor expression. In

23
monoculture the expression of GLUT-4 and insulin receptor was increased in the more diseased
states when compared to hBMM control.
FIGURE 8: Adipocyte Secretion of Cytokines in Monoculture.
(A) Adipocytes were fed for 14 days with hBMM, hBMMtnf, hBMMlipids, dBMM, dBMMtnflipids +/- 10μM TMAO.
On day 14, the concentration of Leptin of the culture supernatant was measured. N=1 for all conditions. (B)
Adipocytes were fed for 14 days with hBMM, hBMMtnf, hBMMlipids, dBMM, dBMMtnflipids +/- 10μM TMAO. On
day 14, the concentration of Adiponectin of the culture supernatant was measured. N=1 for all conditions. (C)
Adipocytes were fed for 14 days with hBMM, hBMMtnf, hBMMlipids, dBMM, dBMMtnflipids +/- 10μM Butyrate.
On day 14, the concentration of Leptin of the culture supernatant was measured. N=1 for all conditions except
dBMMtnflipids+Butyrate, which was not included. (D) Adipocytes were fed for 14 days with hBMM, hBMMtnf,
hBMMlipids, dBMM, dBMMtnflipids +/- 10μM Butyrate. On day 14, the concentration of Adiponectin of the culture
supernatant was measured. N=1 for all conditions except dBMMtnflipids+Butyrate, which was not included.
FIGURE 8: Adipocyte Secretion of Cytokine in Monoculture

24
FIGURE 9: Expression of GLUT-4 and Insulin Receptor in Monoculture
(A) Adipocytes were fed for 14 days with hBMM, hBMMtnf, hBMMlipids, dBMM, dBMMtnflipids +/- 10μM TMAO.
On day 14, the cells were fixed with 4% PFA. Antibodies were used to fluorescently stain for insulin receptor (red)
and GLUT-4 (green). Images at 200X were taken using a confocal microscope. N=1 for all conditions. (B)
Adipocytes were fed for 14 days with hBMM, hBMMtnf, hBMMlipids, dBMM, dBMMtnflipids +/- 10μM Butyrate.
On day 14, the cells were fixed with 4% PFA. Antibodies were used to fluorescently stain for insulin receptor (red)
and GLUT-4 (green). Images at 200X were taken using a confocal microscope. N=1 for all conditions. (C) The
mean grey values of the +/- TMAO images were measured and normalized to hBMM control. (D) The mean grey
values of the +/- Butyrate images were measured and normalized to hBMM control.
FIGURE 9: Expression of GLUT-4 and Insulin Receptor in Monoculture

25
CHAPTER 6: HOAC SYSTEM RESULTS
Culture Health
The MGH hepatocytes in the adipose-liver systems dosed with +/- TMAO were confluent
and appeared healthy through 14 days. The adipocytes in the adipose-liver systems dosed with
+/- TMAO for 14 days also appeared confluent and healthy. The adipocytes also demonstrated
correct morphology, storing lipids. This was true of all three replicates.
FIGURE 10: Cell Health of Adipose-Liver Systems, TMAO
(A) Adipose-liver systems were fed for 14 days with hBMM, hBMMtnf, hBMMlipids, dBMM, dBMMtnflipids +/-
10μM TMAO. The liver module, containing MGH hepatocytes, was imaged at 100X using a phase microscope. (B)
Adipose-liver systems were fed for 14 days with hBMM, hBMMtnf, hBMMlipids, dBMM, dBMMtnflipids +/- 10μM
TMAO. The WAT module, containing adipocytes, was imaged at 100X using a phase microscope.
FIGURE 10: Cell Health of Adipose-Liver Systems, TMAO The MGH hepatocytes of the adipose-liver systems dosed with +/- Butyrate were
confluent through the endpoint of 7 days. The confluency and health of the cells did appear to

26
start to decline as day 7 approached. This can be seen most in conditions hBMMtnf and dBMM.
The adipocytes of the adipose-liver systems +/- Butyrate were confluent but were not expressing
the proper morphology of storing lipids. This suggests that the adipocytes did not differentiate
properly for these systems.
The adipose-liver systems +/- Butyrate were cut off at 7 days after previous systems
showed signs of toxicity disallowing the hepatocytes to be viable through the 14-day mark.
Precautions and extra measures of additional cleaning, medium being remade, and similar efforts
were taken to ensure the best health of the cells. The toxicity which was apparent in the previous
batches was independent of any factor including butyrate.

27
FIGURE 11: Cell Health of Adipose-Liver Systems, Butyrate.
(A) Adipose-liver systems were fed for 7 days with hBMM, hBMMtnf, hBMMlipids, dBMM, dBMMtnflipids +/-
10μM Butyrate. The liver module, containing MGH hepatocytes, was imaged at 100X using a phase microscope. (B)
Adipose-liver systems were fed for 7 days with hBMM, hBMMtnf, hBMMlipids, dBMM, dBMMtnflipids +/- 10μM
Butyrate. The WAT module, containing adipocytes, was imaged at 100X using a phase microscope. FIGURE 11: Cell Health of Adipose-Liver Systems, Butyrate
Hepatic Steatosis
The MGH hepatocytes in the adipose-liver systems expressed a higher level of steatosis
in the hBMMlipids, dBMM, and dBMMtnflipids +/- TMAO conditions than the hBMM +/-
TMAO. Additionally, steatosis appeared to worsen with TMAO dosing in all conditions
excluding dBMM +/- TMAO.

28
The hepatocytes in the adipose-liver systems +/- Butyrate expressed worsened steatosis in
all conditions compared to the hBMM control through day 7. Butyrate also appeared to improve
steatosis in all conditions except for hBMM.

29
FIGURE 12: Steatosis of Hepatocytes in Adipose-Liver Systems.
(A) Adipose-liver systems were fed for 14 days with hBMM, hBMMtnf, hBMMlipids, dBMM, dBMMtnflipids +/-
10μM TMAO. The liver module, containing MGH hepatocytes, was fixed with 4% PFA and stain with Oil Red O
dye. The cells were imaged at 100X and 200X using a phase microscope. (B) Adipose-liver systems were fed for 7
days with hBMM, hBMMtnf, hBMMlipids, dBMM, dBMMtnflipids +/- 10μM butyrate. The liver module, containing
MGH hepatocytes, was fixed with 4% PFA and stain with Oil Red O dye. Images were taken at 100X and 200X on a
phase microscope. (C) The steatosis expressed in the liver modules +/- TMAO was quantified by taking the %Area
of the 200X images using the ImageJ software. The %Area was normalized to the hBMM control. N=3 for all
conditions. (D) The steatosis expressed in monoculture hepatocytes +/- Butyrate was quantified by taking the %Area
of the 200X images using the ImageJ software. The %Area was normalized to the hBMM control. N=1 for all
conditions.
FIGURE 12: Steatosis of Hepatocytes in Adipose-Liver Systems
30
Hepatic Enzyme Activity
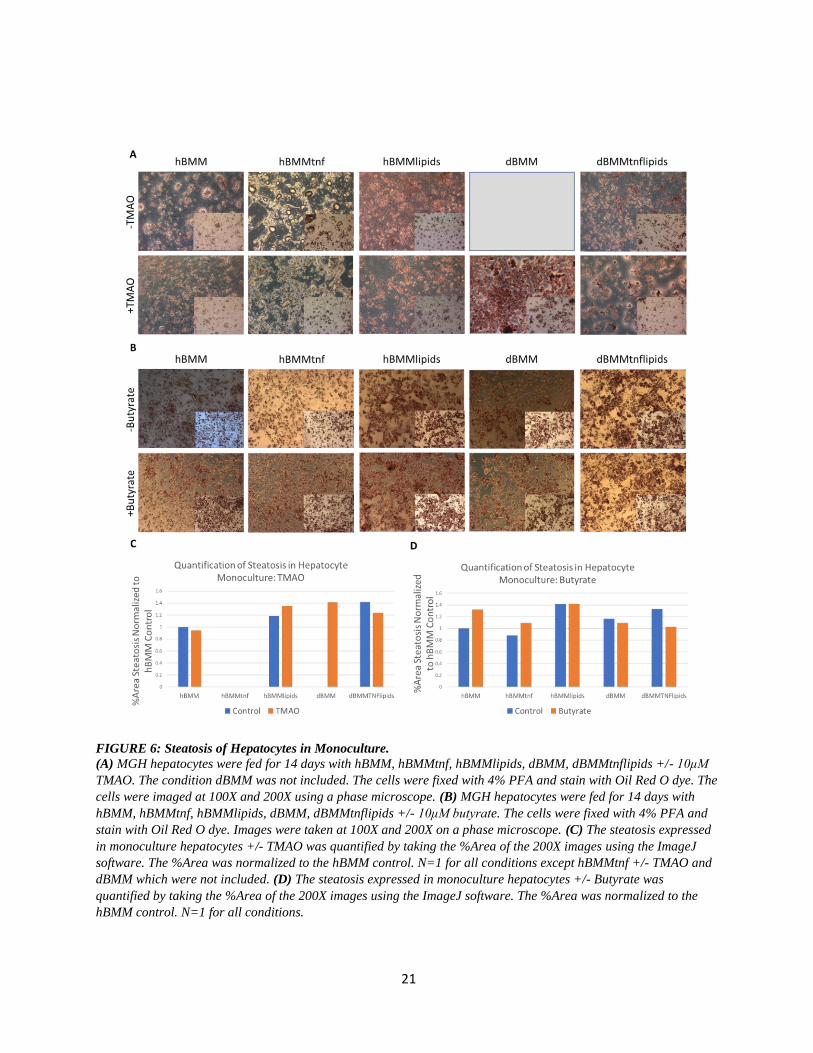
As was seen in monoculture, the MGH hepatocytes in the adipose-liver systems +/-
TMAO did not show any CYP3A4 activity in +TNF conditions when measured at 14 days.
Additionally, the dBMM +/- TMAO conditions had more activity than the rest. +TMAO
conditions impaired CYP3A4 activity in all conditions. The hepatocytes from the adipose-liver
systems +/- Butyrate showed limited CYP3A4 activity on day 7. In conditions that had activity,
butyrate appeared to increase activity compared to controls.
FIGURE 13: CYP3A4 Activity of Hepatocytes in Adipose-Liver Systems.
(A) Adipose-liver systems were fed for 14 days with hBMM, hBMMtnf, hBMMlipids, dBMM, dBMMtnflipids +/-
10μM TMAO. On day 14, the liver module was moved to a 24 well plate and the CYP3A4 activity of the hepatocytes
was measured. N=3 for all conditions. (B) Adipose-liver systems were fed for 7 days with hBMM, hBMMtnf,
hBMMlipids, dBMM, dBMMtnflipids +/- 10μM Butyrate. On day 7, the liver module was moved to a 24 well plate
and the CYP3A4 activity of the hepatocytes was measured. N=1 for all conditions.
FIGURE 13: CYP3A4 Activity of Hepatocytes in Adipose-Liver Systems
Adipocyte Cytokine Secretion and Insulin Resistance
Dosing with TMAO increased the secretion of leptin in adipose-liver systems in most
conditions. The opposite was observed for adiponectin secretion. The expression of GLUT-4 and
insulin receptor in adipose-liver systems decreased in the conditions hBMMlipids +/- TMAO,
dBMM +/- TMAO, and dBMMtnflipids +/- TMAO compared to hBMM control.

31
FIGURE 14: Adipocyte Secretion of Cytokines in Adipose-Liver Systems.
(A) Adipose-liver systems were fed for 14 days with hBMM, hBMMtnf, hBMMlipids, dBMM, dBMMtnflipids +/-
10μM TMAO. On day 14, the concentration of Leptin of the culture supernatant was measured. N=3 for all
conditions. (B) Adipose-liver systems were fed for 14 days with hBMM, hBMMtnf, hBMMlipids, dBMM,
dBMMtnflipids +/- 10μM TMAO. On day 14, the concentration of Adiponectin of the culture supernatant was
measured. N=3 for all conditions. (C) Adipose-liver systems were fed for 7 days with hBMM, hBMMtnf,
hBMMlipids, dBMM, dBMMtnflipids +/- 10μM Butyrate. On day 7, the concentration of Leptin of the culture
supernatant was measured. N=1 for all conditions. (D) Adipose-liver systems were fed for 7 days with hBMM,
hBMMtnf, hBMMlipids, dBMM, dBMMtnflipids +/- 10μM Butyrate. On day 7, the concentration of Adiponectin of
the culture supernatant was measured. N=1 for all conditions.
FIGURE 14: Adipocyte Secretion of Cytokines in Adipose-Liver Systems
32
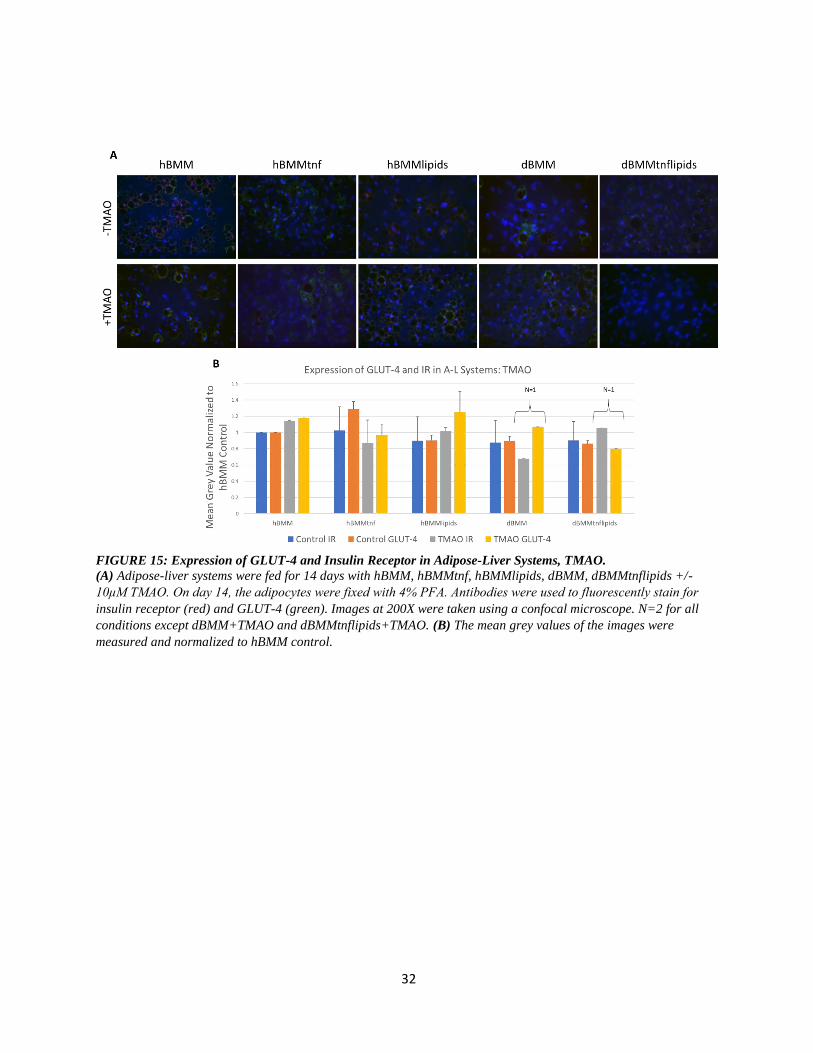
FIGURE 15: Expression of GLUT-4 and Insulin Receptor in Adipose-Liver Systems, TMAO.
(A) Adipose-liver systems were fed for 14 days with hBMM, hBMMtnf, hBMMlipids, dBMM, dBMMtnflipids +/-
10μM TMAO. On day 14, the adipocytes were fixed with 4% PFA. Antibodies were used to fluorescently stain for
insulin receptor (red) and GLUT-4 (green). Images at 200X were taken using a confocal microscope. N=2 for all
conditions except dBMM+TMAO and dBMMtnflipids+TMAO. (B) The mean grey values of the images were
measured and normalized to hBMM control.
FIGURE 15: Expression of GLUT-4 and Insulin Receptor in Adipose-Liver Systems, TMAO

33
CHAPTER 7: DISCUSSION AND CONCLUSION
Adipose-Liver HoaC Systems and NAFLD
A two-organ, adipose-liver, human-on-a-chip, in vitro system was used to create a model
for non-alcoholic fatty liver disease. This was done using defined medium and human cells; the
liver module using primary hepatocytes and the white adipose tissue module using mesenchymal
preadipocyte stem cells. By using this kind of novel system, the effects of disease states, the
influence of peripheral organs, and impacts of drugs and other compounds can be observed under
tightly controlled parameters. Additionally, these systems allow for multiple assays and assay
types to be run on the same system.
The potential and utility of these systems is best seen in the adipose-liver systems +/-
TMAO. These systems yielded relatively consistent data in several different assays. Although
these experiments have not been done in enough replicates to yield statistically significant data at
this point, this data and previous data of the characterization of these two-organ systems suggest
that a higher throughput study with more replications would have success in testing the effects of
various drugs on NAFLD [35].
The main readout for this experiment was the quantification of steatosis. With the
exception of the hBMMtnf +/-TMAO conditions, all conditions displayed higher amounts of
steatosis than the hBMM control (Figure 12). Since the disease states of obesity and diabetes are
correlated with NAFLD, it not surprising that the same would be true in adipose-liver systems. It
is important to note that this trend was seen in not only the adipose-liver systems +/- TMAO, but
in the adipose-liver systems +/- Butyrate and the two monocultures as well (Figures 6, 12).
34
Another important observation is the effect that TNF-α had on the cultures. In the
adipose-liver systems +/- TMAO, the hBMMtnf +/- TMAO stored less lipids than the hBMM
control. Similarly, the dBMMtnflipids +/- TMAO conditions were lower in steatosis than the
dBMM condition, which was unexpected (Figure 12). The most likely explanation for this is that
the TNF-α was causing cell death and thus the cultures themselves were less confluent and so the
overall steatosis was less while the steatosis per cell could have potentially been higher. This
explanation is supported qualitatively by the images and quantitatively by the CYP3A4 activity.
In the +/- TMAO systems, the +/- Butyrate systems, and both monocultures, the hBMMtnf +/-
TMAO/Butyrate and dBMMtnflipids +/- TMAO/Butyrate conditions had almost no CYP3A4
activity (Figures, 7, 13). This indicates that the hepatocytes’ functionality was greatly reduced
when dosed with TNF-α. There are two potential reasons behind this: the first is that the
concentration dosage was too high and thus was toxic to the cells. The other option is that the
TNF- α was causing the hepatocytes to progress in the NAFLD disease spectrum. As was
mentioned before, NAFLD can progress to disease states such as NASH, fibrosis, and eventually
cancer. TNF-α could be causing the damage necessary for the progression to disease states such
as fibrosis which cannot be modeled in this specific HoaC system.
In the CYP3A4 assay, the conditions of dBMM+/- TMAO displayed more activity than
the hBMM control (Figure 13). This was originally unexpected but can be explained by the fact
that the additional glucose, although worsening the steatosis, could be acutely making the cells
more metabolically active.
Although there are some patterns emerging in the quantification of leptin and
adiponectin, with the limited data set, it is difficult to make any conclusions as to the role of the

35
various conditions in adipose health (Figures 8, 14). Similarly, it is not possible at this time to
determine the adipocytes’ role in NAFLD progression in the liver until further monoculture and
adipose-liver system replicates are completed.
In most conditions in the adipose-liver systems, there was less expression of GLUT-4 and
insulin receptor compared to the hBMM control (Figure 15). This is an expected result and
further demonstrates that in the adipose-liver HoaC model the expected phenotypes of NAFLD
can be emulated. The adipose-liver HoaC systems show a promising start to the modeling of
NAFLD. Each batch of these systems can yield a great deal of data. HoaC systems, specifically
the adipose-liver two organ systems, are new and cutting-edge innovations. As with any novel
technology, it is inevitable that there will be hurdles to overcome.
An example of this was the occurrence of toxicity in some of the systems. The reason
why the adipose-liver systems +/-Butyrate were limited to 7 days instead of the intended 14 was
that previous +/-Butyrate systems had some toxicity. The toxicity was remedied by a change in
the cleaning protocol of the housings, but a shorter dosing was used due to time limitations and
to ensure the systems’ success.
The cells themselves offer a challenge. Eukaryotic, specifically human, cells tend to take
a long time to culture and can be difficult to work with. These systems each represent a month,
from the plating of the adipocytes to the disassembly of the systems. In a high throughput,
standardized study, with the human and physical resources to tightly overlap batches, this is not a
significant hurdle. However, this does speak to the limitations of these systems; their
physiological relevance, controlled parameters, and versatility of assays comes with a higher cost
of failure. But it is important to note, that as these systems are used more, with unsuccessful

36
batches occurring periodically, they and their usage will be better characterized and altered
towards a reliable, physiologically relevant, in vitro model for disease which could redefine drug
testing.
The Gut Microbiome’s Role in NAFLD
There were a couple of notable trends observed regarding the gut microbiome’s role in
NAFLD. The first of which was that TMAO does appear to worsen steatosis in the liver in the
adipose-liver systems. This was seen in all conditions except dBMM. The opposite was true of
butyrate which lowered steatosis in the adipose-liver systems in all conditions except hBMM
(Figure 12). These results, that TMAO would increase steatosis while butyrate would decrease it,
were the expected results based on the literature. However, these results were not seen in
monoculture (Figure 6). It is unclear at this time whether this is due to the adipocytes’ influence
in the HoaC systems or if it is due to the limited number of replicates. The hypothesis that
TMAO would worsen disease states was also supported by the CYP3A4 activity. In each
condition, TMAO decreased CYP3A4 activity in the HoaC systems (Figure 13). Butyrate
increased CYP3A4 activity in the adipose-liver systems, which would suggest that butyrate
improves liver function (Figure 13).
As was mentioned previously, although NAFLD is highly correlated with obesity and
type II diabetes, there are still cases of NAFLD in otherwise healthy individuals. The hypothesis
was thus put forward that a dysbiosis of the gut microbiome could account for this subset of the
population. TMAO’s effects in hBMM adipose-liver systems supports this idea. TMAO in
hBMM adipose-liver systems both increases steatosis and decreases CYP3A4 activity (Figures

37
12, 13). It is thus possible that an increase in choline metabolizing microbiota would induce
NAFLD in otherwise healthy individuals.
Similarly, butyrate increased steatosis in hBMM, in both monoculture and adipose-liver
systems, while decreasing steatosis in most other conditions (Figures 6, 12). If this pattern
continues in additional replicates, it would highlight another potential mechanism by which the
GM can influence NAFLD in otherwise healthy patients. While butyrate’s beneficial anti-
inflammatory properties normally operate to decrease steatosis in disease states, butyrate can
also function as an energy source. If butyrate levels in the liver were increased, due to dysbiosis
or leaky gut syndrome, the liver could end up storing this excess energy source as lipids.
Increased leptin and decreased adiponectin were observed in the hBMMtnf, hBMMlipids,
dBMM conditions when dosed with TMAO in the adipose-liver systems. The opposite was seen
for the hBMM and dBMMtnflipids conditions (Figure 14). It is possible that the change in
cytokine secretion was a response to the stimulus of TMAO by the adipose module to protect the
liver module from the inflammatory properties of TMAO. If this is true, it would highlight
adipocytes protective function in disease progression. Further replicates would allow for this
hypothesis to be more fully explored. At this point, there is not enough data to determine the
effects of the gut microbiome on adipocyte expression of GLUT-4 and insulin receptor.
Further experimentation is necessary to solidify and identify by what mechanisms the
GM may be impacting liver health. Future experiments could take the direction of additional
replicates but could also be expanded to allow an even more holistic model of the GM and
NAFLD. In the current experiments, the cultures were dosed with singular compounds. In future
experiments, supernatant from live bacteria, cultured in different conditions, could be used to

38
dose the systems instead. Colon health and permeability is a major factor in the transport of
compounds to the liver. Therefore, an additional module for the colon would incorporate another
important aspect of NAFLD progression.
Conclusion
Using the HoaC systems, the effects of the gut microbiome have started to be elucidated.
This initial data is supportive of the hypothesis that a dysbiosis of the GM can influence the
pathogenesis of NAFLD. More importantly, these experiments have added to the utility and
development of human-on-a-chip systems. Despite some difficulty in early experiments, the
adipose-liver, two-organ systems have significant potential in the testing of drugs and for the
modeling of disease.

39
REFERENCES 1. Buzzetti, E., M. Pinzani, and E.A. Tsochatzis, The multiple-hit pthogenesis of non-alcoholic fatty
liver disease (NAFLD). Metabolism Clinical and Experimental, 2015. 65: p. 1038-1048. 2. Michelotti, G.A., M.V. Machado, and A.M. Diehl, NAFLD, NASH and liver cancer. Mat. Rev.
Gastroenterol. Hepatol., 2013. 10: p. 656-665. 3. Christopher D, W., et al., Prevalence of nonalcoholic fatty liver disease and nonalcoholic
steatohepatitis among a largely middle-aged population utilizing ultrasound and liver biopsy: A prospective study. Gastroenterology, 2011(140): p. 124-131.
4. Charlton, M.R., et al., Frequency and outcomes of liver transplantation for nonalcoholic steatohepatitis in the United States. Gastroenterology, 2011. 141: p. 1249-1253.
5. Fang, Y.-L., et al., Pathogenesis of non-alcoholic fatty liver disease in children and adolescence: From "two hit theory" to "multiple hit model". World Journal of Gastroenterology, 2018. 24(27): p. 2974-2983.
6. Ferramosca, A. and V. Zara, Modulation of hepatic steatosis by dietary fatty acids. World Journal of Gastroenterology, 2014. 20(7): p. 1746-1755.
7. George, J. and C. Liddle, Nonalcoholic fatty liver disease: pathogenesis and potential for nuclear receptors as therapeutic targets. Molecular Pharmaceutics, 2007. 5: p. 49-59.
8. Tsochatzis, E.A., G.V. Papatheodoridis, and A.J. Archimandritis, Adipokines in nonalcoholic steatohepatitis: from pathogenesis to implications in diagnosis and therapy. Mediators of Inflammation, 2009: p. 1-8.
9. Wullaert, A., et al., Hepatic tumor necrosis factor signaling and nuclear factor-kB: effects on liver homeostasis and beyond. Endocrine Reviews, 2007. 28(4): p. 365-386.
10. Hotamisligil, G.S., Inflammation and metabolic disorders. Nature, 2006. 444: p. 860-867. 11. Zhu, L., R.D. Baker, and S.S. Baker, Gut microbiome and nonalcohoolic fatty liver diseases.
Pediatric Research, 2015. 77: p. 245-511. 12. Sender, R., S. Fuchs, and R. Milo, Are we really vastly outnumbered? Revisiting the ratio of
bacterial to host cells in humans. Cell, 2016. 164: p. 337-340. 13. Grabherr, F., et al., Gut dysfunction and non-alcoholic fatty liver disease. Frontiers in
Endocrinology, 2019. 10. 14. Caspani, G., et al., Gut microbial metabolites in depression: understanding the biochemical
mechanisms. Microbial Cell, 2019. 6. 15. Nie, J., et al., Serum trimethylamine n-oxide concentration is positively associated with first
stroke in hypertensive patients. Stroke, 2018. 49: p. 2021-2028. 16. Duarte, S.M.B., et al., Gut microbiome composition in lean patients with NASH is associated with
liver damage independent of caloric intake: a prospective pilot study. Nutrition, Metabolism & Cardiovascular Diseases, 2018. 38: p. 369-384.
17. Chu, H., B. Williams, and B. Schnabl, Gut microbiota, fatty liver disease, and hepatocellular carcinoma. Liver Research, 2018: p. 1-9.
18. Shen, F., et al., Gut microbiota dysbiosis in patients with non-alcoholic fatty liver disease. Hepatobiliary Pancreat Dis Int, 2017. 16: p. 375-381.
19. Craciuin, S. and E.P. Balskus, Microbial conversion of choline to trimethylamine requires a glycyl radical enzyme. PNAS, 2012. 109: p. 21307-21312.
20. Ridlon, J.M., et al., Bile acids and the gut microbiome. Current Opinion Gastroenterol, 2014. 30(3): p. 332-338.

40
21. Mokhtari, Z., D.L. Gibson, and A. Hekmatdoost, Nonalcoholic fatty liver disease, the gut microbiome, and diet. Adv Nutr, 2017. 8: p. 240-252.
22. Chen, Y.-m., et al., Associations of gut-flora-dependent metabolite trimethylamine-N-oxide, betaine and choline with non-alcoholic fatty liver disease in adults. Scientific Reports, 2016.
23. Koeth, R.A., et al., Intestinal microbiota metabolism of L-carnitine, a nutrient in red meat, promotes atherosclerosis. Nat Med, 2013. 19(5): p. 576-585.
24. Bloemen, J.G., et al., Short chain fatty acids exchange across the gut and liver in humans measured at surgery. Clinical Nutrition, 2009. 28: p. 657-661.
25. Canani, R.B., et al., Potential beneficial effects of butyrate in intestinal and extraintestinal diseases. Gastroenterology, 2011. 17(12): p. 1519-1528.
26. Gao, Z., et al., Butyrate improves insulin sensitivity and increases energy expenditure in mice. Diabetes, 2009. 56: p. 1509-1517.
27. Akhtar, A., The flaws and human harms of animal experimentation. Cambridge Quarterly of Healthcare Ethics, 2015. 24: p. 407-419.
28. Meer, P.J.K.c., M.L. Graham, and H.-J. Schuurman, The safety, efficacy and regulatory triangle in drug development: impact for animal models and the use of animals. European Journal of Pharmacology, 2015. 759: p. 3-13.
29. Taylor, K., et al., Estimates for worlwide laboratory animal use in 2005. ATLA, 2008. 36: p. 327-342.
30. Bhatia, S.N. and D.E. Ingber, Microfluidic organs-on-chips. Nature Biotechnology, 2014. 32: p. 760-772.
31. Wang, Y.I., et al., Multiorgan microphysiological systems for drug development: strategies, advances, and challenges. Advanced Healtthcare Materials, 2017. 7.
32. CarlotaOleaga, et al., Multi-organ toxicity demonstration in a functional human in vitro system composed of four organs. Scientific Reports, 2016. 6.
33. Esch, E.W., A. Bahinski, and D. Huh, Organs-on-chips at the frontiers of drug discovery. Nat Rev Drug Discovery, 2015. 14(4): p. 248-260.
34. Moffat, J.G., et al., Opportunities and challenges in phenotypic drug discovery: an industry persective. Nat Rev Drug Discovery, 2017. 16.
35. Slaughter, V., et al., Development and characterization of a two-organ human-on-a-chip NAFLD model, in Integrated Pathways of Disease in NASH and NAFLD. 2019: Santa Fe, New Mexico.
36. Rueden, C.T., et al., ImageJ2: ImageJ for the next generation of scientific image data. BMC Bioinformatics, 2017. 529.