Nomura Initiaties Gold(1)
105
A new era for gold producers Initiating coverage of the European gold sector with a Bullish rating In this Anchor Report, we undertake a detailed analysis of gold market supply/demand fundamentals. We conclude that the gold price should stay elevated with significant upside risks through 2015, translating into a new era for gold producers. A cash build in the producers should drive growth, spur M&A and push dividends higher. This improving outlook has yet to be priced into gold equities, which are trading at historical lows in terms of valuation, offering an attractive entry point given current market instability. We see light at the end of the tunnel for gold equity investors. We initiate coverage of six European gold equities. Our top picks are Randgold Resources, African Barrick Gold and Avocet Mining. Key analysis in this report includes: Proprietary scenario analysis on central bank demand for gold. A review of shifts in the aggregate global gold producer income statement and balance sheet. How this new era translates into stock-specific opportunities within the European gold sector. EQUITY RESEARCH ANCHOR REPORT January 18, 2012 Research analysts European Metals & Mining Tyler Broda, CFA – NIplc [email protected] +44 20 7102 4770 Jonathan Wright – NIplc j[email protected] +44 20 7102 7326 David Radclyffe – NIplc [email protected] +44 20 7102 8434 Juho Lahdenpera, CFA – NIplc j[email protected] +44 20 7102 7450 Patrick Jones – NIplc [email protected] +44 20 7102 5486 Neil Sampat – NIplc [email protected] +44 20 7102 1871 Ashraf Khan [email protected] +91 22 3053 3231 Industry specialist Matthew Kates [email protected] +44 20 7103 1402 See Appendix A-1 for analyst certification, important disclosures and the status of non-US analysts.
-
Upload
sovereign01 -
Category
Documents
-
view
203 -
download
8
Transcript of Nomura Initiaties Gold(1)

A new era for gold producers
Initiating coverage of the European gold sector with a Bullish rating
In this Anchor Report, we undertake a detailed analysis of gold market supply/demand fundamentals. We conclude that the gold price should stay elevated with significant upside risks through 2015, translating into a new era for gold producers. A cash build in the producers should drive growth, spur M&A and push dividends higher. This improving outlook has yet to be priced into gold equities, which are trading at historical lows in terms of valuation, offering an attractive entry point given current market instability. We see light at the end of the tunnel for gold equity investors. We initiate coverage of six European gold equities. Our top picks are Randgold Resources, African Barrick Gold and Avocet Mining.
Key analysis in this report includes:
Proprietary scenario analysis on central bank demand for gold.
A review of shifts in the aggregate global gold producer income statement and balance sheet.
How this new era translates into stock-specific opportunities within the European gold sector.
EQUITY RESEARCH
AN
CH
OR
RE
PO
RT
January 18, 2012
Research analysts
European Metals & Mining
Tyler Broda, CFA – NIplc [email protected] +44 20 7102 4770
Jonathan Wright – NIplc [email protected] +44 20 7102 7326
David Radclyffe – NIplc [email protected] +44 20 7102 8434
Juho Lahdenpera, CFA – NIplc [email protected] +44 20 7102 7450
Patrick Jones – NIplc [email protected] +44 20 7102 5486
Neil Sampat – NIplc [email protected] +44 20 7102 1871
Ashraf Khan [email protected] +91 22 3053 3231
Industry specialist
Matthew Kates [email protected] +44 20 7103 1402
See Appendix A-1 for analyst certification, important disclosures and the status of non-US analysts.
European Gold Sector Initiation
EUROPEAN METALS & MINING
EQ U I T Y R E S E A RC H
ANCHOR REPORT: A new era for gold producers
Cash build to usher in a new era for gold equities
January 18, 2012
Sector view Remains Bullish
Gold prices to stay elevated for longer Gold prices have risen substantially over the past 10 years. Market expectations of future price movements are extremely varied at the moment as multiple uncertainties in the global financial system provide the potential for large swings in demand. Our analysis suggests that gold prices are well supported at current levels as paradigm shifts in central bank and investment demand alongside constrained supply are likely to provide elevated prices beyond 2014.
High profitability to persist for gold equities Importantly for gold equities, high levels of profitability are likely to be sustained. The resultant cash build within the global gold equity balance sheet is likely to usher in a new era for the gold equities as increased dividends, higher valuations for growth potential and valuation tension from an expected pickup in M&A provide the basis for a rally in the gold mining sector.
Gold equities look attractive in current equity market Gold equities have underperformed gold bullion over the past five years. Sector P/E and EV/EBITDA ratios are near 20-year lows. We believe this is about to change. Increasing market expectations of higher longer-term gold price forecasts, cash margins above USD 1,300/oz and a 15% average 2013 free cash flow yield for the companies analysed herein should increase investor interest in the sector. This new era of elevated profitability and cash flow should see gold equities outperform gold bullion once again.
Top picks: Randgold Resources, African Barrick Gold & Avocet Mining Our recommendations are built around these emerging themes. The European gold equity sector consists of generally smaller companies and is an eclectic group from a global perspective; however, we believe there are some intriguing opportunities. Our top picks included in this report are: • Randgold Resources (RRS, Buy, 9,850p TP), in our view, offers the best
exposure to diversified growth and the purest exposure to the gold price of the companies included in this report.
• African Barrick Gold (ABG, Buy, 750p TP) is likely to see its very significant cash build continue, and we believe the shares possess an as-yet-unpriced strategic optionality within its strong balance sheet.
• Avocet Mining (AVM, Buy, 310p TP) has a significant medium-term growth profile and catalysts, and could benefit from increasing M&A activity in the sector.
Research analysts
European Metals & Mining
Tyler Broda, CFA - NIplc [email protected] +44 20 7102 4770
Jonathan Wright - NIplc [email protected] +44 20 7102 7326
David Radclyffe - NIplc [email protected] +61 2 8062 8434
Juho Lahdenpera, CFA - NIplc [email protected] +44 20 7102 7450
Patrick Jones - NIplc [email protected] +44 20 7102 5486
Neil Sampat - NIplc [email protected] +44 20 7102 1808
Industry specialist
Matthew Kates - NIplc [email protected] +44 20 7103 1402
See Appendix A-1 for analyst certification, important disclosures and the status of non-US analysts.

Nomura | European Gold Sector Initiation January 18, 2012
2
Contents
3 Executive summary
5 Company summaries
8 A longer-term perspective on gold
11 Forecast gold prices
12 Supply
17 Demand
25 A new era for gold equities
30 European sector review
34 RRS – Randgold Resources (Buy, 9,850p TP)
44 AVM – Avocet Mining (Buy, 310p TP)
52 ABG – African Barrick Gold (Buy, 750p TP)
64 CEY – Centamin (Neutral, 120p TP)
72 POG – Petropavlovsk (Reduce, 860p TP)
82 POLY – Polymetal International (Reduce, 1,400p TP)
92 SA US – Seabridge Gold (Buy, USD 31.80 TP)
101 Appendix A-1
Research analysts
European Metals & Mining
Tyler Broda, CFA - NIplc [email protected] +44 20 7102 4770
Jonathan Wright - NIplc [email protected] +44 20 7102 7326
David Radclyffe - NIplc [email protected] +61 2 8062 8434
Juho Lahdenpera, CFA - NIplc [email protected] +44 20 7102 7450
Patrick Jones - NIplc [email protected] +44 20 7102 5486
Neil Sampat - NIplc [email protected] +44 20 7102 1808
Industry specialist
Matthew Kates - NIplc [email protected] +44 20 7103 1402

Nomura | European Gold Sector Initiation January 18, 2012
3
Executive summary Our Bullish sector view is built on three key premises.
The current gold price is well supported and should continue to rise in the medium term
Secular Asian demand growth, low and/or negative real interest rates, increasing central bank demand and potential increases in investment sentiment indicate that demand levels will grow. On the supply side, a lack of flexibility in near-term mine supply and a levelling off of scrap gold supply is likely to continue to put upward pressure on the spot gold price.
Our proprietary analysis suggests that central bank demand has the potential to grow from virtually nothing to nearly half of the level currently seen by jewellery (which accounts for 40% of the market). This, in conjunction with a potential wider shift in asset allocation to gold, could see gold prices de-anchoring from current levels. We have used relatively conservative gold demand forecasts in our overall estimates, leaving the gold price with significant upside risk, in our view.
Our gold price forecasts remain near 2012 consensus at USD 1,788/oz, and slightly above 2013 consensus at USD 2,063/oz. Importantly for the gold equities, we expect the gold price to stay above 2010 levels through 2015 and expect long-term equilibrium prices of USD 1,200/oz.
The strong gold price will likely result in a period of rapid EBITDA growth and cash build for the miners
The aggregate industry EBITDA (based on the DS World Gold Mining Index) is set to reach USD 60bn by 2013 compared with the roughly USD 10bn generated in each of the years between 2006 and 2009. This should translate into increasing cash balances for producers. We expect dividends to grow, new expansion projects to progress and M&A activity to also increase sharply. Net debt levels are already low (only two of the seven companies in our coverage universe have net debt positions).
Cash heavy balance sheets have important implications for the sector. As seen in the case of Eldorado Gold Corporation’s recent bid for European Goldfields, M&A activity, especially for growth ounces, is likely to increase, in our view. All of the companies in this report are in a position to benefit from this trend either as acquirers, acquirees or both.
Gold equity valuations are at historical lows
Despite increased profitability and improved balance sheets, gold equities have underperformed gold bullion since 2006 and are trading near 20-year lows in terms of P/E and EV/EBITDA multiples. Even without recovery in sector multiples, the rapid EBITDA growth to c. USD 60bn a year by 2013E (2011: c. USD 30bn), would imply a significant increase in the enterprise value of gold equities over the next two years.
The producers have failed to participate in the recent gold price rally, with gold increasing by 9% in 2011 as global gold equities fell by c.20%. The global gold P/Es have averaged 23x since 2000, whereas the stocks now trade below a 2012E P/E of 15x, providing space for valuation uplift.
The current sector dividend yield is 1.0% and in recent years a number of companies have announced new dividend policies. Assuming yields remain at current levels, FY13E consensus dividends imply a global market capitalisation approaching USD 500bn or nearly 50% upside potential.
On a P/NAV basis, all of our stocks, with the exception of Randgold, trade at below 1.0x (at spot gold prices). We calculate an average implied price of USD 1,488/oz. This implies that investors are not yet pricing in the full potential for gold prices to stay stronger for longer.
We forecast gold producers to achieve record levels of EBITDA and net cash
Cash balances are likely to translate into greater M&A activity and higher dividends, increasing equity valuations
Valuations remain low, despite the high gold price and the related earnings uplift
P/NAV multiples imply value at current spot prices
We expect diversified demand drivers to support the gold price

Nomura | European Gold Sector Initiation January 18, 2012
4
Fig. 1: Forecast gold price Consensus gold expectations are varied
Source: Bloomberg, Nomura research
Fig. 2: Historical and consensus EBITDA and net debt Gold producers are set for a period of rising EBITDA and rising cash levels
Source: Datastream
Fig. 3: Price to NAV On average, the equities are trading at 0.8x based on the spot gold price and all except Randgold trade below 1.0x
Source: Nomura estimates, using a 5% discount rate and spot gold prices of USD 1,640/oz
500
1,000
1,500
2,000
2,500
3,000
3,500
2012e 2013e 2014e 2015e
Nomura High Mean Low
Gol
dpr
ice
(USD
/oz)
-10,000
0
10,000
20,000
30,000
40,000
50,000
60,000
70,000
Q1
2000
Q3
2000
Q1
2001
Q3
2001
Q1
2002
Q3
2002
Q1
2003
Q3
2003
Q1
2004
Q3
2004
Q1
2005
Q3
2005
Q1
2006
Q3
2006
Q1
2007
Q3
2007
Q1
2008
Q3
2008
Q1
2009
Q3
2009
Q1
2010
Q3
2010
Q1
2011
Q3
2011
Q1
2012
Q3
2012
Q1
2013
Q3
2013
Net debt EBITDA ($m)
$m
0.0x
0.2x
0.4x
0.6x
0.8x
1.0x
1.2x
1.4x
1.6x
1.8x
Centamin Af rican Barrick Gold
Avocet Mining Petropavlovsk Polymetal Randgold Resources
P/NAV
Nomura gold price forecasts are roughly in line with consensus in each of the next four years
Forecast gold prices would push global sector EBITDA to USD 60bn by FY13E, with a related build in net cash
Even given the recent fall in the price of gold, the London-based producers (with the exception of Randgold) are still trading at a discount to NAV; given the potential upside to the current gold price, the miners provide excellent value, in our view

Nomura | European Gold Sector Initiation January 18, 2012
5
Company summaries We see upside potential from current levels for all of the gold companies included in this report. In our view, the increasingly compelling macro outlook for gold should provide outperformance for gold equities as compared with the wider market. We see average upside potential of 42% in our universe. Nomura uses a relative rating system, therefore we have attempted to balance our ratings between those with higher upside potential and those with lower upside potential or higher risks. Our top European recommendations include Randgold Resources, African Barrick Gold and Avocet Mining.
Fig. 4: Company summary
Current prices as at close of 16 January 2012. Source: Datastream, Nomura estimates
African Barrick Gold PLC (ABG LN, Buy, TP 750p) Spun out of parent Barrick Gold in 2010, African Barrick Gold is an intermediate gold producer with four gold mines in Tanzania. We estimate that the group produced 697,000oz of gold in 2011 at a cash cost of USD 692/oz. ABG trades at 0.6x our spot gold P/NAV estimates, a valuation which, in our view, is hampered by the continued production disappointments since its IPO.
ABG has an exceptionally strong balance sheet and the group’s strategic optionality does not appear to have been priced into the current share price. We see 2012 as a potentially transformational year for the group as high profitability and further cash generation (we expect a free cash flow yield (FCFY) of 24% for the group by 2013) should increase tension on a current slack market valuation. Nomura initiates on ABG with a Buy rating and a 750p target price, which is equivalent to a P/NAV of 0.8x based on our 2012 exit gold price forecast of USD 1,900/oz.
Avocet Mining PLC (AVM LN, Buy, TP 310p) Now a pure-play West African junior producer, Avocet Mining is turning its full attention to growth both at its current Inata operations in Burkina Faso and its Guinean exploration asset. We expect 2012 to provide continued positive catalysts as the group better defines its growth potential, for which we believe there is significant upside potential.
We forecast that Avocet produced 164,000oz of gold in 2011 at a cash cost of USD 706/oz. The shares underperformed the wider gold equity market in 2011. We believe that the market has yet to price in Avocet’s new exposure to the gold price (following its renegotiation of hedge deliveries) or the potential, as disclosed in the 2011 interim results, to expand Inata once again. Nomura initiates on AVM with a Buy rating and a 310p target price, which is equivalent to a P/NAV of 0.9x based on our 2012 exit gold price forecast of USD 1,900/oz.
Centamin PLC (CEY LN, Neutral, TP 120p) Centamin is a growing junior-intermediate gold producer. It operates the 9.1moz Sukari open-pit and underground mine in southern Egypt. It produced 202,000oz of gold at a forecast cash cost of USD 572/oz in 2011 and our forecasts suggest higher production will result from further plant and mining expansions in 2012.
Centamin’s shares fell by c.50% in 2011 both owing to missed production guidance and to the uncertainty generated by the Egyptian revolution. In addition, the company will begin to see half of the cash flows accrue to the Egyptian government as per the extraction licence, eroding forward EPS growth. The 35% upside potential to the target price reflects the fact that the shares appear to be underpriced and oversold. However, we believe that CEY will maintain higher-than-average risks through the Egyptian election period and as such Nomura initiates on CEY with a Neutral rating. Our 120p 12-month target price is equivalent to 0.5x our 2012 exit gold price forecast of USD 1,900/oz.
Company Ticker Market cap Current price Rating Target price2012e EBITDA
Nomura estimate2012e EBITDA
Consensus median2012e EBITDA
Consensus high/low
Randgold Resources RRS 9,988 7115p Buy 9850p 959 1019 946 - 1344Polymetal P OLY 6,448 1100p Reduce 1400p 1,208 1195 933 - 1472African Barrick Gold ABG 2,904 462p Buy 750p 665 713 613 - 1,066Petropavlovsk P OG 1,952 685p Reduce 860p 570 608 372 - 971Centamin C EY 1,498 89p Neutral 120p 307 310 148 - 362Avocet Mining AVM 654 214p Buy 310p 109 104 75 - 126
Seabridge Gold SA 817 $19.23 Buy $31.80 n/a n/a n/a
In our view, ABG’s valuation is overly hampered by previous production misses
Our analysis indicates that high profitability and significant strategic optionality is not being captured in the current valuation
AVM has an aggressive growth programme
Avocet shareholders have not as yet benefitted from strategic changes in 2011
CEY’s main Sukari asset continues to expand
Egyptian risk and low EPS growth mitigate upside potential from attractive valuation

Nomura | European Gold Sector Initiation January 18, 2012
6
Petropavlovsk PLC (POG, Reduce, TP 860p) Petropavlovsk, a Russian intermediate gold producer, operates four open-pit hard rock gold mines in Russia’s Amur region supported by a promising growth profile. We forecast that POG produced 624,000oz of gold at a cash cost of USD 762/oz in 2011. The main production growth is likely to come from the POX Hub being built at Pokrovskiy. This hub will process refractory ore and should open up a further avenue of growth for POG.
In our view, Petropavlovsk continues to have an attractive valuation and, although the company has made significant progress in rationalising its targets, there remain roadblocks in achieving a full re-rating in 2012, in our view. The relatively high net-debt position, persisting Russian risk discount, the non-precious metal IRC stake and general declining mined grades should continue to place pressure on the P/NAV multiples as the company moves toward commissioning of the POX hub in 2013. Nomura initiates on POG with a Reduce rating and an 860p target price, which is equivalent to 0.7x our 2012 exit gold price forecast of USD 1,900/oz.
Polymetal International (POLY LN, Reduce, TP, 1,400p) New to the FTSE 100 Index, Polymetal is a leading Russian intermediate gold and silver producer. It operates six mining complexes in Russia using a hub approach to rationalise capital costs. Polymetal has one of the leading growth profiles of the London gold equities and provides an interesting split to investors in context of its roughly 50-50 gold/silver exposure. We forecast that it will produce 1,006,000oz of gold equivalent in 2012 at an average cost of USD 752/oz.
Polymetal appears fully priced at the moment, in our view. It has outperformed the sector since its London IPO and now trades on our spot P/NAV estimate of 0.9x. Although there are many positives, including the attractive growth profile, there are many delivery risks that could put this premium rating under pressure in 2012. Nomura initiates on POLY with a Reduce rating and a 1,400p target price, which is equivalent to a P/NAV of 0.9x based on our 2012 exit gold price forecast of USD 1,900/oz.
Randgold Resources (RRS LN, Buy, TP 9,850p) Randgold Resources’ African growth story continues as production at the Loulo/Gounkoto complex increases and the large Kibali open-pit and underground mine in the DRC is built. We forecast that this intermediate gold producer produced 686,000oz at a cash cost of USD 682/oz (excluding royalties) in 2011.
Randgold shares remain the most expensive in the London sector, as the company rates highly on almost all categories including production growth, costs, diversification of risks (both political and operational) and potential, as yet unpriced, NAV growth. Although the shares are relatively expensive, Randgold’s quality means that it is likely to give investors the cleanest exposure to positive sector trends and maintain its multiple. Nomura initiates on RRS with a Buy rating and a 9,850p target price, which is equivalent to 1.7x our 2012 exit gold price forecast of USD 1,900/oz.
Seabridge Gold (SEA CN, Buy, TP USD 31.80) Included in this report is a transfer of coverage update for Seabridge Gold. We maintain the Buy rating and set a USD 31.80, 12-month target price (previously USD 51.00). Seabridge Gold owns and is progressing the massive KSM gold-silver-copper-molybdenum project and the Courageous Lake gold project in Canada.
Seabridge Gold provides perhaps the greatest relative exposure to higher gold prices, in our view. The high expected capex levels for its main projects and its need for a partner to progress these projects see the shares trade on a significant discount to its underlying potential value. As gold prices increase, the probability of these assets being partnered, financed and progressed should increase, reducing the discount in the P/NAV multiple. We anticipate that KSM and Courageous Lake are unlikely to be in production until the end of the decade (at earliest), and there remains significant uncertainty around permitting, financing and development. A discount is, therefore, warranted.
However, investors will be able to gain long-term exposure to our new era for gold equities theme as the Seabridge development story takes place. Our target is based on a 0.4x P/NAV target price using our long-term gold price estimates and we note our valuation is heavily risked for development and financing risks.
The POX hub at Pokrovskiy will account for the main growth from 2013
The attractive valuation will continue to face headwinds, in our view, in 2012
We expect Randgold’s growth to continue
A top-quality company that provides the cleanest exposure for growth-oriented gold equity investors
Although not currently producing, we believe that Seabridge offers substantial upside potential under our forecast gold price
Polymetal is a solid company with strong growth prospects but, in our view, is fully priced
Nom
ura | European G
old Sector Initiation
January 18, 20127
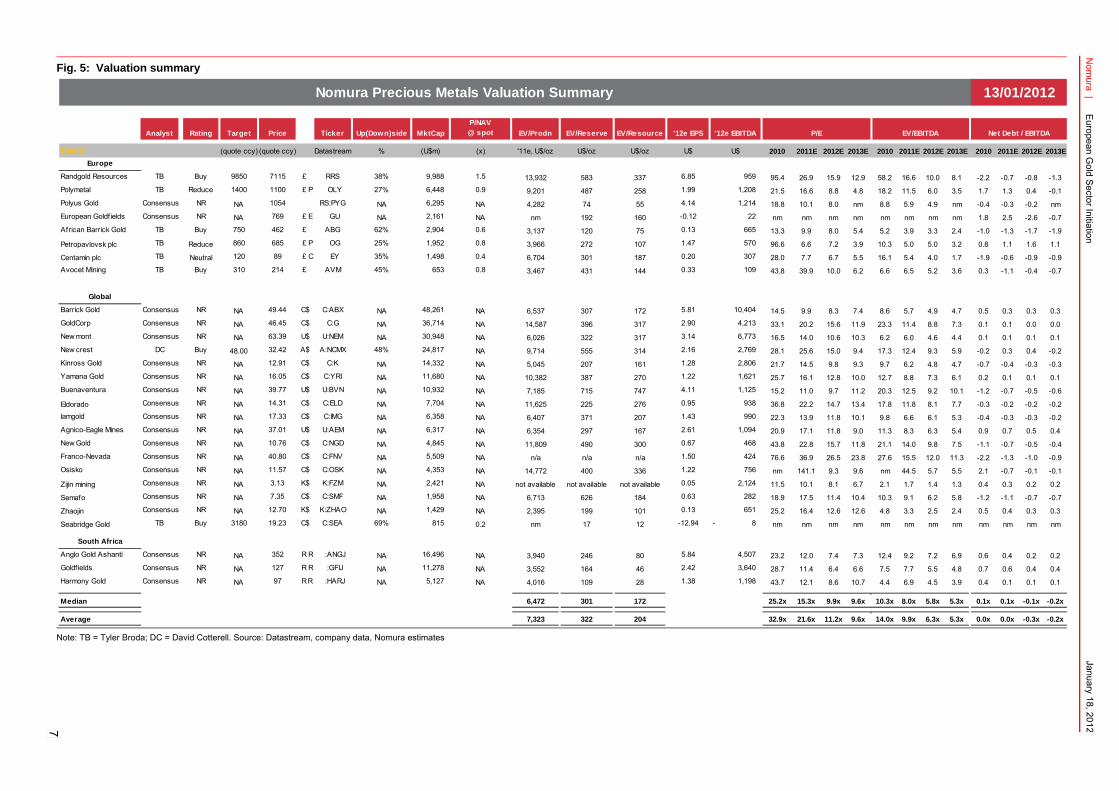
Fig. 5: Valuation summary
Note: TB = Tyler Broda; DC = David Cotterell. Source: Datastream, company data, Nomura estimates
Analyst Rating Target Price Ticker Up(Down)side MktCap
P/NAV@ spot EV/Prodn EV/Reserve EV/Resource '12e EPS '12e EBITDA
Gold (quote ccy) (quote ccy) Datastream % (U$m) (x) '11e, U$/oz U$/oz U$/oz U$ U$ 2010 2011E 2012E 2013E 2010 2011E 2012E 2013E 2010 2011E 2012E 2013E
Europe
Randgold Resources TB Buy 9850 7115 £ RRS 38% 9,988 1.5 13,932 583 337 6.85 959 95.4 26.9 15.9 12.9 58.2 16.6 10.0 8.1 -2.2 -0.7 -0.8 -1.3Polymetal TB Reduce 1400 1100 £ P OLY 27% 6,448 0.9 9,201 487 258 1.99 1,208 21.5 16.6 8.8 4.8 18.2 11.5 6.0 3.5 1.7 1.3 0.4 -0.1Polyus Gold Consensus NR NA 1054 RS:PYG NA 6,295 NA 4,282 74 55 4.14 1,214 18.8 10.1 8.0 nm 8.8 5.9 4.9 nm -0.4 -0.3 -0.2 nmEuropean Goldfields Consensus NR NA 769 £ E GU NA 2,161 NA nm 192 160 -0.12 22 nm nm nm nm nm nm nm nm 1.8 2.5 -2.6 -0.7African Barrick Gold TB Buy 750 462 £ ABG 62% 2,904 0.6 3,137 120 75 0.13 665 13.3 9.9 8.0 5.4 5.2 3.9 3.3 2.4 -1.0 -1.3 -1.7 -1.9
Petropavlovsk plc TB Reduce 860 685 £ P OG 25% 1,952 0.8 3,966 272 107 1.47 570 96.6 6.6 7.2 3.9 10.3 5.0 5.0 3.2 0.8 1.1 1.6 1.1
Centamin plc TB Neutral 120 89 £ C EY 35% 1,498 0.4 6,704 301 187 0.20 307 28.0 7.7 6.7 5.5 16.1 5.4 4.0 1.7 -1.9 -0.6 -0.9 -0.9Avocet Mining TB Buy 310 214 £ AVM 45% 653 0.8 3,467 431 144 0.33 109 43.8 39.9 10.0 6.2 6.6 6.5 5.2 3.6 0.3 -1.1 -0.4 -0.7
Global
Barrick Gold Consensus NR NA 49.44 C$ C:ABX NA 48,261 NA 6,537 307 172 5.81 10,404 14.5 9.9 8.3 7.4 8.6 5.7 4.9 4.7 0.5 0.3 0.3 0.3GoldCorp Consensus NR NA 46.45 C$ C:G NA 36,714 NA 14,587 396 317 2.90 4,213 33.1 20.2 15.6 11.9 23.3 11.4 8.8 7.3 0.1 0.1 0.0 0.0New mont Consensus NR NA 63.39 U$ U:NEM NA 30,948 NA 6,026 322 317 3.14 6,773 16.5 14.0 10.6 10.3 6.2 6.0 4.6 4.4 0.1 0.1 0.1 0.1New crest DC Buy 48.00 32.42 A$ A:NCMX 48% 24,817 NA 9,714 555 314 2.16 2,769 28.1 25.6 15.0 9.4 17.3 12.4 9.3 5.9 -0.2 0.3 0.4 -0.2Kinross Gold Consensus NR NA 12.91 C$ C:K NA 14,332 NA 5,045 207 161 1.28 2,806 21.7 14.5 9.8 9.3 9.7 6.2 4.8 4.7 -0.7 -0.4 -0.3 -0.3Yamana Gold Consensus NR NA 16.05 C$ C:YRI NA 11,680 NA 10,382 387 270 1.22 1,621 25.7 16.1 12.8 10.0 12.7 8.8 7.3 6.1 0.2 0.1 0.1 0.1Buenaventura Consensus NR NA 39.77 U$ U:BVN NA 10,932 NA 7,185 715 747 4.11 1,125 15.2 11.0 9.7 11.2 20.3 12.5 9.2 10.1 -1.2 -0.7 -0.5 -0.6
Eldorado Consensus NR NA 14.31 C$ C:ELD NA 7,704 NA 11,625 225 276 0.95 938 36.8 22.2 14.7 13.4 17.8 11.8 8.1 7.7 -0.3 -0.2 -0.2 -0.2Iamgold Consensus NR NA 17.33 C$ C:IMG NA 6,358 NA 6,407 371 207 1.43 990 22.3 13.9 11.8 10.1 9.8 6.6 6.1 5.3 -0.4 -0.3 -0.3 -0.2Agnico-Eagle Mines Consensus NR NA 37.01 U$ U:AEM NA 6,317 NA 6,354 297 167 2.61 1,094 20.9 17.1 11.8 9.0 11.3 8.3 6.3 5.4 0.9 0.7 0.5 0.4New Gold Consensus NR NA 10.76 C$ C:NGD NA 4,845 NA 11,809 490 300 0.67 468 43.8 22.8 15.7 11.8 21.1 14.0 9.8 7.5 -1.1 -0.7 -0.5 -0.4Franco-Nevada Consensus NR NA 40.80 C$ C:FNV NA 5,509 NA n/a n/a n/a 1.50 424 76.6 36.9 26.5 23.8 27.6 15.5 12.0 11.3 -2.2 -1.3 -1.0 -0.9Osisko Consensus NR NA 11.57 C$ C:OSK NA 4,353 NA 14,772 400 336 1.22 756 nm 141.1 9.3 9.6 nm 44.5 5.7 5.5 2.1 -0.7 -0.1 -0.1
Zijin mining Consensus NR NA 3.13 K$ K:FZM NA 2,421 NA not available not available not available 0.05 2,124 11.5 10.1 8.1 6.7 2.1 1.7 1.4 1.3 0.4 0.3 0.2 0.2
Semafo Consensus NR NA 7.35 C$ C:SMF NA 1,958 NA 6,713 626 184 0.63 282 18.9 17.5 11.4 10.4 10.3 9.1 6.2 5.8 -1.2 -1.1 -0.7 -0.7
Zhaojin Consensus NR NA 12.70 K$ K:ZHAO NA 1,429 NA 2,395 199 101 0.13 651 25.2 16.4 12.6 12.6 4.8 3.3 2.5 2.4 0.5 0.4 0.3 0.3
Seabridge Gold TB Buy 3180 19.23 C$ C:SEA 69% 815 0.2 nm 17 12 -12.94 8- nm nm nm nm nm nm nm nm nm nm nm nm
South Africa
Anglo Gold Ashanti Consensus NR NA 352 R R :ANGJ NA 16,496 NA 3,940 246 80 5.84 4,507 23.2 12.0 7.4 7.3 12.4 9.2 7.2 6.9 0.6 0.4 0.2 0.2Goldfields Consensus NR NA 127 R R :GFIJ NA 11,278 NA 3,552 164 46 2.42 3,640 28.7 11.4 6.4 6.6 7.5 7.7 5.5 4.8 0.7 0.6 0.4 0.4Harmony Gold Consensus NR NA 97 R R :HARJ NA 5,127 NA 4,016 109 28 1.38 1,198 43.7 12.1 8.6 10.7 4.4 6.9 4.5 3.9 0.4 0.1 0.1 0.1
Median 6,472 301 172 25.2x 15.3x 9.9x 9.6x 10.3x 8.0x 5.8x 5.3x 0.1x 0.1x -0.1x -0.2x
Average 7,323 322 204 32.9x 21.6x 11.2x 9.6x 14.0x 9.9x 6.3x 5.3x 0.0x 0.0x -0.3x -0.2x
Nomura Precious Metals Valuation Summary 13/01/2012
P/E EV/EBITDA Net Debt / EBITDA

Nomura | European Gold Sector Initiation January 18, 2012
8
A longer-term perspective on gold Ineffective global governmental and central bank responses to the financial crisis of 2008 and the related sovereign debt crisis are causing investors to rethink some of the fundamental tenets of fiat currency systems. Associated with this, gold’s historical position of importance has the potential to re-emerge, with many important consequences for gold demand.
Gold has occupied a significant, yet constantly evolving place in the history of financial markets. Gold coins were first minted in ancient times, beginning gold’s tradition as the ultimate store of value. The use of gold coins as a mainstream currency persisted until the 16th century when significant discoveries of silver in Latin America saw a dual system develop; with gold and silver competing for use in international and domestic trade. By the early 18th century gold had re-emerged as the de facto monetary standard when Britain set a gold/silver ratio that eventually relegated silver from significant use. By the end of the 19th century most industrial countries adhered to a gold standard.
World War I and its associated pressures on government expenditures saw the gold standard end when major European countries halted the convertibility of their currencies into gold. The gold standard was generally restored in the post-war years; however, this return was short-lived, as leading economies once again suspended convertibility in order to devalue their currencies in response to the Great Depression. The US remained on a gold standard, although the 1934 Gold Reserve Act nationalised private gold holdings and devalued the gold dollar.
The end of World War II saw the implementation of what came to be known as the Bretton Woods system, a two-tiered gold-exchange system where the US dollar was backed by gold and all other currencies were pegged to the dollar. This lasted until 1971 when a combination of short-term pressures alongside the rise of German and Japanese economic power caused US president Richard Nixon to end the gold standard.
Fig. 6: 40-year gold price chart – nominal USD A bull market rally that started almost 10 years ago
Source: Datastream, Nomura research
Fig. 7: US M1 money stock and rate of change The current pace of monetary expansion in the US is near all-time highs
Source: Federal Reserve Bank of St. Louis, Nomura research
It has only been since 1971 that the world has shifted to a sustained, full-faith, fiat currency system. Between 1980 and 2000 the gold price fell as economic prosperity and contained inflation expectations led private investors, institutional investors and central banks away from gold. The 2000s saw gold demand rebound as lower interest rates and strong growth from Asian economies started a bull market that is ongoing today.
Nomura’s Quantitative Research report, Why gold is cheap in Asia, dated 16 August 2011, on why Asian nominal income growth and not US CPI has been the driver of the gold bull market. It provides a crucial perspective shift in understanding that gold has become a global commodity with global demand drivers and has been heavily influenced by Asian economic growth.
0
200
400
600
800
1,000
1,200
1,400
1,600
1,800
2,000
Jan-71 Jan-76 Jan-81 Jan-86 Jan-91 Jan-96 Jan-01 Jan-06 Jan-11
Go
ld p
ric
e (U
S$/o
z)
Gold Bullion LBM U$/Troy Ounce
-0.2%
-0.1%
0.0%
0.1%
0.2%
0.3%
0.4%
0.5%
0
500
1,000
1,500
2,000
2,500
Jan-75 Jan-80 Jan-85 Jan-90 Jan-95 Jan-00 Jan-05 Jan-10
US
M1
mon
ey s
uppl
y (U
S$bn
)
M1 Money Stock 52 wk rolling % weekly increase
The end of the Bretton Wood system in 1971 saw gold-backed currency replaced with a full faith, fiat currency system
The past 40 years have seen a fundamental shift in the nature and location of gold demand

Nomura | European Gold Sector Initiation January 18, 2012
9
Gold has moved in and out of vogue many times over the past 100 years. Figure 6 provides perspective to the drop in gold prices that occurred at the end of 2011. A price correction was arguably overdue, especially in the context of the cyclicality of certain demand segments and the above-trend price increases in mid-2011. That said, our analysis suggests that the forces that have pushed gold up by 480% in the past 10 years are still in force and could well be exacerbated over the medium term.
Gold price appreciation has increased exponentially since the market stabilisation following the initial impact of the 2008 financial crisis. Concerns around the stability of fiat monetary systems in conjunction with exceedingly high sovereign debt levels are leading investors to review alternative stores of value, increasing gold investment demand.
Gold certainly has a long and well-established pedigree when placed in the context of its historical role in financial markets. We expect this re-emergence of gold as an asset class to persist over the medium term even as the world emerges from the sovereign debt crisis and continued shifts in the global economic landscape will see further shifts in reserve currency systems.
This is likely to have important implications for the gold producers. Figure 8 shows global P/E multiples for gold equities remain remarkably constrained despite the shift in gold prices seen over the past 10 years.
Fig. 8: Global P/E for gold equities Gold equities have not followed the gold price in valuation terms
Source: Datastream
The practical constraints of re-implementing a gold standard system after the financial innovations of the past 40 years make a return to a Bretton Woods type system unrealistic, especially when we consider the gold standard’s lack of flexibility in implementing Keynesian or monetarist economic policies. However, it is important in the light of the current fragility of the world’s financial system and the ongoing paradigm shift with regard to the value of fiat currencies, to analyse gold from a broader historical perspective. This time might not be different.
In addition to the paradigm shift questioning faith in fiat currencies and longer-term shifts in world reserve currency systems; from a fundamental perspective, various longer-term trends are supportive of the gold price including:
– secular demand growth from Asia,
– a lack of flexibility in medium-term mine supply growth potential; and
– a shift in emerging market central bank attitudes toward gold as part of reserves.
0
5
10
15
20
25
30
35
40
45
Jan-92 Jul-93 Jan-95 Jul-96 Jan-98 Jul-99 Jan-01 Jul-02 Jan-04 Jul-05 Jan-07 Jul-08 Jan-10 Jul-11
12mth forward PE
We expect that the increase in the gold price since 2008 will persist
Although a return to the gold standard is unrealistic, fiat currencies are under greater scrutiny than ever before

Nomura | European Gold Sector Initiation January 18, 2012
10
Short-term volatility drivers The exogenous risks are likely to favour gold prices, as well, in the context of a limited response from near-term new mine supply. There are a number of factors that could cause gold to trade above our estimates in the short term. These include:
– the perceived threat from elevated inflation expectations from potential further quantitative easing,
– the potential for a lack of alternatives to the eurozone crisis, other than monetisation of debt European Rates Insight: A multiplicity of risk factors into 2012, and
– an increase in investor activity in an era with expected near-zero real interest rates.
The speed of the changing fundamentals within various sub-segment demand categories will no doubt add volatility to the gold price. Current weakness in the Indian rupee has seen Indian gold imports fall sharply. Financial system deleveraging can place pressure on investment demand for gold, which tends to be a larger proportion of demand than for other commodities.
Overall, our analysis suggests that the gold price remains well supported over the medium term, albeit with potentially high volatility from the demand perspective causing wide potential swings.
The gold price could see further, and more profound, spikes in the short term

Nomura | European Gold Sector Initiation January 18, 2012
11
Forecast gold prices We continue to expect increasing gold prices into 2013 as the expected supply response to the higher prices of the past few years underwhelms as compared with the positive structural changes in demand.
Nomura’s gold price forecasts remain near the upper end of the 2012 and 2013 estimate ranges. However, as we have noted above, the supply side is relatively unprepared for future unexpected demand shocks, and this could push the price much further along trend and much higher than we are forecasting in our base-case estimates.
In 2012, we expect the gold price to stabilise following the year-end 2011 sell off as gold continues to attract increased central bank demand, persisting demand growth from Asia (in value terms) and below trend scrap supply growth.
Fig. 9: Nomura long-term gold price forecasts We expect prices above 2010 levels over the longer term
Source: Bloomberg, Nomura estimates
Fig. 10: Consensus gold price forecasts There remain considerable upside risks to our forecast
Source: Bloomberg, Nomura estimates
Fig. 11: Forecast supply and demand model We expect the market to increase in size alongside the higher gold prices, but supply becomes constrained above forecast levels
Source: GFMS, Nomura estimates
0
500
1,000
1,500
2,000
2,500
2007 2008 2009 2010 2011 2012E 2013E 2014E 2015E 2016E 2017E
Historical Nomura forecast
Gol
d p
rice
(US$
/oz)
500
1,000
1,500
2,000
2,500
3,000
3,500
2012e 2013e 2014e 2015e
Nomura High Mean Low
Go
ldpr
ice
(US
D/o
z)
2006 2007 2008 2009 2010 2011E 2012E 2013E
Supply
Mine production 2,481 2,472 2,408 2,581 2,688 2,794 2,988 3,005Net central bank and IMF sales 365 484 235 34 0 0 0 0Scrap gold 1,133 982 1,316 1,695 1,651 1,679 1,949 2,105Hedging 0 0 0 0 0 32 0 0Implied disinvestment 0 0 58 0 0 0 0 0Total supply 3,979 3,938 4,017 4,310 4,339 4,505 4,937 5,111
Demand
Jewellery 2,300 2,423 2,304 1,814 2,035 1,969 2,049 2,037Industrial and other 657 679 718 697 767 809 817 811Net central bank and IMF demand 0 0 0 0 77 336 750 800Physical bar investment 237 244 645 531 859 1,065 953 823Hedging 434 440 350 236 180 0 25 0Implied investment 351 152 0 1,032 421 326 343 639Total Demand 3,979 3,938 4,017 4,310 4,339 4,505 4,937 5,111
The current gold price is supported by Asian secular demand, a shift in central bank attitudes to holding gold and relatively inelastic supply

Nomura | European Gold Sector Initiation January 18, 2012
12
Supply Gold is different from most commodities in the sense that the metal is not normally ‘consumed’ as it is used. Unlike a barrel of oil used in a vehicle or the wheat used to make a loaf of bread, the precious nature of gold, its durability and its store of value characteristics allow significant above ground stocks to exist. According to the World Gold Council, over 165,000 tonnes have been mined in recorded history. The vast majority of this gold is accounted for. This means that supply comes from not only from new mine production and scrap gold, but also from shifts in net demand within multiple categories of ‘consumption’.
The nature of annual global gold supplies has changed over the past decade. Net investment (new investment demand vs. previous investment sold back onto the market), was persistently positive except for a brief period following the initial onset of the financial crisis. Gold exhibits positive tail risk protection as discussed in this note from Nomura FX research Why gold is cheap in Asia.
In 2009, central banks became net buyers of gold for the first time in years, removing traditional sources of gold from the market. Central banks moving from supplying the market to buying gold is a main paradigm shift that is revisited in the demand section below. The end of the most recent IMF gold sales programme of 403 tonnes announced in 2009 has only solidified this trend.
Our analysis suggests these trends will persist over the coming years.
This leaves two main sources of gold supply in the current environment: new mine production and recycled scrap gold (gold that has been returned to the market from selling old jewellery and industrial products).
Mine production has stayed consistent over this period, accounting for 62% of total supply in 2010 as compared with 67% in 2001. Higher prices have seen scrap gold’s contribution to supply increase from 19% of total supply in 2001 to 38% of total supply in 2010 (Fig. 12).
Fig. 12: Gold supply Net central bank selling has stopped, leaving mine production and recycled scrap gold as main sources of supply
Source: GFMS, Nomura research
The ability for gold supply to meet a further demand shock appears limited.
Mine production, after falling for most of the past decade, is increasing once again. However, a lack of new, large-scale mines and the time frame required to find and develop such projects are likely to place a cap on potential new mine supply in the medium term. Higher prices are likely to drive unanticipated extensions to mine lives and this will make certain currently uneconomic resources mineable, but this on the margin, will not shift mine supply substantially in the near term, in our view.
0
1,000
2,000
3,000
4,000
5,000
6,000
2001 2002 2003 2004 2005 2006 2007 2008 2009 2010 2011E 2012E 2013E
Mine production Scrap gold Net central bank and IMF sales Implied disinvestment Hedging
Gol
d (t)
Because it is not normally ‘consumed’, the supply of gold comes from mining, recycling and changes in net demand
Central banks are now net buyers for the first time in years
Although increasing, mining and recycling supply is unlikely to meet additional spikes in demand

Nomura | European Gold Sector Initiation January 18, 2012
13
Scrap gold supply has increased sharply on the back of the higher prices seen at the end of the last decade. However, scrap supply figures in 2010 and 2011 have been lower than expected, weakening a previously strong positive correlation between scrap supply and gold prices. This suggests a potential exhaustion of available stocks or a change in the relative utility of scrap gold from an investment perspective.
Despite the contained nature of the main supply increases, we forecast record aggregate supply levels as higher prices elicit both higher levels of mine supply and scrap material. In our view, however, the supply side from these two main categories is stretched and a supply response would be limited were one of the various demand categories to exceed projections.
Mine production Gold mine production fell steadily last decade. Excluding a late decade surge in production in 2009, production fell by an average of 1% per year during the 2000s. This lost decade was driven by the low prices at the end of the 1990s, which saw structural underinvestment in production capacity and exploration.
Fig. 13: Global new mine supply Peak gold? Production is rising again, but for how long?
Source: Brook Hunt, a Wood Mackenzie company, Nomura research
Fig. 14: Expansion capital expenditure Capital expenditure for expansions has not kept pace with the gold price
Source: Brook Hunt, a Wood Mackenzie company, Nomura research
The gold bull market starting in 2002, which has now seen prices increase by 480%, has shifted the underlying dynamics for new mine supply. The persisting higher gold prices have provided, what Brook Hunt expects to be, a new wave of production.
We have modified the costed Brook Hunt global mine supply forecasts (Fig. 13) to reflect an estimate for global production to 2018. Fig. 13 shows production peaking in 2014 at our adjusted estimate of 3,159 tonnes. It should be noted that this includes all lower probability projects and could be viewed as a best-case estimate.
Brook Hunt notes that capital expenditure for new gold mine production hit a peak of USD 8.5bn in 2008 and has since fallen (Fig. 14). We expect expansion capex to level off at USD 5bn, although we would expect this to increase in conjunction with the stronger balance sheets that are likely to build into 2012. The lack of recent near-term capex begins to feed through after 2014, when production is expected to decline back towards 2011 levels (Brook Hunt), suggesting that a structural medium-term shift in gold demand cannot be met by new gold supply alone.
There is likely to be a response to the higher gold prices that is not captured in the above estimates, and this could be significant in the longer term. High gold prices are likely to increase the economics of previously discovered, but uneconomic deposits, and the expected high margins will make smaller and less scalable operations, like the heap or dump leaching of oxide material, more economic. The other expected outcome is likely to be longer mine lives as current infrastructure is used to process previously uneconomic near-mine deposits. These trends, in conjunction with a potential boom in exploration and higher industry capital expenditure rates could potentially fill future supply gaps. However, this would be a longer-term phenomenon and is dependent on gold prices maintaining or exceeding current prices.
0
500
1,000
1,500
2,000
2,500
3,000
3,500
1999
2000
2001
2002
2003
2004
2005
2006
2007
2008
2009
2010
2011
2012
e
2013
e
2014
e
2015
e
2016
e
2017
e
2018
e
adj possible adj probable adj base case adj operating mines
New
Gol
d m
ine
supp
ly (t
)
0
200
400
600
800
1,000
1,200
1,400
1,600
1,800
0.0
1.0
2.0
3.0
4.0
5.0
6.0
7.0
8.0
9.0
10.0
2000 2001 2002 2003 2004 2005 2006 2007 2008 2009 2010 2011
Capital expenditure Gold price
Glo
bal n
ew m
ine
capi
tal e
xpen
ditu
re
Gold
price USD
/oz
Peak production is 13% higher than current levels
Capital expenditure for growth is falling despite higher gold prices
Longer-term production rates may be better than expected, but this will not alleviate expected medium-term tightness
Gold mine production is increasing after falling for most of the past decade

Nomura | European Gold Sector Initiation January 18, 2012
14
Fig. 15: Global mine production by country, 2000 Africa and North America were leaders a decade ago
Source: GFMS, Nomura research
Fig. 16: Global mine production by country, 2010 Asia and Latin America have seen the most growth
Source: GFMS, Nomura research
Geographical distribution of global gold production has stayed relatively similar on a regional basis over the past decade (Fig. 15, 16), remaining one of the most diversified commodities by production on a geographic basis. Thematically, Asia, Latin America, Russia and Africa (ex-South Africa) have seen increasing production while South Africa, the US and Australia and other developed countries have seen decreasing production (Fig. 17).
Should gold prices remain high, we would expect this trend to persist. Average cash margins for new projects are likely to provide a positive risk/reward outcome despite higher political risks. This is particularly important for the European equity market where African and CIS-based assets constitute a significant part of the assets of the London-listed gold companies.
Fig. 17: Key geographical shifts in gold production 2000-2010 Gold production is slowly shifting away from traditional producer countries.
Source: GFMS, Nomura research
Scrap gold Recycled gold (from consumer consumption, mainly jewellery) accounts for 39% of our 2012 supply expectations. Scrap gold supply has increased markedly since the onset of the 2008 crisis, and this has delivered scrap gold levels ahead of historical averages when compared with gold price changes. However, data from 2010 and 2011 has seen this relationship falter. Fig. 19 shows the relationship between annual gold price changes and aggregate levels of scrap supply. We expect these forecasts to remain below trend in the coming years.
1%
19%
14%
18%
25%
12%
11%
Europe North America Latin America Asia Africa Oceania Former Soviet Union
1%12%
20%
25%
20%
10%
12%
Europe North America Latin America Asia Africa Oceania Former Soviet Union
0
100
200
300
400
500
600
2000 2001 2002 2003 2004 2005 2006 2007 2008 2009 2010Africa ex-South Africa South Africa ChinaUnited States Russia Latin AmericaAustralia
Gol
d pr
oduc
tion
(t)
The European gold mining equity market is skewed towards African and CIS-based assets
Nomura | European Gold Sector Initiation January 18, 2012
15
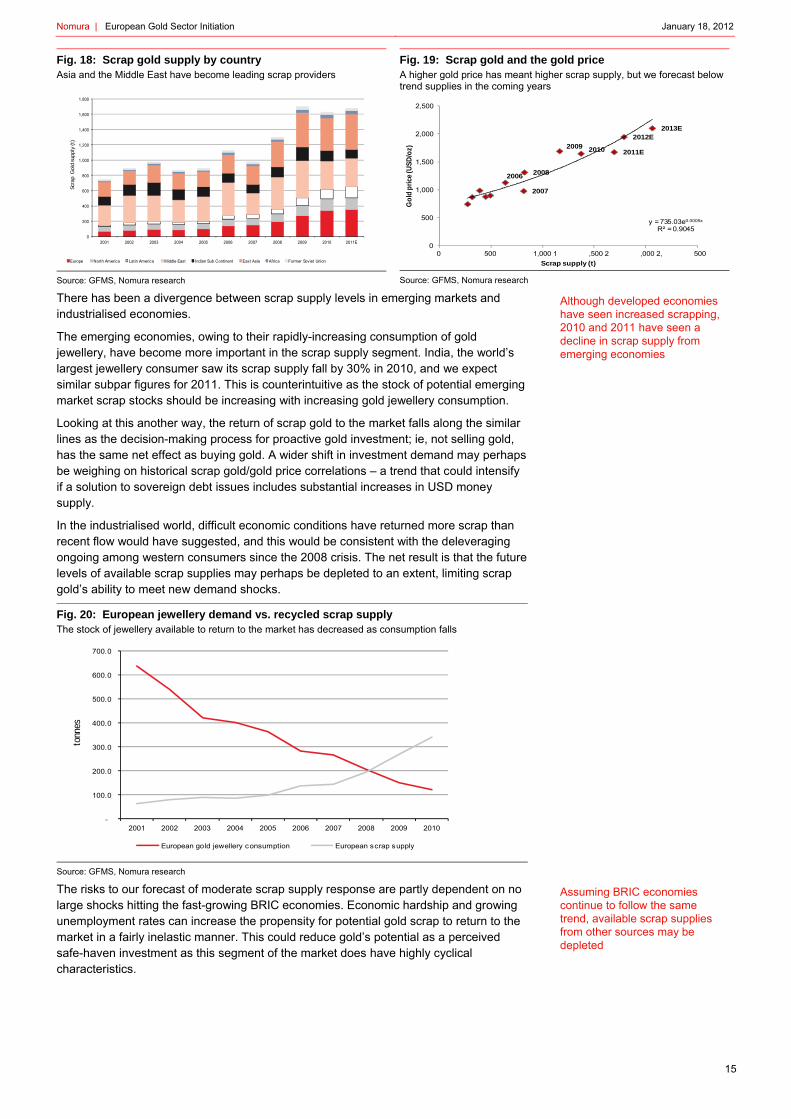
Fig. 18: Scrap gold supply by country Asia and the Middle East have become leading scrap providers
Source: GFMS, Nomura research
Fig. 19: Scrap gold and the gold price A higher gold price has meant higher scrap supply, but we forecast below trend supplies in the coming years
Source: GFMS, Nomura research
There has been a divergence between scrap supply levels in emerging markets and industrialised economies.
The emerging economies, owing to their rapidly-increasing consumption of gold jewellery, have become more important in the scrap supply segment. India, the world’s largest jewellery consumer saw its scrap supply fall by 30% in 2010, and we expect similar subpar figures for 2011. This is counterintuitive as the stock of potential emerging market scrap stocks should be increasing with increasing gold jewellery consumption.
Looking at this another way, the return of scrap gold to the market falls along the similar lines as the decision-making process for proactive gold investment; ie, not selling gold, has the same net effect as buying gold. A wider shift in investment demand may perhaps be weighing on historical scrap gold/gold price correlations – a trend that could intensify if a solution to sovereign debt issues includes substantial increases in USD money supply.
In the industrialised world, difficult economic conditions have returned more scrap than recent flow would have suggested, and this would be consistent with the deleveraging ongoing among western consumers since the 2008 crisis. The net result is that the future levels of available scrap supplies may perhaps be depleted to an extent, limiting scrap gold’s ability to meet new demand shocks.
Fig. 20: European jewellery demand vs. recycled scrap supply The stock of jewellery available to return to the market has decreased as consumption falls
Source: GFMS, Nomura research
The risks to our forecast of moderate scrap supply response are partly dependent on no large shocks hitting the fast-growing BRIC economies. Economic hardship and growing unemployment rates can increase the propensity for potential gold scrap to return to the market in a fairly inelastic manner. This could reduce gold’s potential as a perceived safe-haven investment as this segment of the market does have highly cyclical characteristics.
0
200
400
600
800
1,000
1,200
1,400
1,600
1,800
2001 2002 2003 2004 2005 2006 2007 2008 2009 2010 2011E
Europe North America Latin America Middle East Indian Sub Continent East Asia Africa Former Soviet Union
Scra
p G
old
supp
ly(t
)
2006
2007
2008
2009 2010 2011E
2012E2013E
y = 735.03e0.0005x
R² = 0.9045
0
500
1,000
1,500
2,000
2,500
0 500 1,000 1 ,500 2 ,000 2, 500
Go
ld p
rice
(US
D/o
z)
Scrap supply (t)
-
100.0
200.0
300.0
400.0
500.0
600.0
700.0
2001 2002 2003 2004 2005 2006 2007 2008 2009 2010
European gold jewellery consumption European scrap supply
tonn
es
Although developed economies have seen increased scrapping, 2010 and 2011 have seen a decline in scrap supply from emerging economies
Assuming BRIC economies continue to follow the same trend, available scrap supplies from other sources may be depleted
Nomura | European Gold Sector Initiation January 18, 2012
16
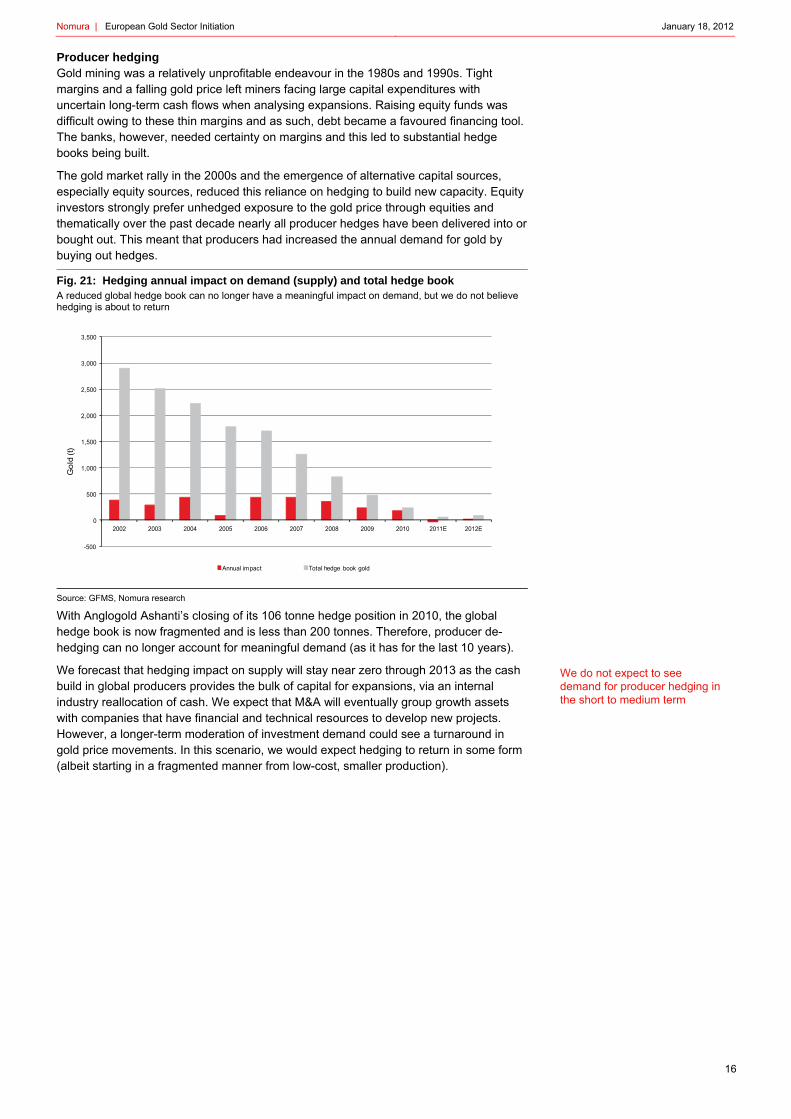
Producer hedging Gold mining was a relatively unprofitable endeavour in the 1980s and 1990s. Tight margins and a falling gold price left miners facing large capital expenditures with uncertain long-term cash flows when analysing expansions. Raising equity funds was difficult owing to these thin margins and as such, debt became a favoured financing tool. The banks, however, needed certainty on margins and this led to substantial hedge books being built.
The gold market rally in the 2000s and the emergence of alternative capital sources, especially equity sources, reduced this reliance on hedging to build new capacity. Equity investors strongly prefer unhedged exposure to the gold price through equities and thematically over the past decade nearly all producer hedges have been delivered into or bought out. This meant that producers had increased the annual demand for gold by buying out hedges.
Fig. 21: Hedging annual impact on demand (supply) and total hedge book A reduced global hedge book can no longer have a meaningful impact on demand, but we do not believe hedging is about to return
Source: GFMS, Nomura research
With Anglogold Ashanti’s closing of its 106 tonne hedge position in 2010, the global hedge book is now fragmented and is less than 200 tonnes. Therefore, producer de-hedging can no longer account for meaningful demand (as it has for the last 10 years).
We forecast that hedging impact on supply will stay near zero through 2013 as the cash build in global producers provides the bulk of capital for expansions, via an internal industry reallocation of cash. We expect that M&A will eventually group growth assets with companies that have financial and technical resources to develop new projects. However, a longer-term moderation of investment demand could see a turnaround in gold price movements. In this scenario, we would expect hedging to return in some form (albeit starting in a fragmented manner from low-cost, smaller production).
-500
0
500
1,000
1,500
2,000
2,500
3,000
3,500
2002 2003 2004 2005 2006 2007 2008 2009 2010 2011E 2012E
Annual impact Total hedge book gold
Gol
d(t)
We do not expect to see demand for producer hedging in the short to medium term

Nomura | European Gold Sector Initiation January 18, 2012
17
Demand Gold demand has increased considerably over the past 10 years in value terms. The market has grown from USD 34bn in 2001 to an estimated USD 240bn in 2011. In total tonnes, however, this growth has been less pronounced; annual gold demand by volume had actually stayed flat until 2009.
Our analysis suggests that demand in total volume terms will meet higher supply resulting from higher prices. Although we forecast there will be more material on the market, on balance, the main demand drivers and their exposure to further exogenous shocks, should leave the price well supported, in our view.
Traditional sources of demand are jewellery, industrial demand (electronics, dental, among others), and physical bar investment. A key change to the market has been the emergence of net central bank buying. Emerging market central banks have been net purchasers of gold since 2008, and the lack of desire to further erode the capital base of central banks have seen sales through the CBGA agreement (Europe) come to an end for the time being. This, in conjunction with a stronger implied investment category, may well push the demand side out of balance with the supply side, resulting in higher prices.
Fig. 22: Segmental gold demand in volume terms The aggregate level of gold demand has stayed constant, but has seen shifts towards investment demand
Source: GFMS, Nomura estimates
Fig. 23: Segmental gold demand in value terms A weaker USD has contributed to the value uplift
Source: GFMS, Nomura estimates
As gold is priced in US dollar terms, a weaker US dollar (as seen at the start of last the decade) helped to kick-start the gold rally. Since 2008, however, this relationship has broken down somewhat. Although there are insufficient data points for true statistical evidence, the charts below show that this relationship has directionally weakened as the R² in the past 16 quarters is lower than the negative correlation between 2000 and 2008. Notably, in recent periods, only two quarters in the past 10 quarters in which the dollar has strengthened, has the gold price declined (this includes Q4 2011 when the gold price saw its most recent correction).
Fig. 24: Gold vs. DXY 1980-2011
Source: Bloomberg
Fig. 25: Gold vs. DXY 2000-2008
Source: Bloomberg
Fig. 26: Gold vs. DXY 2008-2011
Source: Bloomberg
0
1,000
2,000
3,000
4,000
5,000
6,000
2001 2002 2003 2004 2005 2006 2007 2008 2009 2010 2011E 2012E 2013E
Jewellery Industrial and otherPhysical bar investment Net central bank and IMF demandHedging Implied investment
70
75
80
85
90
95
100
105
110
115
1200
50
100
150
200
250
300
350
400
2001 2002 2003 2004 2005 2006 2007 2008 2009 2010 2011E 2012E 2013E
Jewellery Industrial and otherPhysical bar investment Net central bank and IMF demandHedging Implied investment
Gol
dde
man
d (U
SD
bn) D
XY (inverted)
y = -0.6363x + 0.0106R² = 0.1848
-25.0%
-20.0%
-15.0%
-10.0%
-5.0%
0.0%
5.0%
10.0%
15.0%
20.0%
25.0%
30.0%
-15.0% -10.0% -5.0% 0.0% 5.0% 10.0% 15.0% 20.0%
Go
ld p
rice c
hn
ag
e
DXY (USD/oz)
y = -0.6852x + 0.0299R² = 0.227
-10.0%
-5.0%
0.0%
5.0%
10.0%
15.0%
20.0%
-15.0% -10.0% -5.0% 0.0% 5.0% 10.0%
Go
ld p
rice c
hn
ag
e
DXY (USD/oz)
y = -0.2227x + 0.0421R² = 0.0529
-8.0%
-6.0%
-4.0%
-2.0%
0.0%
2.0%
4.0%
6.0%
8.0%
10.0%
12.0%
14.0%
-10.0% -5.0% 0.0% 5.0% 10.0% 15.0%Go
ld p
rice c
hn
ag
e
DXY (USD/oz)
We believe that the current gold price is well supported by demand

Nomura | European Gold Sector Initiation January 18, 2012
18
Perhaps more importantly for gold demand (especially for gold demand for investment purposes), is that real interest rates are expected by Nomura to stay low over the next two years. Fig. 27 presents Nomura’s main interest rate forecasts to 2014. A traditional drawback to gold as an investment is the lack of yield that it provides. In times of higher interest rates (but stabilised inflation expectations) gold performs poorly owing to its lack of yield. In the near term, the dovish monetary policy stance of most global central banks and below-trend growth expectations should allow the general investment climate for gold to stay relatively positive over the next two years.
Fig. 27: Real interest rates in major economies With the exception of China, real interest rates are forecast by Nomura to stay negative through 2013
Source: Datastream, Nomura research
Jewellery The gold jewellery market is perhaps the most sensitive demand subsector to higher gold prices. In volume terms, we expect demand from India and East Asia to stay relatively level over the next three years as higher prices erode total volume demand (Fig. 28). In dollar value terms, however, we expect both regions to continue along the path of structural growth (India has averaged 26% annual increases since 2003, China 31%), with the caveat that the uncertain economic environment may provide short-term volatility in the growth rates.
Fig. 28: Gold jewellery demand in total tonnage terms Higher prices are reducing gold demand on a volume basis
Source: GFMS, Nomura research
Fig. 29: Gold jewellery demand in USD billion Gold jewellery demand in dollar terms continues to be driven by India and China
Source: GFMS, Nomura research
Our gold jewellery forecasts are based on an extrapolation of demand trends over the past 10 years and then modified to account for Nomura estimates for individual country GDP growth rates. What this does not allow for, however, is for our model to capture significant shifts in sub-segment specific demand trends. Gold imports into China from Hong Kong in recent months have risen well past trend levels according to the Census and Statistics department of Hong Kong. Media reports suggest that this is attributable to a diversion of funds from the volatile property market or perhaps even PBOC buying. The jewellery purchase decision can be tilted towards investment in an emerging middle class and this could help to keep demand well supported if a wider positive shift in investment demand is to occur owing to other global factors.
-10.0%
-8.0%
-6.0%
-4.0%
-2.0%
0.0%
2.0%
4.0%
6.0%
8.0%
2006 2007 2008 2009 2010 2011 2012E 2013E
US UK ECB China India
0
100
200
300
400
500
600
700
2001 2002 2003 2004 2005 2006 2007 2008 2009 2010 2011E 2012E 2013E
Go
ld je
wellery
dem
an
d (t)
Europe North America Latin America Middle East Indian Sub Continent China
0
5,000
10,000
15,000
20,000
25,000
30,000
35,000
40,000
45,000
2001 2002 2003 2004 2005 2006 2007 2008 2009 2010 2011E 2012E 2013E
Jew
ellery
dem
an
d (U
S$ b
n)
Europe North America Latin America Middle East Indian Sub Continent China
Low real interest rates will likely support the attractiveness of gold as an investment
Gold jewellery demand is largely driven by India and China

Nomura | European Gold Sector Initiation January 18, 2012
19
Fig. 30: China imports of gold from Hong Kong There has been a recent spike in the import of gold from Hong Kong into China
Source: Census and statistics department of Hong Kong, Nomura research
We do expect there to be volatility along this structural demand growth path. The Bombay Bullion Association has reported that Q4 2011 gold imports into India fell by 125 tonnes or 56% y-o-y. The strong Indian Rupee has caused record gold prices in local terms. The slowing Indian economy, falling inflation and the resultant increase in real interest rates is likely to have contributed to this shift in imports. These trends could continue into 2012 (and could perhaps extend through other emerging economies). However, the total of 878 tonnes of gold imported in 2011, although down 9% y-o-y, is still much higher than the 559 tonnes in 2009, especially when factoring in the 61% increase in average gold prices. It should also be noted that shifts in fundamental demand sub-categories, especially the cyclically exposed jewellery and industrial categories, can cause the various investment categories to experience volatility. This can cause near-term expectations on price to vary; however, in our view, despite the softer Q4 imports, the longer-term global wealth transfer towards emerging markets, like India, is likely to continue.
Central bank buying Gold has traditionally held an important place within the balance sheets of central banks. In the late 1990s, however, as gold prices reached their lows, many of the industrialised world’s central banks were reducing their gold holdings. Following a group of unannounced sales by various central banks, and then the announcement by the UK that it would sell the majority of its gold reserves, The Washington Agreement on Gold was signed in 1999 between the US, the IMF, the eurozone, Switzerland and Sweden (CBGA).
Fig. 31: Top central bank gold holdings The gold held in the central banks is mainly held by US and Europe
Source: World Gold Council
800
1000
1200
1400
1600
1800
2000
0
20
40
60
80
100
120Se
p-09
Oct-0
9
Nov-
09
Dec-
09
Jan-
10
Feb-
10
Mar
-10
Apr-1
0
May
-10
Jun-
10
Jul-1
0
Aug-
10
Sep-
10
Oct-1
0
Nov-
10
Dec-
10
Jan-
11
Feb-
11
Mar
-11
Apr-1
1
May
-11
Jun-
11
Jul-1
1
Aug-
11
Sep-
11
Oct-1
1
Nov-
11
Imports (000 kg) Gold price ($/oz)
000
kg
0
1,000
2,000
3,000
4,000
5,000
6,000
7,000
8,000
9,000
Top 10 holders of gold
tonn
es
Central banks are now net buyers of gold for the first time in years

Nomura | European Gold Sector Initiation January 18, 2012
20
The CBGA was agreed to manage the sales of gold from central banks to mitigate the risk of large price impacts on remaining gold reserves, hence ensuring greater stability in the international financial system. The agreement set out the total tonnage that was allowed to be sold by signatories over a set period, initially 400 tonnes per year for five years. The agreement stated that gold “will remain an important element of global monetary reserves”. Notably, this took the form of a “gentlemen’s agreement” and is not subject to international treaties. Through the past 10 years, and via a second and now a third Washington agreement, a steady level of signatory selling occurred. The price impact on gold was generally limited as was borne out by increasing prices in the 2000s.
Net central bank selling has now become net central bank buying. This shift is important and its impact on the overall market dynamic should not be overlooked, in our view.
European sales under the CBGA 3 (mid-September 2009-2011) have amounted to 12 tonnes as the eurozone sovereign debt crisis has hamstrung central banks from eroding their balance sheets further. The end of the IMF’s sale of 400 tonnes of gold in November 2010 has also removed a source of supply, further shifting the aggregate central banks category towards demand.
Fig. 32: Net central bank selling Our forecasts suggest that central banks will become key buyers of gold in the coming years
Source: World Gold Council, Nomura estimates
There is a general divergence between the levels of gold held by central banks in developed and emerging markets. Developed countries’ central banks tend to hold gold from an era where reserves were held both in US dollar and in gold (prior to the end of the gold standard). Emerging economies by contrast have largely generated their reserves over the past 40 years in the modern US dollar reserve currency system (and notably post gold standard). EM central banks have far lower gold holdings as a percentage of total US dollar reserves (c.5%).
Recent data suggest that emerging market economies are increasing their asset allocation of reserves to gold. Fig. 33 provides the notable net changes in 2011 led by Mexico, Russia and Thailand.
Fig. 33: 2011 changes in gold holdings Multiple emerging market central banks have been buying significant amounts of gold
Source: World Gold Council Nov. estimates
-1,000
-800
-600
-400
-200
0
200
400
600
800
2001 2002 2003 2004 2005 2006 2007 2008 2009 2010 2011E 2012E 2013E
Net central bank selling
Gol
d(t)
-40
-20
0
20
40
60
80
100
120
Mex
ico
Rus
sia
Thai
land
Kore
a
Boliv
ia
Oth
er
Tajik
ista
n
Col
umbi
a
Sri L
anka
Philip
pine
s
Net purchases (tonnes)
Emerging market economies are increasingly looking to diversify their reserves by buying gold
Nomura | European Gold Sector Initiation January 18, 2012
21
The recent bilateral currency agreement between China and Japan, which will promote direct yuan-yen trade and will see Japan hold yuan in its foreign currency reserves for the first time highlights the emergence of potential alternatives to the US dollar in regards to its status as a global reserve currency. In our view, the longer-term uncertainty in regards to how this will develop as emerging markets continue to grow (according to The Economist, China is likely to eclipse US GDP by 2018), will see gold’s re-emergence as an international reserve persist.
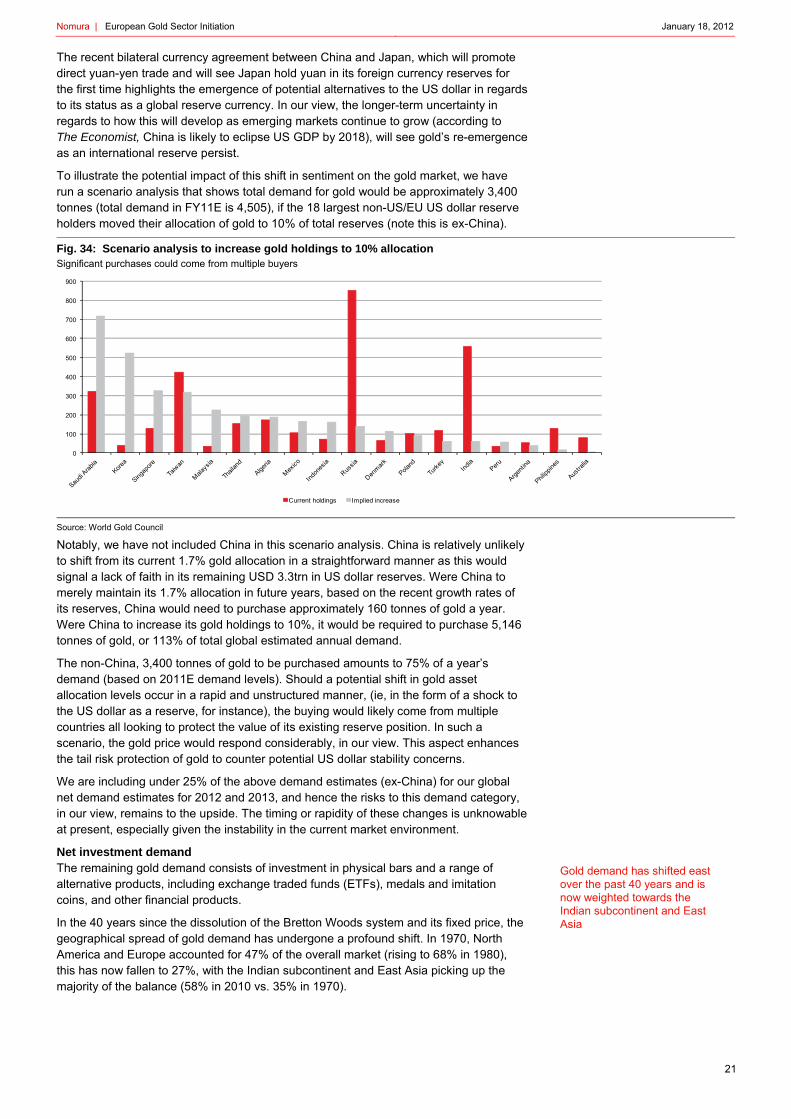
To illustrate the potential impact of this shift in sentiment on the gold market, we have run a scenario analysis that shows total demand for gold would be approximately 3,400 tonnes (total demand in FY11E is 4,505), if the 18 largest non-US/EU US dollar reserve holders moved their allocation of gold to 10% of total reserves (note this is ex-China).
Fig. 34: Scenario analysis to increase gold holdings to 10% allocation Significant purchases could come from multiple buyers
Source: World Gold Council
Notably, we have not included China in this scenario analysis. China is relatively unlikely to shift from its current 1.7% gold allocation in a straightforward manner as this would signal a lack of faith in its remaining USD 3.3trn in US dollar reserves. Were China to merely maintain its 1.7% allocation in future years, based on the recent growth rates of its reserves, China would need to purchase approximately 160 tonnes of gold a year. Were China to increase its gold holdings to 10%, it would be required to purchase 5,146 tonnes of gold, or 113% of total global estimated annual demand.
The non-China, 3,400 tonnes of gold to be purchased amounts to 75% of a year’s demand (based on 2011E demand levels). Should a potential shift in gold asset allocation levels occur in a rapid and unstructured manner, (ie, in the form of a shock to the US dollar as a reserve, for instance), the buying would likely come from multiple countries all looking to protect the value of its existing reserve position. In such a scenario, the gold price would respond considerably, in our view. This aspect enhances the tail risk protection of gold to counter potential US dollar stability concerns.
We are including under 25% of the above demand estimates (ex-China) for our global net demand estimates for 2012 and 2013, and hence the risks to this demand category, in our view, remains to the upside. The timing or rapidity of these changes is unknowable at present, especially given the instability in the current market environment.
Net investment demand The remaining gold demand consists of investment in physical bars and a range of alternative products, including exchange traded funds (ETFs), medals and imitation coins, and other financial products.
In the 40 years since the dissolution of the Bretton Woods system and its fixed price, the geographical spread of gold demand has undergone a profound shift. In 1970, North America and Europe accounted for 47% of the overall market (rising to 68% in 1980), this has now fallen to 27%, with the Indian subcontinent and East Asia picking up the majority of the balance (58% in 2010 vs. 35% in 1970).
0
100
200
300
400
500
600
700
800
900
Current holdings Implied increase
Gold demand has shifted east over the past 40 years and is now weighted towards the Indian subcontinent and East Asia

Nomura | European Gold Sector Initiation January 18, 2012
22
Fig. 35: Total gold demand is geographically diverse (2010) Western investment demand is now below 50% of total
Source: World Gold Council, Nomura research
Fig. 36: Demand for physical investment in gold (2010) India and China constitute 52% of demand for physical investment in gold
Source: World Gold Council, Nomura research
Physical investment Rising income levels in emerging markets – in particular in India and East Asia – have fuelled growth in demand for physical investment in gold (jewellery, bars, coins and medals). In two of the fast-growing economies, India and China, gold is regarded as a sign of prosperity and an integral part of religious ceremony, weddings and other holidays (for example, the WGC has identified the Chinese New Year, the onset of Diwali in October and weddings as typical occasions for gold purchasing). In the charts below, we attempt to quantify this cultural affinity with gold in some developing markets, by showing how a number of these countries have exhibited much higher gold consumption than their GDP per capita would suggest. In 2009, for instance, demand for gold per capita in China and India was roughly comparable with much more prosperous nations, such as the UK.
Despite rising gold prices, this trend has actually accentuated in recent years with Indian gold demand per capita rising from 0.49gm in 2009 to 0.82gm in 2010 to now account for 32% of the physical investment market (although this trend began to stall somewhat in Q4 11). And in Q3 11, with global physical investment demand in tonnes stalling (overall dollar demand continued to grow), two of the three markets that bucked this trend and continued to grow were developing markets: China and Russia.
Fig. 37: 2009: GDP per capita (USD) vs. demand per capita (mg) Demand for gold per capita in China and India was roughly comparable with much more prosperous nations, such as the UK
Source: World Gold Council, World Bank
Fig. 38: 2010: GDP per capita (USD) vs. demand per capita (mg) Indian demand per capita almost doubled in 2010. Demand in China and Russia also increased
Source: World Gold Council, World Bank
Note: Demand includes all physical investment (including jewellery, but excluding the actions of central banks).
The regional dispersion of physical investment demand, its relative reweighting towards ‘gold-friendly’ emerging markets and growth despite rising prices support our assumption that gold demand from physical investment will remain at or slightly below recent historical levels despite continuing price pressure. Ongoing demand from developing markets would constitute upside to this forecast; for instance, if Chinese consumption continued to trend upwards and increase to the 0.82gm seen in India, this would imply additional gold demand of 500 tonnes per annum.
-
200.0
400.0
600.0
800.0
1,000.0
1,200.0
1,400.0
Invest Jewellery Tech
0.0%
5.0%
10.0%
15.0%
20.0%
25.0%
30.0%
35.0%
India Greater China
Other Europe ex CIS
US Middle East
Turkey Vietnam Russia Thailand
IndiaChinaThailand
Indonesia
Russia
United Kingdom Italy
US
South Korea
0
5,000
10,000
15,000
20,000
25,000
30,000
35,000
40,000
45,000
50,000
-0.10 - 0.10 0 .20 0. 30 0.40 0. 50 0.60 0. 70 0.80 0. 90 1. 00
IndiaChina Thailand
Indonesia
Russia
United KingdomItaly
US
South Korea
0
5,000
10,000
15,000
20,000
25,000
30,000
35,000
40,000
45,000
50,000
- 0.10 0.20 0 .30 0. 40 0.50 0 .60 0. 70 0.80 0 .90
Many of the countries with the fastest-growing economies have a strong cultural affinity with gold
We believe that physical investment demand will fall slightly from recent yearly highs. Ongoing demand from developing nations is a source of potential upside to this forecast
Recent years have also seen a rise in the purchase of gold for investment purposes in these markets; in 2010, annual bar and coin demand increased by 60% in India and 72% in China

Nomura | European Gold Sector Initiation January 18, 2012
23
Alternative investment The vast majority of alternative investments relate to ETFs (c. 350 tonnes in 2010). Launched in 2003, the number of available funds and their holdings has increased rapidly as investors have sought exposure to fluctuations in the gold price through these equity vehicles.
Fig. 39: All known gold ETF holdings Consistent retail buying of gold ETF products have helped support the gold price
Source: Bloomberg, Nomura research
At the end of 2011, gold ETFs held around 2,360 tonnes of gold, an increase of 171 tonnes in the year (343 tonnes over the same period in 2010). We expect that these funds and other alternative investments will remain net buyers of gold through 2013, although below the levels seen in 2009 and 2010 in tonnage terms owing to higher prices.
Consensus gold price Consensus estimates have consistently underestimated the price of gold, but are now both more uniform and more bullish. Although commodity prices are notoriously difficult to predict, over the last four years, actual gold prices have consistently been at the high end of consensus forecasts. In addition, the chart shows that 2012 estimates are more tightly grouped than in previous years with the c. USD 500 low, which persisted until 2011, moving to USD 1,500. This shift in near-term gold price estimates may help to underpin gold equity earnings expectations from a volatility perspective.
Fig. 40: One-year forward gold price consensus estimates Actual gold prices have consistently been at the high end of expectations
Source: Bloomberg, Nomura research
0
10
20
30
40
50
60
70
80
90
Dec-03 Dec-04 Dec-05 Dec-06 Dec-07 Dec-08 Dec-09 Dec-10 Dec-11
All known gold ETF holdings (moz)
0
500
1,000
1,500
2,000
2,500
2008 2009 2010 2011 2012
High Mean Low Actual
Gol
dpr
ice
(USD
/oz)
Having increased holdings profoundly in 2009 and 2010, we expect a cooling off of demand from ETFs in the next couple of years
Having repeatedly underestimated the price of gold, the consensus estimates are now more tightly grouped in the USD 1,500/oz to USD 2,000/oz range
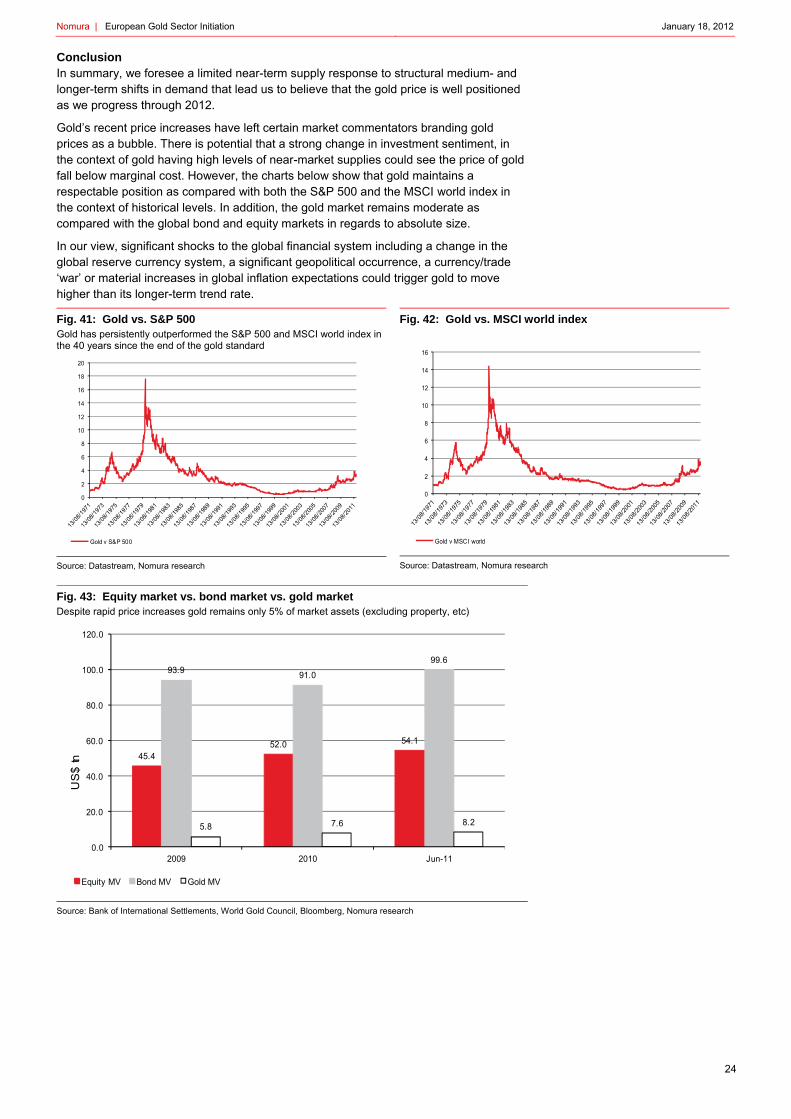
Nomura | European Gold Sector Initiation January 18, 2012
24
Conclusion In summary, we foresee a limited near-term supply response to structural medium- and longer-term shifts in demand that lead us to believe that the gold price is well positioned as we progress through 2012.
Gold’s recent price increases have left certain market commentators branding gold prices as a bubble. There is potential that a strong change in investment sentiment, in the context of gold having high levels of near-market supplies could see the price of gold fall below marginal cost. However, the charts below show that gold maintains a respectable position as compared with both the S&P 500 and the MSCI world index in the context of historical levels. In addition, the gold market remains moderate as compared with the global bond and equity markets in regards to absolute size.
In our view, significant shocks to the global financial system including a change in the global reserve currency system, a significant geopolitical occurrence, a currency/trade ‘war’ or material increases in global inflation expectations could trigger gold to move higher than its longer-term trend rate.
Fig. 41: Gold vs. S&P 500 Gold has persistently outperformed the S&P 500 and MSCI world index in the 40 years since the end of the gold standard
Source: Datastream, Nomura research
Fig. 42: Gold vs. MSCI world index
Source: Datastream, Nomura research
Fig. 43: Equity market vs. bond market vs. gold market Despite rapid price increases gold remains only 5% of market assets (excluding property, etc)
Source: Bank of International Settlements, World Gold Council, Bloomberg, Nomura research
0
2
4
6
8
10
12
14
16
18
20
Gold v S&P 500
0
2
4
6
8
10
12
14
16
Gold v MSCI world
45.452.0 54.1
93.9 91.0
99.6
5.8 7.6 8.2
0.0
20.0
40.0
60.0
80.0
100.0
120.0
2009 2010 Jun-11
Equity MV Bond MV Gold MV
US
$ tn
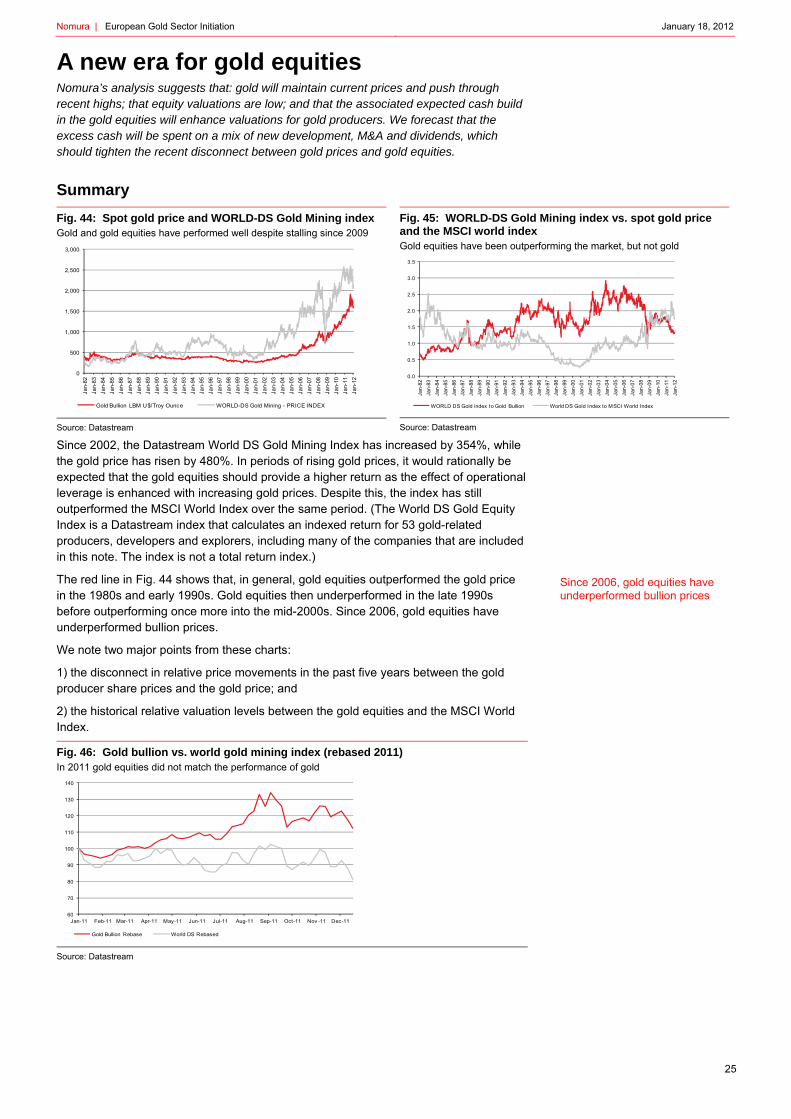
Nomura | European Gold Sector Initiation January 18, 2012
25
A new era for gold equities Nomura’s analysis suggests that: gold will maintain current prices and push through recent highs; that equity valuations are low; and that the associated expected cash build in the gold equities will enhance valuations for gold producers. We forecast that the excess cash will be spent on a mix of new development, M&A and dividends, which should tighten the recent disconnect between gold prices and gold equities.
Summary
Fig. 44: Spot gold price and WORLD-DS Gold Mining index Gold and gold equities have performed well despite stalling since 2009
Source: Datastream
Fig. 45: WORLD-DS Gold Mining index vs. spot gold price and the MSCI world index Gold equities have been outperforming the market, but not gold
Source: Datastream
Since 2002, the Datastream World DS Gold Mining Index has increased by 354%, while the gold price has risen by 480%. In periods of rising gold prices, it would rationally be expected that the gold equities should provide a higher return as the effect of operational leverage is enhanced with increasing gold prices. Despite this, the index has still outperformed the MSCI World Index over the same period. (The World DS Gold Equity Index is a Datastream index that calculates an indexed return for 53 gold-related producers, developers and explorers, including many of the companies that are included in this note. The index is not a total return index.)
The red line in Fig. 44 shows that, in general, gold equities outperformed the gold price in the 1980s and early 1990s. Gold equities then underperformed in the late 1990s before outperforming once more into the mid-2000s. Since 2006, gold equities have underperformed bullion prices.
We note two major points from these charts:
1) the disconnect in relative price movements in the past five years between the gold producer share prices and the gold price; and
2) the historical relative valuation levels between the gold equities and the MSCI World Index.
Fig. 46: Gold bullion vs. world gold mining index (rebased 2011) In 2011 gold equities did not match the performance of gold
Source: Datastream
0
500
1,000
1,500
2,000
2,500
3,000
Jan-
82Ja
n-83
Jan-
84Ja
n-85
Jan-
86Ja
n-87
Jan-
88Ja
n-89
Jan-
90Ja
n-91
Jan-
92Ja
n-93
Jan-
94Ja
n-95
Jan-
96Ja
n-97
Jan-
98Ja
n-99
Jan-
00Ja
n-01
Jan-
02Ja
n-03
Jan-
04Ja
n-05
Jan-
06Ja
n-07
Jan-
08Ja
n-09
Jan-
10Ja
n-11
Jan-
12
Gold Bullion LBM U$/Troy Ounce WORLD-DS Gold Mining - PRICE INDEX
0.0
0.5
1.0
1.5
2.0
2.5
3.0
3.5
Jan-
82Ja
n-83
Jan-
84Ja
n-85
Jan-
86Ja
n-87
Jan-
88Ja
n-89
Jan-
90Ja
n-91
Jan-
92Ja
n-93
Jan-
94Ja
n-95
Jan-
96Ja
n-97
Jan-
98Ja
n-99
Jan-
00Ja
n-01
Jan-
02Ja
n-03
Jan-
04Ja
n-05
Jan-
06Ja
n-07
Jan-
08Ja
n-09
Jan-
10Ja
n-11
Jan-
12
WORLD DS Gold index to Gold Bullion World DS Gold Index to MSCI World Index
60
70
80
90
100
110
120
130
140
Jan-11 Feb-11 Mar-11 Apr-11 May-11 Jun-11 Jul-11 Aug-11 Sep-11 Oct-11 Nov -11 Dec-11
Gold Bullion Rebase World DS Rebased
Since 2006, gold equities have underperformed bullion prices

Nomura | European Gold Sector Initiation January 18, 2012
26
The recent pricing disconnect was amplified in 2011. The gold price, even when accounting for the end-of-year weakness, was up 9% y-o-y, while the gold producers traded down 20% (Fig. 45).
Fig. 45 shows that the WORLD DS Gold index has outperformed the MSCI World Index since 2000. It is notable that, despite 10 years of outperformance (which perhaps reflects an element of catch-up after the weak relative performance in the late 1990s), that gold equities are still trading below historical highs when compared with general equities.
Fig. 47: Global gold equity P/E P/E ratios are near 20-year lows
Source: Datastream
Fig. 48: Global gold equity EV/EBITDA EV/EBITDA ratios are at 20-year lows
Datastream
Looking at valuations from a P/E or an EV/EBITDA multiple basis, similar dynamics are at work. Although P/E ratios of 20x are unarguably high compared with average non-gold equity levels, gold equity P/E valuations are near 20-year lows. Gold equities tend to trade at a premium owing to the lower correlations that gold has traditionally had with economic cycles, a trend we expect will only be enhanced in the unstable market environment. EV/EBITDA valuation metrics reinforce this trend as well.
Fig. 49: Global gold equity EBITDA The rising gold price is already significantly changing the cash flow and balance sheet of gold mining equities
Source: Datastream
Fig. 50: Global gold equity EBITDA and capex The rapid increase in EBITDA has not been matched by capex. Companies are now generating free cash flows that are far in excess of anything see over the last 20 years
Source: Datastream
Figure 49 provides the DS World Gold Mining Index aggregate EBITDA with forecasts based on consensus estimates out to 2013. These forecasts suggest that on an industry-wide basis, close to USD 60bn in EBITDA will be generated in 2013E, up from ~USD 10bn in 2006-09.
This noticeable increase in profitability is likely to have important implications for the sector.
1) Increasing balance sheet strength will, in our view, increase M&A activity. Recent transactions including the Eldorado Gold Corp bid for European Goldfields has provided an early example of potential activity. We see Avocet Mining, Randgold Resources and Seabridge Gold benefitting most from this trend. Additionally, in our view, African Barrick Gold is perhaps closest to making an acquisition and the net result of a changed investment proposition may also change sentiment surrounding the stock.
0
5
10
15
20
25
30
35
40
45
Jan-92 Jul-93 Jan-95 Jul-96 Jan-98 Jul-99 Jan-01 Jul-02 Jan-04 Jul-05 Jan-07 Jul-08 Jan-10 Jul-11
12mth forward PE
0.0
5.0
10.0
15.0
20.0
25.0
Jan-02 Jan-03 Jan-04 Jan-05 Jan-06 Jan-07 Jan-08 Jan-09 Jan-10 Jan-11 Jan-12
EV/E
BTID
A
0
10,000
20,000
30,000
40,000
50,000
60,000
70,000
EBITDA ($m)
0
5,000
10,000
15,000
20,000
25,000
30,000
35,000
40,000
EBITDA ($m)Capex ($m)
The pricing disconnect between gold bullion and gold equities has grown during 2011
Gold equity P/E and EV/EBITDA ratios are near 20-year lows
EBITDA is set to rise to USD 60bn by 2013E from around USD 10bn in 2006-09

Nomura | European Gold Sector Initiation January 18, 2012
27
2) Excess cash will see development projects progress and exploration increase, leading to a potential medium-term supply side response. In the near term, however, we believe this will favour companies with high potential growth characteristics. This would suggest that on a relative basis that the P/NAV multiple for companies such as Randgold, Avocet, Polymetal and Petropavlovsk would benefit the most.
3) A significant portion of cash will be returned to shareholders, in our view. This should favour net cash positive companies with high free cash flow including Centamin, Randgold Resources and African Barrick Gold.
Fig. 51: Global gold equity dividend yield
Source: Datastream
Fig. 51 shows that the consensus 2011 sector dividend yield is running just below 1%. Consensus dividends for the WORLD DS index for FY13 are roughly USD 4.6bn. At a dividend yield of 0.9% (2011), this would imply a market capitalisation of USD 489.0bn or 47.2% upside to existing prices. Notably consensus average 2013 gold forecasts are at USD 1,937/oz. If gold prices increase, this would likely enhance potential sector upside regardless of increased capital spending.
The disconnect between USD 60bn in EBITDA generation and the USD 4.6bn consensus forecast for dividends suggest dividends are likely to come in ahead of current consensus, in our view.
Fig. 52: Global gold net debt With the exception of acquisitions by Newmont Mining and Barrick Gold, which added a combined USD 10.6bn of net debt in Q3 11, sector net debt has been falling since the start of 2009
Source: Datastream
Fig. 53: Global gold net debt to EBITDA The net debt to equity ratio is forecast to become negative in 2013
Source: Datastream
The remaining cash should strengthen balance sheets. The large spike in Fig. 52 in sector net debt in 2011 stemmed from the additions made by majors Barrick Gold Corporation and Newmont Mining to finance their respective acquisitions of Equinox Minerals and Fronteer Gold. Despite this, as would be expected at such high rates of profitability, we expect sector net debt to fall rapidly. The sector as a whole is likely to be in a firmly positive net cash position in 2013.
0.0%
0.5%
1.0%
1.5%
2.0%
2.5%
3.0%
3.5%
Dividend yield
-15,000
-10,000
-5,000
0
5,000
10,000
15,000
Net debt ($m)
-1.00
0.00
1.00
2.00
3.00
4.00
5.00
Net debt to EBITDA
Assuming dividend yield remains at c. 1.0%, FY13E consensus dividends implies 47% upside potential to existing prices
EBITDA growth will likely translate into considerable amounts of cash

Nomura | European Gold Sector Initiation January 18, 2012
28
Our analysis suggests that profitability ratios (Figs. 54 and 55), which are already high, will move higher, suggesting the sector is about to move into a period of super profit. Owing to the shifts we have noted above in gold demand dynamics, and the delayed time frame for which new gold projects can be discovered and built, in our view, this excess economic profit situation could persist for some time. This is likely to encourage investor interest as gold equity valuations retrace towards higher P/E and EV/EBITDA multiples.
Fig. 54: Global gold return on equity Return on equity is at a 10-year high and trending upwards
Source: Datastream
Fig. 55: Global gold net profit margins Net profit margins are also at a recent high and set to increase further
Source: Datastream
The above analysis suggests that the increase in the gold price over the past 12 months and the underlying shift in fundamental economics for the gold producers have yet to be priced in. We expect that as gold prices persist at higher levels, investors will begin to recognise the persisting sector cash build and the implications that this has on industry structure. This will, in our view, have far reaching impact on valuations.
P/NAV multiples have compressed in line with higher gold prices but steady equity prices. There remain valid reasons for this, in our view, including the emergence of ETFs as a liquid and easily accessible alternative to buying mining stocks that are affected by significant operational and political risks. In addition, longer-term forecasts for gold remain compressed as uncertainty surrounding the macro environment is hampering conviction in longer-term views. However, the disconnect has now grown too wide, in our view, and we expect both P/E and P/NAV multiples to begin to retrace closer to historical levels. Increasing M&A activity could act as a catalyst, in our view.
The downside scenario Despite what we believe to be a very well-supported, medium-term supply/demand balance, since 2008, a higher proportion of gold consumption has been in the form of investment demand. On balance, we see the potential for investment demand to increase sharply depending on the progression of the many current macro uncertainties. Although this will come with higher prices, and will, in our view, accelerate the above-analysed valuation increases, the increasing proportion of gold held near-market means that the volatility surrounding net investment demand, and hence gold price volatility, is likely to increase.
-6.0
-4.0
-2.0
-
2.0
4.0
6.0
8.0
10.0
12.0
14.0
Jan-02 Jan-03 Jan-04 Jan-05 Jan-06 Jan-07 Jan-08 Jan-09 Jan-10 Jan-11 Jan-12
Return on Equity
ROE
(%)
-15.0
-10.0
-5.0
-
5.0
10.0
15.0
20.0
25.0
30.0
Jan-02 Jan-03 Jan-04 Jan-05 Jan-06 Jan-07 Jan-08 Jan-09 Jan-10 Jan-11 Jan-12
Net profit margin
Net
pro
fit m
argi
n (%
)
We believe that EBITDA and net cash growth will lead to both P/E and P/NAV multiples moving closer to historical levels
The increasing proportion of gold held ‘near-market’ means that the volatility of net investment demand will likely increase
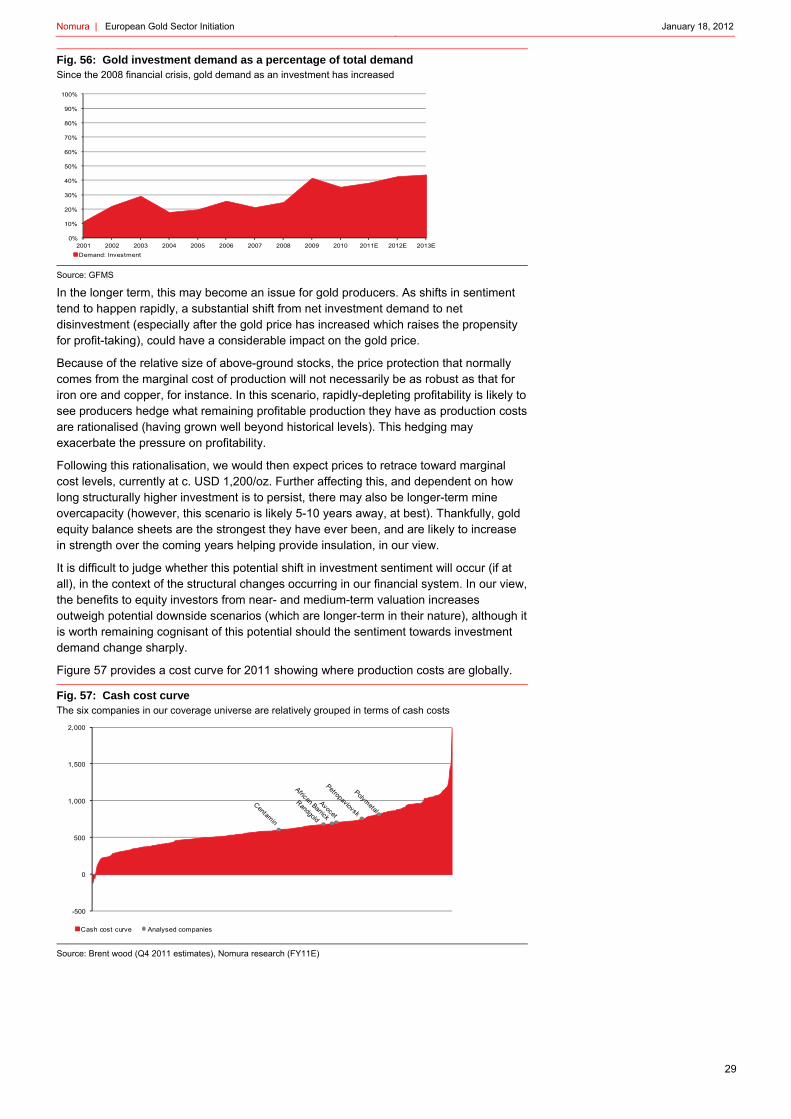
Nomura | European Gold Sector Initiation January 18, 2012
29
Fig. 56: Gold investment demand as a percentage of total demand Since the 2008 financial crisis, gold demand as an investment has increased
Source: GFMS
In the longer term, this may become an issue for gold producers. As shifts in sentiment tend to happen rapidly, a substantial shift from net investment demand to net disinvestment (especially after the gold price has increased which raises the propensity for profit-taking), could have a considerable impact on the gold price.
Because of the relative size of above-ground stocks, the price protection that normally comes from the marginal cost of production will not necessarily be as robust as that for iron ore and copper, for instance. In this scenario, rapidly-depleting profitability is likely to see producers hedge what remaining profitable production they have as production costs are rationalised (having grown well beyond historical levels). This hedging may exacerbate the pressure on profitability.
Following this rationalisation, we would then expect prices to retrace toward marginal cost levels, currently at c. USD 1,200/oz. Further affecting this, and dependent on how long structurally higher investment is to persist, there may also be longer-term mine overcapacity (however, this scenario is likely 5-10 years away, at best). Thankfully, gold equity balance sheets are the strongest they have ever been, and are likely to increase in strength over the coming years helping provide insulation, in our view.
It is difficult to judge whether this potential shift in investment sentiment will occur (if at all), in the context of the structural changes occurring in our financial system. In our view, the benefits to equity investors from near- and medium-term valuation increases outweigh potential downside scenarios (which are longer-term in their nature), although it is worth remaining cognisant of this potential should the sentiment towards investment demand change sharply.
Figure 57 provides a cost curve for 2011 showing where production costs are globally.
Fig. 57: Cash cost curve The six companies in our coverage universe are relatively grouped in terms of cash costs
Source: Brent wood (Q4 2011 estimates), Nomura research (FY11E)
0%
10%
20%
30%
40%
50%
60%
70%
80%
90%
100%
2001 2002 2003 2004 2005 2006 2007 2008 2009 2010 2011E 2012E 2013EDemand: Investment
-500
0
500
1,000
1,500
2,000
Cash cost curve Analysed companies

Nomura | European Gold Sector Initiation January 18, 2012
30
European sector review The European gold producer sector is generally made up of smaller intermediate gold producers with greater exposure to political risk, in general, than the senior North American gold producers. With this greater risk can come greater reward. However we do favour West African exposure over the Russian companies for stock-specific reasons.
In this report, we initiate on the six London-listed gold companies below. Our top picks are Randgold Resources, African Barrick Gold and Avocet Mining, which screen well against our emerging themes from our top-down analysis, being: growth, cash flow and potential to participate in a valuation uplift from increased M&A activity in the gold sector.
We see significant value in all of our non-Buy rated stocks in absolute terms, although in relative terms we favour the higher upside potential in ABG and AVM and the lower risk profile of RRS over the long-term attractive but risky CEY and the lower relative upside potential from the Russian producers POLY and POG.
Fig. 58: European gold producers Although we see value in all our stocks, in relative terms we favour the higher upside potential of ABG and AVM along with the lower risk offered by RRS
Source: Nomura estimates Fig. 59: Target price upside potential We like the upside potential on African Barrick and Avocet and the lower risk offered by Randgold's diversification and size
Source: Nomura research
Fig. 60: Share price movements (indexed 03/2010)
Source: Datastream
The gold equities generally continue to price in valuation levels lower than the spot price on an NAV basis (using a 5% discount rate), although the recent pullback in the gold price from highs of USD 1,900/oz to now USD 1,640/oz has left the mispricing gap marginally lower (suggesting that gold equity participants had in fact correctly anticipated that gold bullion was ahead of short-term trend levels). That said, the disconnect between spot P/NAV multiples and historical multiples of 1.0x or higher (as can also be seen by the P/E and EV/EBITDA sector de-rating in Figs 47 and 48) persists in most stocks except for the larger, and perceived higher growth, stocks of Randgold and Polymetal.
Company Ticker Market cap Spot multiple Target multiple Current price Target price Potential upside Rating
African Barrick Gold ABG 2,904 0.6x 0.8x 462p 750p 62% BuyAvocet Mining AVM 654 0.8x 0.9x 214p 310p 45% BuyCentamin C EY 1,498 0.4x 0.5x 89p 120p 34% NeutralPetropavlovsk P OG 1,952 0.8x 0.7x 685p 860p 25% ReducePolymetal P OLY 6,448 0.9x 0.9x 1100p 1400p 27% ReduceRandgold Resources RRS 9,988 1.5x 1.7x 7115p 9850p 38% BuySeabridge Gold SA 817 0.4x $19.23 $31.80 65% Buy
65.4%62.2%
44.9%
38.4%34.5%
27.3% 25.5%
0%
10%
20%
30%
40%
50%
60%
70%
Seabridge Gold Af rican Barrick Gold Av ocet Mining Randgold Resources Centamin Poly metal Petropav lov sk
0
50
100
150
200
250
300
AVM LN Equity ABG LN Equity CEY LN Equity POG LN Equity POLY LN Equity
RRS LN Equity GDM Index GOLDS Comdty SXXP Index SPX Index

Nomura | European Gold Sector Initiation January 18, 2012
31
Fig. 61: Valuation sensitivity to gold price Generally attractive valuations at spot and our year-end prices
Source: Datastream, Nomura research
Fig. 62: Implied spot price at 5% discount rate With the exception of Randgold, all of the valuations of our coverage companies imply a gold price below the spot price
Source: Nomura research
The sector has de-rated as gold prices have increased and we expect that the cash build and impending M&A as noted above could help to provide a re-rating for all gold stocks. We note that global gold P/Es have averaged above 20x over the course of the bull market that started in 2000 and that the London stocks all trade below a 2012E P/E of 15x.
Should the gold price stabilise at current levels (even disregarding the potential for higher prices), we would expect that the London gold companies may well see a sectoral lift in multiples in conjunction with the cash build and M&A that we expect will help to change the shape of the sector in the coming months. The London gold equities are not pricing in onerous valuations in a historical context, in our view.
Fig. 63: 2012E P/NAV vs. cash costs Bubbles represent EBITDA size
Source: Nomura estimates
Fig. 64: 2013E P/NAV vs. cash costs Centamin has seen its rating decline considerably despite its leading cost position
Source: Nomura estimates
The London-listed gold equities tend to group at the USD 700-800/oz cash cost level (ex-Centamin) vs. a global average cash cost of approximately USD 625/oz. This shows the European-listed stocks tend to have lower-quality assets than the average global companies (in cost terms) and this does affect potential P/NAV multiples.
We do note that the general relationship between P/NAV and cash costs (lower cash costs should translate into higher P/NAV multiples), remains evident and is perhaps enhanced by the shifts in 2013 costs. As the gold price moves higher, the ‘safety margin’
Company Ticker Current
price
African Barrick Gold ABG 462p 512p 0.9x 724p 0.6x 941p 0.5xAvocet Mining AVM 214p 246p 0.9x 285p 0.8x 348p 0.6xCentamin C EY 89p 154p 0.6x 207p 0.4x 255p 0.3xPetropavlovsk P OG 685p 621p 1.1x 858p 0.8x 1226p 0.6xPolymetal P OLY 1100p 967p 1.1x 1192p 0.9x 1620p 0.7xRandgold Resources RRS 7115p 3660p 1.9x 4623p 1.5x 5791p 1.2xSeabridge Gold SA $19.23
NAV @ 5% discount rate
$1,900/ozSpotLong term
2,196
1,545 1,5101,365 1,325
987
0
500
1,000
1,500
2,000
2,500
Randgold Resources Polymetal Petropavlovsk Avocet Mining African Barrick Gold Centamin
Impl
ied
spot
pri
ce U
S$/
0.0x
0.2x
0.4x
0.6x
0.8x
1.0x
1.2x
1.4x
1.6x
1.8x
2.0x
$400 $500 $600 $700 $800 $900 $1,000 $1,100
2012 E cash costs (USD/oz)
Centamin Randgold Resources Avocet Mining Polymetal African Barrick Gold Petropavlovsk
0.0x
0.2x
0.4x
0.6x
0.8x
1.0x
1.2x
1.4x
1.6x
1.8x
2.0x
$400 $500 $600 $700 $800 $900 $1,000 $1,100
2013 E cash costs (USD/oz)
Centamin Randgold Resources Avocet Mining Polymetal African Barrick Gold Petropavlovsk

Nomura | European Gold Sector Initiation January 18, 2012
32
or cash margin per ounce should expand and thereby reduce the impact from this trend (causing a general flattening of the line). We believe this will favour the relative P/NAV multiples for both African Barrick Gold and Avocet Mining as the companies with the most relative cost control (largely owing to structural deflation and moderations in strip ratios rather than a lack of inflation) in a rising gold price environment. This is one of the reasons why we see ABG and AVM benefiting the most from P/NAV multiple expansion over the coming year.
Centamin plc should be pricing in a higher P/NAV multiple based solely on its strong cash cost position, although increased Egyptian political risks continue to weigh on the share price.
Fig. 65: Spot multiple vs. two-year forward EBITDA growth Near-term growth appears to be deceptive based on our valuation analysis
Source: Nomura estimates
Polymetal has the leading two-year EBITDA growth. Polymetal’s growth is also very heavily weighted to 2013 and is dependent on the successful commissioning of the Amursk refractory operation and Polymetal’s shares appear to be pricing in a large portion of this growth, in our view. In addition, our silver forecasts also enhance the relative 2013 EBITDA growth for Polymetal, which produces almost 50% of its revenues from silver.
Randgold maintains its premium multiple, in our view, for the historical delivery and future potential for growth, which remains beyond the reach of the two-year EBITDA growth chart. African Barrick Gold is a notable laggard in near-term growth and with its strong balance sheet, we expect the company to move towards an acquisition while Avocet will see its new growth from Inata in 2014 and onwards.
A key chart, in our view, for why the sector may see a re-rating in general is the changes in balance sheets towards strong net cash positions. Notably, only Petropavlovsk has a net debt position in 2015E. We also note that Polymetal maintains significant debt levels at the moment, and although its debt position is improving, it remains relatively more exposed in a downside gold price scenario.
Fig. 66: Net debt to EBITDA Our forecasts suggest that all of the companies in our report will have negative net debt to EBITDA by 2013 (except Petropavlovsk)
Source: Nomura estimates
Polymetal has the largest gold equivalent production as can been seen in Fig. 66. Petropavlovsk, which should it be able to achieve production on time at its new Pokrovskiy Hub, will move back in line with Randgold in production terms. Centamin’s
0.0x
0.2x
0.4x
0.6x
0.8x
1.0x
1.2x
1.4x
1.6x
1.8x
2.0x
100% 150% 200% 250% 300% 350%
African Barrick Gold Centamin Petropavlovsk Polymetal Avocet Mining Randgold Resources
2011-2013 EBITDA Growth
-2.5x
-2.0x
-1.5x
-1.0x
-0.5x
0.0x
0.5x
1.0x
1.5x
2.0x
2010 2011E 2012E 2013E
AVERAGE African Barrick Gold Avocet Mining Centamin Petropavlovsk Randgold Resources Polymetal
Ne
tde
bt t
o E
BIT
DA

Nomura | European Gold Sector Initiation January 18, 2012
33
ramping underground production as well as the Stage IV expansion at Sukari makes this very attractive from a growth standpoint, although as we note below, the increasing government share of profits and the heightened perceived political risk mitigate the positives at present.
Fig. 67: Estimated production profiles to 2015E Growth rates of production will slow into 2015
Source: Nomura estimates
Fig. 68: Cash costs profile to 2015E Rising production and larger operations and new mines should keep cost inflation in check - translating into higher cash flow from operations
Source: Nomura estimates
Cash cost inflation, in our view, is likely to stay relatively moderate as compared with the increases seen over the past few years, for various reasons, including the ramping up of operations and general producer currency weakness (ruble, CFA franc, South African rand). On our forecasts, the near USD 1,000/oz cash margin seen in 2011E will expand to average above USD 1,300/oz by 2013E. This profitability should see increasing production. Free cash flow yields (ex the next unannounced stage of projects) are elevated from 2013E as well. Fig. 69: Cash margins
Source: Nomura estimates
Fig. 70: Cash flow yield
Source: Nomura estimates
0
200,000
400,000
600,000
800,000
1,000,000
1,200,000
1,400,000
2010 2011 2012 2013 2014 2015
Pro
du
ctio
n(g
old
eq
uiv
alen
t oz)
Af rican Barrick Gold Av ocet Mining Centamin
Petropav lov sk Poly metal Randgold Resources
0
200
400
600
800
1,000
1,200
2010 2011 2012 2013 2014 2015
Cas
h co
sts
($/o
z)
Af rican Barrick Gold Av ocet Mining Centamin
Petropav lov sk Poly metal Randgold Resources
0
200
400
600
800
1,000
1,200
1,400
1,600
2010 2011 2012 2013
Af rican Barrick Gold Av ocet Mining Centamin Petropav lov sk Poly metal Randgold Resources
Cas
h m
arg
in U
SD/o
z
-40%
-30%
-20%
-10%
0%
10%
20%
30%
40%
2010 2011E 2012E 2013E
Af rican Barrick Gold Av ocet Mining Centamin Petropav lov sk Poly metal Randgold Resources

Nomura | European Gold Sector Initiation January 18, 2012
34
RRS – Randgold Resources (Buy, 9,850p TP) Randgold Resources is one of Nomura’s top picks in the London gold sector. The company is expensive compared with its London peers, but we believe its premium rating, which has persisted for years, is warranted. Buy Randgold for the cleanest, most liquid exposure to gold in the London market.
Relatively expensive, but high growth potential a premium asset in a new era
Randgold Resources, a West African pure-play gold producer, has been one of the more successful growth stories in the gold sector over the past 10 years. Nomura believes that Randgold is well placed to continue its longer-term outperformance of the wider gold equity universe, despite its current aggressive market rating.
The shares, trading on our calculations at a P/NAV of 1.5x using the spot gold price, appear expensive as compared with other London gold producers, but less so when compared with larger global growth gold producers. In our view, Randgold’s diversified production base (both on a geographical and asset basis) and high probability growth that has not yet been fully priced into our NAV calculations make RRS the premium London gold equity exposure. This is especially true in the context of the rest of the London listed gold companies, which tend to have concentrated risks. In addition, Randgold has a very strong balance sheet (net cash of USD 729m in 2012E), and has the second lowest long-term cash cost forecasts in our London universe.
Owing to this best-in-class pedigree, Randgold is, in our view, best placed to participate in the general gold equity response to higher gold prices over the medium term. It is also likely to be one of the first movers to respond to this shift should equity markets stay in a ‘risk off’ framework over the next six months. Although our calculated 12-month upside potential is lower than some of its peers (as this high quality has likely been priced into the market), the risk profile is more favourable, in our view.
Randgold also screens well on our key forward themes. Its world-class exploration portfolio should see its growth potential remain high for years to come. Its already strong balance sheet suggests that substantial dividends or further as yet unvalued growth, may be on the horizon, even after the material production growth from Kibali.
Fig. 71: Attributable reserves (oz) per share Randgold has created value in the past ...
Source: Company data, Nomura research
Fig. 72: Project pipeline ... and the current portfolio looks poised to deliver in the future
Source: Company data, Nomura research
0.00
0.05
0.10
0.15
0.20
0.25
2005 2006 2007 2008 2009 2010
Attributable reserv es per share
Reservedefinition16
Indicated and measured resources5
Inferred resources11
Advanced targets12
Follow up targets33
Identified targets51
Regional exploration148
16
6
4
5
3
11
30
Cert
ain
ty
89 4
613 3
23 4
1 5
1
1 2 7
436030 4 11
Senegal Cote d’Ivoire Mali Burkina Faso DRC
Mines (x3)Development project (x1)Feasibility project (x1)
Mining
Feasiprojecresoureserv
Explotarget
Identifgeoloanom
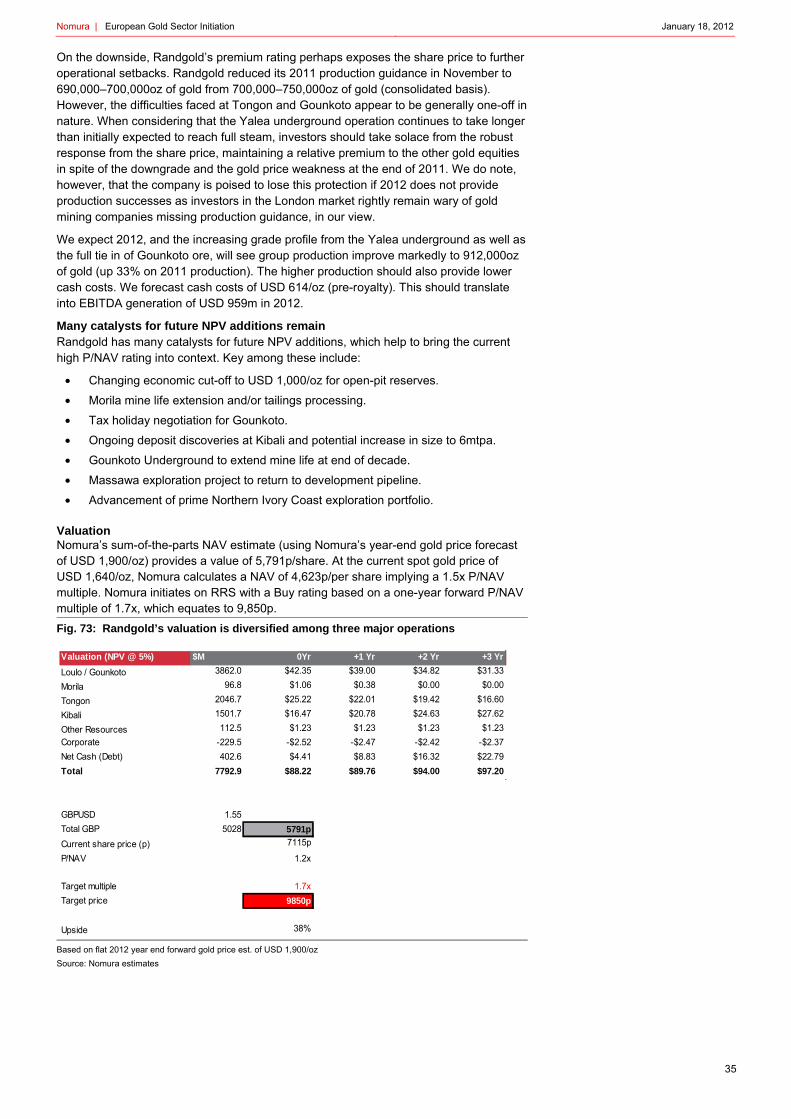
Nomura | European Gold Sector Initiation January 18, 2012
35
On the downside, Randgold’s premium rating perhaps exposes the share price to further operational setbacks. Randgold reduced its 2011 production guidance in November to 690,000–700,000oz of gold from 700,000–750,000oz of gold (consolidated basis). However, the difficulties faced at Tongon and Gounkoto appear to be generally one-off in nature. When considering that the Yalea underground operation continues to take longer than initially expected to reach full steam, investors should take solace from the robust response from the share price, maintaining a relative premium to the other gold equities in spite of the downgrade and the gold price weakness at the end of 2011. We do note, however, that the company is poised to lose this protection if 2012 does not provide production successes as investors in the London market rightly remain wary of gold mining companies missing production guidance, in our view.
We expect 2012, and the increasing grade profile from the Yalea underground as well as the full tie in of Gounkoto ore, will see group production improve markedly to 912,000oz of gold (up 33% on 2011 production). The higher production should also provide lower cash costs. We forecast cash costs of USD 614/oz (pre-royalty). This should translate into EBITDA generation of USD 959m in 2012.
Many catalysts for future NPV additions remain Randgold has many catalysts for future NPV additions, which help to bring the current high P/NAV rating into context. Key among these include:
• Changing economic cut-off to USD 1,000/oz for open-pit reserves.
• Morila mine life extension and/or tailings processing.
• Tax holiday negotiation for Gounkoto.
• Ongoing deposit discoveries at Kibali and potential increase in size to 6mtpa.
• Gounkoto Underground to extend mine life at end of decade.
• Massawa exploration project to return to development pipeline.
• Advancement of prime Northern Ivory Coast exploration portfolio.
Valuation Nomura’s sum-of-the-parts NAV estimate (using Nomura’s year-end gold price forecast of USD 1,900/oz) provides a value of 5,791p/share. At the current spot gold price of USD 1,640/oz, Nomura calculates a NAV of 4,623p/per share implying a 1.5x P/NAV multiple. Nomura initiates on RRS with a Buy rating based on a one-year forward P/NAV multiple of 1.7x, which equates to 9,850p. Fig. 73: Randgold’s valuation is diversified among three major operations
Based on flat 2012 year end forward gold price est. of USD 1,900/oz Source: Nomura estimates
Valuation (NPV @ 5%) $M 0Yr +1 Yr +2 Yr +3 Yr
Loulo / Gounkoto 3862.0 $42.35 $39.00 $34.82 $31.33
Morila 96.8 $1.06 $0.38 $0.00 $0.00
Tongon 2046.7 $25.22 $22.01 $19.42 $16.60
Kibali 1501.7 $16.47 $20.78 $24.63 $27.62
Other Resources 112.5 $1.23 $1.23 $1.23 $1.23Corporate -229.5 -$2.52 -$2.47 -$2.42 -$2.37Net Cash (Debt) 402.6 $4.41 $8.83 $16.32 $22.79Total 7792.9 $88.22 $89.76 $94.00 $97.20
GBPUSD 1.55Total GBP 5028 5791p
Current share price (p) 7115p
P/NAV 1.2x
Target multiple 1.7xTarget price 9850p
Upside 38%
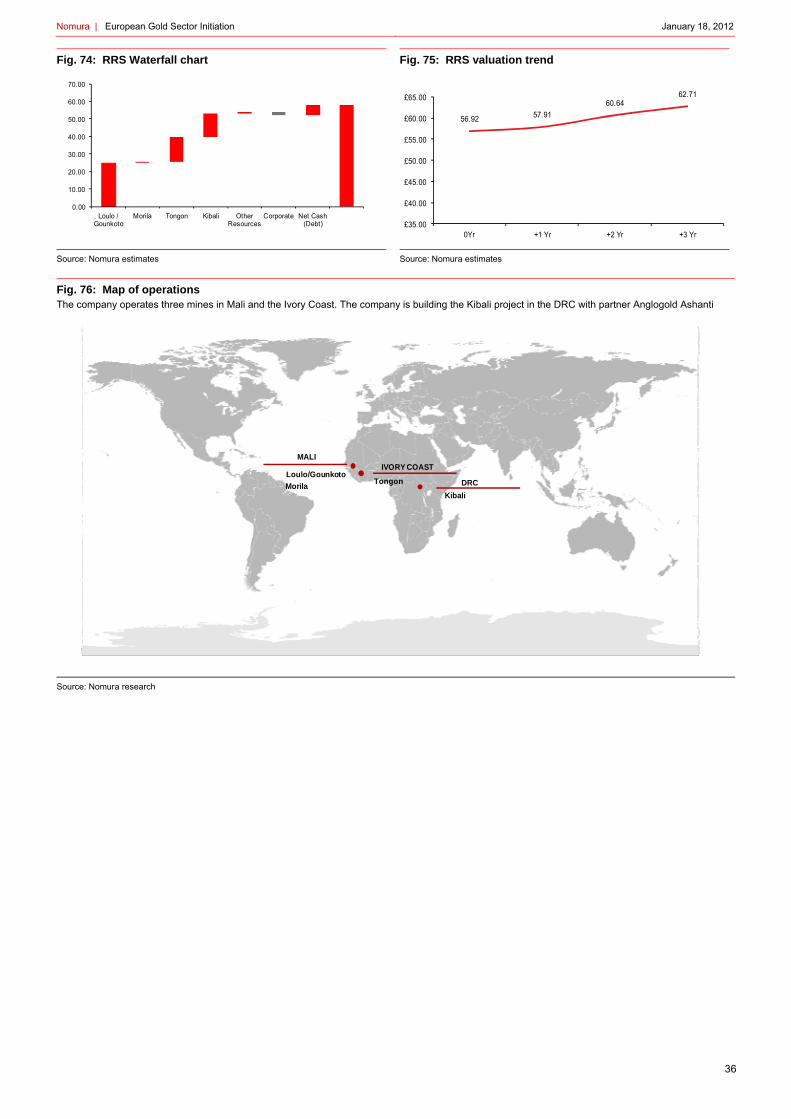
Nomura | European Gold Sector Initiation January 18, 2012
36
Fig. 74: RRS Waterfall chart
Source: Nomura estimates
Fig. 75: RRS valuation trend
Source: Nomura estimates
Fig. 76: Map of operations The company operates three mines in Mali and the Ivory Coast. The company is building the Kibali project in the DRC with partner Anglogold Ashanti
Source: Nomura research
0.00
10.00
20.00
30.00
40.00
50.00
60.00
70.00
Loulo / Gounkoto
Morila Tongon Kibali Other Resources
Corporate Net Cash (Debt)
56.92 57.9160.64
62.71
£35.00
£40.00
£45.00
£50.00
£55.00
£60.00
£65.00
0Yr +1 Yr +2 Yr +3 Yr
MALIIVORY COAST
DRC
Kibali
Tongon Loulo/Gounkoto
Morila

Nomura | European Gold Sector Initiation January 18, 2012
37
Company summary
Randgold Resources is an intermediate gold producer listed on the LSE (RRS) and NASDAQ (GOLD). Randgold operates four mines/projects in sub-Saharan Africa including the Loulo/Gounkoto (80%) underground and open-pit gold complex in Mali, the later-life Morila (45%) mine in Mali, the Tongon (90%) open-pit gold mine in the Ivory Coast and the Kibali (45%) open-pit and underground development project in the DRC. Randgold also holds substantial exploration ground in West Africa in Mali, Ivory Coast, Burkina Faso, Senegal and the DRC.
Fig. 77: RRS production and cash costs forecast Attributable production shows big gains in 2012E
Source: Company data, Nomura estimates
Asset Summary
Loulo-Gounkoto complex (80%) – Mali
Loulo The Loulo/Gounkoto mining complex, located on the border of Mali and Senegal, lies within the Kedougou-Kenieba inlier of Birimian geology, which is host to several major gold deposits. The complex is made up of three open-pit mines (Loulo 3, Yalea and Gara) and two underground operations (Yalea and Gara). Randgold owns 80% of the operations with the remaining 20% held by the State of Mali, whose stake is financed by way of a shareholder loan; this gives Randgold control over 100% of the cash flows until this loan is repaid (c. USD 350m outstanding as at the end of 2010).
Loulo/Gounkoto is undergoing a phase of significant development and has failed to meet its initial production guidance in each of the past two years. The 2010 production level of 316,539oz (target: 400,000oz) was forecast to remain roughly flat in 2011, but has been affected by abnormal rainfall in August (a once-in-a-hundred-year event) and unexpected downtime associated with the tie-in of new tailings pipeline. On the upside, the Yalea underground development has now reached the higher grade ‘purple patch’, an area of c. 10g/t, which, along with the higher grades from Gounkoto, should provide a boost to output and help mitigate cash cost inflation.
Having upgraded the secondary ore crushing circuit in 2010, Randgold is now upgrading the power plant and is building a new mill. By 2015, the mine has the potential to produce over 750,000oz of gold per year. Our forecasts are somewhat conservative owing to a flatter grade profile with production maxing out near 620,000oz (including Gounkoto). As per the 2010 resource update, reserves at the Loulo mine are 6.52moz (resources – 11.37moz), implying a mine life of around nine years. However, given the continued underground development and exploration at Yalea and Gara, the potential to process open-pit resources from other nearby satellite deposits and the potential for Gounkoto, the complex is likely to stay active for far longer than this.
0.00
100.00
200.00
300.00
400.00
500.00
600.00
700.00
800.00
0
100,000
200,000
300,000
400,000
500,000
600,000
700,000
800,000
900,000
1,000,000
2009 2010 2011E 2012E 2013E 2014E 2015E
Loulo / Gounkoto Morila Tongon Kibali Cash cost per ounce
gold
pro
duct
ion
(oz)
US
$/oz
cash
cos
ts
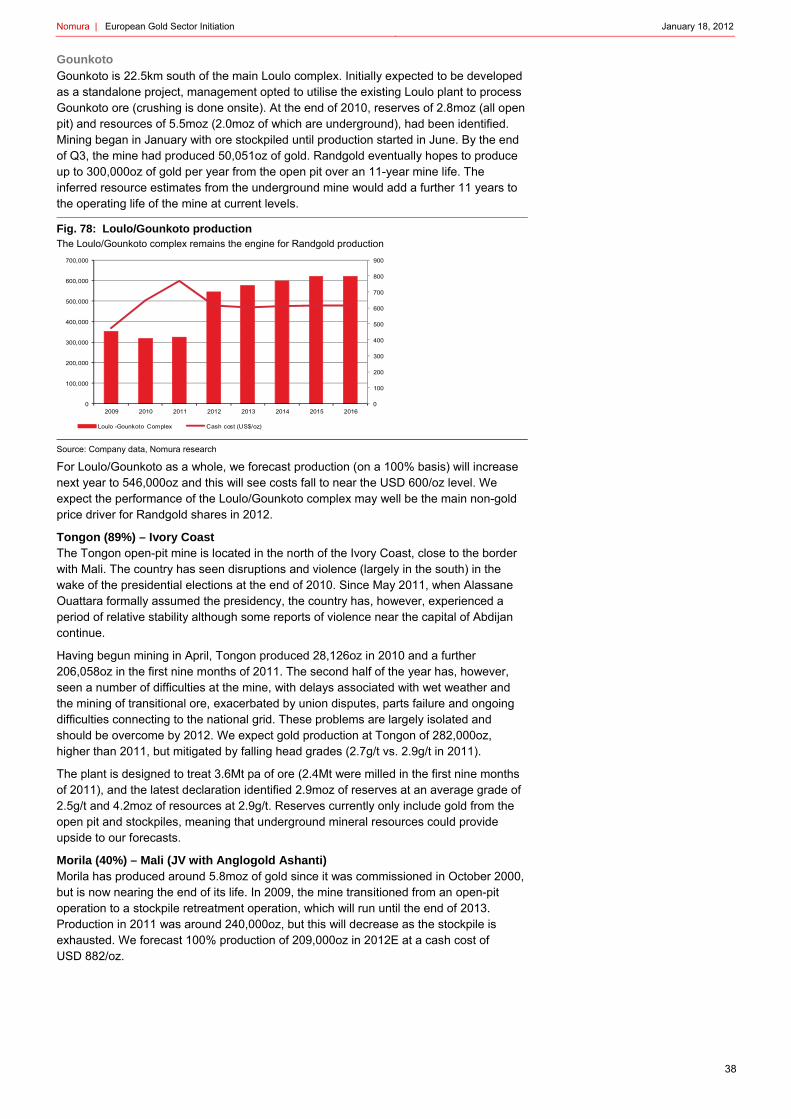
Nomura | European Gold Sector Initiation January 18, 2012
38
Gounkoto Gounkoto is 22.5km south of the main Loulo complex. Initially expected to be developed as a standalone project, management opted to utilise the existing Loulo plant to process Gounkoto ore (crushing is done onsite). At the end of 2010, reserves of 2.8moz (all open pit) and resources of 5.5moz (2.0moz of which are underground), had been identified. Mining began in January with ore stockpiled until production started in June. By the end of Q3, the mine had produced 50,051oz of gold. Randgold eventually hopes to produce up to 300,000oz of gold per year from the open pit over an 11-year mine life. The inferred resource estimates from the underground mine would add a further 11 years to the operating life of the mine at current levels.
Fig. 78: Loulo/Gounkoto production The Loulo/Gounkoto complex remains the engine for Randgold production
Source: Company data, Nomura research
For Loulo/Gounkoto as a whole, we forecast production (on a 100% basis) will increase next year to 546,000oz and this will see costs fall to near the USD 600/oz level. We expect the performance of the Loulo/Gounkoto complex may well be the main non-gold price driver for Randgold shares in 2012.
Tongon (89%) – Ivory Coast The Tongon open-pit mine is located in the north of the Ivory Coast, close to the border with Mali. The country has seen disruptions and violence (largely in the south) in the wake of the presidential elections at the end of 2010. Since May 2011, when Alassane Ouattara formally assumed the presidency, the country has, however, experienced a period of relative stability although some reports of violence near the capital of Abdijan continue.
Having begun mining in April, Tongon produced 28,126oz in 2010 and a further 206,058oz in the first nine months of 2011. The second half of the year has, however, seen a number of difficulties at the mine, with delays associated with wet weather and the mining of transitional ore, exacerbated by union disputes, parts failure and ongoing difficulties connecting to the national grid. These problems are largely isolated and should be overcome by 2012. We expect gold production at Tongon of 282,000oz, higher than 2011, but mitigated by falling head grades (2.7g/t vs. 2.9g/t in 2011).
The plant is designed to treat 3.6Mt pa of ore (2.4Mt were milled in the first nine months of 2011), and the latest declaration identified 2.9moz of reserves at an average grade of 2.5g/t and 4.2moz of resources at 2.9g/t. Reserves currently only include gold from the open pit and stockpiles, meaning that underground mineral resources could provide upside to our forecasts.
Morila (40%) – Mali (JV with Anglogold Ashanti) Morila has produced around 5.8moz of gold since it was commissioned in October 2000, but is now nearing the end of its life. In 2009, the mine transitioned from an open-pit operation to a stockpile retreatment operation, which will run until the end of 2013. Production in 2011 was around 240,000oz, but this will decrease as the stockpile is exhausted. We forecast 100% production of 209,000oz in 2012E at a cash cost of USD 882/oz.
0
100
200
300
400
500
600
700
800
900
0
100,000
200,000
300,000
400,000
500,000
600,000
700,000
2009 2010 2011 2012 2013 2014 2015 2016
Loulo -Gounkoto Complex Cash cost (US$/oz)

Nomura | European Gold Sector Initiation January 18, 2012
39
In 2010, management began investigating the feasibility of re-treating low grade Tailing Storage Facility material; a detailed schedule and financial model is planned to be communicated to the market in the coming weeks. Initial estimates suggest that this will extend the mine life by a further five years. The higher gold prices are also providing the potential for another pushback of the open pit. We have not included any upside potential from these projects in our current valuation, although Morila could be reasonably expected to last longer and provide additional cash flow at the current higher gold prices.
Kibali (45%) – DRC (JV with Anglogold Ashanti) Kibali is a very large development project located in the north-eastern corner of the Democratic Republic of Congo with reserves of 10.1moz and resources (including inferred) of 18.5moz. The project is 90% owned by a Randgold and Anglogold Ashanti joint venture, with the remaining 10% equity held by the government.
The project is in the early stages, with the RAP (Relocation Action Plan) resettling 250 families and developing local infrastructure; the pit opening is planned for 2012 with production beginning in late 2013. Based on current resource estimates, Randgold expects that the completed mill will process 4Mtpa over a mine life of 19 years, split roughly equally between open-pit and underground ore (37mt).
Owing to positive subsequent exploration results, and an already long life of mine, we expect Kibali will be built to process 6mtpa or more of ore. We have included the 6mtpa level in our forecasts, but a larger Kibali would provide yet another potential P/NAV catalyst.
Total capital expenditure, including that already spent in 2010, is estimated at USD 1.4bn, for the 4mtpa plant, we expect that this is likely to be closer to USD 1.7bn for the larger project. This includes the capital covers for hydropower installations and the ongoing capital requirements to develop the underground. As such, Kibali and Randgold’s 40% share of the capital cost, will be a significant drain on free cash flow in the next couple of years, but is then estimated to produce upwards of 500,000oz by 2016 with cash costs over the life of the mine estimated to be only around USD 380/oz.
This world-class project encompasses an area of 1,834 sq km, with a number of prospective, but as-yet-unquantified gold deposits. Fig. 78 shows the new trend to the west of the main KCD deposit. We note that this region may contain far more ounces than the current resource and there could be the potential for a further project to be developed in the region in due course.
Fig. 79: Kibali region map A new trend to the East of KCD could provide further regional resource upside at Kibali
Source: Company data
Gold depositGold target
KCD
Au ppb
NIkamva Kalimva
Oere
Mofu
KCD
Renzi
Aindi WatsaZambula
Kulikongo
Gambari
Lulu North/South
Hotel
Dembu fold
ZambulaWest
Ogagu
AbimvaAbimva
North East
Rambi Kiasi
ZambulaTarget
10km
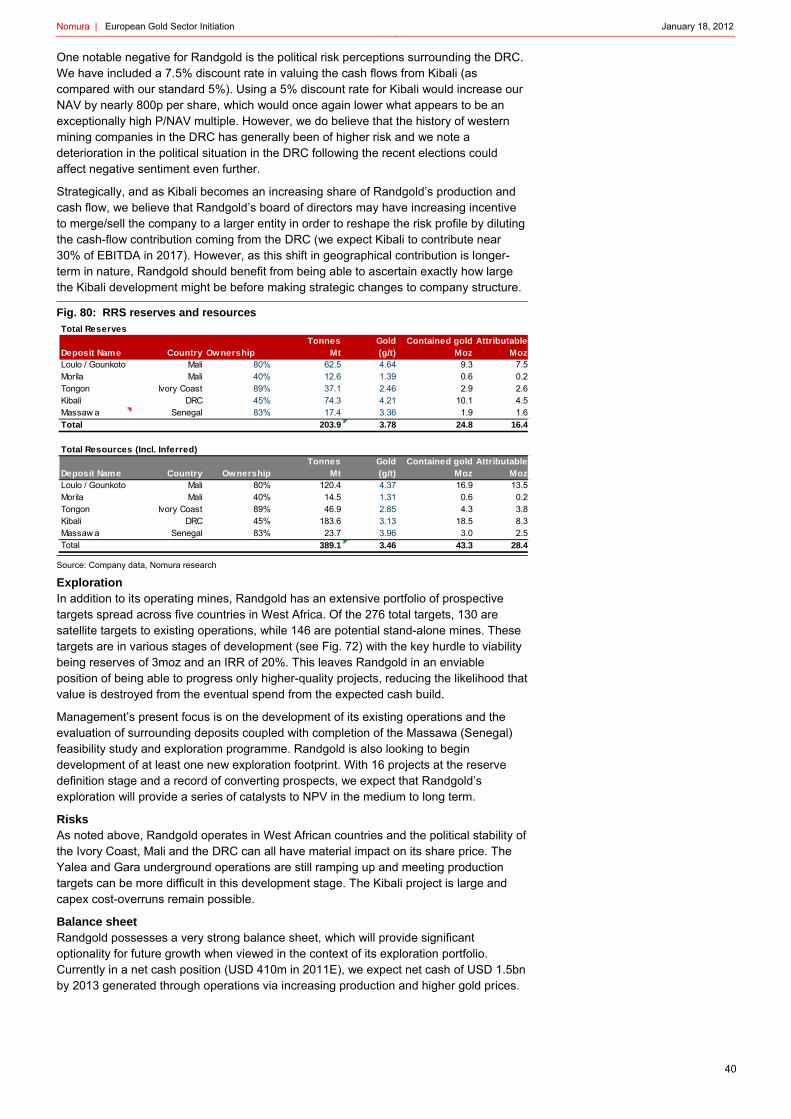
Nomura | European Gold Sector Initiation January 18, 2012
40
One notable negative for Randgold is the political risk perceptions surrounding the DRC. We have included a 7.5% discount rate in valuing the cash flows from Kibali (as compared with our standard 5%). Using a 5% discount rate for Kibali would increase our NAV by nearly 800p per share, which would once again lower what appears to be an exceptionally high P/NAV multiple. However, we do believe that the history of western mining companies in the DRC has generally been of higher risk and we note a deterioration in the political situation in the DRC following the recent elections could affect negative sentiment even further.
Strategically, and as Kibali becomes an increasing share of Randgold’s production and cash flow, we believe that Randgold’s board of directors may have increasing incentive to merge/sell the company to a larger entity in order to reshape the risk profile by diluting the cash-flow contribution coming from the DRC (we expect Kibali to contribute near 30% of EBITDA in 2017). However, as this shift in geographical contribution is longer-term in nature, Randgold should benefit from being able to ascertain exactly how large the Kibali development might be before making strategic changes to company structure.
Fig. 80: RRS reserves and resources
Source: Company data, Nomura research
Exploration In addition to its operating mines, Randgold has an extensive portfolio of prospective targets spread across five countries in West Africa. Of the 276 total targets, 130 are satellite targets to existing operations, while 146 are potential stand-alone mines. These targets are in various stages of development (see Fig. 72) with the key hurdle to viability being reserves of 3moz and an IRR of 20%. This leaves Randgold in an enviable position of being able to progress only higher-quality projects, reducing the likelihood that value is destroyed from the eventual spend from the expected cash build.
Management’s present focus is on the development of its existing operations and the evaluation of surrounding deposits coupled with completion of the Massawa (Senegal) feasibility study and exploration programme. Randgold is also looking to begin development of at least one new exploration footprint. With 16 projects at the reserve definition stage and a record of converting prospects, we expect that Randgold’s exploration will provide a series of catalysts to NPV in the medium to long term.
Risks As noted above, Randgold operates in West African countries and the political stability of the Ivory Coast, Mali and the DRC can all have material impact on its share price. The Yalea and Gara underground operations are still ramping up and meeting production targets can be more difficult in this development stage. The Kibali project is large and capex cost-overruns remain possible.
Balance sheet Randgold possesses a very strong balance sheet, which will provide significant optionality for future growth when viewed in the context of its exploration portfolio. Currently in a net cash position (USD 410m in 2011E), we expect net cash of USD 1.5bn by 2013 generated through operations via increasing production and higher gold prices.
Tonnes Gold Contained gold AttributableDeposit Name Country Ownership Mt (g/t) Moz MozLoulo / Gounkoto Mali 80% 62.5 4.64 9.3 7.5Morila Mali 40% 12.6 1.39 0.6 0.2Tongon Ivory Coast 89% 37.1 2.46 2.9 2.6Kibali DRC 45% 74.3 4.21 10.1 4.5Massaw a Senegal 83% 17.4 3.36 1.9 1.6Total 203.9 3.78 24.8 16.4
Total Resources (Incl. Inferred)Tonnes Gold Contained gold Attributable
Deposit Name Country Ownership Mt (g/t) Moz MozLoulo / Gounkoto Mali 80% 120.4 4.37 16.9 13.5Morila Mali 40% 14.5 1.31 0.6 0.2Tongon Ivory Coast 89% 46.9 2.85 4.3 3.8Kibali DRC 45% 183.6 3.13 18.5 8.3Massaw a Senegal 83% 23.7 3.96 3.0 2.5Total 389.1 3.46 43.3 28.4
Total Reserves

Nomura | European Gold Sector Initiation January 18, 2012
41
Fig. 81: RRS EBITDA and capex profile Already strong EBITDA is expected to increase
Source: Company data, Nomura estimates
Fig. 82: RRS debt profile and debt ratio Even after Kibali capital spending we calculate a generous cash build
Source: Company data, Nomura estimates
Fig. 83: RRS EPS and P/E forecasts @USD 1,900/oz flat goldEPS is expected to increase keeping the P/E at below historical levels
Source: Company data, Nomura estimates
Fig. 84: RRS EPS and P/E forecasts @ long-term prices P/E remains below 20x despite falling mid decade gold price
Source: Company data, Nomura estimates
Fig. 85: Price chart (GBp) 2011 was a year of two halves, the company outperformed in the second half following the end of conflict in the Ivory Coast
Source: Datastream
Fig. 86: Historical P/E Randgold's shares have de-rated in line with the sector
Source: Datastream
DS World gold mining index, indexed to RRS at Jan. 2009
Management and significant shareholders
Board/management Chairman – Philippe Liétard
CEO – Mark Bristow
CFO – Graham Shuttleworth
Significant shareholders Blackrock – 13.9%
Fidelity – 9.9%
-600
-400
-200
0
200
400
600
800
1,000
1,200
1,400
2009 2010 2011 2012e 2013e 2014e 2015e 2016eEBITDA ($M) Capex ($M)
0
500
1,000
1,500
2,000
2,500
3,000
3,500
2009 2010 2011 2012e 2013e 2014e 2015e 2016e
Net Cash (Debt) ($M)
0
20
40
60
80
100
120
140
0
100
200
300
400
500
600
700
800
900
1,000
2009 2010 2011 2012e 2013e 2014e 2015e 2016eEPS P/E (x)
0
20
40
60
80
100
120
140
0
100
200
300
400
500
600
700
800
900
1,000
2009 2010 2011 2012e 2013e 2014e 2015e 2016eEPS P/E (x)
0
1000
2000
3000
4000
5000
6000
7000
8000
Randgold DS World gold mining index
0
5
10
15
20
25
30
35
40
45
Dec
-09
Jan-
10
Feb
-10
Mar
-10
Apr
-10
May
-10
Jun-
10
Jul-1
0
Aug
-10
Sep
-10
Oct
-10
Nov
-10
Dec
-10
Jan-
11
Feb
-11
Mar
-11
Apr
-11
May
-11
Jun-
11
Jul-1
1
Aug
-11
Sep
-11
Oct
-11
Nov
-11
Dec
-11
Forward P/E
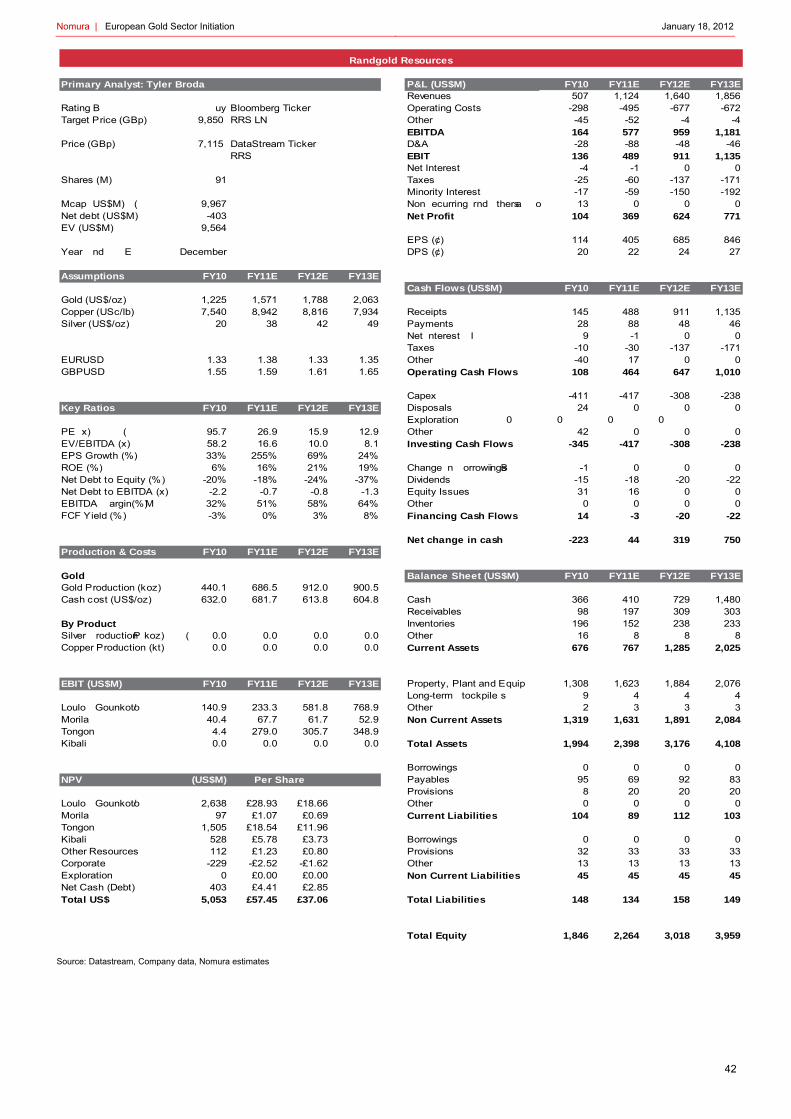
Nomura | European Gold Sector Initiation January 18, 2012
42
Source: Datastream, Company data, Nomura estimates
P&L (US$M) FY10 FY11E FY12E FY13ERevenues 507 1,124 1,640 1,856
Rating B uy Bloomberg Ticker Operating Costs -298 -495 -677 -672Target Price (GBp) 9,850 RRS LN Other -45 -52 -4 -4
EBITDA 164 577 959 1,181Price (GBp) 7,115 DataStream Ticker D&A -28 -88 -48 -46
RRS EBIT 136 489 911 1,135Net Interest -4 -1 0 0
Shares (M) 91 Taxes -25 -60 -137 -171Minority Interest -17 -59 -150 -192
Mcap (US$M) 9,967 Non recurring and others 13 0 0 0Net debt (US$M) -403 Net Profit 104 369 624 771EV (US$M) 9,564
EPS (¢) 114 405 685 846Year End December DPS (¢) 20 22 24 27
Assumptions FY10 FY11E FY12E FY13ECash Flows (US$M) FY10 FY11E FY12E FY13E
Gold (US$/oz) 1,225 1,571 1,788 2,063Copper (USc/lb) 7,540 8,942 8,816 7,934 Receipts 145 488 911 1,135Silver (US$/oz) 20 38 42 49 Payments 28 88 48 46
Net Interest 9 -1 0 0Taxes -10 -30 -137 -171
EURUSD 1.33 1.38 1.33 1.35 Other -40 17 0 0GBPUSD 1.55 1.59 1.61 1.65 Operating Cash Flows 108 464 647 1,010
Capex -411 -417 -308 -238Key Ratios FY10 FY11E FY12E FY13E Disposals 24 0 0 0
Exploration 0 0 0 0PE (x) 95.7 26.9 15.9 12.9 Other 42 0 0 0EV/EBITDA (x) 58.2 16.6 10.0 8.1 Investing Cash Flows -345 -417 -308 -238EPS Growth (%) 33% 255% 69% 24%ROE (%) 6% 16% 21% 19% Change in Borrowings -1 0 0 0Net Debt to Equity (%) -20% -18% -24% -37% Dividends -15 -18 -20 -22Net Debt to EBITDA (x) -2.2 -0.7 -0.8 -1.3 Equity Issues 31 16 0 0EBITDA Margin(%) 32% 51% 58% 64% Other 0 0 0 0FCF Yield (%) -3% 0% 3% 8% Financing Cash Flows 14 -3 -20 -22
Net change in cash -223 44 319 750Production & Costs FY10 FY11E FY12E FY13E
Gold Balance Sheet (US$M) FY10 FY11E FY12E FY13EGold Production (koz) 440.1 686.5 912.0 900.5Cash cost (US$/oz) 632.0 681.7 613.8 604.8 Cash 366 410 729 1,480
Receivables 98 197 309 303By Product Inventories 196 152 238 233Silver Production (koz) 0.0 0.0 0.0 0.0 Other 16 8 8 8Copper Production (kt) 0.0 0.0 0.0 0.0 Current Assets 676 767 1,285 2,025
EBIT (US$M) FY10 FY11E FY12E FY13E Property, Plant and Equip 1,308 1,623 1,884 2,076Long-term stockpile 9 4 4 4
Loulo / Gounkoto 140.9 233.3 581.8 768.9 Other 2 3 3 3Morila 40.4 67.7 61.7 52.9 Non Current Assets 1,319 1,631 1,891 2,084Tongon 4.4 279.0 305.7 348.9Kibali 0.0 0.0 0.0 0.0 Total Assets 1,994 2,398 3,176 4,108
Borrowings 0 0 0 0NPV (US$M) Payables 95 69 92 83
Provisions 8 20 20 20Loulo / Gounkoto 2,638 £28.93 £18.66 Other 0 0 0 0Morila 97 £1.07 £0.69 Current Liabilities 104 89 112 103Tongon 1,505 £18.54 £11.96Kibali 528 £5.78 £3.73 Borrowings 0 0 0 0Other Resources 112 £1.23 £0.80 Provisions 32 33 33 33Corporate -229 -£2.52 -£1.62 Other 13 13 13 13Exploration 0 £0.00 £0.00 Non Current Liabilities 45 45 45 45Net Cash (Debt) 403 £4.41 £2.85Total US$ 5,053 £57.45 £37.06 Total Liabilities 148 134 158 149
Total Equity 1,846 2,264 3,018 3,959
Randgold Resources
Per Share
Primary Analyst: Tyler Broda

Nomura | European Gold Sector Initiation January 18, 2012
43
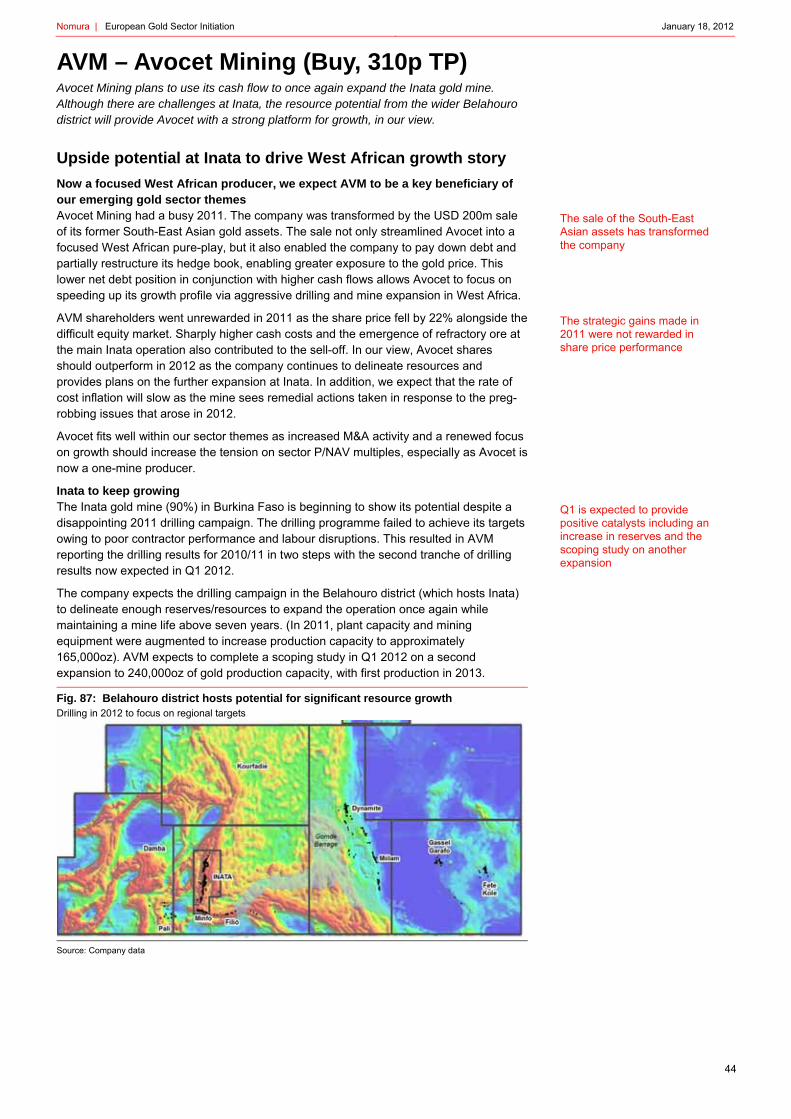
Nomura | European Gold Sector Initiation January 18, 2012
44
AVM – Avocet Mining (Buy, 310p TP) Avocet Mining plans to use its cash flow to once again expand the Inata gold mine. Although there are challenges at Inata, the resource potential from the wider Belahouro district will provide Avocet with a strong platform for growth, in our view.
Upside potential at Inata to drive West African growth story
Now a focused West African producer, we expect AVM to be a key beneficiary of our emerging gold sector themes Avocet Mining had a busy 2011. The company was transformed by the USD 200m sale of its former South-East Asian gold assets. The sale not only streamlined Avocet into a focused West African pure-play, but it also enabled the company to pay down debt and partially restructure its hedge book, enabling greater exposure to the gold price. This lower net debt position in conjunction with higher cash flows allows Avocet to focus on speeding up its growth profile via aggressive drilling and mine expansion in West Africa.
AVM shareholders went unrewarded in 2011 as the share price fell by 22% alongside the difficult equity market. Sharply higher cash costs and the emergence of refractory ore at the main Inata operation also contributed to the sell-off. In our view, Avocet shares should outperform in 2012 as the company continues to delineate resources and provides plans on the further expansion at Inata. In addition, we expect that the rate of cost inflation will slow as the mine sees remedial actions taken in response to the preg-robbing issues that arose in 2012.
Avocet fits well within our sector themes as increased M&A activity and a renewed focus on growth should increase the tension on sector P/NAV multiples, especially as Avocet is now a one-mine producer.
Inata to keep growing The Inata gold mine (90%) in Burkina Faso is beginning to show its potential despite a disappointing 2011 drilling campaign. The drilling programme failed to achieve its targets owing to poor contractor performance and labour disruptions. This resulted in AVM reporting the drilling results for 2010/11 in two steps with the second tranche of drilling results now expected in Q1 2012.
The company expects the drilling campaign in the Belahouro district (which hosts Inata) to delineate enough reserves/resources to expand the operation once again while maintaining a mine life above seven years. (In 2011, plant capacity and mining equipment were augmented to increase production capacity to approximately 165,000oz). AVM expects to complete a scoping study in Q1 2012 on a second expansion to 240,000oz of gold production capacity, with first production in 2013.
Fig. 87: Belahouro district hosts potential for significant resource growth Drilling in 2012 to focus on regional targets
Source: Company data
The sale of the South-East Asian assets has transformed the company
The strategic gains made in 2011 were not rewarded in share price performance
Q1 is expected to provide positive catalysts including an increase in reserves and the scoping study on another expansion

Nomura | European Gold Sector Initiation January 18, 2012
45
Guinea to provide blue sky beyond Inata Beyond Inata, Avocet continues to progress the Tri-K exploration asset in the Siguiri Basin in Guinea. Guinea hosts two large scale gold mines: AngloGold Ashanti’s 5.6moz Siguiri mine and Nord Gold’s 5.9moz LEFA mine. A total of USD 40.5m is budgeted group wide for the 2011/12 exploration season, and of this, USD 15m is likely to be spent in Guinea. Current resources of 2.2moz at Tri-K and the Guinean exploration programme could provide a meaningful catalyst for the shares in 2012.
Expanded, de-hedged Inata not priced in Following Avocet’s decision to use USD 40m in proceeds from the South-East Asian asset sale to reduce the size of the hedge book, the Inata mine is now contracted to deliver 33,000oz per year at a price of USD 950/oz until 2018 vs. 100,000oz at USD 970/oz until 2014 previously. Although this increases the length of the hedge, the transaction has increased Inata’s exposure to the gold price (which we now calculate to be 90% for 2012) and was incrementally positive to our NPV assumptions.
An expansion of Inata is likely to only reduce the impact of the hedge further. We calculate a positive NPV of USD 465m for a USD 150m capital expansion (conservatively higher than management guidance of USD 120m). This could generate gold production capacity of 240,000oz by mid-2013. We have included this value (with a 20% completion risk) in our valuation. Following the recent difficulties at the operations, the market has thus far taken a wait-and-see approach, and we believe this provides an interesting entry point.
Valuation Nomura’s one-year forward sum-of-the-parts NAV estimate (using Nomura’s year-end quarterly gold price forecast of USD 1,900/oz and a 5% discount rate) provides a value of 348p/share. At the current spot gold price of USD 1,640/oz Nomura calculates a NAV of 285p/per share implying a 0.8x P/NAV multiple. Nomura initiates on AVM with a Buy rating based on a one-year exit gold price of USD 1,900/oz and a P/NAV multiple of 0.9x, which equates to 310p.
Fig. 88: Inata accounts for the vast majority of our asset level valuation
Source: Nomura estimates – based on flat one-year forward gold price est. of USD 1,900/oz
Valuation (NPV @ 5%) $M 0Yr +1 Yr +2 Yr +3 Yr
Inata 1006.6 $4.93 $5.04 $4.83 $4.53
Other Resources 124.1 $0.62 $0.62 $0.62 $0.62Corporate -116.7 -$0.58 -$0.57 -$0.55 -$0.53Exploration 0.0 $0.00 $0.00 $0.00 $0.00Net Cash (Debt) -85.4 -$0.43 $0.30 $0.51 $1.36Total 928.6 $4.54 $5.39 $5.41 $5.99
GBPUSD 1.55Total GBP 599 348p
Current share price (p) 214p
P/NAV 0.6x
Target multiple 0.9xTarget price 310p
Upside 45%
Siguiri Basin in Guinea provides upside potential for the company in Koulekoun and Koderian targets
The impact from the hedge has been reduced by the proceeds from the asset sale – we calculate AVM will achieve 90% of spot in 2012
An Inata expansion, unrisked, would provide an incremental USD 252m in NAV
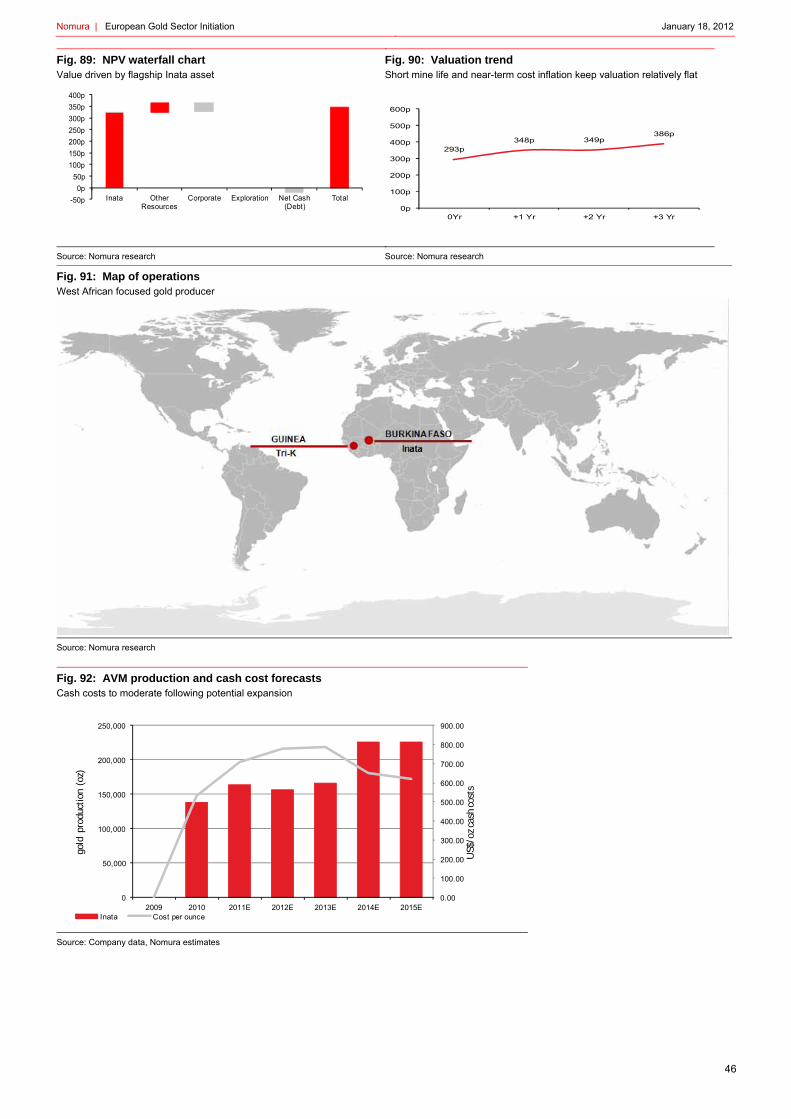
Nomura | European Gold Sector Initiation January 18, 2012
46
Fig. 89: NPV waterfall chart Value driven by flagship Inata asset
Source: Nomura research
Fig. 90: Valuation trend Short mine life and near-term cost inflation keep valuation relatively flat
Source: Nomura research
Fig. 91: Map of operations West African focused gold producer
Source: Nomura research
Fig. 92: AVM production and cash cost forecasts Cash costs to moderate following potential expansion
Source: Company data, Nomura estimates
-50p0p
50p100p150p200p250p300p350p400p
Inata Other Resources
Corporate Exploration Net Cash (Debt)
Total
293p348p 349p
386p
0p
100p
200p
300p
400p
500p
600p
0Yr +1 Yr +2 Yr +3 Yr
0.00
100.00
200.00
300.00
400.00
500.00
600.00
700.00
800.00
900.00
0
50,000
100,000
150,000
200,000
250,000
2009 2010 2011E 2012E 2013E 2014E 2015EInata Cost per ounce
gold
pro
duct
ion
(oz)
US$
/oz c
ash
cost
s

Nomura | European Gold Sector Initiation January 18, 2012
47
Company summary
Avocet Mining is an LSE- and Oslo-listed junior gold producer with operations in Burkina Faso and Guinea. Avocet divested its non-core Asian assets (the Penjom gold mine in Malaysia and the North Lanut gold mine in Indonesia) in 2011 for USD 200m in cash. The company’s flagship asset is the Inata gold mine in Burkina Faso, responsible for 100% of group production. AVM also has exploration activities in Guinea and Mali.
Asset summary
Inata Gold Mine (90%) – Burkina Faso The open-pit Inata gold mine is located in northern Burkina Faso near the border with Mali. The mine produced 137,700oz of gold in 2010 at a cash cost of USD 531/oz. We forecast production of 164,000oz of gold in 2011 at a cash cost of USD 706/oz.
Avocet Mining acquired the Inata gold development project in 2009 by purchasing Wega Mining, a junior Norwegian mining company, for USD 109m. The sale was at a distressed price after cost overruns and the global financial crisis placed the development in doubt.
Following the acquisition and a reset development plan, Avocet brought Inata into production, on time, and on budget, in Q2 2009. Total capex was USD 195m (of which USD 43m was paid by Avocet post acquisition). Since then, Inata has emerged as a leading gold mine in Burkina Faso, which itself is emerging as a significant West African producer. In 2010, Burkina Faso produced 25 tonnes of gold, up 85% on 2009. This ranks the country 5th in Africa behind South Africa, Ghana, Tanzania and Mali in total gold production.
As of 30 June, Inata had 1.3moz of attributable gold reserves at an average grade of 1.9g/t and 2.1moz of attributable gold resource at an average grade of 1.7g/t. The level of reserves has been constrained by the disappointing 2010/11 drilling campaign (in West Africa, generally August and September are the wet season and exploration activities are halted). The company expects to increase its booked reserves in Q1 as follow-up drilling and the results from over 16,000 assays are announced to the market. The company has a target of 1.6moz of attributable gold reserves, which would imply a mine life of over 10 years based on current mining rates.
Fig. 93: Inata Gold Mine Avocet's flagship asset
Source: Avocet Mining
Expansion potential In July 2011, Avocet announced that it undergoing a new scoping study to increase production at Inata, again.
The former owners of the project were focussed on bringing Inata into production as soon as possible. This, in the context of successful post-acquisition drilling results, led to the mine being built with far too small a production capacity for the total potential resource base. Avocet has set out to change this.
Inata was purchased by Avocet as part of the Wega Mining acquisition in 2009
Burkina Faso ranked 5th in African gold production in 2012

Nomura | European Gold Sector Initiation January 18, 2012
48
The mine was expanded in 2010 from its original production capacity of 2.2m tonnes per annum of throughput to 2.7m tonnes via the expansion of the elusion circuit and the addition of mining equipment.
Avocet is now looking to increase capacity further. Initial plans are for Avocet to announce the results of a scoping study analysing the potential to expand production to 4.0m tonnes of throughput which would allow for annual production of c. 240,000oz. Management expects capital expenditure to be in the region of USD 120m.
We believe the announcement of the commissioning of this scoping study in advance of the release of the full drill results from the 2010/2011 season bodes well for the potential from the drill results in Q1. Fig. 87 shows that there remains significant regional potential on top of the near-pit reserve extensions seen in Fig. 94.
Fig. 94: Avocet’s understanding of the ore body has improved
Source: Avocet Mining
We have included an expansion in our base-case scenario; however, we have risked its value by 20% as the full value generated will be dependent on new, near-mine reserves being added at similar grades to the current reserve statement. In addition, we have included a 20% cost overrun on the capital expenditure to remain conservative in our estimates. Our analysis provides a positive (unrisked) NPV of USD 465m.
Tri-K (85%) – Guinea Tri-K is an exploration project in the north-east of Guinea consisting of three main licences: Koulékon, Kodiéran and Kodiafaran. Per an update in December, drilling at these sites has identified a combined 2.2moz of inferred resource at Koulékoun and Kodiéran and the former is now at the feasibility-study stage. The target is to continue to increase mineral resources to 2.5moz before commencing construction.
Despite these mineral resources, Guinea – even in the context of West Africa – is a difficult country in which to operate (ranked 179 of 183 in the World Bank’s “Ease of doing business” index). The newly formed government of Guinea did, however, recently release a draft of a new Mining Code and the company expects to meet officials in Q1 2012. Avocet’s decision to move to the construction phase, potentially in 2012, will be dependent on both the outcome of these meetings and continued positive results from their exploratory drilling.
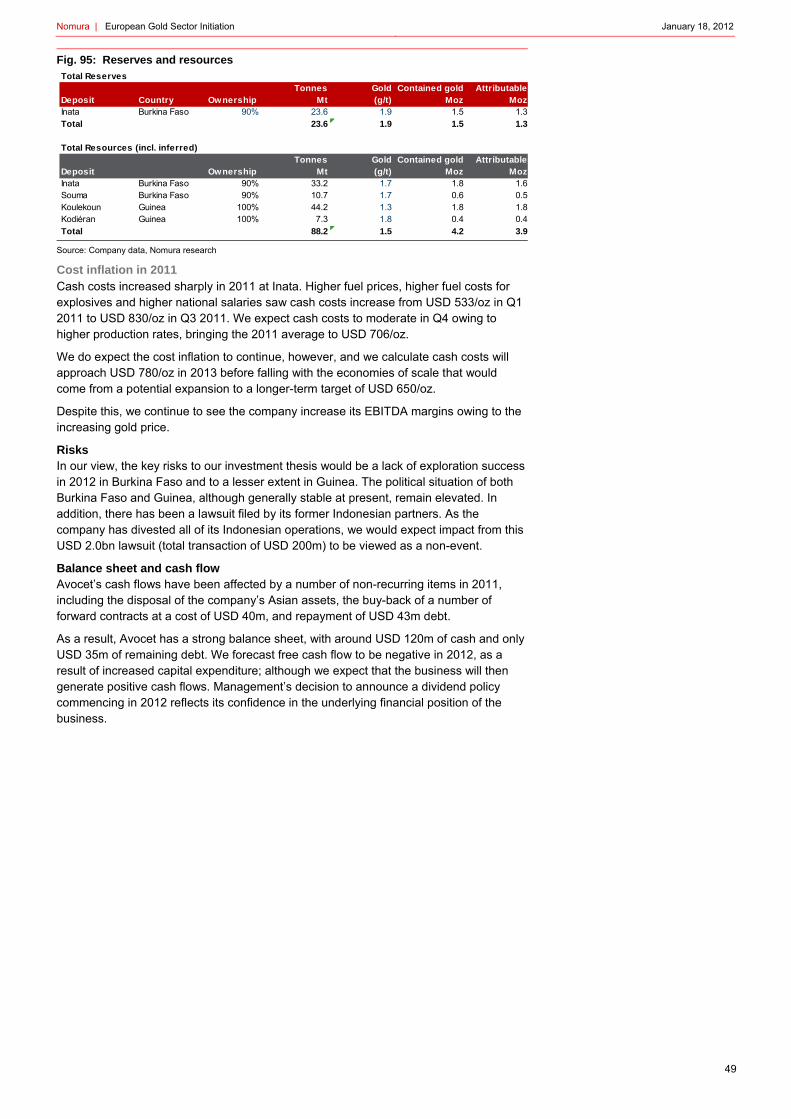
Nomura | European Gold Sector Initiation January 18, 2012
49
Fig. 95: Reserves and resources
Source: Company data, Nomura research
Cost inflation in 2011 Cash costs increased sharply in 2011 at Inata. Higher fuel prices, higher fuel costs for explosives and higher national salaries saw cash costs increase from USD 533/oz in Q1 2011 to USD 830/oz in Q3 2011. We expect cash costs to moderate in Q4 owing to higher production rates, bringing the 2011 average to USD 706/oz.
We do expect the cost inflation to continue, however, and we calculate cash costs will approach USD 780/oz in 2013 before falling with the economies of scale that would come from a potential expansion to a longer-term target of USD 650/oz.
Despite this, we continue to see the company increase its EBITDA margins owing to the increasing gold price.
Risks In our view, the key risks to our investment thesis would be a lack of exploration success in 2012 in Burkina Faso and to a lesser extent in Guinea. The political situation of both Burkina Faso and Guinea, although generally stable at present, remain elevated. In addition, there has been a lawsuit filed by its former Indonesian partners. As the company has divested all of its Indonesian operations, we would expect impact from this USD 2.0bn lawsuit (total transaction of USD 200m) to be viewed as a non-event.
Balance sheet and cash flow Avocet’s cash flows have been affected by a number of non-recurring items in 2011, including the disposal of the company’s Asian assets, the buy-back of a number of forward contracts at a cost of USD 40m, and repayment of USD 43m debt.
As a result, Avocet has a strong balance sheet, with around USD 120m of cash and only USD 35m of remaining debt. We forecast free cash flow to be negative in 2012, as a result of increased capital expenditure; although we expect that the business will then generate positive cash flows. Management’s decision to announce a dividend policy commencing in 2012 reflects its confidence in the underlying financial position of the business.
Tonnes Gold Contained gold AttributableDeposit Country Ownership Mt (g/t) Moz MozInata Burkina Faso 90% 23.6 1.9 1.5 1.3Total 23.6 1.9 1.5 1.3
Total Resources (incl. inferred)Tonnes Gold Contained gold Attributable
Deposit Ownership Mt (g/t) Moz MozInata Burkina Faso 90% 33.2 1.7 1.8 1.6Souma Burkina Faso 90% 10.7 1.7 0.6 0.5Koulekoun Guinea 100% 44.2 1.3 1.8 1.8Kodiéran Guinea 100% 7.3 1.8 0.4 0.4Total 88.2 1.5 4.2 3.9
Total Reserves

Nomura | European Gold Sector Initiation January 18, 2012
50
Fig. 96: EBITDA and capex profile
Source: Company data, Nomura estimates
Fig. 97: Debt profile From 2012, Avocet should begin to reap the rewards of its investment
Source: Company data, Nomura estimates
Fig. 98: EPS and P/E forecasts @ USD 1,900/oz flat gold est We estimate that capital allowances will be exhausted in 2016
Source: Company data, Nomura estimates
Fig. 99: EPS and P/E forecasts at long-term forecasts
Source: Company data, Nomura estimates
Fig. 100: Price chart (GBp)
Source: Datastream
Fig. 101: Historical P/E
Source: Datastream
DS World gold mining index, indexed to RRS at Jan. 2009
Management and significant shareholders
Board/management Chairman – Russell Edey
CEO – Brett Richards
Finance director – Mike Norris
Significant shareholders Elliot Associates – 18.0%
Datum A.S – 12.3%
J.P. Morgan – 6.5%
-200
-150
-100
-50
0
50
100
150
200
250
2010 2011e 2012e 2013e 2014e 2015e 2016e
EBITDA ($M) Capex ($M) Exploration
-100
0
100
200
300
400
500
600
2010 2011e 2012e 2013e 2014e 2015e 2016e
Net Cash (Debt) ($M)
0
10
20
30
40
50
0
20
40
60
80
100
2010 2011e 2012e 2013e 2014e 2015e 2016eEPS P/E (x)
0
10
20
30
40
50
0
20
40
60
80
100
2010 2011e 2012e 2013e 2014e 2015e 2016eEPS P/E (x)
0
50
100
150
200
250
300
350
Av ocet mining DS World gold mining index
0
5
10
15
20
25
30
Dec
-09
Jan-
10Fe
b-10
Mar
-10
Apr-1
0M
ay-1
0Ju
n-10
Jul-1
0Au
g-10
Sep-
10O
ct-1
0N
ov-1
0D
ec-1
0Ja
n-11
Feb-
11M
ar-1
1Ap
r-11
May
-11
Jun-
11Ju
l-11
Aug-
11Se
p-11
Oct
-11
Nov
-11
Dec
-11
Forward P/E
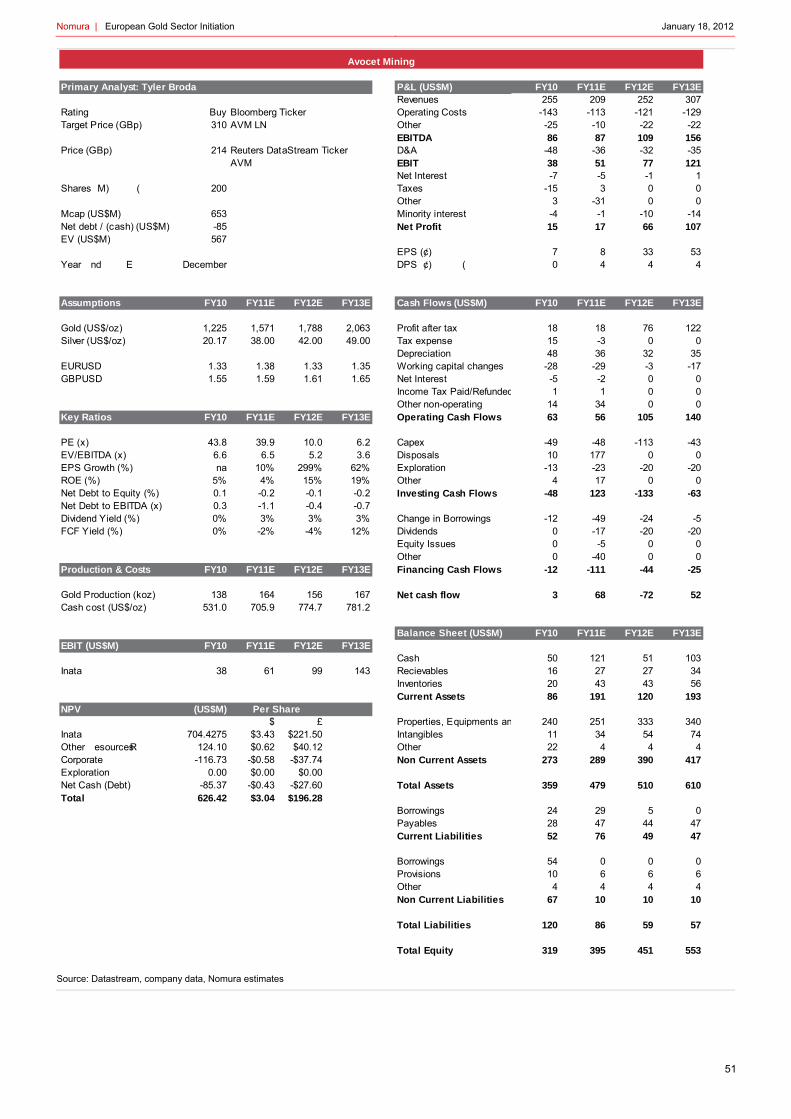
Nomura | European Gold Sector Initiation January 18, 2012
51
Source: Datastream, company data, Nomura estimates
P&L (US$M) FY10 FY11E FY12E FY13ERevenues 255 209 252 307
Rating Buy Bloomberg Ticker Operating Costs -143 -113 -121 -129Target Price (GBp) 310 AVM LN Other -25 -10 -22 -22
EBITDA 86 87 109 156Price (GBp) 214 Reuters DataStream Ticker D&A -48 -36 -32 -35
AVM EBIT 38 51 77 121Net Interest -7 -5 -1 1
Shares (M) 200 Taxes -15 3 0 0Other 3 -31 0 0
Mcap (US$M) 653 Minority interest -4 -1 -10 -14Net debt / (cash) (US$M) -85 Net Profit 15 17 66 107EV (US$M) 567
EPS (¢) 7 8 33 53Year End December DPS (¢) 0 4 4 4
Assumptions FY10 FY11E FY12E FY13E Cash Flows (US$M) FY10 FY11E FY12E FY13E
Gold (US$/oz) 1,225 1,571 1,788 2,063 Profit after tax 18 18 76 122Silver (US$/oz) 20.17 38.00 42.00 49.00 Tax expense 15 -3 0 0
Depreciation 48 36 32 35EURUSD 1.33 1.38 1.33 1.35 Working capital changes -28 -29 -3 -17GBPUSD 1.55 1.59 1.61 1.65 Net Interest -5 -2 0 0
Income Tax Paid/Refunded 1 1 0 0Other non-operating 14 34 0 0
Key Ratios FY10 FY11E FY12E FY13E Operating Cash Flows 63 56 105 140
PE (x) 43.8 39.9 10.0 6.2 Capex -49 -48 -113 -43EV/EBITDA (x) 6.6 6.5 5.2 3.6 Disposals 10 177 0 0EPS Growth (%) na 10% 299% 62% Exploration -13 -23 -20 -20ROE (%) 5% 4% 15% 19% Other 4 17 0 0Net Debt to Equity (%) 0.1 -0.2 -0.1 -0.2 Investing Cash Flows -48 123 -133 -63Net Debt to EBITDA (x) 0.3 -1.1 -0.4 -0.7Dividend Yield (%) 0% 3% 3% 3% Change in Borrowings -12 -49 -24 -5FCF Yield (%) 0% -2% -4% 12% Dividends 0 -17 -20 -20
Equity Issues 0 -5 0 0Other 0 -40 0 0
Production & Costs FY10 FY11E FY12E FY13E Financing Cash Flows -12 -111 -44 -25
Gold Production (koz) 138 164 156 167 Net cash flow 3 68 -72 52Cash cost (US$/oz) 531.0 705.9 774.7 781.2
Balance Sheet (US$M) FY10 FY11E FY12E FY13EEBIT (US$M) FY10 FY11E FY12E FY13E
Cash 50 121 51 103Inata 38 61 99 143 Recievables 16 27 27 34
Inventories 20 43 43 56Current Assets 86 191 120 193
NPV (US$M)$ £ Properties, Equipments an 240 251 333 340
Inata 704.4275 $3.43 $221.50 Intangibles 11 34 54 74Other Resources 124.10 $0.62 $40.12 Other 22 4 4 4Corporate -116.73 -$0.58 -$37.74 Non Current Assets 273 289 390 417Exploration 0.00 $0.00 $0.00Net Cash (Debt) -85.37 -$0.43 -$27.60 Total Assets 359 479 510 610Total 626.42 $3.04 $196.28
Borrowings 24 29 5 0Payables 28 47 44 47Current Liabilities 52 76 49 47
Borrowings 54 0 0 0Provisions 10 6 6 6Other 4 4 4 4Non Current Liabilities 67 10 10 10
Total Liabilities 120 86 59 57
Total Equity 319 395 451 553
Avocet Mining
Per Share
Primary Analyst: Tyler Broda

Nomura | European Gold Sector Initiation January 18, 2012
52
ABG – African Barrick Gold (Buy, 750p TP) African Barrick Gold’s London history has been less than impressive, although we believe that the cash build on the company’s balance sheet cannot be ignored in the context of potential transformational changes. We also see a significant value gap.
From “Tanzanian Barrick” to being a truly African Barrick – cash build to provide impetus for strategic change
Net cash of USD 1.7bn and a free cash flow yield of 24% by 2013 African Barrick Gold has already entered into a significant cash generation phase, generating near USD 600m in net cash in the past two years. Our forecasts show that this cash build will continue (subject to no new capex from as-yet-unconfirmed growth projects) and add an additional USD 1.0bn based on our higher forecast gold prices and a production level of 760,000oz in 2013E.
Some of this excess cash is likely to be spent on the potential North Mara underground mine or on the construction of the Nyanzaga greenfields project, although we expect that the cash position of the company will remain extremely robust in the near term. This significantly increases flexibility at the corporate level. Of the six companies covered in this report, ABG ranks highest on a two-year forward FCF yield basis (Fig. 70).
In our view, the two leading options following this cash build would be either a sizable dividend or the funds to make a meaningful acquisition. A dividend would see funds flow back up to parent Barrick Gold (74%) which will also be experiencing the positive impact from improved gold prices. As growth has always been a stated strategy for African Barrick since its IPO in March 2011, it may well look towards an acquisition, and perhaps sooner than its peers.
If our forecast of a structural increase in M&A activity is correct, then we would expect the currently cheaper sector valuations to increase over time as the structural industry cash-build progresses. Therefore, companies that made an acquisition sooner rather than later would benefit. ABG has less organic growth opportunities relative to peers and the company has consistently included acquisitions as a key strategy for growth, priming the company for a near-term transaction.
What a difference a year might make The current African Barrick Gold P/NAV multiple (which we calculate to be 0.6x P/NAV at a spot gold of USD 1,640/oz), in our view, suffers from, not only lowered market expectations (failure to meet guidance in first two years as a public company), but also from concentrated political risk. The declines in P/E multiples in Randgold and Centamin in 2011 owing to political change in the Cote D’Ivoire and Egypt, respectively, has understandably added to the sector’s de-rating, in our view.
Should ABG make a, say, USD 1bn acquisition, based on consensus African mid-cap and junior production multiples, this could add on average 250,000oz of production and 5.0moz of resource, or growth of c.35% and 20%, respectively.
ABG has the highest 2013 free cash flow yield of the companies in our report
ABG will likely benefit from geographical diversification
Acting sooner rather than later could provide value in a competitive M&A landscape

Nomura | European Gold Sector Initiation January 18, 2012
53
Fig. 102: West African gold producers
Source: Company data, Nomura research
Fig. 103: African production and resource multiples
Source: Company data, Nomura research
Should a potential transaction be structured to include a share element, this could potentially lower the parent Barrick’s share and increase the public free float for ABG. Of course, buying ounces at market or above market prices is difficult to make financial sense of at the time of the transaction (especially following the sell-off at the end of 2011). However, Nomura believes that a transformation that could include: a) a new geography, b) an increased free float, and c) new development growth could see the shares re-rate substantially beyond this.
We have included a re-rating to 0.8x from the current spot multiple of 0.6x in our target price multiple as current sentiment has fallen owing to the most recent downgrade and as investors (rightly so) are likely to proceed with caution. Much like in 2011, however, for African Barrick to achieve a re-rating, the company will need to see a solid year of production. That said, we do not believe that this value gap will be able to persist with the strategic options available to the company and a stronger gold price.
Valuation Nomura’s one-year forward sum-of-the-parts NAV estimate (which is run using Nomura’s one-year forward gold price forecast of USD 1,900/oz flat) provides a value of 941p per share. At the current spot gold price of USD 1,640/oz, Nomura calculates a NAV of 724p per share, which implies ABG is trading at a spot P/NAV multiple of 0.6x. Nomura initiates on ABG with a Buy rating based on a one-year forward P/NAV target multiple of 0.8x, which equates to 750p share.
Fig. 104: ABG valuation Bulyanhulu continues to drive the valuation
Source: Nomura estimates
0
500
1000
1500
2000
2500
3000
3500
AFRICAN BARRICK GOLD
SEMAFO PERSEUS MINING
RESOLUTE MINING
NEVSUN RESOURCES
HIGH RIVER GOLD MINES
BANRO AVION GOLD AVOCET MINING TERANGA GOLD
MV EV
2,186.82,462.5
2,838.5 2,917.6 2,988.63,358.9 3,445.7
3,712.2
5,345.8
6,047.96,294.9
6,757.7
8,855.4
149.1530.0
143.4 112.4 80.6 99.2 146.3 195.0 177.0 253.4 183.2 71.6372.4
0
1,000
2,000
3,000
4,000
5,000
6,000
7,000
8,000
9,000
10,000
EV/oz production EV/oz resource
Valuation (NPV @ 5%) $M 0Yr +1 Yr +2 Yr +3 Yr
Bulyanhulu 3717.5 $9.06 $8.81 $8.52 $8.22
Buzw agi 1005.5 $2.45 $2.16 $1.91 $1.71
North Mara 1303.3 $3.18 $2.24 $2.35 $1.90
Tulaw aka 63.1 $0.15 $0.00 $0.00 $0.00
Other Resources 79.6 $0.19 $0.19 $0.19 $0.19Corporate -775.2 -$1.89 -$1.77 -$1.66 -$1.54Exploration 0.0 $0.00 $0.00 $0.00 $0.00Hedging 0.0 $0.00 $0.00 $0.00 $0.00Investments 0.0 $0.00 $0.00 $0.00 $0.00Net Cash (Debt) 712.5 $1.74 $2.95 $4.22 $5.40Total 6,106 $14.89 $14.58 $15.53 $15.89
GBPUSD 1.55Total GBP NAV 3,940 941p
Current share price (p) 462
P/NAV 0.5x
Target multiple 0.8xTarget price 750p
Upside 62%
ABG shows value even at current levels
Transformative transaction could see a new geography, increased free float and new growth options

Nomura | European Gold Sector Initiation January 18, 2012
54
Fig. 105: NPV waterfall chart Bulyanhulu maintains its top asset status as Buzwagi struggles
Source: Nomura research – based on flat one-year forward gold price est. of USD 1,900/oz
Fig. 106: Valuation trend Lack of growth in current visibility keeps value curve relatively flat
Source: Nomura research – based on flat one-year forward gold price est. of USD 1,900/oz
Fig. 107: Map of operations African Barrick Gold has four producing mines, all located in Tanzania
Source: Nomura research
Fig. 108: ABG production and cash costs Current production profile ready for a strategic step change
Source: Company data, Nomura estimates
0p100p200p300p400p500p600p700p800p900p
1000p
Bulyanhulu Buzwagi North Mara Tulawaka Net Cash (Debt)
Total
961p 941p1002p 1025p
0
200
400
600
800
1,000
1,200
0Yr +1 Yr +2 Yr +3 Yr
NPV Curve
$0
$100
$200
$300
$400
$500
$600
$700
$800
$900
0
100,000
200,000
300,000
400,000
500,000
600,000
700,000
800,000
900,000
2009 2010 2011E 2012E 2013E 2014E 2015E
Bulyanhulu Buzwagi North Mara Tulawaka Cash cost per ounce
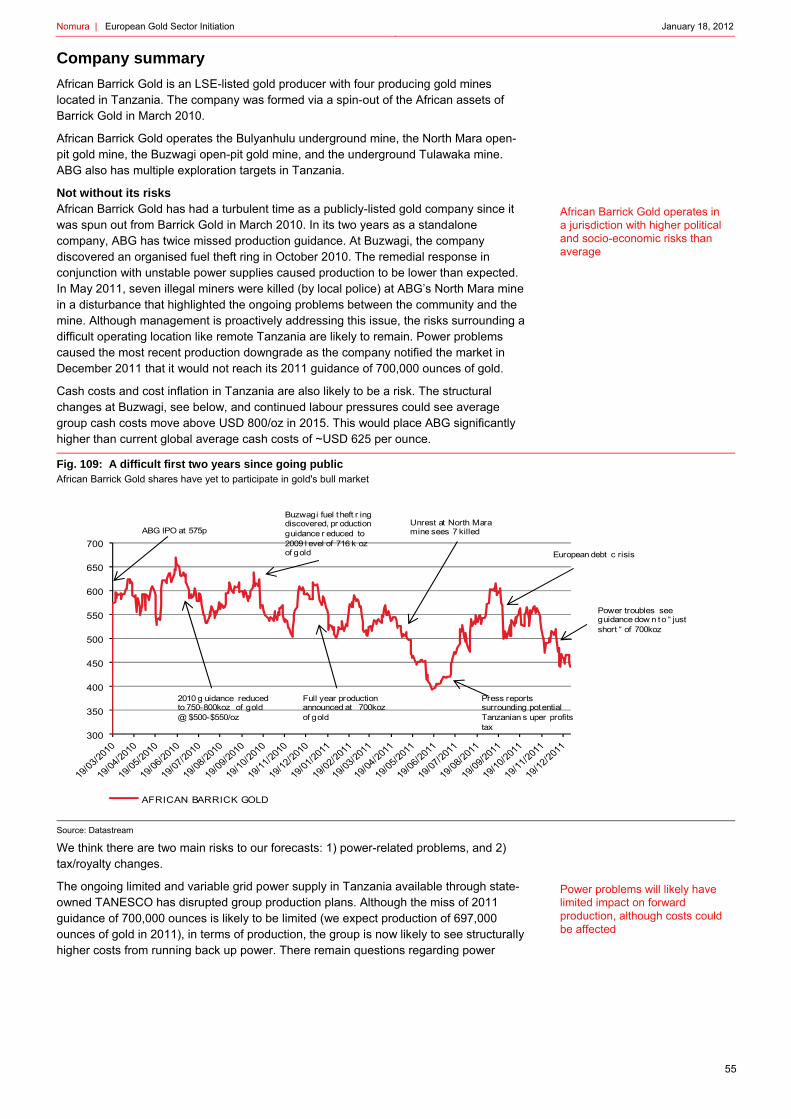
Nomura | European Gold Sector Initiation January 18, 2012
55
Company summary
African Barrick Gold is an LSE-listed gold producer with four producing gold mines located in Tanzania. The company was formed via a spin-out of the African assets of Barrick Gold in March 2010.
African Barrick Gold operates the Bulyanhulu underground mine, the North Mara open-pit gold mine, the Buzwagi open-pit gold mine, and the underground Tulawaka mine. ABG also has multiple exploration targets in Tanzania.
Not without its risks African Barrick Gold has had a turbulent time as a publicly-listed gold company since it was spun out from Barrick Gold in March 2010. In its two years as a standalone company, ABG has twice missed production guidance. At Buzwagi, the company discovered an organised fuel theft ring in October 2010. The remedial response in conjunction with unstable power supplies caused production to be lower than expected. In May 2011, seven illegal miners were killed (by local police) at ABG’s North Mara mine in a disturbance that highlighted the ongoing problems between the community and the mine. Although management is proactively addressing this issue, the risks surrounding a difficult operating location like remote Tanzania are likely to remain. Power problems caused the most recent production downgrade as the company notified the market in December 2011 that it would not reach its 2011 guidance of 700,000 ounces of gold.
Cash costs and cost inflation in Tanzania are also likely to be a risk. The structural changes at Buzwagi, see below, and continued labour pressures could see average group cash costs move above USD 800/oz in 2015. This would place ABG significantly higher than current global average cash costs of ~USD 625 per ounce.
Fig. 109: A difficult first two years since going public African Barrick Gold shares have yet to participate in gold's bull market
Source: Datastream
We think there are two main risks to our forecasts: 1) power-related problems, and 2) tax/royalty changes.
The ongoing limited and variable grid power supply in Tanzania available through state-owned TANESCO has disrupted group production plans. Although the miss of 2011 guidance of 700,000 ounces is likely to be limited (we expect production of 697,000 ounces of gold in 2011), in terms of production, the group is now likely to see structurally higher costs from running back up power. There remain questions regarding power
300
350
400
450
500
550
600
650
700
AFRICAN BARRICK GOLD
ABG IPO at 575p
Buzwagi fuel theft r ing discovered, pr oduction guidance r educed to 2009 l evel of 716 k oz of gold
Unrest at North Mara mine sees 7 killed
European debt c risis
2010 g uidance reduced to 750-800koz of gold @ $500-$550/oz
Full year production announced at 700koz of gold
Press reports surrounding potential Tanzanian s uper profits tax
Power troubles see guidance dow n to “ just short “ of 700koz
Power problems will likely have limited impact on forward production, although costs could be affected
African Barrick Gold operates in a jurisdiction with higher political and socio-economic risks than average
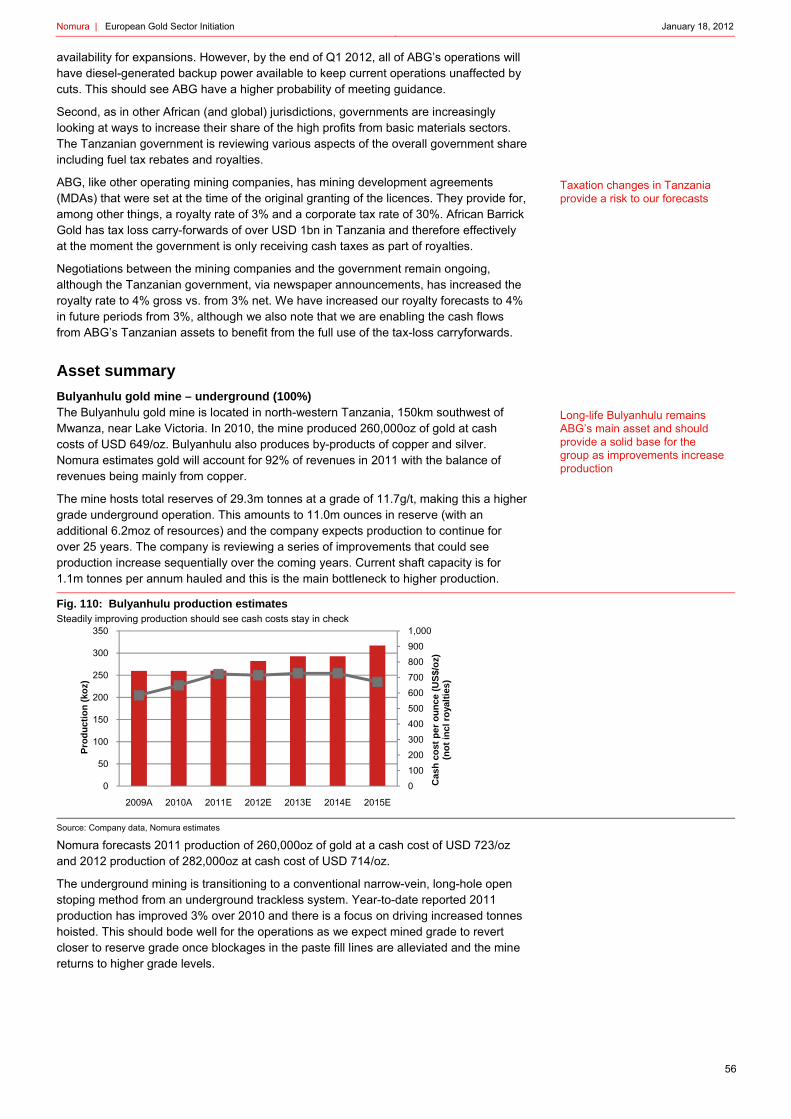
Nomura | European Gold Sector Initiation January 18, 2012
56
availability for expansions. However, by the end of Q1 2012, all of ABG’s operations will have diesel-generated backup power available to keep current operations unaffected by cuts. This should see ABG have a higher probability of meeting guidance.
Second, as in other African (and global) jurisdictions, governments are increasingly looking at ways to increase their share of the high profits from basic materials sectors. The Tanzanian government is reviewing various aspects of the overall government share including fuel tax rebates and royalties.
ABG, like other operating mining companies, has mining development agreements (MDAs) that were set at the time of the original granting of the licences. They provide for, among other things, a royalty rate of 3% and a corporate tax rate of 30%. African Barrick Gold has tax loss carry-forwards of over USD 1bn in Tanzania and therefore effectively at the moment the government is only receiving cash taxes as part of royalties.
Negotiations between the mining companies and the government remain ongoing, although the Tanzanian government, via newspaper announcements, has increased the royalty rate to 4% gross vs. from 3% net. We have increased our royalty forecasts to 4% in future periods from 3%, although we also note that we are enabling the cash flows from ABG’s Tanzanian assets to benefit from the full use of the tax-loss carryforwards.
Asset summary
Bulyanhulu gold mine – underground (100%) The Bulyanhulu gold mine is located in north-western Tanzania, 150km southwest of Mwanza, near Lake Victoria. In 2010, the mine produced 260,000oz of gold at cash costs of USD 649/oz. Bulyanhulu also produces by-products of copper and silver. Nomura estimates gold will account for 92% of revenues in 2011 with the balance of revenues being mainly from copper.
The mine hosts total reserves of 29.3m tonnes at a grade of 11.7g/t, making this a higher grade underground operation. This amounts to 11.0m ounces in reserve (with an additional 6.2moz of resources) and the company expects production to continue for over 25 years. The company is reviewing a series of improvements that could see production increase sequentially over the coming years. Current shaft capacity is for 1.1m tonnes per annum hauled and this is the main bottleneck to higher production.
Fig. 110: Bulyanhulu production estimates Steadily improving production should see cash costs stay in check
Source: Company data, Nomura estimates
Nomura forecasts 2011 production of 260,000oz of gold at a cash cost of USD 723/oz and 2012 production of 282,000oz at cash cost of USD 714/oz.
The underground mining is transitioning to a conventional narrow-vein, long-hole open stoping method from an underground trackless system. Year-to-date reported 2011 production has improved 3% over 2010 and there is a focus on driving increased tonnes hoisted. This should bode well for the operations as we expect mined grade to revert closer to reserve grade once blockages in the paste fill lines are alleviated and the mine returns to higher grade levels.
0100
200300
400500
600700
8009001,000
0
50
100
150
200
250
300
350
2009A 2010A 2011E 2012E 2013E 2014E 2015E
Cas
h c
ost
per
ou
nce
(U
S$/
oz)
(no
t in
cl r
oya
ltie
s)
Pro
du
ctio
n (
koz)
Taxation changes in Tanzania provide a risk to our forecasts
Long-life Bulyanhulu remains ABG’s main asset and should provide a solid base for the group as improvements increase production

Nomura | European Gold Sector Initiation January 18, 2012
57
Despite being the flagship, steady-state, main cash flow generating asset for African Barrick Gold, there is potential for Bulyanhulu to add material upside to numbers. Scoping studies/preliminary assessments are being undertaken for:
Bulyanhulu Upper East Zone (Q1 2012) – located 2.5km east of the main shaft is the higher grade Upper East Zone scheduled to be mined at a later date in the mine plan. ABG is progressing a feasibility study in order to determine the best mining method, although infrastructure is already being increased. The company expects to provide an update in Q1 2012 (formal approval by the board is to follow in Q3 once stoping method tests are completed). We believe that this could bring forward an increase of grade, which could increase near-term production by c. 10%.
Tailings (Q1 2012) – ABG is progressing a feasibility study to expand the processing plant at Bulyanhulu to process tailings. The tailings hold an estimated 8m-10m tonnes of material at an average grade near 1.3g/t, which could provide an incremental 30koz of gold per annum. A small capital programme to increase the plant size (which could work well should unrelated near surface exploration be successful), in conjunction with the higher-grade ore from underground and the tailings could see production increase to closer to 400,000oz of gold per annum, significantly reducing unit costs.
Surface exploration – Above the Upper East Zone is the potential for open-pit mining of Reefs 1 and 2 from surface. Recent drilling shows results confirming near surface mineralisation including 5m @ 36.3g/t from 32m, 6m @ 4.5g/t from 77m and 24m @ 1.4g/t from 110m. There are further holes still pending and infill drilling is likely to develop resources into 2012. In conjunction with the tailings development, near surface material should be able to fill the excess capacity at the Bulyanhulu plant and incrementally increase ounces.
North Mara – open pit (100%) ABG’s North Mara mine is located near the Kenyan Border approximately 100km east of Lake Victoria, the remotest of ABG’s Tanzanian mines. In 2010, North Mara produced 213,000oz of gold at a cash cost USD 486/oz. Beginning production in 2002, North Mara was added to the group in 2006 in as part of Barrick Gold’s acquisition of Placer Dome.
As of 31 December 2010, North Mara hosted 27.6m tonnes of ore at an average grade of 3.2g/t, containing 2.8moz of gold. The ore is mined from three open pits: Nyabirama, Gokona, Nyabienga and is processed using a conventional CIL process, which produces gold doré. Nomura forecasts the mine life will continue at least until 2020 should no further mineralisation be converted into reserve. There remains exploration upside potential in the region, especially in the Gokona Corridor (15km of unexplored ground between the Gokona and Nyanbenga open pits).
Fig. 111: North Mara production and cash cost estimates
Source: Company data, Nomura research
0
100
200
300
400
500
600
700
800
900
1,000
0
50
100
150
200
250
300
350
2009A 2010A 2011E 2012E 2013E 2014E 2015E
Cas
h c
ost
per
ou
nce
(U
S$/
oz)
(no
t in
cl r
oya
ltie
s)
Pro
du
ctio
n (
koz)
Bringing forward the Upper East Zone, processing tailings and near surface potential could provide upside to the operations
Higher grades from North Mara following the focus on waste stripping in 2011 should provide a return to 2010 production
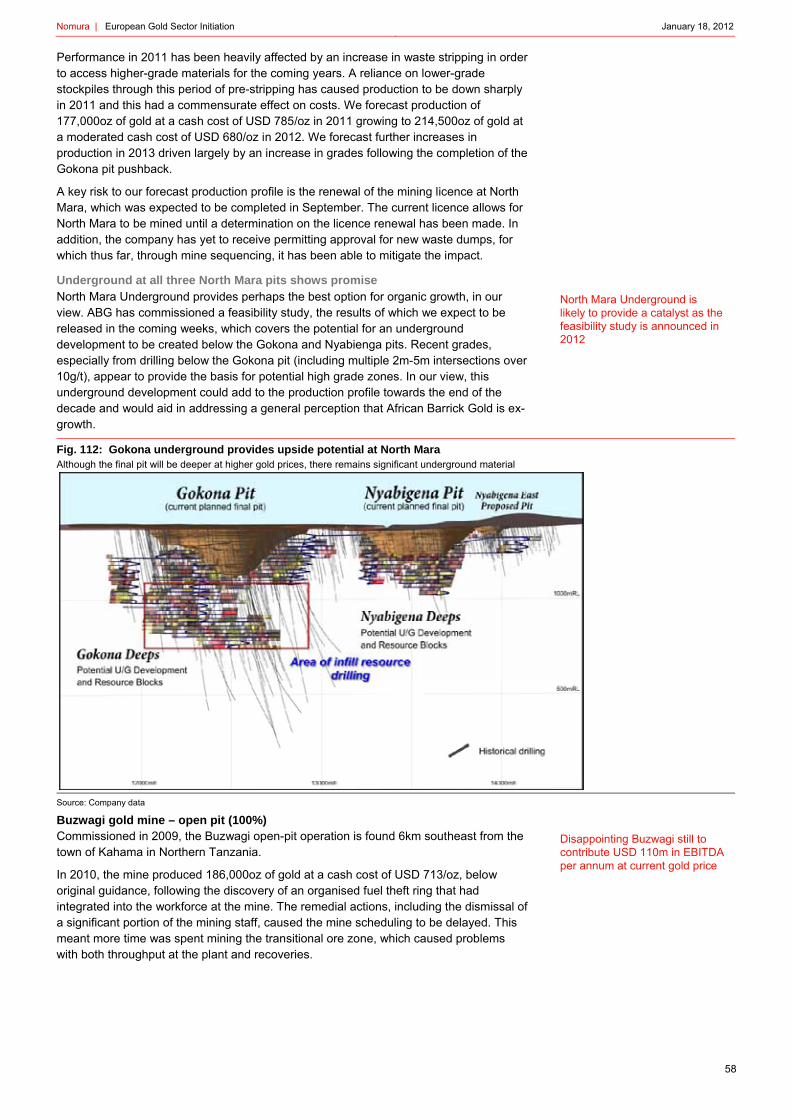
Nomura | European Gold Sector Initiation January 18, 2012
58
Performance in 2011 has been heavily affected by an increase in waste stripping in order to access higher-grade materials for the coming years. A reliance on lower-grade stockpiles through this period of pre-stripping has caused production to be down sharply in 2011 and this had a commensurate effect on costs. We forecast production of 177,000oz of gold at a cash cost of USD 785/oz in 2011 growing to 214,500oz of gold at a moderated cash cost of USD 680/oz in 2012. We forecast further increases in production in 2013 driven largely by an increase in grades following the completion of the Gokona pit pushback.
A key risk to our forecast production profile is the renewal of the mining licence at North Mara, which was expected to be completed in September. The current licence allows for North Mara to be mined until a determination on the licence renewal has been made. In addition, the company has yet to receive permitting approval for new waste dumps, for which thus far, through mine sequencing, it has been able to mitigate the impact.
Underground at all three North Mara pits shows promise North Mara Underground provides perhaps the best option for organic growth, in our view. ABG has commissioned a feasibility study, the results of which we expect to be released in the coming weeks, which covers the potential for an underground development to be created below the Gokona and Nyabienga pits. Recent grades, especially from drilling below the Gokona pit (including multiple 2m-5m intersections over 10g/t), appear to provide the basis for potential high grade zones. In our view, this underground development could add to the production profile towards the end of the decade and would aid in addressing a general perception that African Barrick Gold is ex-growth.
Fig. 112: Gokona underground provides upside potential at North Mara Although the final pit will be deeper at higher gold prices, there remains significant underground material
Source: Company data
Buzwagi gold mine – open pit (100%) Commissioned in 2009, the Buzwagi open-pit operation is found 6km southeast from the town of Kahama in Northern Tanzania.
In 2010, the mine produced 186,000oz of gold at a cash cost of USD 713/oz, below original guidance, following the discovery of an organised fuel theft ring that had integrated into the workforce at the mine. The remedial actions, including the dismissal of a significant portion of the mining staff, caused the mine scheduling to be delayed. This meant more time was spent mining the transitional ore zone, which caused problems with both throughput at the plant and recoveries.
Disappointing Buzwagi still to contribute USD 110m in EBITDA per annum at current gold price
North Mara Underground is likely to provide a catalyst as the feasibility study is announced in 2012

Nomura | European Gold Sector Initiation January 18, 2012
59
The response from parent Barrick Gold, and in general, the performance in FY11 (with the exception of the SAG mill motor outage in Q2), should not be overlooked in Nomura’s view. Barrick seconded 20 operators and shifted management resources across the organisation to help African Barrick get Buzwagi back on track quicker than if there had been no external aid. This, in our view, provides a competitive advantage for ABG and its ability to manage multiple projects despite the various disappointments over the past two years.
Buzwagi is a shear-hosted quartz veined deposit hosted in a porphyritic granite. As at 31 December 2010, the Buzwagi mine hosted 55.6mt of ore at an average grade of 1.6g/t containing 2.9moz of gold. The ore is mined via conventional open-pit methods and is processed in a standard gravity – flotation – leach plant. The mine produces both a gold/copper concentrate and gold doré bars. The capacity of the plant is 4.4m tonnes of throughput per annum.
Fig. 113: Buzwagi cash costs and estimates Buzwagi cash costs are to be higher than expected at IPO, a return to reserve grade reduces production
Source: Company data, Nomura estimates
The outlook for Buzwagi, however, is not as positive as it is for the other mines in the portfolio. Following the decision to place the mine back on diesel generation owing to grid power being too unreliable, costs have structurally increased. In addition, lower grades and a higher strip ratio are likely to cause higher unit costs.
Golden Ridge to provide potential upside ABG is developing a resource 55km north of from Buzwagi named Golden Ridge. The initial indicated open-pit resource of 527,000oz of gold at a grade of 2.9g/t is being investigated as a potential higher grade feed for the Buzwagi operation. The feasibility study results have been pushed back to mid-2012 as current indications are that the economics may perhaps be constrained by the transportation charges, which would be incurred should Golden Ridge be progressed as a satellite operation. The company is now exploring higher grade shoots at depth as well as attempting to convert some of the 152,000oz of inferred resource to reserve. We have not included any Golden Ridge ounces in our Buzwagi model (and have valued them on USD 45/oz of resource), although there remains potential for an increase in grade mid-decade at Buzwagi or for a potential standalone development to be explored.
Tulawaka underground gold mine (70%) The end-of-life Tulawaka underground mine is the fourth and smallest producing asset in the group. The company originally expected to decommission the mine in 2011, but the higher gold prices are making it economically sensible for ABG to extend the mine life through further exploration drilling. The mining is done using a narrow-vein long hole stoping method in an orebody with a quartz vein system with both free and disseminated gold. In 2010, Tulawaka produced 42,000oz of gold at a cash cost of USD 769/oz (29,000oz of gold attributable). The plant, which is a conventional gravity and CIL process plant, has a throughput capacity of 480,000 tonnes per annum.
0
200
400
600
800
1,000
1,200
0
50
100
150
200
250
300
350
2009A 2010A 2011E 2012E 2013E 2014E 2015E
Ca
sh
co
st
pe
r o
un
ce (
US
$/o
z)
(no
t in
cl
roy
alt
ies
)
Pro
du
cti
on
(k
oz
)
Golden Ridge potential could help Buzwagi, eventually
At current prices Tulawaka could keep operating until 2014 when tailings and waste dump constraints would force the mine to shut

Nomura | European Gold Sector Initiation January 18, 2012
60
Higher mined grades have driven higher production thus far in 2011 and Nomura forecasts production of 57,000oz (39,700oz) at a cash cost of USD 651/oz. Nomura is forecasting production until the end of 2012, versus the current mine plan of mid-2012. Should current gold prices persist, we expect that further mineralisation between the 10 and 15 levels would provide two more years of production before tailings capacity was reduced (at approximately 50koz per annum). Although small, Tulawaka may provide incremental production upside potential into the middle of the decade at relatively low capital cost.
Nyanzaga (Tusker) (100%) In April 2010, ABG purchased 100% of the Nyanzaga project by purchasing JV partner Tusker Gold Mines Limited. This asset, located 35km northeast of Bulyanhulu is the most advanced of the greenfields projects in the ABG portfolio. Nyanzaga hosts a resource of 1.0moz. Drilling is being undertaken in order to both increase the overall size of the resource by delineating strike and down-dip targets at both the Tusker and Kilimani mineralised zones.
Fig. 114: ABG reserves and resources
Source: Company data, Nomura research
Catalysts African Barrick has less potential organic growth than some of its peers, although it still has a modest portfolio of projects and balance sheet flexibility to progress them without the usual financial constraints.
Fig. 115: African Barrick growth pipeline More catalysts than the market perceives?
Source: Company data, Nomura research
Tonnes Gold Contained gold By product AttributableDeposit Name Country Ownership Mt (g/t) Moz Moz (gold equivalent) MozBulyanhulu Tanzania 100% 29.3 11.7 11.0 1.1 12.1Buzw agi Tanzania 100% 55.6 1.6 2.9 0.3 3.2North Mara Tanzania 100% 27.6 3.2 2.8 0.0 2.8Tulaw aka Tanzania 70% 0.3 6.5 0.1 0.0 0.1Total 112.9 4.6 16.8 1.4 18.2
Total Resources (Incl. Inferred)Tonnes Gold Contained gold By product Attributable
Deposit Name Country Ownership Mt (g/t) Moz Moz (gold equivalent) MozBulyanhulu Tanzania 100% 49.2 10.9 17.2 1.8 19.1Buzw agi Tanzania 100% 79.9 1.4 3.7 0.4 4.1North Mara Tanzania 100% 48.1 3.1 4.8 0.0 4.8Tulaw aka Tanzania 70% 0.9 5.7 0.2 0.0 0.2Nyanzaga Tanzania 100% 10.5 2.8 1.0 0.0 1.0Total 188.7 4.4 26.9 2.2 29.1
Total Reserves
Scoping and Feasibility Expected results date Description
Gokona / Nyabigena UG Q1 FY12Feasibility completed and results expected to be announced after board review in Q1 12. Project aim to increase the ounce profile of the North Mara mine and to extend mine life. Aim to increase resource profile from 370koz to >1Moz.
Bulyanhuly Upper East Zone and Tailings Q1 FY12 Expansion project of the Bulyanhulu underground mine. Infrastructure study completed, metallurgical and geotechnical study ongoing with expected completion in Q1 FY12. The group aims to build a test stope for mining method validation by Q3 FY12. Details surrounding the tailings operation are expected in Q1.
Tulawaka Deeps Mid to late FY12Mine life extension project. The life of the mine has already been extended to FY12, further assessment ongoing. Ongoing drilling in FY12 will begin to target high grade extensions below the East Pit.
Golden Ridge Detailed update expected by year end FY11
Satellite operation exploration which is operationally challenging (50km hauling distance). Initial resource declared in March FY11 527koz @2.94g/t indicated and [email protected]/t inferred.
Nyanzaga: Tusker and Kilimani By FY11 endLake Victoria goldfields which ABG fully owns after its acquisition of Tusker Gold in FY10. Positive drilling results at Tusker and Kilimani results in Q3 11, resource update expected by y/e FY11.
Nyabirama deeps FY12 Scoping study ongoing relating to expansion of the North Mara pit mine underground. Infill and step-out drilling program ongoing.

Nomura | European Gold Sector Initiation January 18, 2012
61
Fig. 116: ABG EBITDA and capex profile Organic growth has not as yet provided a home for sustained op. profits
Source: Company data, Nomura estimates
Fig. 117: ABG debt profile and debt ratio Strong net cash position to provide significant corporate optionality
Source: Company data, Nomura estimates
Fig. 118: EPS and P/E forecasts @1,900/oz flat gold
Source: Company data, Nomura estimates
Fig. 119: EPS and P/E forecasts @ long-term prices
Source: Company data, Nomura estimates
Fig. 120: Price chart (GBp)
Source: Datastream
Fig. 121: Historical P/E
Source: Datastream
DS World gold mining index, indexed to RRS at Jan. 2009
Management and significant shareholders
Board/management Chairman – Aaron Regent
CEO – Greg Hawkins
CFO – Kevin Jennings
Significant shareholders Barrick Gold Corporation – 73.9%
-$400
-$200
$0
$200
$400
$600
$800
$1,000
2009 2010 2011 2012 2013 2014 2015 2016EBITDA ($M) Capex ($M)
-8.0
-4.0
0.0
4.0
8.0
12.0
16.0
-$2,000
$0
$2,000
$4,000
2009 2010 2011 2012 2013 2014 2015 2016
Net Cash (Debt) ($M) Net Debt/EBITDA (x)
0
5
10
15
20
25
30
0
20
40
60
80
100
120
140
2009 2010 2011 2012 2013 2014 2015EPS P/E (x)
0
5
10
15
20
25
30
0
20
40
60
80
100
120
140
2009 2010 2011 2012 2013 2014 2015EPS P/E (x)
0
100
200
300
400
500
600
700
800
900
ABG DS World gold mining index
0
2
4
6
8
10
12
14
16
Forward P/E
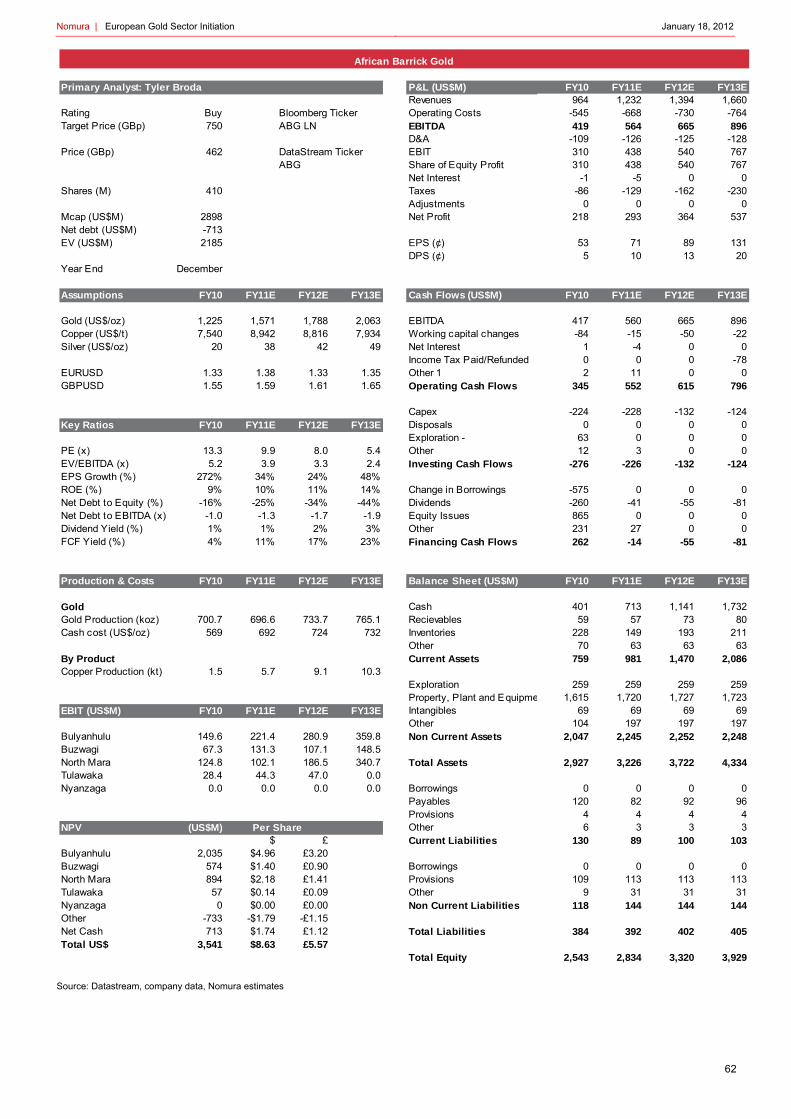
Nomura | European Gold Sector Initiation January 18, 2012
62
Source: Datastream, company data, Nomura estimates
P&L (US$M) FY10 FY11E FY12E FY13ERevenues 964 1,232 1,394 1,660
Rating Buy Bloomberg Ticker Operating Costs -545 -668 -730 -764Target Price (GBp) 750 ABG LN EBITDA 419 564 665 896
D&A -109 -126 -125 -128Price (GBp) 462 DataStream Ticker EBIT 310 438 540 767
ABG Share of Equity Profit 310 438 540 767Net Interest -1 -5 0 0
Shares (M) 410 Taxes -86 -129 -162 -230Adjustments 0 0 0 0
Mcap (US$M) 2898 Net Profit 218 293 364 537Net debt (US$M) -713EV (US$M) 2185 EPS (¢) 53 71 89 131
DPS (¢) 5 10 13 20Year End December
Assumptions FY10 FY11E FY12E FY13E Cash Flows (US$M) FY10 FY11E FY12E FY13E
Gold (US$/oz) 1,225 1,571 1,788 2,063 EBITDA 417 560 665 896Copper (US$/t) 7,540 8,942 8,816 7,934 Working capital changes -84 -15 -50 -22Silver (US$/oz) 20 38 42 49 Net Interest 1 -4 0 0
Income Tax Paid/Refunded 0 0 0 -78EURUSD 1.33 1.38 1.33 1.35 Other 1 2 11 0 0GBPUSD 1.55 1.59 1.61 1.65 Operating Cash Flows 345 552 615 796
Capex -224 -228 -132 -124Key Ratios FY10 FY11E FY12E FY13E Disposals 0 0 0 0
Exploration - 63 0 0 0PE (x) 13.3 9.9 8.0 5.4 Other 12 3 0 0EV/EBITDA (x) 5.2 3.9 3.3 2.4 Investing Cash Flows -276 -226 -132 -124EPS Growth (%) 272% 34% 24% 48%ROE (%) 9% 10% 11% 14% Change in Borrowings -575 0 0 0Net Debt to Equity (%) -16% -25% -34% -44% Dividends -260 -41 -55 -81Net Debt to EBITDA (x) -1.0 -1.3 -1.7 -1.9 Equity Issues 865 0 0 0Dividend Yield (%) 1% 1% 2% 3% Other 231 27 0 0FCF Yield (%) 4% 11% 17% 23% Financing Cash Flows 262 -14 -55 -81
Production & Costs FY10 FY11E FY12E FY13E Balance Sheet (US$M) FY10 FY11E FY12E FY13E
Gold Cash 401 713 1,141 1,732Gold Production (koz) 700.7 696.6 733.7 765.1 Recievables 59 57 73 80Cash cost (US$/oz) 569 692 724 732 Inventories 228 149 193 211
Other 70 63 63 63By Product Current Assets 759 981 1,470 2,086Copper Production (kt) 1.5 5.7 9.1 10.3
Exploration 259 259 259 259Property, Plant and Equipme 1,615 1,720 1,727 1,723
EBIT (US$M) FY10 FY11E FY12E FY13E Intangibles 69 69 69 69Other 104 197 197 197
Bulyanhulu 149.6 221.4 280.9 359.8 Non Current Assets 2,047 2,245 2,252 2,248Buzwagi 67.3 131.3 107.1 148.5North Mara 124.8 102.1 186.5 340.7 Total Assets 2,927 3,226 3,722 4,334Tulawaka 28.4 44.3 47.0 0.0Nyanzaga 0.0 0.0 0.0 0.0 Borrowings 0 0 0 0
Payables 120 82 92 96Provisions 4 4 4 4
NPV (US$M) Other 6 3 3 3$ £ Current Liabilities 130 89 100 103
Bulyanhulu 2,035 $4.96 £3.20Buzwagi 574 $1.40 £0.90 Borrowings 0 0 0 0North Mara 894 $2.18 £1.41 Provisions 109 113 113 113Tulawaka 57 $0.14 £0.09 Other 9 31 31 31Nyanzaga 0 $0.00 £0.00 Non Current Liabilities 118 144 144 144Other -733 -$1.79 -£1.15Net Cash 713 $1.74 £1.12 Total Liabilities 384 392 402 405Total US$ 3,541 $8.63 £5.57
Total Equity 2,543 2,834 3,320 3,929
Primary Analyst: Tyler Broda
African Barrick Gold
Per Share

Nomura | European Gold Sector Initiation January 18, 2012
63
Nomura | European Gold Sector Initiation January 18, 2012
64
CEY – Centamin (Neutral, 120p TP) Centamin and its high-quality Sukari gold mine is, in our view, significantly underpriced in the longer term. However, near-term political risk concerns are likely to remain the focus of investors and leave Centamin at a relatively low valuation through 2012.
Egyptian risk to persist through 2012 elections
Centamin is a one-mine gold producer and as such its risks are concentrated on the Sukari asset located in southern Egypt near the Red Sea. Centamin was a market favourite with its high-quality growth and low cash cost position, although the revolution in Egypt, the resultant political uncertainty and production missing guidance have put pressure on the share price. Centamin’s shares fell by c. 50% in 2011.
Egypt’s near-term stability remains a concern, in our view. Parliamentary elections held in recent months have seen nearly 70% of seats won by Islamist parties, which signals a potential shift in Egyptian geopolitical positioning. The ruling Military Council has announced that presidential elections will be held after the drafting of a new constitution prior to June. Although there is no direct link between Centamin’s current operations and the political changes, the sell-off in Centamin’s shares sparked by renewed violence in Cairo in November served as a reminder of the inherently unstable situation.
Economically, Egypt’s position continues to deteriorate. Egypt’s major tourism industry fell by 30% in 2011 and the government will be seeking a record USD 28bn in bond issuance in Q1 2012 alongside a negotiation with the IMF for funds. The Egyptian government has recently removed a fuel subsidy for heavy industry. Although this is yet to affect Centamin, further deterioration in the government’s fiscal position could see this potentially affect operations (removal of the subsidy could see an estimated increase of USD 50 to USD 100 per ounce in costs). Fiscal instability and political uncertainty in Egypt will continue to weigh on sentiment, in our view, in the coming months.
We believe that as the current high levels of uncertainty stemming from political change in Egypt are removed in due course, that Centamin shares will see what could be a substantial rerating. That said, at this point, we do not believe that investor sentiment towards Egypt is likely to change substantially enough over our target price horizon, leaving Centamin less exposed to our positive macro gold outlook over the near term.
In our view, the shares are likely oversold and are close to bottoming (on current available information) as the P/NAV begins to reach heavily-discounted territory. As such, we expect the P/NAV to settle out at slightly higher levels than what is currently implied by spot prices, at 0.5 P/NAV vs. 0.4 P/NAV. As such, we see upside potential from current levels, although in our relative rating framework, which provides further upside from other gold equities, we rate Centamin as Neutral with a 120p target price.
Expanded cash flows should pay for the government stake As there is no mining code in Egypt (and prospects for a new code are unlikely in the context of political changes), the Sukari licence is modelled on a general oil and gas production and sharing agreement split 50-50 between Centamin and the Arab Republic of Egypt. Centamin has fully funded the capital expenditure at Sukari, but is entitled to recover these costs (to a maximum of 33% per annum). Although Centamin must pay a 3% net revenue royalty, there is no corporate tax paid on the profits from Sukari.
Owing to the higher gold prices, the capital recovery balances are being depleted faster than originally forecast. This includes the capital being spent on the Stage 4 expansion at Sukari and the continued underground development. We calculate (based on our long-term gold price forecasts) that the government will receive 45% of the cash flows from Sukari starting in 2013. The government’s share then increases to 50% in 2015.

Nomura | European Gold Sector Initiation January 18, 2012
65
After the Stage 4 expansion is completed and the underground operations have matured, we forecast that Sukari will produce 530,000oz of gold in 2015 or a 160% increase on 2011E levels. Based on spot pricing (in order to remove the effect of gold price changes), Nomura forecasts that Centamin’s EBITDA will reflect this increasing production reaching over USD 600m in 2014. EPS, however, will actually decline on 2011 numbers as cost inflation and the increase to a 50% government take erode Centamin’s share.
Fig. 122: EBITDA and EPS: 2010–15E Centamin's EPS will likely not increase in line with EBITDA as the government increases its share of the company's cash flows
Source: Company data, Nomura estimates
Fig. 123: CEY’s share price vs. EGX 30 (indexed at Jan. 11) Centamin's exposure to country risk has been reflected in the way in which its shares have tracked the Egyptian stock market
Source: Datastream
World-class Sukari provides long-term value The Sukari gold mine remains one of the few top-tier assets in the world held outside of the major gold companies. We believe this makes Centamin a unique investment opportunity for longer-term investors, current country risks aside. Despite higher costs in 2011, we expect that cash costs will moderate to USD 500/oz as the underground operations reach full production and economies of scale begin to be generated from the Sukari expansion to 10m tonnes per annum.
This 500,000oz plus of gold production and the associated cash flow generation potential should be exceptionally strong compared with peers. We calculate a FCF yield of 30% for Centamin in 2013E. In our view, this strong balance sheet, coupled with strong forward cash generation potential, should allow Centamin to look at expanding into a new geography (beyond its current Ethiopian exploration programme). However, owing to the size and quality of Sukari, there are limited assets that would diversify production in a meaningful way without giving up too much longer-term value at Sukari. This may see Centamin pay substantial dividends from 2013 onwards.
We therefore believe that management’s apparent strategy of focussing on longer-term potential (progressing with the Stage IV expansion in current political climate, progressing exploration assets), while waiting for the cash build to tighten valuations, is a prudent one in the current circumstances. We initiate on Centamin with a Neutral rating as on a risk-adjusted basis the downside risk from the potential consequences of the changing political system and this associated uncertainty mitigates upside opportunities for the time being.
0
10
20
30
40
50
60
70
80
0
100
200
300
400
500
600
700
2010 2011E 2012E 2013E 2014E 2015E
EBITDA (US$M) - LHS EPS - RHS
0
20
40
60
80
100
120
Jan-11 Feb-11 Mar-11 Apr-11 May-11 Jun-11 Jul-11 Aug-11 Sep-11 Oct-11 Nov -11 Dec-11
Share price EGX 30

Nomura | European Gold Sector Initiation January 18, 2012
66
Valuation Nomura’s one-year forward sum-of-the-parts NAV estimate (using Nomura’s one-year forward quarterly gold price forecast of USD 1,900/oz) provides a value of 255p/share. At the current spot gold price of USD 1,600/oz, Nomura calculates a NAV of 207p/per share implying a P/NAV multiple of 0.4x. Nomura initiates on CEY with a Neutral rating based on a one-year forward P/NAV multiple of 0.5x, which equates to 120p.
Fig. 124: Sum-of-the-parts NAV Valuation shows upside potential, assuming political risk perceptions stabilise following Egyptian elections
Source: Nomura estimates
Valuation (NPV @ 5%) $M Current Per Share +1 Yr +2 Yr +3 Yr
Sukari 4026.7 $3.67 $3.74 $3.63 $3.45
Other Resources 15.0 $0.01 $0.01 $0.01 $0.01Corporate -80.0 -$0.07 -$0.07 -$0.07 -$0.06Exploration 0.0 $0.00 $0.00 $0.00 $0.00Hedging 0.0 $0.00 $0.00 $0.00 $0.00Investments 0.0 $0.00 $0.00 $0.00 $0.00Net Cash (Debt) 160.3 $0.15 $0.27 $0.46 $0.79Total 4122.0 $3.76 $3.95 $4.04 $4.19
GBPUSD 1.55Total GBP 2659 255p
Current share price (p) 89
P/NAV 0.3x
Target multiple 0.5xTarget price 120p
Upside 34%

Nomura | European Gold Sector Initiation January 18, 2012
67
Fig. 125: CEY NPV waterfall chart Centamin's value is near 100% focused in Egypt
Source: Nomura research
Fig. 126: CEY valuation trend Despite Egyptian risk there remains significant value in Centamin
Source: Nomura research
Fig. 127: Map of operations Centamin is focused on the Nubian shield of East Africa
Source: Company data
Fig. 128: CEY production and cash cost forecasts Cash costs should be contained once Stage IV and underground ramp up has expanded production
Source: Company data, Nomura estimates
0p
50p
100p
150p
200p
250p
300p
Sukari Other Resources Corporate Net Cash (Debt) Total
242.6 254.9260.6 270.1
0p
50p
100p
150p
200p
250p
300p
0Yr +1 Yr +2 Yr +3 Yr
0.00
100.00
200.00
300.00
400.00
500.00
600.00
700.00
0
100,000
200,000
300,000
400,000
500,000
600,000
2009 2010 2011E 2012E 2013E 2014E 2015E
Sukari Cash cost per ounce
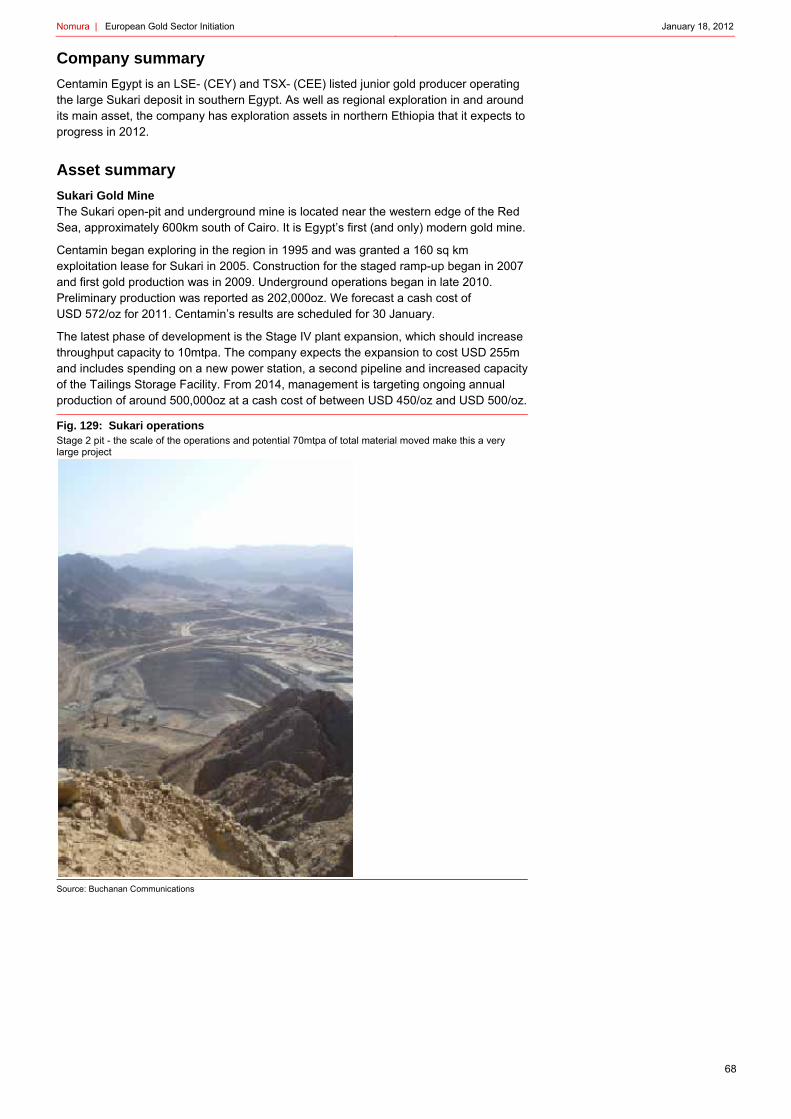
Nomura | European Gold Sector Initiation January 18, 2012
68
Company summary
Centamin Egypt is an LSE- (CEY) and TSX- (CEE) listed junior gold producer operating the large Sukari deposit in southern Egypt. As well as regional exploration in and around its main asset, the company has exploration assets in northern Ethiopia that it expects to progress in 2012.
Asset summary
Sukari Gold Mine The Sukari open-pit and underground mine is located near the western edge of the Red Sea, approximately 600km south of Cairo. It is Egypt’s first (and only) modern gold mine.
Centamin began exploring in the region in 1995 and was granted a 160 sq km exploitation lease for Sukari in 2005. Construction for the staged ramp-up began in 2007 and first gold production was in 2009. Underground operations began in late 2010. Preliminary production was reported as 202,000oz. We forecast a cash cost of USD 572/oz for 2011. Centamin’s results are scheduled for 30 January.
The latest phase of development is the Stage IV plant expansion, which should increase throughput capacity to 10mtpa. The company expects the expansion to cost USD 255m and includes spending on a new power station, a second pipeline and increased capacity of the Tailings Storage Facility. From 2014, management is targeting ongoing annual production of around 500,000oz at a cash cost of between USD 450/oz and USD 500/oz.
Fig. 129: Sukari operations Stage 2 pit - the scale of the operations and potential 70mtpa of total material moved make this a very large project
Source: Buchanan Communications

Nomura | European Gold Sector Initiation January 18, 2012
69
The Sukari mine has had limited disruptions since the revolution that forced former president Hosni Mubarak to resign in February 2011. Through the height of the revolution, Centamin had difficulties in shipping blast materials from Alexandria, but the impact on Q1 production was relatively limited. Local blast inspectors, however, did cause Q2 blasting to fall behind schedule, which pushed back the mining schedule and caused a downgrade in 2011 production guidance to 200,000-210,000oz of gold at a higher cash cost of USD 550/oz. Q3 saw increased production rates and Q4 saw record production of 59,000oz.
This trend should continue into 2012 and we expect stronger production of 260,000oz in 2012. Owing to the delays in the mine sequencing plan, and the shift from the Stage 2 pit to the Stage 3 pit pushback, we expect that the open-pit operations will have a higher strip ratio in 2012 and that this will keep costs relatively elevated at USD 532/oz.
The mine is owned by the Egyptian government by means of a concession agreement, the details of which are:
• no taxes and duties for 15 years (and an option to extend for a further 15 years), but a 3% royalty rate;
• a 50% profit-sharing arrangement, once Centamin has recovered the cost of any capital expenditure (estimated by Nomura to be in Q4 2013);
• the details of this agreement are unchanged since they were signed in 1994.
Sukari had 4.5moz of attributable gold reserves at an average grade of 1.2g/t and 7.2moz of attributable gold resource at an average grade of 1.5g/t.
Expansion potential The underground operations of the Sukari mine hold the greatest potential for expansion. In Q4 2011, we expect Centamin to announce an expansion of the underground reserve and in 2012 the company will undertake a new programme of resource drilling (USD 18m in capex), which will target deeper into the orebody. This secondary decline will take underground activity away from the current pit shell and allow the company to run two separate production sources. The average plant feed grade is also markedly higher underground (10-12g/t) than it is in the open pit (1.8g/t), although the company is increasingly encountering problems with recoveries that may reduce final output.
Centamin is also exploring seven other prospects within the Sukari licence area and holds four exploration licences in Ethiopia that were acquired as part of the Sheba Exploration plc acquisition in 2011. Centamin plans on advancing the Una Deriam prospect in Ethiopia in 2012 as well as continuing exploration on the Quartz Ridge and V-Shear zones at Sukari. Centamin is scheduled to report a new resource and reserve statement on 30 January.
Fig. 130: Reserves and resources
Source: Company data
Balance sheet With no debt, USD 160m of cash (Q3) and cash from operating activities set to accelerate from its current quarterly level of USD 62.5m, Centamin is, we believe, well positioned to fund its Sukari development strategy without recourse to further financing.
Total ReservesTonnes Gold Contained gold Attributable
Deposit Name Ow nership Mt (g/t) Oz Oz Sukari 50% 245.4 1.2 9.1 4.5Total 245.4 1.15 9.1 4.5
Total Resources (incl. Inferred)Tonnes Gold Contained gold Attributable
Deposit Name Ownership Mt (g/t) Oz Oz Sukari 50% 304.6 1.5 14.5 7.2Total 304.6 1.48 14.5 7.2
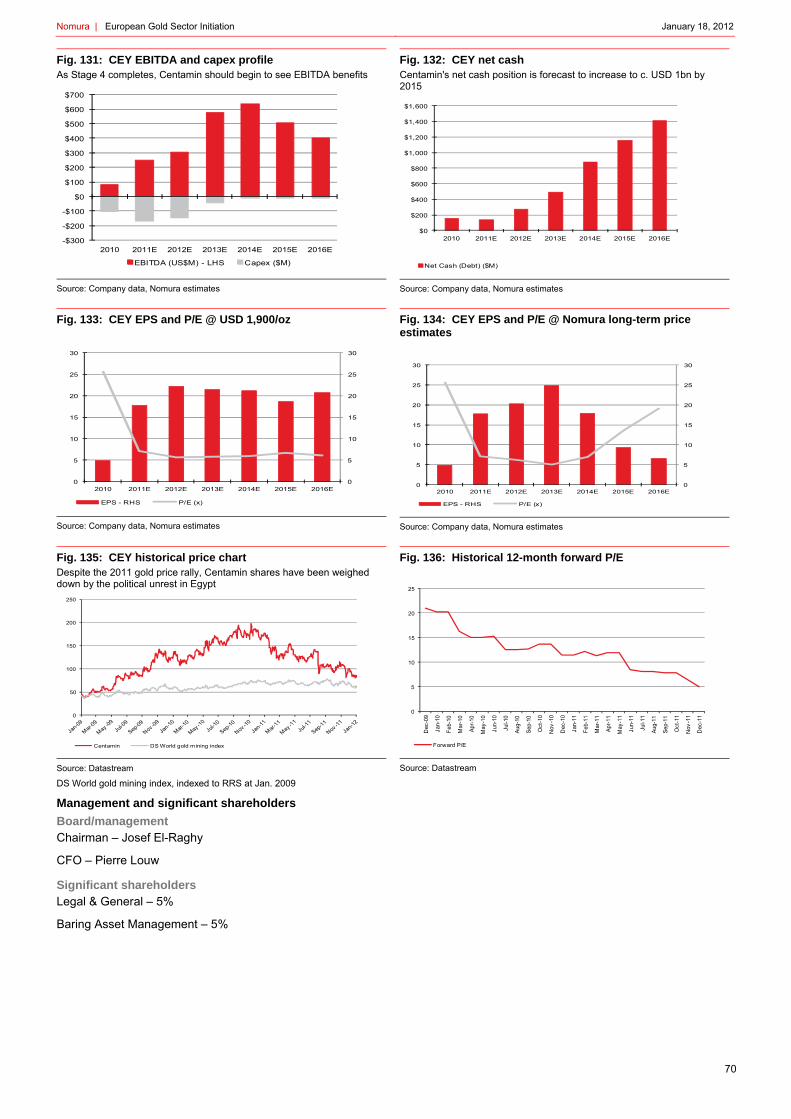
Nomura | European Gold Sector Initiation January 18, 2012
70
Fig. 131: CEY EBITDA and capex profile As Stage 4 completes, Centamin should begin to see EBITDA benefits
Source: Company data, Nomura estimates
Fig. 132: CEY net cash Centamin's net cash position is forecast to increase to c. USD 1bn by 2015
Source: Company data, Nomura estimates
Fig. 133: CEY EPS and P/E @ USD 1,900/oz
Source: Company data, Nomura estimates
Fig. 134: CEY EPS and P/E @ Nomura long-term price estimates
Source: Company data, Nomura estimates
Fig. 135: CEY historical price chart Despite the 2011 gold price rally, Centamin shares have been weighed down by the political unrest in Egypt
Source: Datastream
Fig. 136: Historical 12-month forward P/E
Source: Datastream
DS World gold mining index, indexed to RRS at Jan. 2009
Management and significant shareholders
Board/management Chairman – Josef El-Raghy
CFO – Pierre Louw
Significant shareholders Legal & General – 5%
Baring Asset Management – 5%
-$300
-$200
-$100
$0
$100
$200
$300
$400
$500
$600
$700
2010 2011E 2012E 2013E 2014E 2015E 2016E
EBITDA (US$M) - LHS Capex ($M)
$0
$200
$400
$600
$800
$1,000
$1,200
$1,400
$1,600
2010 2011E 2012E 2013E 2014E 2015E 2016E
Net Cash (Debt) ($M)
0
5
10
15
20
25
30
0
5
10
15
20
25
30
2010 2011E 2012E 2013E 2014E 2015E 2016E
EPS - RHS P/E (x)
0
5
10
15
20
25
30
0
5
10
15
20
25
30
2010 2011E 2012E 2013E 2014E 2015E 2016E
EPS - RHS P/E (x)
0
50
100
150
200
250
Centamin DS World gold mining index
0
5
10
15
20
25
Dec
-09
Jan-
10
Feb-
10
Mar
-10
Apr-1
0
May
-10
Jun-
10
Jul-1
0
Aug-
10
Sep-
10
Oct
-10
Nov
-10
Dec
-10
Jan-
11
Feb-
11
Mar
-11
Apr-1
1
May
-11
Jun-
11
Jul-1
1
Aug-
11
Sep-
11
Oct
-11
Nov
-11
Dec
-11
Forward P/E
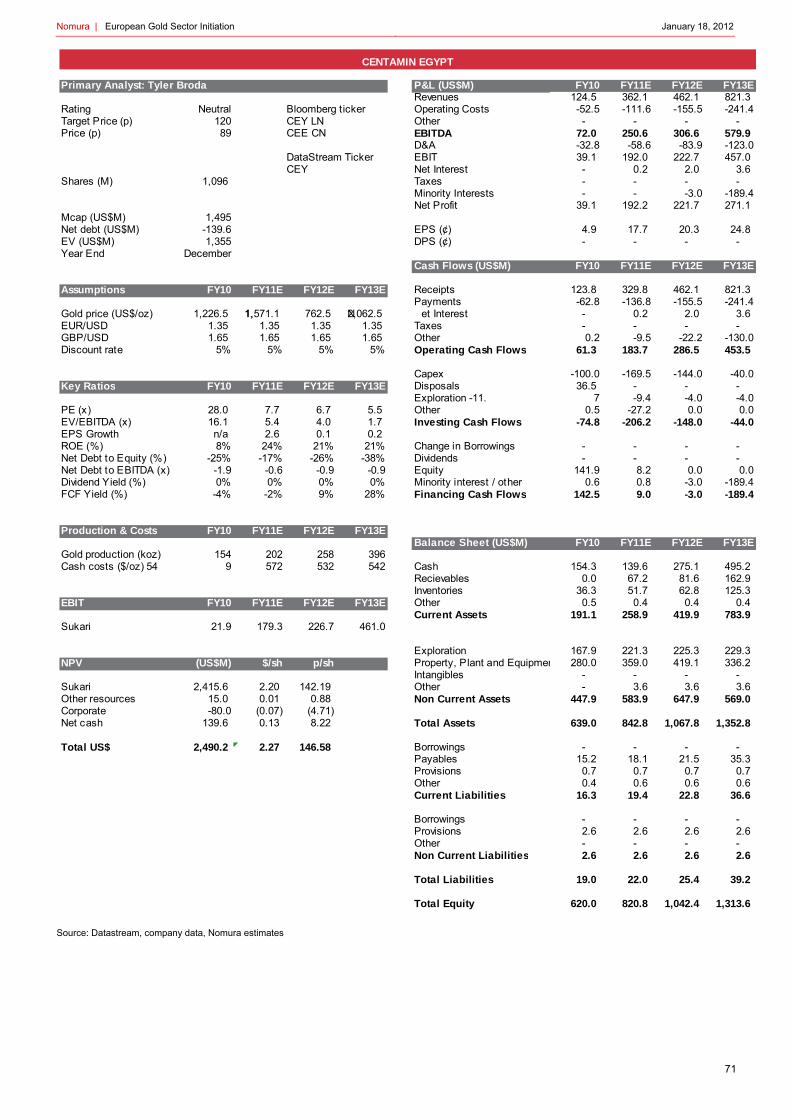
Nomura | European Gold Sector Initiation January 18, 2012
71
Source: Datastream, company data, Nomura estimates
P&L (US$M) FY10 FY11E FY12E FY13ERevenues 124.5 362.1 462.1 821.3
Rating Neutral Bloomberg ticker Operating Costs -52.5 -111.6 -155.5 -241.4Target Price (p) 120 CEY LN Other - - - - Price (p) 89 CEE CN EBITDA 72.0 250.6 306.6 579.9
D&A -32.8 -58.6 -83.9 -123.0DataStream Ticker EBIT 39.1 192.0 222.7 457.0 CEY Net Interest - 0.2 2.0 3.6
Shares (M) 1,096 Taxes - - - - Minority Interests - - -3.0 -189.4Net Profit 39.1 192.2 221.7 271.1
Mcap (US$M) 1,495Net debt (US$M) -139.6 EPS (¢) 4.9 17.7 20.3 24.8 EV (US$M) 1,355 DPS (¢) - - - - Year End December
Cash Flows (US$M) FY10 FY11E FY12E FY13E
Assumptions FY10 FY11E FY12E FY13E Receipts 123.8 329.8 462.1 821.3 Payments -62.8 -136.8 -155.5 -241.4
Gold price (US$/oz) 1,226.5 1,571.1 1, 762.5 2,062.5 N et Interest - 0.2 2.0 3.6 EUR/USD 1.35 1.35 1.35 1.35 Taxes - - - - GBP/USD 1.65 1.65 1.65 1.65 Other 0.2 -9.5 -22.2 -130.0Discount rate 5% 5% 5% 5% Operating Cash Flows 61.3 183.7 286.5 453.5
Capex -100.0 -169.5 -144.0 -40.0Key Ratios FY10 FY11E FY12E FY13E Disposals 36.5 - - -
Exploration -11. 7 -9.4 -4.0 -4.0PE (x) 28.0 7.7 6.7 5.5 Other 0.5 -27.2 0.0 0.0EV/EBITDA (x) 16.1 5.4 4.0 1.7 Investing Cash Flows -74.8 -206.2 -148.0 -44.0EPS Growth n/a 2.6 0.1 0.2 ROE (%) 8% 24% 21% 21% Change in Borrowings - - - - Net Debt to Equity (%) -25% -17% -26% -38% Dividends - - - - Net Debt to EBITDA (x) -1.9 -0.6 -0.9 -0.9 Equity 141.9 8.2 0.0 0.0Dividend Yield (%) 0% 0% 0% 0% Minority interest / other 0.6 0.8 -3.0 -189.4FCF Yield (%) -4% -2% 9% 28% Financing Cash Flows 142.5 9.0 -3.0 -189.4
Production & Costs FY10 FY11E FY12E FY13EBalance Sheet (US$M) FY10 FY11E FY12E FY13E
Gold production (koz) 154 202 258 396Cash costs ($/oz) 54 9 572 532 542 Cash 154.3 139.6 275.1 495.2
Recievables 0.0 67.2 81.6 162.9 Inventories 36.3 51.7 62.8 125.3
EBIT FY10 FY11E FY12E FY13E Other 0.5 0.4 0.4 0.4 Current Assets 191.1 258.9 419.9 783.9
Sukari 21.9 179.3 226.7 461.0
Exploration 167.9 221.3 225.3 229.3 NPV (US$M) $/sh p/sh Property, Plant and Equipmen 280.0 359.0 419.1 336.2
Intangibles - - - - Sukari 2,415.6 2.20 142.19 Other - 3.6 3.6 3.6 Other resources 15.0 0.01 0.88 Non Current Assets 447.9 583.9 647.9 569.0 Corporate -80.0 (0.07) (4.71) Net cash 139.6 0.13 8.22 Total Assets 639.0 842.8 1,067.8 1,352.8
Total US$ 2,490.2 2.27 146.58 Borrowings - - - - Payables 15.2 18.1 21.5 35.3 Provisions 0.7 0.7 0.7 0.7 Other 0.4 0.6 0.6 0.6 Current Liabilities 16.3 19.4 22.8 36.6
Borrowings - - - - Provisions 2.6 2.6 2.6 2.6 Other - - - - Non Current Liabilities 2.6 2.6 2.6 2.6
Total Liabilities 19.0 22.0 25.4 39.2
Total Equity 620.0 820.8 1,042.4 1,313.6
CENTAMIN EGYPT
Primary Analyst: Tyler Broda

Nomura | European Gold Sector Initiation January 18, 2012
72
POG – Petropavlovsk (Reduce, 860p TP) Petropavlovsk is undergoing a period of rapid growth as the company brings its vast Russian land packages and projects to account. Fundamental value is far higher than the current share price. However, we do not expect 2012 to provide a re-rating in advance of the commissioning of the technically-challenging POX hub, hence our relative Reduce rating.
Attractive, but risks outweigh significant upside potential until POX production begins
Petropavlovsk continues to rapidly progress its vast suite of mineral assets in Russia’s Far East Amur region. The recently commissioned Albyn mine became the fourth hard rock gold mine built by the group and the company is analysing yet another expansion at its Pioneer mine. We expect Petropavlovsk’s precious metals operations to increase production from 0.6moz of gold in 2011 to almost 1.0moz of gold in 2014.
The majority of the current growth portfolio comes from the new POX Hub at Pokrovskiy. POX (pressure oxidization) is a processing method that allows refractory ore (sulphide material where gold extraction cannot be completed through traditional techniques), to be processed via high pressure oxidization in autoclaves. The hub, which will process ore from Pioneer and Malomir remains on time and on budget for a mid-2013 commissioning at USD 480m in total capital expenditure.
The progress to date is encouraging. However, as the milled grades decline at the other mines, the POX Hub will account for 38% of our total gold production estimates by 2014. We believe that Petropavlovsk has a firm understanding of the challenges that will arise with this entry to POX processing, but we believe these risks will remain highlighted during a ‘show-me’ year for Petropavlovsk, in context of the company’s past production guidance misses.
Fig. 137: Petropavlovsk milled grades and refractory production Petropavlovsk will likely be facing declining grades at its main operations while adding more challenging POX production
Source: Company data, Nomura estimates
On a P/NAV basis, we calculate that Petropavlovsk is trading at 0.8x P/NAV as using spot gold prices. In our view, there are fundamental structural issues blocking the potential for a significant P/NAV re-rating over the next 12 months.
1) Petropavlovsk is likely to be heading deeper into a net-debt position (40% net debt to equity), owing to the high capex for the POX Hub at a time when the market generally prefers less leveraged balance sheets.
2) Investor perceptions of Russian risks are unlikely to dissipate, especially following the unexpected public reaction to the Russian parliamentary elections. Petropavlovsk’s political risk exposure remains concentrated and therefore we believe there is less potential for Petropavlovsk to take part in M&A than its peers.
3) The lower expected grades in the precious metals division should see increasing unit costs in future years, reducing the safety margin from an already relatively high cash cost position.
5.8
2.7 2.7
2.2
1.6 1.5 1.4
0%
5%
10%
15%
20%
25%
30%
35%
40%
45%
50%
0.0
1.0
2.0
3.0
4.0
5.0
6.0
7.0
2009 2010 2011E 2012E 2013E 2014E 2015E
Weighted avg. hard rock milled grade (LHS) % of group production from POX hub (RHS)
Aver
age
hard
rock
mill
ed g
rade
Percentageof production from
refractory ore

Nomura | European Gold Sector Initiation January 18, 2012
73
4) The 65.6% stake in Hong Kong listed iron ore/titanomagnetite-producer IRC reduces the pure-play gold exposure and at the suppressed IRC equity prices, we do not expect the company to revisit this in the next 12 months.
5) The potential for operational challenges to arise surrounding the POX operations are likely to reach their peak in the next 18 months.
Near-term upside potential? Despite the negatives mentioned above, Petropavlovsk is poised to announce an increased reserves and resources statement following an USD 80m exploration spend in 2011. This could have material positive impact on the company’s shares in the near term.
The Pioneer mine is running out of non-refractory gold. The current reserve supports not much more than 3 or 4 years of production, and the bulk of that is likely to come at a lower grades as the higher grade Andreevskaya pit runs out of reserve sooner. However the company plans to bring forward another grinding block to increase capacity. This, in our view, indicates that the February resource update, at Pioneer at least, is likely to add positive NAV to our valuation and this could have significant positive impact on near-term mine lives and cash flow.
Three longer-term opportunities are likely to help Petropavlovsk management enhance shareholder value: 1) Petropavlovsk has rationalised its communications to the market and we believe that achieving 2011 production guidance will go a long way toward increasing investor perception of the investment opportunity. 2) If successful, the POX Hub, which is located on the Trans Siberian Railway and is scalable, could become a centre for processing refractory gold, of which Russia has many stranded deposits. 3) The IRC stake, and strategic optionality, over the long-run, could develop significant value for the group.
In addition, the disparity between Petropavlovsk and Polymetal’s P/NAV multiples despite the relative similarities of the companies is also a potential positive for Petropavlovsk. We expect that if Petropavlovsk executes over the next two years, the disparity in the P/NAV multiples will decrease (and likely in POG’s favour).
Valuation Nomura’s sum-of-the-parts NAV estimate (using Nomura’s year-end gold price forecast of USD 1,900/oz and a 5% discount rate) provides a value of 1,226p/share. At the current spot gold price of USD 1,640/oz, Nomura calculates a NAV of 858p/per share implying a P/NAV multiple of 0.8x. Nomura initiates on POG with a Reduce rating based on a one-year forward P/NAV multiple of 0.7x, which equates to 860p.
Fig. 138: POG valuation Petropavlovsk is highly dependent on the outcome of the POX Hub
Source: Nomura estimates
Valuation (NPV @ 5%) $M Current Per Share +1 Yr +2 Yr +3 Yr
Pioneer 513.3 $2.73 $1.88 $1.30 $1.12
Pokrovskiy 393.3 $2.09 $1.75 $1.38 $1.10
Malomir 230.0 $1.22 $0.78 $0.49 $0.25
Albyn 694.5 $3.70 $3.45 $2.55 $1.68
Pokrovskiy Hub 2059.1 $10.96 $13.41 $13.65 $12.56
Alluvials 493.8 $2.63 $2.39 $2.14 $1.88
IRC (65.6%) 305.5 $1.63 $1.63 $1.63 $1.63
Other Resources 168.8 $0.90 $0.90 $0.90 $0.90Corporate -532.8 -$2.84 -$2.45 -$2.15 -$1.84Net Cash (Debt) -525.4 -$2.80 -$4.72 -$5.06 -$2.16Total 3800.0 $20.23 $19.01 $16.83 $17.11
GBPUSD 1.55Total GBP 2452 1226p
Current share price (p) 679
P/NAV 0.6x
Target multiple 0.7xTarget price 859p
Upside 27%

Nomura | European Gold Sector Initiation January 18, 2012
74
Fig. 139: POG NPV waterfall chart Pokrovskiy hub is the future for Petropavlovsk at higher gold prices
Source: Nomura research
Fig. 140: POG valuation trend Shorter mine lives with increased capital spending sees NPV drifting
Source: Nomura research
Fig. 141: Map of operations Petropavlovsk's operations are focused on the Amur region of Eastern Russia
Source: Nomura research
Fig. 142: POG precious metals division production and cash cost forecasts
Source: Company data, Nomura estimates
£0.00
£2.00
£4.00
£6.00
£8.00
£10.00
£12.00
£14.00
£16.00
£18.00
Pio
neer
Pok
rovs
kiy
Mal
omir
Alb
yn
Pok
rovs
kiy
Hub
Allu
vial
s
IRC
(65.
6%)
Oth
er R
esou
rces
Cor
pora
te
Net
cas
h
Tota
l
£13.05£12.26
£10.86 £11.04
£0.00
£2.00
£4.00
£6.00
£8.00
£10.00
£12.00
£14.00
0Yr +1 Yr +2 Yr +3 Yr
NP
V p
er
sh
are
0.0
200.0
400.0
600.0
800.0
1,000.0
1,200.0
0
100,000
200,000
300,000
400,000
500,000
600,000
700,000
800,000
900,000
1,000,000
2009 2010 2011E 2012E 2013E 2014E 2015E
Pioneer Pokrov skiy Malomir Albyn Pokrov skiy Hub Alluv ials Cash cost per ounce
Gold
pro
duct
ion
(oz)
Cash costs (USD/oz)

Nomura | European Gold Sector Initiation January 18, 2012
75
Company summary
Petropavlovsk (formerly Peter Hambro Mining) is an intermediate gold producer listed on the LSE (POG). Petropavlovsk operates four mines hardrock open-pit gold mining projects in the Amur region of Russia, including Pioneer (98.6%), Pokrovskiy (98.6%), Malomir (100%) and Albyn (100%%). The company is building the POX Hub at Pokrovskiy to process the substantial refractory gold resources owned in the region, starting with Pioneer and Malomir. Petropavlovsk also operates seasonal alluvial gold mines. In addition to multiple exploration prospects, the company owns a 65.6% stake in its former wholly-owned Hong Kong-listed IRC Limited (1029 HK). IRC is developing the K+S and Kurynakh projects iron ore and titanomagnetite projects, also found in the Amur region.
Asset summary
Pioneer (98.6%) The Pioneer Gold mine is located in the Amur region of Russia, 40km from the Pokrovskiy mine, near the Chinese border. In 2010, Pioneer produced 230,000oz of gold at a cash cost of USD 565/oz. Nomura forecasts 2011 production to be 326,000oz at a cash cost of USD 645/oz.
Pioneer consists of multiple steeply-dipping ore zones formed as a result of hydrothermal activity associated with the collision of the Eurasian and Amur plates. Andreevskaya, a higher grade pit, is found to the south-east of the main structure. The processing facilities include a 5.0mtpa RIP (resin in pulp) plant and a seasonal heap leaching facility that has an estimated capacity of 0.7mtpa. The company will report in January 2012 on a potential expansion to increase grinding capacity to 7.0mtpa. 2011 saw significant pre-stripping as the mine prepares to extract refractory ore.
The ore at Pioneer is both refractory and non-refractory. As part of the POX Hub being built at Pokrovskiy, a series of three flotation circuits are being installed at Pioneer that will generate a refractory concentrate that will be processed at Pokrovskiy. Pioneer has 524 sq km of nearby exploration ground and we expect that positive exploration results could provide rationale for a further increase of the front-end of the plant that should see Pioneer continuing to process non-refractory material, past 2015, augmenting group production.
The reserve consists of 67.3mt of ore at an average grade of 1.2g/t. It is unclear what proportion of ore is refractory and what proportion is non-refractory; making it difficult to forecast with accuracy how long the RIP operations at Pioneer can continue. Petropavlovsk is likely to update the market on this point shortly. Additionally, the recent mined grades have been substantially higher than the reserve grade, suggesting that higher costs are likely in the future as lower grade ore is mined and processed.
Owing to the lower grades, we forecast 276,000oz of gold production at a cash cost of USD 789/oz in 2012. Positive exploration results that add new, higher grade, non-refractory deposits could provide upside potential beyond our 2013 forecasts.
Pokrovskiy (98.6%) and POX Hub Pokrovskiy is the initial hard rock mine developed by Petropavlovsk and is located 10km from the Trans Siberian railway, Pokrovskiy will be host to the new POX Hub and will process refractory ore from the region, beginning with material from Pioneer and Malomir. The non-refractory operations at Pokrovskiy produced 145,000oz of gold at USD 570/oz in 2010. We forecast production of 102,000oz of gold at a cash cost of USD 657/oz in 2011, down owing to lower expected grades.
Current operations are likely to continue until 2014 (heap leach until 2017). After this, the 1.7mtpa RIP plant and spare milling capacity should provide extra flexibility for the POX Hub. The main source of ore in 2012 is likely to be from the Pokrovska 2 pit as the original pit has come towards the end of its mine life. The newly-discovered Zheltunak resource should also incrementally add ounces to production. Owing to decreasing grades (the reserve grade is 0.9g/t), we forecast 2012 production to fall to 88,000oz of gold at a cash cost of USD 767/oz.

Nomura | European Gold Sector Initiation January 18, 2012
76
The future for Pokrovskiy and, in our view, for Petropavlovsk itself, will be determined by the success of the POX Hub. Petropavlovsk is budgeting USD 480m on developing a regional centre to process refractory gold ore. Two flotation plants will be built at Pioneer and Malomir, where gold concentrate will be shipped 40km and 670km by road, respectively, to Pokrovskiy. The POX hub will have a capacity of 600ktpa of concentrate per annum – 330ktpa from Malomir and 240ktpa from Pioneer. The operation is larger than Polymetal’s Amursk Hub which is delivering a similar project along a similar timeframe.
Fig. 143: POX Hub regional diagram The hub is located next to the Trans Siberian railway, 40km from Pioneer, 670km from Malomir
Source: Company data
The Hub is being constructed at Pokrovskiy as the current mine has many favourable advantages including low-cost hydropower electricity, significant limestone and clay deposits, and existing nearby tailings facilities. There is already a skilled workforce in place.
Production from the autoclaves is expected by the company to commence in mid-2013. Initially Petropavlovsk had expected to process concentrate via third-party copper smelters in advance of the construction of the autoclaves; however, the company might now stockpile material in order to avoid the punitive refining costs. This is likely to delay first production until 2013, when proper gold production from the autoclaves was scheduled in the first place (leaving the project on time).
Fig. 144: POX Hub production and cash cost estimates Once construction has completed, POX Hub should account for a significant portion of POG production
Source: Company data, Nomura research
0
200
400
600
800
1,000
1,200
0
50,000
100,000
150,000
200,000
250,000
300,000
350,000
400,000
450,000
2009 2010 2011E 2012E 2013E 2014E 2015E
Cash
co
st
per
ou
nce
(US
$/o
z)
(no
t in
cl
roya
ltie
s)
Pro
du
ctio
n (
oz)
Nomura | European Gold Sector Initiation January 18, 2012
77
The risks surrounding the implementation of POX technology are greater than traditional processing techniques. That said, Petropavlovsk has taken a measured approach to this shift in group strategy via extensive design and testing. The group has hired experienced POX practitioners and thus far the project is on time and budget.
Malomir (100%) The Malomir mine is located in the northeast corner of the Amur region in Russia. The RIP plant for processing non-refractory ore was commissioned in August 2010. The majority of the ore at Malomir is refractory. The mine produced 36,000oz in 2010 and we expect production to increase to 88,000oz in 2011 at a cash cost of USD 667/oz.
The capacity of the plant was increased in 2011 with the addition of a second crushing and grinding line. The current operations are mining the higher grade Quartzitovitze pit, which has a reserve grade of 1.1g/t as compared with the current milled grade in 2011E of 3.7g/t. As such, we expect grades to fall next year, but the new capacity of 1.4mtpa should provide increased gold production. We expect Malomir to produce 97,000oz of gold in 2012 at a cash cost of USD 738/oz.
Malomir is likely to be the biggest contributor to the POX hub. Malomir will send 330ktpa of refractory concentrate to Pokrovskiy from 6.0mtpa of ore mined. The company expects that the first flotation line will be commissioned in mid-2012.
Albyn (100%) Albyn was commissioned in 2011 with an initial capacity of 1.8mtpa of throughput. The group is considering expanding the capacity with the addition of a second processing line, which should bring total production to 3.6mtpa. We forecast Albyn will produce (on a pre-expanded basis) 133,000oz of gold at a cash cost of USD 740/oz in 2012. We forecast production of 212,000oz of gold in 2013.
The mine has a life of eight years, although there is potential for other regional resources to be added to the overall resource. Albyn has a reserve grade of 2.0g/t, well above the group reserve grade of 1.2g/t and this mine should provide higher operational flexibility for the group. On the downside, we expect the strip ratio to be 22:1, which will leave costs relatively exposed to mining cost inflation.
IRC Limited (65.6%) IRC Limited is a subsidiary of Petropavlovsk listed on the Hong Kong stock exchange (1029 HK). IRC is an emerging iron ore and ilmenite producer with three development stage projects located in Russia’s Amur region near the Chinese border. The assets include Kuranakh, which produces an iron ore and a titanomagnetite concentrate, K+S a large magnetite deposit under development and Garinskoye, a longer-term magnetite development deposit.
Kuranakh is ramping up production to a forecast 900ktpa of iron ore concentrate and 290ktpa of ilmenite concentrate. The larger K+S deposit is likely to begin production in 2013, reaching a total of 3.2mt Fe (a 65% concentrate) at full capacity.
As Petropavlovsk consolidates its majority stake in IRC into the group figures, the capex spend in the near term (we calculate over USD 400m of capital expenditure over the next two years) is likely to weigh on the Petropavlovsk balance sheet. A total of USD 740m in debt and project financing has been arranged with ICBC and CNEEC and therefore the K+S project is financed to expected completion – the company had a cash balance of USD 122m as at 30 June 2011.
Our risked valuation for Petropavlovsk’s 65.6% stake in IRC is USD 317m, close to the pure equity read-through value of USD 331m. In our view, the IRC stake within Petropavlovsk has the potential to create unrecognised value once the ownership structure is streamlined and as development de-risking allows IRC to trade closer to its NAV. A further divestment will be difficult in the near term, however, as Petropavlovsk has guaranteed certain of the current IRC debt facilities. There are also significant crossover synergies from an operational perspective between the two companies. Therefore, the two companies may remained intertwined at the group level for a while longer.
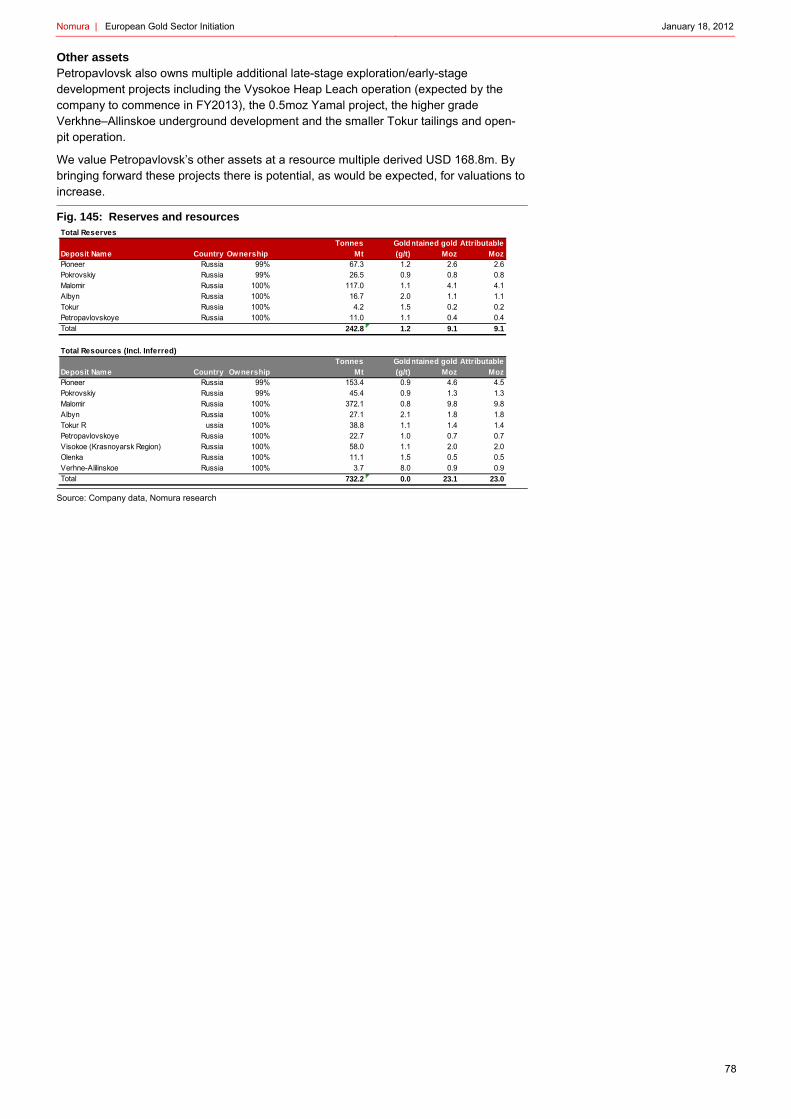
Nomura | European Gold Sector Initiation January 18, 2012
78
Other assets Petropavlovsk also owns multiple additional late-stage exploration/early-stage development projects including the Vysokoe Heap Leach operation (expected by the company to commence in FY2013), the 0.5moz Yamal project, the higher grade Verkhne–Allinskoe underground development and the smaller Tokur tailings and open-pit operation.
We value Petropavlovsk’s other assets at a resource multiple derived USD 168.8m. By bringing forward these projects there is potential, as would be expected, for valuations to increase.
Fig. 145: Reserves and resources
Source: Company data, Nomura research
Tonnes Goldntained gold AttributableDeposit Name Country Ownership Mt (g/t) Moz MozPioneer Russia 99% 67.3 1.2 2.6 2.6Pokrovskiy Russia 99% 26.5 0.9 0.8 0.8Malomir Russia 100% 117.0 1.1 4.1 4.1Albyn Russia 100% 16.7 2.0 1.1 1.1Tokur Russia 100% 4.2 1.5 0.2 0.2Petropavlovskoye Russia 100% 11.0 1.1 0.4 0.4Total 242.8 1.2 9.1 9.1
Total Resources (Incl. Inferred)Tonnes Goldntained gold Attributable
Deposit Name Country Ownership Mt (g/t) Moz MozPioneer Russia 99% 153.4 0.9 4.6 4.5Pokrovskiy Russia 99% 45.4 0.9 1.3 1.3Malomir Russia 100% 372.1 0.8 9.8 9.8Albyn Russia 100% 27.1 2.1 1.8 1.8Tokur R ussia 100% 38.8 1.1 1.4 1.4Petropavlovskoye Russia 100% 22.7 1.0 0.7 0.7Visokoe (Krasnoyarsk Region) Russia 100% 58.0 1.1 2.0 2.0Olenka Russia 100% 11.1 1.5 0.5 0.5Verhne-Alilinskoe Russia 100% 3.7 8.0 0.9 0.9Total 732.2 0.0 23.1 23.0
Total Reserves
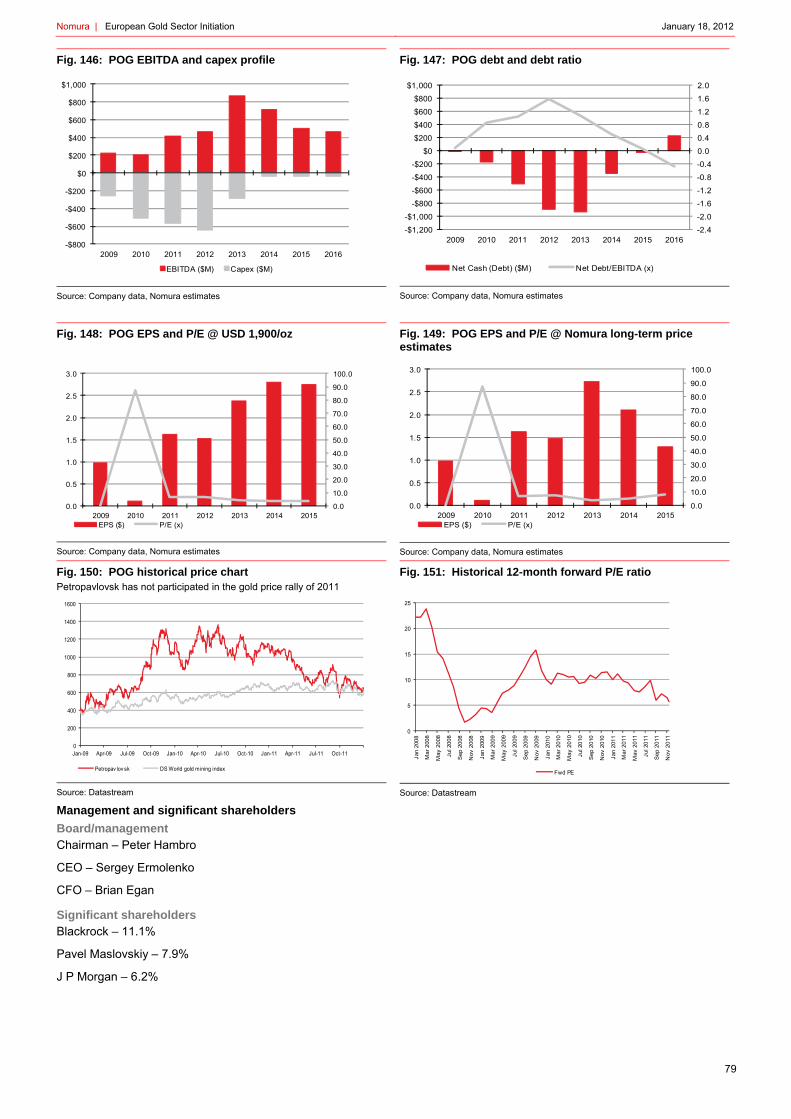
Nomura | European Gold Sector Initiation January 18, 2012
79
Fig. 146: POG EBITDA and capex profile
Source: Company data, Nomura estimates
Fig. 147: POG debt and debt ratio
Source: Company data, Nomura estimates
Fig. 148: POG EPS and P/E @ USD 1,900/oz
Source: Company data, Nomura estimates
Fig. 149: POG EPS and P/E @ Nomura long-term price estimates
Source: Company data, Nomura estimates
Fig. 150: POG historical price chart Petropavlovsk has not participated in the gold price rally of 2011
Source: Datastream
Fig. 151: Historical 12-month forward P/E ratio
Source: Datastream
Management and significant shareholders
Board/management Chairman – Peter Hambro
CEO – Sergey Ermolenko
CFO – Brian Egan
Significant shareholders Blackrock – 11.1%
Pavel Maslovskiy – 7.9%
J P Morgan – 6.2%
-$800
-$600
-$400
-$200
$0
$200
$400
$600
$800
$1,000
2009 2010 2011 2012 2013 2014 2015 2016
EBITDA ($M) Capex ($M)
-2.4-2.0
-1.6-1.2
-0.8-0.40.0
0.40.8
1.21.6
2.0
-$1,200-$1,000
-$800-$600
-$400-$200
$0
$200$400
$600$800
$1,000
2009 2010 2011 2012 2013 2014 2015 2016
Net Cash (Debt) ($M) Net Debt/EBITDA (x)
0.0
10.0
20.0
30.0
40.0
50.0
60.0
70.0
80.0
90.0
100.0
0.0
0.5
1.0
1.5
2.0
2.5
3.0
2009 2010 2011 2012 2013 2014 2015EPS ($) P/E (x)
0.0
10.0
20.0
30.0
40.0
50.0
60.0
70.0
80.0
90.0
100.0
0.0
0.5
1.0
1.5
2.0
2.5
3.0
2009 2010 2011 2012 2013 2014 2015EPS ($) P/E (x)
0
200
400
600
800
1000
1200
1400
1600
Jan-09 Apr-09 Jul-09 Oct-09 Jan-10 Apr-10 Jul-10 Oct-10 Jan-11 Apr-11 Jul-11 Oct-11
Petropav lov sk DS World gold mining index
0
5
10
15
20
25
Jan
2008
Mar
200
8
May
200
8
Jul 2
008
Sep
200
8
Nov
200
8
Jan
2009
Mar
200
9
May
200
9
Jul 2
009
Sep
200
9
Nov
200
9
Jan
2010
Mar
201
0
May
201
0
Jul 2
010
Sep
201
0
Nov
201
0
Jan
2011
Mar
201
1
Ma y
201
1
Jul 2
011
Sep
201
1
Nov
201
1
Fwd PE

Nomura | European Gold Sector Initiation January 18, 2012
80
Source: Datastream, company data, Nomura estimates
P&L (US$M) FY10 FY11E FY12E FY13ERevenues 612 1,233 1,512 2,107
Rating Reduce Bloomberg Ticker Operating Costs -275 -572 -754 -995Target Price GBp 860 POG LN Other -132 -165 -188 -218
EBITDA 205 495 570 894Price (GBp) 685 DataStream Ticker D&A -87 -82 -145 -145
POG EBIT 118 413 425 749Associate 0 0 0 0
Shares Outstanding (M) 188 Net Interest -23 -39 -42 -34Taxes - 46 -97 -107 -200
Mcap (US$M) 1948 Adjustments -26 14 0 0Net debt (US$M) 526 Net Profit 23 291 276 514EV (US$M) 2474
EPS (¢) 11 162 147 274Year End December DPS (¢) 7 7 7 14
Assumptions FY10 FY11E FY12E FY13ECash Flows (US$M) FY10 FY11E FY12E FY13E
Gold (US$/oz) 1,225 1,571 1,788 2,063Copper (USc/lb) 3.04 3.94 4.11 3.95 Cash generated from operations 201 525 570 894Silver (US$/oz) 20.17 38.00 42.00 49.00 Working capital changes -121 -176 -90 -332Iron Ore (US¢/%Fe) 0 0 250 206 Net Interest -27 -35 -42 -34
Taxes -15 -93 -107 -200Operating Cash Flows 38 220 331 328
GBP/USD 0.96 1.55 1.55 1.55AUD/USD 0.88 0.99 1.03 1.02 Capex -507 -562 -644 -288
Disposals 1 0 0 0Exploration 0 0 -63 -63
Key Ratios FY10 FY11E FY12E FY13E Other 4 -2 0 0Investing Cash Flows -503 -564 -707 -351
PE (x) 96.6 6.6 7.2 3.9EV/EBITDA (x) 10.3 5.0 5.0 3.2 Change in Borrow ings 408 190 310 -70EPS Grow th (%) -89% 1370% -9% 86% Dividends -28 -9 -10 -16ROE (%) 1% 15% 12% 18% Equity 336 0 0 0Net Debt to Equity (%) 10% 27% 41% 35% Other -4 -2 0 0Net Debt to EBITDA (x) 0.84 1.06 1.60 1.06 Financing Cash Flows 712 179 300 -86Dividend Yield (%) 2% 2% 2% 3%FCF Yield (%) -30.4% -17.3% -15.8% 2.1%Net debt / (cash) 171.1 526.0 912.1 951.3 Balance Sheet (US$M) FY10 FY11E FY12E FY13E
Cash 321 165 89 -20Production & Costs FY10 FY11E FY12E FY13E Recievables 219 341 444 668
Inventories 210 356 378 561Gold Production (koz) 507 624 682 884 Other 2 0 0 0Cash cost (US$/oz) 617.0 762.3 789.8 963.3 Current Assets 751 862 910 1,209
Recievables 29 31 31 31EBIT (US$m) FY10 FY11E FY12E FY13E Investments 12 2 2 2
Property, Plant and Equipment 1,320 1,731 2,230 2,372Pioneer 111 324 268 163 Intangibles 369 393 425 488Prokrovskiy 72 81 78 99 Other 7 15 47 47Malomir 19 72 91 72 Non Current Assets 1,737 2,173 2,735 2,941Albyn 0 2 148 170Prokrovskiy Hub 0 0 -78 278 Total Assets 2,488 3,035 3,645 4,150Alluvials 24 95 71 91IRC 26 -47 -4 54 Borrow ings 93 199 199 199
Payables 143 217 252 329Provisions 10 0 0 0
NPV (US$M) US$/sh GBp/sh Other 0 6 6 6Current Liabilities 246 422 458 534
Pioneer 418 $2.23 £1.44Prokrovskiy 309 $1.64 £1.06 Borrow ings 399 491 801 731Malomir 175 $0.93 £0.60 Provisions 134 13 13 13Albyn 477 $2.54 £1.64 Other 11 141 141 141Prokrovskiy Hub 1,032 $5.49 £3.54 Non Current Liabilities 544 645 955 885Alluvials 304 $1.62 £1.05IRC 305 $1.63 £1.05Net Cash -526 -$2.80 -£1.81 Total Liabilities 789 1,068 1,413 1,419Total US$ $11.34 £7.32
Total Equity 1,699 1,967 2,233 2,731
Petropavlovsk PLC
Primary Analyst: Tyler Broda

Nomura | European Gold Sector Initiation January 18, 2012
81
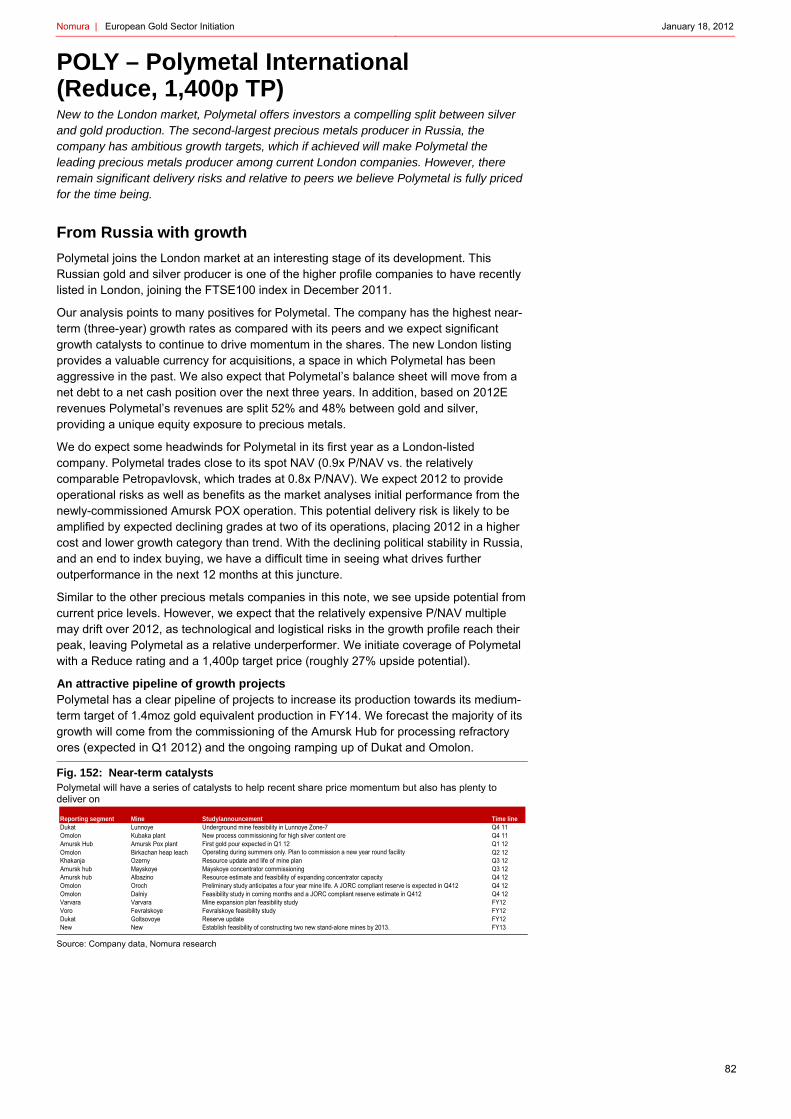
Nomura | European Gold Sector Initiation January 18, 2012
82
POLY – Polymetal International (Reduce, 1,400p TP) New to the London market, Polymetal offers investors a compelling split between silver and gold production. The second-largest precious metals producer in Russia, the company has ambitious growth targets, which if achieved will make Polymetal the leading precious metals producer among current London companies. However, there remain significant delivery risks and relative to peers we believe Polymetal is fully priced for the time being.
From Russia with growth
Polymetal joins the London market at an interesting stage of its development. This Russian gold and silver producer is one of the higher profile companies to have recently listed in London, joining the FTSE100 index in December 2011.
Our analysis points to many positives for Polymetal. The company has the highest near-term (three-year) growth rates as compared with its peers and we expect significant growth catalysts to continue to drive momentum in the shares. The new London listing provides a valuable currency for acquisitions, a space in which Polymetal has been aggressive in the past. We also expect that Polymetal’s balance sheet will move from a net debt to a net cash position over the next three years. In addition, based on 2012E revenues Polymetal’s revenues are split 52% and 48% between gold and silver, providing a unique equity exposure to precious metals.
We do expect some headwinds for Polymetal in its first year as a London-listed company. Polymetal trades close to its spot NAV (0.9x P/NAV vs. the relatively comparable Petropavlovsk, which trades at 0.8x P/NAV). We expect 2012 to provide operational risks as well as benefits as the market analyses initial performance from the newly-commissioned Amursk POX operation. This potential delivery risk is likely to be amplified by expected declining grades at two of its operations, placing 2012 in a higher cost and lower growth category than trend. With the declining political stability in Russia, and an end to index buying, we have a difficult time in seeing what drives further outperformance in the next 12 months at this juncture.
Similar to the other precious metals companies in this note, we see upside potential from current price levels. However, we expect that the relatively expensive P/NAV multiple may drift over 2012, as technological and logistical risks in the growth profile reach their peak, leaving Polymetal as a relative underperformer. We initiate coverage of Polymetal with a Reduce rating and a 1,400p target price (roughly 27% upside potential).
An attractive pipeline of growth projects Polymetal has a clear pipeline of projects to increase its production towards its medium-term target of 1.4moz gold equivalent production in FY14. We forecast the majority of its growth will come from the commissioning of the Amursk Hub for processing refractory ores (expected in Q1 2012) and the ongoing ramping up of Dukat and Omolon.
Fig. 152: Near-term catalysts Polymetal will have a series of catalysts to help recent share price momentum but also has plenty to deliver on
Source: Company data, Nomura research
Reporting segment Mine Study/announcement Time lineDukat Lunnoye Underground mine feasibility in Lunnoye Zone-7 Q4 11Omolon Kubaka plant New process commissioning for high silver content ore Q4 11Amursk Hub Amursk Pox plant First gold pour expected in Q1 12 Q1 12Omolon Birkachan heap leach Operating during summers only. Plan to commission a new year round facility Q2 12Khakanja Ozerny Resource update and life of mine plan Q3 12Amursk hub Mayskoye Mayskoye concentrator commissioning Q3 12Amursk hub Albazino Resource estimate and feasibility of expanding concentrator capacity Q4 12Omolon Oroch Preliminary study anticipates a four year mine life. A JORC compliant reserve is expected in Q412 Q4 12Omolon Dalniy Feasibility study in coming months and a JORC compliant reserve estimate in Q412 Q4 12Varvara Varvara Mine expansion plan feasibility study FY12Voro Fevralskoye Fevralskoye feasibility study FY12Dukat Goltsovoye Reserve update FY12New New Establish feasibility of constructing two new stand-alone mines by 2013. FY13

Nomura | European Gold Sector Initiation January 18, 2012
83
We have generally based our production forecasts on current reserves and the competent person’s report forecasts from the recent LSE prospectus making our forecasts generally lower than management’s production targets. Therefore, should management execute on its growth plans, over time, there is potential NAV upside risk to our forecasts.
Fig. 153: Polymetal’s recent acquisition history The company has been aggressive with growth in the past and new London listing will likely see this continue, but perhaps at a more moderate pace
Source: Company data, Nomura research
Polymetal International has been one of the more active acquirers in the past three years, acquiring over USD 700m of assets. We think this trend will continue as management has stated an ambition to expand the company inorganically, which it also stated in conjunction with its recent London listing.
The new listing should ease the use of share capital as an M&A currency, but we note that the group’s relatively high net debt balance and capex schedule is likely to restrict it from larger transactions in the near future.
Valuation Nomura’s sum-of-the-parts NAV estimate (using Nomura’s year-end gold price forecast of USD 1,900/oz and a discount rate of 5%) provides a value of 1,620p/share. At the current spot gold price of USD 1,640/oz, Nomura calculates a NAV of 1,192p/per share implying a P/NAV multiple of 0.9x. Nomura initiates on POLY with a Reduce rating based on a one-year forward P/NAV multiple of 0.9x, which equates to 1,400p.
Fig. 154: Polymetal NPV
Source: Nomura estimates
Acquisition Resources EV US$mUS$/oz
resource Strategic rationaleGoltsovoye 1.1 47 45 Bolt-on to DukatSopka 1.4 95 67 Bolt-on to OmolonMayskoye 7.5 166 22 Strategic fit with AlbazinoVarvara 3.8 258 68 Cash flow and entry to KazakhstanAvlayakan and Kirankan 0.5 65 142
Immediate cash flows, bolt-on to Khakanja
Svetloye 1.4 9 7 Bolt-on to KhakanjaKutyn 1 .2 67 56 Advanced exploration property in the
strategic regionTotal 16.9 707 42
Valuation (NPV @ 5%) $M Current Per Share +1 Yr +2 Yr +3 Yr
Dukat Hub 3971.6 $10.38 $9.59 $8.67 $7.60
Amursk POX 2475.9 $6.47 $7.27 $7.07 $6.81
Omolon 1810.5 $4.73 $4.53 $4.27 $3.91
Voro 382.7 $2.18 $1.82 $1.57 $1.43
Khakanja 637.7 $1.67 $1.27 $1.03 $0.79
Varvara 818.1 $2.14 $1.78 $1.47 $1.25
Other Resources 302.1 $0.79 $0.79 $0.79 $0.79Corporate -236.4 -$0.62 -$0.57 -$0.49 -$0.45Exploration 0.0 $0.00 $0.00 $0.00 $0.00Hedging 0.0 $0.00 $0.00 $0.00 $0.00Investments 0.0 $0.00 $0.00 $0.00 $0.00Net Cash (Debt) -836.0 -$2.18 -$1.37 $0.71 $3.45Total 9326.3 $25.55 $25.11 $25.09 $25.58
1400p 1399p 1426p
GBPUSD 1.55Total GBP 6017 1620p
Current share price (p) 1100
P/NAV 0.7x
Target multiple 0.9xTarget price 1400p
Upside 27%

Nomura | European Gold Sector Initiation January 18, 2012
84
Fig. 155: POLY waterfall chart
Source: Nomura research
Fig. 156: NPV curve
Source: Nomura research
Fig. 157: Map of operations Polymetal has operations across Russia and Kazakhstan
Source: Company data
Fig. 158: Polymetal production and cash cost forecasts Like Petropavlovsk, Polymetal's growth comes from the refractory Amursk POX hub, but is more balanced with the emergence of Omolon
Source: Nomura estimates
0p
200p
400p
600p
800p
1,000p
1,200p
1,400p
1,600p
1,800p
2,000p
Dukat Hub Amursk POX
Omolon Voro Khakanja Varv ara Other Resources
Corporate Net Cash (Debt)
Total
1648p 1620p
1619p
1650p
1,500
1,520
1,540
1,560
1,580
1,600
1,620
1,640
1,660
1,680
1,700
0Yr +1 Yr +2 Yr +3 YrNPV curv e
0.00
100.00
200.00
300.00
400.00
500.00
600.00
700.00
800.00
900.00
0
200,000
400,000
600,000
800,000
1,000,000
1,200,000
1,400,000
2009 2010 2011E 2012E 2013E 2014E 2015E
Dukat Hub Amursk POX Omolon Voro Khakanja Varvara Cash costs
Nomura | European Gold Sector Initiation January 18, 2012
85
Company summary
Polymetal International is an intermediate gold and silver producer listed on the LSE and is a member of the FTSE 100 index. The company has an ambitious target to increase production from current 790,000oz of gold equivalent in 2011 to 1.4moz of gold equivalent by 2014.
Polymetal operates three ’hub’ operations with multiple mines/processing centres and three standalone mines. The hubs, all located in Far East Russia, consist of the largely silver producing Dukat operations, the nearby Omolon hub and the Amursk refractory POX hub. Amursk is due to be commissioned in Q1 2012. The standalone mines consist of the Voro and Khakanja gold and silver mines in Russia and the Varavara copper-gold mine in Kazakhstan.
Based on our estimates, we expect the group’s net debt to peak at about USD 840m in FY11 below declining to a small net cash balance by FY13E. From a relative standpoint, as we show above in our industry analysis, the group’s net debt is higher than its peers, which we highlight as a risk factor.
We also believe that the group is likely to start paying dividends owing to our forecast for an ongoing improvement in its profitability and free cash flow generation. Management’s stated dividend policy is to pay total dividends of 20% if the net-debt-to-EBITDA ratio is less than 1.75x. We are cautiously forecasting dividend payout ratios of 20% for FY11 (DPSe: 20p) and 20% for FY12 (DPSe 39p), which is in line with management guidance.

Nomura | European Gold Sector Initiation January 18, 2012
86
Asset summary
Dukat hub (100%) The Dukat mining hub includes the Omsukchan concentrator, Lunnoye processing plant and four separate mines. It is the largest of the group’s operations and given our forecast for a steady production increase at Dukat (and low capex expectations) we expect it to remain the group’s main cash generator in the coming years. The Dukat hub is located in the Magadan region in Russia and mining is done both using open-pit and underground methods. The reserves at Dukat are predominantly silver. The mine hosts 275.8moz of silver but there is also 700,000oz of gold. In 2011 production on a gold equivalent basis, 90% of production was silver.
The Omsukchan concentrator has a capacity of 1.5Mtpa. The concentrate from the plant is either treated in Lunnoye’s cyanide leaching circuit (capacity 300ktpa) or shipped to a third party for further processing. Based on the ore grades and processing volumes we expect the hub’s production to grow from 275,000koz of gold in 2010 to 460,000oz by 2014E.
On the basis of the latest reserves at Dukat, we expect the operations to continue until 2020, although we expect the Omsukchan concentrator is likely to operate below its capacity/below reserve grades during this period. We note that the group is mining some ore outside its established reserves which increases forecasting uncertainty. However we think this uncertainty should alleviate somewhat once the Goltsovoye reserve grades and Lunnoye underground mine feasibility study are released in 2012.
Fig. 159: Dukat hub
Source: Company data, Nomura estimates
Dukat Mine (FY01) (incl. Nachalny-2 FY11):
Management plan open pit mining to terminate in FY12 and underground in FY21. Current capacity of 1000ktpa
but mgmt plan to expand to 1320ktpa by FY14.
Nachalny-2 mine :Located 4km North of the Dukat mine.
The mine is opening in H2 11 terminating in FY13 .The group expects to mine a total of 292ktpa of ore by FY13 (=36.5ktp/quarter). Concentrates have low recoveries
from cyanidation and are planned to be sold to off-takers.
Omsukchan ConcentratorIn FY10 debottlenecking enhanced capacity to current
1500ktpa. Ore treatment:
Uses conventional sulphide flotation, different cycles for different ore qualities. Nachalny -2 and Goltsovoye
have more complex ores. Recoveries: 72-74% for silver, 73-75% for gold.
Lunnoye feed treatment:Drying, homogenisation, sampling and packing. (before
07 smelting was done on site).
42km unpaved
Goltsovoye mine (FY09):Currently there are no reserve estimates but
management plan to publish estimates in FY12 following a completion of a drilling program.
Concentrates from this mine have low recoveries from cyanidation and are expected to be sold to off-takers.
The group started underground development in Q309 and first ore was mined in Q410. Mining capacity of 120ktpa
in FY11 is expected to reach 180ktpa in FY12
80km Full year access
Lunnoye Cyanide Leaching plantMixes concentrate from Omsukchan with ore from
Arylakh and Lunnoye mines. This is processed into zinc precipitate via agitated-tank
cyanide leaching and the Merrill Crowe process and transported back to Omsukchan concentrator for drying, homogenisation, sampling and packing.
The plant is operating at full capacity, processing 300ktpa to 30-50ktpa of concentrate with gold recovery
of 92-94% and silver of 87-91%
172kmFull year access
Arylakh Mine (FY06)Open pit expected to be depleted by FY13.
Detailed delineation below pit limit and underground mine design is currently ongoing.
Underground development expected to commence in Q1 13 and to operate for 3 years.
22kmFull year access
If mgmt deems that cyanidation is not effective for a batch, it is shipped to a third party off taker
through the Port of Magadan
After the Lunnoye treatment loop the drysampled precipitate is shipped to a third party refinery for toll-refining into dore and for sale.
Perevalny project Located 8km from the Dukat mine. Reserves
have not been establishedResource estimate 1.2Mt of mineralised material
grading 363g/t silver and 6.1gt gold.
Krasin project TBD71km from the Omsukchan concentrator and
6km from existing road.Resource estimate expected in FY12.
Lunnoye Mine (FY00): Zone 9 underground mine: Current capacity of 150ktpa. Further expansion to 300ktpa planned for FY17. Known
reserves expected to be depleted by FY23 but mgmt believe extensions are likely.
Zone 7: High grade narrow-quartz veins. In-fill drilling planned to start in Q412 to convert the zone from resource
to a reserve. Mgmt expect the underground mining feasibility be established in Q411.

Nomura | European Gold Sector Initiation January 18, 2012
87
Omolon hub (100%) The Omolon hub is also located in the Magadan region in a remote area accessible by winter road. The Kubaka plant, acquired with alongside the Birkachan mine, in 2008, is the main processing centre. The plant processes ore from the Sopka and Birkachan mines and is also planned to process ore from planned future developments in Tsokol, Oroch and Dalniy.
The Kubaka plant uses conventional CIP cyanidation technology and has a current capacity of 850ktpa. The plant processes mostly low grade Birkachan ore. A new section is being commissioned for high silver grade ore including an agitated leaching, counter-current decantation and Merrill Crowe recovery. Management expect the plant to be commissioned in Q4 2011, which we see as a potential catalyst. In Q4 2012 management plan to complete feasibility studies to evaluate potential reserves at the Oroch and Dalniy sites. Based on management’s plans we note the facilities are planned to be expanded to include a heap leaching operation at Birkachan which the company expects to start operations in 2012 and a heap leach at Sopka from 2014 onwards.
We see Omolon production will contribute significantly to the group’s production growth and forecast gold equivalent production to grow to 230,000oz in FY14E (10,000oz in FY10).
Fig. 160: Omolon hub
Source: Company data, Nomura estimates
Kubaka plant (FY08)Acquired in FY08 with four mining properties including
Birkachan.In Q410 the group started construction of a new
processing section to enable processing of ores with high silver content from the Sopka deposit. The
upgraded plant is expected to be commissioned in Q411.
Process uses conventional CIP cyanidation technology. The operating capacity of the plant is 850ktpa .Currently the plant processes mostly low grade
Birkachan ore, with a recovery of 92% gold.
Sopka mine (FY09)Property acquired in FY09 and open pit mining started in FY10. The capacity is of 250kt or rock per month from three pits which will merge into one pit later one. Only
high grade ore (Au eq 5g/t) is transported to the Kubaka plant for processing. Current mine plan provides for open pit mining until FY16 with processing continuing
until FY18.
Transportation volumes to limited to 300ktpa owing to the road conditions as the road is only operational 4
months pa. Winter weather may further limit this capacity. recoveries are expected to be 94% for gold
and 88% for silver.
180km Winter road
Birkachan mine (FY08)Property acquired in FY08. Following a bridge
construction in Q211 the site is accessible all year around from Kubaka.
The earlier owner processed only the highest grade material and stored lower grade on site .
Polymetal management plan to send the high grade material to Kubaka and to heap leach low grade material going forward. According to the current mgmt plan, open pit operations are planned to last until FY17 followed by
underground to FY23. Current mining capacity is 900ktp of rock /month.
34 km Full year access
Birkachan Heap leach (FY12e)Polymetal is trialling dump or heap leaching this material
and a heap leaching facility is expected to start operations in FY12e with a full year operations. The leach
will be heated to 14 degrees and distributed by buried drippers in the winter. A separate building is being built
for processing through a CIC circuit.
Sopka Heap leach (FY14e)Low grade ore will be heap leached on-site after two-
stage crushing. Test work indicated recoveries of 6% for gold and 55% for silver are achievable over two-year
leaching period. Processing expected by management to start in FY14e.
Tsokol project (FY12e)Property acquired in FY09 with Kubaka plant. Highly weathered near-surface vein deposit .
No current reserves but resources are 1.3mt of ore grading 8.1g/t gold.
Open pit mining expected to commence in Q312 reaching annual rate of 150ktpa in FY13. Ore
will be processed in the Kubaka plant.
Management expect open pit mining operations until FY17 and underground until
FY19
3 kmFull year access
Oroch project (FY18e) Exploration site located 20 km from the Sopka
mine road and 110km from Kubaka plant. Resources are expected to be published in
Q412. According to latest plans mining is expected to
start in FY18e but Polymetal management thinks this could be earlier.
110km Winter road
Dalniy project (FY15e)Located 18km from the Sopka mine and
accessible using a winter road.There are no resource or reserve estimates, for
the project. Management expect reserve estimates by Q412.
Management expect mining o commence in FY15e.
Management anticipate Dalniy to have a five year mine live . High grade ore is transported to Kubaka and low grade ore heap leached on site
jointly with material from Sopka.
18km Winter road

Nomura | European Gold Sector Initiation January 18, 2012
88
Amursk POX Hub (100%) The Amursk Hub is located in the Khabarovsk territory in Russia and includes two operational mines, the Albazino mine in Khabarovsk territory and the Mayskoye mine located nearly 2,600km away in the Chukotka territory near the Arctic circle.
It is one of the first facilities that will be able to process refractory ore in the region and leads the Petropavlovsk Pokrovskiy Hub by roughly 18 months. Although a significant growth opportunity, the Amursk operations are relatively challenging, both from a technological and logistical perspective. First, the pressure oxidisation process is highly complex and requires specific chemical and operating parameters, which can take time to achieve expected rates of production. Second, the mines that will be producing concentrate for the POX processing are in distant and remote areas (Albazino 755km, Mayskoye 4,200km by ship and road) with only seasonal transport windows. This in our view will mean that the production profile from Amursk is likely to be more volatile and more affected by inherent risks. Full capacity at Amursk is 225ktpa concentrate.
The combined reserves of the two mines are 4.7moz of gold. We forecast Amursk to ramp up production in FY12 and to grow to 270,000oz of gold by 2014. Consequently it is a major component of the group’s near term production growth, although we note that our estimates are below management’s target of 430,000oz in FY13.
Fig. 161: Amursk POX Hub
Source: Company data, Nomura estimates
Voro (100%) The Voro open-pit mine is located in the Sverdlovsk region of Russia, 370km north of Ekaterinburg. Polymetal commenced mining at Voro in 1999 and heap leaching of oxidised ore in 2000. A CIP plant was commissioned in 2005 and later expanded to current capacity of 940ktpa. Reserves at Voro are 1.4moz of contained gold.
The group has a satellite project at Fevralskoye for which a feasibility study is expected to be published in FY12. An earlier satellite open-pit project at Degtyarskoye is closing in FY11.
Central Pressure oxidation (POX) facility at Amursk (FY12e)
Under construction in Q311. designed to accommodate the complementary Mayskoye and ablation concentrates.
Designed capacity of 225ktpa of concentrate but only if sulphide sulphur oxidation is below 22ktpa. If there is more sulphur in the concentrate the
capacity is lower. First gold pour expected for Q1 2.
Average recovery of 92% of gold to dore was demonstrated, (combined recovery of 81%).
Albazino mine (FY09)Albazino has two open pit mines and capacity of
1.5mtpa Transport to Amursk is by barging which is
restricted to 6 months of the year. Updated resource estimate is expected by mgmt
in Q4 12 as well as an update on a possible expansion of the concentrator capacity.
Mgmt have other targets identified on the property including Maslov, Katya-2 and the watershed.
Current mine plan provides for open pit mining until FY20e but mgmt state extensions are likely owing
to pit enlargements.
Albazino concentrator (FY11)The ore is refractory and not amenable to recovery by conventional cyanidation. Grinding capacity of
1,500ktpa achieved in Q311 running on full capacity since Aug 2011. Designed recovery using flotation of 87.5% and mass pull of 8%. Currently
processes oxidized ores which results in a recovery of 65%. concentrate contains 45-55g/t of gold. Mgmt plan processing to continue until FY23e.
Mayskoye mine (FY09)Property acquired from Highland Gold in FY09. Underground mine development had started in FY08. Polymetal decided to link this with the
Amursk POX facility to reduce Capex. Mining at Mayskoye will be done both using open pit and
underground methodsDevelopment is expected to start in Q112e. Underground development of 1,100m pm.
The current life of mine plan expects the mine to operate until FY24e.
Mayskoye concentrator (FY12e)Construction commenced in Q210 commissioning
expected in Q3FY12. The concentrator has a capacity of 850ktpa which is planned to be achieved by Q412. Concentrate is expected to have 70-100g/t gold and RIL recovery
is expected to be around 88%.
Transport will be in 14 tonne bags to the port of Pevek, then by sea to Vanino and from there by rail to Amursk plant. The other legs are year around but sea shipment is restricted to the summer months.
Oxidized ore will be processed by RIL cyanidation.
755km Shipping and barging, summer only
Shipped to a third party off taker before the opening of the Amursk POX facility. According to mgmt 20
tonnes sold in FY11.

Nomura | European Gold Sector Initiation January 18, 2012
89
Owing to the current mining speed and low oxidised ore reserves, the Voro heap leach is likely to operate at below operating capacity from FY12 onwards and to finish in 2017. We model that the CIP process will have enough material until 2024, although this is likely to be extended once the Fevraslkoye reserves are established in FY12. Our forecast for Voro reflects the maturity of the mine and declining reserves. We expect production to decline to 87,000koz of gold equivalent by 2014. (In 2010 the mine produced 186,000oz). We would see any increase in reserves at Fevralskoye or other finds nearby as positive as this could improve the capacity utilisation at Voro, providing expected benefits to cash cost and production volumes.
Varvara (100%) The Varvara mine is located in Northern Kazakhstan and consists of an open-pit mine and a processing plant. We note that management believes that owing to its infrastructure and location, the Varvara mine has the potential to become a production hub for other mines in the region. The group’s current reserves at Varvara amount to 0.8moz of gold and 0.1MT of contained copper. Based on the reserves we expect Varvara production to peak in FY11E at 140,000oz, but to decline from FY12E onwards initially owing to lower grades at the Varvara mine and then owing to lower planned mining volumes from FY14 onwards. Based on current reserves, we expect mining to continue at Varvara until FY16E but note as a potential catalyst the Varvara mine expansion feasibility study, which management aim to publish in FY12.
Khakanja Mine (100%) The Khakanja mine is a combined gold and silver mine located in the Khabarovsk territory in eastern Russia. Mining activities there consist of two open pits and the Yurivskoye satellite project. Management plans to commence underground mining in Khakanja from FY12E onwards until FY18E. The Khakanja mine is a mature asset and we model production to (based on current reserves of 0.3Moz of Au and 18.2Moz of Ag) continue until FY2020. We note that management aims to update resources and the life of mine plan in Q3 2012E.
Fig. 162: Reserves and resources
Source: Company data, Nomura research
Balance sheet With FY11E net debt of USD 836m, Polymetal’s balance sheet is one of the most geared companies in our universe. We think that the relatively high net debt position is attributable to the group’s high capex spending to ramp up its production as well as its active M&A record. Based on our estimates we think the net debt will peak in FY11 and improve to a moderate net cash position of USD 255m by 2013, owing to both a decline in capex and an increase in production.
Total Reserves
TonnesDeposit Name Ownership Country Mt Gold Contained Attributable Silver Contained Attrib. Equiv Attrib Copper Contained Attrib. Equiv Attrib
(g/t) Oz Oz ( g/t) oz moz moz % mt mt moz
Dukat Hub 100% RUS 16.9 1.3 0.7 0.7 508.6 275.8 275.8 4.6 - 0.0 0.0 0.0Amursk POX 100% RUS 25.4 5.8 4.7 4.7 0.0 0.0 0.0 0.0 - 0.0 0.0 0.0Omolon 100% RUS 16.7 2.9 1.6 1.6 41.4 22.3 22.3 0.4 - 0.0 0.0 0.0Voro 100% RUS 15.5 2.8 1.4 1.4 3.9 1.9 1.9 0.0 - 0.0 0.0 0.0Khakanja 100% RUS 2.5 3.5 0.3 0.3 230.7 18.2 18.2 0.3 - 0.0 0.0 0.0Varvara 100% KAZ 28.5 0.9 0.8 0.8 0.0 0.0 0.0 0.0 0.0 0.1 0.1 0.1
Total 105.5 2.8 9.5 9.5 93.8 318.3 318.3 5.3 0.0 0.1 0.1 0.1
Total Resources (Incl. inferred)
TonnesDeposit Name Ownership Country Mt Gold Contained Attributable Silver Contained Attrib. Equiv Attrib Copper Contained Attrib. Equiv Attrib
(g/t) Oz Oz ( g/t) oz moz moz % t t moz
Dukat Hub 100% RUS 28.9 1.0 0.9 0.9 479.0 430.1 430.1 7.2 - 0.0 0.0 0.0Amursk POX 100% RUS 55.5 6.1 10.9 10.9 0.0 0.0 0.0 0.0 - 0.0 0.0 0.0Omolon 100% RUS 24.1 3.2 2.5 2.5 47.6 36.0 36.0 0.6 - 0.0 0.0 0.0Voro 100% RUS 17.1 2.7 1.5 1.5 3.9 2.1 2.1 0.0 - 0.0 0.0 0.0Khakanja 100% RUS 11.2 5.2 1.9 1.9 66.6 29.0 29.0 0.5 - 0.0 0.0 0.0Varvara 100% KAZ 70.3 0.8 1.9 1.9 0.0 0.0 0.0 0.0 0.0 0.3 0.3 0.3
Total 207.0 2.9 19.6 19.6 73.8 497.1 497.1 8.3 0.0 0.3 0.3 0.3
Gold Silver Copper
Gold Silver Copper

Nomura | European Gold Sector Initiation January 18, 2012
90
Fig. 163: POLY EBITDA and capex
Source: Company data, Nomura estimates
Fig. 164: POLY net debt and debt ratio
Source: Company data, Nomura estimates
Fig. 165: POLY EPS and P/E @ USD 1,900/oz
Source: Company data, Nomura estimates
Fig. 166: POLY EPS and P/E @ long term forecast
Source: Company data, Nomura estimates
Fig. 167: POLY share price since listing
Source: Datastream, Nomura research
Fig. 168: Historical 12-month forward P/E (consensus)
Source: Datastream, Nomura research
DS World gold mining index, indexed to RRS at Jan. 2009
Management and significant shareholders
Board/management Chairman – Ilya Yuzhanov
CEO – Vitaly Nesis
CFO – Sergey Cherkasin
Significant shareholders Three main shareholders control about 47% of Polymetal shares, which puts the company above the minimum 50% free float required for FTSE 100 listing. The largest shareholder of the group is Czech Financier Petr Kellner who owns 20%. The group’s CEO Mr Vitaly Nesis’s brother, Alexander Nesis is the second largest holder with a 17% holding. The third largest holder is Alexander Mamut, with an approximate 10% shareholding.
-$1,000
-$500
$0
$500
$1,000
$1,500
$2,000
$2,500
2009 2010 2011 2012 2013 2014 2015 2016
EBITDA ($M) Capex ($M)
-1.0
-0.5
0.0
0.5
1.0
1.5
2.0
-$2,000
$0
$2,000
$4,000
2009 2010 2011e 2012e 2013e 2014e 2015e 2016e
Net Cash (Debt) ($M) Net Debt/EBITDA (x)
0
5
10
15
20
25
0.0
0.5
1.0
1.5
2.0
2.5
3.0
3.5
4.0
2009 2010 2011e 2012e 2013e 2014e 2015eEPS P/E (x)
0
5
10
15
20
25
0.0
0.5
1.0
1.5
2.0
2.5
3.0
3.5
4.0
2009 2010 2011e 2012e 2013e 2014e 2015eEPS P/E (x)
50.0
250.0
450.0
650.0
850.0
1,050.0
1,250.0
Oct-11 Nov -11 Dec-11
Poly metal DS World gold mining index
0
2
4
6
8
10
12
14
16
18
20
20/0
4/20
07
20/0
6/20
07
20/0
8/20
07
20/1
0/20
07
20/1
2/20
07
20/0
2/20
08
20/0
4/20
08
20/0
6/20
08
20/0
8/20
08
20/1
0/20
08
20/1
2/20
08
20/0
2/20
09
20/0
4/20
09
20/0
6/20
09
20/0
8/20
09
20/1
0/20
09
20/1
2/20
09
20/0
2/20
10
20/0
4/20
10
20/0
6/20
10
20/0
8/20
10
20/1
0/20
10
20/1
2/20
10
20/0
2/20
11
20/0
4/20
11
20/0
6/20
11
20/0
8/20
11
20/1
0/20
11
POLYMETAL (~ £ ) POLYMETAL I NTERNATIONAL (~£ )

Nomura | European Gold Sector Initiation January 18, 2012
91
Fig. 169: Forecast summary
Source: Datastream, company data, Nomura estimates
P&L (US$M) FY10 FY11E FY12E FY13ERevenues 925 1,362 1,993 2,980
Rating R educe Operating Costs -527 -729 -786 -919Target Price (GBp) 1350 Other 0 0 0 0
EBITDA 399 633 1,208 2,061Price (GBp) 1,100 D&A -70 -78 -106 -157
EBIT 328 553 1,098 1,900Shares (M) 383 Price (US$) 16.99 Share of Equity Profit 328 553 1,098 1,900
Net Interest -26 -22 -87 -53Mcap (US$M) 6,434 Net debt (US$M) 836 Taxes -67 -151 -283 -517EV (US$M) 7,270 Net Profit 242 389 728 1,330
Year End December EPS (¢) 67.00 107.20 199.44 364.44DPS (¢) 0.0 20.0 39.9 72.9
Assumptions FY10 FY11 FY12E FY13ECash Flows (US$M) FY10 FY11E FY12E FY13E
Gold (US$/oz) 1,225 1,587 1,788 2,063Silver (US$/oz) 20.17 34.55 36.88 48.25 PBT 306 536 1,011 1,847Copper (USc/lb) 3.42 4.06 4.00 3.60 Working Capital -120 -123 -309 -463
Net Interest -17 -62 -87 -53GBP/USD 1.55 1.61 1.61 1.65 Taxes -80 -136 -283 -517
Other 126 122 193 210Operating Cash Flows 215 337 524 1,024
Key Ratios FY10 FY11E FY12E FY13ECapex -404 -380 -153 -87
PE (x) 21.5 16.6 8.8 4.8 Disposals 0 0 0 0EV/EBITDA (x) 18.2 11.5 6.0 3.5 Exploration 0 0 0 0EPS Growth (%) 139% 60% 86% 83% Other -6 -3 0 0ROE (%) 18% 20% 28% 35% Investing Cash Flows -410 -382 -153 -87Net Debt to Equity (%) 0.5 0.4 0.2 -0.1Net Debt to EBITDA (x) 1.7 1.3 0.4 -0.1 Change in Borrowings 182 72 -299 -571Dividend Yield (%) 0% 1% 2% 4% Dividends 0 0 -73 -146FCF Yield (%) -4% -1% 6% 15% Equity Issues 0 0 0 0
Other -4 -5 0 0Financing Cash Flows 178 67 -372 -716
Production koz (Au Eq) FY10 FY11E FY12E FY13E
Dukat 278 321 377 446 Balance Sheet (US$M) FY10 FY11E FY12E FY13EVoro 186 157 120 126 Khakanja 170 114 139 109 Cash 11 33 33 255Varvara 100 140 109 124 Recievables 167 259 379 566Omolon 10 59 195 197 Inventories 369 545 758 1,073Amursk - - 67 256 Other 4 4 4 4Total 743 790 1,006 1,258 Current Assets 551 841 1,174 1,898
Cash costs (US$M) FY10 FY11E FY12E FY13E Exploration 0 0 0 0Property, Plant and Equipmen 1,643 2,110 2,157 2,087
Dukat 612 876 752 707 Intangibles 115 125 125 125Voro 458 605 565 541 Other 111 146 146 146Khakanja 462 678 522 590 Non Current Assets 1,869 2,381 2,427 2,357Varvara 629 741 1,027 893Omolon 981 1,484 511 688 Total Assets 2,420 3,222 3,601 4,255Amursk 0 0 1,815 772Total 546 815 752 709 Borrowings 91 217 217 0
Payables 90 169 192 232Provisions 0 0 0 0
EBIT (US$M) FY10 FY11E FY12E FY13E Other 22 42 42 42Current Liabilities 203 427 450 273
Dukat 131 294 497 895Voro 108 139 134 176 Borrowings 595 652 354 0Khakanja 105 83 174 178 Provisions 69 58 58 58Varvara 31 94 73 122 Other 191 124 124 124Omolon -10 1 247 271 Non Current Liabilities 856 835 536 183Amursk -15 -19 -14 270
Total Liabilities 1,059 1,262 987 456
Total Equity 1,361 1,960 2,615 3,799
Primary Analyst: Tyler Broda
Nomura Polymetal model

Nomura | European Gold Sector Initiation January 18, 2012
92
SA US – Seabridge Gold (Buy, USD 31.80 TP) We are assuming coverage of Seabridge Gold with a Buy rating and a USD 31.80 target price. In our analysis, Seabridge Gold fits well into our top-down framework. This development and exploration company with large, longer-term assets should benefit directly from a structurally higher gold price.
A focused way to invest in a new era for gold equities
We believe Seabridge Gold provides a unique investment opportunity in our coverage universe. With no operating mines, the current asset portfolio has a long-term production profile that still faces significant hurdles including financing, construction and permitting. The company has stated that its preferred route for realising the value from KSM and Courageous Lake is through a partnership with a large gold producer. Therefore, the destiny of catalysing value from moving through development to construction relies on external factors.
However, in our view, the shares form what amounts to an indirect call option on a potential new era for gold equities. The super-sized KSM project in Northern British Columbia Canada, its c. 750,000oz of gold equivalent production potential and its USD 4.7bn capital cost is likely to consume a vast amount of resources (financial and otherwise) from an eventual partner. The sheer scale of the project limits the universe of potential partners. As described in sections above, our analysis indicates that significant levels of cash is likely to build on the global gold equity balance sheet. In our view, this will increase the propensity of the company being able to negotiate a partnership that is long-term value enhancing for Seabridge’s shareholders.
In terms of valuation, we see significant potential upside for risk-tolerant longer-term investors. Unrisked, and importantly unfinanced (and using the same 5% discount rate for our other coverage universe and a flat gold price at USD 1,900/oz), our calculations provide a value of USD 225.68/share. We note that achieving this valuation in the near-term is unrealistic: a) a partnership is likely to see much of this upside given up; b) there is no discount for financing; and c) our long-term gold price forecast likely provides a more reasonable expectation (USD 90.76/share). However, should a large gold producer look to add material production from a desirable country (such as Canada) from a risk perspective, we believe that the KSM project would perhaps look more achievable in the coming years.
A JV partnership for KSM or Courageous Lake with a major gold producer would be a significant catalyst for the shares, and would allow for a de-risking of the valuation. We note that Seabridge expects to announce an updated feasibility study for KSM in April 2012.
Fig. 170: Seabridge vs. volatility vs. gold vs. gold equities Seabridge shares have generally outperformed the gold equity universe in a risk on environment
Source: Bloomberg

Nomura | European Gold Sector Initiation January 18, 2012
93
Valuation We have taken a factor approach to valuing Seabridge Gold based on the multiple risk factors including financing risk, permitting risk, construction risk and gold price risk. Owing to the longer-term nature of the developments and lack of near-term production potential we are using our base-case, long-term prices for valuation (rather than a flat gold price of USD 1,900/oz).
Fig. 171: Valuation for Seabridge Gold
Source: Nomura estimates
Based on Nomura’s one-year forward sum-of-the-parts NAV estimate (using our long-term gold price of USD 1200/oz and long-term estimates for copper, silver and molybdenum), we estimate a value of USD 90.76/share. Through a multifactor discount process to account for the risks above, we use a target 12-month P/NAV multiple of 0.4x, generating a value of USD 31.80/share. We highlight that Seabridge Gold, with no cash flows and no expectation of positive cash flows in the medium term, has much higher risks as an investment and there remain many operational and structural factors that could see variations in NAV estimates.
Valuation (NPV @ 10%) $M Current Per Share +1 Yr +2 Yr +3 Yr
KSM 3131.2 $71.65 $77.22 $81.36 $85.71
Courageous Lake 496.1 $11.35 $12.57 $13.20 $14.05
Other Resources 65.4 $1.50 $1.50 $1.50 $1.50Corporate -35.2 -$0.81 -$0.77 -$0.72 -$0.68Exploration 0.0 $0.00 $0.00 $0.00 $0.00Hedging 0.0 $0.00 $0.00 $0.00 $0.00Investments 0.0 $0.00 $0.00 $0.00 $0.00Net Cash (Debt) 34.5 $0.79 $0.24 -$0.31 -$0.86Total USD 3692.0 $84.49 $90.76 $95.03 $99.72
CAD $86.73 $93.17 $97.55 $102.37
USD/CAD 1.02655Total USD 3790 $90.76
Current share price (p) $17.03 09/01/2012P/NAV 0.2x
Target multiple 0.4xTarget price $31.77
Upside 87%

Nomura | European Gold Sector Initiation January 18, 2012
94
Fig. 172: Seabridge Gold valuation chart
Source: Nomura research
Fig. 173: Seabridge Gold valuation trend
Source: Nomura research
Fig. 174: Map of operations for Seabridge Gold
Source: Company data, Nomura research
Asset summary
KSM (100%) The Kerr-Sulphurets-Mitchell (KSM) project is located in northern British Columbia, Canada and is the larger of the group’s two main assets. The site consists of four separate deposits and has total reserves of 38.5moz of gold (average grade 0.55g/t); 214.5moz of Silver (average grade 3g/t); 4.6mt of Copper (0.21%) and 257mp of Molybdenum (53.2ppm).The asset is 100% owned by Seabridge Gold and based on our analysis ranks as one of the largest current gold mine development projects in the world.
Management have published an updated preliminary feasibility study for KSM in June 2011, which increased the life of mine plan to 52 years with an average processing throughput of 120kt per day. Ore is planned to be mined using open-pit methods and processed in a flotation circuit to a combined copper/gold/silver concentrate, which is planned to be transferred to an offsite smelter. Additionally, separate on-site processes are also planned to produce Molybdenum concentrate and gold-silver doré.
0102030405060708090
100
KSM Courageous Lake
Other Resources
Net Cash (Debt)
Corporate Total USD
$84.49
$90.76
$95.03
$99.72
75
80
85
90
95
100
105
Current Per Share +1 Yr +2 Yr +3 Yr
NPV Curve
NPV Curve
Canada
Courageous LakeKSM

Nomura | European Gold Sector Initiation January 18, 2012
95
According to the feasibility study, the start-up capital costs for the project are estimated at USD 4.7bn, which we think is beyond the group’s financial means. We think that mainly owing to the extensive financial resource requirements, management are openly looking to partner the development of the mine. Consequently we think that progression of the plan is highly dependent on finding a partner with sufficient financial resources and risk appetite. In our model we estimate a development phase of 6 years and production starting in FY19.
Courageous Lake (100%) The Courageous Lake deposit is located in an isolated location in the North West territories in Canada and consists of a 50km long greenstone belt FAT deposit. Total resources amount to 11.3moz of gold at an average grade of 2.3g/t, reserves have not been established to date.
Based on the preliminary economic assessment, which management released in June 2011 mining at Courageous Lake is planned to be done using open-pit mining methods with operating life at 17,500 tonnes per day, 365 operating days per year and a 92% plant availability. Annual throughput for the mill is estimated at 6.4m tonnes. With 101.1m tonnes of in-pit mineralised material above cut-off, Courageous Lake's mine life is estimated at approximately 16 years. Overall gold recovery is estimated at 89.9% resulting in 6.05m ounces of gold production over the project's life averaging 383,000 ounces per year.
The project site is accessible only using a winter road and by air, and hence stand-alone power supply and large warehousing storage facilities are required. Overall the start-up capital costs for the project are estimated at USD 1.3bn. According to management’s latest estimates we understand that development of the project is likely to take 6 years, and we forecast production to start in FY18. We note that owing to the high capital expenditure, we believe that Seabridge gold requires external financing (or a partner) to develop this project.
Other resources (100%) The group also has a number of smaller gold assets in earlier stages of development. These include the Grassy Mountain deposit which has resources of 1moz of gold (grade: 1.5g/t); Quartz Mountain 4.6moz of gold (grade 1.4g/t); Red Mountain 0.6moz (grade: 5.5g/t) and the Castle/Black Rock deposit, which has 0.3moz of gold at an average grade of 0.5g/t.
Fig. 175: Seabridge reserves and resources
Source: Company data, Nomura research
Total Reserves
TonnesDeposit Name Ownersh Country Mt Gold Contained Attributable Silver Contained Attrib. Equiv Attrib Copper Contained Attrib. Equiv Attrib Moly Contained Attrib. Equiv Attrib
(g/t) moz moz (g/t) moz moz moz % mt mt moz ppm mp mp moz
KSM 100% CAN 2194.4 0.6 38.5 38.5 3.0 214.5 214.5 3.6 0.21% 4.6 4.6 23.3 53.2 257.3 257.3 0.0 65.4
Total 2194.4 0.6 38.5 38.5 3.0 214.5 214.5 3.6 0.21% 4.6 4.6 23.3 53.2 257.3 257.3 0.0 65.4
Total Resources (Incl. inferred), excluding reserves
TonnesDeposit Name Ownersh Country Mt Gold Contained Attributable Silver Contained Attrib. Equiv Attrib Copper Contained Attrib. Equiv Attrib Moly Contained Attrib. Equiv Attrib
(g/t) Oz Oz ( g/t) oz moz moz % t t moz ppm mp mp moz
KSM 100% CAN 0.5 1455.2 0.4 20.8 20.8 3.0 138.9 138.9 2.3 0.18% 2.6 2.6 13.2 56.8 170.6 170.6 0.0 36.4Courageous Lake 100% CAN 0.83 153.2 2.3 11.3 11.3 0.0 0.0 0.0 0.0 0.00% 0.0 0.0 0.0 0 0 0 0.0 11.3Grassy mountain 100% CAN 0.55 20.4 1.5 1.0 1.0 0.0 0.0 0.0 0.0 0.00% 0.0 0.0 0.0 0 0 0 0.0 1.0Quartz Mountain 100% CAN 0.34 102.6 1.4 4.6 4.6 0.0 0.0 0.0 0.0 0.00% 0.0 0.0 0.0 0 0 0 0.0 4.6Red Mountain 100% CAN 1.00 3.7 5.5 0.6 0.6 0.0 0.0 0.0 0.0 0.00% 0.0 0.0 0.0 0 0 0 0.0 0.6Castle/ Black Rock 100% CAN 0.25 20.3 0.5 0.3 0.3 0.0 0.0 0.0 0.0 0.00% 0.0 0.0 0.0 0 0 0 0.0 0.3
Total 1755.4 0.7 38.4 38.4 2.5 138.9 138.9 2.3 0.15% 2.6 2.6 13.2 47.1 170.6 170.6 0.0 54.0
Gold Silver Copper
Total Au Eq
Cut off grade
Total Au Eq
Gold Silver Copper
Molybdenum
Molybdenum
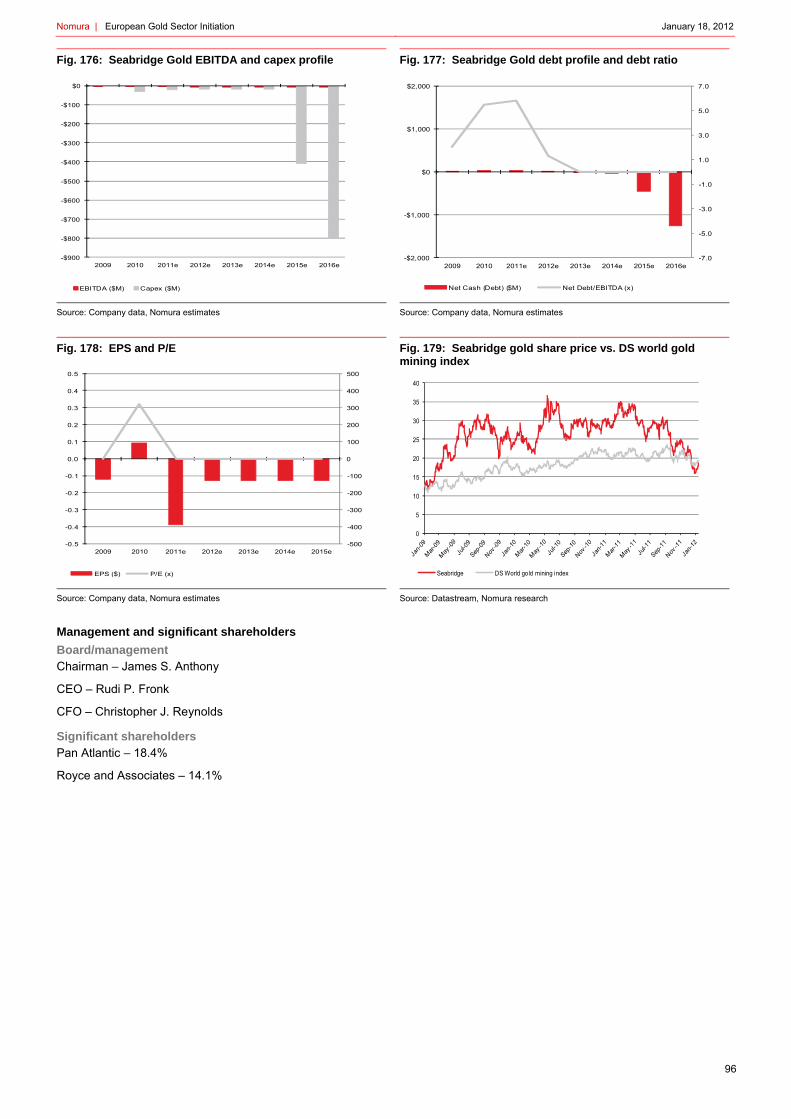
Nomura | European Gold Sector Initiation January 18, 2012
96
Fig. 176: Seabridge Gold EBITDA and capex profile
Source: Company data, Nomura estimates
Fig. 177: Seabridge Gold debt profile and debt ratio
Source: Company data, Nomura estimates
Fig. 178: EPS and P/E
Source: Company data, Nomura estimates
Fig. 179: Seabridge gold share price vs. DS world gold mining index
Source: Datastream, Nomura research
Management and significant shareholders
Board/management Chairman – James S. Anthony
CEO – Rudi P. Fronk
CFO – Christopher J. Reynolds
Significant shareholders Pan Atlantic – 18.4%
Royce and Associates – 14.1%
-$900
-$800
-$700
-$600
-$500
-$400
-$300
-$200
-$100
$0
2009 2010 2011e 2012e 2013e 2014e 2015e 2016e
EBITDA ($M) Capex ($M)
-7.0
-5.0
-3.0
-1.0
1.0
3.0
5.0
7.0
-$2,000
-$1,000
$0
$1,000
$2,000
2009 2010 2011e 2012e 2013e 2014e 2015e 2016e
Net Cash (Debt) ($M) Net Debt/EBITDA (x)
-500
-400
-300
-200
-100
0
100
200
300
400
500
-0.5
-0.4
-0.3
-0.2
-0.1
0.0
0.1
0.2
0.3
0.4
0.5
2009 2010 2011e 2012e 2013e 2014e 2015e
EPS ($) P/E (x)
0
5
10
15
20
25
30
35
40
Seabridge DS World gold mining index

Nomura | European Gold Sector Initiation January 18, 2012
97
Fig. 180: Forecast summary
Source: Datastream, company data, Nomura estimates
P&L (US$M) FY10 FY11E FY12E FY13ERevenues 0 0 0 0
Rating B uy Operating Costs -6 -17 -8 -8Target Price USD 31.80 Other 10 0 0 0
EBITDA 4 -17 -8 -8Price (US$) 19.23 D&A 0 0 0 0NPV (US$) 90.76 EBIT 4 -17 -8 -8
Financial items 2 -1 0 0Shares (M) 44 Price (CAD) 19.74 Net Interest 0 1 0 0
NPV(CAD) 93.17 Taxes - 3 1 3 3Adjustments 0 0 0 0
Mcap (US$M) 815 Net debt (US$M) -34 Net Profit 4 -16 -5 -5EV (US$M) 780
EPS (¢) 9.00 -38.99 -12.94 -12.94Year End December DPS (¢) 0.00 0.00 0.00 0.00
Assumptions FY10 FY11 FY12E FY13E Cash Flows (US$M) FY10 FY11E FY12E FY13E
Gold (US$/oz) 1,369 1,571 1,788 2,063 Net income 4 -16 -5 -5Silver (US$/oz) 26 35 37 48 Working capital -2 0 0 0Copper (USc/lb) 4 4 4 4 Depreciation 0 0 0 0Moly (USc/lb) 16 16 22 20 Taxes 0 -1 -3 -3
Other -10 13 4 4CAD/USD 0.98 0.99 0.96 0.96 Operating Cash Flows -9 -4 -4 -4
Capex -38 -39 -20 -20Disposals 10 0 0 0
Key Ratios FY10 FY11E FY12E FY13E Exploration - 32 1 42 0Other 0 0 0 0
PE (x) 318.8 NA NA NA Investing Cash Flows -59 -38 22 -20EV/EBITDA (x) 185.6 -45.1 -97.6 -97.6EPS Growth (%) NM NM NM 0% Change in Borrowings 0 0 0 0ROE (%) 0.0 -0.1 0.0 0.0 Dividends 0 0 0 0Net Debt to Equity (%) -0.2 -0.2 -0.1 0.1 Equity Issues 69 33 0 0Net Debt to EBITDA (x) -7.8 2.0 1.3 -1.7 Other 0 0 0 0Dividend Yield (%) 0.0 0.0 0.0 0.0 Financing Cash Flows 69 33 0 0FCF Yield (%) 0.0 0.0 0.0 0.0
NPV (USD$M) Per Share Balance Sheet (US$M) FY10 FY11E FY12E FY13E
KSM 3,131 $71.65 Cash 1 -8 10 -14Courageous Lake 496 $11.35 Recievables 3 2 2 2Other Resource 65 $1.50 Inventories 0 0 0 0Corporate -35 -$0.81 Other 32 42 0 0Other 0 $0.00 Current Assets 36 37 13 -11Net Cash 34 $0.79
Total 3,692 84.49 Exploration 132 162 162 162Property, Plant and Equipm 0 4 24 44Intangibles 0 0 0 0Other 12 1 4 6Non Current Assets 144 168 190 213
Total Assets 180 205 203 202
Borrowings 0 0 0 0Payables 4 3 3 3Provisions 0 0 0 0Other 0 0 0 0Current Liabilities 4 3 3 3
Borrowings 0 0 0 0Provisions 2 2 2 2Other 1 0 0 0Non Current Liabilities 3 2 2 2
Total Liabilities 6 5 5 5
Total Equity 174 199 198 196
Primary Analyst: Tyler Broda
Seabridge Gold

Nomura | European Gold Sector Initiation January 18, 2012
98
Nomura | European Gold Sector Initiation January 18, 2012
99

Nomura | European Gold Sector Initiation January 18, 2012
100

Nomura | European Gold Sector Initiation January 18, 2012
101
Appendix A-1
Analyst Certification
I, Tyler Broda, hereby certify (1) that the views expressed in this Research report accurately reflect my personal views about any or all of the subject securities or issuers referred to in this Research report, (2) no part of my compensation was, is or will be directly or indirectly related to the specific recommendations or views expressed in this Research report and (3) no part of my compensation is tied to any specific investment banking transactions performed by Nomura Securities International, Inc., Nomura International plc or any other Nomura Group company.
Issuer Specific Regulatory Disclosures Mentioned companies Issuer name Ticker Price Price date Stock rating Sector rating Disclosures African Barrick Gold ABG LN 459p 16-Jan-2012 Buy Bullish Avocet Mining AVM LN 214p 16-Jan-2012 Buy Bullish Centamin Egypt CEY LN 91p 16-Jan-2012 Neutral Bullish Petropavlovsk POG LN 681p 16-Jan-2012 Reduce Bullish Polymetal International POLY LN 1091p 16-Jan-2012 Reduce Bullish Randgold Resources RRS LN 7215p 16-Jan-2012 Buy Bullish 123 Seabridge Gold SA US USD 18.76 13-Jan-2012 Buy Bullish 123
Disclosures required in the U.S.
123 Market Maker - NSI Nomura Securities International Inc. makes a market in securities of the company.
Previous Rating Issuer name Previous Rating Date of change African Barrick Gold Not rated 18-Jan-2012 Avocet Mining Not rated 18-Jan-2012 Centamin Egypt Not rated 18-Jan-2012 Petropavlovsk Not rated 18-Jan-2012 Polymetal International Not rated 18-Jan-2012 Randgold Resources Not rated 18-Jan-2012 Seabridge Gold Not Rated 10-May-2010
Rating and target price changes
Ticker Old stock rating New stock rating Old target price New target price
African Barrick Gold ABG LN Not rated Buy N/A 750p Avocet Mining AVM LN Not rated Buy N/A 310p Centamin Egypt CEY LN Not rated Neutral N/A 120p Petropavlovsk POG LN Not rated Reduce N/A 860p Polymetal International POLY LN Not rated Reduce N/A 1400p Randgold Resources RRS LN Not rated Buy N/A 9850p Seabridge Gold SA US Buy Buy USD 51.00 USD 31.80
Nomura | European Gold Sector Initiation January 18, 2012
102
Important Disclosures Conflict-of-interest disclosures Important disclosures may be accessed through the following website: http://go.nomuranow.com/research/globalresearchportal/pages/disclosures/disclosures.aspx . If you have difficulty with this site or you do not have a password, please contact your Nomura Securities International, Inc. salesperson (1-877-865-5752) or email [email protected] for assistance. Online availability of research and conflict-of-interest disclosures Nomura research is available on www.nomuranow.com, Bloomberg, Capital IQ, Factset, MarkitHub, Reuters and ThomsonOne. Important disclosures may be read at http://go.nomuranow.com/research/globalresearchportal/pages/disclosures/disclosures.aspx/ or requested from Nomura Securities International, Inc., on 1-877-865-5752. If you have any difficulties with the website, please email [email protected] for help. The analysts responsible for preparing this report have received compensation based upon various factors including the firm's total revenues, a portion of which is generated by Investment Banking activities. Unless otherwise noted, the non-US analysts listed at the front of this report are not registered/qualified as research analysts under FINRA/NYSE rules, may not be associated persons of NSI, and may not be subject to FINRA Rule 2711 and NYSE Rule 472 restrictions on communications with covered companies, public appearances, and trading securities held by a research analyst account. Industry Specialists identified in some Nomura International plc research reports are employees within the Firm who are responsible for the sales and trading effort in the sector for which they have coverage. Industry Specialists do not contribute in any manner to the content of research reports in which their names appear. Marketing Analysts identified in some Nomura research reports are research analysts employed by Nomura International plc who are primarily responsible for marketing Nomura’s Equity Research product in the sector for which they have coverage. Marketing Analysts may also contribute to research reports in which their names appear and publish research on their sector. Distribution of ratings (US) The distribution of all ratings published by Nomura US Equity Research is as follows: 35% have been assigned a Buy rating which, for purposes of mandatory disclosures, are classified as a Buy rating; 11% of companies with this rating are investment banking clients of the Nomura Group*. 59% have been assigned a Neutral rating which, for purposes of mandatory disclosures, is classified as a Hold rating; 2% of companies with this rating are investment banking clients of the Nomura Group*. 6% have been assigned a Reduce rating which, for purposes of mandatory disclosures, are classified as a Sell rating; 0% of companies with this rating are investment banking clients of the Nomura Group*. As at 31 December 2011. *The Nomura Group as defined in the Disclaimer section at the end of this report. Distribution of ratings (Global) The distribution of all ratings published by Nomura Global Equity Research is as follows: 47% have been assigned a Buy rating which, for purposes of mandatory disclosures, are classified as a Buy rating; 40% of companies with this rating are investment banking clients of the Nomura Group*. 43% have been assigned a Neutral rating which, for purposes of mandatory disclosures, is classified as a Hold rating; 45% of companies with this rating are investment banking clients of the Nomura Group*. 10% have been assigned a Reduce rating which, for purposes of mandatory disclosures, are classified as a Sell rating; 21% of companies with this rating are investment banking clients of the Nomura Group*. As at 31 December 2011. *The Nomura Group as defined in the Disclaimer section at the end of this report. Explanation of Nomura's equity research rating system in Europe, Middle East and Africa, US and Latin America The rating system is a relative system indicating expected performance against a specific benchmark identified for each individual stock. Analysts may also indicate absolute upside to target price defined as (fair value - current price)/current price, subject to limited management discretion. In most cases, the fair value will equal the analyst's assessment of the current intrinsic fair value of the stock using an appropriate valuation methodology such as discounted cash flow or multiple analysis, etc. STOCKS A rating of 'Buy', indicates that the analyst expects the stock to outperform the Benchmark over the next 12 months. A rating of 'Neutral', indicates that the analyst expects the stock to perform in line with the Benchmark over the next 12 months. A rating of 'Reduce', indicates that the analyst expects the stock to underperform the Benchmark over the next 12 months. A rating of 'Suspended', indicates that the rating, target price and estimates have been suspended temporarily to comply with applicable regulations and/or firm policies in certain circumstances including, but not limited to, when Nomura is acting in an advisory capacity in a merger or strategic transaction involving the company. Benchmarks are as follows: United States/Europe: Please see valuation methodologies for explanations of relevant benchmarks for stocks (accessible through the left hand side of the Nomura Disclosure web page: http://go.nomuranow.com/research/globalresearchportal);Global Emerging Markets (ex-Asia): MSCI Emerging Markets ex-Asia, unless otherwise stated in the valuation methodology. SECTORS A 'Bullish' stance, indicates that the analyst expects the sector to outperform the Benchmark during the next 12 months. A 'Neutral' stance, indicates that the analyst expects the sector to perform in line with the Benchmark during the next 12 months. A 'Bearish' stance, indicates that the analyst expects the sector to underperform the Benchmark during the next 12 months. Benchmarks are as follows: United States: S&P 500; Europe: Dow Jones STOXX 600; Global Emerging Markets (ex-Asia): MSCI Emerging Markets ex-Asia. Explanation of Nomura's equity research rating system in Japan and Asia ex-Japan STOCKS

Nomura | European Gold Sector Initiation January 18, 2012
103
Stock recommendations are based on absolute valuation upside (downside), which is defined as (Target Price - Current Price) / Current Price, subject to limited management discretion. In most cases, the Target Price will equal the analyst's 12-month intrinsic valuation of the stock, based on an appropriate valuation methodology such as discounted cash flow, multiple analysis, etc. A 'Buy' recommendation indicates that potential upside is 15% or more. A 'Neutral' recommendation indicates that potential upside is less than 15% or downside is less than 5%. A 'Reduce' recommendation indicates that potential downside is 5% or more. A rating of 'Suspended' indicates that the rating and target price have been suspended temporarily to comply with applicable regulations and/or firm policies in certain circumstances including when Nomura is acting in an advisory capacity in a merger or strategic transaction involving the subject company. Securities and/or companies that are labelled as 'Not rated' or shown as 'No rating' are not in regular research coverage of the Nomura entity identified in the top banner. Investors should not expect continuing or additional information from Nomura relating to such securities and/or companies. SECTORS A 'Bullish' rating means most stocks in the sector have (or the weighted average recommendation of the stocks under coverage is) a positive absolute recommendation. A 'Neutral' rating means most stocks in the sector have (or the weighted average recommendation of the stocks under coverage is) a neutral absolute recommendation. A 'Bearish' rating means most stocks in the sector have (or the weighted average recommendation of the stocks under coverage is) a negative absolute recommendation. . Target Price A Target Price, if discussed, reflect in part the analyst's estimates for the company's earnings. The achievement of any target price may be impeded by general market and macroeconomic trends, and by other risks related to the company or the market, and may not occur if the company's earnings differ from estimates.
Nomura | European Gold Sector Initiation January 18, 2012
104
Disclaimers This document contains material that has been prepared by the Nomura entity identified at the top or bottom of page 1 herein, if any, and/or, with the sole or joint contributions of one or more Nomura entities whose employees and their respective affiliations are specified on page 1 herein or identified elsewhere in the document. Affiliates and subsidiaries of Nomura Holdings, Inc. (collectively, the 'Nomura Group'), include: Nomura Securities Co., Ltd. ('NSC') Tokyo, Japan; Nomura International plc ('NIplc'), UK; Nomura Securities International, Inc. ('NSI'), New York, US; Nomura International (Hong Kong) Ltd. (‘NIHK’), Hong Kong; Nomura Financial Investment (Korea) Co., Ltd. (‘NFIK’), Korea (Information on Nomura analysts registered with the Korea Financial Investment Association ('KOFIA') can be found on the KOFIA Intranet at http://dis.kofia.or.kr ); Nomura Singapore Ltd. (‘NSL’), Singapore (Registration number 197201440E, regulated by the Monetary Authority of Singapore); Capital Nomura Securities Public Company Limited (‘CNS’), Thailand; Nomura Australia Ltd. (‘NAL’), Australia (ABN 48 003 032 513), regulated by the Australian Securities and Investment Commission ('ASIC') and holder of an Australian financial services licence number 246412; P.T. Nomura Indonesia (‘PTNI’), Indonesia; Nomura Securities Malaysia Sdn. Bhd. (‘NSM’), Malaysia; Nomura International (Hong Kong) Ltd., Taipei Branch (‘NITB’), Taiwan; Nomura Financial Advisory and Securities (India) Private Limited (‘NFASL’), Mumbai, India (Registered Address: Ceejay House, Level 11, Plot F, Shivsagar Estate, Dr. Annie Besant Road, Worli, Mumbai- 400 018, India; Tel: +91 22 4037 4037, Fax: +91 22 4037 4111; SEBI Registration No: BSE INB011299030, NSE INB231299034, INF231299034, INE 231299034, MCX: INE261299034); Banque Nomura France (‘BNF’), regulated by the Autorité des marches financiers and the Autorité de Contrôle Prudentiel; NIplc, Dubai Branch (‘NIplc, Dubai’); NIplc, Madrid Branch (‘NIplc, Madrid’) and NIplc, Italian Branch (‘NIplc, Italy’). This material is: (i) for your private information, and we are not soliciting any action based upon it; (ii) not to be construed as an offer to sell or a solicitation of an offer to buy any security in any jurisdiction where such offer or solicitation would be illegal; and (iii) based upon information from sources that we consider reliable, but has not been independently verified by Nomura Group. Nomura Group does not warrant or represent that the document is accurate, complete, reliable, fit for any particular purpose or merchantable and does not accept liability for any act (or decision not to act) resulting from use of this document and related data. To the maximum extent permissible all warranties and other assurances by Nomura group are hereby excluded and Nomura Group shall have no liability for the use, misuse, or distribution of this information. Opinions or estimates expressed are current opinions as of the original publication date appearing on this material and the information, including the opinions and estimates contained herein, are subject to change without notice. Nomura Group is under no duty to update this document. Any comments or statements made herein are those of the author(s) and may differ from views held by other parties within Nomura Group. Clients should consider whether any advice or recommendation in this report is suitable for their particular circumstances and, if appropriate, seek professional advice, including tax advice. Nomura Group does not provide tax advice. Nomura Group, and/or its officers, directors and employees, may, to the extent permitted by applicable law and/or regulation, deal as principal, agent, or otherwise, or have long or short positions in, or buy or sell, the securities, commodities or instruments, or options or other derivative instruments based thereon, of issuers or securities mentioned herein. Nomura Group companies may also act as market maker or liquidity provider (as defined within Financial Services Authority (‘FSA’) rules in the UK) in the financial instruments of the issuer. Where the activity of market maker is carried out in accordance with the definition given to it by specific laws and regulations of the US or other jurisdictions, this will be separately disclosed within the specific issuer disclosures. This document may contain information obtained from third parties, including ratings from credit ratings agencies such as Standard & Poor’s. Reproduction and distribution of third party content in any form is prohibited except with the prior written permission of the related third party. Third party content providers do not guarantee the accuracy, completeness, timeliness or availability of any information, including ratings, and are not responsible for any errors or omissions (negligent or otherwise), regardless of the cause, or for the results obtained from the use of such content. Third party content providers give no express or implied warranties, including, but not limited to, any warranties of merchantability or fitness for a particular purpose or use. Third party content providers shall not be liable for any direct, indirect, incidental, exemplary, compensatory, punitive, special or consequential damages, costs, expenses, legal fees, or losses (including lost income or profits and opportunity costs) in connection with any use of their content, including ratings. Credit ratings are statements of opinions and are not statements of fact or recommendations to purchase hold or sell securities. They do not address the suitability of securities or the suitability of securities for investment purposes, and should not be relied on as investment advice. Any MSCI sourced information in this document is the exclusive property of MSCI Inc. (‘MSCI’). Without prior written permission of MSCI, this information and any other MSCI intellectual property may not be reproduced, re-disseminated or used to create any financial products, including any indices. This information is provided on an "as is" basis. The user assumes the entire risk of any use made of this information. MSCI, its affiliates and any third party involved in, or related to, computing or compiling the information hereby expressly disclaim all warranties of originality, accuracy, completeness, merchantability or fitness for a particular purpose with respect to any of this information. Without limiting any of the foregoing, in no event shall MSCI, any of its affiliates or any third party involved in, or related to, computing or compiling the information have any liability for any damages of any kind. MSCI and the MSCI indexes are services marks of MSCI and its affiliates. Investors should consider this document as only a single factor in making their investment decision and, as such, the report should not be viewed as identifying or suggesting all risks, direct or indirect, that may be associated with any investment decision. Nomura Group produces a number of different types of research product including, among others, fundamental analysis, quantitative analysis and short term trading ideas; recommendations contained in one type of research product may differ from recommendations contained in other types of research product, whether as a result of differing time horizons, methodologies or otherwise. Nomura Group publishes research product in a number of different ways including the posting of product on Nomura Group portals and/or distribution directly to clients. Different groups of clients may receive different products and services from the research department depending on their individual requirements. Figures presented herein may refer to past performance or simulations based on past performance which are not reliable indicators of future performance. Where the information contains an indication of future performance, such forecasts may not be a reliable indicator of future performance. Moreover, simulations are based on models and simplifying assumptions which may oversimplify and not reflect the future distribution of returns. Certain securities are subject to fluctuations in exchange rates that could have an adverse effect on the value or price of, or income derived from, the investment. The securities described herein may not have been registered under the US Securities Act of 1933 (the ‘1933 Act’), and, in such case, may not be offered or sold in the US or to US persons unless they have been registered under the 1933 Act, or except in compliance with an exemption from the registration requirements of the 1933 Act. Unless governing law permits otherwise, any transaction should be executed via a Nomura entity in your home jurisdiction. This document has been approved for distribution in the UK and European Economic Area as investment research by NIplc, which is authorized and regulated by the FSA and is a member of the London Stock Exchange. It does not constitute a personal recommendation, as defined by the FSA, or take into account the particular investment objectives, financial situations, or needs of individual investors. It is intended only for investors who are 'eligible counterparties' or 'professional clients' as defined by the FSA, and may not, therefore, be redistributed to retail clients as defined by the FSA. This document has been approved by NIHK, which is regulated by the Hong Kong Securities and Futures Commission, for distribution in Hong Kong by NIHK. This document has been approved for distribution in Australia by NAL, which is authorized and regulated in Australia by the ASIC. This document has also been approved for distribution in Malaysia by NSM. In Singapore, this document has been distributed by NSL. NSL accepts legal responsibility for the content of this document, where it concerns securities, futures and foreign exchange, issued by their foreign affiliates in respect of recipients who are not accredited, expert or institutional investors as defined by the Securities and Futures Act (Chapter 289). Recipients of this document in Singapore should contact NSL in respect of matters arising from, or in connection with, this document. Unless prohibited by the provisions of Regulation S of the 1933 Act, this material is distributed in the US, by NSI, a US-registered broker-dealer, which accepts responsibility for its contents in accordance with the provisions of Rule 15a-6, under the US Securities Exchange Act of 1934. This document has not been approved for distribution in the Kingdom of Saudi Arabia (‘Saudi Arabia’) or to clients other than 'professional clients' in the United Arab Emirates (‘UAE’) by Nomura Saudi Arabia, NIplc or any other member of Nomura Group, as the case may be. Neither this document nor any copy thereof may be taken or transmitted or distributed, directly or indirectly, by any person other than those authorised to do so into Saudi Arabia or in the UAE or to any person located in Saudi Arabia or to clients other than 'professional clients' in the UAE. By accepting to receive this document, you represent that you are not located in Saudi Arabia or that you are a 'professional client' in the UAE and agree to comply with these restrictions. Any failure to comply with these restrictions may constitute a violation of the laws of Saudi Arabia or the UAE. NO PART OF THIS MATERIAL MAY BE (I) COPIED, PHOTOCOPIED, OR DUPLICATED IN ANY FORM, BY ANY MEANS; OR (II) REDISTRIBUTED WITHOUT THE PRIOR WRITTEN CONSENT OF A MEMBER OF NOMURA GROUP. Further information on any of the securities mentioned herein may be obtained upon request. If this document has been distributed by electronic transmission, such as e-mail, then such transmission cannot be guaranteed to be secure or error-free as information could be intercepted, corrupted, lost, destroyed, arrive late or incomplete, or contain viruses. The sender therefore does not accept liability for any errors or omissions in the contents of this document, which may arise as a result of electronic transmission. If verification is required, please request a hard-copy version. Nomura Group manages conflicts with respect to the production of research through its compliance policies and procedures (including, but not limited to, Conflicts of Interest, Chinese Wall and Confidentiality policies) as well as through the maintenance of Chinese walls and employee training. Additional information is available upon request. Disclosure information is available at the Nomura Disclosure web page: http://go.nomuranow.com/research/globalresearchportal/pages/disclosures/disclosures.aspx