
Nomogramas
4
320 INDUSTRIAL AND ENGINEERING CHEMISTRY Vol. 38, No. 3 Koroseal and poly- ethylene are suitable for gaskets and similar applications. Phosphates are thc best stabilizers of those tested. There appears to be a maximum concentration above which a stabilizer ceases to function. Concentrated per- oxide is insensitive to shock. Concentrated cal- cium permanganate solutions are stable at temperature up to at least 50" C. Ordinary steel containers may be used for its storage and shipment. TABLE XXXIV. STABILITY ASD CORROSION OF CALCIUM PERIIANGANATE SOLUTIONS AT 50 O C. ITD1010 AI, 2S'/aH SS Type 304 Bakelite" - -Al--^-' -___- -~--- Control -- El E2 A 2 €31 BZ C1 c2 D1 D2 Piessure, atm. 0 day 1 day. 5 days 10 days 19 days 21 days 56 days h.InOa-, % Original Final Change Initial Final Change Vol. of tube, ml. Weight, grams a Steel test piec 1.0 1.0 1.0 1.0 1.0 1.0 51.9 52.1 10.2 12.5 ... :es coated 1.0 1.0 0.9 0.9 1.0 0.9 1.0 0.9 1.0 0.9 0.9 0.9 1.0 . .. 1.0 1.0 0.9 0. 9 0.9 1.0 1.0 1.0 1.0 0.9 1.0 1.0 1.0 ... 1.0 1.0 1.0 1.0 1.0 1.0 1.0 51.9 61.9 .51,9 51.9 5f.9 53.5 51.3 51.2 51.1 01.3 +1.6 -0.6 -0.7 -0.8 -0.6 10.5 9.02 8.93 9.43 8.87 2.7508 2.7511 +0, 0003 according to CWB 2,7783 1.0579 1.0575 2.7763 1,0579 1,0574 +0.0008 0.0000 -0.0001 , Specification 196-131-207. 1.0 1.0 0.9 0.9 1.0 1.0 51.9 51.0 -0.9 ... 8.48 2.9235 4.9235 0.0000 1.0 1.0 1.0 1.0 1.0 1.0 1.0 51.9 51.7 -0.2 12.69 2.8946 2.8948 +0.0002 1.0 0.9 1.0 1.0 1.0 1.0 51.9 51.7 -c.2 12.55 ... 4.596G 4.5970 4-0.0004 1.0 1.0 1.0 1.0 1.0 1.0 1.0 51.9 51.8 -0.1 12.77 4. G255 4.6259 -to. 0004 TABLE xxxv. TEST OF \rARIOUS ;\IArERIALS IN 5 1fL. OF CONCEKTRATED CALCIUM PER\lANGANATE SOLT7TIOS AT ROoX TEMPERATURE IN COVERED TEST TUBE Wt, after 28 Daysa ______~- Wt. after 7 Daysa Initial, Final, Change, Initial, Final, Change, grams grams mg. grams grams mg. Garlock 7790 0.2376 0,2375 -0.1 0,2091 0,2093 +0.2 Saran tubing Clear 0.5264 0.5265 +O.l 0.4954 0.4957 4-0.3 Dark 0.6333 0.6331 -0.2 0,6027 0,6028 +O.l Koroseal 117 0.9546 0.9538 -0.8 0.8250 0.8748 -0.2 2s Alb 0.9486 0,9487 4-0.1 0.9523 0,9526 +0.3 SS 446O 1.4152 1.4154 +0.2 1.4229 1.4233 +0.4 a Test pieces were approximately 0.2 X 0.7 X 2.9 cm. b Aluminum was given Becco treatment. C Stainless steel was pickled in 10% HzSOa at 80' C. LlTERATURE CITED (I) Gilbert, H. N., and Reichert, J. S. (to Du Pont Co.), U. S. (2) Maas, O., and co-workers, J. Am. Chem. SOC., 42, 2548-74 Patents 2,001,509 (1935) and 2,091,178 (1937). (1920) ; 44, 2472-80 (1922); 46, 200-308, 2693-2700 (1924); 51, 674-87 (1929). (3) Reichert, J. S., Chem. Eng. News, 21, 480 (1943). (4) Reichert, J. S. (to Du Pont Co.), U. S. Patent 2,008,726 (1935). (5) Spring, W., 2. anorg. Ch,em., 8,424-33 (1895). RELEASED by authority of the Chief, Chemical Warfare Service. Vapor Pressure-Temperature Nomographs SAMUEL B. LIPPINCOTT AND MARGARET M. LYMAN Esso Laboratories, Standard Oil Development Company, Elizabeth, N. J. Nomographs are presented that give vapor pressure-tem- perature relations for compounds boiling from -50" to 550' C. If any two of the three related quantities, vapor pressure, temperature, and normal boiling point, are known, the third can be found by a single setting of a straight edge. 4 need often arises in the laboratory and plant for a rapid THE method of calculating vapor pressure-temperature relations. A number of nomographs for this purpose have appeared in the literature, but for the most part each nomograph represents only a single class of compounds, and each compound is represented by a given point. The nomographs presented here can be used for all pure liquids boiling between -50' and 560" C. The slide rule for vapor pressure described by Miles (2) can be applied to a similar range of compounds. The nornographs have the advan- tage that they do not have to be cut out and mounted before use. Miles gives a complete bibliography of the subject. The nomographs presented here are based upon a method for the correction of boiling points to standard pressure by Hass and Xewton (1). They used a modification of the integrated form of the Clausius-Clapeyron equation: (273.1 + t)(2.8808 - log p) + + 0.15 (2.8808 - log p) At = where At = O C. to be added to obseTed boiling point t = observed boiling points, from log of 760 C. 2.8808 - log p = log of observed pressure subtracted d. = quantity proportional to entropy of vaporiza- tion of 760 mm. Thc solution of this equation is rather laborious and time con- suming. First a value for + must be determined. For this pur- pose all compounds are divided arbitrarily into eight groups and listed (Tables I and 11). Substances not included in the tabula- ,tion may be classified by grouping them with compounds which they resemble closely in physical and structural properties. When the compound has been classified, the value of + can be estimated from a graph in which + is plotted against boiling point for each of the eight groups. If the normal boiling point is the unknown, a t least two calculations must be made. The first gives an approximate boiling point; the latter, in turn, is used to ob- tain a value of + from which to make the more accurate calculx- tion. The nornographs (Figures 1 and 2) solve the equation by a single setting of a straight edge. The eight curves through the center of each nomograph represent. the eight groups. The scale along these Eurves gives the normal or standard boiling point at 760 mm. Thc scale at the right gives the observed boiling point, and the logarithmic scale at the left gives the observed pressure.
-
Upload
camilo-perez -
Category
Documents
-
view
4 -
download
3
description
Ingeniería química/Química
Transcript of Nomogramas

320 I N D U S T R I A L A N D E N G I N E E R I N G CHEMISTRY Vol. 38, No. 3
Koroseal and poly- ethylene are suitable f o r g a s k e t s a n d similar applications.
Phosphates are thc best stabilizers of those tested. There appears to be a maximum concentration above which a stabilizer ceases to function.
Concentrated per- oxide is insensitive to shock.
Concentrated cal- cium permanganate solutions are stable a t temperature up to at least 50" C. Ordinary steel containers may be used for its storage and shipment.
TABLE XXXIV. STABILITY A S D CORROSION O F CALCIUM PERIIANGANATE SOLUTIONS AT 50 O C. ITD1010 AI, 2S'/aH SS Type 304 Bakelite" - -Al--̂-' -___- -~--- Control --
El E2 A 2 €31 BZ C 1 c 2 D 1 D2 Piessure, atm.
0 day 1 day . 5 days
10 days 19 days 21 days 56 days
h.InOa-, % Original Final Change
Initial Final Change
Vol. of tube, ml. Weight, grams
a Steel test piec
1 . 0 1 . 0 1.0 1 .0 1 . 0 1 . 0
51.9 52.1
1 0 . 2 12.5
...
:es coated
1 .0 1 . 0 0 . 9 0 . 9 1 .0 0 . 9 1 .0 0 . 9 1 . 0 0 . 9 0 . 9 0 . 9 1.0 . . .
1 . 0 1 . 0 0 . 9 0 . 9 0 . 9 1 .0 1 . 0
1 .0 1 .0 0 . 9 1 .0 1.0 1 . 0 ...
1 . 0 1.0 1 . 0 1 . 0 1 . 0 1 . 0 1 . 0
51.9 6 1 . 9 .51,9 51.9 5 f . 9 5 3 . 5 51.3 5 1 . 2 51.1 01.3
+ 1 . 6 -0 .6 -0 .7 -0 .8 -0 .6 1 0 . 5 9.02 8.93 9.43 8.87
2.7508 2.7511
+0, 0003
according to CWB
2 , 7 7 8 3 1.0579 1.0575 2.7763 1,0579 1,0574
+0.0008 0.0000 -0.0001
, Specification 196-131-207.
1 . 0 1 .0 0 . 9 0 .9 1.0 1 . 0
51.9 51.0
-0 .9
. . .
8 .48
2.9235 4.9235 0.0000
1.0 1 . 0 1 . 0 1 . 0 1.0 1 .0 1 . 0
51.9 51.7
- 0 . 2 12.69
2.8946 2.8948
+0.0002
1.0 0.9 1.0 1.0 1.0 1 . 0
51.9 51.7
-c .2 12.55
. . .
4.596G 4.5970
4-0.0004
1 .0 1 .0 1 . 0 1 . 0 1 . 0 1 . 0 1 . 0
51.9 51 .8
- 0 . 1 12.77
4 . G255 4.6259
-to. 0004
TABLE xxxv. TEST O F \rARIOUS ;\IArERIALS IN 5 1 f L . O F CONCEKTRATED CALCIUM PER\lANGANATE SOLT7TIOS AT ROoX
TEMPERATURE IN COVERED TEST TUBE Wt, after 28 Daysa ______~- Wt. after 7 Daysa
Initial, Final, Change, Initial, Final, Change, grams grams mg. grams grams mg.
Garlock 7790 0.2376 0,2375 - 0 . 1 0,2091 0,2093 + 0 . 2 Saran tubing
Clear 0.5264 0.5265 + O . l 0.4954 0.4957 4-0.3 Dark 0.6333 0.6331 -0 .2 0 ,6027 0,6028 + O . l
Koroseal 117 0.9546 0.9538 - 0 . 8 0.8250 0.8748 -0.2 2s Alb 0.9486 0,9487 4-0.1 0.9523 0,9526 + 0 . 3 SS 446O 1.4152 1.4154 +0.2 1.4229 1.4233 + 0 . 4 a Test pieces were approximately 0.2 X 0.7 X 2.9 cm. b Aluminum was given Becco treatment. C Stainless steel was pickled in 10% HzSOa a t 80' C.
LlTERATURE CITED
(I) Gilbert, H. N., and Reichert, J. S. (to Du Pont Co.), U. S.
(2) Maas, O., and co-workers, J. Am. Chem. SOC., 42, 2548-74 Patents 2,001,509 (1935) and 2,091,178 (1937).
(1920) ; 44, 2472-80 (1922); 46, 200-308, 2693-2700 (1924); 51, 674-87 (1929).
(3) Reichert, J. S., Chem. Eng. News, 21, 480 (1943). (4) Reichert, J. S. (to Du Pont Co.), U. S. Patent 2,008,726 (1935). (5) Spring, W., 2. anorg. Ch,em., 8,424-33 (1895).
RELEASED by authority of the Chief, Chemical Warfare Service.
Vapor Pressure-Temperature Nomographs
SAMUEL B. LIPPINCOTT AND MARGARET M. LYMAN Esso Laboratories, Standard Oil Development Company, Elizabeth, N . J .
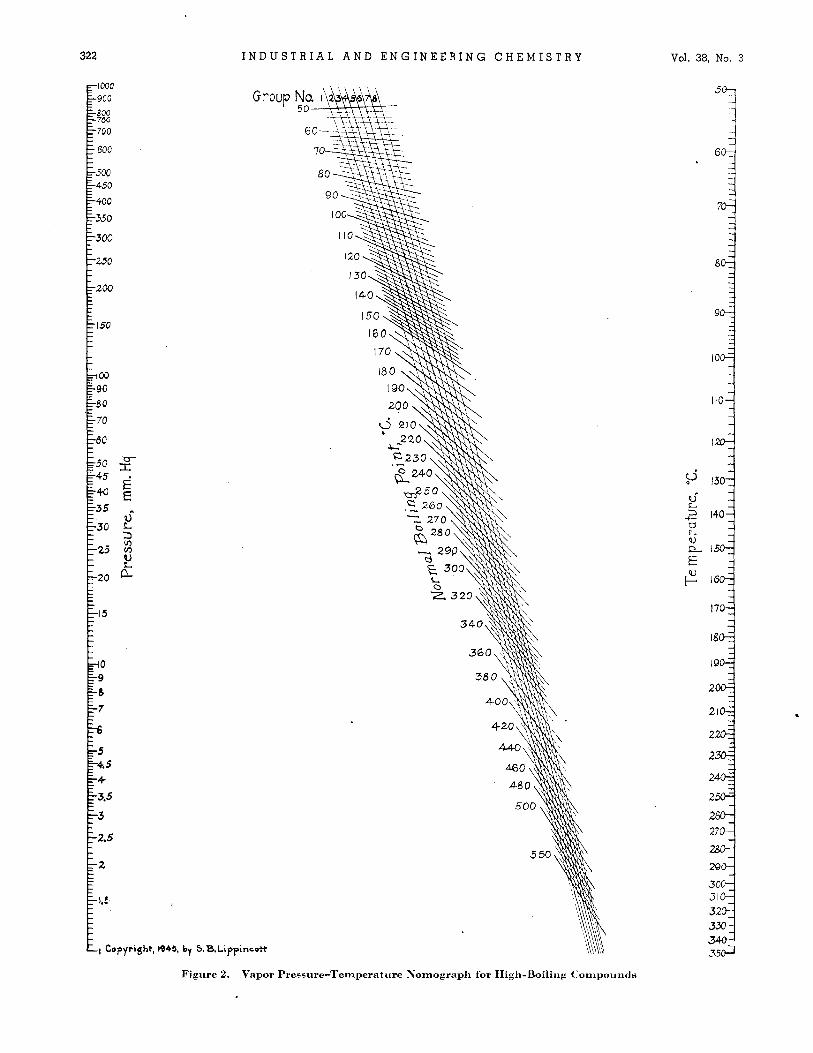
Nomographs are presented that give vapor pressure-tem- perature relations for compounds boiling from -50" to 550' C. If any two of the three related quantities, vapor pressure, temperature, and normal boiling point, are known, the third can be found by a single setting of a straight edge.
4 need often arises in the laboratory and plant for a rapid THE method of calculating vapor pressure-temperature relations. A number of nomographs for this purpose have appeared in the literature, but for the most part each nomograph represents only a single class of compounds, and each compound is represented by a given point. The nomographs presented here can be used for all pure liquids boiling between -50' and 560" C. The slide rule for vapor pressure described by Miles ( 2 ) can be applied to a similar range of compounds. The nornographs have the advan- tage that they do not have to be cut out and mounted before use. Miles gives a complete bibliography of the subject.
The nomographs presented here are based upon a method for the correction of boiling points to standard pressure by Hass and Xewton (1). They used a modification of the integrated form of the Clausius-Clapeyron equation:
(273.1 + t)(2.8808 - log p ) + + 0.15 (2.8808 - log p ) At =
where At = O C. to be added to obseTed boiling point t = observed boiling points,
from log of 760
C. 2.8808 - log p = log of observed pressure subtracted
d. = quantity proportional to entropy of vaporiza- tion of 760 mm.
Thc solution of this equation is rather laborious and time con- suming. First a value for + must be determined. For this pur- pose all compounds are divided arbitrarily into eight groups and listed (Tables I and 11). Substances not included in the tabula-
,tion may be classified by grouping them with compounds which they resemble closely in physical and structural properties. When the compound has been classified, the value of + can be estimated from a graph in which + is plotted against boiling point for each of the eight groups. If the normal boiling point is the unknown, a t least two calculations must be made. The first gives an approximate boiling point; the latter, in turn, is used to ob- tain a value of + from which to make the more accurate calculx- tion.
The nornographs (Figures 1 and 2) solve the equation by a single setting of a straight edge. The eight curves through the center of each nomograph represent. the eight groups. The scale along these Eurves gives the normal or standard boiling point a t 760 mm. Thc scale a t the right gives the observed boiling point, and the logarithmic scale a t the left gives the observed pressure.

March, 1946
E 760
c
100 90 00 70
60
lz.5 4
G
I N D U S T R I A L A N D E N G I N E E R I N G C H E M I S T R Y
Group
r" 2 E
Copyright, 1946, by S.B.Lipp;nco+t
321
-1 -31 -I 0 4
0 l
E
' O i
Figure 1. Vapor Pressure-Temperature Nomograph for Low-Boiling Compounds
CAMILO
Línea
CAMILO
Óvalo
322
c
20 fL
15
~
I N D U S T R I A L A N D E N G I N E E R I N G C H E M I S T R Y
Group
2.5
2 E 1.5,
k i Copyright, 1943, by S.E.Lippinsott
Vol. 38, No. 3
8 4
LI E
4
, 7 0 4
3 21 -1
3 3 5 4
.
Figure 2. Vapor Pressure-Temperature Nomograph for High-Boiling <:ompoiirid.s
CAMILO
Línea
March, 1946 I N D U S T R I A L A N D E N G I N E E R I N G C H E M I S T R Y 3i3
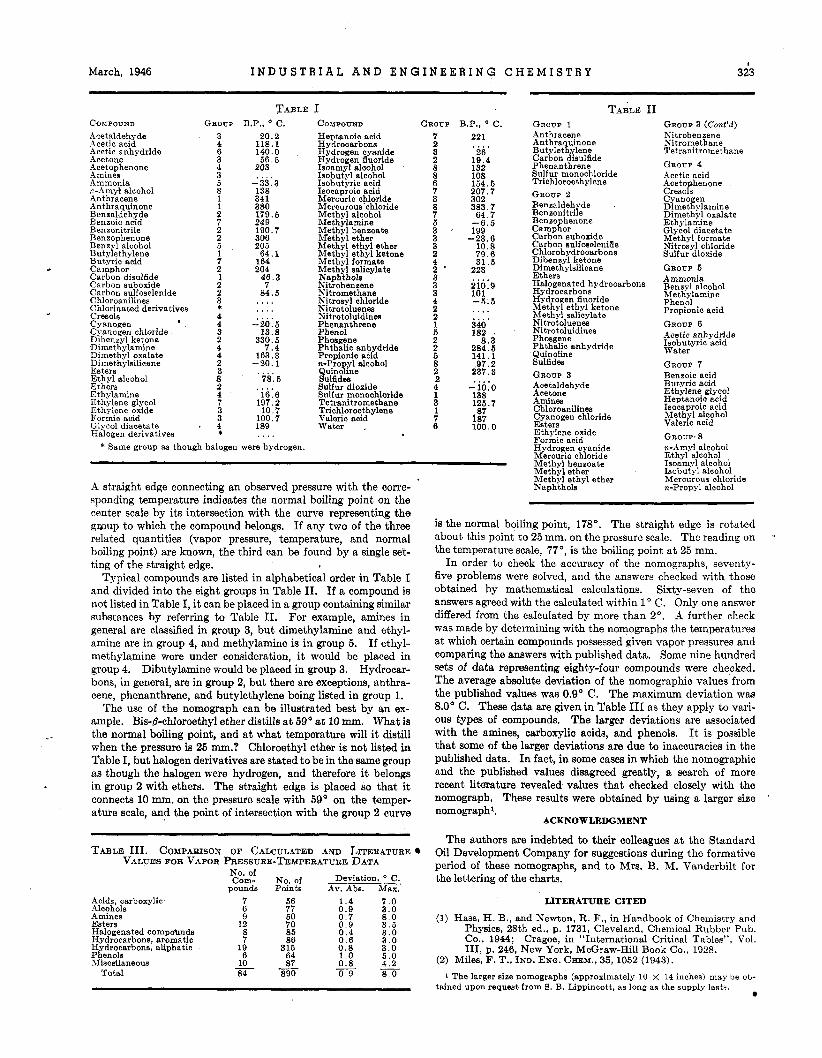
COMPOUND Acetaldehyde Acetic acid Acetic anhydride Acetone ticetophenone Amines Ammonia n-Amy+ alcohol Anthracene Anthraquinone Benzaldehyde Benzoic acid Bensonitrile Benzo henone Bensyy alcohol Butylethylene Butyric acid Camphor Carbon disulfide Carbon suboxide Carbon sulfoselenide Chloroanilines Chlorinated derivatives Cresols Cyanogen , Cyanogen chloride. Dibenzyl ketone Dimethylamine Dimethyl oxalate Dimethylsilicane Esters Ethyl alcohol Ethers Ethvlamine
GROUP 3 4 6 3 4 3 5 8 1 1 2 7 2 2 5 1 7 2 1 2 2
4 4 3 2 4 4 2 3 8 2 4 7 3 3
3,
4,
TABLE B.P., C.
20.2 118.1 140.0 56.5 203 . . . . -33.3 138 341 380 179.5 249 190.7 306 205 64.1 164 204 46.3 7 84.5 . . . . . . . . . . . .
-20.6 13.8 330.5 7.4
163.3 -20.1
78.6
16.6 197.2 10.7 100.7 189
. . . .
. . . .
. . . .
I COMPOUND Heptanoic acid Hydrocarbons Hydrogen cyanide Hydrogen fluoride Isoamyl alcohol Isobutyl alcohol Isobutyric acid Isocaproic acid Mercuric chloride Mercurous 'chloride Methyl alcohol Methylamine Methyl benzoate Methyl ether Methyl ethyl ether Methyl ethyl ketone Methyl formate Methyl salicylate Naphthols Nitrobenzene Nitromethane Nitrosyl ohloride Nitrotoluenes Nitrotoluidinea Phenanthrene Phenol Phosgene Phthalic anhydride Propionio acid n-Propyl alcohol
Sulfur dioside Sulfur monochloride Tetranitromethane Trichloroethylene Valeric acid Water .
c&ino;le
GROUP 7 2 3 2 8 8 6 7 3 8 7 6 3 3 3 2 4 2' 3 3 3 4 2 2 1 5 2 2 5 8 2 2 4 1 3 1 7 6
B.P., O C. 22 1
26 19.4 132 108 154.5 207.7 302 383.7 64.7 -6.6 199 -23.6 10.8 79.6 31.5
. . . .
223
101 -5.6
iio:s
.... &io* 182 . 8.3
284.5 141.1 .97.2 237.3
-10.0 138 125.7 87 187 100.0
....
TABLE 11 GROUP I Anthracene Anthra uinone But let% lene Cargon dmlfide Phenanthrene Sulfur monochloride Trichloroethylene GROUP 2 Benzaldehyde Benzonitrile Benzo henone Camptor Carbon suboxide Carbon sulfoseleniae Chlorohydrocarbons Dibenzyl ketone Dimethylsilicane Ethers Halogenated hydrocs Hydrocarbons Hydro en 5uoride Methy'! ethyl ketone Methyl salicylate Nitrotoluenes Nitrotoluidines Phosgene Phthalic anhydride Quinoline Sulfides
GROUP 3 Acetaldehyde Acetone Amines Chloroanilines Cyanogen chloride Esters Ethylene oxide Formic acid
trbons
Hydrogen cyaqide Mercuric chloride Methyl benzoate Methyl ether Methyl ethyl ether Naphthols
* Same group as though halogen were hydrogen,
4 straight edge connecting an observed pressure with the corre- sponding temperature indicates the normal boiling point on the center scale by its intersection with the curve representing the gwup to which the compound belongs. If any two of the three related quantities (vapor pressure, temperature, and normal boiling point) are known, the third can be found by a single set- ting of the straight edge.
Typical compounds are listed in alphabetical order in Table I and divided into the eight groups in Table 11. If a compound is not listed in Table I, i t can be placed in a group containing similar substances by referring to Table 11. For example, amines in general are classified in group 3, but dimethylamine and ethyl- amine are in group 4, and methylamine is in group 5. If ethyl- methylamine were under consideration, it would be placed in group 4. Dibutylamine would be placed in group 3. Hydrocar- bons] in general, are in group 2, but there are exceptions, anthra- cene, phenanthrene, and butylethylene being listed in group 1.
The use of the nomograph can be illustrated best by an ex- ample. Bis-8-chloroethyl ether distills at 59' at 10 mm. What is the normal boiling point, and at what temperature will it distill when the pressure is 25 mm.? Chloroethyl ether is not listed in Table I, but halogen derivatives are stated to be in the same group as though the halogen were hydrogen, and therefore it belongs in group 2 with ethers. The straight edge is placed so that i t connects 10 111111. on the pressure scale with 59' on the temper- ature scale, and the point of intersection with the group 2 curve
TABLE 111. COMPARISON OF CALCULATED AND LITERATURE 6 VALUES FOR VAPOR PRESSURE-TEMPERATURE DATA
Deviation, C. No. of Com- No. of
pounds Points Av. Abs. Max. Acids, carboxylic Alcohols Amines Tbtpr. Halogenated compohnds Hydrocarbons, aromatic Hydrocarbons, aliphatic Phenols Miscellaneous
Total
7 6 9 12 8 7 19 6 10 84 -
56 77 60 70 86 86 315 64 87 890 -
1.4 0.9 0.7 0.9 0.4 0.6 0.8 1 .o 0.8 0 9 c
7.0 3.0 8.0 3.5 3.0 3.0 3.0 6.0 4.2 8.0 _.
GROUP 3 (Cont'd) Nitrobenzene Nitromethane Tetranitromethane GROUP 4 Acetic acid Aceto henone CresoE Cyanogen Dimethylamine Dimethyl oxalate Ethylamine Glycol diacetate Methyl formate Nitrosyl chloride Sulfur dioxide GROUP 5 AMMOnia Benzyl alcohol Methylamine Phenol Propionic acid GROUP 6 Acetic anhydride Isobutyric acid Water
GROUP 7 Benzoic acid Butyric acid Ethylene glycol Heptanoic acid Isocaproic acid Methyl alcohol Valeric acid GROUP.^ n-Amyl alcohol Ethyl alcohol Isoamyl alcohol Isobutyl alcohol Mercurous chloride n-Propyl alcohol
is the normal boiling point, 178". The straight edge is rotated about this point to 25 mm. on the pressure scale. The reading on the temperature scale, 77", is the boiling point a t 25 mm.
In order to check the accuracy of the nomographs, seventy- five problems were solved, and the answers checked with those obtained by mathematical calculations. Sixty-seven of the answers agreed with the calculated within 1" C. Only one answer differed from the calculated by more than 2". A further check was made by determining with the nomographs the temperatures a t which certain compounds possessed given vapor pressures and comparing the answers with published data. Some nine hundred sets of data representing eighty-four compounds were checked. The average absolute deviation of the nomographic values from the published values was 0.9' C. The maximum deviation was 8.0" C. These data are given in Table I11 as they apply to vari- ous types of compounds. The larger deviations are associated with the amines, carboxylic acids, and phenols. It is possible that some of the larger deviations are due to inaccuracies in the published data. In fact, in some cases in which the nomographic and the published values disagreed greatly, a search of more recent literature revealed values that checked closely with the nomograph. These results were obtained by using a larger size nomograph'.
a
.
ACKNOWLEDGMENT
The authors are indebted to their colleagues at the Standard Oil Development Company for suggestions during the formative period of these nomographs, and to Mrs. B. M. Vanderbilt for the lettering of the charts.
LITERATURE CITED
(1) Hasa, H. B., and Newton, R. F., in Handbook of Chemistry and Physics, 28th ed., p. 1731, Cleveland, Chemical Rubber Pub. Co., 1944; Cragoe, in "International Critical Tables", Vol. 111, p. 246, New York, McGraw-Hill Book Co., 1928.
(2) Miles, F. T., IND. ENG. CHEM., 35, 1052 (1943). 1 The larger size nomographs (approximately 10 X 14 Inches) may be ob-
tained upon request from 9. B. Lippincott, as long a8 the supply lasts.
CAMILO
Línea


