![[SPECO] Catalog - Concrete Batching Plantkr.speco.co.kr/customer_center/pdf/Catalog-ConcreteBatchingPlant.… · Concrete batching plant Silo Top Type Portable Batching Plant Ribbon](https://static.fdocuments.in/doc/165x107/5a9deea57f8b9ada718b6595/speco-catalog-concrete-batching-concrete-batching-plant-silo-top-type-portable.jpg)
NOISE & DUST IMPACT ASSESSMENT PROPOSED CONCRETE BATCHING...
84
Max Winders & Associates Pty Ltd tas MWA Environmental Level 15, 241 Adelaide St, Brisbane GPO BOX 3137, Brisbane Qld 4001 P 07 3002 5500 F 07 3002 5588 E [email protected] W www.mwaenviro.com.au ABN 94 010 833 084 NOISE & DUST IMPACT ASSESSMENT PROPOSED CONCRETE BATCHING PLANT ABBOTSFORD ROAD BOWEN HILLS Prepared for: Hanson Construction Materials Pty Ltd Prepared by: MWA Environmental 10 April 2014
Transcript of NOISE & DUST IMPACT ASSESSMENT PROPOSED CONCRETE BATCHING...
Max Winders & Associates Pty Ltd tas MWA Environmental Level 15, 241 Adelaide St, Brisbane GPO BOX 3137, Brisbane Qld 4001
P 07 3002 5500 F 07 3002 5588 E [email protected] W www.mwaenviro.com.au
ABN 94 010 833 084
NOISE & DUST IMPACT ASSESSMENT PROPOSED CONCRETE BATCHING PLANT ABBOTSFORD ROAD BOWEN HILLS
Prepared for:
Hanson Construction Materials Pty Ltd
Prepared by:
MWA Environmental
10 April 2014

MWA Environmental
Bowen Hills 14-026 10 April 2014
DOCUMENT CONTROL SHEET
MWA Environmental Level 15 241 Adelaide Street Job Name: Bowen Hills GPO Box 3137 Brisbane 4001 Job No: 14-026 Telephone: 07 3002 5500 Facsimile 07 3002 5588 Original Date of Issue: 10 April 2014 Email: [email protected]
DOCUMENT DETAILS
Title: Noise & Dust Impact Assessment – Proposed Concrete Batching Plant – Abbotsford Road, Bowen Hills
Principal Author: Mr Ben Hyde Client: Hanson Construction Materials Pty Ltd c/- Groundwork Plus Client Address: 6 Mayneview Street, MILTON QLD 4064 Client Contact: Mr John Taylor
REVISION/CHECKING HISTORY
Version Number Date Issued By Checked By
1 Report 10/04/14 BH
PAK
2 3
4
5
6
7
8
DISTRIBUTION RECORD
Destination Version Number
1 2 3 4 5 6 7 8 9
Groundwork (electronic) 1
Client (electronic) 1
File Copy 1
MWA Enviro Library
MWA Environmental
Bowen Hills 14-026 10 April 2014
CONTENTS TABLE
1.0 INTRODUCTION ................................................................................... 1
1.1 PURPOSE OF REPORT ................................................................................. 1 1.2 SITE DESCRIPTION ..................................................................................... 1 1.3 SURROUNDING LAND USES ..................................................................... 2 1.4 PROPOSED DEVELOPMENT ...................................................................... 3
2.0 NOISE IMPACT ASSESSMENT ........................................................... 5 2.1 AMBIENT NOISE LEVELS .......................................................................... 5 2.2 RELEVANT NOISE CRITERIA ................................................................... 7 2.3 NOISE MODELLING .................................................................................... 9
2.3.1 NOISE MODELLING METHODOLOGY ............................................. 9 2.3.2 SOURCE NOISE DATA ....................................................................... 10 2.3.3 NOISE CONTROL MEASURES.......................................................... 12
2.3.4 NOISE MODELLING RESULTS ......................................................... 13
3.0 DUST IMPACT ASSESSMENT .......................................................... 14 3.1 AMBIENT DUST CONCENTRATIONS .................................................... 14 3.2 RELEVANT DUST GUIDELINES ............................................................. 14 3.3 DUST MODELLING .................................................................................... 15
3.3.1 DUST MODELLING METHODOLOGY ............................................ 15 3.3.2 RECOMMENDED DUST CONTROL MEASURES........................... 16 3.3.3 DUST EMISSION SOURCES .............................................................. 16 3.3.4 DUST MODELLING RESULTS .......................................................... 17
5.0 CONCLUSION .................................................................................... 20 FIGURES ATTACHMENTS
MWA Environmental
Bowen Hills 14-026 10 April 2014 1
1.0 INTRODUCTION
1.1 PURPOSE OF REPORT MWA Environmental has been engaged by Hanson Construction Materials Pty Ltd to prepare a Noise & Dust Impact Assessment for a proposed concrete batching plant at Bowen Hills. The report has been commissioned to support an application to Department of State Development and Infrastructure Planning (DSDIP) for development approval. The development application is made under the Economic Development Act 2012 in a Priority Development Area (PDA) – Bowen Hills Urban Development Area Development Scheme (Precinct 9). The assessment has been conducted in accordance with the methodology agreed with DSDIP as per the following documents:
Proposed Concrete Batching Plant at Abbotsford Road, Bowen Hills - Assessment Methodology – Noise (MWA Environmental ref. L06214/BH/14-026, 28 February 2014); and
Proposed Concrete Batching Plant at Abbotsford Road, Bowen Hills - Assessment Methodology – Air Quality (MWA Environmental ref. L06114/BH/14-026, 28 February 2014).
The report addresses the potential impact of noise and dust emissions from the proposed concrete batching plant activities on surrounding sensitive land uses with reference to the relevant regulatory noise limits and air quality objectives. The assessment has been based upon detailed noise propagation and dust dispersion modelling and provides recommendations for measures required to mitigate potential impacts at surrounding sensitive receptors.
1.2 SITE DESCRIPTION The site has a street address of 236 Abbotsford Road, Bowen Hills but also has vehicular access via Gebbie Street. The subject site has a real property description of:
Lot 22 RP46694;
Lots 16 to 21 RP48712;
Lots 33 to 37 RP 55484; and
Lot 314 SP268648.
The location of the subject site is shown on Figure 1.
MWA Environmental
Bowen Hills 14-026 10 April 2014 2
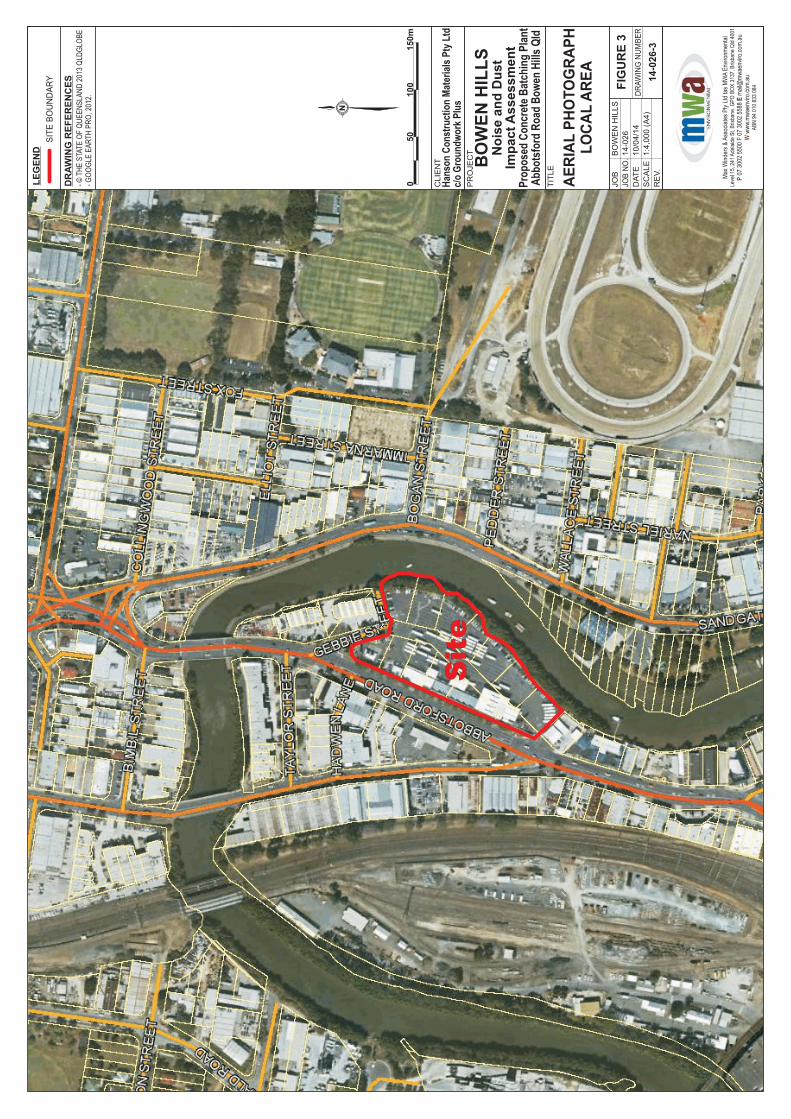
The site is located within an industrial zoned land use area. The land use zoning of the locality is shown on Figure 2. The site has previously operated as a Brisbane City Council bus depot including hardstand, workshop, refuelling and office facilities. An aerial photograph of the subject site and local area is included as Figure 3.
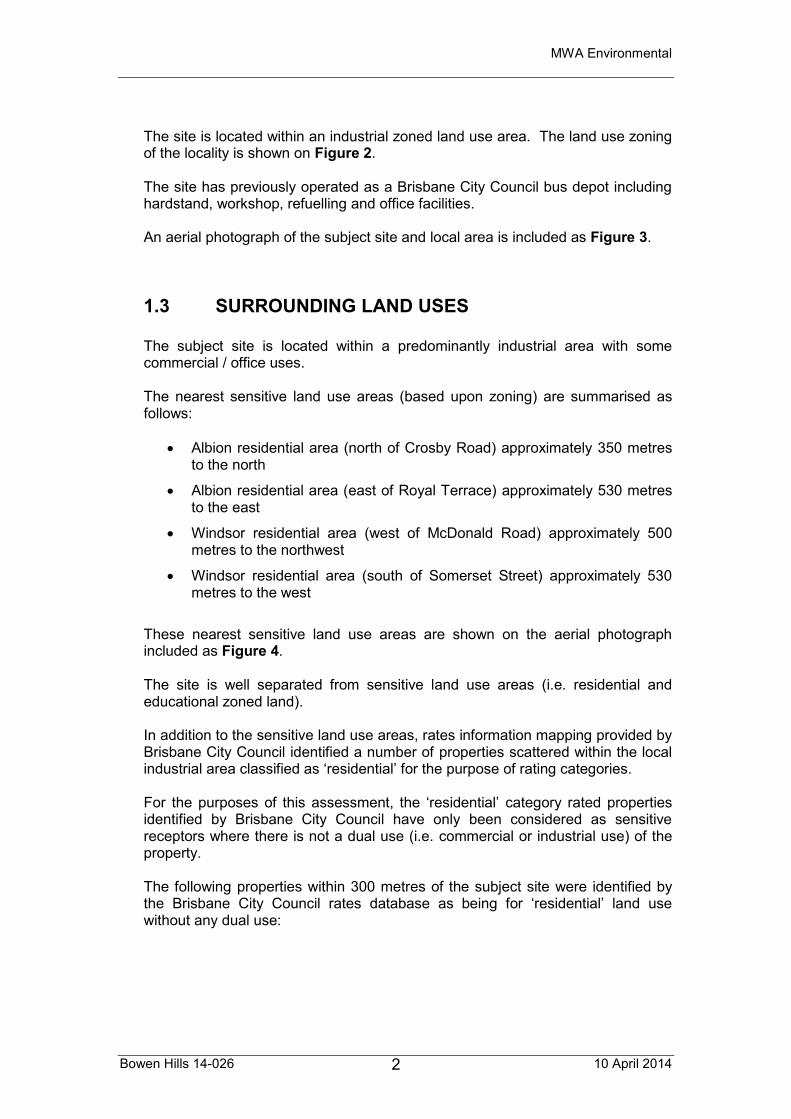
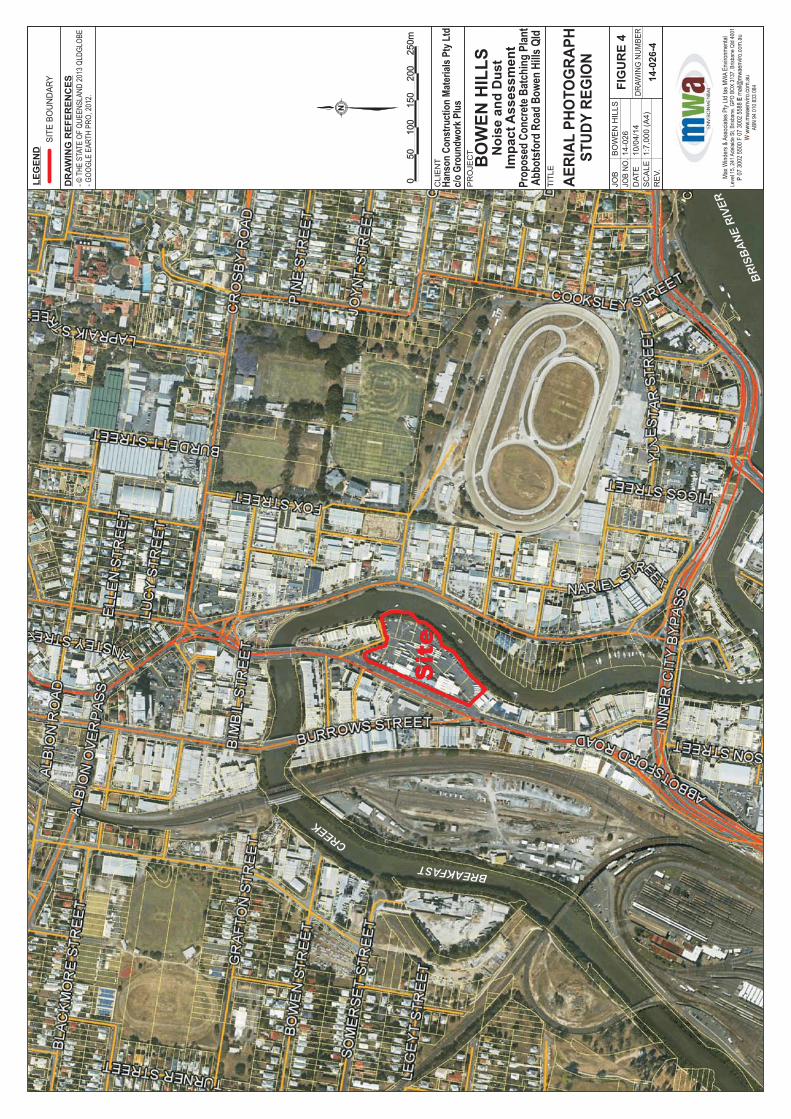
1.3 SURROUNDING LAND USES The subject site is located within a predominantly industrial area with some commercial / office uses. The nearest sensitive land use areas (based upon zoning) are summarised as follows:
Albion residential area (north of Crosby Road) approximately 350 metres to the north
Albion residential area (east of Royal Terrace) approximately 530 metres to the east
Windsor residential area (west of McDonald Road) approximately 500 metres to the northwest
Windsor residential area (south of Somerset Street) approximately 530 metres to the west
These nearest sensitive land use areas are shown on the aerial photograph included as Figure 4. The site is well separated from sensitive land use areas (i.e. residential and educational zoned land). In addition to the sensitive land use areas, rates information mapping provided by Brisbane City Council identified a number of properties scattered within the local industrial area classified as ‘residential’ for the purpose of rating categories. For the purposes of this assessment, the ‘residential’ category rated properties identified by Brisbane City Council have only been considered as sensitive receptors where there is not a dual use (i.e. commercial or industrial use) of the property. The following properties within 300 metres of the subject site were identified by the Brisbane City Council rates database as being for ‘residential’ land use without any dual use:
MWA Environmental
Bowen Hills 14-026 10 April 2014 3
115 Sandgate Road, Albion
91 Sandgate Road, Albion
61 Nariel Street, Albion
63 Nariel Street, Albion
8 Immarna Street, Albion
10 Immarna Street, Albion
1 Tate Street, Albion
19 Bimbil Street, Albion
12 Gore Street, Albion
10 Gore Street, Albion
Based upon site inspection and aerial photograph analysis, MWA Environmental has considered the following properties as dual use (i.e. not sensitive receptors) and therefore not assessed as sensitive receptors:
115 Sandgate Road, Albion - Considered to be industrial or dual use based upon vehicle storage and integration of yard areas with two adjoining industrial properties.
91 Sandgate Road, Albion – Considered to be commercial or dual use based upon business signage for ‘Portfolio Projects’ office
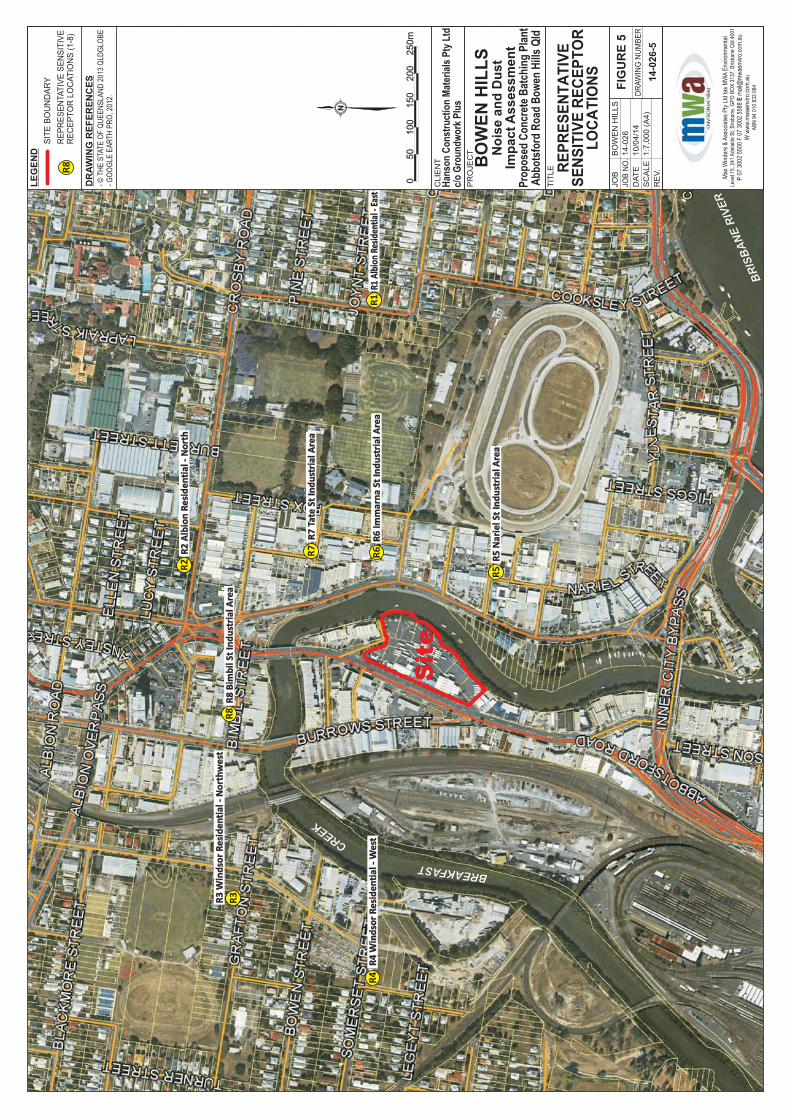
Several other properties identified by Brisbane City Council rating information are also likely to be dual use based upon sale and leasing advertising noted at the properties. Due to uncertainty regarding other properties, they have been considered as sensitive places for the purposes of this assessment. The representative sensitive receptor locations considered in the assessment, including within the industrial precinct, are shown on the aerial photograph included as Figure 5.
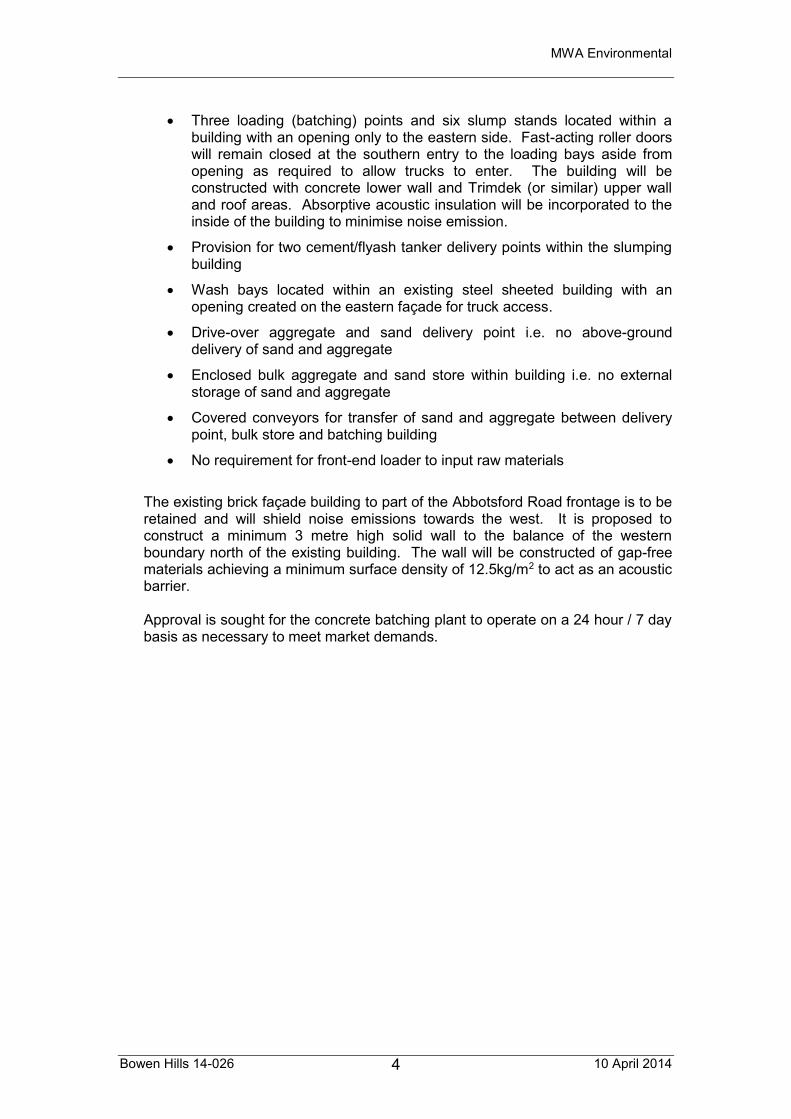
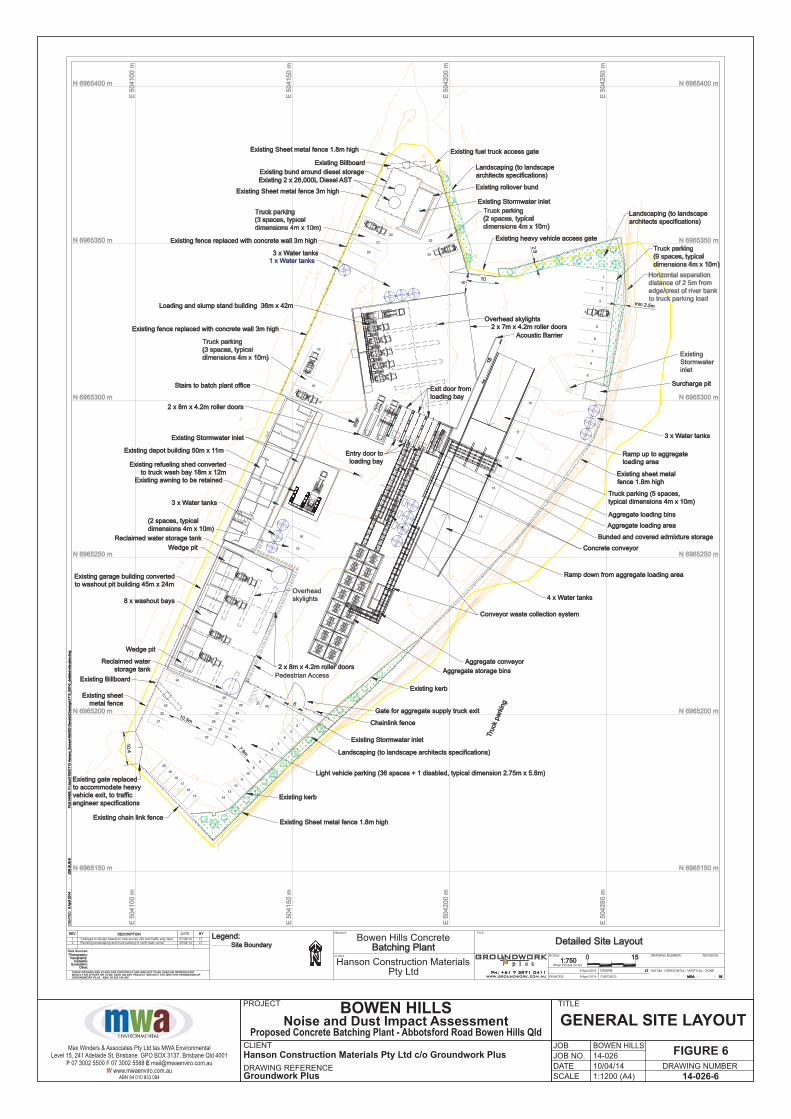
1.4 PROPOSED DEVELOPMENT It is proposed to develop the subject site as a modern concrete batching plant. Heavy vehicle access to and from the site is proposed to be via driveways at the northern end of the site to Gebbie Street. Staff carparking is proposed to be accessed via a driveway at the southern end of the site from Abbotsford Road The proposed site plan is shown on Figure 6. The design of the plant incorporates specific features to minimise noise and dust emissions including:
MWA Environmental
Bowen Hills 14-026 10 April 2014 4
Three loading (batching) points and six slump stands located within a
building with an opening only to the eastern side. Fast-acting roller doors will remain closed at the southern entry to the loading bays aside from opening as required to allow trucks to enter. The building will be constructed with concrete lower wall and Trimdek (or similar) upper wall and roof areas. Absorptive acoustic insulation will be incorporated to the inside of the building to minimise noise emission.
Provision for two cement/flyash tanker delivery points within the slumping building
Wash bays located within an existing steel sheeted building with an opening created on the eastern façade for truck access.
Drive-over aggregate and sand delivery point i.e. no above-ground delivery of sand and aggregate
Enclosed bulk aggregate and sand store within building i.e. no external storage of sand and aggregate
Covered conveyors for transfer of sand and aggregate between delivery point, bulk store and batching building
No requirement for front-end loader to input raw materials
The existing brick façade building to part of the Abbotsford Road frontage is to be retained and will shield noise emissions towards the west. It is proposed to construct a minimum 3 metre high solid wall to the balance of the western boundary north of the existing building. The wall will be constructed of gap-free materials achieving a minimum surface density of 12.5kg/m2 to act as an acoustic barrier. Approval is sought for the concrete batching plant to operate on a 24 hour / 7 day basis as necessary to meet market demands.

MWA Environmental
Bowen Hills 14-026 10 April 2014 5
2.0 NOISE IMPACT ASSESSMENT
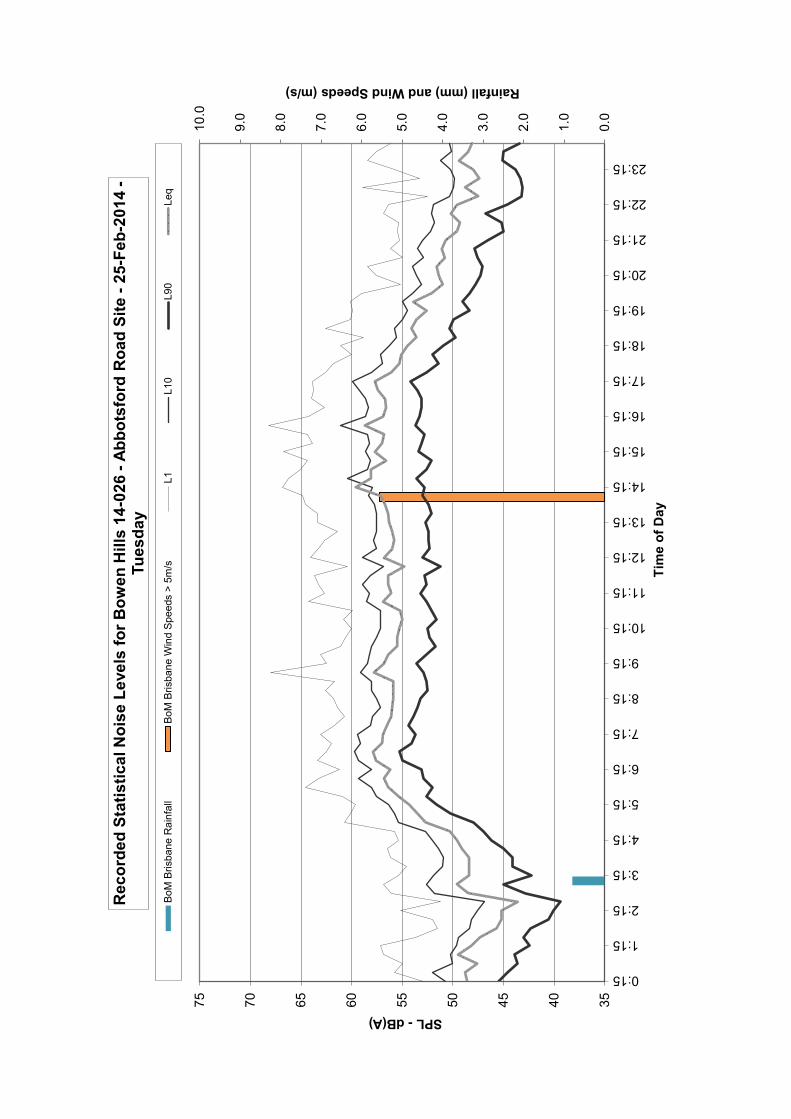
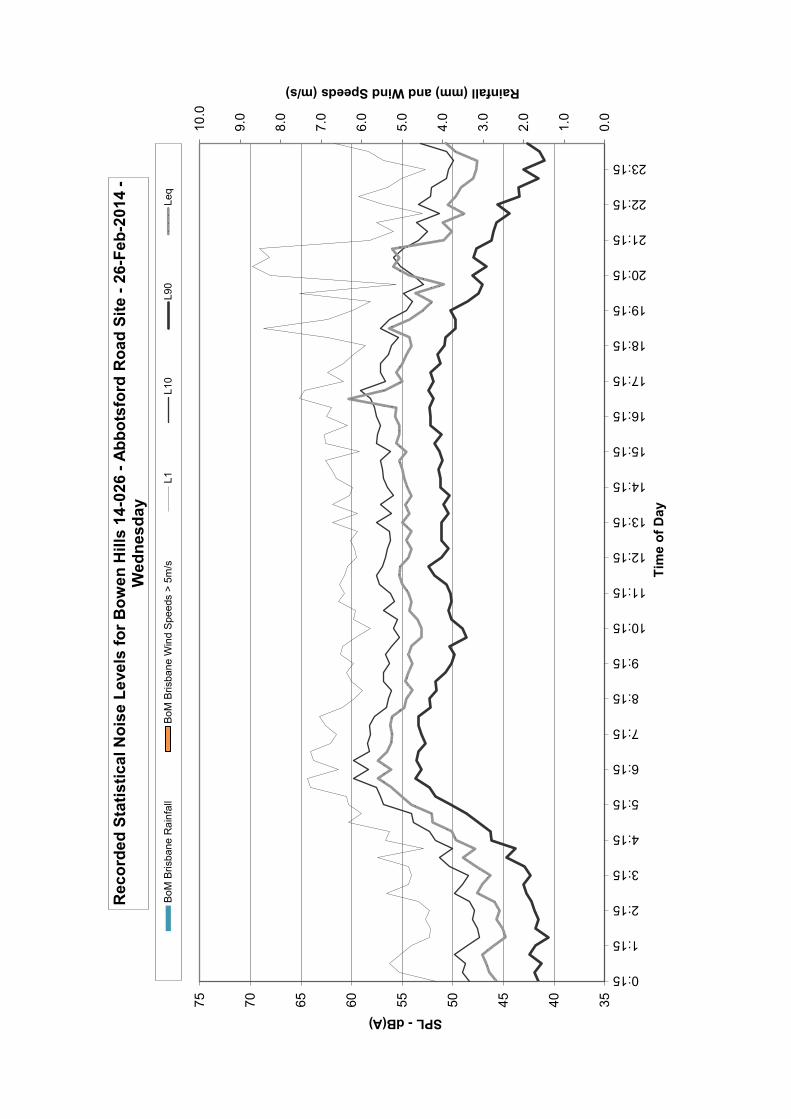
2.1 AMBIENT NOISE LEVELS In order to characterise the existing acoustic environment at the surrounding sensitive receptors, noise monitoring has been undertaken during the day, evening and night periods at representative locations. The noise monitoring locations are described as follows and shown on Figure 7:
Bowen Hills Local Area Centrally located on subject site Period 24 February 2014 to 2 March 2014 Rion NL-42 sound level meter pre-calibrated to 94 dB at 1 kHz Free-field monitoring location shielded from Abbotsford Road and
Sandgate Road traffic noise by existing building structures and solid fencing
Location representative of locations within the local commercial / industrial area which are reasonably separated and/or shielded from major roadways
Noise environment primarily affected by local and distant road traffic noise, mechanical plant noise from within the industrial/commercial precinct
Windsor Residential Area Bowen Street, Windsor Period 28 February 2014 to 6 March 2014 Rion NL-21 sound level meter pre-calibrated to 94 dB at 1 kHz Free-field monitoring location within residential property Location representative of quieter areas within the Windsor residential
precinct Noise environment primarily affected by local and distant road traffic noise
Albion Residential Area Royal Terrace, Albion Period 13 to 14 March 2014 ARL EL-215 noise datalogger pre-calibrated to 94 dB at 1 kHz Free-field monitoring location within park adjacent to residential
properties, well setback from roadways Location representative of less elevated, quieter areas within the Albion
residential precinct Noise environment primarily affected by local and distant road traffic noise
MWA Environmental
Bowen Hills 14-026 10 April 2014 6
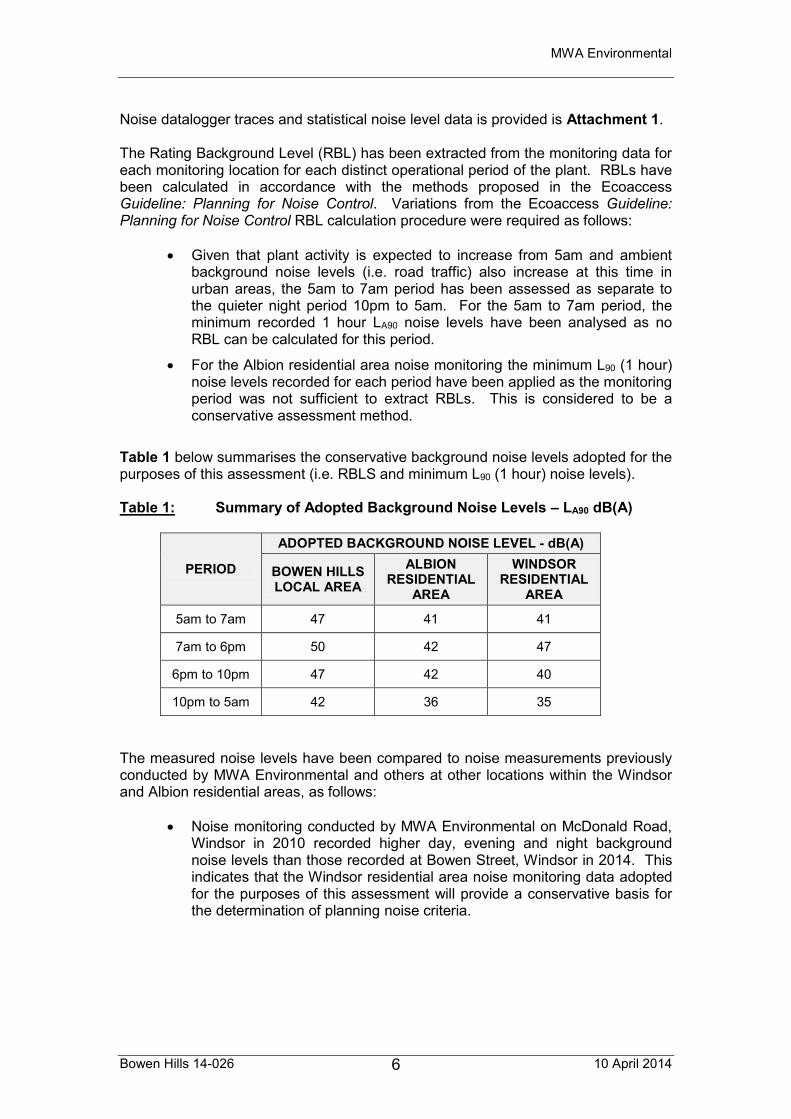
Noise datalogger traces and statistical noise level data is provided is Attachment 1. The Rating Background Level (RBL) has been extracted from the monitoring data for each monitoring location for each distinct operational period of the plant. RBLs have been calculated in accordance with the methods proposed in the Ecoaccess Guideline: Planning for Noise Control. Variations from the Ecoaccess Guideline: Planning for Noise Control RBL calculation procedure were required as follows:
Given that plant activity is expected to increase from 5am and ambient background noise levels (i.e. road traffic) also increase at this time in urban areas, the 5am to 7am period has been assessed as separate to the quieter night period 10pm to 5am. For the 5am to 7am period, the minimum recorded 1 hour LA90 noise levels have been analysed as no RBL can be calculated for this period.
For the Albion residential area noise monitoring the minimum L90 (1 hour) noise levels recorded for each period have been applied as the monitoring period was not sufficient to extract RBLs. This is considered to be a conservative assessment method.
Table 1 below summarises the conservative background noise levels adopted for the purposes of this assessment (i.e. RBLS and minimum L90 (1 hour) noise levels). Table 1: Summary of Adopted Background Noise Levels – LA90 dB(A)
PERIOD
ADOPTED BACKGROUND NOISE LEVEL - dB(A)
BOWEN HILLS LOCAL AREA
ALBION RESIDENTIAL
AREA
WINDSOR RESIDENTIAL
AREA
5am to 7am 47 41 41
7am to 6pm 50 42 47
6pm to 10pm 47 42 40
10pm to 5am 42 36 35
The measured noise levels have been compared to noise measurements previously conducted by MWA Environmental and others at other locations within the Windsor and Albion residential areas, as follows:
Noise monitoring conducted by MWA Environmental on McDonald Road, Windsor in 2010 recorded higher day, evening and night background noise levels than those recorded at Bowen Street, Windsor in 2014. This indicates that the Windsor residential area noise monitoring data adopted for the purposes of this assessment will provide a conservative basis for the determination of planning noise criteria.
MWA Environmental
Bowen Hills 14-026 10 April 2014 7
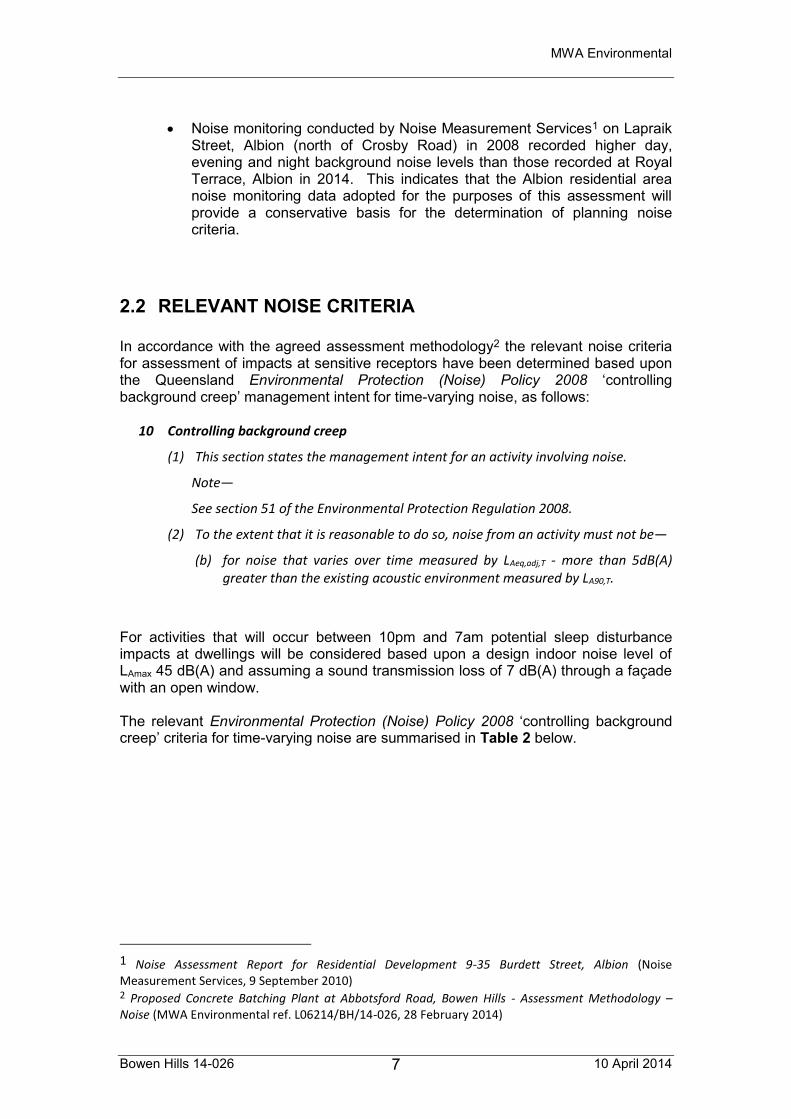
Noise monitoring conducted by Noise Measurement Services1 on Lapraik Street, Albion (north of Crosby Road) in 2008 recorded higher day, evening and night background noise levels than those recorded at Royal Terrace, Albion in 2014. This indicates that the Albion residential area noise monitoring data adopted for the purposes of this assessment will provide a conservative basis for the determination of planning noise criteria.
2.2 RELEVANT NOISE CRITERIA In accordance with the agreed assessment methodology2 the relevant noise criteria for assessment of impacts at sensitive receptors have been determined based upon the Queensland Environmental Protection (Noise) Policy 2008 ‘controlling background creep’ management intent for time-varying noise, as follows:
10 Controlling background creep
(1) This section states the management intent for an activity involving noise.
Note—
See section 51 of the Environmental Protection Regulation 2008.
(2) To the extent that it is reasonable to do so, noise from an activity must not be—
(b) for noise that varies over time measured by LAeq,adj,T - more than 5dB(A) greater than the existing acoustic environment measured by LA90,T.
For activities that will occur between 10pm and 7am potential sleep disturbance impacts at dwellings will be considered based upon a design indoor noise level of LAmax 45 dB(A) and assuming a sound transmission loss of 7 dB(A) through a façade with an open window. The relevant Environmental Protection (Noise) Policy 2008 ‘controlling background creep’ criteria for time-varying noise are summarised in Table 2 below.
1 Noise Assessment Report for Residential Development 9-35 Burdett Street, Albion (Noise Measurement Services, 9 September 2010) 2 Proposed Concrete Batching Plant at Abbotsford Road, Bowen Hills - Assessment Methodology – Noise (MWA Environmental ref. L06214/BH/14-026, 28 February 2014)

MWA Environmental
Bowen Hills 14-026 10 April 2014 8
Table 2: Relevant EP(Noise)P 2008 ‘Controlling Background Creep’ Criteria For Sensitive Receptors – LAeq dB(A)
PERIOD
ADOPTED BACKGROUND - LA90 - dB(A) ADOPTED SENSITIVE RECEPTOR NOISE LIMIT – LAeq,adj,T - dB(A)
BOWEN HILLS LOCAL
AREA
ALBION RESIDENTIAL
AREA
WINDSOR RESIDENTIAL
AREA
BOWEN HILLS LOCAL
AREA
ALBION RESIDENTIAL
AREA
WINDSOR RESIDENTIAL
AREA
5am to 7am 47 41 41 52 46 46
7am to 6pm 50 42 47 55 47 52
6pm to 10pm 47 42 40 52 47 45
10pm to 5am 42 36 35 47 41 40
As the site will operate during the night period (10pm to 7am) it is appropriate to consider the potential for sleep disturbance within residential dwellings. The Ecoaccess Guideline: Planning for Noise Control provides the following in relation to sleep disturbance planning criteria:
Research has shown that the ability to get to sleep and, when asleep, the probability of experiencing a change of sleep state or ultimately of awakening are related to both the ambient and maximum instantaneous noise levels at the ear of the sleeper and the number of events during the night time period (WHO 1999). As a rule in planning for short-term or transient noise events, for good sleep over eight hours, the indoor sound pressure level measured as a maximum instantaneous value should not exceed approximately 45dBA maxLpA more than 10-15 times per night. The corresponding external noise level, assuming partially closed windows, is 52dBA maxLpA, measured in the free field.
As such, a sleep disturbance criteria of LAmax 52 dB(A) external to dwellings with an open window has been applied for the purposes of night operations. Based upon measurements conducted by MWA Environmental at the existing Hanson Lytton concrete batching plant, no tonal or impulsive adjustment is warranted. For further details refer to Attachment 2.

MWA Environmental
Bowen Hills 14-026 10 April 2014 9
2.3 NOISE MODELLING
2.3.1 NOISE MODELLING METHODOLOGY To enable assessment of noise from the proposed concrete batching plant operations a detailed noise model has been established using the SoundPLAN 7.3 software applying the ISO9613 standard. This model is an accepted regulatory model that allows input of site-specific terrain data and source noise data as sound power level spectra. The noise modelling undertaken considered meteorological conditions as per the methodology of the ISO9613 standard, with a temperature of 10 degrees Celsius and 70% humidity, a temperature inversion and the following wind conditions as per the adverse meteorological assumptions of ISO9613:
Downwind propagation conditions for the method specified in this part of ISO 9613 are as specified in 5.4.3.3 of ISO 1996-2:1987, namely
- Wind direction within an angle of + 45o of the direction connecting the centre of the dominant sound source and the centre of the specified receiver region, with the wind blowing from source to receiver, and
- Wind speed between approximately 1m/s and 5m/s,
measured at a height of 3m to 11m above the ground. As such, given the above adverse meteorological assumptions, it is considered that the results of the noise modelling represent the resultant noise levels of the proposed concrete batching plant activities during worst-case noise propagation conditions. The SoundPLAN 7.3 model has been setup to represent noise emissions from the proposed concrete batching plans as per the site plan shown on Figure 6. The model layout and the source locations are shown on the drawings included in Attachment 3. The model was established over an area of approximately 1500 metres by 1100 metres surrounding the site which is of sufficient area to include the potentially affected sensitive receptors in the Bowen Hills local area, the Windsor residential area and the Albion residential area. The modelling has considered two operational scenarios, as follows:
Peak Operations – 5am to 10pm Absolute peak operations scenario based upon the plant operating continuously to the design production limit and peak raw material delivery rates. This scenario is only applicable to the core business hours of 5am to 10pm.
MWA Environmental
Bowen Hills 14-026 10 April 2014 10
Night Operations – 10pm to 5am Expected peak night operations scenario based upon the plant operating at a production rate to supply concrete to an inner city night pour operating two concrete pumps3. Peak sand and aggregate delivery rates for early night period and up to two cement / flyash deliveries per hour.
The noise sources represented for each scenario are described in Section 2.3.2 below. The modelling considered the resultant noise levels at the surrounding receptors with all noise sources operating simultaneously. Given that dwellings at the locality are generally of highset construction, the model was setup to predict the resultant noise levels across the model domain for Upper Level (+4.3m) receptors.
2.3.2 SOURCE NOISE DATA The sources represented in the SoundPLAN 7.3 model were as per the following Table 3.
3 100m3 per hour pour rate at 6.5m3 per agitator truck => 15 agitator trucks per hour production rate

MWA Environmental
Bowen Hills 14-026 10 April 2014 11
Table 3: Noise Sources Used in SoundPLAN 7.3 Modelling
MODELLED NOISE SOURCE
MODELLED SOURCE TYPE PEAK OPERATIONS
(5am to 10pm) NIGHT OPERATIONS
(10pm to 5am)
Loading Agitator Truck at Batching Point
(3 simultaneously)
Loading Agitator Truck at Batching Point
Indoor Point Sources Within Industrial Building Source
Agitator Truck at Slump Stand
(6 simultaneously)
Agitator Truck at Slump Stand
(2 simultaneously)
Indoor Point Sources Within Industrial Building Source
Unloading Bulk Cement (2 simultaneously) Unloading Bulk Cement Indoor Point Sources Within
Industrial Building Source
Agitator Truck at Washout Pit
(2 simultaneously)
Agitator Truck at Washout Pit
Indoor Point Sources Within Industrial Building Source
Batching Building Batching Building Industrial Building Source
Bulk Aggregate Store Bulk Aggregate Store Industrial Building Source
Delivery Conveyor System Delivery Conveyor System Point Source
Building Extraction Fan Building Extraction Fan Point Source
Agitator Trucks (60 per hour)
Agitator Trucks (15 per hour)
Line Source (as Moving Point Source)
Aggregate / Sand Delivery Trucks (7 per hour)
Aggregate / Sand Delivery Trucks (7 per hour)
Line Source (as Moving Point Source)
Cement/Flyash Delivery Trucks (4 per hour)
Cement/Flyash Delivery Trucks (1 per hour)
Line Source (as Moving Point Source)
Bag Filter Fan (x4) Bag Filter Fan (x4) Point Sources
Sound power data for the noise sources was derived from measurements conducted by MWA Environmental at the existing Hanson concrete batching plant at Lytton. Supplementary noise data was input for trucks and cement deliveries based upon from previous measurements at Hanson concrete batching plants. The source noise data and a plan showing the modelled source locations are provided in Attachment 3.
MWA Environmental
Bowen Hills 14-026 10 April 2014 12
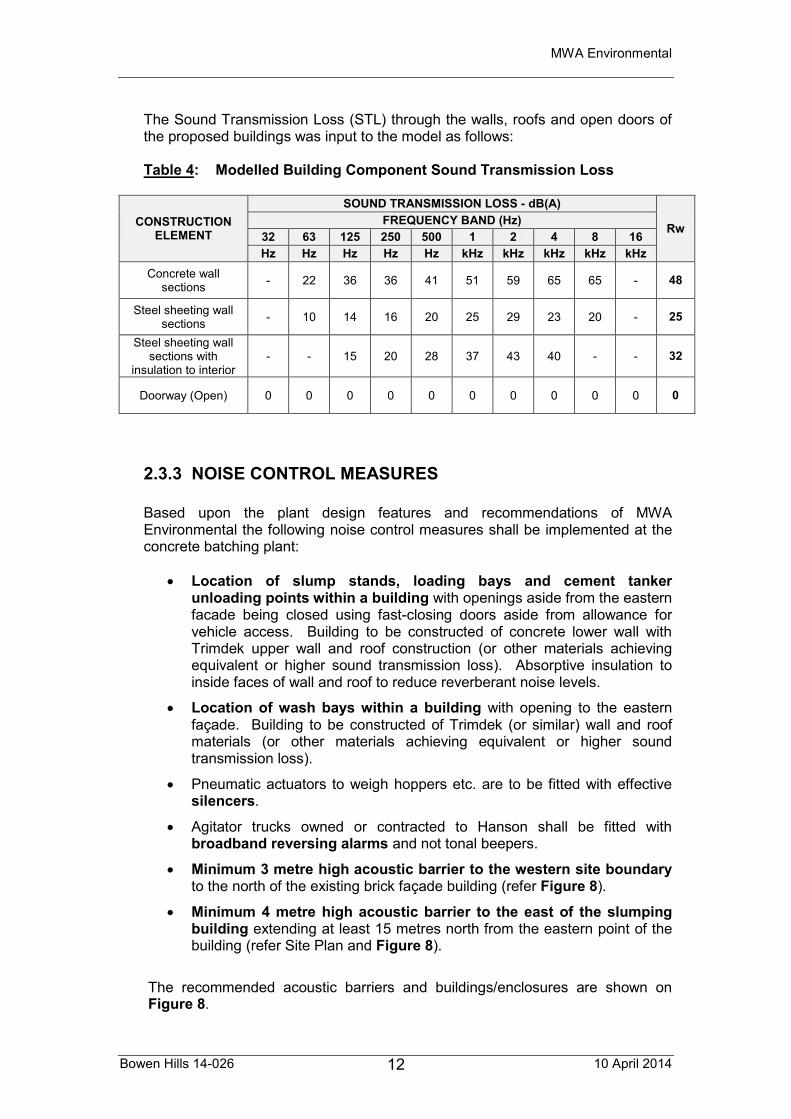
The Sound Transmission Loss (STL) through the walls, roofs and open doors of the proposed buildings was input to the model as follows: Table 4: Modelled Building Component Sound Transmission Loss
CONSTRUCTION ELEMENT
SOUND TRANSMISSION LOSS - dB(A)
Rw FREQUENCY BAND (Hz) 32 63 125 250 500 1 2 4 8 16 Hz Hz Hz Hz Hz kHz kHz kHz kHz kHz
Concrete wall sections - 22 36 36 41 51 59 65 65 - 48
Steel sheeting wall sections - 10 14 16 20 25 29 23 20 - 25
Steel sheeting wall sections with
insulation to interior - - 15 20 28 37 43 40 - - 32
Doorway (Open) 0 0 0 0 0 0 0 0 0 0 0
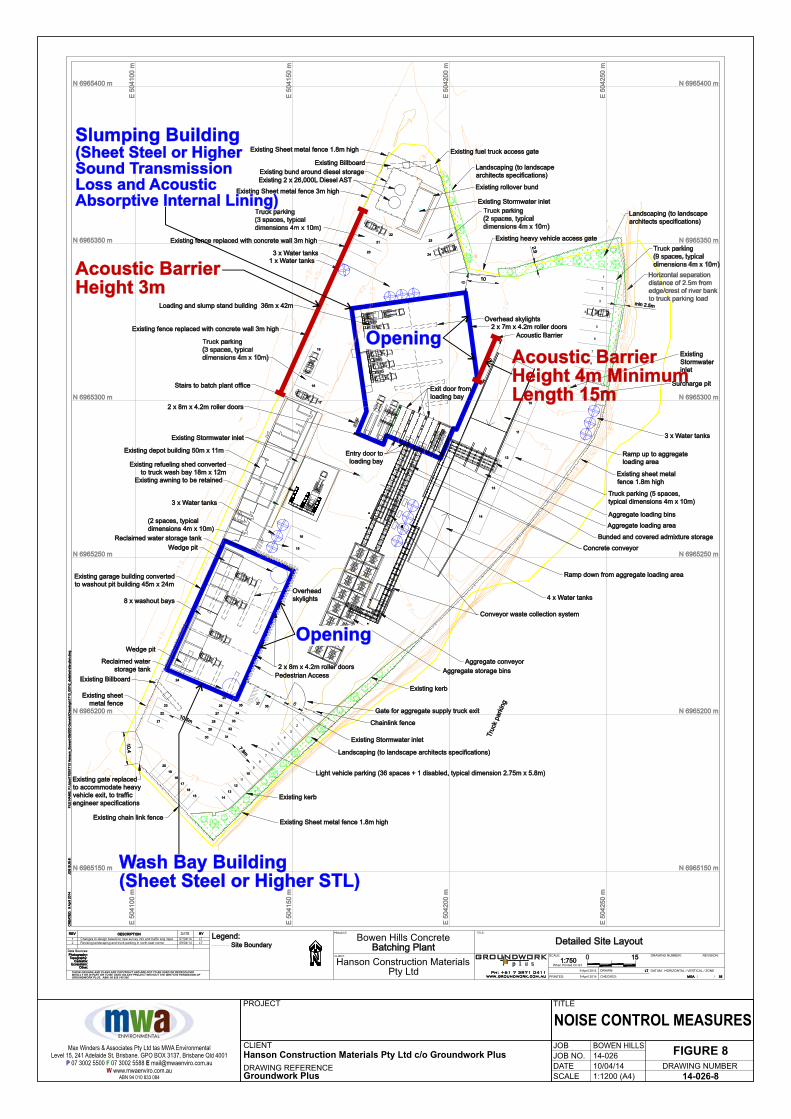
2.3.3 NOISE CONTROL MEASURES Based upon the plant design features and recommendations of MWA Environmental the following noise control measures shall be implemented at the concrete batching plant:
Location of slump stands, loading bays and cement tanker unloading points within a building with openings aside from the eastern facade being closed using fast-closing doors aside from allowance for vehicle access. Building to be constructed of concrete lower wall with Trimdek upper wall and roof construction (or other materials achieving equivalent or higher sound transmission loss). Absorptive insulation to inside faces of wall and roof to reduce reverberant noise levels.
Location of wash bays within a building with opening to the eastern façade. Building to be constructed of Trimdek (or similar) wall and roof materials (or other materials achieving equivalent or higher sound transmission loss).
Pneumatic actuators to weigh hoppers etc. are to be fitted with effective silencers.
Agitator trucks owned or contracted to Hanson shall be fitted with broadband reversing alarms and not tonal beepers.
Minimum 3 metre high acoustic barrier to the western site boundary to the north of the existing brick façade building (refer Figure 8).
Minimum 4 metre high acoustic barrier to the east of the slumping building extending at least 15 metres north from the eastern point of the building (refer Site Plan and Figure 8).
The recommended acoustic barriers and buildings/enclosures are shown on Figure 8.
MWA Environmental
Bowen Hills 14-026 10 April 2014 13
The above noise control measures have been represented in the noise modelling presented in this report.
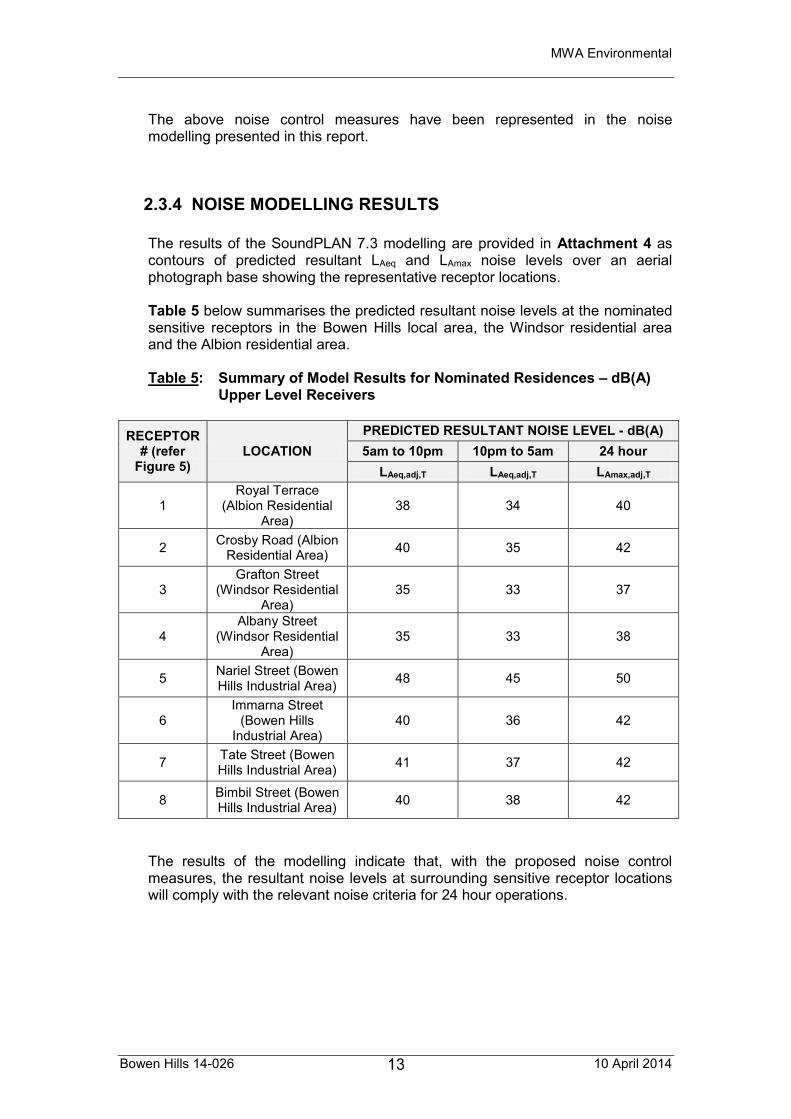
2.3.4 NOISE MODELLING RESULTS The results of the SoundPLAN 7.3 modelling are provided in Attachment 4 as contours of predicted resultant LAeq and LAmax noise levels over an aerial photograph base showing the representative receptor locations. Table 5 below summarises the predicted resultant noise levels at the nominated sensitive receptors in the Bowen Hills local area, the Windsor residential area and the Albion residential area. Table 5: Summary of Model Results for Nominated Residences – dB(A) Upper Level Receivers
RECEPTOR # (refer
Figure 5) LOCATION
PREDICTED RESULTANT NOISE LEVEL - dB(A) 5am to 10pm 10pm to 5am 24 hour
LAeq,adj,T LAeq,adj,T LAmax,adj,T
1 Royal Terrace
(Albion Residential Area)
38 34 40
2 Crosby Road (Albion Residential Area) 40 35 42
3 Grafton Street
(Windsor Residential Area)
35 33 37
4 Albany Street
(Windsor Residential Area)
35 33 38
5 Nariel Street (Bowen Hills Industrial Area) 48 45 50
6 Immarna Street
(Bowen Hills Industrial Area)
40 36 42
7 Tate Street (Bowen Hills Industrial Area) 41 37 42
8 Bimbil Street (Bowen Hills Industrial Area) 40 38 42
The results of the modelling indicate that, with the proposed noise control measures, the resultant noise levels at surrounding sensitive receptor locations will comply with the relevant noise criteria for 24 hour operations.
MWA Environmental
Bowen Hills 14-026 10 April 2014 14
3.0 DUST IMPACT ASSESSMENT
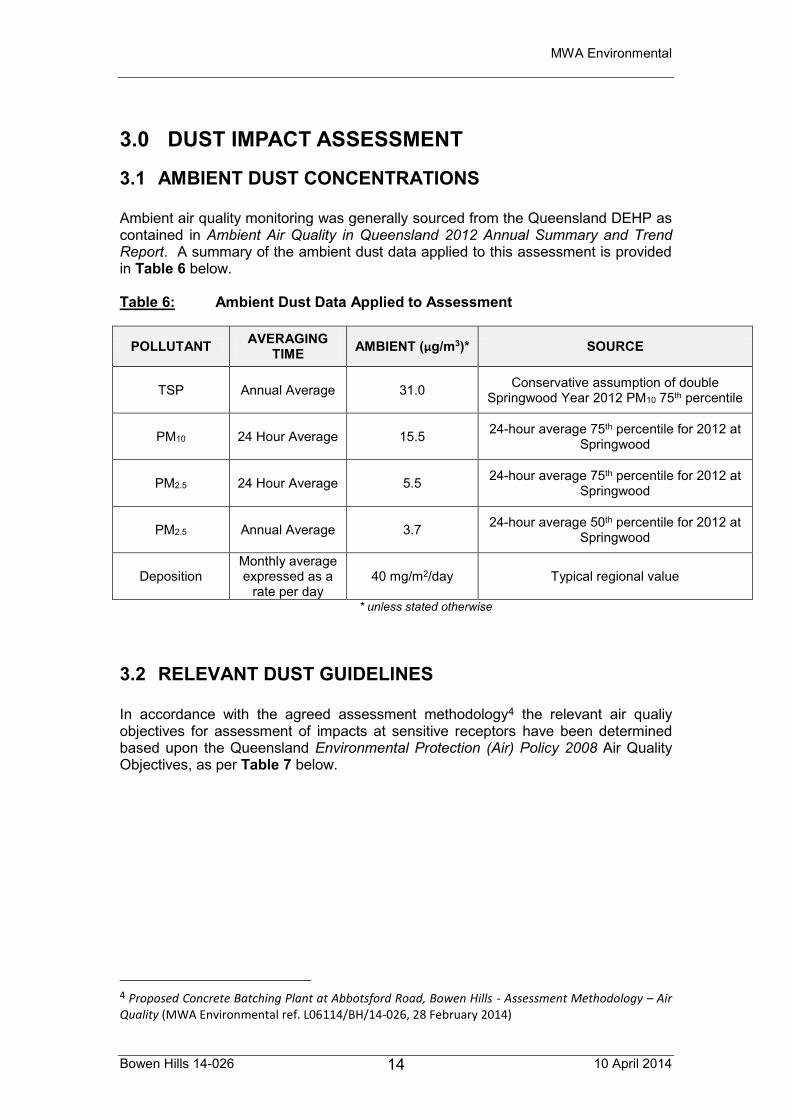
3.1 AMBIENT DUST CONCENTRATIONS Ambient air quality monitoring was generally sourced from the Queensland DEHP as contained in Ambient Air Quality in Queensland 2012 Annual Summary and Trend Report. A summary of the ambient dust data applied to this assessment is provided in Table 6 below. Table 6: Ambient Dust Data Applied to Assessment
POLLUTANT AVERAGING TIME AMBIENT (µg/m3)* SOURCE
TSP Annual Average 31.0 Conservative assumption of double Springwood Year 2012 PM10 75th percentile
PM10 24 Hour Average 15.5 24-hour average 75th percentile for 2012 at Springwood
PM2.5 24 Hour Average 5.5 24-hour average 75th percentile for 2012 at Springwood
PM2.5 Annual Average 3.7 24-hour average 50th percentile for 2012 at Springwood
Deposition Monthly average expressed as a
rate per day 40 mg/m2/day Typical regional value
* unless stated otherwise
3.2 RELEVANT DUST GUIDELINES In accordance with the agreed assessment methodology4 the relevant air qualiy objectives for assessment of impacts at sensitive receptors have been determined based upon the Queensland Environmental Protection (Air) Policy 2008 Air Quality Objectives, as per Table 7 below.
4 Proposed Concrete Batching Plant at Abbotsford Road, Bowen Hills - Assessment Methodology – Air Quality (MWA Environmental ref. L06114/BH/14-026, 28 February 2014)

MWA Environmental
Bowen Hills 14-026 10 April 2014 15
Table 7: Applicable Air Quality Objectives
POLLUTANT AVERAGING PERIOD GUIDELINE
TSP Annual Average 90 µg/m3
PM10 24 Hour Average (6th highest) 50 µg/m3
PM2.5 Annual Average 8 µg/m3
PM2.5 24 Hour Average 25 µg/m3
Dust Deposition Monthly Average 120 mg/m2/day5
3.3 DUST MODELLING
3.3.1 DUST MODELLING METHODOLOGY To enable assessment of dust concentrations and deposition rates from the proposed concrete batching plant operations at sensitive receptor locations, detailed dispersion modelling has been conducted using the regulatory approved AUSPLUME 6.0 Atmospheric Dispersion Model. The AUSPLUME model was setup to represent a 1600 metre x 1300 metre area incorporating the proposed concrete batching plant and sensitive receptors within the Bowen Hills local area, the Windsor residential area and the Albion residential area. A 50 metre grid resolution was modelled to produce contours for gridded receptors within the model domain. Terrain effects were considered within the model area. AUSPLUME defaults were used for Urban areas with a surface roughness of 0.4 based upon the land use at the locality and the proposed development and surrounding land uses. The model has been run using the meteorological data file for Brisbane, which is considered to be the DEHP meteorological data set most applicable to the subject site. Whilst the local meteorology will be slightly different, the overriding regional influences are considered appropriate for the purpose of the modelling. The model-predicted dust concentrations / deposition rates due to emissions from the proposed concrete batching plant activities were added to the ambient concentrations presented in Table 6 above to assess the cumulative dust exposure at sensitive receptors. In order to assess the potential dust deposition from the concrete batching plant it was necessary to model a particle size distribution. It is considered reasonable to apply a generalised particle size distribution for the purposes of this modelling.
5 Assessed as annual average
MWA Environmental
Bowen Hills 14-026 10 April 2014 16
The modelled particle size distribution was derived from the USEPA AP42 Appendix B.2 Generalized Particle Size Distributions6 for concrete batching. A detailed summary of the particle size distributions input to the TSP, PM10 and PM2.5 models is provided as Attachment 5.
3.3.2 RECOMMENDED DUST CONTROL MEASURES Based upon the plant design features and recommendations of MWA Environmental the following dust control measures shall be implemented at the concrete batching plant:
Aggregate and sand is to be delivered to drive-over bins and transferred directly to the bulk aggregate store building via covered conveyors.
Loading of agitator trucks to occur in an enclosure with an appropriate dust collection and filtration system
Cement and flyash storage silos will incorporate effective dust filter systems (e.g. reverse pulse bag filters) with filter medium breakthrough alarms, low level relief points and automatic cut-off and/or high level alarms to silos to prevent overfilling
The site is to be sealed and regularly cleaned to minimise silt loading and potential dust emissions from wind erosion and vehicle manoeuvring
3.3.3 DUST EMISSION SOURCES The following dust emission sources were represented as a combined area source in the AUSPLUME Dispersion Model:
Wheel generated dust from vehicle movements onsite (paved road)
Dust emissions from transfer of aggregate and sand
Cement unloading to silo
Supplement unloading to silo
Loading of agitator trucks with cement, aggregate and sand
Wind erosion from stockpiles is not an emission source for the proposed plant as there is no external storage of raw materials. Aggregate and sand is to be delivered to drive-over bins and then transferred directly to the bulk aggregate storage building (enclosed).
6 USEPA (2006) Compilation of Air Pollutant Emission Factors – Volume 1: Stationary Point and Area Sources, AP-42 Chapter 13.2.4 Aggregate Handling and Storage Piles, United States Environmental Protection Agency.
MWA Environmental
Bowen Hills 14-026 10 April 2014 17
Emissions rates for each of the above sources have been calculated using published emission factors from the following references:
NPI Emission Estimation Technique Manual for Mining v2.3, Environment Australia (2001)
USEPA AP42 Chapter 13.2.1 Paved Roads (2011)
USEPA AP42 Chapter 11.12 Concrete Batching (2006)
Emission rates are related to the production rate at the plant. Ultimately production rates are dictated by market demand. For the purposes of this assessment, the daily production rate has been based upon the historical production rates from an existing inner city Hanson plant (two loading points) and up-scaled by 50% to account for the additional loading point at the proposed plant. This is considered to be a conservative basis for the assessment of emission rates from the proposed plant. The dust emission rates have been calculated considering the proposed dust emission control measures outlined in Section 3.3.2 above: Dust emissions from site activities have been represented in the model as varying by hour of day based upon a 24 hour operational profile based upon an existing inner city Hanson plant. Detailed emission rate calculations are included as Attachment 6.
3.3.4 DUST MODELLING RESULTS Dispersion modelling has been undertaken for gridded receptors within the model domain. The gridded receptor results have been plotted using a contouring package to provide a graphical representation of the extent of dust concentrations and deposition rates, whilst discrete receptor models provide predicted concentrations at the representative sensitive receptors. A tabulated summary of the model-predicted dust concentrations and deposition rates at the representative sensitive residences (refer Figure 5) is provided in Table 8 below. The tabulated concentrations include the ambient concentrations presented in Table 6 above. Gridded receptor model results are presented in Attachment 7 as contours over an aerial photograph base. The plotted concentrations / deposition rates include the ambient concentrations specified in Table 6 above. Complete electronic model input and output files are available to DSDIP by request to [email protected]

MW
A En
viro
nmen
tal
Bow
en H
ills 1
4-02
6
10 A
pril
2014
18
Tabl
e 8:
M
odel
-Pre
dict
ed D
ust E
xpos
ure
at R
epre
sent
ativ
e Se
nsiti
ve R
ecep
tors
(inc
ludi
ng a
mbi
ent)
REC
EPTO
R
(ref
er F
igur
e 5)
PRED
ICTE
D C
ON
CEN
TRA
TIO
N (I
NC
LUD
ING
AM
BIE
NT)
- µ
g/m
3 D
UST
DEP
OSI
TIO
N
(INC
LUD
ING
AM
BIE
NT)
- m
g/m
2 /day
C
OM
PLIA
NC
E ?
TSP
(AN
NU
AL
AVE
RA
GE)
6th H
IGH
EST
PM10
(24
HR
A
VER
AG
E)
HIG
HES
T PM
2.5 (2
4 H
R
AVE
RA
GE)
PM2.
5 (A
NN
UA
L A
VER
AG
E)
DEP
OSI
TIO
N (A
NN
UA
L A
VER
AG
E)
R1
31.4
18
.3
5.5
3.7
41
YES
R2
33.6
23
.5
5.5
3.7
43.8
YE
S
R3
32.1
19
.9
5.5
3.7
42.2
YE
S
R4
32.1
21
5.
5 3.
7 41
.8
YES
R5
35.8
36
.7
5.5
3.7
46.8
YE
S
R6
38.8
38
.6
5.5
3.7
57.7
YE
S
R7
38.2
39
.6
5.5
3.7
51.8
YE
S
R8
33.9
24
5.
5 3.
7 46
.3
YES
GU
IDE
LIN
E
90
50
25
8
120
MWA Environmental
Bowen Hills 14-026 10 April 2014 19
The modelling conducted demonstrates that, with the proposed dust control measures (refer Section 3.3.2), the proposed 24 hour operation concrete batching plant will readily comply with the air quality objectives of the Queensland Environmental Protection (Air) Policy 2008 at surrounding sensitive receptors.
MWA Environmental
Bowen Hills 14-026 10 April 2014 20
5.0 CONCLUSION MWA Environmental has been engaged by Hanson Construction Materials Pty Ltd to prepare a Noise & Dust Impact Assessment for a proposed concrete batching plant at Bowen Hills. The report addresses the potential impact of noise and dust emissions from the proposed concrete batching plant activities on surrounding sensitive land uses with reference to the relevant regulatory noise limits and air quality objectives. The proposed concrete batching plant incorporates a high standard of noise and dust control. Approval is sought for the concrete batching plant to operate on a 24 hour / 7 day basis as necessary to meet market demands. Consideration has been given to sensitive receptors within the Bowen Hills local industry area, the Windsor residential area and the Albion residential area. Ambient noise monitoring and detailed computer noise modelling of the proposed concrete batching plant demonstrates that, with the proposed noise control measures, the resultant noise levels at surrounding sensitive receptor locations will comply with the relevant noise criteria for 24 hour operations. The following noise control measures shall be implemented at the concrete batching plant:
Location of slump stands, loading bays and cement tanker unloading points within a building with openings aside from the eastern facade being closed using fast-closing doors aside from allowance for vehicle access. Building to be constructed of concrete lower wall with Trimdek upper wall and roof construction (or other materials achieving equivalent or higher sound transmission loss). Absorptive insulation to inside faces of wall and roof to reduce reverberant noise levels.
Location of wash bays within a building with opening to the eastern façade. Building to be constructed of Trimdek (or similar) wall and roof materials (or other materials achieving equivalent or higher sound transmission loss).
Pneumatic actuators to weigh hoppers etc. are to be fitted with effective silencers.
Agitator trucks owned or contracted to Hanson shall be fitted with broadband reversing alarms and not tonal beepers.
Minimum 3 metre high acoustic barrier to the western site boundary to the north of the existing brick façade building (refer Figure 8).
Minimum 4 metre high acoustic barrier to the east of the slumping building extending at least 15 metres north from the eastern point of the building (refer Site Plan and Figure 8).
Detailed dust dispersion modelling of the proposed concrete batching plant demonstrates that, with the proposed dust control measures, compliance with the relevant air quality objectives can be achieved at surrounding sensitive receptors.
MWA Environmental
Bowen Hills 14-026 10 April 2014 21
The following dust control measures shall be implemented at the concrete batching plant:
Aggregate and sand is to be delivered to drive-over bins and transferred directly to the bulk aggregate store building via covered conveyors.
Loading of agitator trucks to occur in an enclosure with an appropriate dust collection and filtration system
Cement and flyash storage silos will incorporate effective dust filter systems (e.g. reverse pulse bag filters) with filter medium breakthrough alarms, low level relief points and automatic cut-off and/or high level alarms to silos to prevent overfilling
The site is to be sealed and regularly cleaned to minimise silt loading and potential dust emissions from wind erosion and vehicle manoeuvring
In summary, the noise and dust impact assessment has concluded that, with appropriate management measures and physical emission controls, the proposed 24 hour operation concrete batching plant shall not cause unreasonable amenity impacts at sensitive receptors. MWA Environmental 10 April 2014

MWA Environmental
Bowen Hills 14-026 10 April 2014
FIGURES

50
05
00
50
0
Bim
bil
St
Bim
bil
St
Bim
bil
St
Bim
bil
St
Bim
bil
St
Bim
bil
St
Bim
bil
St
Bim
bil
St
Bim
bil
St
HudsonRdHudsonRdHudsonRdHudsonRdHudsonRdHudsonRdHudsonRdHudsonRdHudsonRd
SandgateRd
SandgateRd
SandgateRd
SandgateRd
SandgateRd
SandgateRd
SandgateRd
SandgateRd
SandgateRd
Alb
ion
Overp
ass
Alb
ion
Overp
ass
Alb
ion
Overp
ass
Alb
ion
Overp
ass
Alb
ion
Overp
ass
Alb
ion
Overp
ass
Alb
ion
Overp
ass
Alb
ion
Overp
ass
Alb
ion
Overp
ass
RoyalTceRoyalTceRoyalTceRoyalTceRoyalTceRoyalTceRoyalTceRoyalTceRoyalTce
TateSt TateSt TateSt TateSt TateSt TateSt TateSt TateStTateSt
Cro
sb
yR
oad
Cro
sb
yR
oad
Cro
sb
yR
oad
Cro
sb
yR
oad
Cro
sb
yR
oad
Cro
sb
yR
oad
Cro
sb
yR
oad
Cro
sb
yR
oad
Cro
sb
yR
oad
Bo
ga
nS
tB
og
an
St
Bo
ga
nS
tB
og
an
St
Bo
ga
nS
tB
og
an
St
Bo
ga
nS
tB
og
an
St
Bo
ga
nS
t
Ped
der
St
Ped
der
St
Ped
der
St
Ped
der
St
Ped
der
St
Ped
der
St
Ped
der
St
Ped
der
St
Ped
der
St
Leg
eyt
St
Leg
eyt
St
Leg
eyt
St
Leg
eyt
St
Leg
eyt
St
Leg
eyt
St
Leg
eyt
St
Leg
eyt
St
Leg
eyt
St
Gra
nts
on
St
Gra
nts
on
St
Gra
nts
on
St
Gra
nts
on
St
Gra
nts
on
St
Gra
nts
on
St
Gra
nts
on
St
Gra
nts
on
St
Gra
nts
on
St
Cart
wri
gh
tS
tC
art
wri
gh
tS
tC
art
wri
gh
tS
t
Cart
wri
gh
tS
tC
art
wri
gh
tS
t
Cart
wri
gh
tS
tC
art
wri
gh
tS
tC
art
wri
gh
tS
tC
art
wri
gh
tS
t
LutwycheRdLutwycheRdLutwycheRdLutwycheRdLutwycheRdLutwycheRdLutwycheRdLutwycheRdLutwycheRd
McdonaldRd
McdonaldRd
McdonaldRd
McdonaldRd
McdonaldRd
McdonaldRd
McdonaldRd
McdonaldRd
McdonaldRd
So
mers
et
St
So
mers
et
St
So
mers
et
St
So
mers
et
St
So
mers
et
St
So
mers
et
St
So
mers
et
St
So
mers
et
St
So
mers
et
St
SandgaRd
SandgatRd
SandgatRd
SandgaRd
SandgatRd
SandgaRd
SandgatRd
SandgatRd
SandgatRd W
allac
eS
tW
allac
eS
tW
allac
eS
tW
allac
eS
tW
allac
eS
tW
allac
eS
tW
allac
eS
tW
allac
eS
tW
allac
eS
t
Jo
bso
nS
tJo
bso
nS
tJo
bso
nS
t
Jo
bso
nS
tJo
bso
nS
t
Jo
bso
nS
tJo
bso
nS
tJo
bso
nS
tJo
bso
nS
t
Bla
ckm
ore
St
Bla
ckm
ore
St
Bla
ckm
ore
St
Bla
ckm
ore
St
Bla
ckm
ore
St
Bla
ckm
ore
St
Bla
ckm
ore
St
Bla
ckm
ore
St
Bla
ckm
ore
St
Gra
fto
nS
tG
raft
on
St
Gra
fto
nS
tG
raft
on
St
Gra
fto
nS
tG
raft
on
St
Gra
fto
nS
tG
raft
on
St
Gra
fto
nS
t
Bo
wen
St
Bo
wen
St
Bo
wen
St
Bo
wen
St
Bo
wen
St
Bo
wen
St
Bo
wen
St
Bo
wen
St
Bo
wen
St
Inn
er
Cit
yB
yp
ass
Inn
er
Cit
yB
yp
ass
Inn
er
Cit
yB
yp
ass
Inn
er
Cit
yB
yp
ass
Inn
er
Cit
yB
yp
ass
Inn
er
Cit
yB
yp
ass
Inn
er
Cit
yB
yp
ass
Inn
er
Cit
yB
yp
ass
Inn
er
Cit
yB
yp
ass
Ta
ylo
rS
tT
ay
lor
St
Ta
ylo
rS
tT
ay
lor
St
Ta
ylo
rS
tT
ay
lor
St
Ta
ylo
rS
tT
ay
lor
St
Ta
ylo
rS
t
Burrows StBurrows StBurrows StBurrows StBurrows StBurrows StBurrows StBurrows StBurrows St
AbbotsfordRd
AbbotsfordRd
AbbotsfordRd
AbbotsfordRd
AbbotsfordRd
AbbotsfordRd
AbbotsfordRd
AbbotsfordRd
AbbotsfordRd
BRISBANE
RIV
ER
Bu
lim
ba
Alb
ion
Bo
wen
Hills
Win
dso
r
New
ste
ad
Asco
t
Alb
ion
CR
EEK
Sit
e
BREAKFAST
Max
Win
ders
&A
ssoc
iate
sP
tyLt
dta
sM
WA
Env
ironm
enta
l
0730
0255
0007
3002
5588
mai
l@m
wae
nviro
.com
.au
ww
w.m
wae
nviro
.com
.au
Leve
l15,
241
Ade
laid
eS
t,B
risba
ne.G
PO
BO
X31
37,B
risba
neQ
ld40
01
AB
N94
010
833
084
EP
F W
TIT
LE
N
DR
AW
ING
NU
MB
ER
FIG
UR
E1
JO
B
JOB
NO
.
DA
TE
SC
ALE
BO
WE
NH
ILLS
1:1
0,0
00
(A4)
14-0
26-1
14-0
26
RE
V.
GE
NE
RA
LS
ITE
LO
CA
TIO
N
0200
300m
100
SIT
EB
OU
ND
AR
Y
LE
GE
ND
DR
AW
ING
RE
FE
RE
NC
ES
-©
TH
ES
TAT
EO
FQ
UE
EN
SLA
ND
2013
QLD
GLO
BE
-G
OO
GLE
EA
RT
HP
RO
,201
2.
CLIE
NT
PR
OJE
CT
Han
son
Co
nst
ruct
ion
Mat
eria
lsP
tyL
tdc/
oG
rou
nd
wo
rkP
lus
BO
WE
NH
ILL
SN
ois
ea
nd
Du
st
Imp
ac
tA
ss
es
sm
en
tP
rop
ose
dC
on
cret
eB
atch
ing
Pla
nt
Ab
bo
tsfo
rdR
oad
Bo
wen
Hill
sQ
ld
10/0
4/1
4

Sit
e
BREAKFAST
CR
EEK
BR
ISB
AN
E
RIV
ER
CLIE
NT
PR
OJE
CT
Han
son
Co
nst
ruct
ion
Mat
eria
lsP
tyL
tdc/
oG
rou
nd
wo
rkP
lus
BO
WE
NH
ILL
SN
ois
ea
nd
Du
st
Imp
ac
tA
ss
es
sm
en
tP
rop
ose
dC
on
cret
eB
atch
ing
Pla
nt
Ab
bo
tsfo
rdR
oad
Bo
wen
Hill
sQ
ld
Max
Win
ders
&A
ssoc
iate
sP
tyLt
dta
sM
WA
Env
ironm
enta
l
0730
0255
0007
3002
5588
mai
l@m
wae
nviro
.com
.au
ww
w.m
wae
nviro
.com
.au
Leve
l15,
241
Ade
laid
eS
t,B
risba
ne.G
PO
BO
X31
37,B
risba
neQ
ld40
01
AB
N94
010
833
084
EP
F W
TIT
LE
N
DR
AW
ING
NU
MB
ER
FIG
UR
E2
JO
B
JOB
NO
.
DA
TE
SC
ALE
BO
WE
NH
ILLS
NO
TT
OS
CA
LE
14-0
26-2
14-0
26
RE
V.
BC
CP
DO
NL
INE
AR
EA
CL
AS
SIF
ICA
TIO
N
10/0
4/1
4
Sit
eC
LIE
NT
PR
OJE
CT
Han
son
Co
nst
ruct
ion
Mat
eria
lsP
tyL
tdc/
oG
rou
nd
wo
rkP
lus
BO
WE
NH
ILL
SN
ois
ea
nd
Du
st
Imp
ac
tA
ss
es
sm
en
tP
rop
ose
dC
on
cret
eB
atch
ing
Pla
nt
Ab
bo
tsfo
rdR
oad
Bo
wen
Hill
sQ
ld
Max
Win
ders
&A
ssoc
iate
sP
tyLt
dta
sM
WA
Env
ironm
enta
l
0730
0255
0007
3002
5588
mai
l@m
wae
nviro
.com
.au
ww
w.m
wae
nviro
.com
.au
Leve
l15,
241
Ade
laid
eS
t,B
risba
ne.G
PO
BO
X31
37,B
risba
neQ
ld40
01
AB
N94
010
833
084
EP
F W
TIT
LE
N
DR
AW
ING
NU
MB
ER
FIG
UR
E3
JO
B
JOB
NO
.
DA
TE
SC
ALE
BO
WE
NH
ILLS
1:4
,000
(A4)
14-0
26-3
14-0
26
RE
V.
AE
RIA
LP
HO
TO
GR
AP
HL
OC
AL
AR
EA
05
01
00
15
0m
SIT
EB
OU
ND
AR
Y
LE
GE
ND
DR
AW
ING
RE
FE
RE
NC
ES
-©
TH
ES
TAT
EO
FQ
UE
EN
SLA
ND
2013
QLD
GLO
BE
-G
OO
GLE
EA
RT
HP
RO
,201
2.
10/0
4/1
4
Sit
e
BREAKFAST
CR
EEK
BR
ISB
AN
ER
IVE
R
CLIE
NT
PR
OJE
CT
Han
son
Co
nst
ruct
ion
Mat
eria
lsP
tyL
tdc/
oG
rou
nd
wo
rkP
lus
BO
WE
NH
ILL
SN
ois
ea
nd
Du
st
Imp
ac
tA
ss
es
sm
en
tP
rop
ose
dC
on
cret
eB
atch
ing
Pla
nt
Ab
bo
tsfo
rdR
oad
Bo
wen
Hill
sQ
ld
Max
Win
ders
&A
ssoc
iate
sP
tyLt
dta
sM
WA
Env
ironm
enta
l
0730
0255
0007
3002
5588
mai
l@m
wae
nviro
.com
.au
ww
w.m
wae
nviro
.com
.au
Leve
l15,
241
Ade
laid
eS
t,B
risba
ne.G
PO
BO
X31
37,B
risba
neQ
ld40
01
AB
N94
010
833
084
EP
F W
TIT
LE
N
DR
AW
ING
NU
MB
ER
FIG
UR
E4
JO
B
JOB
NO
.
DA
TE
SC
ALE
BO
WE
NH
ILLS
1:7
,000
(A4)
14-0
26-4
14-0
26
RE
V.
AE
RIA
LP
HO
TO
GR
AP
HS
TU
DY
RE
GIO
N
SIT
EB
OU
ND
AR
Y
LE
GE
ND
DR
AW
ING
RE
FE
RE
NC
ES
-©
TH
ES
TAT
EO
FQ
UE
EN
SLA
ND
2013
QLD
GLO
BE
-G
OO
GLE
EA
RT
HP
RO
,201
2.
050
100
20
0150
25
0m
10/0
4/1
4
R3
R3
Win
dso
rR
esi
de
nti
al
-N
ort
hw
est
R3
Win
dso
rR
esi
de
nti
al
-N
ort
hw
est
R4
R4
Win
dso
rR
esi
de
nti
al
-W
est
R4
Win
dso
rR
esi
de
nti
al
-W
est
R5
R5
Na
rie
lS
tIn
du
stri
al
Are
aR
5N
ari
el
St
Ind
ust
ria
lA
rea
R6
R6
Imm
arn
aS
tIn
du
stri
al
Are
aR
6Im
ma
rna
St
Ind
ust
ria
lA
rea
R7
R7
Tate
St
Ind
ust
ria
lA
rea
R7
Tate
St
Ind
ust
ria
lA
rea
R8
R8
Bim
bil
St
Ind
ust
ria
lA
rea
R8
Bim
bil
St
Ind
ust
ria
lA
rea
R2
R2
Alb
ion
Re
sid
en
tia
l-
No
rth
R2
Alb
ion
Re
sid
en
tia
l-
No
rth
R1
R1
Alb
ion
Res
iden
tial
-Ea
stR
1A
lbio
nR
esid
enti
al-
East
Sit
e
BREAKFAST
CR
EEK
BR
ISB
AN
ER
IVE
R
CLIE
NT
PR
OJE
CT
Han
son
Co
nst
ruct
ion
Mat
eria
lsP
tyL
tdc/
oG
rou
nd
wo
rkP
lus
BO
WE
NH
ILL
SN
ois
ea
nd
Du
st
Imp
ac
tA
ss
es
sm
en
tP
rop
ose
dC
on
cret
eB
atch
ing
Pla
nt
Ab
bo
tsfo
rdR
oad
Bo
wen
Hill
sQ
ld
Max
Win
ders
&A
ssoc
iate
sP
tyLt
dta
sM
WA
Env
ironm
enta
l
0730
0255
0007
3002
5588
mai
l@m
wae
nviro
.com
.au
ww
w.m
wae
nviro
.com
.au
Leve
l15,
241
Ade
laid
eS
t,B
risba
ne.G
PO
BO
X31
37,B
risba
neQ
ld40
01
AB
N94
010
833
084
EP
F W
TIT
LE
N
DR
AW
ING
NU
MB
ER
FIG
UR
E5
JO
B
JOB
NO
.
DA
TE
SC
ALE
BO
WE
NH
ILLS
1:7
,000
(A4)
14-0
26-5
14-0
26
RE
V.
SIT
EB
OU
ND
AR
Y
LE
GE
ND
DR
AW
ING
RE
FE
RE
NC
ES
-©
TH
ES
TAT
EO
FQ
UE
EN
SLA
ND
2013
QLD
GLO
BE
-G
OO
GLE
EA
RT
HP
RO
,201
2.
050
100
20
0150
25
0m
R8 RE
PR
ES
EN
TA
TIV
ES
EN
SIT
IVE
RE
CE
PT
OR
LO
CA
TIO
NS
RE
PR
ES
EN
TA
TIV
ES
EN
SIT
IVE
RE
CE
PT
OR
LO
CA
TIO
NS
(1-8
)
10/0
4/1
4
E504100
mE
504100
mE
504100
mE
504100
m
E504150
mE
504150
mE
504150
mE
504150
m
E504200
mE
504200
mE
504200
mE
504200
m
E504250
mE
504250
mE
504250
mE
504250
m
N 6965150 mN 6965150 m N 6965150 mN 6965150 m
N 6965200 mN 6965200 m N 6965200 mN 6965200 m
N 6965250 mN 6965250 m N 6965250 mN 6965250 m
N 6965300 mN 6965300 m N 6965300 mN 6965300 m
N 6965350 mN 6965350 m N 6965350 mN 6965350 m
N 6965400 mN 6965400 m N 6965400 mN 6965400 m
Light vehicle parking (36 spaces + 1 disabled, typical dimension 2.75m x 5.8m)Light vehicle parking (36 spaces + 1 disabled, typical dimension 2.75m x 5.8m)
Existing BillboardExisting Billboard
Existing BillboardExisting Billboard
Existing 2 x 26,000L Diesel ASTExisting 2 x 26,000L Diesel AST
Existing sheet metalExisting sheet metal
fence 1.8m highfence 1.8m high
Existing rollover bundExisting rollover bund
Existing Stormwater inletExisting Stormwater inlet
Existing
Stormwater
inlet
Surcharge pitSurcharge pit
3 x Water tanks3 x Water tanks
Aggregate loading binsAggregate loading bins
Aggregate storage binsAggregate storage bins
Aggregate conveyorAggregate conveyor
3 x Water tanks3 x Water tanks
4 x Water tanks4 x Water tanks
Ramp up to aggregateRamp up to aggregate
loading arealoading area
Aggregate loading areaAggregate loading area
Ramp down from aggregate loading areaRamp down from aggregate loading area
Landscaping (to landscapeLandscaping (to landscape
architects specifications)architects specifications)
Landscaping (to landscape architects specifications)Landscaping (to landscape architects specifications)
Concrete conveyorConcrete conveyor
Existing Stormwater inletExisting Stormwater inlet
Chainlink fenceChainlink fence
Gate for aggregate supply truck exitGate for aggregate supply truck exit
Existing depot building 50m x 11mExisting depot building 50m x 11m
Existing refueling shed convertedExisting refueling shed converted
to truck wash bay 18m x 12mto truck wash bay 18m x 12m
Existing Stormwater inletExisting Stormwater inlet
Loading and slump stand building 36m x 42mLoading and slump stand building 36m x 42m
Bunded and covered admixture storageBunded and covered admixture storage
Existing Sheet metal fence 1.8m highExisting Sheet metal fence 1.8m high
Existing sheetExisting sheet
metal fencemetal fence
3 x Water tanks3 x Water tanks
Existing garage building convertedExisting garage building converted
to washout pit building 45m x 24mto washout pit building 45m x 24m
Existing Sheet metal fence 1.8m highExisting Sheet metal fence 1.8m high
Existing Sheet metal fence 3m highExisting Sheet metal fence 3m high
Existing bund around diesel storageExisting bund around diesel storage
Existing kerbExisting kerb
Existing kerbExisting kerb
Existing heavy vehicle access gateExisting heavy vehicle access gate
Conveyor waste collection systemConveyor waste collection system
Existing fuel truck access gateExisting fuel truck access gate
Existing awning to be retainedExisting awning to be retained
Existing fence replaced with concrete wall 3m highExisting fence replaced with concrete wall 3m high
1 x Water tanks1 x Water tanks
Existing fence replaced with concrete wall 3m highExisting fence replaced with concrete wall 3m high
8 x washout bays8 x washout bays
Wedge pitWedge pit
Wedge pitWedge pit
Reclaimed water storage tankReclaimed water storage tank
Reclaimed waterReclaimed water
storage tankstorage tank
2 x 7m x 4.2m roller doors2 x 7m x 4.2m roller doors
Overhead skylightsOverhead skylights
2 x 8m x 4.2m roller doors2 x 8m x 4.2m roller doors
Overhead
skylights
2 x 8m x 4.2m roller doors2 x 8m x 4.2m roller doors
Entry door toEntry door to
loading bayloading bay
Exit door fromExit door from
loading bayloading bay
Existing chain link fenceExisting chain link fence
Existing gate replacedExisting gate replaced
to accommodate heavyto accommodate heavy
vehicle exit, to trafficvehicle exit, to traffic
engineer specificationsengineer specifications
Pedestrian Access
1
2
3
4
5
6
7
8
9
10
11
12
13
1415
16
17
18
19
20
21
22
23
24
25
26
27
28
29
30 31
32
33
34
35 3637
7.9m
10.5m
10.4
10
6
2.9
1
2
3
4
5
6
7
8
9
10
11
12
13
14
15
16
17
18
19
20
21
22
23
24
Landscaping (to landscapeLandscaping (to landscape
architects specifications)architects specifications)
Acoustic BarrierAcoustic Barrier
15
Tru
ckpark
ing
15
Tru
ckpark
ing
(2 spaces, typical(2 spaces, typical
dimensions 4m x 10m)dimensions 4m x 10m)
Stairs to batch plant officeStairs to batch plant office
Truck parking (5 spaces,Truck parking (5 spaces,
typical dimensions 4m x 10m)typical dimensions 4m x 10m)
6
min 2.5m
THESE DESIGNS AND PLANS ARE COPYRIGHT AND ARE NOT TO BE USED OR REPRODUCED
WHOLLY OR IN PART OR TO BE USED ON ANY PROJECT WITHOUT THE WRITTEN PERMISSION OF
GROUNDWORK PLUS. ABN: 80 829 145 906
DATEREV DESCRIPTION BY
CLIENT:
PROJECT: TITLE:
DRAWING NUMBER:SCALE:
DRAWN:
0When Printed On A3
DATUM: HORIZONTAL / VERTICAL / ZONE
REVISION:
CHECKED:
Photography:Topography:
Cadastre:Ecosystem:
Other:
/ /
9A
pril2014
9A
pril2014
CR
EA
TE
D:
PRINTED:
9 April 2014
9 April 2014
Ph: +61 7 3871 0411Ph: +61 7 3871 0411
www.groundwork.com.au
F:\Jobs\1
700\1
713
Hanson_B
ow
enH
ills\0
00
Generic\D
raw
ings\1
713_007r2
_deta
iled-s
ite-p
lan.d
wg
F:\Jobs\1
700\1
713
Hanson_B
ow
enH
ills\0
00
Generic\D
raw
ings\1
713_007r2
_deta
iled-s
ite-p
lan.d
wg
FIL
EN
AM
E:
FIL
EN
AM
E:
JO
BS
UB
#:
JO
BS
UB
#:
Detailed Site LayoutDetailed Site Layout
Hanson Construction MaterialsPty Ltd
Bowen Hills ConcreteBatching Plant
LT
1:750
Batching Plant
LT
1:75015
MGA 56
Legend:
15
MGA 56
Legend:Site BoundarySite Boundary
1 Changes to design based on new survey info and traffic eng input 07/04/14 LT
2 Revising landscaping and truck parking in north east corner 09/04/14 LT
14-026-6
FIGURE 6Max Winders & Associates Pty Ltd tas MWA EnvironmentalLevel 15, 241 Adelaide St, Brisbane. GPO BOX 3137, Brisbane Qld 4001
07 3002 5500 07 3002 5588 [email protected]
E
ABN 94 010 833 084
P FW
CLIENT
PROJECT TITLE
DRAWING NUMBER
GENERAL SITE LAYOUT
Hanson Construction Materials Pty Ltd c/o Groundwork Plus
DRAWING REFERENCEGroundwork Plus
JOB
JOB NO.
DATE
SCALE
14-026
10/04/14
1:1200 (A4)
BOWEN HILLS
BOWEN HILLSNoise and Dust Impact Assessment
Proposed Concrete Batching Plant - Abbotsford Road Bowen Hills Qld

2
1
3A
lbio
nR
esi
de
nti
al
Are
aN
ois
eLo
gg
er
Alb
ion
Re
sid
en
tia
lA
rea
No
ise
Log
ge
r
Sit
e
Win
dso
rR
esi
de
nti
al
Are
aN
ois
eLo
gg
er
Win
dso
rR
esi
de
nti
al
Are
aN
ois
eLo
gg
er
Sit
eN
ois
eLo
gg
er
Sit
eN
ois
eLo
gg
er
BREAKFAST
CR
EEK
BR
ISB
AN
ER
IVE
R
CLIE
NT
PR
OJE
CT
Han
son
Co
nst
ruct
ion
Mat
eria
lsP
tyL
tdc/
oG
rou
nd
wo
rkP
lus
BO
WE
NH
ILL
SN
ois
ea
nd
Du
st
Imp
ac
tA
ss
es
sm
en
tP
rop
ose
dC
on
cret
eB
atch
ing
Pla
nt
Ab
bo
tsfo
rdR
oad
Bo
wen
Hill
sQ
ld
Max
Win
ders
&A
ssoc
iate
sP
tyLt
dta
sM
WA
Env
ironm
enta
l
0730
0255
0007
3002
5588
mai
l@m
wae
nviro
.com
.au
ww
w.m
wae
nviro
.com
.au
Leve
l15,
241
Ade
laid
eS
t,B
risba
ne.G
PO
BO
X31
37,B
risba
neQ
ld40
01
AB
N94
010
833
084
EP
F W
TIT
LE
N
DR
AW
ING
NU
MB
ER
FIG
UR
E7
JO
B
JOB
NO
.
DA
TE
SC
ALE
BO
WE
NH
ILLS
1:7
,000
(A4)
14-0
26-7
14-0
26
10/0
4/1
4
RE
V.
SIT
EB
OU
ND
AR
Y
LE
GE
ND
DR
AW
ING
RE
FE
RE
NC
ES
-©
TH
ES
TAT
EO
FQ
UE
EN
SLA
ND
2013
QLD
GLO
BE
-G
OO
GLE
EA
RT
HP
RO
,201
2.
050
100
20
0150
25
0m
3
NO
ISE
MO
NIT
OR
ING
LO
CA
TIO
NS
NO
ISE
DA
TA
LO
GG
ER
LO
CA
TIO
NS
(1-3
)
MWA Environmental
Bowen Hills 14-026 10 April 2014
ATTACHMENT 1
Summary of Noise Monitoring Data
Bowen Hills Industrial Area (subject site) Albion Residential Area (Royal Terrace)
Windsor Residential Area (Bowen Street)
BOWEN HILLS LOCAL AREA

0.0
1.0
2.0
3.0
4.0
5.0
6.0
7.0
8.0
9.0
10.0
354045505560657075
0:15
1:15
2:15
3:15
4:15
5:15
6:15
7:15
8:15
9:15
10:15
11:15
12:15
13:15
14:15
15:15
16:15
17:15
18:15
19:15
20:15
21:15
22:15
23:15
Rainfall (mm) and Wind Speeds (m/s)
SPL -dB(A)
Tim
e of
Day
Rec
orde
d St
atis
tical
Noi
se L
evel
s fo
r Bow
en H
ills
14-0
26 -
Abbo
tsfo
rd R
oad
Site
-24
-Feb
-201
4 -
Mon
day
BoM
Bris
bane
Rai
nfal
lBo
M B
risba
ne W
ind
Spee
ds >
5m
/sL1
L10
L90
Leq
0.0
1.0
2.0
3.0
4.0
5.0
6.0
7.0
8.0
9.0
10.0
354045505560657075
0:15
1:15
2:15
3:15
4:15
5:15
6:15
7:15
8:15
9:15
10:15
11:15
12:15
13:15
14:15
15:15
16:15
17:15
18:15
19:15
20:15
21:15
22:15
23:15
Rainfall (mm) and Wind Speeds (m/s)
SPL -dB(A)
Tim
e of
Day
Rec
orde
d St
atis
tical
Noi
se L
evel
s fo
r Bow
en H
ills
14-0
26 -
Abbo
tsfo
rd R
oad
Site
-25
-Feb
-201
4 -
Tues
day
BoM
Bris
bane
Rai
nfal
lBo
M B
risba
ne W
ind
Spee
ds >
5m
/sL1
L10
L90
Leq
0.0
1.0
2.0
3.0
4.0
5.0
6.0
7.0
8.0
9.0
10.0
354045505560657075
0:15
1:15
2:15
3:15
4:15
5:15
6:15
7:15
8:15
9:15
10:15
11:15
12:15
13:15
14:15
15:15
16:15
17:15
18:15
19:15
20:15
21:15
22:15
23:15
Rainfall (mm) and Wind Speeds (m/s)
SPL -dB(A)
Tim
e of
Day
Rec
orde
d St
atis
tical
Noi
se L
evel
s fo
r Bow
en H
ills
14-0
26 -
Abbo
tsfo
rd R
oad
Site
-26
-Feb
-201
4 -
Wed
nesd
ay
BoM
Bris
bane
Rai
nfal
lBo
M B
risba
ne W
ind
Spee
ds >
5m
/sL1
L10
L90
Leq

0.0
1.0
2.0
3.0
4.0
5.0
6.0
7.0
8.0
9.0
10.0
354045505560657075
0:15
1:15
2:15
3:15
4:15
5:15
6:15
7:15
8:15
9:15
10:15
11:15
12:15
13:15
14:15
15:15
16:15
17:15
18:15
19:15
20:15
21:15
22:15
23:15
Rainfall (mm) and Wind Speeds (m/s)
SPL -dB(A)
Tim
e of
Day
Rec
orde
d St
atis
tical
Noi
se L
evel
s fo
r Bow
en H
ills
14-0
26 -
Abbo
tsfo
rd R
oad
Site
-27
-Feb
-201
4 -
Thur
sday
BoM
Bris
bane
Rai
nfal
lBo
M B
risba
ne W
ind
Spee
ds >
5m
/sL1
L10
L90
Leq

0.0
1.0
2.0
3.0
4.0
5.0
6.0
7.0
8.0
9.0
10.0
354045505560657075
0:15
1:15
2:15
3:15
4:15
5:15
6:15
7:15
8:15
9:15
10:15
11:15
12:15
13:15
14:15
15:15
16:15
17:15
18:15
19:15
20:15
21:15
22:15
23:15
Rainfall (mm) and Wind Speeds (m/s)
SPL -dB(A)
Tim
e of
Day
Rec
orde
d St
atis
tical
Noi
se L
evel
s fo
r Bow
en H
ills
14-0
26 -
Abbo
tsfo
rd R
oad
Site
-28
-Feb
-201
4 -
Frid
ay
BoM
Bris
bane
Rai
nfal
lBo
M B
risba
ne W
ind
Spee
ds >
5m
/sL1
L10
L90
Leq

0.0
1.0
2.0
3.0
4.0
5.0
6.0
7.0
8.0
9.0
10.0
354045505560657075
0:15
1:15
2:15
3:15
4:15
5:15
6:15
7:15
8:15
9:15
10:15
11:15
12:15
13:15
14:15
15:15
16:15
17:15
18:15
19:15
20:15
21:15
22:15
23:15
Rainfall (mm) and Wind Speeds (m/s)
SPL -dB(A)
Tim
e of
Day
Rec
orde
d St
atis
tical
Noi
se L
evel
s fo
r Bow
en H
ills
14-0
26 -
Abbo
tsfo
rd R
oad
Site
-01
-Mar
-201
4 -
Satu
rday
BoM
Bris
bane
Rai
nfal
lBo
M B
risba
ne W
ind
Spee
ds >
5m
/sL1
L10
L90
Leq

0.0
1.0
2.0
3.0
4.0
5.0
6.0
7.0
8.0
9.0
10.0
354045505560657075
0:15
1:15
2:15
3:15
4:15
5:15
6:15
7:15
8:15
9:15
10:15
11:15
12:15
13:15
14:15
15:15
16:15
17:15
18:15
19:15
20:15
21:15
22:15
23:15
Rainfall (mm) and Wind Speeds (m/s)
SPL -dB(A)
Tim
e of
Day
Rec
orde
d St
atis
tical
Noi
se L
evel
s fo
r Bow
en H
ills
14-0
26 -
Abbo
tsfo
rd R
oad
Site
-02
-Mar
-201
4 -
Sund
ay
BoM
Bris
bane
Rai
nfal
lBo
M B
risba
ne W
ind
Spee
ds >
5m
/sL1
L10
L90
Leq

0.0
1.0
2.0
3.0
4.0
5.0
6.0
7.0
8.0
9.0
10.0
354045505560657075
0:15
1:15
2:15
3:15
4:15
5:15
6:15
7:15
8:15
9:15
10:15
11:15
12:15
13:15
14:15
15:15
16:15
17:15
18:15
19:15
20:15
21:15
22:15
23:15
Rainfall (mm) and Wind Speeds (m/s)
SPL -dB(A)
Tim
e of
Day
Rec
orde
d St
atis
tical
Noi
se L
evel
s fo
r Bow
en H
ills
14-0
26 -
Abbo
tsfo
rd R
oad
Site
-03
-Mar
-201
4 -
Mon
day
BoM
Bris
bane
Rai
nfal
lBo
M B
risba
ne W
ind
Spee
ds >
5m
/sL1
L10
L90
Leq
ALBION RESIDENTIAL AREA
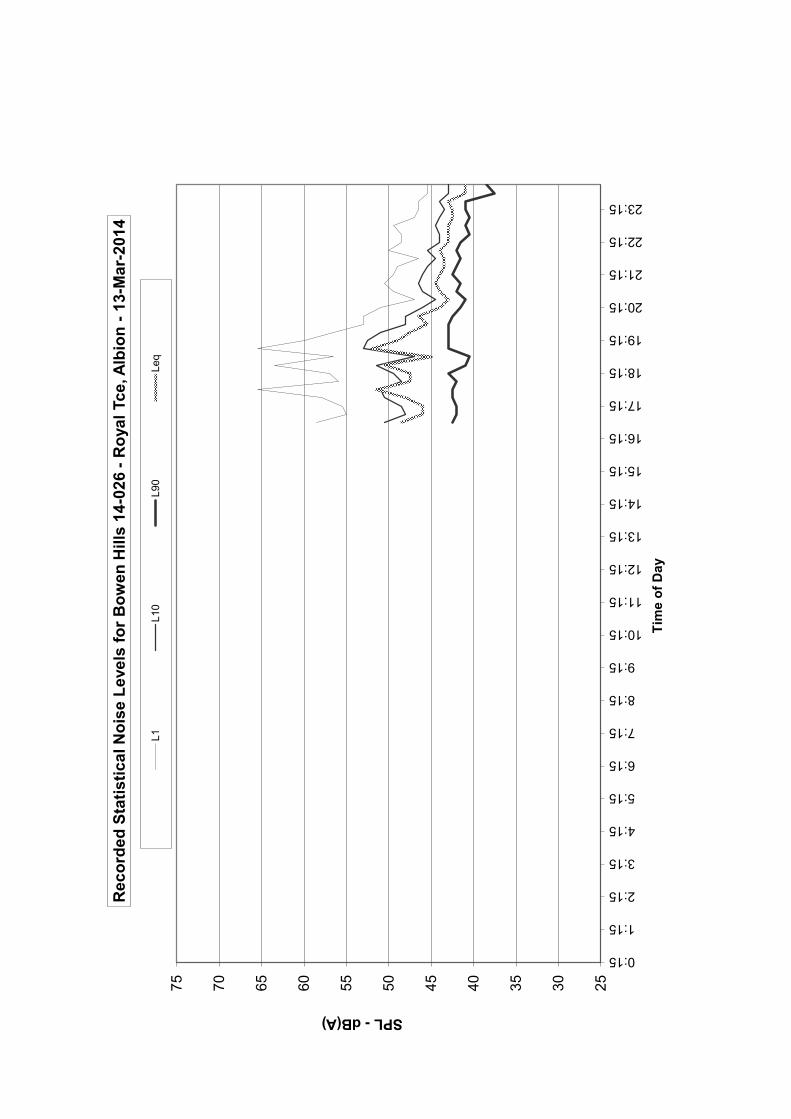
25303540455055606570750:15
1:15
2:15
3:15
4:15
5:15
6:15
7:15
8:15
9:15
10:15
11:15
12:15
13:15
14:15
15:15
16:15
17:15
18:15
19:15
20:15
21:15
22:15
23:15
SPL - dB(A)
Tim
e of
Day
Rec
orde
d St
atis
tical
Noi
se L
evel
s fo
r Bow
en H
ills
14-0
26 -
Roy
al T
ce, A
lbio
n - 1
3-M
ar-2
014
L1L1
0L9
0Le
q

25303540455055606570750:15
1:15
2:15
3:15
4:15
5:15
6:15
7:15
8:15
9:15
10:15
11:15
12:15
13:15
14:15
15:15
16:15
17:15
18:15
19:15
20:15
21:15
22:15
23:15
SPL - dB(A)
Tim
e of
Day
Rec
orde
d St
atis
tical
Noi
se L
evel
s fo
r Bow
en H
ills
14-0
26 -
Roy
al T
ce, A
lbio
n - 1
4-M
ar-2
014
L1L1
0L9
0Le
q

WINDSOR RESIDENTIAL AREA
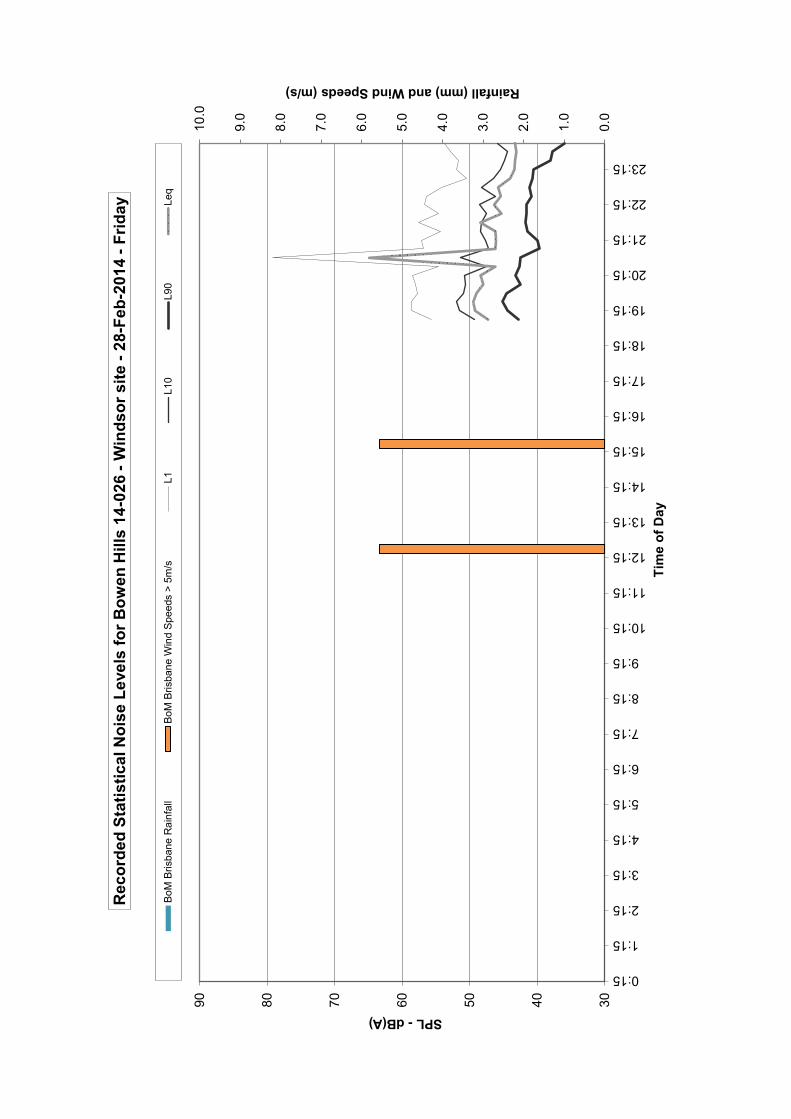
0.0
1.0
2.0
3.0
4.0
5.0
6.0
7.0
8.0
9.0
10.0
30405060708090
0:15
1:15
2:15
3:15
4:15
5:15
6:15
7:15
8:15
9:15
10:15
11:15
12:15
13:15
14:15
15:15
16:15
17:15
18:15
19:15
20:15
21:15
22:15
23:15
Rainfall (mm) and Wind Speeds (m/s)
SPL -dB(A)
Tim
e of
Day
Rec
orde
d St
atis
tical
Noi
se L
evel
s fo
r Bow
en H
ills
14-0
26 -
Win
dsor
site
-28
-Feb
-201
4 -F
riday
BoM
Bris
bane
Rai
nfal
lBo
M B
risba
ne W
ind
Spee
ds >
5m
/sL1
L10
L90
Leq

0.0
1.0
2.0
3.0
4.0
5.0
6.0
7.0
8.0
9.0
10.0
30405060708090
0:15
1:15
2:15
3:15
4:15
5:15
6:15
7:15
8:15
9:15
10:15
11:15
12:15
13:15
14:15
15:15
16:15
17:15
18:15
19:15
20:15
21:15
22:15
23:15
Rainfall (mm) and Wind Speeds (m/s)
SPL -dB(A)
Tim
e of
Day
Rec
orde
d St
atis
tical
Noi
se L
evel
s fo
r Bow
en H
ills
14-0
26 -
Win
dsor
site
-01
-Mar
-201
4 -S
atur
day
BoM
Bris
bane
Rai
nfal
lBo
M B
risba
ne W
ind
Spee
ds >
5m
/sL1
L10
L90
Leq

0.0
1.0
2.0
3.0
4.0
5.0
6.0
7.0
8.0
9.0
10.0
30405060708090
0:15
1:15
2:15
3:15
4:15
5:15
6:15
7:15
8:15
9:15
10:15
11:15
12:15
13:15
14:15
15:15
16:15
17:15
18:15
19:15
20:15
21:15
22:15
23:15
Rainfall (mm) and Wind Speeds (m/s)
SPL -dB(A)
Tim
e of
Day
Rec
orde
d St
atis
tical
Noi
se L
evel
s fo
r Bow
en H
ills
14-0
26 -
Win
dsor
site
-02
-Mar
-201
4 -S
unda
y
BoM
Bris
bane
Rai
nfal
lBo
M B
risba
ne W
ind
Spee
ds >
5m
/sL1
L10
L90
Leq
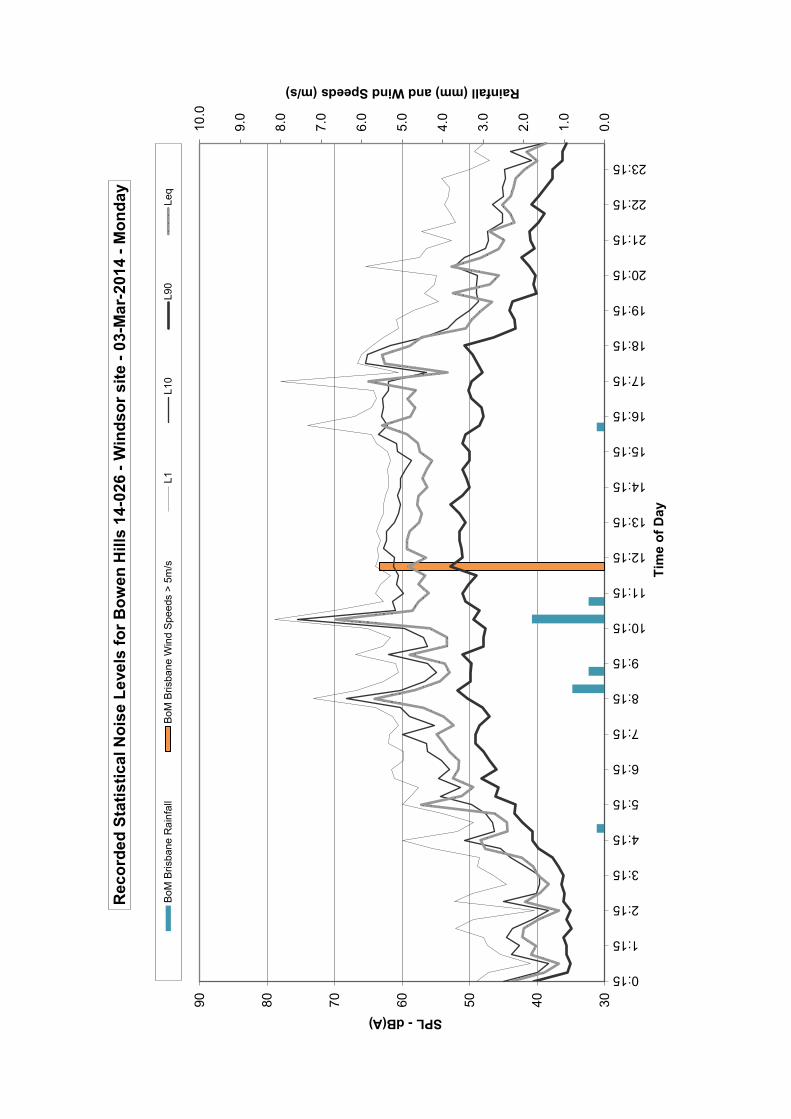
0.0
1.0
2.0
3.0
4.0
5.0
6.0
7.0
8.0
9.0
10.0
30405060708090
0:15
1:15
2:15
3:15
4:15
5:15
6:15
7:15
8:15
9:15
10:15
11:15
12:15
13:15
14:15
15:15
16:15
17:15
18:15
19:15
20:15
21:15
22:15
23:15
Rainfall (mm) and Wind Speeds (m/s)
SPL -dB(A)
Tim
e of
Day
Rec
orde
d St
atis
tical
Noi
se L
evel
s fo
r Bow
en H
ills
14-0
26 -
Win
dsor
site
-03
-Mar
-201
4 -M
onda
y
BoM
Bris
bane
Rai
nfal
lBo
M B
risba
ne W
ind
Spee
ds >
5m
/sL1
L10
L90
Leq
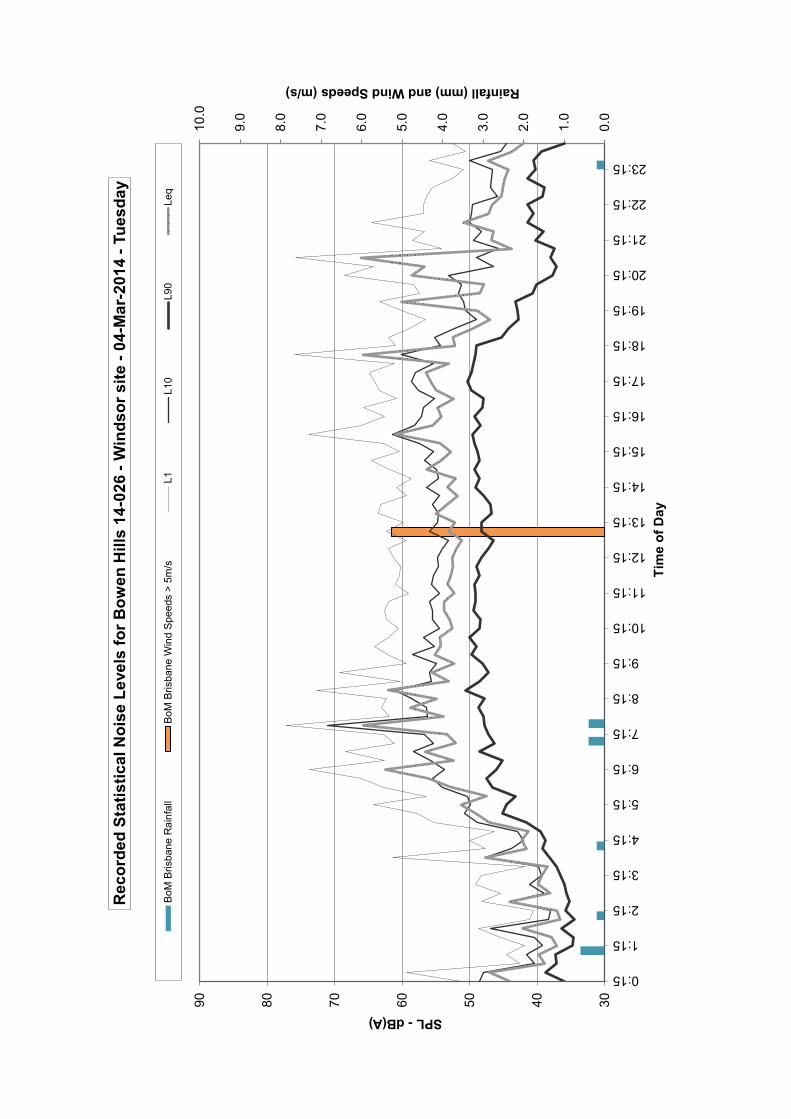
0.0
1.0
2.0
3.0
4.0
5.0
6.0
7.0
8.0
9.0
10.0
30405060708090
0:15
1:15
2:15
3:15
4:15
5:15
6:15
7:15
8:15
9:15
10:15
11:15
12:15
13:15
14:15
15:15
16:15
17:15
18:15
19:15
20:15
21:15
22:15
23:15
Rainfall (mm) and Wind Speeds (m/s)
SPL -dB(A)
Tim
e of
Day
Rec
orde
d St
atis
tical
Noi
se L
evel
s fo
r Bow
en H
ills
14-0
26 -
Win
dsor
site
-04
-Mar
-201
4 -T
uesd
ay
BoM
Bris
bane
Rai
nfal
lBo
M B
risba
ne W
ind
Spee
ds >
5m
/sL1
L10
L90
Leq

0.0
1.0
2.0
3.0
4.0
5.0
6.0
7.0
8.0
9.0
10.0
30405060708090
0:15
1:15
2:15
3:15
4:15
5:15
6:15
7:15
8:15
9:15
10:15
11:15
12:15
13:15
14:15
15:15
16:15
17:15
18:15
19:15
20:15
21:15
22:15
23:15
Rainfall (mm) and Wind Speeds (m/s)
SPL -dB(A)
Tim
e of
Day
Rec
orde
d St
atis
tical
Noi
se L
evel
s fo
r Bow
en H
ills
14-0
26 -
Win
dsor
site
-05
-Mar
-201
4 -W
edne
sday
BoM
Bris
bane
Rai
nfal
lBo
M B
risba
ne W
ind
Spee
ds >
5m
/sL1
L10
L90
Leq

0.0
1.0
2.0
3.0
4.0
5.0
6.0
7.0
8.0
9.0
10.0
30405060708090
0:15
1:15
2:15
3:15
4:15
5:15
6:15
7:15
8:15
9:15
10:15
11:15
12:15
13:15
14:15
15:15
16:15
17:15
18:15
19:15
20:15
21:15
22:15
23:15
Rainfall (mm) and Wind Speeds (m/s)
SPL -dB(A)
Tim
e of
Day
Rec
orde
d St
atis
tical
Noi
se L
evel
s fo
r Bow
en H
ills
14-0
26 -
Win
dsor
site
-06
-Mar
-201
4 -T
hurs
day
BoM
Bris
bane
Rai
nfal
lBo
M B
risba
ne W
ind
Spee
ds >
5m
/sL1
L10
L90
Leq

0.0
1.0
2.0
3.0
4.0
5.0
6.0
7.0
8.0
9.0
10.0
30405060708090
0:15
1:15
2:15
3:15
4:15
5:15
6:15
7:15
8:15
9:15
10:15
11:15
12:15
13:15
14:15
15:15
16:15
17:15
18:15
19:15
20:15
21:15
22:15
23:15
Rainfall (mm) and Wind Speeds (m/s)
SPL -dB(A)
Tim
e of
Day
Rec
orde
d St
atis
tical
Noi
se L
evel
s fo
r Bow
en H
ills
14-0
26 -
Win
dsor
site
-07
-Mar
-201
4 -F
riday
BoM
Bris
bane
Rai
nfal
lBo
M B
risba
ne W
ind
Spee
ds >
5m
/sL1
L10
L90
Leq
MWA Environmental
Bowen Hills 14-026 10 April 2014
ATTACHMENT 2
Assessment of Tonality and Impulsiveness
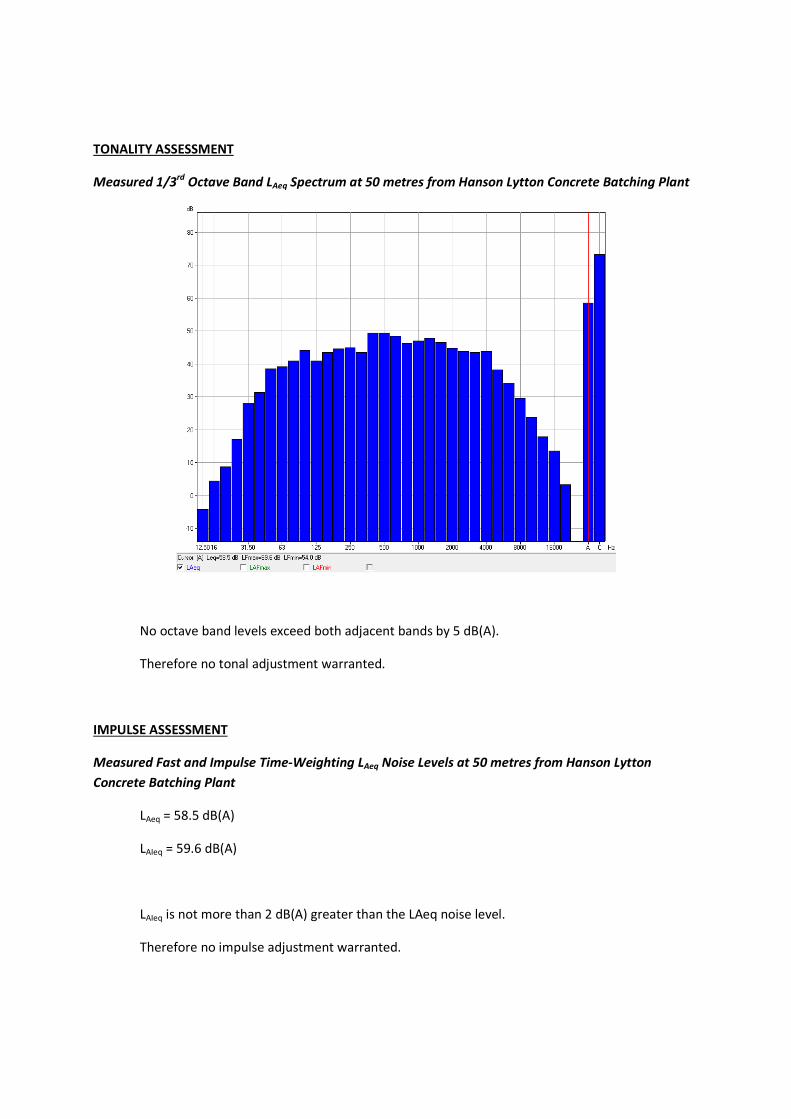
TONALITY ASSESSMENT
Measured 1/3rd
Octave Band LAeq Spectrum at 50 metres from Hanson Lytton Concrete Batching Plant
No octave band levels exceed both adjacent bands by 5 dB(A).
Therefore no tonal adjustment warranted.
IMPULSE ASSESSMENT
Measured Fast and Impulse Time-Weighting LAeq Noise Levels at 50 metres from Hanson Lytton
Concrete Batching Plant
LAeq = 58.5 dB(A)
LAIeq = 59.6 dB(A)
LAIeq is not more than 2 dB(A) greater than the LAeq noise level.
Therefore no impulse adjustment warranted.

MWA Environmental
Bowen Hills 14-026 10 April 2014
ATTACHMENT 3
SoundPlan 7.3
Model Layout Plans Sound Power Level Data

Silo
Filt
er
A
Silo
Filt
er
B
Silo
Filt
er
C
Silo
Filt
er
DB
atc
h B
uild
ing
Exh
au
st
Fa
n
De
live
ry C
on
ve
yor
Sys
tem
Agitato
r Tru
cks -
60 vp
h - Segm
ent 1
Agita
tor T
ruck
s - 6
0 vp
h - S
egm
ent 2
Cement Flyash Trucks - 4vph
Agg and Sand Trucks - 7vph
Ba
tch
AB
atc
h B
Ba
tch
C
Ce
me
nt
De
live
ry A
Ce
me
nt
De
live
ry B
Slu
mp
A
Slu
mp
B
Slu
mp
C
Slu
mp
D
Slu
mp
E
Slu
mp
F
Tru
ck W
ash
ou
t 1
Tru
ck W
ash
ou
t 2
Le
ng
th s
ca
le 1
:12
50
05
10
20
30
40 m
Bo
we
n H
ills
14
-02
6
Pe
ak
Op
era
tio
ns
5a
m t
o 1
0p
m
So
urc
e L
ayo
ut
Ap
ril
20
14
Le
ge
nd Cadastr
al
Poin
t sourc
e
Lin
e s
ourc
e
Are
a s
ourc
e
Build
ing
Acoustic B
arr
ier
Industr
ial build
ing
Poin
t re
ceiv
er
Slu
mp
Bu
ild
ing
So
urce
Wash
ou
t B
uild
ing
So
urce

No.
Ele
ment
nam
eU
nit
31.5
63
125
250
500
12
48
16
Sum
Hz
Hz
Hz
Hz
Hz
kH
zkH
zkH
zkH
zkH
z
1W
ashout
SW
LdB
(A)/
unit
46.8
71.4
70.8
78.1
86.3
95.3
94.9
89.1
83.0
69.4
106.9
56.9
68.0
75.4
81.3
103.5
98.7
96.1
88.4
79.3
64.3
57.8
78.1
84.5
81.4
91.6
94.1
92.3
85.8
73.7
56.3
14
Slu
mp
SW
LdB
(A)/
unit
47.4
69.4
77.1
83.9
92.7
96.8
99.7
96.1
88.7
74.6
109.4
57.3
74.8
82.0
89.3
102.5
101.0
97.6
94.0
84.8
70.0
59.7
81.8
83.9
86.0
96.8
101.5
97.4
90.9
79.7
64.7
15
Batc
hin
g T
ruck
SW
LdB
(A)/
unit
55.6
77.6
82.0
93.3
101.7
105.7
104.4
102.4
96.0
82.8
116.0
62.8
76.2
87.5
101.8
109.1
106.0
107.6
100.0
92.2
76.2
66.5
84.0
90.2
99.2
104.4
104.0
103.1
97.8
88.1
69.1
16
Agg S
tore
Base I
nt
Level
Indo
or S
PL
dB
(A)/
level
25.1
59.1
54.2
59.3
63.6
67.0
69.3
71.4
80.1
70.3
86.6
38.7
46.6
52.6
59.8
66.9
67.8
70.9
74.0
75.1
66.0
45.4
50.5
57.3
62.8
67.3
68.9
70.9
82.2
74.7
62.1
17
Agg S
tore
Top I
nt
Level
Indo
or S
PL
dB(A
)/le
vel
12.2
25.9
35.5
51.3
56.8
59.9
63.2
73.2
81.3
75.6
87.7
18.5
28.9
40.5
54.0
59.5
60.3
66.7
76.1
81.6
69.3
23.3
33.3
47.3
56.5
61.5
61.3
70.0
79.1
79.7
60.7
19
Exh
aust
Fan
SW
LdB
(A)/
unit
38.5
75.0
76.6
80.8
95.2
93.7
93.7
86.5
77.7
64.5
102.9
42.9
62.4
75.3
83.9
93.9
92.3
90.3
84.2
74.0
58.7
56.5
68.5
77.2
86.2
91.5
92.8
89.4
80.9
69.5
52.8
20
Drive O
ver
Bin
Outloadin
gS
WL
dB
(A)/
unit
44.8
75.1
76.0
79.3
87.7
92.1
90.2
87.6
91.0
84.6
102.5
49.9
63.6
72.2
81.8
91.2
91.4
88.5
88.4
89.9
79.1
66.2
72.0
79.9
85.4
94.4
91.1
87.9
90.3
88.1
72.0
23
Batc
h B
uild
ing I
nte
rnal
Indo
or S
PL
dB(A
)/le
vel
29.3
52.4
59.4
63.8
71.3
74.6
74.1
75.3
73.1
65.4
86.1
34.2
43.3
62.0
70.0
75.0
74.4
75.4
74.1
71.9
59.5
46.3
50.8
60.1
70.2
74.2
74.0
75.7
73.2
69.4
52.2
24
Bag F
ilter
Fan
SW
LdB
(A)/
unit
52.8
62.9
69.4
79.8
80.0
77.2
69.0
60.9
84.3
25
Unlo
adin
g B
ulk
Cem
ent
- T
ruck M
ount
SW
L dB
/unit
89.7
94.7
102.7
102.7
100.7
99.7
100.7
95.7
90.7
109.0
Max
Win
ders
& A
ssocia
tes P
ty L
td
GP
O B
ox
3137
Brisbane Q
LD
4000
AU
ST
RA
LIA
1 /
1
So
un
dP
LA
N 7
.3
MWA Environmental
Bowen Hills 14-026 10 April 2014
ATTACHMENT 4
SoundPlan 7.3
Predicted Noise Contour Plots
5am to 10pm Peak Operations LAeq 10pm to 5am Night Operations LAeq
LAmax

R5
Na
rie
l S
tre
et
Ind
us
tria
l A
rea
R6
Im
ma
rna
St
Ind
us
tria
l A
rea
R7
Ta
te S
tre
et
Ind
us
tria
l A
rea
R8
Bim
bil S
t In
du
str
ial A
rea
R4
Win
ds
or
Re
sid
en
tia
l -
We
st
R2
Alb
ion
Re
sid
en
tia
l -
No
rth
R3
Win
ds
or
Re
sid
en
tia
l -
No
rth
we
st
R1
Alb
ion
Re
sid
en
tia
l -
Ea
stNo
ise
le
ve
l
LA
eq,T
in d
B(A
)
=33
=36
=39
=42
=45
=48
=51
=54
Le
ng
th s
ca
le 1
:65
00
030
60
120
180
240 m
Bo
we
n H
ills
14
-02
6
Pe
ak
Op
era
tio
ns
5a
m t
o 1
0p
m
All
So
urc
es
Op
era
tin
g
Ma
rc
h 2
01
4
Le
ge
nd Cadastr
al
Poin
t sourc
e
Lin
e s
ourc
e
Are
a s
ourc
e
Build
ing
Acoustic B
arr
ier
Industr
ial build
ing
Poin
t re
ceiv
er
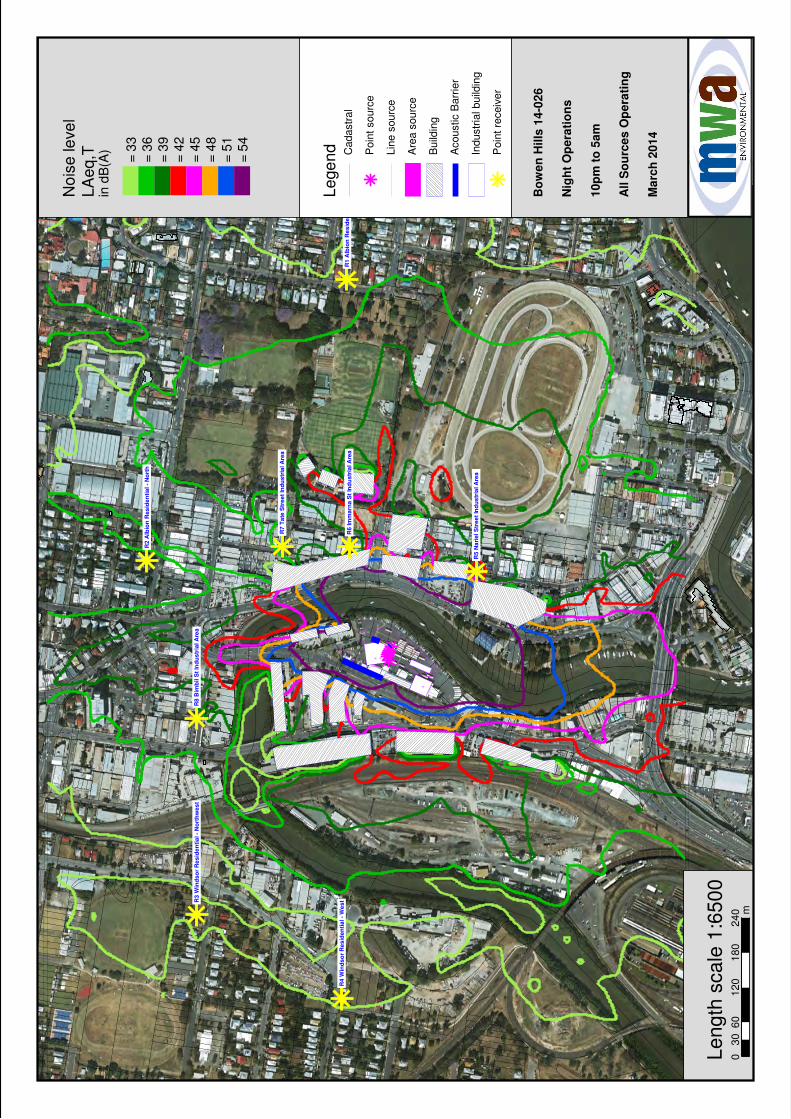
R5
Na
rie
l S
tre
et
Ind
us
tria
l A
rea
R6
Im
ma
rna
St
Ind
us
tria
l A
rea
R7
Ta
te S
tre
et
Ind
us
tria
l A
rea
R8
Bim
bil S
t In
du
str
ial A
rea
R4
Win
ds
or
Re
sid
en
tia
l -
We
st
R2
Alb
ion
Re
sid
en
tia
l -
No
rth
R3
Win
ds
or
Re
sid
en
tia
l -
No
rth
we
st
R1
Alb
ion
Re
sid
en
tia
l -
Ea
stNo
ise
le
ve
l
LA
eq,T
in d
B(A
)
=33
=36
=39
=42
=45
=48
=51
=54
Le
ng
th s
ca
le 1
:65
00
030
60
120
180
240 m
Bo
we
n H
ills
14
-02
6
Nig
ht
Op
era
tio
ns
10
pm
to
5a
m
All
So
urc
es
Op
era
tin
g
Ma
rc
h 2
01
4
Le
ge
nd Cadastr
al
Poin
t sourc
e
Lin
e s
ourc
e
Are
a s
ourc
e
Build
ing
Acoustic B
arr
ier
Industr
ial build
ing
Poin
t re
ceiv
er

R5
Na
rie
l S
tre
et
Ind
us
tria
l A
rea
R6
Im
ma
rna
St
Ind
us
tria
l A
rea
R7
Ta
te S
tre
et
Ind
us
tria
l A
rea
R8
Bim
bil S
t In
du
str
ial A
rea
R4
Win
ds
or
Re
sid
en
tia
l -
We
st
R2
Alb
ion
Re
sid
en
tia
l -
No
rth
R3
Win
ds
or
Re
sid
en
tia
l -
No
rth
we
st
R1
Alb
ion
Re
sid
en
tia
l -
Ea
stNo
ise
le
ve
l
LA
ma
x,T
in d
B(A
)
=37
=40
=43
=46
=49
=52
=55
=58
Le
ng
th s
ca
le 1
:65
00
030
60
120
180
240 m
Bo
we
n H
ills
14
-02
6
Pe
ak
Op
era
tio
ns
5a
m t
o 1
0p
m
All
So
urc
es
Op
era
tin
g
Ma
rc
h 2
01
4
Le
ge
nd Cadastr
al
Poin
t sourc
e
Lin
e s
ourc
e
Are
a s
ourc
e
Build
ing
Acoustic B
arr
ier
Industr
ial build
ing
Poin
t re
ceiv
er
MWA Environmental
Bowen Hills 14-026 10 April 2014
ATTACHMENT 5
Modelled Dust Particle Size Distribution

AP
-42
Ap
pen
dix
B.2
Gen
era
lize
d P
arti
cle
Size
Dis
trib
uti
on
s -
Cat
ego
ry 3
fo
r C
on
cret
e B
atch
ing
Par
ticl
e Si
ze µ
mC
um
ula
tive
%
Ce
ntr
e S
ize
2.5
(an
yth
ing
low
er
than
µm
)
7.5
(an
yth
ing
be
twe
en
10 a
nd
5µ
m)
20
(an
yth
ing
ove
r 1
0µm
)
14
% in
ran
ge30.0
21.0
49.0
211
2.5
15
Ce
ntr
e Si
ze
2
(an
yth
ing
low
er
than
4µ
m)
5
(an
yth
ing
be
twe
en
6
and
4µ
m)
8
(an
yth
ing
be
twe
en
10 a
nd
6µ
m)
318
% in
ran
ge49.0
17.6
33.3
425
530
Ce
ntr
e Si
ze
0.5
(an
yth
ing
low
er
than
1µ
m)
1.5
(an
yth
ing
be
twe
en
2
and
1 µ
m)
2.25
(an
yth
ing
be
twe
en
2.5
and
1 µ
m)
634
% in
ran
ge26.7
46.7
26.7
1051
Po
lluta
nt
% in
ran
ge
TSP
49
PM
10
36
PM
2.5
15
PM
2.5
PM
10
TSP

MWA Environmental
Bowen Hills 14-026 10 April 2014
ATTACHMENT 6
Dust Emission Rate Calculations

JOB: Bowen Hills 14-026
AREA EMISSIONS FROM PROPOSED SITE - AVERAGE HOUR
PM2.5 PM10 TSP
By Hour 0.056 0.225 0.851
By Day 1.3 5.4 20.4
Area of source 5892 m2
PM2.5 PM10 TSP
Area Source (by hour) 0.000009 0.000038 0.000145
SOURCE
SOURCE
g/sec
g/m2/sec
JOB: Bowen Hills 14-026
SCENARIO: Proposed Concrete Batching Plant
EMISSIONS ESTIMATION INPUT SUMMARY
Parameter Value Units Comments
Operating Hours: 24 per day 1713_305_001 DSDIP meeting minutes 20140213
Paved Road Silt Loading (sL): 6 g/m2USEPA AP42 Chapter 13.2.1 mean concrete batching (50% Control for plant design)
Density of wet concrete 2.3 t/m3
Days of rainfall > 0.25mm (p): 90 days Typical data for region
Aggregate & Sand Truck Movements
Mean Vehicle Mass (W): 39 tonnes Typical data for concrete plant
Average Payload: 30.6 tonnes MWA Calc Based on Traffic Information
Trips per Day: 76 # MWA Calc Based on Traffic Information
Average Trip Length: 0.320 km Digitised in Mapinfo
Cement and Flyash Truck Movements
Mean Vehicle Mass (W): 39 tonnes Typical data for concrete plant
Average Payload: 26.6 tonnes MWA Calc Based on Traffic Information
Trips per Day: 16 # MWA Calc Based on Traffic Information
Average Trip Length: 0.320 km Digitised in Mapinfo
Agitator Truck Movements
Mean Vehicle Mass (W): 15.2 tonnes Typical data for concrete plant
Average Payload: 5.6 m3MWA Calc Based on Traffic Information
Trips per Day: 224 # MWA Calc Based on Traffic Information
Average Trip Length: 0.360 km Digitised in Mapinfo
Aggregate Transfer
Material Component: 46% Based on Concrete Composition
Material Usage: 1338 t/day MWA Calc
Sand Transfer
Material Component: 36% Based on Concrete Composition
Material Usage: 1025 t/day MWA Calc
Cement Unloading to Silo
Material Component: 12% Based on Concrete Composition
Material Usage: 353 t/day MWA Calc
Cement Supplement Unloading to Silo
Material Component: 2% Based on Concrete Composition
Material Usage: 52 t/day MWA Calc
Loading agitator trucks
Control Efficiency: 98% Enclosure with dust collection
AREAS
Modelling area 5892 m2
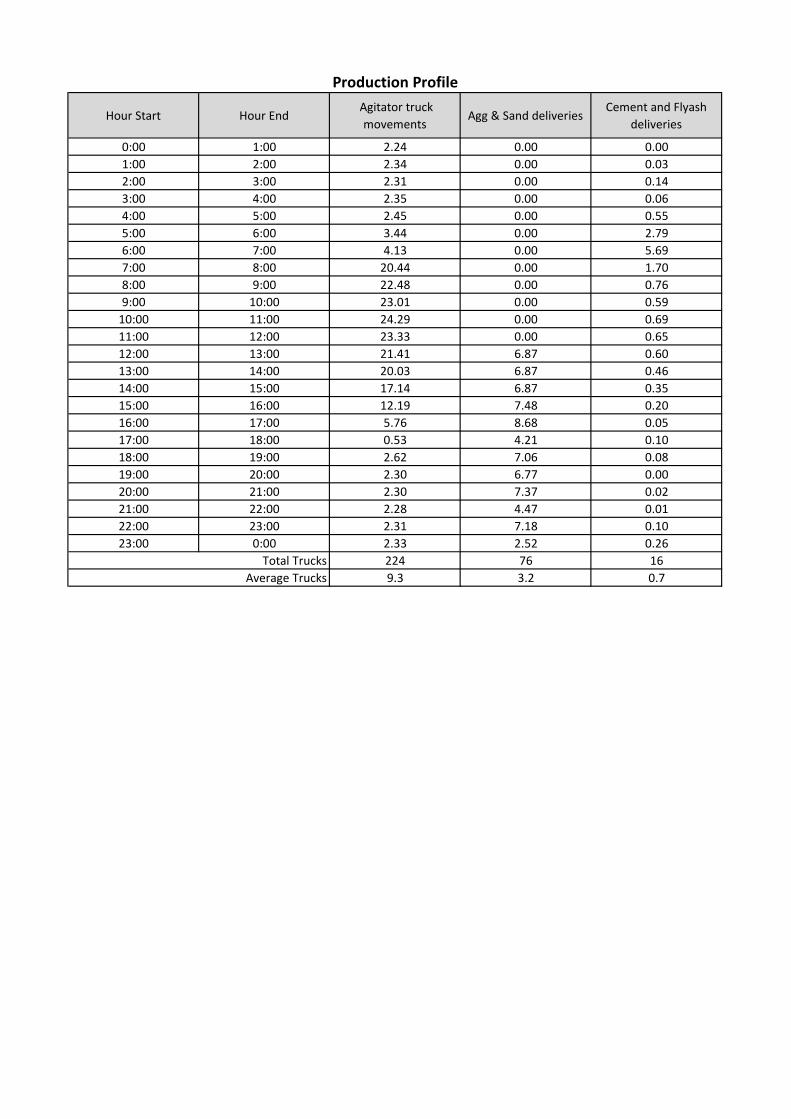
Hour Start Hour End Agitator truck
movementsAgg & Sand deliveries
Cement and Flyash
deliveries
0:00 1:00 2.24 0.00 0.00
1:00 2:00 2.34 0.00 0.03
2:00 3:00 2.31 0.00 0.14
3:00 4:00 2.35 0.00 0.06
4:00 5:00 2.45 0.00 0.55
5:00 6:00 3.44 0.00 2.79
6:00 7:00 4.13 0.00 5.69
7:00 8:00 20.44 0.00 1.70
8:00 9:00 22.48 0.00 0.76
9:00 10:00 23.01 0.00 0.59
10:00 11:00 24.29 0.00 0.69
11:00 12:00 23.33 0.00 0.65
12:00 13:00 21.41 6.87 0.60
13:00 14:00 20.03 6.87 0.46
14:00 15:00 17.14 6.87 0.35
15:00 16:00 12.19 7.48 0.20
16:00 17:00 5.76 8.68 0.05
17:00 18:00 0.53 4.21 0.10
18:00 19:00 2.62 7.06 0.08
19:00 20:00 2.30 6.77 0.00
20:00 21:00 2.30 7.37 0.02
21:00 22:00 2.28 4.47 0.01
22:00 23:00 2.31 7.18 0.10
23:00 0:00 2.33 2.52 0.26
224 76 16
9.3 3.2 0.7Average Trucks
Total Trucks
Production Profile

JOB: Bowen Hills 14-026
SCENARIO: Proposed Concrete Batching Plant
PAVED ROADS
Emission Source: Aggregate and Sand Truck Movements
Data Source: USEPA AP42 Chapter 13.2.1 Paved Roads (2011)
Emission Factor Formula:
Silt Loading (sL): 6 g/m2USEPA AP42 Chapter 13.2.1 mean concrete batching (50% Control for plant design)
Mean Vehicle Mass (W): 39 tonnes
Days of rainfall > 0.25mm (p): 90 days
Constants (PM2.5): k = 0.15
Constants (PM10): k = 0.62
Constants (TSP): k = 3.23
(USEPA AP42 Chapter 13.2.2 Tables 13.2.1-1)
Emission Factor (PM2.5): EF= 30.2 g/VKT
Emission Factor (PM10): EF= 124.7 g/VKT
Emission Factor (TSP): EF= 649.5 g/VKT
Operating Hours: 24 per day
Trips per Day: 76
Average Trip Length (two way): 0.32 km
Controlled Emission Rate: PM2.5: 0.008526 grams/second 24-hours
PM10: 0.035241 grams/second
TSP: 0.183593 grams/second

JOB: Bowen Hills 14-026
SCENARIO: Proposed Concrete Batching Plant
PAVED ROADS
Emission Source: Cement and Flyash Truck Movements
Data Source: USEPA AP42 Chapter 13.2.1 Paved Roads (2011)
Emission Factor Formula:
Silt Loading (sL): 6 g/m2USEPA AP42 Chapter 13.2.1 mean concrete batching (50% Control for plant design)
Mean Vehicle Mass (W): 39 tonnes
Days of rainfall > 0.25mm (p): 90 days
Constants (PM2.5): k = 0.15
Constants (PM10): k = 0.62
Constants (TSP): k = 3.23
(USEPA AP42 Chapter 13.2.2 Tables 13.2.1-1)
Emission Factor (PM2.5): EF= 30.2 g/VKT
Emission Factor (PM10): EF= 124.7 g/VKT
Emission Factor (TSP): EF= 649.5 g/VKT
Operating Hours: 24 per day
Trips per Day: 16
Average Trip Length (two way): 0.32 km
Controlled Emission Rate: PM2.5: 0.001776 grams/second 24-hours
PM10: 0.007342 grams/second
TSP: 0.038248 grams/second

JOB: Bowen Hills 14-026
SCENARIO: Proposed Concrete Batching Plant
PAVED ROADS
Emission Source: Agitator Truck Movements
Data Source: USEPA AP42 Chapter 13.2.1 Paved Roads (2011)
Emission Factor Formula:
Silt Loading (sL): 6 g/m2USEPA AP42 Chapter 13.2.1 mean concrete batching (50% Control for plant design)
Mean Vehicle Mass (W): 15.2 tonnes
Days of rainfall > 0.25mm (p): 90 days
Constants (PM2.5): k = 0.15
Constants (PM10): k = 0.62
Constants (TSP): k = 3.23
(USEPA AP42 Chapter 13.2.2 Tables 13.2.1-1)
Emission Factor (PM2.5): EF= 11.5 g/VKT
Emission Factor (PM10): EF= 47.7 g/VKT
Emission Factor (TSP): EF= 248.4 g/VKT
Operating Hours: 24 per day
Trips per Day: 224
Average Trip Length (two way): 0.36 km
Controlled Emission Rate: PM2.5: 0.010769 grams/second 24-hours
PM10: 0.044512 grams/second
TSP: 0.231892 grams/second
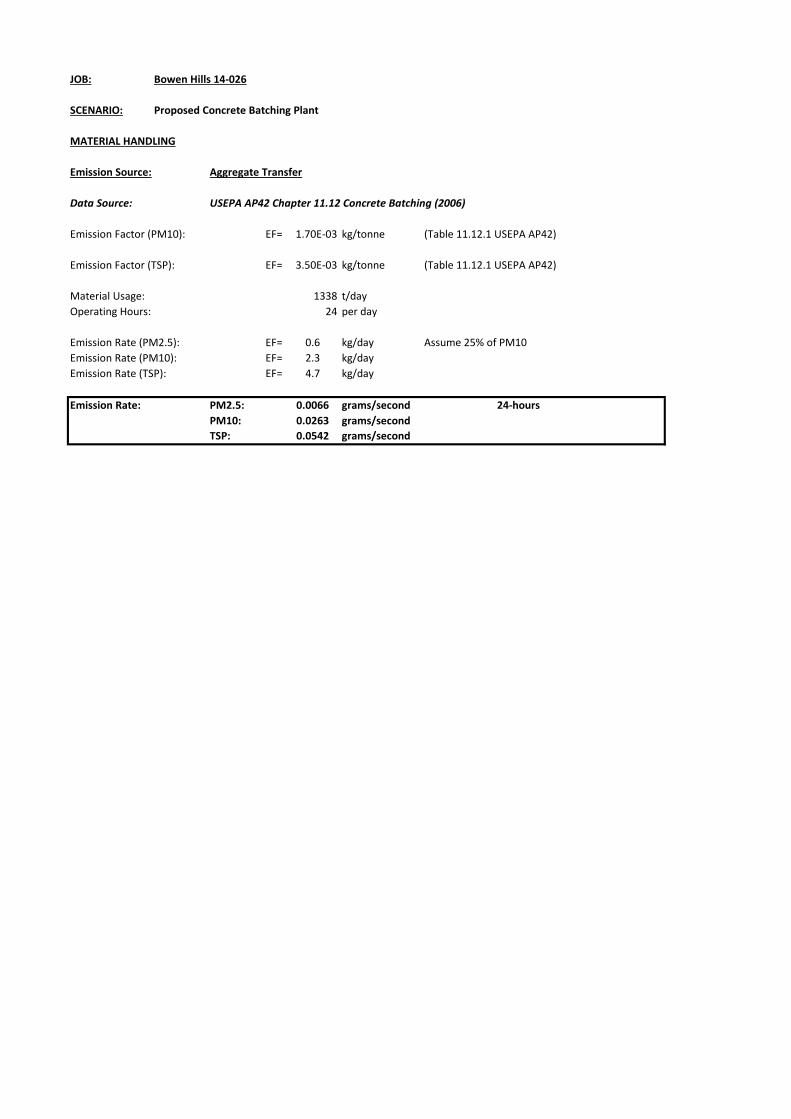
JOB: Bowen Hills 14-026
SCENARIO: Proposed Concrete Batching Plant
MATERIAL HANDLING
Emission Source: Aggregate Transfer
Data Source: USEPA AP42 Chapter 11.12 Concrete Batching (2006)
Emission Factor (PM10): EF= 1.70E-03 kg/tonne (Table 11.12.1 USEPA AP42)
Emission Factor (TSP): EF= 3.50E-03 kg/tonne (Table 11.12.1 USEPA AP42)
Material Usage: 1338 t/day
Operating Hours: 24 per day
Emission Rate (PM2.5): EF= 0.6 kg/day Assume 25% of PM10
Emission Rate (PM10): EF= 2.3 kg/day
Emission Rate (TSP): EF= 4.7 kg/day
Emission Rate: PM2.5: 0.0066 grams/second 24-hours
PM10: 0.0263 grams/second
TSP: 0.0542 grams/second

JOB: Bowen Hills 14-026
SCENARIO: Proposed Concrete Batching Plant
MATERIAL HANDLING
Emission Source: Sand Transfer
Data Source: USEPA AP42 Chapter 11.12 Concrete Batching (2006)
Emission Factor (PM10): EF= 1.10E-03 kg/tonne (Table 11.12.1 USEPA AP42)
Emission Factor (TSP): EF= 5.10E-04 kg/tonne (Table 11.12.1 USEPA AP42)
Material Usage: 1025 t/day
Operating Hours: 24 per day
Emission Rate (PM2.5): EF= 0.3 kg/day Assume 25% of PM10
Emission Rate (PM10): EF= 1.1 kg/day
Emission Rate (TSP): EF= 0.5 kg/day
Emission Rate: PM2.5: 0.0033 grams/second 24-hours
PM10: 0.0130 grams/second
TSP: 0.0060 grams/second

JOB: Bowen Hills 14-026
SCENARIO: Proposed Concrete Batching Plant
MATERIAL HANDLING
Emission Source: Cement Unloading to Silo
Data Source: USEPA AP42 Chapter 11.12 Concrete Batching (2006)
Controlled Emission Factor (PM10): EF= 1.10E-03 kg/tonne (Table 11.12.1 USEPA AP42)
Controlled Emission Factor (TSP): EF= 5.10E-04 kg/tonne (Table 11.12.1 USEPA AP42)
Material Usage: 353 t/day
Operating Hours: 24 per day
Emission Rate (PM2.5): EF= 0.10 kg/day Assume 25% of PM10
Emission Rate (PM10): EF= 0.39 kg/day
Emission Rate (TSP): EF= 0.18 kg/day
Emission Rate: PM2.5: 0.0011 grams/second 24-hours
PM10: 0.0045 grams/second
TSP: 0.0021 grams/second
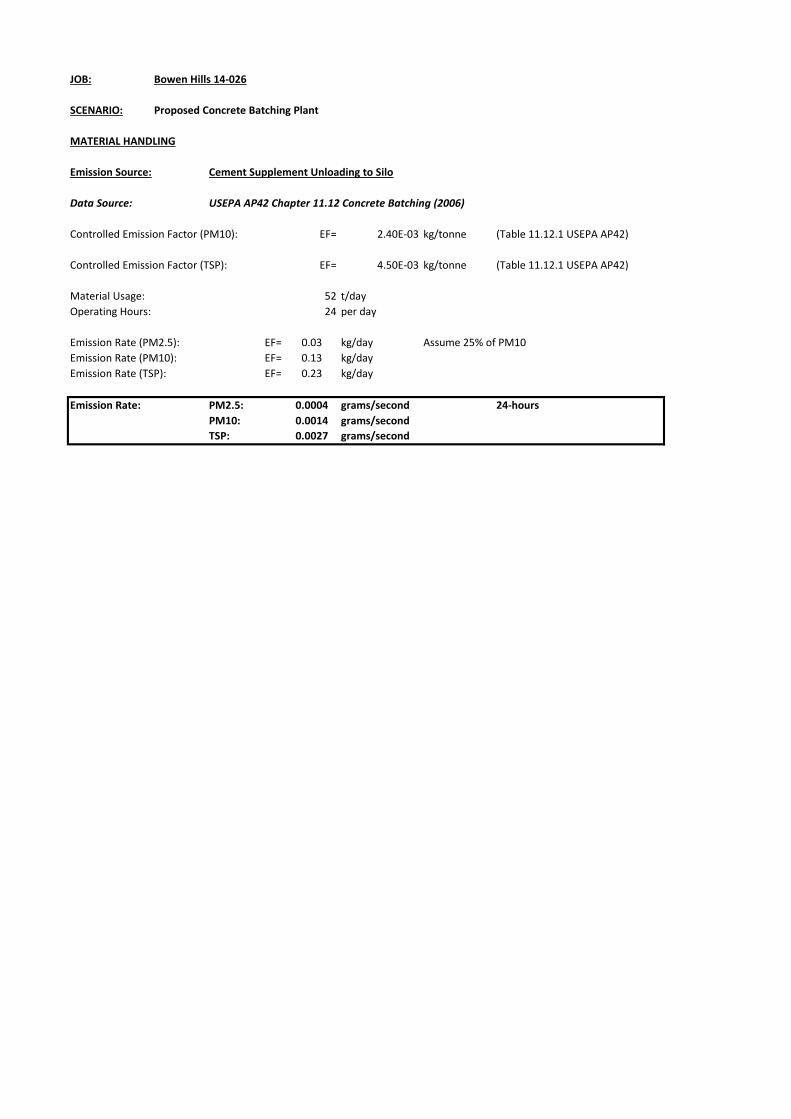
JOB: Bowen Hills 14-026
SCENARIO: Proposed Concrete Batching Plant
MATERIAL HANDLING
Emission Source: Cement Supplement Unloading to Silo
Data Source: USEPA AP42 Chapter 11.12 Concrete Batching (2006)
Controlled Emission Factor (PM10): EF= 2.40E-03 kg/tonne (Table 11.12.1 USEPA AP42)
Controlled Emission Factor (TSP): EF= 4.50E-03 kg/tonne (Table 11.12.1 USEPA AP42)
Material Usage: 52 t/day
Operating Hours: 24 per day
Emission Rate (PM2.5): EF= 0.03 kg/day Assume 25% of PM10
Emission Rate (PM10): EF= 0.13 kg/day
Emission Rate (TSP): EF= 0.23 kg/day
Emission Rate: PM2.5: 0.0004 grams/second 24-hours
PM10: 0.0014 grams/second
TSP: 0.0027 grams/second

JOB: Bowen Hills 14-026
SCENARIO: Proposed Concrete Batching Plant
MATERIAL HANDLING
Emission Source: Loading agitator trucks
Data Source: USEPA AP42 Chapter 11.12 Concrete Batching (2006)
Emission Factor (PM10): EF= 1.39E-01 kg/tonne (Table 11.12.1 USEPA AP42)
Emission Factor (TSP): EF= 4.98E-01 kg/tonne (Table 11.12.1 USEPA AP42)
Control Efficiency: 98% (3-sided and roofed enclosure with dust collection)
Average Payload: 5.6 m³
Number of trucks per day: 224 #
Operating Hours: 24 per day
Emission Rate (PM2.5): EF= 2.01 kg/day Assume 25% of PM10
Emission Rate (PM10): EF= 8.02 kg/day
Emission Rate (TSP): EF= 28.74 kg/day
Emission Rate: PM2.5: 0.0232 grams/second 24-hours
PM10: 0.0928 grams/second
TSP: 0.3327 grams/second

MWA Environmental
Bowen Hills 14-026 10 April 2014
ATTACHMENT 7
Predicted Dust Concentrations / Deposition Rates

Site Boundary
Sensitive Receptors
Predicted 24-hour PM10 concentrations from the Proposed Concrete Batching Plant including ambient
Figure A7.1 Pollutant Averaging Period Units
PM10 24-hour µg/m³
Air Quality Guideline Source Date
50 µg/m³ 6th Highest EPP (Air) 27/03/2014

Site Boundary
Sensitive Receptors
Predicted 24-hour PM2.5 concentrations from the Proposed Concrete Batching Plant including ambient
Figure A7.2 Pollutant Averaging Period Units
PM2.5 24-hour µg/m³
Air Quality Guideline Source Date
25 µg/m³ EPP (Air) 27/03/2014

Site Boundary
Sensitive Receptors
Predicted annual average PM2.5 concentrations from the Proposed Concrete Batching Plant including ambient
Figure A7.3 Pollutant Averaging Period Units
PM2.5 Annual µg/m³
Air Quality Guideline Source Date
8 µg/m³ EPP (Air) 27/03/2014
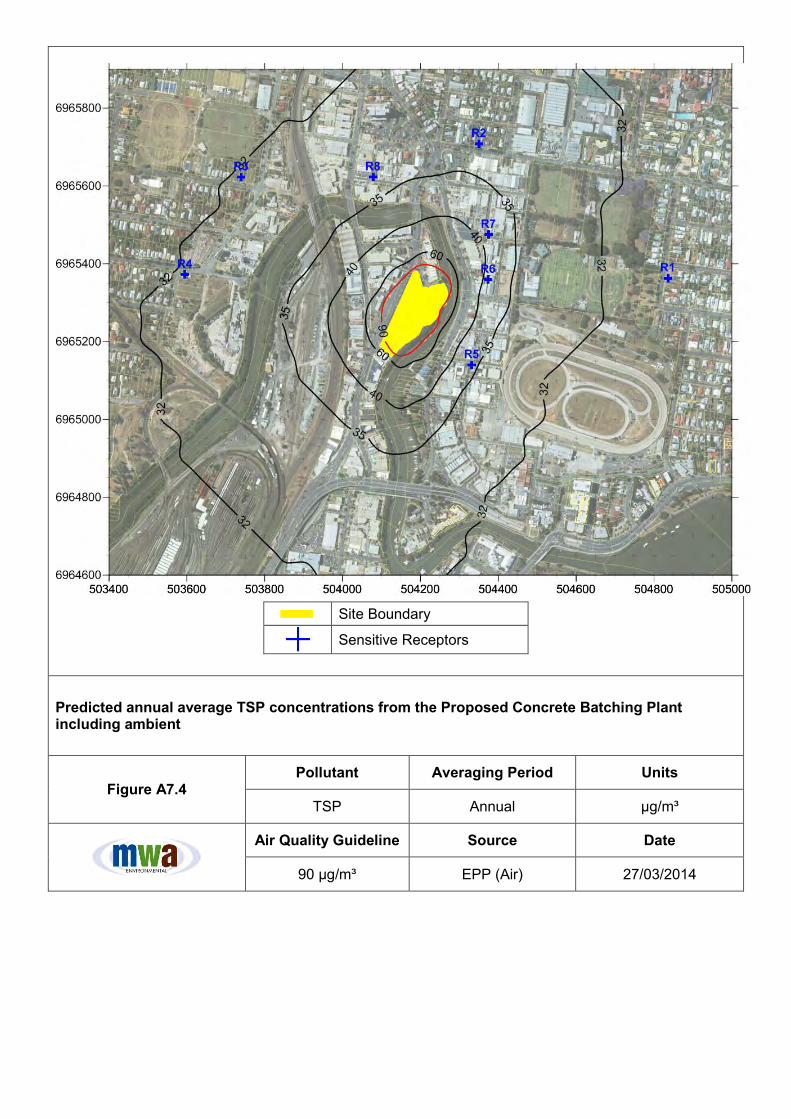
Site Boundary
Sensitive Receptors
Predicted annual average TSP concentrations from the Proposed Concrete Batching Plant including ambient
Figure A7.4 Pollutant Averaging Period Units
TSP Annual µg/m³
Air Quality Guideline Source Date
90 µg/m³ EPP (Air) 27/03/2014
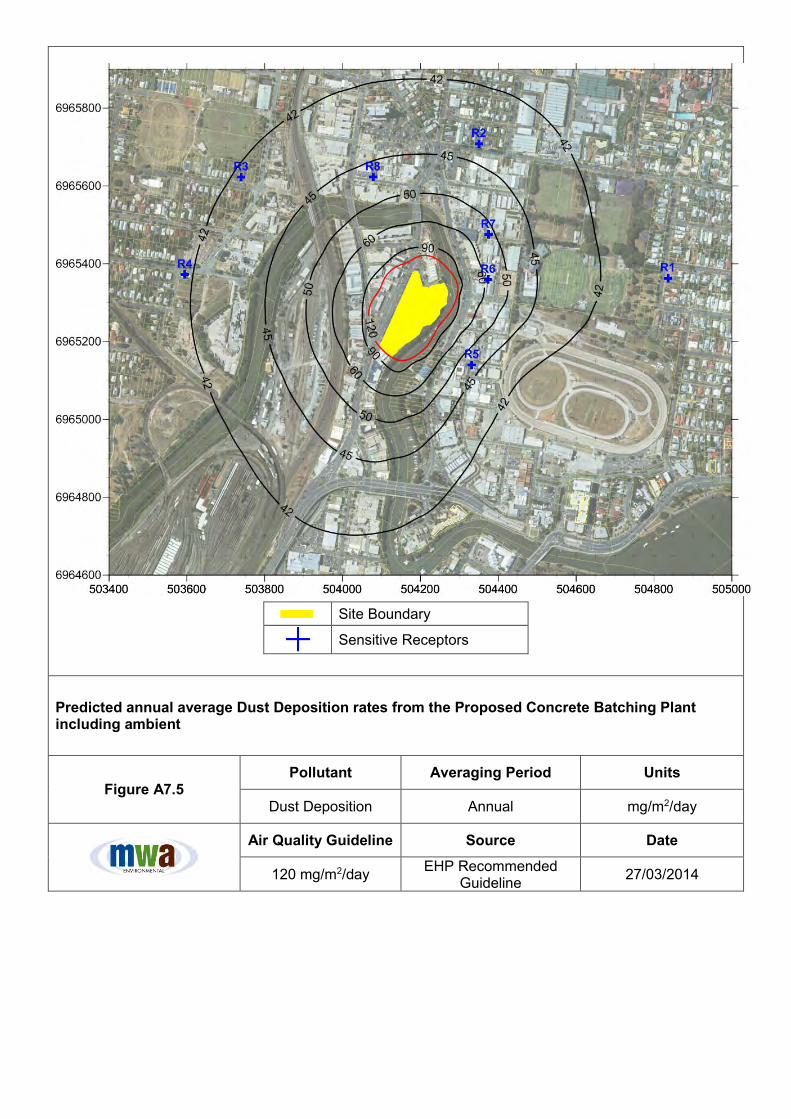
Site Boundary
Sensitive Receptors
Predicted annual average Dust Deposition rates from the Proposed Concrete Batching Plant including ambient
Figure A7.5 Pollutant Averaging Period Units
Dust Deposition Annual mg/m2/day
Air Quality Guideline Source Date
120 mg/m2/day EHP Recommended Guideline 27/03/2014


![[SPECO] Catalog - Concrete Batching Plant · 2018. 11. 14. · Concrete batching plant Silo Top Type Portable Batching Plant Ribbon & Twin Mixer Portable Shuttle Conveyor Portable](https://static.fdocuments.in/doc/165x107/6134471cdfd10f4dd73ba0cc/speco-catalog-concrete-batching-plant-2018-11-14-concrete-batching-plant.jpg)