NOAA Technical Memorandum NOS ORCA 71 - Vol III - Technical Methods for Mussels
235
NOAA Technical Memorandum NOS ORCA 71 National Status and Trends Program for Marine Environmental Quality Sampling and Analytical Methods of the National Status and Trends Program National Benthic Surveillance and Mussel Watch Projects 1984-1992 Volume III Comprehensive Descriptions of Elemental Analytical Methods Silver Spring, Maryland July, 1993 noaa NATIONAL OCEANIC AND ATMOSPHERIC ADMINISTRATION Coastal Monitoring and Bioeffects Assessment Division Office of Ocean Resources Conservation and Assessment National Ocean Service
Transcript of NOAA Technical Memorandum NOS ORCA 71 - Vol III - Technical Methods for Mussels

NOAA Technical Memorandum NOS ORCA 71
National Status and Trends Programfor Marine Environmental Quality
Sampling and Analytical Methods of theNational Status and Trends Program
National Benthic Surveillance and Mussel Watch Projects1984-1992
Volume III
Comprehensive Descriptions of Elemental Analytical Methods
Silver Spring, MarylandJuly, 1993
noaa NATIONAL OCEANIC AND ATMOSPHERIC ADMINISTRATION
Coastal Monitoring and Bioeffects Assessment DivisionOffice of Ocean Resources Conservation and Assessment
National Ocean Service


NOAA Technical Memorandum NOS ORCA 71
Sampling and Analytical Methods of theNational Status and Trends ProgramNational Benthic Surveillance and Mussel Watch Projects1984-1992
Volume III
Comprehensive Descriptions of Elemental Analytical Methods
G. G. Lauenstein and A. Y. Cantillo(Editors)
Silver Spring, MarylandJuly, 1993
United States National Oceanic andDepartment of Commerce Atmospheric Administration National Ocean Service
Ronald H. Brown D. James Baker W. Stanley WilsonSecretary Under Secretary Assistant Administrator

Disclaimer
The purpose of this publication is to document the sampling and analytical methods used bycooperating laboratories of the NOAA NS&T Program. The NOAA and participating laboratoriesdo not approve, recommend, or endorse any proprietary product or proprietary materialmentioned in this publication. No reference shall be made to the NOAA or participatinglaboratories concerning this publication in any advertising or sales promotion which wouldindicate or imply that the NOAA or the participating laboratories recommend, or endorse anyproprietary product or proprietary material mentioned herein, or which has as its purpose anintent to cause directly or indirectly an advertised product to be used or purchased because ofthis NOAA publication.

TABLE OF CONTENTS
LIST OF TABLES..................................................................................................................III.iLIST OF FIGURES.................................................................................................................III.ii
PREFACE............................................................................................................................III.iii
Total Dissolution of Marine Sediment and Atomic Absorption Analysis ofMajor and Trace ElementsV. S. Zdanowicz, T. W. Finneran and R. Kothe
ABSTRACT ........................................................................................................................III.11. INTRODUCTION .............................................................................................................III.12. EQUIPMENT AND SUPPLIES ...........................................................................................III.1
2.1. Instrumentation ...........................................................................................III.12.2. Supplies ......................................................................................................III.22.3. Labware ......................................................................................................III.22.4. Reagents .....................................................................................................III.22.5. Solvents and matrix modifiers .....................................................................III.3
2.5.1. M19 Diluent ...................................................................................III.32.5.2. 1646 Modifier ...............................................................................III.32.5.3. Matrix modifiers for graphite furnace analyses ..............................III.3
3. SAMPLE TREATMENT ...................................................................................................III.43.1. Drying ........................................................................................................III.43.2. Compositing ................................................................................................III.43.3. Digestion .....................................................................................................III.4
4. CALIBRATION ..............................................................................................................III.54.1. Sn, Sb, Tl and As calibration .......................................................................III.54.2. Ag calibration .............................................................................................III.54.3. Cd, Se, Sb, and Sn additional dilutions ..........................................................III.5
5. CALCULATIONS ............................................................................................................III.66. REFERENCES ................................................................................................................III.77. INSTRUMENTAL ANALYSIS ...........................................................................................III.14
7.1. Aluminum ....................................................................................................III.147.2. Silicon ........................................................................................................III.157.3. Chromium ...................................................................................................III.167.4. Manganese ..................................................................................................III.177.5. Iron ............................................................................................................III.187.6. Nickel .........................................................................................................III.197.7. Copper ........................................................................................................III.207.8. Zinc ............................................................................................................III.217.9. Arsenic .......................................................................................................III.227.10. Selenium .....................................................................................................III.237.11. Silver .........................................................................................................III.247.12. Cadmium .....................................................................................................III.257.13. Tin ..............................................................................................................III.267.14. Antimony ....................................................................................................III.277.15. Mercury .....................................................................................................III.287.16. Thallium ......................................................................................................III.297.17. Lead ............................................................................................................III.30

Digestion of Fish Tissue and Atomic Absorption Analysis of TraceElementsV. S. Zdanowicz, T. W. Finneran and R. Kothe
ABSTRACT ........................................................................................................................III.311. INTRODUCTION .............................................................................................................III.312. EQUIPMENT AND SUPPLIES ...........................................................................................III.31
2.1. Instrumentation ...........................................................................................III.312.2. Supplies ......................................................................................................III.322.3. Labware ......................................................................................................III.322.4. Reagents .....................................................................................................III.322.5. Solvents and matrix modifiers .....................................................................III.33
2.5.1. 10% HNO3 .....................................................................................III.332.5.2. Matrix modifiers for graphite furnace analyses ..............................III.33
3. SAMPLE PREPARATION ................................................................................................III.334. CALIBRATION ..............................................................................................................III.345. CALCULATIONS ............................................................................................................III.346. REFERENCES.................................................................................................................III.357. INSTRUMENTAL ANALYSIS............................................................................................III.36
7.1. Aluminum.....................................................................................................III.367.2. Chromium....................................................................................................III.377.3. Manganese...................................................................................................III.387.4. Iron.............................................................................................................III.397.5. Nickel..........................................................................................................III.407.6. Copper.........................................................................................................III.417.7. Zinc.............................................................................................................III.427.8. Arsenic........................................................................................................III.437.9. Selenium......................................................................................................III.447.10. Silver..........................................................................................................III.457.11. Cadmium......................................................................................................III.467.12. Tin...............................................................................................................III.477.13 Antimony.....................................................................................................III.487.14. Mercury......................................................................................................III.497.15. Thallium.......................................................................................................III.507.16. Lead.............................................................................................................III.51
Analytical Methods for Trace Elements in Sediments by Atomic AbsorptionSpectrophotometryD. W. Evans and P. J. Hanson
ABSTRACT ........................................................................................................................III.531. INTRODUCTION .............................................................................................................III.532. EQUIPMENT AND SUPPLIES ...........................................................................................III.53
2.1. Equipment ..................................................................................................III.532.1.1. Atomic absorption spectrophotometers ..........................................III.532.1.2. Flow injection system ....................................................................III.542.1.3. Lamps and power supplies ..............................................................III.542.1.4. Sample digestion equipment ............................................................III.542.1.5. General laboratory equipment ........................................................III.54
2.2 Supplies ......................................................................................................III.542.2.1. Atomic absorption spectrophotometry ............................................III.542.2.2. Compressed gases .........................................................................III.55
2.2.3. Plasticware ...................................................................................III.552.2.4. Labware preparation ......................................................................III.55
2.3. Chemicals and reagents ...............................................................................III.552.3.1. Atomic absorption standards ..........................................................III.552.3.2. Reagents .......................................................................................III.56
3. SAMPLE TREATMENT ...................................................................................................III.563.1. Sample matrix modification .........................................................................III.563.2. Sample drying and compositing ....................................................................III.573.3. Microwave digestion ...................................................................................III.57
3.3.1. Acid additions ................................................................................III.573.3.2. Digestion .......................................................................................III.573.3.3. Initial sample dilution and volume determination .............................III.583.3.4. Alternate digestion ........................................................................III.58
3.4. Dilution .......................................................................................................III.583.5. Standards ...................................................................................................III.59
4. CALIBRATION AND COMPUTATION OF ANALYTE CONCENTRATIONS ................................III.595. DETECTION LIMITS .......................................................................................................III.606. CHANGES IN ANALYTICAL METHODS OVER TIME ............................................................III.617. ACKNOWLEDGEMENTS ..................................................................................................III.618. SELECTED REFERENCES UTILIZED IN METHODS DEVELOPMENT..........................................III.629. INSTRUMENTAL ANALYSES...........................................................................................III.63
9.1. Aluminum.....................................................................................................III.639.2. Antimony.....................................................................................................III.649.3. Arsenic........................................................................................................III.659.4. Cadmium......................................................................................................III.669.5. Chromium....................................................................................................III.679.6. Copper.........................................................................................................III.689.7. Iron.............................................................................................................III.699.8. Lead.............................................................................................................III.709.9. Manganese...................................................................................................III.719.10. Mercury......................................................................................................III.729.11. Nickel..........................................................................................................III.749.12. Selenium......................................................................................................III.759.13. Silicon.........................................................................................................III.779.14. Silver..........................................................................................................III.789.15. Thallium.......................................................................................................III.799.16. Tin...............................................................................................................III.809.17. Zinc.............................................................................................................III.81
Analytical Methods for Trace Elements in Fish Liver by Atomic AbsorptionSpectrophotometryD. W. Evans and P. J. Hanson
ABSTRACT ........................................................................................................................III.831. INTRODUCTION .............................................................................................................III.832. EQUIPMENT AND SUPPLIES ...........................................................................................III.84
2.1. Equipment ...................................................................................................III.842.1.1. Atomic absorption spectrophotometers ..........................................III.842.1.2. Flow injection system ....................................................................III.842.1.3. Lamps and power supplies ..............................................................III.852.1.4. Sample digestion equipment ............................................................III.852.1.5. Sample homogenization equipment ..................................................III.852.1.6. General laboratory equipment ........................................................III.85

2.2 Supplies ......................................................................................................III.852.2.1. Atomic absorption spectrophotometry ............................................III.852.2.2. Compressed gases .........................................................................III.852.2.3. Plasticware ...................................................................................III.862.2.4. Dissection tools .............................................................................III.862.2.5. Labware preparation ......................................................................III.86
2.3. Chemicals and reagents ...............................................................................III.862.3.1. Atomic absorption standards ..........................................................III.862.3.2. Reagents .......................................................................................III.87
3. SAMPLE TREATMENT ...................................................................................................III.873.1. Sample matrix modification .........................................................................III.873.2. Sample preparation .....................................................................................III.88
3.2.1. Sample drying ...............................................................................III.883.2.2. Homogenization of large composite samples ....................................III.88
3.3. Microwave digestion ..................................................................................III.893.3.1. Acid additions ................................................................................III.893.3.2. Digestion .......................................................................................III.893.3.3. Initial sample dilution and volume determination .............................III.90
3.4. Alternate bomb digestion .............................................................................III.903.5. Dilution .......................................................................................................III.91
4. CALIBRATION AND COMPUTATION OF ANALYTE CONCENTRATIONS ................................III.915. DETECTION LIMITS .......................................................................................................III.926. CHANGES IN ANALYTICAL METHODS OVER TIME ............................................................III.937. ACKNOWLEDGEMENTS ..................................................................................................III.948. SELECTED REFERENCES USED IN METHOD DEVELOPMENT.................................................III.949. INSTRUMENTAL ANALYSES...........................................................................................III.95
9.1. Antimony.....................................................................................................III.959.2. Arsenic........................................................................................................III.969.3. Cadmium......................................................................................................III.979.4. Chromium....................................................................................................III.989.5. Copper.........................................................................................................III.999.6. Iron.............................................................................................................III.1009.7. Lead.............................................................................................................III.1019.8. Manganese...................................................................................................III.1029.9. Mercury......................................................................................................III.1039.10. Nickel..........................................................................................................III.1059.11. Selenium......................................................................................................III.1069.12. Silver..........................................................................................................III.1079.13. Thallium.......................................................................................................III.1089.14. Tin...............................................................................................................III.1099.15. Zinc.............................................................................................................III.110
Sample Preparation and Analyses of Trace Metals by Atomic AbsorptionSpectroscopyP. A. Robisch and R. C. Clark
ABSTRACT.........................................................................................................................III.1111. INTRODUCTION..............................................................................................................III.1112. EQUIPMENT AND SUPPLIES............................................................................................III.111
2.1. Instrumentation............................................................................................III.1112.2. Supplies.......................................................................................................III.1112.3. Labware.......................................................................................................III.1112.4. Reagents......................................................................................................III.111

2.5. Matrix modifiers and reagents......................................................................III.1122.5.1. Magnesium nitrate..........................................................................III.1122.5.2. Nickel nitrate.................................................................................III.1122.5.3. Ammonium hydrogen phosphate.......................................................III.1122.5.4. Potassium permanganate.................................................................III.1122.5.5. Sodium borohydride........................................................................III.112
3. SAMPLE PROCESSING....................................................................................................III.1123.1. Tissues........................................................................................................III.112
3.1.1. Acid addition..................................................................................III.1133.1.2. Microwave digestion.......................................................................III.1133.1.3. Sample dilution...............................................................................III.113
3.2. Sediments....................................................................................................III.1133.2.1. Acid addition..................................................................................III.1143.2.2. Microwave digestion.......................................................................III.1143.2.3. Sample dilution...............................................................................III.114
4. CALIBRATION AND COMPUTATION OF ANALYTE CONCENTRATIONS.................................III.1145. CONCLUSIONS...............................................................................................................III.1156. REFERENCES.................................................................................................................III.1157. SEDIMENT ANALYSIS....................................................................................................III.117
7.1. Silver..........................................................................................................III.1177.2. Aluminum.....................................................................................................III.1187.3. Arsenic........................................................................................................III.1197.4. Cadmium......................................................................................................III.1207.5. Chromium....................................................................................................III.1217.6. Copper.........................................................................................................III.1227.7. Iron.............................................................................................................III.1237.8. Iron.............................................................................................................III.1247.9. Mercury......................................................................................................III.1257.10. Manganese...................................................................................................III.1267.11. Nickel..........................................................................................................III.1277.12. Lead.............................................................................................................III.1287.13. Antimony.....................................................................................................III.1297.14. Selenium......................................................................................................III.1307.15. Tin...............................................................................................................III.1317.16. Tin...............................................................................................................III.1327.17. Zinc.............................................................................................................III.134
8. TISSUES.......................................................................................................................III.1358.1. Silver..........................................................................................................III.1358.2. Aluminum.....................................................................................................III.1368.3. Arsenic........................................................................................................III.1378.4. Cadmium......................................................................................................III.1388.5. Chromium....................................................................................................III.1398.6. Copper.........................................................................................................III.1408.7. Iron.............................................................................................................III.1418.8. Mercury......................................................................................................III.1428.9. Manganese...................................................................................................III.1438.10. Nickel..........................................................................................................III.1448.11. Lead.............................................................................................................III.1458.12. Antimony.....................................................................................................III.1468.13. Selenium......................................................................................................III.1478.14. Tin...............................................................................................................III.1488.15. Tin...............................................................................................................III.1498.16. Zinc.............................................................................................................III.150

GERG Trace Element Quantification TechniquesB. J. Taylor and B. J. Presley
1. INTRODUCTION..............................................................................................................III.1512. EQUIPMENT AND SUPPLIES............................................................................................III.151
2.1. Instrumentation............................................................................................III.1512.2. Supplies.......................................................................................................III.1522.3. Labware.......................................................................................................III.1522.4. Reagents......................................................................................................III.1522.5. Matrix modifiers..........................................................................................III.1532.6. Standards....................................................................................................III.153
3. SAMPLE TREATMENT....................................................................................................III.1533.1. Oyster tissue...............................................................................................III.153
3.1.1. Oyster shucking..............................................................................III.1533.1.2. Bulk homogenizing...........................................................................III.1543.1.3. Freeze drying.................................................................................III.1543.1.4. Homogenization of dry aliquot.........................................................III.1543.1.5. Digestion........................................................................................III.1543.1.6. Displacement volume......................................................................III.154
3.2. Bottom sediment..........................................................................................III.1543.2.1. Homogenization...............................................................................III.1543.2.2. Freeze drying.................................................................................III.1553.2.3. Homogenization of dry aliquot.........................................................III.1553.2.4. Digestion........................................................................................III.155
4. CALIBRATION AND ANALYSIS........................................................................................III.1555. CALCULATIONS.............................................................................................................III.156
5.1. Concentration...............................................................................................III.1565.2. Dilution factor..............................................................................................III.1565.3. Concentration...............................................................................................III.157
6. INSTRUMENTAL ANALYSIS............................................................................................III.1586.1. Mercury......................................................................................................III.1586.2. Aluminum.....................................................................................................III.1596.3. Copper.........................................................................................................III.1606.4. Iron.............................................................................................................III.1616.5. Manganese...................................................................................................III.1626.6. Zinc.............................................................................................................III.1636.7. Silver..........................................................................................................III.1646.8. Arsenic........................................................................................................III.1666.9. Cadmium......................................................................................................III.1686.10. Chromium....................................................................................................III.1706.11. Copper.........................................................................................................III.1726.12. Nickel..........................................................................................................III.1746.13. Lead.............................................................................................................III.1766.14. Selenium......................................................................................................III.1786.15. Tin...............................................................................................................III.1806.16. Aluminum.....................................................................................................III.1826.17. Chromium....................................................................................................III.1836.18. Iron.............................................................................................................III.1846.19. Manganese...................................................................................................III.185

Analysis of Marine Sediment and Bivalve Tissue by X-Ray Fluorescence,Atomic Absorption and Inductively Coupled Plasma Mass SpectrometryE. Crecelius, C. Apts, L. Bingler, O. Cotter, S. Kiesser and R. Sanders
ABSTRACT.........................................................................................................................III.1871. INTRODUCTION..............................................................................................................III.1872. EQUIPMENT AND SUPPLIES............................................................................................III.187
2.1. Instrumentation............................................................................................III.1872.2. Supplies.......................................................................................................III.1882.3. Labware.......................................................................................................III.1892.4. Reagents......................................................................................................III.1892.5. Solvents and matrix modifiers......................................................................III.190
3. SAMPLE TREATMENT....................................................................................................III.1903.1. Drying and homogenization...........................................................................III.190
3.1.1. Sediments......................................................................................III.1903.1.2. Tissues..........................................................................................III.190
3.2. Digestion.....................................................................................................III.1903.2.1. Sediments......................................................................................III.1913.2.2. Tissues..........................................................................................III.191
3.3. Microwave digestion....................................................................................III.1924. CALIBRATION...............................................................................................................III.1925. SPECTRAL INTERFERENCES............................................................................................III.1926. CALCULATIONS.............................................................................................................III.193
6.1. Graphite furnace and ICP-MS........................................................................III.1936.2. Cold vapor atomic absorption........................................................................III.1936.3. X-ray fluorescence......................................................................................III.193
7. CONCLUSIONS...............................................................................................................III.1948. REFERENCES.................................................................................................................III.1949. INSTRUMENTAL ANALYSIS............................................................................................III.195
9.1. Atomic absorption spectrometry..................................................................III.1959.1.1. Aluminum.......................................................................................III.1959.1.2. Chromium.......................................................................................III.1969.1.3. Nickel.............................................................................................III.1979.1.4. Selenium........................................................................................III.1989.1.5. Silver............................................................................................III.199
9.1.5.1. Graphite furnace atomic absorption for tissue....................III.1999.1.5.2. Graphite furnace atomic absorption for sediment................III.200
9.1.6. Cadmium........................................................................................III.2019.1.6.1. Graphite furnace atomic absorption for tissue....................III.2019.1.6.2. Graphite furnace atomic absorption for sediment................III.202
9.1.7. Tin.................................................................................................III.2039.1.7.1. Hydride generation atomic absorption for tissue.................III.2039.1.7.2. Hydride generation atomic absorption for sediment.............III.204
9.1.8. Antimony.......................................................................................III.2059.1.8.1. Graphite furnace atomic absorption for tissue....................III.2059.1.8.2. Graphite furnace atomic absorption for sediment................III.206
9.1.9. Mercury.........................................................................................III.2079.1.10. Thallium.........................................................................................III.208
9.1.10.1. Graphite furnace atomic absorption for tissue..................III.2089.1.10.2. Graphite furnace atomic absorption for sediment..............III.209
9.1.11. Lead...............................................................................................III.2109.2. Inductively coupled plasma mass spectrometry.............................................III.2119.3. X-Ray fluorescence......................................................................................III.212

Analytical Procedures Followed by Science Applications InternationalCorporation, Trace and Major Element AnalysesC. Peven, A. Uhler and D. West
1. INTRODUCTION..............................................................................................................III.2132. TRACE METAL ANALYSIS..............................................................................................III.213
2.1. Equipment and reagents................................................................................III.2132.1.1. Instruments....................................................................................III.2132.1.2. Labware.........................................................................................III.2152.1.2. Reagents........................................................................................III.215
2.2. Bivalve tissues digestion - SAIC..................................................................III.2162.2.1. For all elements except Hg..............................................................III.2162.2.2. For Hg analysis...............................................................................III.217
2.3. Surficial sediments......................................................................................III.2172.3.1. For all elements except Hg..............................................................III.2172.3.2. For Hg analysis...............................................................................III.218
2.4. Sample analysis...........................................................................................III.2182.4.1. Graphite furnace atomic absorption spectrometry...........................III.2182.4.2. Flame atomic absorption spectrometry............................................III.2182.4.3. Cold vapor atomic absorption spectrometry....................................III.2182.4.4. Colorimetry...................................................................................III.219
3. REFERENCES...................................................................................................................III.219

LIST OF TABLES
P.1. Laboratories analyzing National Status and Trends Program National BenthicSurveillance Project samples for major and trace elements and pertinentchapters in this document......................................................................................III.iii
P.2. Laboratories analyzing National Status and Trends Program Mussel Watch Projectsamples for major and trace elements....................................................................III.iv
III.1. Typical detection limits for the Sandy Hook Method Laboratory 19...........................III.7
III.2. Typical detection limits for the Sandy Hook Method Laboratory 20.........................III.35
III.3. Typical sediment detection limits..........................................................................III.60
III.4. Sediment methodological changes through time......................................................III.61
III.5. Volume of nitric acid added to various tissue sample weights.................................III.89
III.6. Typical tissue detection limits..............................................................................III.92
III.7. Tissue methodological changes through time..........................................................III.93
III.8. Typical method detection limits for 0.3 g digestion samples................................III.115
III.9. Summary of laboratory responsibilities..............................................................III.214
III.10. Analytical methods for trace elements used by Battelle and SAIC, 1986..............III.214
III.11. Analytical methods for trace elements used by Battelle and SAIC, 1987..............III.215
III.12. Analytical methods for trace elements used by Battelle and SAIC, 1988 and1989..................................................................................................................III.216
III. i
LIST OF FIGURES
III.1. Flow injection system for sediment mercury analysis...........................................III.73
III.2. Flow injection system for sediment selenium analysis...........................................III.76
III.3. Flow injection system for tissue mercury analysis..............................................III.104
III. i i

PREFACE
The quantification of environmental contaminants and their effects by the National Oceanic andAtmospheric Administration's National Status and Trends Program began in 1984. Polycyclicaromatic hydrocarbons, butyltins, polychlorinated biphenyls, DDTs and other chlorinatedpesticides, trace and major elements, and a number of measures of contaminant effects arequantified in estuarine and coastal samples. There are two major monitoring components in thisprogram, the National Benthic Surveillance Project which is responsible for quantification ofcontamination in fish tissue and sediments, and developing and implementing new methods todefine the biological significance of environmental contamination, and the Mussel Watch Projectwhich monitors pollutant concentrations by quantifying contaminants in mollusk bivalves andsediments. Methods are described for sample collection, preparation, and quantification. Theevolution of methods, method detection limits, and the Quality Assurance Project are alsodiscussed.
This document is Volume III of the document entitled "National Benthic Surveillance and MusselWatch Projects Analytical Protocols 1984-1992," and contains detailed descriptions ofanalytical methods used for the determination of major and trace elements in sediments andtissues by participating laboratories participating in the NS&T Program (Tables P.1 and P.2).
Table P.1. Laboratories analyzing National Status and Trends Program National BenthicSurveillance Project samples for major and trace elements and pertinent chapters in thisdocument.
National Benthic Surveillance Project
Year 1984-1986 1987 1988-present
Northeast NEFSC (Sediments) NWFSC (Sediments) SEFSC (Sediments)Coast Zdanowicz, Finneran and Kothe Robisch and Clark (Evans and Hanson)
NEFSC (Tissues) NWFSC (Tissues) SEFSC (Tissues)Zdanowicz, Finneran and Kothe Robisch and Clark Evans and Hanson
Southeast and SEFSC (Tissues) SEFSC (Tissues) SEFSC (Tissues)Gulf Coasts Evans and Hanson (same) (same)
SEFSC (Sediments) SEFSC (Sediments) SEFSC (Sediments)Evans and Hanson (same) (same)
West Coast NWFSC (Sediments) NWFSC (Sediments) NWFSC (Sediments)Robisch and Clark (same) (same)NWFSC (Tissues) NWFSC (Tissues) NWFSC (Tissues)Robisch and Clark (same) (same)
NEFSC - NOAA/NMFS/Northeast Fisheries Science Center, Sandy Hook, NJ.SEFSC - NOAA/NMFS/Southeast Fisheries Science Center, Beaufort, NC.NWFSC - NOAA/NMFS/Northwest Fisheries Science Center, Seattle, WA.
I I I . i i i

Table P.2. Laboratories analyzing National Status and Trends Program Mussel Watch Projectsamples for major and trace elements and pertinent chapters in this document.
Mussel Watch Project
Year 1986-1987 1988 1989 1990-1993
East Coast Battelle Battelle Battelle BattelleCrecelius et al. (same) (same) (same)
Gulf Coast TAMU TAMU TAMU TAMUTaylor and Presley (same) (same) (same)
West CoastCalifornia SAIC SAIC∆ SAIC◊ Battelle
Peven et al. (same) (same) Crecelius et al.Oregon Battelle Battelle Battelle Battelle
Crecelius et al. (same) (same) (same)Washington Battelle Battelle Battelle Battelle
Crecelius et al. (same) (same) (same)Alaska Battelle Battelle NS Battelle
Crecelius et al. (same) - (same)Hawaii SAIC SAIC NS Battelle
Peven et al. (same) - Crecelius et al.
∆ Sn analyzed by Battelle. ◊ Se and Sn analyzed by Battelle. NS - Not sampled.Battelle - Battelle Ocean Sciences, Duxbury, MA, and Sequim, WA.TAMU - Geochemical and Environmental Research Group of Texas A&M University, College Station, TX.SAIC - Science Applications International Corporation, Inc.
G. G. Lauenstein and A. Y. CantilloEditors
Coastal Monitoring and Bioeffects Assessment DivisionOffice of Ocean Resources Conservation and Assessment
National Ocean Service
II I. iv

Total Dissolution of Marine Sediment and Atomic Absorption Analysis ofMajor and Trace Elements
V. S. Zdanowicz, T. W. Finneran and R. KotheNOAA/National Marine Fisheries Service
Northeast Fisheries Science Center, Sandy Hook LaboratoryHighlands, NJ
ABSTRACT
Methods are described for the total dissolution of marine sediment and the instrumentalanalysis of 17 major and trace elements, at the Sandy Hook Laboratory as part of theNational Benthic Surveillance Project of the National Status and Trends (NS&T)Program.
1. INTRODUCTION
These methods, for analysis of 17 metals in estuarine sediments, were developed as part of theNational Benthic Surveillance Project of the National Status and Trends (NS&T) Program. Thedigestion procedure is a combination of those described by Bernas (1968), Buckley, andCranston (1971), and Rantala and Loring (1975), adapted for use with Parr digestion bombs,and provides for total dissolution of sediments without loss of volatile elements. Seven of the17 elements can be determined by flame atomization methods, which are relatively rapid,leaving 9 elements for graphite furnace determination; Hg is determined using the cold vaportechnique. Although the primary objective in developing each instrumental method was that itshould be as simple and straightforward as possible while producing acceptable accuracy andprecision, most furnace methods contain multiple char steps and require matrix modification.
Users of the instrumental methods described below will probably have to modify certainparameter values to suit their particular instrumentation and equipment, due to variations inperformance between instruments. Such variations are caused by differences in furnacecalibrations, nebulizer characteristics, and other factors.
These methods were used at the NOAA National Marine Fisheries Service Northeast FisheriesScience Center Sandy Hook Laboratory to analyze NS&T samples collected from 1984 to 1986.Analytical results can be found in Zdanowicz and Gadbois (1990).
2. EQUIPMENT AND SUPPLIES
2.1. Instrumentation
Perkin-Elmer model Z/5000 spectrophotometer. Perkin-Elmer Corp., Norwalk, CT.
Burner (0040-0146) with flow spoiler and standard nebulizer (0303-0352)Dual lamp EDL power supplyFurnace cooling unitModel 056 dual pen recorderModel 500 graphite furnace atomizer with Zeeman background correction systemModel 3600 data terminal with model PRS 100 printerModel AS40 autosampler (for furnace analyses)
III.1

Model AS50 autosampler (for flame analyses)Model PRS 10 printer
Perkin-Elmer model Z/5100 spectrophotometer
Dual lamp EDL power supplyFurnace cooling unitModel 600 graphite furnace atomizer with Zeeman background correction systemModel 7700 data terminal with model PRS 210 printerModel AS60 autosampler (for furnace analysis)
Mercury Analyzer, Gold Film, 511. Arizona Instruments, Clarksdale, AZ.
2.2. Supplies
Acetylene, pre-purifiedArgon, 99.999% purityElectrodeless discharge lamps (EDL)Graphite tubes; pyrolytically coated, grooved, Perkin-Elmer B0109-322Hollow cathode lamps (HCL)Nitrous oxide, USP gradePlatforms, pyrolytically coated L'vov, Perkin-Elmer B0109-324
2.3. Labware
Balance, Mettler model PK300 with printer Parr bomb, 125-mL, Teflon tetrafluoro-ethylene (TFE) lined stainless steel, model4748. Parr, Moline, IL.
Bottles, 125-mL, polyethyleneCups, 2-mL, polyethyleneFilter paper, Whatman 41 Pipets, macro and microFlasks, volumetric, 100-mL, polypropylene Spatulas or transfer tubesFunnels, polypropylene Vials, 15-mL, Teflon polyfluoroalkoxy (PFA),
threaded with screw caps, model 02.5.Savillex, Minnetonka, MN.
Glass mortars and pestlesOvens, stainless steel, gravity convection,
OV-18SA. Blue M, Blue Island, IL.
PFA vials were cleaned using Micro detergent and rinsed in tap water. They were then soakedfor three days in hot (70-80°C) 10% HNO3 / 5% HCl solution, rinsed with deionized water,soaked for 3 days in room-temperature 0.1 M ethylenediamine tetraacetic acid (EDTA),tetrasodium salt, rinsed with deionized water, soaked for 3 days in hot deionized water, anddried in Class 100 laminar flow hoods. All other plasticware was soaked for three days in 10%HNO3 at room temperature, rinsed with deionized water, and dried as above.
2.4. Reagents
All reagents are ultrapure grades, except where so indicated.
Ammonium nitrate (NH4NO3) [6484-52-2],solid, 99.99%. Aesar, Ward Hill, MA.
Boric acid (H3BO3) [10043-35-3], solid, J. T.Baker 5168 or E. M. Science 765. J. T.Baker, Phillipsburg, NJ. or E. M. Science,Gibbstown, NJ.
Ascorbic acid (C6H8O6) [50-81-7], solid,reagent grade. J. T. Baker, Phillipsburg,NJ. Copper nitrate [Cu(NO3)2 . 2.5H2O] [19004-
19-4], solid, reagent gradeAtomic absorption standards, 1000 µg/mL.Aesar, Ward Hill, MA.
III.2

Hydrochloric acid (HCl) [7647-01-0],concentrated (37%), 4800. J. T. Baker,Phillipsburg, NJ.
Nitric acid (HNO3) [7697-37-2], concentrated(70%), Baker 4801 or G. F. Smith 621. J.T. Baker, Phillipsburg, NJ, or G.Frederick Smith Chemicals, Columbus, OH.Hydrofluoric acid (HF) [7664-39-3],
concentrated (48%), 4804. J. T. Baker,Phillipsburg, NJ.
Palladium nitrate [Pd(NO3)2], 9.984% Pd+2
solution, 12621. Aesar, Ward Hill, MA.Magnesium nitrate [Mg(NO3)2
. 6H2O] [13446-18-9], solid, 99.99%. Aesar, Ward Hill,MA.
Water, deionized, 18 megohm-cm resistivity
2.5. Solvents and matrix modifiers
2.5.1. M19 Diluent
This solvent is used for making blank and sample dilutions and for most instrumentalcalibration standards (see Calibration section). It is prepared in deionized water and contains40 g H3BO3, 60 mL concentrated HF, 7.5 mL concentrated HCl, and 2.5 mL concentratedHNO3 per liter of solution.
2.5.2. 1646 Modifier
This solution contains approximately the concentrations of Si, Fe, and Al that would be foundif 0.5 g NIST SRM 1646 were digested and brought to 100 mL volume. SRM 1646 was astandard reference material composed of estuarine sediment collected in Chesapeake Bay.
Dissolve 50.593 g Na2SiO4 . 6H2O per 100 mL of solution in deionized water to obtain
approximately 50,000 ppm Si.
Dissolve 10.851 g Fe(NO3)2 . 9H2O per 100 mL of solution in deionized water to obtain
approximately 15,000 ppm Fe.
Dissolve 4.172 g Al(NO3)3 . 9H2O per 100 mL of solution in deionized water to obtain
approximately 3,000 ppm Al.
Add 3 mL of the Si solution, 1 mL of the Fe solution, and 10 mL of the Al solution toapproximately 50 mL of M19 diluent. Make up to 100 mL volume in a polypropylenevolumetric flask using the M19 diluent.
This solution should be prepared 24-48 hr before use. It is used for calibration of Ag, Sn, As,Tl, and Sb analyses.
2.5.3. Matrix modifiers for graphite furnace analyses
Copper nitrate solution: 0.366 g Cu(NO3)2 . 2.5H2O per 100 mL of solution in deionized water
Magnesium nitrate solution: 1.731 g Mg(NO3)2 . 6H2O per 100 mL of solution in deionized
water
Ammonium nitrate solution: 5.000 g NH4NO3 per 100 mL of solution in deionized water
Palladium nitrate solution: 500-fold dilution of a 9.984% Pd+2 solution in deionized water
III.3
Ascorbic acid solution: 5.000 g ascorbic acid per 100 mL of solution in deionized water
3. SAMPLE TREATMENT
3.1. Drying
The top 3 cm of each core sample were dried overnight in polyethylene weighing boats in astainless steel gravity convection oven at 60-65°C, and subsequently cooled in a dessicator.They were then homogenized using glass mortars and pestles. The samples were stored inpolyethylene vials at room temperature until composited and analyzed.
3.2. Compositing
Composites used for analysis were comprised of equal weight portions of each of the threesediment samples collected at each station and dried as described above.
3.3. Digestion
Sandy Hook Laboratory Method 19: Total Digestion of Sediments
Three reagent blanks and three standard reference material (SRM) samples were included ineach analytical string of 36 samples. Reagent blanks contain no sample and were processedidentically to the samples.
Weigh 450 ± 15 mg homogenized, dried sample into a 15-mL PFA vial. Add 750 µLconcentrated HCl to each vial and begin wet-out of sample. Add 250 µL concentrated HNO3 toeach vial and continue wet-out of sample. Add 2 mL concentrated HF, swirling to completesample wet-out. Add 4 mL concentrated HF, rinsing the walls of the vial to insure that allsolids are washed down into the acid mixture.
Seal each vial tightly by hand. Place two vials in each bomb. Add 5 mL deionized water toeach bomb liner and seal the bombs according to manufacturer's recommendations. Placebombs in oven and heat to 120°C overnight.
When cool, vent internal pressure carefully in a fume hood, and remove vials. Allow vials tocool to room temperature.
Quantitatively transfer the contents of each vial to a 125-mL polyethylene screw cap bottle,containing 50 mL of 4.0% (0.647 M) boric acid in deionized water using a wash bottlecontaining boric acid solution. The volume of each polyethylene bottle should be no more than80 mL after transfer of the digest. Let stand 2-4 hours to allow dissolution of the fluorides.
Pretreat Whatman 41 filter paper by washing 3-4 times with M19 diluent, discarding thewash. Filter the sample solutions into 100-mL polypropylene volumetric flasks, removingany residue. Wash the filter paper 3-4 times with the boric acid solution and take to 100 mLwith the boric acid solution.
III.4
4. CALIBRATION
Calibration standards were prepared by serial dilution of commercially available atomicabsorption standards using class-A glass pipets and volumetric flasks, and 10% HNO3. Finalworking standards, except for Ag, were prepared in M19 diluent using micropipets and plasticvolumetric flasks. Concentrations of commercial standards were verified by comparison withNational Institute of Standards and Technology (NIST) spectrophotometric standards.
Standards of four different concentrations including zero were used and at least three replicatedeterminations were made for each concentration. This was accomplished by analyzing astandard at the start of each analytical string and after every three samples. For a set of36 samples, this resulted in at least 13 determinations of standards.
After each analytical string, the concentrations of the standards, together with the instrumentreadings obtained during the analysis of the standards, were used to calculate the slope,intercept, and correlation coefficient of the calibration curve using linear, least-squaresregression. The correlation coefficient, r, was typically ≥0.98 for a well-behaved analysis.
4.1. Sn, Sb, Tl and As calibration
The instrumental sensitivity of these elements was affected by the concentrations of Si, Fe,and Al in the sample solutions, so calibration standards were prepared using the 1646modifier.
For samples requiring dilution, the calibration standards were made-up using 1646 modifierdiluted in the same proportions. For example, if in an analytical string of 36 samples, 12 werediluted twofold, 12 fivefold, and 12 tenfold, then separate sets of calibration standards wereused for each set of 12 samples. The first set of standards was prepared in twofold-diluted1646 modifier, the second in fivefold-diluted 1646 modifier, and the third in tenfold-diluted1646 modifier. Samples and 1646 modifier were diluted with M19 diluent.
4.2. Ag calibration
The Ag standards were prepared in 10% HNO3 to insure that no losses occurred due to thepresence of halides. However, the sensitivity of the Ag analysis was also affected by theconcentrations of Si, Fe, and Al in the sample solutions. To compensate for these effects, thefollowing procedure was used. When analyzing a standard, 10 µL of standard and 10 µL ofappropriately diluted 1646 Modifier (see above) were used, and when analyzing a sample, 10µL of sample and 10 µL of 10% HNO3 were used.
As with Sn, Sb, Tl, and As, when samples were diluted, appropriately diluted (see above)1646 modifier was used for the standards.
4.3. Cd, Se, Sb, and Sn dilutions
Due to matrix effects, after digesting samples using SHL Method 19 described earlier,solutions were further diluted for the determination of Cd, Se, Sb, and Sn, even if theseelements were present in very low concentrations. The signal from a diluted sample may fallbelow the limit of detection, while the signal from the undiluted sample may be above the limitof detection. However, the latter (undiluted) signal was usually erroneous and was biased lowdue to matrix interferences that were reduced by dilution with M19 diluent.
III.5

5. CALCULATIONS
Using the value of the slope, m, of the calibration curve obtained by linear regression analysisof the calibration standards data, the concentration of analyte in sample and reagent blanksolutions was calculated using
C = Ym
where C is the concentration (µg/mL or ng/mL) of analyte in solution, Y is the absorbance ofthe sample and m is the slope of the calibration curve.
For Hg determinations, the formula used was
C = Y
m VHg
where VHg is the volume of sample used for Hg analysis.
B, the average of the reagent blanks, and sB, the standard deviation of B were then calculated.
The solution detection limit, DLS, was then calculated using
DLS = B + 3sB
Since all the samples theoretically contain B, DLS was used as a working detection limit todetermine which samples required a "less than" calculation. The actual detection limit, DL,defined as the minimum solution concentration that is reliably different from the averagereagent blank concentration, was calculated using
DL = DLS - B = 3sB
Typical method detection limits are listed in Table III.1.
The dry weight concentration of the analyte in the samples was calculated using the relation,
X = (C - B) (DF) (Vol)
Wt
where X is the concentration of analyte in the dry sample, C is the concentration of the analytein solution, B is the average reagent blank, DF is the amount of any additional dilution of thesample solution, Vol is the volume of the original sample solution (e.g. 100 mL), and Wt is thedry weight of the sample (e.g. 0.465 g). When C is in µg/mL, X is in µg/g, and when C is inng/mL, X is in ng/g.
For any sample with a solution concentration lower than the working detection limit, DLS, of anelement, a "less than" value was calculated using
X < (DLS - B) (DF) (Vol)
Wt .
III.6

Table III.1. Typical detection limits for Sandy Hook Laboratory Method 19 [0.45 g sedimentsample brought to 100 mL final volume (µg/g unless noted)].
Al 0.2 % Se 0.1Si 2 % Ag 0.01Cr 6 Cd 0.01Mn 3 Sn 0.2Fe 0.2 % Sb 0.2Ni 0.3 Hg 0.01Cu 4 Tl 0.2Zn 4 Pb 0.1As 0.1
6. REFERENCES
Bernas, B. (1968) A new method for the decomposition and comprehensive analysis of silicatesby atomic absorption spectrometry. Anal. Chem., 40:1682-86
Buckley, D. E., and R. E. Cranston (1971) Atomic absorption analyses of 18 elements from asingle decomposition of aluminosilicate. Chem. Geol., 7:273-84.
Rantala, R. T. T., and D. H. Loring (1975) Multi-element analysis of silicate rocks and marinesediments by atomic absorption spectrophotometry. At. Abs. Newslett., 14(5):117-20.
Zdanowicz, V. S., and D. F. Gadbois (1990) Contaminants in sediment and fish tissues fromestuarine and coastal sites of the northeast United States: Data summary of the baseline phaseof the National Status and Trends Program Benthic Surveillance Project, 1984 - 1986. NOAATech. Memo. NMFS-F/NEC-79. NOAA/National Marine Fisheries Service, Woods Hole, MA.
Additional references used in method development:
Alexander, J., K. Saeed, and Y. Thomassen (1980) Thermal stabilization of inorganic andorgano-selenium compounds for direct electrothermal atomic absorption spectrometry. Anal.Chim. Acta, 120:377-82.
Amore, F. (1974) Determination of cadmium, lead, thallium, and nickel in blood by atomicabsorption spectrometry. Anal. Chem., 46(11):1597-99.
Bauslaugh, J., B. Radziuk, K. Saeed, and Y. Thomassen (1984) Reduction of effects ofstructured non-specific absorption in the determination of arsenic and selenium byelectrothermal atomic absorption spectrometry. Anal. Chim. Acta, 165:149-57.
Berrow, M. L., and W. M. Stein (1983) Extraction of metals from soils and sewage sludges byrefluxing with aqua regia. Analyst, 108:277-85.
Bloom, N. (1983) Determination of silver in marine sediments by Zeeman corrected graphitefurnace atomic absorption spectrometry. At. Spectrosc., 4(6):204-7.
III.7

Bloom, N. S., and E. Crecelius (1983) Determination of mercury in seawater at sub-nanogramper liter levels. Mar. Chem., 14:49-59.
Cantillo, A. Y., S. A. Sinex, and G. R. Helz (1984) Elemental analysis of estuarine sediments bylithium metaborate fusion and direct current plasma emission spectrometry. Anal. Chem.,56:33-7.
Carlton-Smith, C. H., and R. D. Davis (1983) An inter-laboratory comparison of metaldeterminations in sludge-treated soil. Wat. Pollut. Contr., 544-56.
Chakrabarti, D., W. DeJonghe, and F. Adams (1980) The determination of arsenic byelectrothermal atomic absorption spectrometry with a graphite furnace. Part 1. Difficulties inthe direct determination. Anal. Chim. Acta, 119:331-41.
Criaud, A., and C. Fovillac (1985) Use of the L'vov platform and molybdenum coating for thedetermination of volatile elements in thermomineral waters by atomic absorptionspectrometry. Anal. Chim. Acta, 167:257-67.
Davis, R. D., and C. H. Carlton-Smith (1983) An inter-laboratory comparison of metaldeterminations in sewage sludges and soil. Wat. Pollut. Contr., 290-308.
deBenzo, Z. A., and R. Fraile (1984) Behavior of low salt content aqueous solutions of lead inhafnium treated graphite tubes for atomic absorption spectrometry. At. Spectrosc., 5(5):204-208.
deOliveira, E., J. W. McLaren, and S. S. Berman (1983) Simultaneous determination of arsenic,antimony and selenium in marine samples by inductively coupled plasma atomic emissionspectrometry. Anal. Chem., 55:2047-50.
Desaulniers, J. A. H., R. E. Sturgeon, and S. S. Berman (1985) Atomic absorption determinationof trace metals in marine sediments and biological tissues using a stabilized temperatureplatform furnace. At. Spectrosc., 6(5):125-7.
Ebdon, L., and J. R. Wilkinson (1981) Determination of sub-nanogram amounts of mercury bycold-vapor atomic fluorescence spectrometry with an improved gas-sheathed atom cell. Anal.Chim. Acta, 128:45-55.
Eggiman, D. W., and P. R. Betzer (1976) Decomposition and analysis of refractory oceanicsuspended materials. Anal. Chem., 48(6):886-90.
Erspamer, J. P., and T. M. Niemczyk (1982) Effect of graphite surface type on determination oflead and nickel in a magnesium chloride matrix by furnace atomic absorption spectrometry.Anal. Chem., 54:2150-4.
Fernandez, F. J., S. A. Myers, and W. Slavin (1980) Background correction in atomicabsorption using the Zeeman effect. Anal. Chem., 52:741-6.
Ferrara, R., A. Seritti, C. Barghigiani, and A. Petrosino (1980) Improved instrument formercury determination by atomic fluorescence spectrometry with a high frequencyelectrodeless discharge lamp. Anal. Chim. Acta, 117:391-395.
III.8

Fiorino, J. A., J. W. Jones, and S. G. Capar (1976) Sequential determination of arsenic,selenium, antimony and tellurium and foods via rapid hydride evolution and atomic absorptionspectrometry. Anal. Chim. Acta, 48:120-5.
Fuller, C. W. (1976) The effect of acids on the determination of thallium by atomic absorptionspectrometry with a graphite furnace. Anal. Chim. Acta, 81:199-202.
Gladney, E. S., and W. E. Goode (1981) Elemental concentrations in eight new United StatesGeological Survey rock standards: A review. Geostand. Newslett., 5(1):31-4.
Grobenski, Z., W. Erler, and U. Voellkopf. (1985) Determination of mercury with Zeemangraphite furnace AAS. At. Spectrosc., 6(4):91-3.
Guevremont, R., R. E. Sturgeon, and S. S. Berman (1980) Application of EDTA to direct graphitefurnace atomic absorption analysis for cadmium in sea water. Anal. Chim. Acta, 115:163-70.
Hatch, W. R., and W. L. Ott (1968) Determination of submicrogram quantities of mercury byatomic absorption spectrophotometry. Anal. Chem., 40(14):2085-7.
Hoenig, M., and R. deBorger (1983) Particular problems encountered in trace metal analysis ofplant material by atomic absorption spectrometry. Spectr. Acta, 38B(5,6):873-880.
Iskandar, I. K., J. K. Syers, L. W. Jacobs, D. R. Keeney, and J. T. Gilmour (1972)Determination of total mercury in sediments and soils. Analyst, 97:388-93.
Issaq, H., and W. L. Zielinski, Jr. (1974) Hot atomic absorption spectrometry method for thedetermination of mercury at the nanogram and subnanogram level. Anal. Chem., 46(11):1436-8.
Kahn, H. L., F. J. Fernandez, and S. Slavin (1972) The determination of lead and cadmium insoils and leaves by atomic absorption spectroscopy. At. Abs. Newslett., 11(2):42-5.
Kaiser, M. L., S. R. Koirtyohann, E. J. Hinderberger, and H. E. Taylor (1981) Reduction ofmatrix interference in furnace atomic absorption with the L'vov platform. Spectr. Acta,36B(8):773-83.
Kirkbright, G. F., S. Hsiao-Chuan, and R. D. Snook. (1980) An evaluation of some matrixmodification procedures for use in the determination of mercury and selenium by atomicabsorption spectroscopy with a graphite furnace electrothermal atomizer. At. Spectrosc.,1:85-9.
Koreckova, J., W. French, E. Lundberg, J. Persson, and A. Cedergren (1981) Investigations ofreactions involved in electrothermal atomic absorption procedures. Part 10. Factors influencingthe determination of arsenic. Anal. Chim. Acta, 130:267-80.
Krivan, V., K. Petrick, B. Welz, and M. Melcher (1985) Radiotracer error diagnosticinvestigation of selenium determination by hydride generation atomic absorption spectrometryinvolving treatment with hydrogen peroxide and hydrochloric acid. Anal. Chem., 57:1703-6.
Laxen, D. P. H., and R. M. Harrison (1981) Cleaning methods for polythene containers prior tothe determination of trace metals in freshwater samples. Anal. Chem., 53:345-50.
III.9

Lener, J. and B. Bibr (1971) Determination of traces of cadmium in biological materials byatomic absorption spectrophotometry. J. Agr. Food Chem., 19(5):1011-3.
Liem, I., G. Kaiser, M. Sager, and G. Tolg (1984) The determination of thallium in rocks andbiological materials at ng/g levels by differential pulse anodic stripping voltammetry andelectrothermal atomic absorption spectrometry. Anal. Chim. Acta, 158:179-97.
Lundberg, E., B. Bergmark, and W. Frech (1982) Investigations of reactions involved inelectrothermal atomic absorption procedures. Part 11. A theoretical and experimentalinvestigation of factors influencing the determination of tin. Anal. Chim. Acta, 142:129-42.
Manning, D. C., and W. Slavin (1978) Determination of lead in a chloride matrix with thegraphite furnace. Anal. Chem., 50:1234-8.
Markunas, L. D., E. F. Barry, G. P. Guiffre, and R. Litman (1979) An improved procedure forthe determination of lead in environmental samples by atomic absorption spectroscopy. J.Environ. Sci. Health, A14(6):501-6.
Matthews, A. D., and J. P. Riley (1969) The determination of thallium in silicate rocks, marinesediments and sea water. Anal. Chim. Acta, 48:25-34.
May, T. W., and D. A. Kane (1984) Matrix-dependent instability of selenium (IV) stored inTeflon containers. Anal. Chim. Acta, 161:387-91.
McLaren, J. W., S. S. Berman, V. J. Boyko, and D. S. Russell (1981) Simultaneousdetermination of major, minor, and trace elements in marine sediments by inductively coupledplasma atomic emission spectrometry. Anal. Chem., 53:1802-6.
Moody, J. R., and R. M. Lindstrom (1977) Selection and cleaning of plastic containers forstorage of trace element samples. Anal. Chem., 49(14):2264-7.
Morita, H., T. Mitsuhashi, H. Sakurai, and S. Shimomura (1983) Absorption of mercury bysolutions containing oxidants. Anal. Chim. Acta, 153:351-5.
Murphy, P. J. (1979) Determination of nanogram qualities of mercury in liquid matrices by agold film mercury detector. Anal. Chem., 51(9):1599-1600.
Muscat, V. I., T. J. Vickers, and A. Andren (1972) Simple and versatile atomic fluorescencesystem for determination of nanogram quantities of mercury. Anal. Chem., 44(2):218-21.
Nakahara, T., T. Tanka, and S. Musha (1977) Flameless atomic fluorescence spectrometry ofmercury by dispersive and nondispersive systems in combination with a cold-vapor technique.Bull. Chem. Soc. Japan, 51(7):2020-4.
Norval, E., H. G. C. Human, and L. R. P. Butler (1979) Carbide coating process for graphitetubes in electrothermal atomic absorption spectrometry. Anal. Chem., 51(12):2045-8.
Okamoto, K., and K. Fuwa (1984) Low-contamination digestion bomb method using a Teflondouble vessel for biological materials. Anal. Chem., 56:1758-60.
Pegon, Y. (1985) Direct determination of arsenic in blood serum by electrothermal atomicabsorption spectrometry. Anal. Chim. Acta, 172:147-56.
III.10

Pruszkowska, E., D. C. Manning, G., R. Carnrick, and W. Slavin (1983) Experimental conditionsfor the determination of tin with the stabilized temperature platform furnace and Zeemanbackground correction. At. Spectrosc., 4:87-93.
Pruszkowska, E., and P. Barrett (1984) Determination of As, Se, Cr, Co, and Ni in geochemicalsamples using the stabilized temperature platform furnace and Zeeman background correction.Spectrochim. Acta, 39B(2,3):485-91.
Randlesome, J. E., and S. R. Aston (1980) A rapid method for the determination of mercury insediments, suspended solids and soils. Environ. Technol. Lett., 1:3-8.
Rantala, R. T. T., and D. H. Loring (1973) New, low-cost Teflon decomposition vessel. At. Abs.Newslett., 12:97-9.
Rantala, R. T. T., and D. H. Loring (1978) Atomic absorption analysis of USGS reference samplemarine mud MAG-1 for selected trace elements. Geostand. Newslett., 2(2):125-7.
Reamer, D. C., C. Veillon, and P. T. Tokousbalides (1981) Radiotracer techniques for evaluationof selenium hydride generation systems. Anal. Chem., 53:245-8.
Ritter, C. J., and S. C. Bergman (1978) Comparison of sample preparation techniques foratomic absorption analysis of sewage sludge and soil. At. Abs. Newslett., 17(4):70-2.
Robertson, D. E. (1968) Role of contamination in trace element analysis of sea water. Anal.Chem., 40(7):1067-72.
Saeed, K., and Y. Thomassen (1981) Spectral interferences from phosphate matrices in thedetermination of arsenic, antimony, selenium and tellurium by electrothermal atomicabsorption spectrometry. Anal. Chim. Acta, 130:281-7.
Salmon, S. G., and J. A. Holcombe (1982) Alteration of metal release mechanisms in graphitefurnace atomizers by chemisorbed oxygen. Anal. Chem., 54:630-4.
Sighinolfi, G. P., C. Gorgoni, and A. M. Santos (1980) Atomic absorption determination ofultratrace elements in geological materials by vapor hydride-forming techniques. 1. MercuryGeostand. Newslett., 4(2):223-7.
Sinemus, H. W., M. Melcher, and B. Welz (1981) Influence of valence state on the determinationof antimony, arsenic, bismuth, selenium and tellurium in lake water using the hydride AAtechnique. At. Spectrosc., 2:81-86.
Slavin, W., D. C. Manning, and G. R. Carnrick (1981) The stabilized temperature platformfurnace. At. Spectrosc., 2(5):137-45.
Slavin, W., G. R. Carnrick, and D. C. Manning (1982) Graphite tube effects on perchloric acidinterferences on aluminum and thallium in the stabilized temperature platform furnace. Anal.Chim. Acta, 138:103-10.
Slavin, W., G. R. Carnrick, D. C. Manning, and E. Pruszkowska (1983) Recent experiences withthe stabilized temperature platform furnace and Zeeman background correction. At. Spectrosc.,4:69-86.
III.11

Sotera, J. J., L. C. Cristiano, M. K. Conley, and H. L. Kahn (1983) Reduction of matrixinterferences in furnace atomic absorption spectrometry. Anal. Chem., 55:204-8.
Sturgeon, R. E., J. A. H. Desaulniers, S. S. Berman, and D. S. Russell (1982) Determination oftrace metals in estuarine sediments by graphite furnace atomic absorption spectrometry. Anal.Chim. Acta, 134:283-91.
Thompson, K. C., R. G. Godden, and D. R. Thomerson (1975) A method for the formation ofpyrolytic graphite coatings and enhancement by calcium addition techniques for graphite rodflameless atomic absorption spectrometry. Anal. Chim. Acta, 74:289-97.
Tominaga, M., and Y. Umezaki (1979) Determination of submicrogram amounts of tin by atomicabsorption spectrometry with electrothermal atomization. Anal. Chim. Acta, 110:55-60.
Tominaga, M., and Y. Umezaki (1982) Comparison of ascorbic acid and related compounds asinterference suppressors in electrothermal atomic absorption spectrometry. Anal. Chim. Acta,139:279-85.
Tominaga, M., and Y. Umezaki (1983) Evaluation of interference suppressors in electrothermalatomic absorption spectrometry. Anal. Chim. Acta, 148:285-91.
Veillon, C., B. E. Guthrie, and W. R. Wolf (1980) Retention of chromium by graphite furnacetubes. Anal. Chem., 52:457-9.
Vickrey, T. M., G. W. Harrison, and G. J. Ramelow (1981) Treated graphite surfaces fordetermination of tin by graphite furnace atomic absorption spectrometry. Anal. Chem.,53:1573-6.
Vijan, P. N., and D. Leung (1980) Reduction of chemical interference and speciation studies inthe hydride generation atomic absorption method for selenium. Anal. Chim. Acta, 120:141-6.
Voellkopf, V., and Z. Grobenski (1984) Interferences in the analysis of biological samples usingthe stabilized temperature platform furnace and Zeeman background correction. At. Spectrosc.,5:115-22.
Welcher, G. G., O. H. Kriege, and J. Y. Marks (1974) Direct determination of trace quantities oflead, bismuth, selenium, tellurium and thallium in high temperature alloys by non-flame atomicabsorption spectrophotometry. Anal. Chem., 46(9):1227-31.
Welz, B., and M. Melcher (1985) Decomposition of marine biological tissues for determinationof arsenic, selenium and mercury using hydride generation and cold vapor atomic absorptionspectrometry. Anal. Chem., 57:427-31.
Xio-Quan, D., N. Zhe-Ming, and Z. Li (1983) Determination of arsenic in soil, coal fly ash andbiological samples by electrothermal atomic absorption spectrometry with matrix modification.Anal. Chim. Acta, 151:179-85.
Xiao-Quan, D., N. Zhe-Ming, and Z. Li. (1984) Use of arsenic resonance line of 197.2 nm andmatrix modification for determination of arsenic in environmental samples by graphite furnaceatomic absorption spectrometry using palladium as a matrix modifier. At. Spectrosc., 5 (1):1-4.
III.12

Zatka, V. J. (1987) Tantalum treated graphite atomizer tubes for atomic absorptionspectrometry. Anal. Chem., 50(3):538-41.
Zhu, J. - L. (1984) Determination of trace tin in river sediment and coal fly ash by graphitefurnace atomic absorption spectrometry using a mixture of ascorbic acid and iron as matrixmodifiers. At. Spectrosc., 5:91-5.
III.13

7. INSTRUMENTAL ANALYSIS
7.1. Aluminum
METHOD: Flame Atomic Absorption
DIGEST MATRIX: M19 diluent. Diluted ten-fold using M19 diluent.
INSTRUMENT SETTINGS:
Wavelength: 309.3 nmLamp: HCL, 7 ma (Perkin-Elmer 0303-6009)Fuel: AcetyleneOxidant: Nitrous oxideMixture: Rich (red)Burner head: Single-slot, 5 cm, 0° rotationSlit width setting: 0.2HBackground correction: NoneSignal mode: Peak height/holdScale expansion: NoneRead delay: 4 secNumber of readings: 3 sec/reading, average of 3 readsOutput: To data terminal and printer
STANDARDS: 0, 10, 30, and 50 µg Al/mL prepared in M19 diluent using Aesar Alspectral standard (13856). Auto-zero using deionized water.
TYPICAL SENSITIVITY: Absorbance is approximately 0.220 for a 50.0 µg/mL standard.
CALIBRATION: Peak height of standard versus concentration of standard. Computethe slope, intercept, and correlation coefficient using linear, least-squares regression.
MATRIX MODIFICATION: None
NOTES: Aspirate 10% HNO3 between samples.Scrape ash build-up off burner slot every 4-6 readings.
III.14
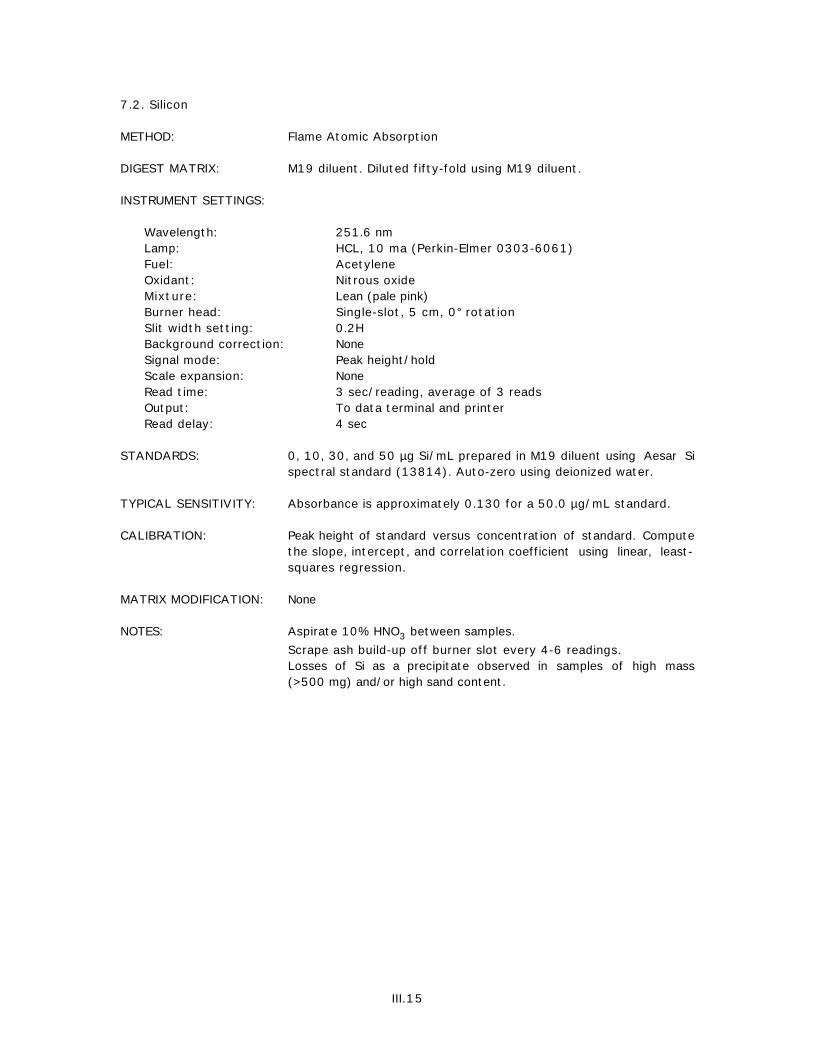
7.2. Silicon
METHOD: Flame Atomic Absorption
DIGEST MATRIX: M19 diluent. Diluted fifty-fold using M19 diluent.
INSTRUMENT SETTINGS:
Wavelength: 251.6 nmLamp: HCL, 10 ma (Perkin-Elmer 0303-6061)Fuel: AcetyleneOxidant: Nitrous oxideMixture: Lean (pale pink)Burner head: Single-slot, 5 cm, 0° rotationSlit width setting: 0.2HBackground correction: NoneSignal mode: Peak height/holdScale expansion: NoneRead time: 3 sec/reading, average of 3 readsOutput: To data terminal and printerRead delay: 4 sec
STANDARDS: 0, 10, 30, and 50 µg Si/mL prepared in M19 diluent using Aesar Sispectral standard (13814). Auto-zero using deionized water.
TYPICAL SENSITIVITY: Absorbance is approximately 0.130 for a 50.0 µg/mL standard.
CALIBRATION: Peak height of standard versus concentration of standard. Computethe slope, intercept, and correlation coefficient using linear, least-squares regression.
MATRIX MODIFICATION: None
NOTES: Aspirate 10% HNO3 between samples.Scrape ash build-up off burner slot every 4-6 readings.Losses of Si as a precipitate observed in samples of high mass(>500 mg) and/or high sand content.
III.15

7.3. Chromium
METHOD: Flame Atomic Absorption
DIGEST MATRIX: M19 diluent. For additional dilutions use M19 diluent.
INSTRUMENT SETTINGS:
Wavelength: 357.9 nmLamp: HCL, 25 ma (Perkin-Elmer 0303-6021)Fuel: AcetyleneOxidant: AirMixture: Rich (pale yellow)Burner head: Three-slot, 10 cm, 0° rotationSlit width setting: 0.7HBackground correction: NoneSignal mode: Peak height/holdScale expansion: NoneRead time: 3 sec/reading, average of 3 readsOutput: To data terminal and printerRead delay: 4 sec
STANDARDS: 0, 1, 2, and 4 µg Cr/mL prepared in M19 diluent using Aesar Crspectral standard (13864). Auto-zero using deionized water.
TYPICAL SENSITIVITY: Absorbance is approximately 0.240 for a 4.00 µg/mL standard.
CALIBRATION: Peak height of standard versus concentration of standard. Computethe slope, intercept, and correlation coefficient using linear, least-squares regression.
MATRIX MODIFICATION: None
NOTES: Aspirate 10% HNO3 between samples.
III.16

7.4. Manganese
METHOD: Flame Atomic Absorption
DIGEST MATRIX: M19 diluent. For additional dilutions use M19 diluent.
INSTRUMENT SETTINGS:
Wavelength: 279.5 nmLamp: HCL, 7 ma (Perkin-Elmer 0303-6043)Fuel: AcetyleneOxidant: AirMixture: Lean (pale blue)Burner head: Three-slot, 10 cm, 0° rotationSlit width setting: 0.2HBackground correction: NoneSignal mode: Peak height/holdScale expansion: NoneRead time: 3 sec/reading, average of 3 readsOutput: To data terminal and printerRead delay: 4 sec
STANDARDS: 0, 0.5, 1, and 2 µg Mn/mL prepared in M19 diluent using Aesar Mnspectral standard (13826). Auto-zero using deionized water.
TYPICAL SENSITIVITY: Absorbance is approximately 0.250 for a 2 µg/mL standard.
CALIBRATION: Peak height of standard versus concentration of standard. Computethe slope, intercept, and correlation coefficient using linear, least-squares regression.
MATRIX MODIFICATION: None
NOTES: Aspirate 10% HNO3 between samples.Losses observed in sample solutions containing precipitated Si.
III.17

7.5. Iron
METHOD: Flame Atomic Absorption
DIGEST MATRIX: M19 diluent. Diluted fifty-fold using M19 diluent.
INSTRUMENT SETTINGS:
Wavelength: 248.3 nmLamp: HCL, 30 ma (Perkin-Elmer 0303-6037)Fuel: AcetyleneOxidant: AirMixture: Lean (pale blue)Burner head: Three-slot, 10 cm, 0° rotationSlit width setting: 0.2HBackground correction: NoneSignal mode: Peak height/holdScale expansion: NoneRead time: 3 sec/reading, average of 3 readsOutput: To data terminal and printerRead delay: 4 sec
STANDARDS: 0, 1, 2, and 4 µg Fe/mL prepared in M19 diluent using Aesar Fespectral standard (13830). Auto-zero using deionized water.
TYPICAL SENSITIVITY: Absorbance is approximately 0.180 for a 4.00 µg/mL standard.
CALIBRATION: Peak height of standard versus concentration of standard. Computethe slope, intercept, and correlation coefficient using linear, least-squares regression.
MATRIX MODIFICATION: None
NOTES: Aspirate 10% HNO3 between samples.Alternate wavelength, 248.8 nm, may be used.
III.18

7.6. Nickel
METHOD: Graphite Furnace Atomic Absorption
DIGEST MATRIX: M19 diluent. For additional dilutions use M19 diluent.
INSTRUMENT SETTINGS:
Wavelength: 232.2 nmLamp: HCL, 25 ma (Perkin-Elmer 0303-6047)Platform: L'vov, coatedCarrier gas: ArgonSlit width setting: 0.2LBackground correction: ZeemanSignal mode: Peak areaScale expansion: NoneRead time: 5 secOutput: To data terminal, printer and recorder
FURNACE PROGRAM:
Step T(°C) Time (sec) Internal GasRamp Hold Flow (mL/min)
Dry 120 10 25 300Char l 450 10 10 300Char 2 1450 10 10 300Atomize 2900 0 5 0Cool l 20 1 10 300Cleanout 3000 1 5 300Cool 2 20 1 10 300
STANDARDS: 0, 10, 20, and 40 µg Ni/mL prepared in M19 diluent using Aesar Nispectral standard (13839). Auto-zero using air.
TYPICAL SENSITIVITY: Peak area is approximately 0.240 for a 40.0 ng/mL standard.
CALIBRATION: Peak area of standard versus concentration of standard. Computethe slope, intercept, and correlation coefficient using linear, least-squares regression.
INJECTION VOLUME: 20 µL
MATRIX MODIFICATION: None
III.19

7.7. Copper
METHOD: Flame Atomic Absorption
DIGEST MATRIX: M19 diluent. For additional dilutions use M19 diluent.
INSTRUMENT SETTINGS:
Wavelength: 324.8 nmLamp: HCL, 15 ma (Perkin-Elmer 0303-6024)Fuel: AcetyleneOxidant: AirMixture: Lean (pale blue)Burner head: Three-slot, 10 cm, 0° rotationSlit width setting: 0.7HBackground correction: NoneSignal mode: Peak height/holdScale expansion: NoneRead time: 3 sec/reading, average of 3 readsOutput: To data terminal and printerRead delay: 4 sec
STANDARDS: 0, 1, 3, and 5 µg Cu/mL prepared in M19 diluent using Aesar Cuspectral standard (13867). Auto-zero using deionized water.
TYPICAL SENSITIVITY: Absorbance is approximately 0.230 for a 5.00 µg/mL standard.
CALIBRATION: Peak height of standard versus concentration of standard. Computethe slope, intercept, and correlation coefficient using linear, least-squares regression.
MATRIX MODIFICATION: None
NOTES: Aspirate 10% HNO3 between samples.
III.20

7.8. Zinc
METHOD: Flame Atomic Absorption
DIGEST MATRIX: M19 diluent. For additional dilutions, use M19 diluent.
INSTRUMENT SETTINGS:
Wavelength: 213.9 nmLamp: HCL, 15 ma (Perkin-Elmer 0303-6081)Fuel: AcetyleneOxidant: AirMixture: Lean (pale blue)Burner head: Three-slot, 10 cm, 0° rotationSlit width setting: 0.7HBackground correction: NoneSignal mode: Peak height/holdScale expansion: NoneRead time: 3 sec/reading, average of 3 readsOutput: To data terminal and printerRead delay: 4 sec
STANDARDS: 0, 0.25, 0.5, and 1 µg Zn/mL prepared in M19 diluent using AesarZn spectral standard (13835). Auto-zero using deionized water.
TYPICAL SENSITIVITY: Absorbance is approximately 0.255 for a 1.00 µg/mL standard.
CALIBRATION: Peak height of standard versus concentration of standard. Computethe slope, intercept, and correlation coefficient using linear, least-squares regression.
MATRIX MODIFICATION: None
NOTES: Aspirate 10% HNO3 between samples.
III.21

7.9. Arsenic
METHOD: Graphic Furnace Atomic Absorption
DIGEST MATRIX: M19 diluent. For additional dilutions use M19 diluent.
INSTRUMENT SETTINGS:
Wavelength: 193.7 nmLamp: EDL, 6 w (Perkin-Elmer 0303-6211)Platform: L'vov, coatedCarrier gas: ArgonSlit width setting: 0.7LBackground correction: ZeemanSignal mode: Peak areaScale expansion: NoneRead time: 5 secOutput: To data terminal, printer, and recorder
FURNACE PROGRAM:
Step T(°C) Time (sec) Internal GasRamp Hold Flow (mL/min)
Dry 120 10 30 300Char l 450 10 10 300Char 2 1000 10 10 300Atomize 2550 0 5 0Cool l 20 1 10 300Cleanout 2900 1 5 300Cool 2 20 1 10 300
STANDARDS: 0, 5, 15, and 30 µg As/mL prepared in appropriately diluted 1646modifier using Aesar As spectral standard (13839). Auto-zerousing air without modifier.
TYPICAL SENSITIVITY: Peak area is approximately 0.175 for a 30.0 ng/mL standard.
CALIBRATION: Peak area of standard versus concentration of standard. Computethe slope, intercept, and correlation coefficient using linear, least-squares regression.
INJECTION VOLUME: 20 µL
MATRIX MODIFICATION: 5 µL 1:1 mixture of palladium nitrate and magnesium nitratesolutions (see matrix modifiers section for preparationinstructions).
NOTES: See Calibration section.
III.22

7.10. Selenium
METHOD: Graphic Furnace Atomic Absorption
DIGEST MATRIX: M19 diluent. Samples must be diluted at least two-fold.
INSTRUMENT SETTINGS:
Wavelength: 196.0 nmLamp: EDL, 4.5 watts (Perkin-Elmer 0303-6262)Platform: L'vov, coatedCarrier gas: ArgonSlit width setting: 2.0LBackground correction: ZeemanSignal mode: Peak heightScale expansion: NoneRead time: 5 secOutput: To data terminal, printer and recorder
FURNACE PROGRAM:
Step T(°C) Time (sec) Internal GasRamp Hold Flow (mL/min)
Dry 120 10 20 300Char1 350 10 10 300Char2 600 10 10 300Atomize 2600 0 5 0Cool1 20 1 10 300Cleanout 2900 1 5 300Cool2 20 1 10 300
STANDARDS: 0, 5, 10, and 20 ng Se/mL prepared in M19 diluent using Aesar Sespectral standard (13845). Auto-zero using air without modifier.
TYPICAL SENSITIVITY: Absorbance is approximately 0.080 for a 20.0 ng/mL standard.
CALIBRATION: Peak height of standard versus concentration of standard. Computethe slope, intercept, and correlation coefficient using linear, least-squares regression.
INJECTION VOLUME: 20 µL
MATRIX MODIFICATION: 5 µL 1:1 mixture of copper nitrate and magnesium nitrate solutions(see matrix modifiers section for preparation instructions).
III.23

7.11. Silver
METHOD: Graphite Furnace Atomic Absorption
DIGEST MATRIX: M19 diluent. For additional dilutions, use M19 diluent.
INSTRUMENT SETTINGS:
Wavelength: 328.1 nmLamp: HCL, 10 ma (Perkin-Elmer 0303-6064)Platform: L'vov, coatedCarrier gas: ArgonSlit width setting: 0.7LBackground correction: ZeemanSignal mode: Peak heightScale expansion: NoneRead time: 5 secOutput: To data terminal, printer, and recorder
FURNACE PROGRAM:
Step T(°C) Time (sec) Internal GasRamp Hold Flow (mL/min)
Dry 120 10 25 300Char1 450 10 10 300Char2 700 10 10 300Atomize 2100 0 5 0Cool1 20 1 10 300Cleanout 2900 1 5 300Cool2 20 1 10 300
STANDARDS: 0, 0.5, 1.5, and 3.0 ng Ag/mL prepared in 10% HNO3 using AesarAg spectral standard (13849). Auto-zero using air withoutmodifier.
TYPICAL SENSITIVITY: Absorbance is approximately 0.120 for a 3.0 ng/mL standard.
CALIBRATION: Peak height of standard versus concentration of standard. Computethe slope, intercept, and correlation coefficient using linear, least-squares regression.
INJECTION VOLUME: 10 µL
MATRIX MODIFICATION: 10 µL 10% HNO3 for sample digests, and 10 µL appropriatelydiluted 1646 modifier solution for standards.
NOTES: See Calibration section.
III.24

7.12. Cadmium
METHOD: Graphite Furnace Atomic Absorption
DIGEST MATRIX: M19 diluent. Samples must be diluted at least two-fold.
INSTRUMENT SETTINGS:
Wavelength: 228.8 nmLamp: HCL, 4 ma (Perkin-Elmer 0303-6016)Platform: L'vov, coatedCarrier gas: ArgonSlit width setting: 0.7LBackground correction: ZeemanSignal mode: Peak areaScale expansion: NoneRead time: 5 secOutput: To data terminal, printer, and recorder
FURNACE PROGRAM:
Step T(°C) Time (sec) Internal GasRamp Hold Flow (mL/min)
Dry 120 10 30 300Char1 450 10 25 300Atomize 1500 0 5 0Cool1 20 1 10 300Cleanout 2700 1 5 300Cool2 20 1 10 300
STANDARDS: 0, 0.2, 0.5, and 1 ng Cd/mL prepared in M19 diluent using AesarCd spectral standard (13813). Auto-zero using air.
TYPICAL SENSITIVITY: Peak area is approximately 0.140 for a 1.00 ng/mL standard.
CALIBRATION: Peak area of standard versus concentration of standard. Computethe slope, intercept, and correlation coefficient using linear, least-squares regression.
INJECTION VOLUME: 20 µL
MATRIX MODIFICATION: None
III.25

7.13. Tin
METHOD: Graphite Furnace Atomic Absorption
DIGEST MATRIX: M19 diluent. Samples must be diluted at least two-fold.
INSTRUMENT SETTINGS:
Wavelength: 286.3 nmLamp: EDL, 6 watts (Perkin-Elmer 0303-6274)Platform: L'vov, coatedCarrier gas: ArgonSlit width setting: 0.7LBackground correction: ZeemanSignal mode: Peak heightScale expansion: NoneRead time: 5 secOutput: To data terminal, printer, and recorder
FURNACE PROGRAM:
Step T(°C) Time (sec) Internal GasRamp Hold Flow (mL/min)
Dry 120 10 30 300Char1 450 10 10 300Char2 800 10 10 300Atomize 2600 0 5 0Cool1 20 1 10 300Cleanout 2900 1 5 300Cool2 20 1 10 300
STANDARDS: 0, 5, 15, and 30 ng Sn/mL prepared in appropriately diluted 1646modifier solution using Aesar Sn spectral standard (13863). Auto-zero using air without modifier.
TYPICAL SENSITIVITY: Absorbance is approximately 0.270 for a 30.0 ng/mL standard.
CALIBRATION: Peak height of standard versus concentration of standard. Computethe slope, intercept, and correlation coefficient using linear, least-squares regression.
INJECTION VOLUME: 20 µL
MATRIX MODIFICATION: 5 µL 1:1 mixture of palladium nitrate and ammonium nitratesolutions (see matrix modifiers section for preparationinstructions).
NOTES: See Calibration section.
III.26
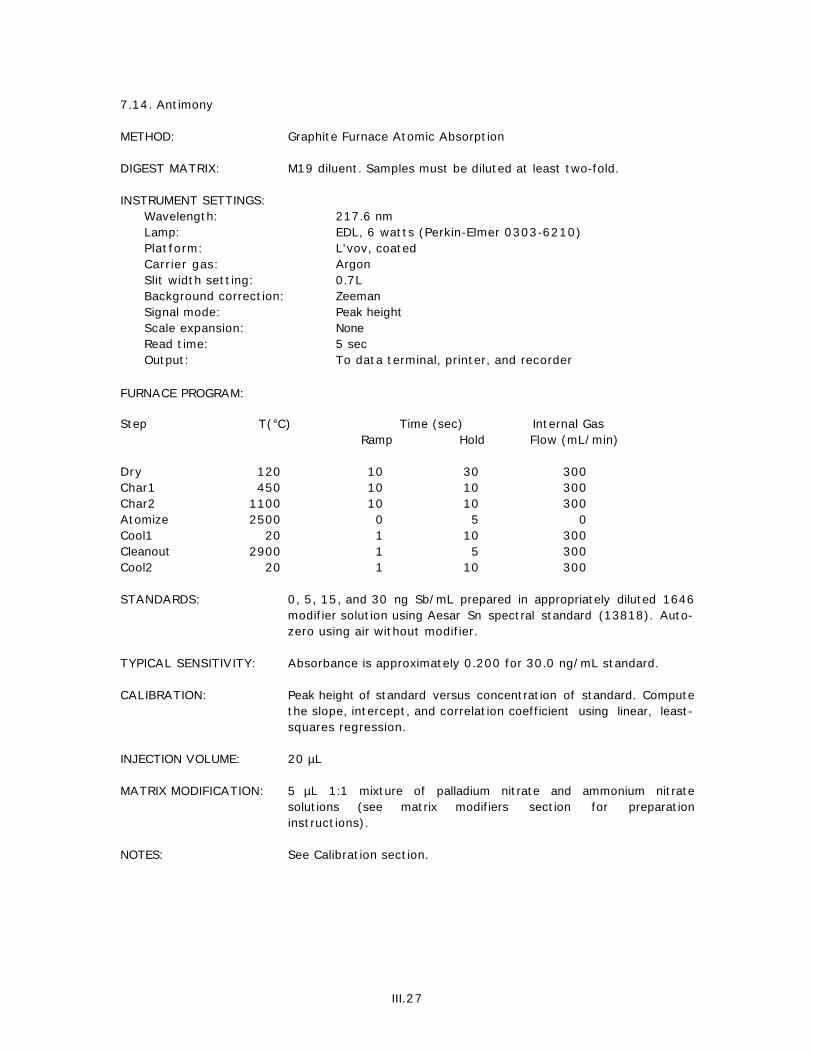
7.14. Antimony
METHOD: Graphite Furnace Atomic Absorption
DIGEST MATRIX: M19 diluent. Samples must be diluted at least two-fold.
INSTRUMENT SETTINGS:Wavelength: 217.6 nmLamp: EDL, 6 watts (Perkin-Elmer 0303-6210)Platform: L'vov, coatedCarrier gas: ArgonSlit width setting: 0.7LBackground correction: ZeemanSignal mode: Peak heightScale expansion: NoneRead time: 5 secOutput: To data terminal, printer, and recorder
FURNACE PROGRAM:
Step T(°C) Time (sec) Internal GasRamp Hold Flow (mL/min)
Dry 120 10 30 300Char1 450 10 10 300Char2 1100 10 10 300Atomize 2500 0 5 0Cool1 20 1 10 300Cleanout 2900 1 5 300Cool2 20 1 10 300
STANDARDS: 0, 5, 15, and 30 ng Sb/mL prepared in appropriately diluted 1646modifier solution using Aesar Sn spectral standard (13818). Auto-zero using air without modifier.
TYPICAL SENSITIVITY: Absorbance is approximately 0.200 for 30.0 ng/mL standard.
CALIBRATION: Peak height of standard versus concentration of standard. Computethe slope, intercept, and correlation coefficient using linear, least-squares regression.
INJECTION VOLUME: 20 µL
MATRIX MODIFICATION: 5 µL 1:1 mixture of palladium nitrate and ammonium nitratesolutions (see matrix modifiers section for preparationinstructions).
NOTES: See Calibration section.
III.27

7.15. Mercury
METHOD: Cold Vapor/Gold Foil Detector
DIGEST MATRIX: M19 diluent.
INSTRUMENT SETTINGS:
Reaction volume: 30 mLDiluent: M19 diluent.Carrier gas: AirFlow rate: 850 mL/minScale expansion: NoneIntegration time: 2 minOutput: To LC Display
REDUCTANT: 10% SnCl2 in deionized water.
STANDARDS: 0, 10, 30, and 50 ng Hg from a 50 ng/mL standard in M19 diluentusing Aesar Hg spectral standard (13865). Use aliquots of 0, 200,600, and 1000 µL. Auto zero using air.
TYPICAL SENSITIVITY: 90% recovery of input standard.
CALIBRATION: Instrument read-out is in ng Hg. Calibration curve is based on Hgdetected versus ng Hg in the standards. The slope, intercept, andcorrelation coefficient are calculated using linear, least-squaresregression.
INJECTION VOLUME: Up to 30 mL.
REDUCTANT VOLUME: 1 mL
MATRIX MODIFICATION: None
III.28

7.16. Thallium
METHOD: Graphite Furnace Atomic Absorption
DIGEST MATRIX: M19 diluent. For additional dilutions, use M19 diluent.
INSTRUMENT SETTINGS:
Wavelength: 276.8 nmLamp: EDL, 5 watts (Perkin-Elmer 0303-6271)Platform: L'vov, coatedCarrier gas: ArgonSlit width setting: 0.7LBackground correction: ZeemanSignal mode: Peak heightScale expansion: NoneRead time: 5 secOutput: To data terminal, printer, and recorder
FURNACE PROGRAM:
Step T(°C) Time (sec) Internal GasRamp Hold Flow (mL/min)
Dry 120 10 25 300Char1 450 10 20 300Char2 700 10 20 300Atomize 1900 0 5 0Cool1 20 1 10 300Cleanout 2900 1 5 300Cool2 20 1 10 300
STANDARDS: 0, 2, 5, and 10 ng Tl/mL prepared in appropriately diluted 1646modifier solution using Aesar Tl spectral standard (13851). Auto-zero using air without modifier.
TYPICAL SENSITIVITY: Absorbance is approximately 0.070 for a 10.0 ng/mL standard.
CALIBRATION: Peak height of standard versus concentration of standard. Computethe slope, intercept, and correlation coefficient using linear, least-squares regression.
INJECTION VOLUME: 20 µL
MATRIX MODIFICATION: 5 µL 5% ascorbic acid solution in deionized water.
NOTES: See Calibration section.
III.29

7.17. Lead
METHOD: Graphite Furnace Atomic Absorption
DIGEST MATRIX: M19 diluent. For additional dilutions, use M19 diluent.
INSTRUMENT SETTINGS:
Wavelength: 283.3 nmLamp: 10 ma (Perkin-Elmer 0303-6039)Platform: L'vov, coatedCarrier gas: ArgonSlit width setting: 0.7LBackground correction: ZeemanSignal mode: Peak heightScale expansion: NoneRead time: 5 secOutput: To data terminal, printer, and recorder
FURNACE PROGRAM:
Step T(°C) Time (sec) Internal GasRamp Hold Flow (mL/min)
Dry 120 10 15 300Char1 450 10 10 300Char2 1000 10 10 300Atomize 1900 0 5 0Cool1 20 1 10 300Cleanout 2900 1 5 300Cool2 20 1 10 300
STANDARDS: 0, 5, 15, and 30 ng Pb/mL prepared in M19 diluent using Aesar Pbspectral standard (13853). Auto-zero using air.
TYPICAL SENSITIVITY: Absorbance is approximately 0.240 for a 30.0 ng/mL standard.
CALIBRATION: Peak height of standard versus concentration of standard. Computethe slope, intercept, and correlation coefficient using linear, least-squares regression.
INJECTION VOLUME: 20 µL
MATRIX MODIFICATION: None
III.30

Digestion of Fish Tissue and Atomic Absorption Analysis of Trace Elements
V. S. Zdanowicz, T. W. Finneran and R. KotheNOAA/National Marine Fisheries Service
Northeast Fisheries Science Center, Sandy Hook LaboratoryHighlands, NJ
ABSTRACT
Methods are described for the total dissolution of fish liver and the instrumentalanalyses of sixteen trace elements, developed at the Sandy Hook Laboratory as part ofthe National Benthic Surveillance Project of the National Status and Trends (NS&T)Program.
1. INTRODUCTION
The methods for the analyzing of 16 metals in marine fish livers were developed as part of theNational Benthic Surveillance Project of the National Status and Trends (NS&T) Program. Theprocedures are based largely on those of Evans and Hanson (this document), and customized forour use and equipment. The digestion results in a total dissolution of tissue without loss ofvolatile elements. Four of the 16 elements can be determined by flame atomization methods,which are relatively rapid, leaving eleven elements for graphite furnace atomization. Mercuryis determined using the cold vapor technique. Although the primary objective in developing eachinstrumental method was that it be simple and straightforward while producing acceptableaccuracy and precision, most furnace methods contain multiple char steps and require matrixmodification.
Due to variations in performance between instruments, users of the instrumental methodsdescribed below will probably have to modify certain parameters values to suit their particularinstrumentation and equipment. Such variations are caused by differences in furnacecalibrations, nebulizer characteristics, lamp intensities, and other factors.
These methods were used at the NOAA National Marine Fisheries Service Northeast FisheriesScience Center Sandy Hook Laboratory to analyze NS&T samples collected from 1984 to 1986.Analytical results can be found in Zdanowicz and Gadbois (1990).
2. EQUIPMENT AND SUPPLIES
2.1. Instrumentation
Perkin-Elmer model Z/5000 spectrophotometer. Perkin-Elmer Corp., Norwalk, CT.
Burner (0040-0146) with flow spoiler and standard nebulizer (0303-0352)Dual lamp EDL power supplyFurnace cooling unitModel 056 dual pen recorderModel 500 graphite furnace atomizer with Zeeman background correction systemModel 3600 data terminal with model PRS 100 printerModel AS40 autosampler (for furnace analyses)Model AS50 autosampler (for flame analyses)Model PRS 10 printer
III.31

Perkin-Elmer model Z/5100 spectrophotometer
Dual lamp EDL power supplyFurnace cooling unitModel 600 graphite furnace atomizer with Zeeman background correction systemModel 7700 data terminal with model PRS 210 printerModel AS60 autosampler (for furnace analyses)
Mercury Analyzer, Gold Film, model 511. Arizona Instruments, Clarksdale, AZ.
2.2. Supplies
Acetylene (C2H2) [74-86-2], pre-purifiedArgon (Ar), 99.999% purityElectrodeless discharge lamps (EDL)Hollow cathode lamps (HCL)Platforms, pyrolytically coated L'vov, Perkin-Elmer B0109-324Graphite tubes, pyrolytically coated, grooved, Perkin-Elmer B0109-322
2.3. Labware
Balance, Mettler, model PK300 with printer Pipets, macro and microCups, 2-mL, polyethylene Spatulas or transfer tubesGraduated cylinders, 25-mL, glass Tubes, centrifuge, 15-mL, polystyreneOvens, stainless steel, gravity convection,
model OV-18SA. Blue M Blue Island, IL.Vials, 2-mL, glassVials, 15-mL, Teflon polyfluoroalkoxy (PFA),
threaded with screw caps, 02.5. Savillex,Minnetonka, MN.
Parr bomb, 125-mL, Teflon tetrafluoro-ethylene (TFE) lined stainless steel, 4748.Parr, Moline, IL.
PFA vials are cleaned using Micro detergent and rinsed in tap water. They are then soaked forthree days in a hot solution (70-80°C) of mixed acids (10% HNO3 and 5% HCl solution, byvolume), rinsed with deionized water, soaked for 3 days in room-temperature 0.1 Methylenediamine tetraacetic acid (EDTA) tetrasodium salt, rinsed with deionized water, soakedfor 3 days in hot deionized water, and dried in Class 100 laminar flow hoods. All other plasticand glassware are soaked for three days in 10% HNO3 at room temperature, rinsed withdeionized water, and dried as above. All containers used for aluminum analysis also receive theEDTA soak.
Before use, PFA vials are brought to constant weight by heating at 120°C for 24-48 hours.
2.4. Reagents
All reagents are ultrapure grades, except where indicated.
Ammonium nitrate (NH4NO3) [6484-52-2], solid, 99.99%. Aesar, Ward Hill, MA.Atomic absorption standards, 1000 µg/mL. Aesar, Ward Hill, MA.Magnesium nitrate [Mg(NO3)2
. 6H2O] [13446-18-9], solid, 99.99%. Aesar, Ward Hill, MA.Nitric acid (HNO3) [7697-37-2], concentrated (70%), Baker 4801 or G. F. Smith 621. J. T.
Baker, Phillipsburg, NJ, or G. Frederick Smith Chemicals, Columbus, OH.Palladium nitrate, [Pd(NO3)2]; 9.984% Pd+2 solution, 12621. Aesar, Ward Hill, MA.Water, deionized, 18 megohm-cm resistivity
III.32

2.5. Solvents and matrix modifiers
2.5.1. 10% HNO3
This solvent is used for making blank and sample dilutions and for instrumental calibrationstandards (see Calibration section). It is prepared in deionized water and contains 142 mLconcentrated HNO3 per liter of solution.
2.5.2. Matrix modifiers for graphite furnace analyses
Magnesium nitrate solution: 1.731 g Mg(NO3)2.6H2O per 100 mL of solution in deionized
water
Ammonium nitrate solution: 5.000 g NH4NO3 per 100 mL of solution in deionized water
Palladium nitrate solution: 500-fold dilution of a 9.984% Pd+2 solution in deionized water
3. SAMPLE PREPARATION
Sandy Hook Laboratory Method 20: Total Digestion of Fish Liver
Three reagent blanks and three standard reference material (SRM) samples were included ineach analytical string of 36 samples. Reagent blanks contained no sample and were processedidentically to the samples. The steps marked with an asterisk (*) are included if Al is to bedetermined.
Record the tare weight of a 15-mL PFA vial. Weigh no more than 3 grams (wet weight) ofliver tissue into the tared vial, re-weigh and record the weight.
Dry the samples overnight at 60-65°C. After cooling, re-weigh and record the weight.
Add 5 mL concentrated HNO3 to each vial and let the vials stand in a fume hood for 1-2 hr.Seal each vial tightly by hand and place two vials in each bomb. Add 5 mL of deionized waterto each bomb liner and seal the bombs according to manufacturer's instructions. Place bombsin oven and heat at 120°C overnight.
When cool, carefully vent the bombs in a fume hood. Disassemble bombs and remove vials.After vials cool, loosen caps and let stand overnight in fume hood to allow digests to de-gas.
* Weigh the vials and record the weight. Using a micropipette with a plastic pipet tip,remove a 500 µL aliquot of the digest from the vial and add this aliquot to a 15-mLcentrifuge tube containing 6-8 mL 10% HNO3. Flush the pipet tip using the liquid in thecentrifuge tube. This solution is for aluminum analysis.
* Re-weigh the vial and record the weight. This remaining portion of the digest is used foranalyses of the remaining elements.
Quantitatively transfer the contents of the vial to a 25-mL glass graduated cylindercontaining 10-12 mL deionized water using distilled water and a small glass funnel. Rinse the
III.33

vial 2-3 times with 2-3 mL deionized water and add each rinse to the cylinder. Rinse anddiscard the funnel. Bring to 25.0 mL using deionized water.
* Bring the Al samples to 10.0 mL using 10% HNO3.
4. CALIBRATION
Calibration standards were prepared by serial dilution of commercially available atomicabsorption standards using class-A glass pipets and volumetric flasks, and 10% HNO3. Finalworking standards were prepared in 10% HNO3. Concentrations of commercial standards wereverified by comparison with National institute of Standards and Technology (NIST)spectrophotometric standards.
Standards of four different concentrations including zero were used, and at least threereplicate determinations are made for each concentration. This was accomplished by analyzinga standard at the start of each sample string analysis and after every three samples. For a setof 36 samples, this resulted in at least 13 determinations of standards.
After each analytical sample string was analyzed, the concentrations of the standards and theinstrument readings obtained during the analysis of the standards were used to calculate theslope, intercept, and correlation coefficient of the calibration curve using linear, least-squaresregression. The correlation coefficient, r, is typically >0.98 for a well-behaved analysis.
5. CALCULATIONS
Using the value of the slope, m, of the calibration curve obtained by linear regression analysisof the calibration standards data, the concentration of analyte in sample and reagent blanksolutions is calculated using
C = Ym
where C is the concentration (µg/mL or ng/mL) of analyte in solution, Y is the absorbance ofthe sample, and m is the slope of the calibration curve.
For Hg determinations, the formula used was
C = Y
m VHg
where VHg is the volume of sample solution used for Hg analysis.
B, the average of the reagent blanks, and sB, the standard deviation of B were then calculated.
The solution detection limit, DLs, was calculated using
DLs = B + 3sB .
III.34

Table III.2. Typical detection limits for Sandy Hook Laboratory Method 20 [1.0 g liver samplebrought to 25 mL final volume (µg/g)].
Al 0.1 Se 0.2Cr 0.04 Ag 0.01Mn 1 Cd 0.02Fe 5 Sn 0.2Ni 0.1 Sb 0.2Cu 2 Hg 0.01Zn 1 Tl 0.2As 0.1 Pb 0.05
Since all the samples theoretically contain B, DLs was used as a working detection limit todetermine which samples required a "less than" calculation. The actual detection limit, DL,defined as the minimum solution concentration that is reliably different from the averagereagent blank concentration, was calculated using
DL = DLs - B = 3sB .
Typical method detection limits are listed in Table III.2.
The dry weight concentration of the analyte in the samples was calculated using the relation,
X = (C - B) (DF) (Vol)
Wt
where X is the concentration of analyte in the dry sample, C is the concentration of the analytein solution, B is the average reagent blank, DF is the amount of any additional dilution of theoriginal sample solution, Vol is the volume of the original sample solution (e.g. 25.0 mL), and Wtis the dry weight of the sample (e.g. 1.000 g). When C is in µg/mL, X is in µg/g; when C is inng/mL, X is in ng/g.
For any sample with a solution concentration lower than the working detection limit (DLs) for anelement, a "less than" value was calculated using
X < (DLs - B) (DF) (Vol)
Wt .
6. REFERENCES
Evans, D. W., and P. J. Hanson (1993) Analytical methods for trace elements in fish liver byatomic absorption spectrophotometry, this volume.
Zdanowicz, V. S., and D. F. Gadbois (1990) Contaminants in sediment and fish tissues fromestuarine and coastal sites of the northeast United States: Data summary of the baseline phaseof the National Status and Trends Program Benthic Surveillance Project, 1984 - 1986. NOAATech. Memo. NMFS-F/NEC-79. NOAA/National Marine Fisheries Service, Woods Hole, MA.
III.35

7. INSTRUMENTAL ANALYSIS
7.1. Aluminum
METHOD: Graphite Furnace Atomic Absorption
DIGEST MATRIX: 10% HNO3. For additional dilutions, use 10% HNO3.
INSTRUMENT SETTINGS:
Wavelength: 309.3 nmLamp: HCL, 25 ma (Perkin-Elmer 0303-6009)Platform: L'vov, coatedCarrier gas: ArgonSlit width setting: 0.7LBackground correction: ZeemanSignal mode: Peak areaScale expansion: NoneRead time: 5 secOutput: To data terminal, printer, and recorder
FURNACE PROGRAM:
Step T(°C) Time (sec) Internal GasRamp Hold Flow (mL/min)
Dry 120 10 25 300Char1 450 10 10 300Char2 1400 10 10 300Atomize 2600 0 5 0Cool1 20 1 10 300Cleanout 2900 1 5 300Cool2 20 1 10 300
STANDARDS: 0, 5, 10, and 20 ng Al/mL prepared in 10% HNO3 using Aesar Alspectral standard (13856). Auto-zero using air.
TYPICAL SENSITIVITY: Peak area is approximately 0.180 for a 20 ng/mL standard.
CALIBRATION: Peak area of standard versus concentration of standard. Computethe slope, intercept, and correlation coefficient using linear, least-squares regression.
INJECTION VOLUME: 20 µL
MATRIX MODIFICATION: None
III.36

7.2. Chromium
METHOD: Graphite Furnace Atomic Absorption
DIGEST MATRIX: 10% HNO3. For additional dilutions, use 10% HNO3.
INSTRUMENT SETTINGS:
Wavelength: 357.9 nmLamp: HCL, 25 ma (Perkin-Elmer 0303-6021)Platform: L'vov, coatedCarrier gas: ArgonSlit width setting: 0.7LBackground correction: ZeemanSignal mode: Peak areaScale expansion: NoneRead time: 7 secOutput: To data terminal, printer, and recorder
FURNACE PROGRAM:
Step T(°C) Time (sec) Internal GasRamp Hold Flow (mL/min)
Dry 120 10 25 300Char1 450 10 10 300Char2 1500 10 10 300Atomize 2600 0 7 0Cool1 20 1 10 300Cleanout 2900 1 5 300Cool2 20 1 10 300
STANDARDS: 0, 2, 5, and 10 ng Cr/mL prepared in 10% HNO3 using Aesar Crspectral standard (13864). Auto-zero using air.
TYPICAL SENSITIVITY: Peak area is approximately 0.240 for a 10 ng/mL standard.
CALIBRATION: Peak area of standard versus concentration of standard. Computethe slope, intercept, and correlation coefficient using linear, least-squares regression.
INJECTION VOLUME: 20 µL
MATRIX MODIFICATION: None
III.37
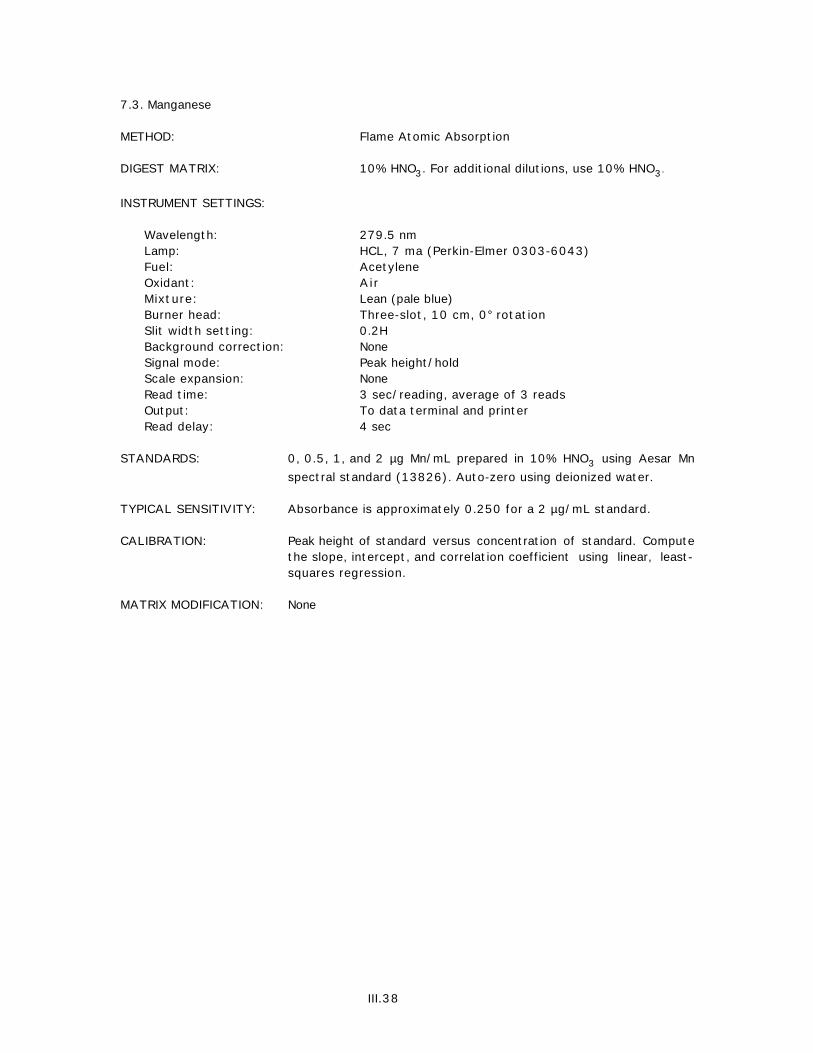
7.3. Manganese
METHOD: Flame Atomic Absorption
DIGEST MATRIX: 10% HNO3. For additional dilutions, use 10% HNO3.
INSTRUMENT SETTINGS:
Wavelength: 279.5 nmLamp: HCL, 7 ma (Perkin-Elmer 0303-6043)Fuel: AcetyleneOxidant: AirMixture: Lean (pale blue)Burner head: Three-slot, 10 cm, 0° rotationSlit width setting: 0.2HBackground correction: NoneSignal mode: Peak height/holdScale expansion: NoneRead time: 3 sec/reading, average of 3 readsOutput: To data terminal and printerRead delay: 4 sec
STANDARDS: 0, 0.5, 1, and 2 µg Mn/mL prepared in 10% HNO3 using Aesar Mnspectral standard (13826). Auto-zero using deionized water.
TYPICAL SENSITIVITY: Absorbance is approximately 0.250 for a 2 µg/mL standard.
CALIBRATION: Peak height of standard versus concentration of standard. Computethe slope, intercept, and correlation coefficient using linear, least-squares regression.
MATRIX MODIFICATION: None
III.38

7.4. Iron
METHOD: Flame Atomic Absorption
DIGEST MATRIX: 10% HNO3. For additional dilutions use 10% HNO3.
INSTRUMENT SETTINGS:
Wavelength: 248.3 nmLamp: HCL, 30 ma (Perkin-Elmer 0303-6037)Fuel: AcetyleneOxidant: AirMixture: Lean (pale blue)Burner head: Three-slot, 10 cm, 0° rotationSlit width setting: 0.2HBackground correction: NoneSignal mode: Peak height/holdScale expansion: NoneRead time: 3 sec/reading, average of 3 readsOutput: To data terminal and printerRead delay: 4 sec
STANDARDS: 0, 1, 2, and 4 µg Fe/mL prepared in 10% HNO3 using Aesar Fespectral standard (13830). Auto-zero using deionized water.
TYPICAL SENSITIVITY: Absorbance is approximately 0.180 for a 4 µg/mL standard.
CALIBRATION: Peak height of standard versus concentration of standard.Compute the slope, intercept, and correlation coefficient usinglinear, least-squares regression.
MATRIX MODIFICATION: None
NOTES: Alternate wavelength, 248.8 nm, may be used.
III.39
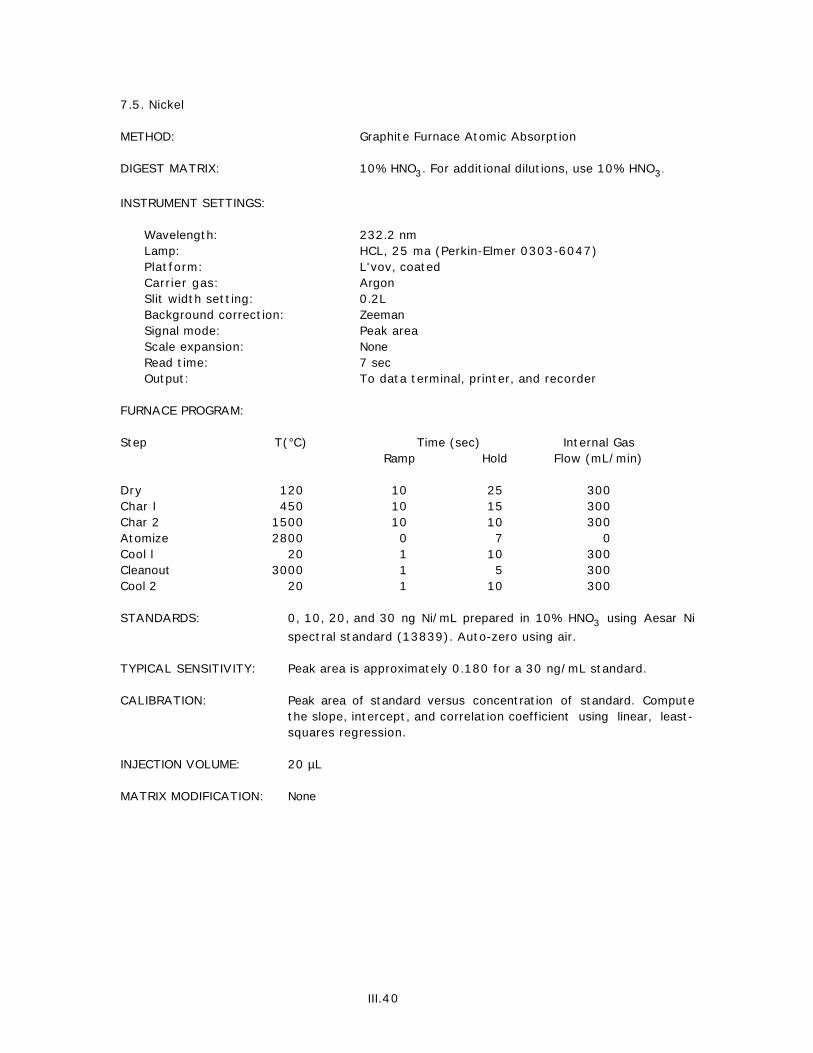
7.5. Nickel
METHOD: Graphite Furnace Atomic Absorption
DIGEST MATRIX: 10% HNO3. For additional dilutions, use 10% HNO3.
INSTRUMENT SETTINGS:
Wavelength: 232.2 nmLamp: HCL, 25 ma (Perkin-Elmer 0303-6047)Platform: L'vov, coatedCarrier gas: ArgonSlit width setting: 0.2LBackground correction: ZeemanSignal mode: Peak areaScale expansion: NoneRead time: 7 secOutput: To data terminal, printer, and recorder
FURNACE PROGRAM:
Step T(°C) Time (sec) Internal GasRamp Hold Flow (mL/min)
Dry 120 10 25 300Char l 450 10 15 300Char 2 1500 10 10 300Atomize 2800 0 7 0Cool l 20 1 10 300Cleanout 3000 1 5 300Cool 2 20 1 10 300
STANDARDS: 0, 10, 20, and 30 ng Ni/mL prepared in 10% HNO3 using Aesar Nispectral standard (13839). Auto-zero using air.
TYPICAL SENSITIVITY: Peak area is approximately 0.180 for a 30 ng/mL standard.
CALIBRATION: Peak area of standard versus concentration of standard. Computethe slope, intercept, and correlation coefficient using linear, least-squares regression.
INJECTION VOLUME: 20 µL
MATRIX MODIFICATION: None
III.40

7.6. Copper
METHOD: Flame Atomic Absorption
DIGEST MATRIX: 10% HNO3. For additional dilutions use 10% HNO3.
INSTRUMENT SETTINGS:
Wavelength: 324.8 nmLamp: HCL, 15 ma (Perkin-Elmer 0303-6024)Fuel: AcetyleneOxidant: AirMixture: Lean (pale blue)Burner head: Three-slot, 10 cm, 0° rotationSlit width setting: 0.7HBackground correction: NoneSignal mode: Peak height/holdScale expansion: NoneRead time: 3 sec/reading, average of 3 readsOutput: To data terminal and printerRead delay: 4 sec
STANDARDS: 0, 1, 3, and 5 µg Cu/mL prepared in 10% HNO3 using Aesar Cuspectral standard (13867). Auto-zero using deionized water.
TYPICAL SENSITIVITY: Absorbance is approximately 0.230 for a 5 µg/mL standard.
CALIBRATION: Peak height of standard versus concentration of standard. Computethe slope, intercept, and correlation coefficient using linear, least-squares regression.
MATRIX MODIFICATION: None
III.41

7.7. Zinc
METHOD: Flame Atomic Absorption
DIGEST MATRIX: 10% HNO3. For additional dilutions, use 10% HNO3.
INSTRUMENT SETTINGS:
Wavelength: 213.9 nmLamp: HCL, 15 ma (Perkin-Elmer 0303-6081)Fuel: AcetyleneOxidant: AirMixture: Lean (pale blue)Burner head: Three-slot, 10 cm, 0° rotationSlit width setting: 0.7HBackground correction: NoneSignal mode: Peak height/holdScale expansion: NoneRead time: 3 sec/reading, average of 3 readsOutput: To data terminal and printerRead delay: 4 sec
STANDARDS: 0, 0.25, 0.5, and 1 µg Zn/mL prepared in 10% HNO3 using Aesar Znspectral standard (13835). Auto-zero using deionized water.
TYPICAL SENSITIVITY: Absorbance is approximately 0.250 for a 1 µg/mL standard.
CALIBRATION: Peak height of standard versus concentration of standard. Computethe slope, intercept, and correlation coefficient using linear, least-squares regression.
MATRIX MODIFICATION: None
III.42

7.8. Arsenic
METHOD: Graphite Furnace Atomic Absorption
DIGEST MATRIX: 10% HNO3. For additional dilutions, use 10% HNO3.
INSTRUMENT SETTINGS:
Wavelength: 193.7 nmLamp: EDL, 6 w (Perkin-Elmer 0303-6211)Platform: L'vov, coatedCarrier gas: ArgonSlit width setting: 0.7LBackground correction: ZeemanSignal mode: Peak areaScale expansion: NoneRead time: 5 secOutput: To data terminal, printer, and recorder
FURNACE PROGRAM:
Step T(°C) Time (sec) Internal GasRamp Hold Flow (mL/min)
Dry 120 10 25 300Char l 450 10 15 300Char 2 700 10 10 300Atomize 2400 0 5 0Cool l 20 1 10 300Cleanout 2900 1 5 300Cool 2 20 1 10 300
STANDARDS: 0, 5, 15, and 30 µg As/mL prepared in appropriately diluted 1646modifier using Aesar As spectral standard (13839). Auto-zerousing air without modifier.
TYPICAL SENSITIVITY: Peak area is approximately 0.180 for a 30 ng/mL standard.
CALIBRATION: Peak area of standard versus concentration of standard. Computethe slope, intercept, and correlation coefficient using linear, least-squares regression.
INJECTION VOLUME: 20 µL
MATRIX MODIFICATION: 5 µL 1:1 mixture of palladium nitrate and magnesium nitratesolutions (see matrix modifiers section).
III.43

7.9. Selenium
METHOD: Graphite Furnace Atomic Absorption
DIGEST MATRIX: 10% HNO3
INSTRUMENT SETTINGS:
Wavelength: 196.0 nmLamp: EDL, 4.5 watts (Perkin-Elmer 0303-6262)Platform: L'vov, coatedCarrier gas: ArgonSlit width setting: 2.0LBackground correction: ZeemanSignal mode: Peak areaScale expansion: NoneRead time: 5 secOutput: To data terminal, printer, and recorder
FURNACE PROGRAM:
Step T(°C) Time (sec) Internal GasRamp Hold Flow (mL/min)
Dry 120 10 25 300Char1 450 10 15 300Char2 600 10 15 300Atomize 2600 0 5 0Cool1 20 1 10 300Cleanout 2900 1 5 300Cool2 20 1 10 300
STANDARDS: 0, 5, 10, and 20 ng Se/mL prepared in 10% HNO3 using Aesar Sespectral standard (13845). Auto-zero using air without modifier.
TYPICAL SENSITIVITY: Peak area is approximately 0.060 for a 20 ng/mL standard.
CALIBRATION: Peak area of standard versus concentration of standard. Computethe slope, intercept, and correlation coefficient using linear, least-squares regression.
INJECTION VOLUME: 20 µL
MATRIX MODIFICATION: 5 µL 1:1 mixture of palladium nitrate and magnesium nitratesolutions (see matrix modifiers section).
III.44

7.10. Silver
METHOD: Graphite Furnace Atomic Absorption
DIGEST MATRIX: 10% HNO3. For additional dilutions, use 10% HNO3.
INSTRUMENT SETTINGS:
Wavelength: 328.1 nmLamp: HCL, 10 ma (Perkin-Elmer 0303-6064)Platform: L'vov, coatedCarrier gas: ArgonSlit width setting: 0.7LBackground correction: ZeemanSignal mode: Peak areaScale expansion: NoneRead time: 5 secOutput: To data terminal, printer, and recorder
FURNACE PROGRAM:
Step T(°C) Time (sec) Internal GasRamp Hold Flow (mL/min)
Dry 120 10 25 300Char1 500 10 15 300Atomize 1700 0 5 0Cool1 20 1 10 300Cleanout 2900 1 5 300Cool2 20 1 10 300
STANDARDS: 0, 0.5, 1.5, and 3.0 ng Ag/mL prepared in 10% HNO3 using AesarAg spectral standard (13849). Auto-zero using air.
TYPICAL SENSITIVITY: Peak area is approximately 0.180 for a 3 ng/mL standard.
CALIBRATION: Peak area of standard versus concentration of standard. Computethe slope, intercept, and correlation coefficient using linear, least-squares regression.
INJECTION VOLUME: 20 µL
MATRIX MODIFICATION: None
III.45

7.11. Cadmium
METHOD: Graphite Furnace Atomic Absorption
DIGEST MATRIX: 10% HNO3. For additional dilutions, use 10% HNO3.
INSTRUMENT SETTINGS:
Wavelength: 228.8 nmLamp: HCL, 4 ma (Perkin-Elmer 0303-6016)Platform: L'vov, coatedCarrier gas: ArgonSlit width setting: 0.7LBackground correction: ZeemanSignal mode: Peak areaScale expansion: NoneRead time: 5 secOutput: To data terminal, printer, and recorder
FURNACE PROGRAM:
Step T(°C) Time (sec) Internal GasRamp Hold Flow (mL/min)
Dry 120 10 25 300Char1 450 10 15 300Atomize 1600 0 5 0Cool1 20 1 10 300Cleanout 2900 1 5 300Cool2 20 1 10 300
STANDARDS: 0, 0.2, 0.5, and 1 ng Cd/mL prepared in 10% HNO3 using Aesar Cdspectral standard (13813). Auto-zero using air.
TYPICAL SENSITIVITY: Peak area is approximately 0.180 for a 1 ng/mL standard.
CALIBRATION: Peak area of standard versus concentration of standard. Computethe slope, intercept, and correlation coefficient using linear, least-squares regression.
INJECTION VOLUME: 20 µL
MATRIX MODIFICATION: None
III.46

7.12. Tin
METHOD: Graphite Furnace Atomic Absorption
DIGEST MATRIX: 10% HNO3. For additional dilutions, use 10% HNO3.
INSTRUMENT SETTINGS:
Wavelength: 286.3 nmLamp: EDL, 6 watts (Perkin-Elmer 0303-6274)Platform: L'vov, coatedCarrier gas: ArgonSlit width setting: 0.7LBackground correction: ZeemanSignal mode: Peak heightScale expansion: NoneRead time: 5 secOutput: To data terminal, printer, and recorder
FURNACE PROGRAM:
Step T(°C) Time (sec) Internal GasRamp Hold Flow (mL/min)
Dry 120 10 25 300Char1 450 10 20 300Char2 800 10 20 300Atomize 2600 0 5 0Cool1 20 1 10 300Cleanout 2900 1 5 300Cool2 20 1 10 300
STANDARDS: 0, 5, 15, and 30 ng Sn/mL prepared in 10% HNO3 using Aesar Snspectral standard (13863). Auto-zero using air without modifier.
TYPICAL SENSITIVITY: Absorbance is approximately 0.210 for a 30 ng/mL standard.
CALIBRATION: Peak height of standard versus concentration of standard. Computethe slope, intercept, and correlation coefficient using linear, least-squares regression.
INJECTION VOLUME: 20 µL
MATRIX MODIFICATION: 5 µL 1:1 mixture of palladium nitrate and ammonium nitratesolutions (see matrix modifiers section).
III.47

7.13. Antimony
METHOD: Graphite Furnace Atomic Absorption
DIGEST MATRIX: 10% HNO3. For additional dilutions, use 10% HNO3.
INSTRUMENT SETTINGS:
Wavelength: 217.6 nmLamp: EDL, 6 watts (Perkin-Elmer 0303-6210)Platform: L'vov, coatedCarrier gas: ArgonSlit width setting: 0.7LBackground correction: ZeemanSignal mode: Peak heightScale expansion: NoneRead time: 4 secOutput: To data terminal, printer, and recorder
FURNACE PROGRAM:
Step T(°C) Time (sec) Internal GasRamp Hold Flow (mL/min)
Dry 120 10 25 300Char1 450 10 15 300Char2 1200 10 15 300Atomize 2500 0 4 0Cool1 20 1 10 300Cleanout 2900 1 5 300Cool2 20 1 10 300
STANDARDS: 0, 5, 10, and 20 ng Sb/mL prepared in 10% HNO3 using Aesar Snspectral standard (13818). Auto-zero using air without modifier.
TYPICAL SENSITIVITY: Absorbance is approximately 0.110 for 20 ng/mL standard.
CALIBRATION: Peak height of standard versus concentration of standard. Computethe slope, intercept, and correlation coefficient using linear, least-squares regression.
INJECTION VOLUME: 20 µL
MATRIX MODIFICATION: 5 µL 1:1 mixture of palladium nitrate and ammonium nitratesolutions (see matrix modifiers section).
III.48

7.14. Mercury
METHOD: Cold Vapor/Gold Foil Detector
DIGEST MATRIX: 10% HNO3
INSTRUMENT SETTINGS:
Reaction volume: 30 mLDiluent: 10% HNO3
Carrier gas: AirFlow rate: 850 mL/minScale expansion: NoneIntegration time: 2 minOutput: To LC Display
REDUCTANT: 10% SnCl2 in deionized water
STANDARDS: 0, 10, 30, and 50 ng Hg from a 50 ng/mL standard in 10% HNO3
using Aesar Hg spectral standard (13865). Use aliquots of 0, 200,600, and 1000µL. Auto zero using air.
TYPICAL SENSITIVITY: 90% recovery of input standard concentration.
CALIBRATION: Instrument read-out is in ng Hg. Calibration curve is based on ng Hgdetected versus ng Hg in the standards. The slope, intercept, andcorrelation coefficient are calculated using linear, least-squaresregression.
SAMPLE VOLUME: Up to 10 mL
REDUCTANT VOLUME: 1 mL
MATRIX MODIFICATION: None
III.49

7.15. Thallium
METHOD: Graphite Furnace Atomic Absorption
DIGEST MATRIX: 10% HNO3. For additional dilutions, use 10% HNO3.
INSTRUMENT SETTINGS:
Wavelength: 276.8 nmLamp: EDL, 5 watts (Perkin-Elmer 0303-6271)Platform: L'vov, coatedCarrier gas: ArgonSlit width setting: 0.7LBackground correction: ZeemanSignal mode: Peak heightScale expansion: NoneRead time: 4 secOutput: To data terminal, printer, and recorder
FURNACE PROGRAM:
Step T(°C) Time (sec) Internal GasRamp Hold Flow (mL/min)
Dry 120 10 25 300Char1 450 10 20 300Char2 750 10 20 300Atomize 2000 0 4 0Cool1 20 1 10 300Cleanout 2900 1 5 300Cool2 20 1 10 300
STANDARDS: 0, 2, 5, and 10 ng Tl/mL prepared in 10% HNO3 using Aesar Tlspectral standard (13851). Auto-zero using air without modifier.
TYPICAL SENSITIVITY: Absorbance is approximately 0.060 for a 10 ng/mL standard.
CALIBRATION: Peak height of standard versus concentration of standard. Computethe slope, intercept, and correlation coefficient using linear, least-squares regression.
INJECTION VOLUME: 20 µL
MATRIX MODIFICATION: 5 µL 1:1 mixture of palladium nitrate and ammonium nitratesolutions (see matrix modifiers section).
III.50

7.16. Lead
METHOD: Graphite Furnace Atomic Absorption
DIGEST MATRIX: 10% HNO3. For additional dilutions, use 10% HNO3.
INSTRUMENT SETTINGS:
Wavelength: 283.3 nmLamp: HCL, 10 ma (Perkin-Elmer 0303-6039)Platform: L'vov, coatedCarrier gas: ArgonSlit width setting: 0.7LBackground correction: ZeemanSignal mode: Peak heightScale expansion: NoneRead time: 5 secOutput: To data terminal, printer, and recorder
FURNACE PROGRAM:
Step T(°C) Time (sec) Internal GasRamp Hold Flow (mL/min)
Dry 120 10 25 300Char1 450 10 20 300Atomize 1600 0 5 0Cool1 20 1 10 300Cleanout 2900 1 5 300Cool2 20 1 10 300
STANDARDS: 0, 5, 15, and 30 ng Pb/mL prepared in 10% HNO3 using Aesar Pbspectral standard (13853). Auto-zero using air.
TYPICAL SENSITIVITY: Absorbance is approximately 0.260 for a 30 ng/mL standard.
CALIBRATION: Peak height of standard versus concentration of standard. Computethe slope, intercept, and correlation coefficient using linear, least-squares regression.
INJECTION VOLUME: 20 µL
MATRIX MODIFICATION: None
III.51

III.52

Analytical Methods for Trace Elements in Sediments by Atomic AbsorptionSpectrophotometry
D. W. Evans and P. J. HansonNOAA/National Marine Fisheries Service
Southeast Fisheries Science CenterBeaufort Laboratory
Beaufort, NC
ABSTRACT
Methods are described for analysis of 17 major and trace elements in estuarinesediments as used by NOAA/NMFS/Beaufort Laboratory of the Southeast FisheriesScience Center as part of the Benthic Surveillance Project of the National Status andTrends Program.
1. INTRODUCTION
When the National Status and Trends (NS&T) Program Benthic Surveillance Project began in1984, methods were needed for the analysis of 17 elements (Ag, Al, As, Cd, Cr, Cu, Fe, Hg,Mn, Ni, Pb, Sb, Se, Si, Sn, Tl, and Zn) in estuarine sediments. The Sandy Hook Laboratory ofthe NOAA National Marine Fisheries Service (NMFS) took the lead in developing a generalapproach based on total dissolution of sediments and analysis by atomic absorptionspectrophotometry. The other participating NMFS laboratories developed, in parallel, specificmethods suited to their analytical needs. We describe here the methods used at BeaufortLaboratory as they have evolved from this shared effort.
2. EQUIPMENT AND SUPPLIES
2.1. Equipment
2.1.1. Atomic absorption spectrophotometers
Perkin Elmer model Z/5100 Spectrophotometer. Perkin-Elmer, Norwalk, CT.Perkin Elmer model HGA-600 graphite furnacePerkin Elmer model AS-60 autosamplerIBM AT computerEpson LQ-850 printer
Perkin Elmer model Z/3030 spectrophotometerPerkin Elmer model HGA-600 graphite furnacePerkin Elmer model AS-60 autosamplerPrinter, Printronix model S7024. Anadex, Irvine, CA.
Perkin Elmer model 603 spectrophotometer with manual burner control and deuterium lampbackground correctionPerkin Elmer model R100A strip chart recorder
III.53

2.1.2. Flow injection system
Connectors and tees, Teflon, variable bore. Omnifit, Atlantic Beach, NY.Fittings, flangeless. Upchurch Scientific, Oak Harbor, WA.Flow meters, panel-mounted flow-meters with aluminum fittings, 65 mm flow tubes and
adjustable valves. Maximum air flow rates of 145 mL/min and 333 mL/min. ColePalmer, Niles, IL.
Hg cold vapor absorption cell, custom, PFA Teflon, 0.6 mm I.D. by 13.5 mm longRainin Rabbit Plus 4 channel peristaltic pump with 0.89 mm and 2.29 mm I.D. PVC pump
tubing. Rainin Rabbit, Woburn, MA.Separator, custom, Teflon and acrylic gas/liquidTubing, Teflon, for reaction and separation coils and intercomponent connections, 1.5-mm
O.D., 0.8-mm I.D., 3.0-mm O.D., and 1.5 mm I.D.Valve, rotary injection Teflon, manual 6-way with 0.5 and 1.0 mL sample loops. Rheodyne,
Cotati, CA.
2.1.3. Lamps and power supplies
Perkin-Elmer single lamp Electrodeless Discharge (EDL) power supplyPerkin-Elmer (EDL) lamps for As, Cd, Hg, Pb, Se, Sn, and ZnPerkin-Elmer Hollow Cathode Lamps (HCL) for Al, Cr, Cu, Fe, Mn, Sb, Si, Tl, and AgVWR Scientific Hollow Cathode (HCL) for Ni. VWR, Atlanta, GA.
2.1.4. Sample digestion equipment
CEM Model MDS 81D microwave digestion oven. CEM Corp., Mathews, NC.CEM pressure vessel capping stationCEM 120-mL perfluoroalkoxy (PFA) Teflon pressure vesselsCEM turntableVials, 30-mL PFA Teflon vials. Savillex, Minnetonka, MN.
2.1.5. General laboratory equipment
Balance, Model GT2100. Ohaus, Florham Park, NJ.Balance, Model GT4800. Ohaus, Florham Park, NJ.Balance, Model RP160. Sartorius, McGaw Park, IL.Deionized water system, Milli-Q deionized water system. Millipore Corp., Bedford, MA.Hood, benchtop, laminar flow. Environmental Air, Albuquerque, NM.Hotplate. Thermolyne Cimarec, Dubuque, IA.Ionizing unit, Staticmaster. Nuclear Products, Grand Island, NY.Oven, air flow, model OV-510A-2 horizontal. Blue M, Blue Island, MN.Oven, air flow, model OV-510A-3 horizontal. Blue M, Blue Island, MN.Pipets, Pipetman, continuously adjustable, 2-20 µL, 10-100 µL, 20-200 µL, 100-1000
µL, and 500-5000 µL. Gilson, Worthington, OH.
2.2 Supplies
2.2.1. Atomic absorption spectrophotometry
L'vov Platforms, solid pyrolytic, Perkin-Elmer B010-9324Pyrolytic graphite tubes with forked platforms, Perkin-Elmer B050-5057Pyrolytic graphite tubes, grooved, Perkin-Elmer B010-9322
III.54

2.2.2. Compressed gases
Acetylene (C2H2) [74-86-2], pre-purifiedArgon, 99.998% purityCompressed airNitrogen, prepurified 99.998% purity
2.2.3. Plasticware
Bottles, 60-, 125-, 250-, 500-, and 1000-mL, FEP TeflonBottles, 125-, 250-, 500-, and 1000-mL, linear polyethylene bottlesCups, autosampler with external snap caps, 2-mL conical bottom, polyethylenePipet tips, polypropylene, for Gilson pipets, clear natural trace metal freeTubes, culture, with external snap caps, 12 x 75 mm (5-mL), and 17 x 100 mm (15-mL),
polystyrene
2.2.4. Labware preparation
The PFA vials used for the digestions were rinsed and scrubbed inside with a brush after eachuse. They were washed in an automatic laboratory dishwasher using detergent and rinsed indistilled water. The vials were then placed upright in 1-L PFA jars fitted with lids containingports that can be opened or closed. The jars were filled with a 3:1 mixture of concentratedHNO3 and concentrated HCl, and the lids screwed tightly in place. The ports were left open toaccommodate expansion and acid evaporation. The jars were heated on a hot plate in an exhausthood at about 90°C for at least 24 hr. After cooling, the acid was poured off and the jars filledwith Milli-Q water, shaken to rinse the vials, and the waste water poured off. This wasrepeated three times. The vials were removed from the jar and dried at room temperature in alaminar flow clean hood. The vial caps were cleaned similarly but separately. Vials used fortissue digestion and homogenization were cleaned separately and isolated from those used forsediment digestion or standards preparation.
Autosampler(AS 60) cups were placed in 1-L FEP Teflon bottles which were filled with 10%v/v HNO3 in Milli-Q water. They were double sealed in polyethylene Ziploc bags and heated at60°C for at least 24 hr. After cooling, they were rinsed at least three times with Milli-Qwater as described above.
2.3. Chemicals and reagents
2.3.1. Atomic absorption standards
Al: 1000 ppm, Baker 6917-1 and 10,000 ppm NIST SRM 2127. J. T. Baker, Phillipsburg,NJ, and NIST, Gaithersburg, MD.
Sb: 1000 ppm, Baker 6918-1 and 10,000 ppm NIST SRM 2126As: 1000 ppm, Baker 6919-1 and 10,000 ppm NIST SRM 2126Cd: 1000 ppm, Baker 6924-1 and 10,000 ppm NIST SRM 2121Cr: 1000 ppm, Baker 6926-1 and 10,000 ppm NIST SRM 2128Cu: 1000 ppm, Baker 6928-1 and 10,000 ppm NIST SRM 2124Fe: 1000 ppm, Baker 6929-1 and 10,000 ppm NIST SRM 2124Pb: 1000 ppm, Baker 6930-1 and 10,000 ppm NIST SRM 2121Mn: 1000 ppm, Baker 6933-1 and 10,000 ppm NIST SRM 2128Hg: 1000 ppm, VWR VW0737-3 and 1000 ppm Fisher SO-M-114. VWR, Atlanta, GA, and
Fisher Scientific, Pittsburg, PA.Ni: 1000 ppm, Baker 6930-1 and 10,000 ppm NIST SRM 2124
III.55

Se: 1000 ppm, Baker 6938-1 and 10,000 ppm NIST SRM 2126Si: 1000 ppm, VWR VW0756-3Ag: 1000 ppm, Baker 6940-1 and 10,000 ppm NIST SRM 2121Tl: 1000 ppm, Ricca 3890. Ricca, Arlington, TX.Sn: 1000 ppm, Baker 1-6943 and 10,000 ppm NIST SRM 2126Zn: 1000 ppm, Baker 6946-1 and 10,000 ppm NIST SRM 2121
2.3.2. Reagents
Ammonium phosphate, monobasic (NH4H2PO4)[7722-76-1], Ultrex 4-4931. J. T.Baker, Phillipsburg, NJ.
trace metal analysis. J. T. Baker,Phillipsburg, NJ.
Hydrofluoric acid (HF) [7664-39-3],concentrated (48%), Seastar Ultra-highpurity sub-boiling distilled in Teflon.Seastar Chemicals, Sidney, BC, Canada.
Ascorbic acid (C6H8O6) [50-81-7], reagentgrade. Fisher Scientific, Pittsburg, PA.
Boric acid (H3BO3) [10043-35-3], analyzedreagent 0084-01. J. T. Baker, Phillipsburg,NJ.
Nitric acid (HNO3) [7697-37-2], concentrated(70%), Seastar Ultra-high purity sub-boiling distilled in Teflon. SeastarChemicals, Sidney, BC, Canada.
Boric acid (H3BO3) [10043-35-3], MerckSuprapur Art. 765. Merck, Darmstadt,Germany.
Nitric acid (HNO3) [7697-37-2], concentrated(70%), Instra-analyzed for trace metalanalysis. J. T. Baker, Phillipsburg, NJ.
Cobalt metal [7440-48-4], powder reagentgrade, C-363. Fisher Scientific, Pitts-burg, PA. Palladium metal [7440-05-3], powder, grade
1 puratomic. Johnson Matthey, WestChester, PA.
Hydrochloric acid (HCl) [7647-01-0],concentrated (38%), Instra-analyzed fortrace metal analysis. J. T. Baker,Phillipsburg, NJ.
Sodium borohydride (NaBH4) [16940-66-2],99% purity. Aldrich Chemical Co.,Milwaukee, WI.Hydrochloric acid (HCl) [7647-01-0],
concentrated (38%), Seastar Ultra-highpurity sub-boiling distilled in Teflon.Seastar Chemicals, Sidney, BC, Canada.
Sodium hydroxide (NaOH) [1310-73-2],analyzed reagent 3722-01. J. T. Baker,Phillipsburg, NJ.
Stannous chloride (SnCl2 . 2H2O) [10025-69-1], suitable for mercury analysis, 3980-01. J. T. Baker, Phillipsburg, NJ.
Hydrofluoric acid (HF) [7664-39-3],concentrated (48%), Instra-analyzed for
3. SAMPLE TREATMENT
3.1. Sample matrix modification
Chemical modification of the sample matrix is often necessary to achieve unbiased analysis ofsamples using simple standard solutions in graphite furnace AAS. The development of matrixmodifiers has evolved to take advantage of newer approaches or to adapt to specific analyticalproblems. The current matrix modifiers are described below.
250 µg Pd/mL in 4N HNO3. This was used in the analysis of Ag, Cd, and Pb and wasprepared by diluting 10,000 µg Pd/mL solution 40 fold with 4N HNO3. The 10,000 µgPd/mL solution was prepared using Johnson-Matthey Grade 1 Puratomic Pd metal dissolvedin concentrated Seastar HNO3 to which a few drops of Seastar HCl were added to aiddissolution. Heating to 90°C dissolved the Pd metal. The resulting solution was diluted withMilli-Q water to make 10,000 µg Pd/mL in 4N HNO3.
III.56

1000 µg Pd/mL in 4N HN03. This was used in the analysis of Sn. It was prepared as abovebut with a 10-fold dilution of the 10,000 µg Pd/mL stock solution.
(2000 µg Pd + 2000 µg Co)/mL in 4N HNO3. This solution was used in the analysis of Asand Sb and was prepared by diluting 10,000 µg Pd/mL and 10,000 µg Co/mL solutions with4N Seastar HNO3. The 10,000 µg Co/mL solution was prepared by dissolving l g Co metal in100 mL 4N HNO3.
5% ascorbic acid. This solution was used in conjunction with the 250 µg Pd/mL modifier inthe analysis of Tl. It was prepared by dissolving 5 g ascorbic acid (Fisher reagent grade) in100 mL Milli-Q water.
3.2. Sample drying and compositing
All concentrations of trace elements in sediments are reported on the basis of sediment dryweight. Sediments were oven dried at 60° C for 16 hr in a forced air convection oven toconstant dry weight. Standard reference materials were similarly dried. Samples were driedbefore compositing equal weight aliquots from the three cores representing each station at asampling site. Samples are ground to a fine texture in an agate mortar before compositing.
3.3. Microwave digestion
3.3.1. Acid additions
Dissolution of sediment was accomplished with a mixture of HF, HCl, and HNO3 using a methodmodified from Rantala and Loring (1975) employing microwave heating. Approximately 0.1200± 0.0100 g of sample or CRM were weighed into cleaned, tared, 30-mL PFA vials, and 0.9 mLHF, 0.12 mL HCl, and 0.04 mL HNO3 were added.
Pipetting of acids was done using Gilson pipets with pre-rinsed polyethylene tips to minimizecontamination. Pipets are disassembled after use and rinsed with Milli-Q water and dried toprevent corrosion of internal parts.
3.3.2. Digestion
The 30-mL PFA vials containing samples, CRMs, or blanks and added acids were capped andsealed tightly. The vials were then placed singly in CEM microwave pressure vessels. Five mLof Milli-Q water were added to each pressure vessel to generate a back pressure duringheating. The Teflon vial within Teflon digestion vessel provides a double contamination barrieralso used in tissue digestions. The pressure vessels were then capped and sealed tightly.Vessels were placed in alternating positions in the 12-position microwave carousel, and thevent tubes attached from the central chamber. Six samples were digested together using thefollowing program sequence.
1. Close microwave door. Turn on exhaust fan to maximum. Start turntable.
2. Time = 60 min; Power = 20%.Cool vials for 20 min; vent each vessel by pressing on exhaust tube.
3. Uncap pressure vessels in an exhaust hood using the capping station. Remove the 30-mLPFA vials from the pressure vessels by floating them out with Milli-Q water. Allow the
III.57

PFA vials to dry in a laminar flow hood before opening. Dilute sample digests with 4.5%boric acid as described below.
3.3.3. Initial sample dilution and volume determination
Samples were diluted with 25 mL of a 4.5% boric acid in Milli-Q water to complex fluoride ionsand prevent precipitation of fluorides of Al and Ca. Digests with added boric acid should beresealed and warmed to 60°C to aid dissolution of any possible precipitates. Slow precipitationof silica will occur over a period of days: samples intended for analysis of Si or Al should havealiquots removed and diluted immediately to obtain a representative aliquot. The acid digestwith the added boric acid solution diluent is termed “diluted HF/Aqua Regia” in subsequentelement specific sections (9.1 through 9.17).
The vials and contents were weighed to 0.01 g before any sample solution was removed, andthe net solution weight was determined by subtracting the tare weight of the vial. Solutionvolume was calculated by dividing by an assumed solution density of 1.015 g/mL.
3.3.4. Alternate digestion
The microwave digestion procedure was developed from an earlier digestion procedure thatused large Teflon-lined Parr bombs as pressure vessels with heating in a conventionallaboratory oven. This method was modeled on one described by Okamoto and Fuwa (1984) fortissues. The Teflon pressure vessel provides an additional inert barrier to possible metalcontamination while allowing use of relatively inexpensive PFA vials as primary digestioncontainers which can be cleaned and weighed in large numbers. The vials were used for directweighing of samples and CRMs, initial dilutions, and sample storage. Contamination risks werereduced since digest transfers to other containers for volume determination and storage wereunnecessary. Efficiency was increased by eliminating such procedures. For these reasons, weretained the configuration of a digestion vial within an inert pressure vessel when switching tomicrowave digestion.
Sample preparation and acid additions for the alternate Parr bomb digestion were the same asfor the microwave digestion. The 30-mL PFA vials were placed singly in the Teflon liner of the125-mL Parr bomb with 5 mL of Milli-Q water. After capping, the liner was placed in itsstainless steel bomb jacket which was then assembled according to the manufacturer’sinstructions. The bombs were heated for 16 hr at 120°C and then cooled. After venting in afume hood, the PFA vials were removed and treated as in the microwave digestion procedure.In both procedures, there was some venting of vapors from the PFA vials into the pressurevessel, but we observed no apparent loss of potentially volatile elements, such as mercury,from the PFA vials.
3.4. Dilution
Any sample or CRM digest whose concentration exceeded that of the highest standard wasdiluted. Extrapolation of the calibration curve beyond the range of the highest standard was notdone. Diluents were selected to mimic the acid matrix of the samples, CRMs, and blanks.
The diluent used in graphite furnace analysis is "furnace sediment matrix solution." This isprepared using 964 mL of 4.5% boric acid solution, 31 mL 48% Seastar HF, 4.1 mL 38%Seastar HCl, and 1.4 mL 70% Seastar HNO3.
In graphite furnace AAS, the diluent for analysis of Ag, As, Cd, Pb, and Sn is “furnacesediment matrix solution,” which mimics the blank digest composition. The diluent used in
III.58
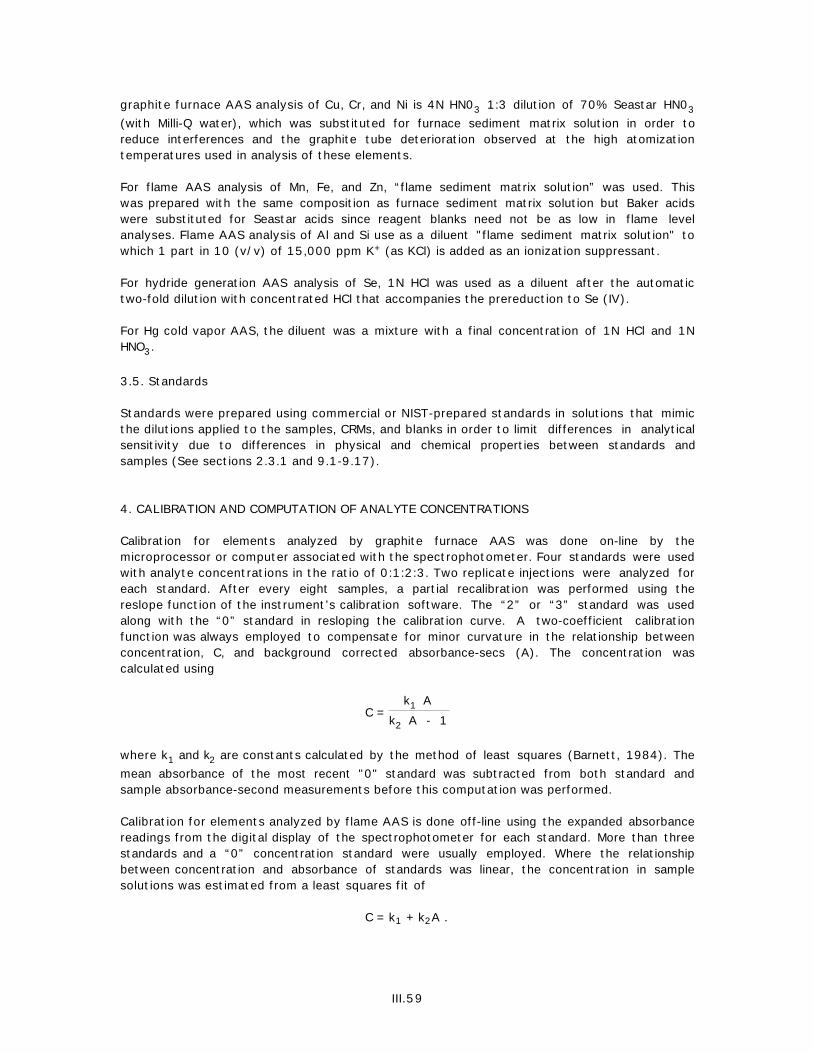
graphite furnace AAS analysis of Cu, Cr, and Ni is 4N HN03 1:3 dilution of 70% Seastar HN03
(with Milli-Q water), which was substituted for furnace sediment matrix solution in order toreduce interferences and the graphite tube deterioration observed at the high atomizationtemperatures used in analysis of these elements.
For flame AAS analysis of Mn, Fe, and Zn, “flame sediment matrix solution” was used. Thiswas prepared with the same composition as furnace sediment matrix solution but Baker acidswere substituted for Seastar acids since reagent blanks need not be as low in flame levelanalyses. Flame AAS analysis of Al and Si use as a diluent "flame sediment matrix solution" towhich 1 part in 10 (v/v) of 15,000 ppm K+ (as KCl) is added as an ionization suppressant.
For hydride generation AAS analysis of Se, 1N HCl was used as a diluent after the automatictwo-fold dilution with concentrated HCl that accompanies the prereduction to Se (IV).
For Hg cold vapor AAS, the diluent was a mixture with a final concentration of 1N HCl and 1NHNO3.
3.5. Standards
Standards were prepared using commercial or NIST-prepared standards in solutions that mimicthe dilutions applied to the samples, CRMs, and blanks in order to limit differences in analyticalsensitivity due to differences in physical and chemical properties between standards andsamples (See sections 2.3.1 and 9.1-9.17).
4. CALIBRATION AND COMPUTATION OF ANALYTE CONCENTRATIONS
Calibration for elements analyzed by graphite furnace AAS was done on-line by themicroprocessor or computer associated with the spectrophotometer. Four standards were usedwith analyte concentrations in the ratio of 0:1:2:3. Two replicate injections were analyzed foreach standard. After every eight samples, a partial recalibration was performed using thereslope function of the instrument’s calibration software. The “2” or “3” standard was usedalong with the “0” standard in resloping the calibration curve. A two-coefficient calibrationfunction was always employed to compensate for minor curvature in the relationship betweenconcentration, C, and background corrected absorbance-secs (A). The concentration wascalculated using
C = k1 A
k2 A - 1
where k1 and k2 are constants calculated by the method of least squares (Barnett, 1984). Themean absorbance of the most recent "0" standard was subtracted from both standard andsample absorbance-second measurements before this computation was performed.
Calibration for elements analyzed by flame AAS is done off-line using the expanded absorbancereadings from the digital display of the spectrophotometer for each standard. More than threestandards and a “0” concentration standard were usually employed. Where the relationshipbetween concentration and absorbance of standards was linear, the concentration in samplesolutions was estimated from a least squares fit of
C = k1 + k2A .
III.59

If the relationship between absorbance and concentration is non-linear (visual inspection of agraphed calibration curve or r2 less than 0.995), calibration is performed using an equation ofthe form
1C
= k1 + k2 1A
.
The mean “0” concentration standard absorbance was subtracted from all standard and sampleresults before performing the non-linear calibration computation. The “0” concentrationstandard is not used subsequently in this calibration computation. This equation is equivalent tothe online calibration used by the spectrophotometer computer in graphite furnace AAS. Thisregression, using reciprocals of C and A, weighs the lower concentration standards moreheavily than higher standards. This has advantages in estimating concentrations near thedetection limit. Standards are reanalyzed after every 10 samples. Drift in the baseline andsensitivity were corrected by linear interpolation of absorbance data collected betweenanalyses of standards.
Calibration for Hg analysis using cold vapor AAS was similar to that for flame AAS. Peakheight output from a strip chart recorder corrected for baseline as described above was usedto determine absorbance.
The mass of analyte in each blank sample was determined from the product of measuredconcentration and diluted sample volume. The mean mass of analyte in the blanks wassubtracted from the calculated analyte mass in the samples to yield blank-corrected analytemass. When divided by sample dry weight, this yields the final analyte concentration in thesediment sample.
5. DETECTION LIMITS
The detection limit was defined as three times the standard deviation of the measuredconcentration of blanks processed as samples. A dry weight of 0.12 g was assumed incalculating detection limits on the basis of sediment dry weight. Typical detection limits arelisted in Table III.3.
Table III.3. Typical sediment detection limits.
Element Detection limit Element Detection limit(µg/g dry weight) (µg/g dry weight)
Ag 0.02 Ni 2Al (%) 0.09 Pb 0.5As 0.8 Sb 0.8Cd 0.02 Se 0.05Cr 2 Si (%) 0.8Cu 0.8 Sn 0.3Fe (%) 0.05 Tl 0.3Hg 0.06 Zn 5Mn 20
III.60

Table III.4. Sediment methodological changes through time.
Sample Set Methodological change
First trace element intercomparison exercise none1984 sediments (southeast) I1Second trace element intercomparison exercise I21985 sediments (southeast) M1Third trace element intercomparison exercise I31987 sediments (southeast) none1986 sediments (southeast) none
Fourth trace element intercomparison exercise I4, I5, M2, M31988 sediments (southeast) P11988 sediments (northeast) none
Sample preparation:P1 - Microwave digestion replaced bomb digestion to reduce digestion time and limit possible metal contamination from thestainless steel bomb jacket.Instrumental:I1 - The Z/3030 with Zeeman background correction replaced the model 603 for graphite furnace analyses. Zeemanbackground correction greatly improved accuracy and precision.I2 - Deuterium arc background correction was dropped from flame analyses on the model 603 AAS. It was unnecessary andincreased the analytical signal to noise ratio and baseline drift.I3 - Graphite furnace AAS replaced flame AAS in the analysis of Cu and Cr to lower the detection limits.I4 - Flow injection analysis for Hg was introduced to increase the speed of analyses which had previously been done by aninefficient batch method.I5 - Flow injection analysis for Se was introduced to increase the speed of analyses which had previously been done by aninefficient batch method.Matrix modification:M1 - 1000 µg Pd/mL replaced 250 µg Pd/mL as the matrix modifier for Sn analysis.M2 - Matrix modifier for Se, As, and Sb was changed from (500 µg Pd + 500 µg Co)/mL to (2000 µg Pd + 2000 µg Co)/mL toimprove precision and accuracy degraded by matrix effects and to make the analysis more robust to variations in atomizationtemperature and sample composition.M3 - 4N HNO3 replaced furnace sediment matrix solution in dilutions of Cu, Cr, and Ni for graphite furnace AAS to avoid
degradation of the graphite furnace by boric acid.
6. CHANGES IN ANALYTICAL METHODS OVER TIME
Initial analytical methods used in the Benthic Surveillance Project have evolved to their currentstatus, as described here, through several iterations in response to new knowledge andexperience in addressing perceived problems and improving efficiency. The major changes inthe past are documented in Table III.4. Changes are paired with the sample sets where theywere first employed. Sample sets are in the order of analysis. Reasons for the changes aregiven in footnotes to the table.
7. ACKNOWLEDGEMENTS
We thank P. Crumley, J. N. Willis, III, and D. S. Squires for their contributions to methodsdevelopment as well as B. L. Pawlak, M. E. Williamson, and W. Riggsbee for their technicalassistance. V. Zdanowicz, B. Clark, and P. Robisch, our colleagues in the Benthic SurveillanceProject, shared technical information and practical experience of great use in methodsdevelopment. We acknowledge the NOAA Quality Assurance Project, the annual intercomparison
III.61

exercises conducted by National Research Council of Canada, and, particularly, S. Berman, fortheir significant contributions to the development, testing, and quality of our methods.
8. SELECTED REFERENCES UTILIZED IN METHODS DEVELOPMENT
Barnett, W. B. (1984) A calibration algorithm for atomic absorption. Spectrochim. A.,39B:829-36.
Fang, Z., S. Xu, X. Wang, and S. Zhang (1986) Combination of flow-injection technique withatomic spectrometry in agricultural and environmental analysis. Anal. Chim. Acta, 179:325-40.
McLaren, J. W., S. S. Berman, V. J. Boyko, and D. S. Russell (1981) Simultaneousdetermination of major, minor, and trace elements in marine sediments by inductively coupledplasma atomic emission spectrometry. Anal. Chem., 53:1802-6.
Nakashima, S., R. E. Sturgeon, S. N. Willie, and S. S. Berman (1988) Acid digestion of marinesamples for trace element analysis using microwave heating. Analyst, 113:159-63.
Okamoto, K., and K. Fuwa. 1984. Low contamination digestion bomb method using Teflon doublevessel for biological materials. Anal. Chem., 56:1750-60.
Rantala, R. T. T., and D. H. Loring (1975) Multi-element analysis of silicate rocks and marinesediments by atomic absorption spectrophotometry. At. Abs. Newslett., 14:117-20.
Rantala, R. T. T., and D. H. Loring (1980) Direct determination of cadmium in silicates from afluoboric-boric acid matrix by graphite furnace atomic absorption spectrometry. At.Spectrosc., 1:163-5.
Shan, X. - Q., Z. - M. Ni, and Z. Li (1983) Determination of arsenic in soil, coal fly-ash andbiological samples by electrothermal atomic absorption spectrometry with matrix modification.Anal. Chim. Acta, 151:179-4.
Shan, X. - Q., Z. - M. Ni, and Z. Li (1984) Use of arsenic resonance line of 197.2 nm and matrixmodification for determination of arsenic in environmental samples by graphite furnace atomicabsorption spectrometry using palladium as a matrix modifier. At. Spectrosc., 5:1-4.
Slavin, W., G. R. Carnrick, D. C. Manning, and E. Pruszkowska (1983) Recent experiences withthe stabilized temperature platform furnace and Zeeman background correction. At. Spectrosc.,4:69-86.
Sturgeon, R. E., J. A. H. Desaulniers, S. S. Berman, and D. S. Russell (1982) Determination oftrace metals in estuarine sediments by graphite furnace atomic absorption spectrometry. Anal.Chim. Acta, 134:283-291.
Tominaga, M., and Y. Umezaki (1982) Comparison of ascorbic acid and related compounds asinterference suppressors in electrothermal atomic absorption spectrometry. Anal. Chim. Acta,139:279-285.
Vijan, P. N., and D. Leung (1980) Reduction of chemical interference and speciation studies inthe hydride generation atomic absorption method for selenium. Anal. Chim. Acta, 120:141-146.
III.62

9. INSTRUMENTAL ANALYSES
9.1. Aluminum
METHOD: Flame Atomic Absorption Spectrophotometry
SAMPLE DIGEST: Diluted HF/Aqua regia
SPECTROPHOTOMETER SETTINGS:
Lamp: HCL 30 maWavelength: 309.3 nmSlit Width: 0.7 nmSignal Output: Expanded absorbanceExpansion: 5 timesIntegration Time: 3 secReplicate Readings: 1Nebulization: Flow spoilerBurner Head: Single slot, 5 cm, nitrous oxideBackground Correction: noneFlame: Nitrous oxide:acetylene; red reducing; nitrous oxide 35,
acetylene 55
STANDARDS: 0, 10, 20, 30, and 40 mg Al/L in flame sediment matrix solutionwith 1500 µg K+/L (as KCl) added as an ionization suppressant.
DILUENT: Flame sediment matrix solution with 1500 µg K+/L. Ten-folddilutions of all samples, blanks, and CRMs.
CALIBRATION: Off-line processing of expanded absorbance signals using either alinear least squares regression (default) or a non-linear leastsquares regression program. Regression coefficients, r2, of lessthan 0.995 indicates the possible need for a non-linear regressioncalibration. Standards are rerun after every 10 samples. Drift inthe calibration parameters is corrected by interpolation.
SENSITIVITY: 0.110 absorbance for a 30 mg Al/L standard.
III.63

9.2. Antimony
METHOD: Graphite Furnace Atomic Absorption Spectrophotometry
SAMPLE DIGEST: Diluted HF/Aqua regia
SPECTROPHOTOMETER SETTINGS:
Lamp: HCL 20 maWavelength: 217.6 nmSlit Width: 0.7 nmRead Delay: 0 secIntegration (Read) Time: 4 secReplicate Sample Injections: 2
FURNACE CONDITIONS:
Graphite Tube Type: Pyrolytic, grooved for forked platformL'vov Platform Type: Solid pyrolytic, forkedCarrier Gas: Argon
FURNACE PROGRAM:
Step T(°C) Time (sec) Internal Gas ReadRamp Hold Flow (mL/min)
1 250 15 30 300 -2 400 20 10 300 -3 1000 10 10 300 -4 2400 0 4 0 *5 2650 1 5 300 -
STANDARDS: 0, 10, 20, and 30 µg Sb/L in furnace sediment matrix solution.
MATRIX MODIFIER: (2000 µg Pd+2000 µg Co)/mL in 4N HNO3.
INJECTION VOLUME: 20 µL
MATRIX MODIFIER: 5 µL
DILUENT: Furnace sediment matrix solution, if needed.
CALIBRATION: Two-coefficient least squares fitted calibration line performed byinstrument microprocessor using the above standards. Reslopeafter every 8 samples.
TYPICAL SENSITIVITY: 0.065 abs.-sec. for 20 µL of a 30 µg Sb/L standard.
III.64

9.3. Arsenic
METHOD: Graphite Furnace Atomic Absorption Spectrophotometry
SAMPLE DIGEST: Diluted HF/Aqua regia
SPECTROPHOTOMETER SETTINGS:
Lamp: EDL Z/3030 10 watts continuous or Z/5100 6-6.5 wattsmodulated
Wavelength: 193.7 nmSlit Width: 0.7 nmRead Delay: 0 secIntegration (Read) Time: 4 secReplicate Sample Injections: 2
FURNACE CONDITIONS:
Graphite Tube Type: Pyrolytic, grooved for forked platformL'vov Platform Type: Solid pyrolytic, forkedCarrier Gas: Argon
FURNACE PROGRAM:
Step T(°C) Time (sec) Internal Gas ReadRamp Hold Flow (mL/min)
1 250 15 30 300 -2 400 20 10 300 -3 1200 10 10 300 -4 2450 0 4 0 *5 2650 1 5 300 -
STANDARDS: 0, 20, 40, and 60 µg As/L in furnace sediment matrix solution.
MATRIX MODIFIER: (2000 µg Pd + 2000 µg Co)/mL in 4N HNO3.
INJECTION VOLUME: 10 µL
MATRIX MODIFIER: 5 µL
DILUENT: Furnace sediment matrix solution.
CALIBRATION: Two-coefficient least squares fitted calibration line performed byinstrument microprocessor using the above standards. Reslopeafter every 8 samples.
TYPICAL SENSITIVITY: 0.220 abs-sec. for 10 µL of a 60 µg As/L standard.
III.65

9.4. Cadmium
METHOD: Graphite Furnace Atomic Absorption Spectrophotometry
SAMPLE DIGEST: Diluted HF/Aqua regia
SPECTROPHOTOMETER SETTINGS:
Lamp: EDL Z/3030 5 watts continuous or Z/5100 3-3.5 wattsmodulated
Wavelength: 228.8 nmSlit Width: 0.7 nmRead Delay: 0 secIntegration (Read) Time: 5 secReplicate Sample Injections: 2
FURNACE CONDITIONS
Graphite Tube Type: Pyrolytic, grooved for forked platformL'vov Platform Type: Solid pyrolytic, forkedCarrier Gas: Argon
FURNACE PROGRAM:
Step T(°C) Time (sec) Internal Gas ReadRamp Hold Flow (mL/min)
1 250 15 30 300 -2 400 20 10 300 -3 500 10 20 300 -4 1700 0 5 0 *5 2650 1 5 300 -
STANDARDS: 0, 1, 2, and 3 µg Cd/L in furnace sediment matrix solution.
MATRIX MODIFIER: 250 µg Pd/mL in 4N HNO3.
INJECTION VOLUME: 15 µL
MATRIX MODIFIER: 5 µL
DILUENT: Furnace sediment matrix solution, if necessary.
CALIBRATION: Two-coefficient least squares fitted calibration line performed byinstrument microprocessor using above standards. Reslope afterevery 8 samples.
TYPICAL SENSITIVITY: 0.250 abs.-sec. for 15 µL of a 2 µg Cd/L standard.
III.66

9.5. Chromium
METHOD: Graphite Furnace Atomic Absorption Spectrophotometry
SAMPLE DIGEST: Diluted HF/Aqua regia
SPECTROPHOTOMETER SETTINGS:
Lamp: HCL 25 maWavelength: 357.9 nmSlit Width: 0.7 nmRead Delay: 0 secIntegration (Read) Time: 6 secReplicate Sample Injections: 2
FURNACE CONDITIONS:
Graphite Tube Type: Pyrolytically coated, groovedL'vov Platform Type: Solid pyrolytic graphiteCarrier Gas: Argon
FURNACE PROGRAM:
Step T(°C) Time (sec) Internal Gas ReadRamp Hold Flow (mL/min)
1 160 15 20 300 -2 400 20 10 300 -3 1000 10 10 300 -4 2500 0 6 0 *5 2800 3 6 300 -
STANDARDS: 0, 10, 20, and 30 µg Cr/L in a 1:15 v/v mixture of furnacesediment matrix solution and 4N HNO3.
MATRIX MODIFIER: none
INJECTION VOLUME: 15 µL
MATRIX MODIFIER: none
DILUENT: 4N HNO3. A minimum 16-fold dilution was made on all samples,certified reference materials, and blanks.
CALIBRATION: Two-coefficient least squares fitted calibration line performed byinstrument microprocessor using the above standards. Reslopeafter every 8 samples.
TYPICAL SENSITIVITY: 0.400 abs-sec. for 15 µL of 20 µg Cr/L standard.
III.67

9.6. Copper
METHOD: Graphite Furnace Atomic Absorption Spectrophotometry
SAMPLE DIGEST: Diluted HF/Aqua regia
SPECTROPHOTOMETER SETTINGS:
Lamp: HCL, 20 maWavelength: 324.7 nmSlit Width: 0.7 nmRead Delay: 0 secIntegration Time: 6 secReplicate Injections: 2
STANDARDS: 0, 20, 40, and 50 µg Cu/L in 1:3 v/v mixture of furnace sedimentmatrix solution and 4N HNO3.
DILUENT: 4N HNO3. A minimum 4-fold dilution was made on all samples,certified reference materials, and blanks.
CALIBRATION: Two-coefficient least squares fitted calibration line performed byinstrument microprocessor using the above standards. Reslopeafter every 8 samples.
SENSITIVITY: 0.340 abs-sec for a 40 µg Cu/L standard.
III.68
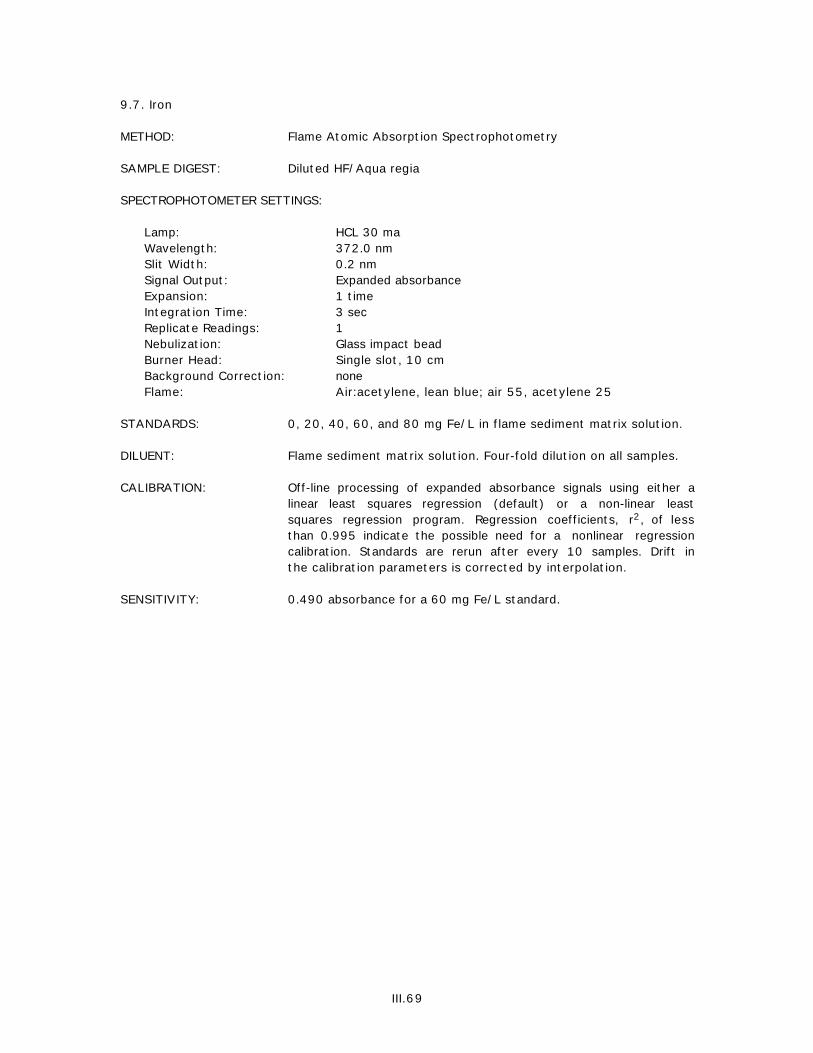
9.7. Iron
METHOD: Flame Atomic Absorption Spectrophotometry
SAMPLE DIGEST: Diluted HF/Aqua regia
SPECTROPHOTOMETER SETTINGS:
Lamp: HCL 30 maWavelength: 372.0 nmSlit Width: 0.2 nmSignal Output: Expanded absorbanceExpansion: 1 timeIntegration Time: 3 secReplicate Readings: 1Nebulization: Glass impact beadBurner Head: Single slot, 10 cmBackground Correction: noneFlame: Air:acetylene, lean blue; air 55, acetylene 25
STANDARDS: 0, 20, 40, 60, and 80 mg Fe/L in flame sediment matrix solution.
DILUENT: Flame sediment matrix solution. Four-fold dilution on all samples.
CALIBRATION: Off-line processing of expanded absorbance signals using either alinear least squares regression (default) or a non-linear leastsquares regression program. Regression coefficients, r2, of lessthan 0.995 indicate the possible need for a nonlinear regressioncalibration. Standards are rerun after every 10 samples. Drift inthe calibration parameters is corrected by interpolation.
SENSITIVITY: 0.490 absorbance for a 60 mg Fe/L standard.
III.69

9.8. Lead
METHOD: Graphite Furnace Atomic Absorption Spectrophotometry
SAMPLE DIGEST: Diluted HF/Aqua regia
SPECTROPHOTOMETER SETTINGS:
Lamp: EDL Z/3030 10 watts continuous or Z/5100 7-7.5 wattsmodulated
Wavelength: 283.3 nmSlit Width: 0.7 nmRead Delay: 0 secIntegration (Read) Time: 5 secReplicate Sample Injections: 2
FURNACE CONDITIONS:
Graphite Tube Type: Pyrolytic, grooved for forked platformL'vov Platform Type: Solid pyrolytic, forkedCarrier Gas: Argon
FURNACE PROGRAM:
Step T(°C) Time (sec) Internal Gas ReadRamp Hold Flow (mL/min)
1 250 15 30 300 -2 400 20 10 300 -3 900 10 10 300 -4 2000 0 5 0 *5 2650 1 5 300 -
STANDARDS: 0, 40, 80, and 120 µg Pb/L in furnace sediment matrix solution.
MATRIX MODIFIER: 250 µ Pd/L in 4N HNO3
INJECTION VOLUME: 15 µL
MATRIX MODIFIER: 5 µL
DILUENT: Furnace sediment matrix solution.
CALIBRATION: Two-coefficient least squares fitted calibration line performed byinstrument microprocessor using the above standards. Reslopeafter every 8 samples.
TYPICAL SENSITIVITY: 0.500 abs-sec for 15 µL of 80 µg Pb/L standard.
III.70

9.9. Manganese
METHOD: Flame Atomic Absorption Spectrophotometry
SAMPLE DIGEST: Diluted HF/Aqua regia
SPECTROPHOTOMETER SETTINGS:
Lamp: HCL 20 maWavelength: 279.5 nmSlit Width: 0.2 nmSignal Output: Expanded absorbanceExpansion: 10 timesIntegration Time: 1 secReplicate Readings: 3Nebulization: Glass impact beadBurner Head: Single slot, 10 cmBackground Correction: noneFlame: Air:acetylene, lean blue; air 55, acetylene 25
STANDARDS: 0, 0.3, 0.6, 0.9, and 1.2 mg Mn/L in furnace sediment matrixsolution.
DILUENT: Flame sediment matrix solution. A 4-fold dilution was made on allsamples, certified reference materials, and blanks to minimizeinterference from Si.
CALIBRATION: Off-line processing of expanded absorbance signals using either alinear least squares regression (default) or a non-linear leastsquares regression program. Regression coefficients, r2, of lessthan 0.995 indicate the probable need for a nonlinear regressioncalibration. Standards are rerun after every 10 samples. Drift inthe calibration parameters is corrected by interpolation.
SENSITIVITY: 0.070 absorbance for a 0.9 mg Mn/L standard.
III.71

9.10. Mercury
METHOD: Cold vapor atomic absorption spectrophotometry
SAMPLE DIGEST: Diluted HF/Aqua regia
SPECTROPHOTOMETER SETTINGS:
Lamp: EDL 5 wattsWavelength: 253.7 nmSlit Width: 2.0 nmSignal Output: Expanded absorbance to strip chart recorderExpansion: 10 timesIntegration time: 0.5 secRecorder Time Constant: TC3 (4 sec)Background Correction: none
FLOW INJECTION PARAMETERS:
Pump: Rainin Rabbit Plus with 4 channel headPump Speed: 25 rpmTubing Diameters (I.D.): 0.89 mm reductant
2.29 mm carrier acid/sample2.29 mm waste
Gas Flow (nitrogen) 100 cm3/min (setting 50)230 cm3/min (setting 50)
Injection Volume: 1.0 mLGas/Liquid Separator Volume: 3.5 mLMixing Loop Volume: 1 mLReaction Loop Volume: 1 mLCell Length: 13.5 cmCell Diameter: 0.6 cmCell Volume: 4 cm3
Reductant: 10% w/v SnCl2 . 2H2O in 1N HClCarrier Acid: Mixed 1N HCl + 1N HNO3
STANDARDS: 0, 1, 2, 3, 5, and 10 ng Hg/L in mixed 1N HCl + 1N HNO3.
DILUENT: Mixed in HCl + 1N HNO3, if necessary.
CALIBRATION: Off-line processing of expanded absorbance signals using either alinear least squares regression (default) or a non-linear leastsquares regression program. Regression coefficients, r2, of lessthan 0.995 indicate the probable need for a nonlinear regressioncalibration. Standards are run after every 10 samples. Drift in thecalibration parameters is corrected by interpolation.
SENSITIVITY: 0.080 absorbance for a 10 µg Hg/L standard.
COMMENTS: Recorder peak height is suppressed by the long time constant inorder to smooth baseline noise. See Figure III.1 for flow injectiondiagram.
III.72

2
1 mL/min
8 mL/min
8 mL/min
Sample loop
Sample
100 mL/min
Flow meter
Flow meter
N
230 mL/min
Partition coil(50 cm
1.6 mm idTeflon)
Reaction coil(50 cm
1.6 mm idTeflon)
Waste
Absorption cell
Pump Flow injection
valve
Carrier acid
Reductant
Gas-liquid separator
Figure III.1. Flow injection system for sediment mercury analysis.
III.73

9.11. Nickel
METHOD: Graphite Furnace Atomic Absorption Spectrophotometry
SAMPLE DIGEST: Diluted HF/Aqua regia
SPECTROPHOTOMETER SETTINGS:
Lamp: HCL 18 maWavelength: 232.0 nmSlit Width: 0.2 nmRead Delay: 0 secIntegration (Read) Time: 6 secReplicate Sample Injections: 2
FURNACE CONDITIONS:
Graphite Tube Type: Pyrolytic, coated, groovedL'vov Platform Type: Solid pyrolytic graphiteCarrier Gas: Argon
FURNACE PROGRAM:
Step T(°C) Time (sec) Internal Gas ReadRamp Hold Flow (mL/min)
1 160 5 20 300 -2 400 20 10 300 -3 1000 10 10 300 -4 2800 0 6 0 *5 2800 3 6 300 -
STANDARDS: 0, 40, 60, and 80 µg Ni/L in a 1:3 mixture of furnace sedimentmatrix solution.
MATRIX MODIFIER: none
INJECTION VOLUME: 20 µL
MATRIX MODIFIER: none
DILUENT: 4N HNO3. A minimum 4-fold dilution was made for all samples,certified reference materials, and blanks.
CALIBRATION: Two-coefficient least squares fitted calibration line performed byinstrument microprocessor using the above standards. Reslopeafter every 8 samples.
TYPICAL SENSITIVITY: 0.660 abs-sec for 20 µL of 80 µg Ni/L standard.
III.74

9.12. Selenium
METHOD: Hydride Generation Atomic Absorption Spectrophotometry
SAMPLE DIGEST: Diluted HF/Aqua regia. Two mL diluted sample digests weresubsequently diluted 1:1 v:v with 12N HCl and heated for 1 hr at90°C in closed 5-mL PFA vials to reduce all Se to the +IV oxidationstate necessary for hydride generation and analysis.
SPECTROPHOTOMETER SETTINGS:
Lamp: EDL6 wattsWavelength: 196.0 nmSlit Width: 2.0 nmSignal output: Expanded absorbance to strip chart recorderExpansion: 10 timesRecorder time constant: TC2 (1 sec)Background Correction: noneIntegration (Read) Time: 0.5 secReplicate Sample Injections: 2
FLOW INJECTION PARAMETERS:
Pump: Rainin Rabbit Plus with 4 channel headPump Speed: 25 rpmTubing Diameters (I.D.):
0.89 mm reductant2.29 mm carrier acid/sample2.29 mm waste
Gas Flow (nitrogen)130 cm3/min (setting 60)300 cm3/min (setting 60)
Injection Volume: 0.5 mLGas/Liquid Separator Volume: 3.5 mLMixing Loop Volume: 1 mLReaction Loop Volume: 1 mLCell: Perkin-Elmer MHS-10 system heated in an air:acetylene
flameCell Length: 16.5 cmCell Diameter: 1.2 cmCell Volume: 18.7 cm3
Reductant: 1% w/v NaBH4 in 0.5% w/v NaOHCarrier Acid: Mixed 1N HCl + 1N HNO3
STANDARDS: 0, 1, 2, 3, and 5 µg Se/L in 6N HCl.
DILUENT: 1N HCl
III.75

CALIBRATION: Off-line processing of expanded absorbance signals using either alinear least squares regression (default) or a non-linear leastsquares regression program. Regression coefficients, r2, of lessthan 0.995 indicate the probable need for a nonlinear regressioncalibration. Standards are run after every 10 samples. Drift in thecalibration parameters is corrected by interpolation.
TYPICAL SENSITIVITY: 0.100 abs-sec for 5 µg Se/L standard.
2
1 mL/min
8 mL/min
8 mL/min
Sample loop
Sample
130 mL/min
Flow meter
Flow meter
N
300 mL/min
Partition coil(50 cm
1.6 mm idTeflon)
Reaction coil(50 cm
1.6 mm idTeflon)
Waste
Absorption cell
Pump Flow injection
valve
Carrier acid
Reductant
Gas-liquid separator
Figure III.2. Flow injection system for selenium analysis.
III.76

9.13. Silicon
METHOD: Flame Atomic Absorption Spectrophotometry
SAMPLE DIGEST: Diluted HF/Aqua regia
SPECTROPHOTOMETER SETTINGS:
Lamp: HCL 30 maWavelength: 251.6 nmSlit Width: 0.2 nmSignal Output: Expanded absorbanceExpansion: 2 timesIntegration Time: 3 secReplicate Readings: 1Nebulization: Flow spoilerBurner Head: Single slot, 5 cmBackground Correction: noneFlame: Nitrous oxide:acetylene, red reducing; nitrous oxide 35,
acetylene 55
STANDARDS: 0, 50, 100, 150, and 200 mg Si/L in flame sediment matrixsolution with 1500 µg/L K+ (as KCl) added as an ionizationsuppressant.
DILUENT: Flame sediment matrix solution with 1500 µg/L K+ (as KCl). A 10-fold dilution was made on all samples, certified referencematerials, and blanks.
CALIBRATION: Off-line processing of expanded absorbance signals using either alinear least squares regression (default) or a non-linear leastsquares regression program. Regression coefficients, r2, of lessthan 0.995 indicate the probable need for a nonlinear regressioncalibration. Standards are rerun after every 10 samples. Drift inthe calibration parameters is corrected by interpolation.
SENSITIVITY: 0.200 absorbance for a 150 mg Si/L standard.
III.77

9.14. Silver
METHOD: Graphite Furnace Atomic Absorption Spectrophotometry
SAMPLE DIGEST: Diluted HF/Aqua regia
SPECTROPHOTOMETER SETTINGS:
Lamp: HCL 12 maWavelength: 328.1 nmSlit Width: 0.7 nmRead Delay: 0 secIntegration (Read) Time: 4 secReplicate Sample Injections: 2
FURNACE CONDITIONS:
Graphite Tube Type: Pyrolytic, grooved for forked platformL'vov Platform Type: Solid pyrolytic, forkedCarrier Gas: Argon
FURNACE PROGRAM:
Step T(°C) Time (sec) Internal Gas ReadRamp Hold Flow (mL/min)
1 250 15 30 300 -2 400 20 10 300 -3 700 10 10 300 -4 2000 0 4 0 *5 2650 1 5 300 -
STANDARDS: 0, 1, 2, and 3 µg Ag/L in furnace sediment matrix solution.
MATRIX MODIFIER: 250 µg Pd/mL in 4N HNO3.
INJECTION VOLUME: 30 µL
MATRIX MODIFIER: 5 µL
DILUENT: Furnace sediment matrix solution, if necessary.
CALIBRATION: Two-coefficient least squares fitted calibration line performed byinstrument microprocessor using above standards. Reslope afterevery 8 samples.
TYPICAL SENSITIVITY: 0.140 abs-sec for 30 µL of a 2 µg Ag/L standard.
III.78

9.15. Thallium
METHOD: Graphite Furnace Atomic Absorption Spectrophotometry
SAMPLE DIGEST: Diluted HF/Aqua regia
SPECTROPHOTOMETER SETTINGS:
Lamp: EDL Z/3030 7 watts continuous or Z/5100 4-4.5 wattsmodulated
Wavelength: 276.8 nmSlit Width: 0.7 nmRead Delay: 0 secIntegration (Read) Time: 4 secReplicate Sample Injections: 2
FURNACE CONDITIONS
Graphite Tube Type: Pyrolytic, grooved for forked platformL'vov Platform Type: Solid pyrolytic, forkedCarrier Gas: Argon
FURNACE PROGRAM:
Step T(°C) Time (sec) Internal Gas ReadRamp Hold Flow (mL/min)
1 250 15 30 300 -2 400 20 10 300 -3 600 15 30 300 -4 1900 0 4 0 *5 2650 1 3 300 -
STANDARDS: 0, 10, 20, and 30 µg Tl/L in furnace sediment matrix solution.
MATRIX MODIFIERS: (1) 5% w/v ascorbic acid in Milli-Q water(2) 250 µg Pd/mL in 4N HNO3
INJECTION VOLUME: 20 µL
MATRIX MODIFIER : 5 µL of (1) + 5 µL of (2).
DILUENT: Furnace sediment matrix solution, if necessary.
CALIBRATION: Two-coefficient least squares fitted calibration line performed byinstrument microprocessor using above standards. Reslope afterevery 8 samples.
TYPICAL SENSITIVITY: 0.100 abs-sec for 20 µL of a 30 µg Tl/L standard.
III.79

9.16. Tin
METHOD: Graphite Furnace Atomic Absorption Spectrophotometry
SAMPLE DIGEST: Diluted HF/Aqua regia
SPECTROPHOTOMETER SETTINGS:
Lamp: EDL Z/3030 8-8.5 watts continuous or Z/5100 5.5-6watts modulated
Wavelength: 286.3 nmSlit Width: 0.7 nmRead Delay: 1 secIntegration (Read) Time: 3 secReplicate Sample Injections: 2
FURNACE CONDITIONS
Graphite Tube Type: Pyrolytic, grooved for forked platformL'vov Platform Type: Solid pyrolytic, forkedCarrier Gas: Argon
FURNACE PROGRAM:
Step T(°C) Time (sec) Internal Gas ReadRamp Hold Flow (mL/min)
1 250 5 40 300 -2 400 30 10 300 -3 1000 10 10 300 -4 2400 0 4 0 *5 2650 1 3 300 -
STANDARDS: 0, 20, 40, and 60 µg Sn/L in 4N HNO3.
MATRIX MODIFIER: 1000 µg Pd/mL in 4N HNO3.
INJECTION VOLUME: 30 µL
MATRIX MODIFIER: 5 µL
DILUENT: Furnace sediment matrix solution, if necessary.
CALIBRATION: Two-coefficient least squares fitted calibration line performed byinstrument microprocessor using above standards. Reslope afterevery 8 samples.
TYPICAL SENSITIVITY: 0.195 abs-sec. for 30 µl of a 60 µg Sn/L standard.
III.80

9.17. Zinc
METHOD: Flame Atomic Absorption Spectrophotometry
SAMPLE DIGEST: Diluted HF/Aqua regia
SPECTROPHOTOMETER SETTINGS:
Lamp: HCL 15 maWavelength: 213.8 nmSlit Width: 0.7 nmSignal Output: Expanded absorbanceExpansion: 1 timeIntegration Time: 3 secReplicate Readings: 1Nebulization: Glass impact beadBurner Head: Single slot, 10 cmBackground Correction: noneFlame: Air:acetylene, lean blue; air 55, acetylene 25
STANDARDS: 0, 0.3, 0.6, 0.9, and 1.2 mg Zn/L in flame sediment matrixsolution.
DILUENT: Flame sediment matrix solution, if needed.
CALIBRATION: Off-line processing of expanded absorbance signals using either alinear least squares regression (default) or a non-linear leastsquares regression program. R2 less than 0.995 indicates theprobable need for a nonlinear regression calibration. Standards arererun after every 10 samples. Drift in the calibration parametersis corrected by interpolation.
SENSITIVITY: 0.260 absorbance for a 0.9 mg Zn/L standard.
III.81

III.82

Analytical Methods for Trace Elements in Fish Liver by Atomic AbsorptionSpectrophotometry
D. W. Evans and P. J. HansonNOAA/National Marine Fisheries Service
Southeast Fisheries Science CenterBeaufort Laboratory
Beaufort, NC
ABSTRACT
The methods developed and used for analysis of 15 major and trace elements in teleostfish livers by the NOAA/NMFS/Beaufort Laboratory of the Southeast Fisheries Centeras part of the National Benthic Surveillance Surveillance Project of the National Statusand Trends (NS&T) Program are described.
1. INTRODUCTION
At the inception of the NS&T National Benthic Surveillance Surveillance Project in 1984,analytical methods were needed for the analysis of 15 elements (Ag, As, Cd, Cr, Cu, Fe, Hg,Mn, Ni, Pb, Sb, Se, Sn, Tl, and Zn) in teleost fish livers. Three laboratories of the NOAANational Marine Fisheries Service (NMFS) participated in the analyses, including the BeaufortLaboratory of the Southeast Fisheries Center. It was important to develop analytical methodsthat could assure intercomparability of data throughout the nation since each NS&Tcollaborating laboratory would be analyzing tissue samples collected in its respective region.The Beaufort Laboratory accepted responsibility for development of basic methods forelemental analysis of tissues that would be reflective of the then current state-of-the-art, andthat would provide the basis for each laboratory to refine its own methods to fit specificrequirements of their samples and instrumentation. Intercomparability of data from the threeNMFS laboratories would be assured through analysis of certified reference materials, andannual intercomparison exercises that began in 1985 and continue today under the direction ofDr. Shier Berman of the National Research Council of Canada.
Each of the participating laboratories was equipped, and was familiar with, atomic absorptionspectrophotometry (AAS) for elemental analysis, thus providing a common approach tomethods development. Data and, therefore, methods for most of the 15 elements in fish liverwere reported by early 1984 (Eisler, 1981), often by AAS. Only for Sb, Sn, and Tl wereanalytical data and methods not available. The principal task was to further develop existingmethods within the constraints required by the project. These included:
• Limitations imposed by the often small size of liver samples available for analysis,
• The need to provide dissolution of small tissue samples with reproducible recoveries andminimal process blanks,
• The need to analyze as many as 15 elements in a single dissolved sample, and
• The need to keep the dissolved sample volume small enough to assure analysis of elementswith inherently low AAS sensitivities (e.g., Ni and Sb) and expected low concentrations inliver tissue (e.g., Sb, Cr, Ni, and Sn).
III.83

Whole livers from some of the smaller fish are often < 0.5 g wet weight and sometimes assmall as 0.1 g. Although composite samples could be anticipated, analysis of individual smalllivers and small dissected pieces of larger livers would be required of the method. The volumeof digested sample needed to be at least 10 mL to provide sufficient volume for all 15 elementalanalyses from a single digest, and at this volume, detection limits for some elements in livertissue are approached. The low tissue concentrations for some elements requires a minimalsample volume, and thus constrains the dissolution method to minimize contamination andmaximize elemental recoveries. The initial dissolution method used a high temperature pressurevessel heated in a convection oven. The vessel had three walls: a Teflon vial inside a Teflonlined stainless-steel pressure vessel. This functioned well to produce reproducible recoveriesand generally low blanks. It was later replaced by a more convenient method using microwaveheating in an all Teflon double-walled vessel.
The general method employed is total dissolution of tissue samples using nitric acid at elevatedtemperature and pressure followed by AAS using flame, graphite furnace, hydride generation,or cold vapor atomization. The basis for development was the literature available in 1984.Although the methods remain substantially as initially developed, they have evolved during theintervening years. The significant differences and the reasons for the changes are presented.Each of the participating NOAA laboratories refined and evolved their methods independently.Some differences undoubtedly exist among the laboratories, and this chapter describes themethods used at Beaufort Laboratory. The results of six tissue intercomparison exercisesbetween 1985 and 1992 indicated good intercomparability of data among the NMFSlaboratories.
2. EQUIPMENT AND SUPPLIES
2.1. Equipment
2.1.1. Atomic absorption spectrophotometers
Personal computer, IBM AT with Epson LQ-850 printerPrinter, Printronix model S7024. Anadex, Irvine, CA.Spectrophotometer, Perkin-Elmer model 603 with manual burner control and deuterium
lamp background correction. Perkin-Elmer, Norwalk, CT.Spectrophotometer, Perkin-Elmer Z/3030 with Perkin-Elmer HGA-600 furnace controller
and Perkin-Elmer AS-60 autosamplerSpectrophotometer, Perkin-Elmer Z/5100 with Perkin-Elmer HGA-600 furnace controller
and Perkin-Elmer AS-60 autosamplerStrip chart recorder, Perkin-Elmer model R100A
2.1.2. Flow injection system
Connectors and tees, Teflon, variable bore. Omnifit, Atlantic Beach, NY.Fittings, flangeless. Upchurch Scientific, Oak Harbor, WA.Flow-meters, panel-mounted with aluminum fittings, 65 mm flow tubes and adjustable
valves with maximum air flow rates of 145 mL/min and 333 mL/min. Cole Parmer,Niles, IL.
Gas/liquid separator, custom Teflon and acrylicMercury cold vapor absorption cell, custom PFA Teflon, 0.6 mm i.d. by 13.5 mm longPump, peristaltic, 4 channel, 0.89 mm and 2.29 mm i.d. PVC pump tubing. Rainin Rabbit,
Woburn, MA.Tubing, Teflon, for reaction and separation coils and intercomponent connections: 1.5-mm
o.d., 0.8-mm i.d.; 3.0-mm o.d., 1.5 mm i.d.
III.84

Valve, rotary injection, Teflon, manual 6-way with 0.5 and 1.0 mL sample loops.Rheodyne, Cotati, CA.
2.1.3. Lamps and power supplies
Electrodeless Discharge Lamp (EDL) power supply, single lamp. Perkin-Elmer, Norwalk, CT.Electrodeless Discharge Lamps (EDL), for As, Cd, Hg, Pb, Se, Sn, and Zn. Perkin-Elmer,
Norwalk, CT.Hollow Cathode Lamps (HCL), for Cr, Cu, Fe, Mn, Sb, Tl, and Ag. Perkin-Elmer, Norwalk,
CT.Hollow Cathode Lamps (HCL), for Ni. VWR Scientific, Atlanta, GA.
2.1.4. Sample digestion equipment
Capping station, pressure vessel. CEM Corp., Mathews, NC.Oven, digestion, microwave , CEM Model MDS 81DPressure vessels, 120-mL, perfluoroalkoxy (PFA) Teflon, CEMTurntable, CEMVials, PFA Teflon, 30-mL. Savillex, Minnetonka, MN.
2.1.5. Sample homogenization equipment
Paint shaker, Model MNC-2-C. Miracle Paint Rejuvenator, St. Paul, Mn.Vials, 30-mL, PFA Teflon. Savillex, Minnetonka, MN.Spheres, 0.5-inch, Teflon. Cole Parmer, Niles, IL.
2.1.6. General laboratory equipment
Balance, Model GT2100. Ohaus, Florham Park, NJ.Balance, Model GT4800. Ohaus, Florham Park, NJ.Balance, Model RP160. Sartorius, McGaw Park, IL.Deionized water system, Milli-Q. Millipore Corp., Bedford, MA.Hood, benchtop, laminar flow. Environmental Air, Albuquerque, NM.Horizontal air flow oven, OV-510A-2. Blue M, Blue Island, IL.Horizontal air flow oven, OV-510A-3. Blue M, Blue Island, IL.Hotplate. Thermolyne Cimarec, Dubuque, IA.Ionizing unit, Staticmaster. Nuclear Products, Grand Island, NY.Pipets, Pipetman, continuously adjustable, 2-20 µL, 10-100 µL, 20-200 µL, 100-1000
µL, and 500-5000 µL. Gilson, Worthington, OH.
2.2 Supplies
2.2.1. Atomic absorption spectrophotometry
L'vov Platforms; solid pyrolytic, Perkin-Elmer B010-9324Pyrolytic graphite tubes; grooved, Perkin-Elmer B010-9322Pyrolytic graphite tubes; with forked platforms, Perkin-Elmer B050-5057
2.2.2. Compressed gases
Acetylene, atomic absorption grade 99.6% purityArgon, prepurified 99.998% purityCompressed airNitrogen, prepurified 99.998% purity
III.85

2.2.3. Plasticware
Bottles, 60-, 125-, 250-, 500-, and 1000-mL, FEP TeflonBottles, 125-, 250-, 500-, and 1000-mL, linear polyethylene bottlesCups, autosampler with external snap caps, 2-mL conical bottom, polyethylenePipet tips, polypropylene, for Gilson pipets, clear natural trace metal freeTubes, culture, with external snap caps, 12 X 75 mm (5-mL), and 17 X 100 mm (15-mL),
polystyrene
2.2.4. Dissection tools
Forceps and cutting board, plastic (e.g., Teflon or polypropylene chemically resistantplastic with low metal impurity content)
Knives and scalpels, titanium, made from purified metal
2.2.5. Labware preparation
All containers and utensils coming into contact with the tissue samples were cleaned rigorouslyto minimize possible contamination. This is especially important in the analyses of Cr, Ni, Pb,and Sn, which are usually in very low concentration in fish livers, and are widely found inshipboard and laboratory environments. Powder-free vinyl gloves were worn during this andall other operations.
The PFA vials used for the digestions were rinsed and scrubbed inside with a brush after eachuse. They were washed in an automatic laboratory dishwasher using detergent and rinsed indistilled water. The vials were then placed upright in 1-L PFA jars fitted with lids containingports that can be opened or closed. The jars were filled with concentrated HNO3 (Baker) and thelids screwed tightly in place. The ports were left open to accommodate expansion and acidevaporation. The jars were heated on a hot plate in an exhaust hood at about 90°C for at least24 hr. After cooling, the acid was poured off and the jars filled with Milli-Q water, shaken torinse the vials, and the waste water poured off. This was repeated three times. The vials wereremoved from the jar and dried at room temperature in a laminar flow clean hood. The vial capswere cleaned similarly but separately. Vials used for tissue digestion and homogenization werecleaned separately and isolated from those used for sediment digestion or standardspreparation.
Autosampler (AS 60) cups were placed in 1-L FEP Teflon bottles which were filled with 10%v/v HNO3 (Baker) in Milli-Q water. They were double sealed in polyethylene Ziplock bags andheated at 60°C for at least 24 hr. After cooling, they were rinsed at least three times withMilli-Q water as described above.
All forceps, scissors, knives, and cutting surfaces which might contact the tissue sample, arewashed with 10% v/v HNO3 (Baker) followed by Milli-Q water just prior to use. Removal oftissue particles from dissecting tools often required washing in detergent (e.g., Micro) prior toacid wash.
2.3. Chemicals and reagents
2.3.1. Atomic absorption standards
Ag: 1000 ppm, Baker 6940-1 and 10,000 ppm NIST SRM 2121. J. T. Baker, Phillipsburg,NJ, and NIST, Gaithersburg, MD.
III.86

As: 1000 ppm, Baker 6919-1 and 10,000 ppm NIST SRM 2126Cd: 1000 ppm, Baker 6924-1 and 10,000 ppm NIST SRM 2121Cr: 1000 ppm, Baker 6926-1 and 10,000 ppm NIST SRM 2128Cu: 1000 ppm, Baker 6928-1 and 10,000 ppm NIST SRM 2124Fe: 1000 ppm, Baker 6929-1 and 10,000 ppm NIST SRM 2124Hg: 1000 ppm, VWR 737-3 and 1000 ppm, Fisher SO-M-114. VWR, Atlanta, GA, and
Fisher Scientific, Pittsburg, PA.Mn: 1000 ppm, Baker 6933-1 and 10,000 ppm NIST SRM 2128Ni: 1000 ppm, Baker 6930-1 and 10,000 ppm NIST SRM 2124Pb: 1000 ppm, Baker 6930-1 and 10,000 ppm NIST SRM 2121Sb: 1000 ppm, Baker 6918-1 and 10,000 ppm NIST SRM 2126Se: 1000 ppm, Baker 6938-1 and 10,000 ppm NIST SRM 2126Sn: 1000 ppm, Baker 6943-1 and 10,000 ppm NIST SRM 2126Tl: 1000 ppm, Ricca 8390. Ricca Chemicals, Arlington, TX.Zn: 1000 ppm, Baker 6946-1 and 10,000 ppm NIST SRM 2121
2.3.2. Reagents
Ammonium phosphate, monobasic (NH4H2PO4) [7722-76-1], Ultrex 4-4931. J. T. Baker,Phillipsburg, NJ.
Cobalt metal [7440-48-4], powder reagent grade, C-363. Fisher Scientific, Pittsburg, PA.Hydrochloric acid (HCl) [7647-01-0], concentrated (38%), Instra-analyzed for trace
metal analysis. J. T. Baker, Phillipsburg, NJ.Nitric acid (HNO3) [7697-37-2], concentrated (70%), Ultra-high purity sub-boiling
distilled in Teflon. Seastar Chemicals, Sidney, BC, Canada.Nitric acid (HNO3) [7697-37-2], concentrated (70%), Instra-analyzed for trace metal
analysis. J. T. Baker, Phillipsburg, NJ.Palladium metal [7440-05-3], powder, grade 1 puratomic. Johnson Matthey, West
Chester, PA.Stannous chloride (SnCl2 . 2H2O) [10025-69-1], suitable for mercury analysis, 3980-01.
J. T. Baker, Phillipsburg, NJ.
3. SAMPLE TREATMENT
3.1. Sample matrix modification
Chemical modification of the sample matrix is often necessary to achieve unbiased analysis ofsamples using simple standard solutions in graphite furnace AAS. The development of matrixmodifiers has evolved to take advantage of newer approaches or to adapt to specific analyticalproblems. The current matrix modifiers are described below.
250 µg Pd/mL in 4N HNO3. This was used in the analysis of Ag, Cd, and Sn and wasprepared by diluting 10,000 µg Pd/mL solution 40 fold with 4N HNO3. The 10,000 µgPd/mL solution was prepared using Johnson-Matthey Grade 1 Puratomic Pd metal dissolvedin concentrated Seastar HNO3 to which a few drops of Seastar HCl were added to aiddissolution. Heating to 90°C dissolved the Pd metal. The resulting solution was diluted withMilli-Q water to make a 10,000 µg Pd/mL in 4N HNO3.
(2000 µg Pd + 2000 µg Co)/mL in 4N HNO3. This solution was used in the analysis of As,Sb, and Se, and was prepared by diluting 10,000 µg Pd/mL and 10,000 µg Co/mL solutions
III.87

with 4N Seastar HNO3. The 10,000 µg Co/mL solution was prepared by dissolving l g Cometal in 100 mL 4N HNO3.
5% ascorbic acid. This solution was used in conjunction with the 250 µg Pd/mL modifier inthe analysis of Tl. It was prepared by dissolving 5 g ascorbic acid (Fisher reagent grade) in100 mL Milli-Q water.
5% w/v NH4H2PO4. This solution was used in the analysis of Pb and was prepared bydissolving 5 g Baker Ultrex ammonium dihydrogen phosphate in 100 mL of 4N HNO3
(Seastar).
3.2. Sample preparation
3.2.1. Sample drying
All concentrations of trace elements in liver tissues are reported on the basis of tissue dryweight. In the analysis of individual livers, the tissue was dried before nitric acid was addedfor digestion. Livers were placed in previously tared 30-mL PFA Teflon vials immediately afterdissection. The vials were previously cleaned and dried to constant weight at 100°C by heatingovernight in a convection oven. During pre-tare drying, the vials caps were loosened. The vialswere placed in polypropylene trays with the lid loosely in place.
Livers in their vials were frozen to -90°C and then freeze dried overnight to less than 200millitorr vacuum. The vial caps were left in place but tightened only one-half to two-thirds turnduring freeze drying process. Vials in trays of 10 were placed in polyethylene Ziplock bagswhich were zipped only two-thirds closed to maintain connection to the vacuum. One such bagwas placed inside another and partially zipped from the other side to create a maze-like path.Vials were reweighed after freeze drying and the tissue dry weight determined as thedifference from the vial tare. Precision in such weight determination is about 0.0010 g.Reference materials and blanks (no added material) were treated similarly. Weights weredetermined to 0.0001 g.
Livers analyzed as composites from 10 fish were digested wet and the dry weight determinedfrom the dry-to-wet weight ratio of a separate aliquot. About one gram of liver homogenatepuree was pipetted into a tared aluminum weighing pan. The tissue wet weight was determinedby difference using a balance with 0.001 g readability. Samples were oven dried overnight at60°C. The tissue dry weight was determined by difference from the tare weight. The dryweight to wet weight ratio was calculated.
3.2.2. Homogenization of large composite samples
Samples composited from livers of many fish were too large to be digested by our procedure,so a homogeneous subsample was prepared. This was done by placing samples of about 1 g wetweight from each of ten livers directly in a cleaned 30 mL PFA vial.
III.88

Table III.5. Volume of nitric acid added to various tissue sample weights.
__________ Tissue weight___________
Dry (g) Wet (g) Volume of HNO3 (mL)
< 0.1 < 0.4 2.50.1 - 0.2 0.4 to 0.8 5.0
> 0.2 > 0.8 7.5
The actual wet weight of each liver sample added to the vial is determined by repeatedly taringthe vial after each addition. Weights are determined to 0.01 g. Two acid-cleaned, 0.5-inchdiameter TFE Teflon balls were added to each vial which was then tightly capped. Three vialswere placed in a small polyethylene Ziplock bag and three such bags were placed in a specialpolystyrene foam-lined paint can so that the balls were shaken along the long axis of the PFAvials to homogenize the tissue. The paint can was sealed, attached to the paint shaker, andshaken for ten min.
About 1 mL of the homogenized tissue puree was pipetted into a cleaned, tared 30-mL PFA vialfor subsequent digestion. A second aliquot of about the same size was pipetted into a taredaluminum weighing pan for drying and determination of tissue dry weight to wet weight ratio.
3.3. Microwave digestion
3.3.1. Acid additions
Dissolution of tissues was accomplished through oxidation with high purity concentrated HNO3
(70%, Seastar). The volume of acid used depended on tissue weight. Wet tissues were treatedunder the assumption that the wet weight to dry weight ratio was 4. The volume of acid usedfor various tissue sample weights are listed in Table III.5. Samples weighing more than 0.4 gdry weight or 1.6 g wet weight cannot be effectively digested in the 30 mL PFA vials. CertifiedReference Material (CRM) weights were targeted at 0.27 g to 0.33 g and received 7.5 mLHNO3. Blanks containing no sample or CRM material also received 7.5 mL HNO3 additions.
Pipetting of HNO3 was done using a 5-mL Gilson pipet with pre-rinsed polyethylene tips in orderto minimize contamination. The pipet was disassembled and rinsed immediately after use toprevent corrosion of internal parts.
3.3.2. Digestion
The 30-mL PFA vials containing samples, CRMs, or blanks and added HNO3 were capped andsealed tightly. The vials were then placed singly in CEM microwave pressure vessels. Five mLof Milli-Q water were added to each pressure vessel, which was then capped and sealed tightlywith the capping station. Vessels were placed in alternating positions in the 12-positionmicrowave carousel, and the vent tubes attached from the central chamber. Six samples weredigested together using the following program sequence.
III.89

1. Close microwave door. Turn on exhaust fan to maximum. Start turntable.
2. Time = 5 min; Power = 30%.Cool vials for 20 min; vent each vessel by pressing on exhaust tube.
3. Time = 5 min; Power= 50%Cool and vent as in step 2.
4. Time = 5 min; Power = 70%.Cool and vent as in step 2.
5. Uncap pressure vessels in an exhaust hood using the capping station. Remove the 30-mLPFA vials from the pressure vessels by floating them out with Milli-Q water. Allow thePFA vials to dry in a laminar flow hood before opening. Dilute sample digests with Milli-Qwater as described below.
3.3.3. Initial sample dilution and volume determination
Milli-Q water was added to each digest in a 3:1 v/v ratio of Milli-Q to HNO3 originally added.Thus, vials with 2.5 mL HNO3 received 7.5 mL Milli-Q water; vials with 5.0 mL HNO3 received15.0 mL Milli-Q water; and vials with 7.5 mL HNO3 received 22.5 mL Milli-Q water. The diluteddigests ranged from about 4N HNO3 in blanks to 2N HNO3 in digests with as much as 0.4 g dryweight of tissue. The difference represents the loss of HNO3 consumed in oxidation of tissue.All subsequent dilutions were made with 3N HNO3 (Seastar) to approximately match the middlerange of acid strengths of initially diluted digests.
Vials and their contents were weighed to 10 mg and the net solution weight calculated as thedifference from the vial tare weight. After shaking to mix the vial contents, the solutiondensity was determined. Three 100 µL aliquots of the initially diluted digest solution werepipetted into an AS-60 cup and weighed to 0.1 mg. A calibrated 100 µL Gilson pipet and pre-rinsed pipet tips were used. Pipet tips need not be rinsed between aliquots from the same vial,but new tips must be used for different vials. Weights of the three aliquots had to agree within1.0 mg, otherwise further aliquots were weighed and the outlying weights rejected. The meanaliquot weight was multiplied by 10 to yield the solution density. Solution volume wascalculated as solution weight divided by solution density.
3.4. Alternate bomb digestion
The microwave digestion procedure was developed from an earlier digestion procedure thatused large Teflon-lined Parr bombs as pressure vessels and heating in a conventionallaboratory oven. This method was modeled on one described by Okamota and Fuwa (1984). TheTeflon pressure vessel provided an additional inert barrier to possible metal contaminationwhile using relatively inexpensive PFA vials as primary digestion containers which could becleaned and weighed in large numbers. The vials could be used for direct weighing of samplesand CRMs, initial dilutions, and sample storage. Contamination risks were reduced becausedigest transfers to other containers for volume determination and storage were unnecessary.Efficiency was increased by eliminating such procedures. For these reasons, we retained theconfiguration of a digestion vial within an inert pressure vessel when changing to microwavedigestion.
Sample preparation and acid additions for the alternate Parr bomb digestion were the same asfor the microwave digestion. The 30-mL PFA vials were placed singly in the Teflon liner of the125-mL Parr bomb with 5 mL of Milli-Q water. After capping, the liner was placed in its
III.90

stainless steel bomb jacket which was then assembled according to the manufacturer'sinstructions. The bombs were heated for 2 hr at 90°C, for 4 hr at 140°C, and cooled overnight.After venting in a fume hood, the PFA vials were removed and treated as in the microwavedigestion procedure. In both procedures there was some venting of vapors from the PFA vialsinto the pressure vessel, but we observed no apparent loss of potentially volatile elements suchas mercury.
3.5. Dilution
Any sample or CRM digest whose concentration exceeded that of the highest standard wasdiluted. Extrapolation of the calibration curve beyond the range of the highest standard was notdone. Diluents were selected to mimic the acid matrix of the samples, CRM's, and blanks.
For graphite furnace AAS analyses, the diluent was 4N HNO3, prepared using 175 g HNO3
(Seastar) and 375 g Milli-Q water. This acid solution mimics the blank digest composition. TheHNO3 also functioned as a matrix modifier, especially in reducing the possible interference ofchloride salts.
For flame and Hg cold vapor AAS analyses, the diluent is 3N HNO3, prepared using 131 g HNO3
(Seastar) and 406 g Milli-Q water. This acid solution mimics the CRM digest acid composition.There was a variable loss of HNO3 utilized in the digestion procedure resulting from thediffering amounts of organic matter in samples, CRM's, and blanks, and this resulted in a rangeof final HNO3 concentrations. The choice of 3N HNO3 was a compromise within this range ofconcentrations. Standards were also prepared in 3N HNO3 to limit variations in analyticalsensitivity due to differences in aspiration, nebulization, and flow rates.
4. CALIBRATION AND COMPUTATION OF ANALYTE CONCENTRATIONS
Calibration for the elements analyzed by graphite furnace AAS was done on line by themicroprocessor or computer associated with each spectrophotometer. Four standards in 4NHNO3 were used with analyte concentrations in the ratio of 0:1:2:3. Two replicate injectionswere analyzed for each standard. After every eight samples, a partial recalibration wasperformed using the reslope function of the instrument's calibration software. The "2" or "3"standard was used along with the "0" standard in resloping the calibration curve. A two-coefficient calibration function was always employed to compensate for minor curvature in therelationship between concentration (C) and background corrected absorbance-sec (A). Theconcentration was calculated using
C = k1 A
k2 A - 1
where k1 and k2 are constants calculated by the method of least squares (Barnett, 1984). Themean absorbance of the most recent "0" standard was subtracted from both standard andsample absorbance-second measurements before this computation was performed.
Calibration for elements analyzed by flame AAS was done offline using the mean of threeexpanded absorbance readings from the digital display of the spectrophotometer for eachstandard. More than three standards and a "0" concentration standard were usually employed.Where the relationship between concentration and absorbance of standards was linear, theconcentration in sample solutions was estimated from a least squares calculation of
III.91

Table III.6. Typical tissue detection limits.
Element Detection limit Element Detection limit(µg/g dry weight) (µg/g dry weight)
Ag 0.02 Ni 0.1As 0.3 Pb 0.1Cd 0.01 Sb 0.2Cr 0.05 Se 0.4Cu 1 Sn 0.2Fe 5 Tl 0.1Mn 1 Zn 2Hg 0.05
C = k1 + k2 A.
If the relationship between absorbance and concentration was found to be non-linear throughvisual inspection of a calibration curve or calculation of an r2 less than 0.995, calibration wasperformed using an equation of the form
1C
= k1 + k2 1A
.
The mean "0" concentration standard absorbance was subtracted from all standard and sampleresults before calibration computations. The "0" standard is not used in this calibrationcomputation. This equation is equivalent to the online calibration used by the spectrophotometercomputer in graphite furnace AAS. This regression, using reciprocals of C and A, weights thelower standards more heavily than higher standards. This had an advantage when estimatingconcentrations near the detection limit. Standards were reanalyzed after every ten samples.Drift in baseline and sensitivity were corrected by linear interpolation.
Calibration for Hg analyzed by cold vapor AAS was similar to that for flame AAS. Peak heightoutput from a strip chart recorder corrected for baseline was used to determine expandedabsorbance.
The mass of analyte in each blank sample was determined from the product of measuredconcentration and diluted sample volume. The mean mass of analyte in these blanks wassubtracted from the calculated analyte mass in the samples to yield blank-corrected analytemass. Division by sample dry weight yielded the final analyte concentration in the tissuesample.
5. DETECTION LIMITS
The detection limit was defined as three times the standard deviation of the measuredconcentration of blanks processed as samples. A dry weight of 0.3 g was assumed in calculatingdetection limits on the basis of tissue dry weight. Typical detection limits are listed in TableIII.6.
III.92

Table III.7. Tissue methodological changes through time.
Sample Set Methodological change
First trace element intercomparison exercise noneCycle 1 tissues (southeast) P1, I1
Second trace element intercomparison exercise I2Cycle 2 tissues (southeast) M1Cycle 4 tissues (Galveston Bay, St. Johns River, Sapelo Sound) none
Third trace element intercomparison exercise noneCycle 4 tissue (remaining southeast) noneCycle 3 tissue (southeast) noneCycle 5 tissue (Galveston Bay) M2, M3, I3Fourth trace element intercomparison exercise noneCycle 5 tissue (Lavaca Bay) noneCycle 5 tissue (remaining southeast) P2Cycle 5 tissue (northeast) none
Sample preparation:P1 - Tissues were freeze dried instead of oven dried to minimize possible mercury losses.P2 - Microwave digestion replaced bomb digestion to reduce digestion time and limit possible metal contamination from thestainless steel bomb jacket.
Instrumental:I1 - The Z/3030 with Zeeman background correction replaced the model 603 for graphite furnace analyses. Zeemanbackground correction greatly improved accuracy and precision.I2 - Deuterium arc background correction was dropped from flame analyses on the model 603 AAS. It was unnecessary andincreased the analytical signal to noise ratio and baseline drift.I3 - Flow injection analysis for mercury was introduced to increase the speed of analyses which had previously been done by aninefficient batch method.
Matrix modification:M1 - Selenium digests are diluted a further 4-fold to reduce a matrix effect that biased accuracy.M2 - Matrix modifier for Se, As, and Sb was changed from (500 µg Pd + 500 µg Co)/mL to (2000 µg Pd + 2000 µg Co)/mL toimprove precision and accuracy degraded by matrix effects and to make the analysis more robust to variations in atomizationtemperature and sample composition.M3 - 5% ammonium dihydrogen phosphate was substituted for 250 µg Pd/mL as a matrix modifier for lead to improve accuracyby reducing matrix effects.
6. CHANGES IN ANALYTICAL METHODS OVER TIME
Initial analytical methods used in the National Benthic Surveillance Project have evolved totheir current status, as described here, through several iterations in response to newknowledge and experience gained in addressing problems and improving efficiency. The majorchanges in the past are documented in Table III.7. Changes are paired with the sample setswhere they were first employed. Sample sets are in the order of analysis. Reasons for thechanges are given in Table III.4 footnotes.
III.93

7. ACKNOWLEDGEMENTS
The authors thank P. H. Crumley, J. N. Willis, III, and D. S. Squires for their contributions tomethods development. We thank B. L. Pawlak, M. E. Williamson and W. Riggsbee for theirtechnical assistance. V. Zdanowicz, B. Clark and P. Robisch, our colleagues in the NationalBenthic Surveillance Project, shared technical information and practical experience of greatuse in methods development. We acknowledge the NOAA Quality Assurance Project annualintercomparison exercises conducted by the National Research Council of Canada, and inparticular, S. Berman, for their significant contributions to the development, testing, andquality of our methods.
8. SELECTED REFERENCES USED IN METHOD DEVELOPMENT
Barnett, W. B. (1984) A calibration algorithm for atomic absorption. Spectrochim. Acta,39B:829-36.
Barrett, P., L. J. Davidowski, K. W. Penaro, and T. R. Copeland (1978) Microwave-based wetdigestion technique. Anal. Chem., 50:1021-23.
Bauslaugh, J., B. Radziuk, K. Saeed, and Y. Thomassen (1984) Reduction of effects ofstructured non-specific absorption in the determination of arsenic and selenium byelectrothermal atomic absorption spectrometry. Anal. Chim. Acta, 165:149-57.
Chapman, L. E., and L. S. Dale (1978) Simple apparatus for the spectrometric determination ofmercury by the cold vapour atomic absorption technique. Anal. Chim. Acta, 101:203.
Eisler, R. (1981) Trace metal concentrations in marine organisms. Pergamon, New York. 687pp.
Fang, Z., S. Xu, X. Wang, and S. Zhang (1986) Combination of flow-injection technique withatomic spectrometry in agricultural and environmental analysis. Anal. Chim. Acta, 179:325-40.
LaFleur, P. D. (1973) Retention of mercury when freeze-drying biological materials. Anal.Chem., 45:1534-36.
May, T. W., and W. G. Braumbaugh (1982) Matrix modifier and L'vov platform for eliminationof matrix interferences in the analysis of fish tissues for lead by graphite furnace atomicabsorption spectrometry. Anal. Chem., 54:1032-37.
Okamoto, K., and K. Fuwa. 1984. Low contamination digestion bomb method using Teflon doublevessel for biological materials. Anal. Chem., 56:1750-60.
Shan Xiao-Quan, Ni Zhe-Ming, and Zhang Li (1983) Determination of arsenic in soil, coal fly ashand biological samples by electrothermal atomic absorption spectrometry with matrixmodification. Anal. Chim. Acta, 151:179-85.
Tominaga, M., and Y. Umezaki (1982) Comparison of ascorbic acid and related compounds asinterference suppressors in electrothermal atomic absorption spectrometry. Anal. Chim. Acta,139:279-85.
III.94

9. INSTRUMENTAL ANALYSES
9.1. Antimony
METHOD: Graphite Furnace Atomic Absorption Spectrophotometry
SAMPLE DIGEST: ~3N HNO3
SPECTROPHOTOMETER SETTINGS:
Lamp: HCL 20 maWavelength: 217.6 nmSlit Width: 0.7 nmRead Delay: 0 secIntegration (Read) Time: 4 secReplicate Sample Injections: 2
FURNACE CONDITIONS:
Graphite Tube Type: Pyrolytic, grooved for forked platformL'vov Platform Type: Solid pyrolytic, forkedCarrier Gas: Argon
FURNACE PROGRAM:
Step T(°C) Time (sec) Internal Gas ReadRamp Hold Flow (mL/min)
1 250 15 30 300 -2 1000 30 15 300 -3 2400 0 4 0 *4 2650 1 5 300 -
STANDARDS: 0, 10, 20, 30 µg Sb/L in 4N HNO3.
MATRIX MODIFIER: (2000 µg Pd+2000 µg Co)/mL.
INJECTION VOLUME: 25 µL
MATRIX MODIFIER: 5 µL
DILUENT: 4N HNO3, if needed.
CALIBRATION: Two-coefficient least squares fitted calibration line performed byinstrument microprocessor using the above standards. Reslopeafter every 8 samples.
TYPICAL SENSITIVITY: 0.085 abs.-sec. for 25 µL of a 30 µg Sb/L standard.
III.95

9.2. Arsenic
METHOD: Graphite Furnace Atomic Absorption Spectrophotometry
SAMPLE DIGEST: ~3N HNO3
SPECTROPHOTOMETER SETTINGS:
Lamp: EDL Z/3030 10 watts continuous or Z/5100 6-6.5 wattsmodulated
Wavelength: 193.7 nmSlit Width: 0.7 nmRead Delay: 0 secIntegration (Read) Time: 5 secReplicate Sample Injections: 2
FURNACE CONDITIONS:
Graphite Tube Type: Pyrolytic, grooved for forked platformL'vov Platform Type: Solid pyrolytic, forkedCarrier Gas: Argon
FURNACE PROGRAM:
Step T(°C) Time (sec) Internal Gas ReadRamp Hold Flow (mL/min)
1 250 15 30 300 -2 1200 30 15 300 -3 2600 0 5 0 *4 2650 1 5 300 -
STANDARDS: 0, 60, 120, 180 µg As/L in 4N HNO3.
MATRIX MODIFIER: (2000 µg Pd + 2000 µg Co)/mL.
INJECTION VOLUME: 10 µL
MATRIX MODIFIER: 5 µL
DILUENT: 4N HNO3, 2-fold dilutions required of all samples, CRM's, andblanks.
CALIBRATION: Two-coefficient least squares fitted calibration line performed byinstrument microprocessor using the above standards. Reslopeafter every 8 samples.
TYPICAL SENSITIVITY: 0.300 abs-sec. for 10 µL of a 120 µg As/L standard.
III.96

9.3. Cadmium
METHOD: Graphite Furnace Atomic Absorption Spectrophotometry
SAMPLE DIGEST: ~3N HNO3
SPECTROPHOTOMETER SETTINGS:
Lamp: EDL Z/3030 5 watts continuous or Z/5100 3-3.5 wattsmodulated
Wavelength: 228.8 nmSlit Width: 0.7 nmRead Delay: 0 secIntegration (Read) Time: 5 secReplicate Sample Injections: 2
FURNACE CONDITIONS:
Graphite Tube Type: Pyrolytic, grooved for forked platformL'vov Platform Type: Solid pyrolytic, forkedCarrier Gas: Argon
FURNACE PROGRAM:
Step T(°C) Time (sec) Internal Gas ReadRamp Hold Flow (mL/min)
1 250 15 30 300 -2 500 15 30 300 -3 1700 0 5 0 *4 2650 1 3 300 -
STANDARDS: 0, 1, 2, and 3 µg Cd/L in 4N HNO3.
MATRIX MODIFIER: 250 µg Pd/mL in 4N HNO3.
INJECTION VOLUME: 15 µL
MATRIX MODIFIER: 5 µL
DILUENT: 4N HN03, if necessary.
CALIBRATION: Two-coefficient least squares fitted calibration line performed byinstrument microprocessor using above standards. Reslope afterevery 8 samples.
TYPICAL SENSITIVITY: 0.250 abs.-sec. for 15 µL of a 2 µg Cd/L standard.
III.97

9.4. Chromium
METHOD: Graphite Furnace Atomic Absorption Spectrophotometry
SAMPLE DIGEST: ~3N HNO3
SPECTROPHOTOMETER SETTINGS:
Lamp: HCL 25 maWavelength: 357.9 nmSlit Width: 0.7 nmRead Delay: 0 secIntegration (Read) Time: 5 secReplicate Sample Injections: 2
FURNACE CONDITIONS:
Graphite Tube Type: Pyrolytic, grooved for forked platformL'vov Platform Type: Solid pyrolytic, forkedCarrier Gas: Argon
FURNACE PROGRAM:
Step T(°C) Time (sec) Internal Gas ReadRamp Hold Flow (mL/min)
1 160 15 30 300 -2 1000 30 15 300 -3 2500 0 5 0 *4 3000 1 6 300 -
STANDARDS: 0, 5, 10, 15 µg Cr/L in 4N HNO3.
MATRIX MODIFIER: none
INJECTION VOLUME: 30 µL
MATRIX MODIFIER: none
DILUENT: 4N HNO3, if necessary.
CALIBRATION: Two-coefficient least squares fitted calibration line performed byinstrument microprocessor using the above standards. Reslopeafter every 8 samples.
TYPICAL SENSITIVITY: 0.400 abs-sec. for 30 µL of 15 µg Cr/L standard.
III.98

9.5. Copper
METHOD: Flame Atomic Absorption Spectrophotometry
SAMPLE DIGEST: ~3N HNO3
SPECTROPHOTOMETER SETTINGS:
Lamp: HCL, 20 maWavelength: 324.7 nmSlit Width: 0.7 nmSignal Output: Expanded absorbanceExpansion: 5 timesIntegration Time: 1 secReplicate Readings: 3Nebulization: Glass impact beadBurner Head: Single slot, 10 cmBackground Correction: noneFlame: Air:acetylene, lean blue; air 55, acetylene 25
STANDARDS: 0, 0.2, 0.4, 0.8, 1.2, 2.0 mg Cu/L in 3N HNO3.
DILUENT: 3N HNO3, if needed.
CALIBRATION: Off-line processing of expanded absorbance signals using either alinear least squares regression (default) or a non-linear leastsquares regression program. Regression coefficients, r2, of lessthan 0.995 indicate the possible need for a nonlinear regressioncalibration. Standards are rerun after every 10 samples. Drift inthe calibration parameters is corrected by interpolation.
SENSITIVITY: 0.160 absorbance for a 2.0 mg Cu/L standard.
III.99

9.6. Iron
METHOD: Flame Atomic Absorption Spectrophotometry
SAMPLE DIGEST: ~3N HNO3
SPECTROPHOTOMETER SETTINGS:
Lamp: HCL 30 maWavelength: 248.3 nmSlit Width: 0.2 nmSignal Output: Expanded absorbanceExpansion: 1 timeIntegration Time: 1 secReplicate Readings: 3Nebulization: Glass impact beadBurner Head: Single slot, 10 cmBackground Correction: noneFlame: Air:acetylene, lean blue; air 55, acetylene 25
STANDARDS: 0, 1.0, 2.0, 4.0, 6.0, 10.0 mg Fe/L in 3N HNO3.
DILUENT: 3N HNO3, if needed.
CALIBRATION: Off-line processing of expanded absorbance signals using either alinear least squares regression (default) or a non-linear leastsquares regression program. Regression coefficients, r2, of lessthan 0.995 indicate the possible need for a nonlinear regressioncalibration. Standards are rerun after every 10 samples. Drift inthe calibration parameters is corrected by interpolation.
SENSITIVITY: 0.465 absorbance for a 10 mg Fe/L standard.
III.100

9.7. Lead
METHOD: Graphite Furnace Atomic Absorption Spectrophotometry
SAMPLE DIGEST: ~3N HNO3
SPECTROPHOTOMETER SETTINGS:
Lamp: EDL Z/3030 10 watts continuous or Z/5100 7-7.5 wattsmodulated
Wavelength: 283.3 nmSlit Width: 0.7 nmRead Delay: 0 secIntegration (Read) Time: 6 secReplicate Sample Injections: 2
FURNACE CONDITIONS:
Graphite Tube Type: Pyrolytic, grooved for forked platformL'vov Platform Type: Solid pyrolytic, forkedCarrier Gas: Argon
FURNACE PROGRAM:
Step T(°C) Time (sec) Internal Gas ReadRamp Hold Flow (mL/min)
1 250 15 30 300 -2 500 30 15 300 -3 2000 0 6 0 *4 2650 1 5 300 -
STANDARDS: 0, 10, 20, 30 µg Pb/L in 4N HNO3.
MATRIX MODIFIER: 5% w/v NH4H2PO4 4N HNO3
INJECTION VOLUME: 25 µL
MATRIX MODIFIER: 5 µL
DILUENT: 4N HN03, if necessary.
CALIBRATION: Two-coefficient least squares fitted calibration line performed byinstrument microprocessor using the above standards. Reslopeafter every 8 samples.
TYPICAL SENSITIVITY: 0.240 abs.-sec. for 25 µL of 30 µg Pb/L standard.
III.101

9.8. Manganese
METHOD: Flame Atomic Absorption Spectrophotometry
SAMPLE DIGEST: ~3N HNO3
SPECTROPHOTOMETER SETTINGS:
Lamp: HCL 20 maWavelength: 279.5 nmSlit Width: 0.2 nmSignal Output: Expanded absorbanceExpansion: 5 timesIntegration Time: 1 secReplicate Readings: 3Nebulization: Glass impact beadBurner Head: Single slot, 10 cmBackground Correction: noneFlame: Air:acetylene, lean blue; air 55, acetylene 25
STANDARDS: 0, 0.1, 0.2, 0.4, 0.6, 1.0 mg Mn/L in ~3N HNO3.
DILUENT: 3N HNO3, if needed.
CALIBRATION: Off-line processing of expanded absorbance signals using either alinear least squares regression (default) or a non-linear leastsquares regression program. Regression coefficients, r2, of lessthan 0.995 indicate the probable need for a nonlinear regressioncalibration. Standards are rerun after every 10 samples. Drift inthe calibration parameters is corrected by interpolation.
SENSITIVITY: 0.130 absorbance for a 1.0 mg Mn/L standard.
III.102

9.9. Mercury
METHOD: Cold vapor atomic absorption spectrophotometry
SAMPLE DIGEST: ~3N HNO3
SPECTROPHOTOMETER SETTINGS:
Lamp: EDL 5 wattsWavelength: 253.7 nmSlit Width: 0.7 nmSignal Output: Expanded absorbance to strip chart recorderExpansion: 10 timesIntegration time: 0.5 secRecorder Time Constant: TC3 (4 sec)Background Correction: none
FLOW INJECTION PARAMETERS:
Pump: Rainin Rabbit Plus with 4 channel headPump Speed: 25 rpmTubing Diameters (I.D.):
0.89 mm reductant2.29 mm carrier acid/sample2.29 mm waste
Gas Flow(Nitrogen):100 cm3/min (setting 50)230 cm3/min (setting 50)
Injection Volume: 0.5 mLGas/Liquid Separator Volume: 3.5 mLMixing Loop Volume: 1 mLReaction Loop Volume: 1 mLCell Length: 13.5 cmCell Diameter: 0.6 cmCell Volume: 4 cm3
Reductant: 10% w/v SnCl2.H2O in 1N HCl
Carrier Acid: Mixed 1N HCl + 1N HNO3
STANDARDS: 0, 1, 2, 3, 5, 10, 20, 30, 50, 100 µg Hg/L in mixed 1N HCl + 1NHNO3.
DILUENT: 3N HNO3, if necessary.
CALIBRATION: Off-line processing of expanded absorbance signals using either alinear least squares regression (default) or a non-linear leastsquares regression program. Regression coefficients, r2, of lessthan 0.995 indicate the probable need for a nonlinear regressioncalibration. Standards are run after every 10 samples. Drift in thecalibration parameters is corrected by interpolation.
SENSITIVITY: 0.100 absorbance for a 10 µg Hg/L standard.
III.103

COMMENTS: Recorder peak height is suppressed by the long time constant inorder to smooth baseline noise. See Figure III.3 for flow injectiondiagram.
2
1 mL/min
8 mL/min
8 mL/min
Sample loop
Sample
100 mL/min
Flow meter
Flow meter
N
230 mL/min
Partition coil(50 cm
1.6 mm idTeflon)
Reaction coil(50 cm
1.6 mm idTeflon)
Waste
Absorption cell
Pump Flow injection
valve
Carrier acid
Reductant
Gas-liquid separator
Figure III.3. Flow injection system for tissue mercury analysis.
III.104

9.10. Nickel
METHOD: Graphite Furnace Atomic Absorption Spectrophotometry
SAMPLE DIGEST: ~3N HNO3
SPECTROPHOTOMETER SETTINGS:
Lamp: HCL 18 maWavelength: 232.0 nmSlit Width: 0.2 nmRead Delay: 0 secIntegration (Read) Time: 6 secReplicate Sample Injections: 2
FURNACE CONDITIONS:
Graphite Tube Type: Pyrolytic, grooved for forked platformL'vov Platform Type: Solid pyrolytic, forkedCarrier Gas: Argon
FURNACE PROGRAM:
Step T(°C) Time (sec) Internal Gas ReadRamp Hold Flow (mL/min)
1 160 15 30 300 -2 1000 30 15 300 -3 20 1 10 300 -4 2700 0 6 0 *5 2700 1 6 300 -
STANDARDS: 0, 10, 20, 30 µg Ni/L in 4N HNO3.
MATRIX MODIFIER: none
INJECTION VOLUME: 30 µL
MATRIX MODIFIER: none
DILUENT: 4N HNO3
CALIBRATION: Two-coefficient least squares fitted calibration line performed byinstrument microprocessor using the above standards. Reslopeafter every 8 samples.
TYPICAL SENSITIVITY: 0.260 abs-sec. for 30 µL of 30 µg Ni/L standard.
III.105

9.11. Selenium
METHOD: Graphite Furnace Atomic Absorption Spectrophotometry
SAMPLE DIGEST: ~3N HNO3
SPECTROPHOTOMETER SETTINGS:
Lamp: EDL Z/3030 6 watts or Z/5100 4-4.5 wattsWavelength: 196.0 nmSlit Width: 0.7 nmRead Delay: 0 secIntegration (Read) Time: 5 secReplicate Sample Injections: 2
FURNACE CONDITIONS:
Graphite Tube Type: Pyrolytic, grooved for forked platformL'vov Platform Type: Solid pyrolytic, forkedCarrier Gas: Argon
FURNACE PROGRAM:
Step T(°C) Time (sec) Internal Gas ReadRamp Hold Flow (mL/min)
1 250 15 30 300 -2 700 30 15 300 -3 2400 0 4 0 *4 2650 1 3 300 -
STANDARDS: 0, 30, 60, 90 µg Se/L in 4N HNO3.
MATRIX MODIFIER: (2000 µg Pd + 2000 µg Co)/mL
INJECTION VOLUME: 20 µL
MATRIX MODIFIER : 5 µL
DILUENT: 4N HNO3, 4-fold dilutions required of all samples, CRM's andblanks.
CALIBRATION: Two-coefficient least squares fitted calibration line performed byinstrument microprocessor using the standards. Reslope afterevery 8 samples.
TYPICAL SENSITIVITY: 0.250 abs-sec. for 20 µL of a 90 µg Se/L standard.
COMMENTS: Sensitivity depends on EDL lamp power and energy output.
III.106

9.12. Silver
METHOD: Graphite Furnace Atomic Absorption Spectrophotometry
SAMPLE DIGEST: ~3N HNO3
SPECTROPHOTOMETER SETTINGS:
Lamp: HCL 12 maWavelength: 328.1 nmSlit Width: 0.7 nmRead Delay: 0 secIntegration (Read) Time: 4 secReplicate Sample Injections: 2
FURNACE CONDITIONS:
Graphite Tube Type: Pyrolytic, grooved for forked platformL'vov Platform Type: Solid pyrolytic, forkedCarrier Gas: Argon
FURNACE PROGRAM:
Step T(°C) Time (sec) Internal Gas ReadRamp Hold Flow (mL/min)
1 250 15 30 300 -2 500 15 30 300 -3 1900 0 5 0 *4 2650 1 3 300 -
STANDARDS: 0, 3, 6, and 9 µg Ag/L in 4N HNO3.
MATRIX MODIFIER: 250 µg Pd/mL in 4N HNO3.
INJECTION VOLUME: 20 µL
MATRIX MODIFIER: 5 µL
DILUENT: 4N HNO3, if necessary.
CALIBRATION: Two-coefficient least squares fitted calibration line performed byinstrument microprocessor using above standards. Reslope afterevery 8 samples.
TYPICAL SENSITIVITY: 0.350 abs-sec. for 20 µL of a 6 µg Ag/L standard.
III.107

9.13. Thallium
METHOD: Graphite Furnace Atomic Absorption Spectrophotometry
SAMPLE DIGEST: ~3N HNO3
SPECTROPHOTOMETER SETTINGS:
Lamp: EDL Z/3030 7 watts continuous or Z/5100 4-4.5 wattsmodulated
Wavelength: 276.8 nmSlit Width: 0.7 nmRead Delay: 0 secIntegration (Read) Time: 4 secReplicate Sample Injections: 2
FURNACE CONDITIONS
Graphite Tube Type: Pyrolytic, grooved for forked platformL'vov Platform Type: Solid pyrolytic, forkedCarrier Gas: Argon
FURNACE PROGRAM:
Step T(°C) Time (sec) Internal Gas ReadRamp Hold Flow (mL/min)
1 250 15 30 300 -2 600 15 30 300 -3 2100 0 4 0 *4 2650 1 5 300 -
STANDARDS: 0, 10, 20, and 30 µg Tl/L in 4N HNO3.
MATRIX MODIFIERS: (1) 5% w/v ascorbic acid in Milli-Q water(2) 250 µg Pd/mL in 4N HNO3
INJECTION VOLUME: 15 µL
MATRIX MODIFIER : 5 µL of (1) + 5 µL of (2)
DILUENT: 4N HN03, if necessary.
CALIBRATION: Two-coefficient least squares fitted calibration line performed byinstrument microprocessor using above standards. Reslope afterevery 8 samples.
TYPICAL SENSITIVITY: 0.080 abs-sec. for 15 µL of a 30 µg Tl/L standard.
III.108

9.14. Tin
METHOD: Graphite Furnace Atomic Absorption Spectrophotometry
SAMPLE DIGEST: ~3N HNO3
SPECTROPHOTOMETER SETTINGS:
Lamp: EDL Z/3030 8-8.5 watts continuous or Z/5100 5.5-6watts modulated
Wavelength: 286.3 nmSlit Width: 0.7 nmRead Delay: 0 secIntegration (Read) Time: 4 secReplicate Sample Injections: 2
FURNACE CONDITIONS
Graphite Tube Type: Pyrolytic, grooved for forked platformL'vov Platform Type: Solid pyrolytic, forkedCarrier Gas: Argon
FURNACE PROGRAM:
Step T(°C) Time (sec) Internal Gas ReadRamp Hold Flow (mL/min)
1 250 15 30 300 -2 500 15 30 300 -3 2400 0 4 0 *4 2650 1 5 300 -
STANDARDS: 0, 20, 40, and 60 µg Sn/L in 4N HNO3.
MATRIX MODIFIER: 250 µg Pd/mL in 4N HNO3.
INJECTION VOLUME: 25 µL
MATRIX MODIFIER: 5 µL
DILUENT: 4N HNO3, if necessary.
CALIBRATION: Two-coefficient least squares fitted calibration line performed byinstrument microprocessor using above standards. Reslope afterevery 8 samples.
TYPICAL SENSITIVITY: 0.210 abs-sec. for 25 µl of a 60 µg Sn/L standard.
III.109

9.15. Zinc
METHOD: Flame Atomic Absorption Spectrophotometry
SAMPLE DIGEST: ~3N HN03
SPECTROPHOTOMETER SETTINGS:
Lamp: HCL 15 maWavelength: 213.8 nmSlit Width: 0.7 nmSignal Output: Expanded absorbanceExpansion: 1 timeIntegration Time: 1 secReplicate Readings: 3Nebulization: Glass impact beadBurner Head: Single slot, 10 cmBackground Correction: noneFlame: Air:acetylene, lean blue; air 55, acetylene 25
STANDARDS: 0, 0.2, 0.4, 0.8, 1.2, 2.0 mg Zn/L in 3N HNO3.
DILUENT: 3N HNO3, if needed.
CALIBRATION: Off-line processing of expanded absorbance signals using either alinear least squares regression (default) or a non-linear leastsquares regression program. R2 less than 0.995 indicates theprobable need for a nonlinear regression calibration. Standards arererun after every 10 samples. Drift in the calibration parametersis corrected by interpolation.
SENSITIVITY: 0.570 absorbance for a 2.0 mg Zn/L standard.
III.110
Sample Preparation and Analyses of Trace Metals by Atomic AbsorptionSpectroscopy
P. A. Robisch and R. C. ClarkNOAA/National Marine Fisheries Service
Northwest Fisheries Science CenterSeattle, WA
ABSTRACT
The methods used for the atomic absorption analyses of major and trace elements inmarine sediments by the NOAA/National Marine Fisheries Service (NMFS) NorthwestFisheries Science Center as part of the National Status and Trends Program are basedon those developed by the NMFS Northeast Fisheries Science Center. The methods usedfor tissues are based on those developed by the NMFS Southeast Fisheries ScienceCenter. The modifications to these methods are described.
1. INTRODUCTION
The methods used for the atomic absorption analyses of major and trace elements in marinesediments by the NOAA/National Marine Fisheries Service (NMFS) Northwest Fisheries ScienceCenter as part of the National Status and Trends Program are based on those developed at theNMFS Northeast Fisheries Science Center by Zdanowicz and Finneran (this document). Themethods used for tissues are based on those developed at the NMFS Southeast Fisheries ScienceCenter by Evans and Hanson (this document). The modifications to these methods are describedbelow.
2. EQUIPMENT AND SUPPLIES
2.1. Instrumentation
2.2. Supplies
CEM Model 81D, microwave oven with pressure controller unit and high pressure Teflondigestion vessels. CEM Corp., Matthews, NC.
2.3. Labware
Pippettors, manual, Chempette Digital MacroPipettor. Cole Palmer, Niles, IL.
2.4. Reagents
Acetic acid, ultra pure (CH3COOH) [64-19-7].Seastar Chemicals, Sidney, BritishColumbia.
Hydrochloric acid (HCl) [7647-01-0], ultrapure. Seastar Chemicals, Sidney, BC,Canada.
Hydrofluoric acid (HF) [7664-39-3], ultrapure. Seastar Chemicals, Sidney, BC,Canada.
Ammonium dihydrogen phosphate (NH4H2PO4)[7722-76-1], Ultrex. J. T. Baker,Phillipsburg, NJ.
Hydrogen peroxide, ultra pure. FlukaChemical, Ronkondoma, NY.
Boric acid (H3BO3) [10043-35-3], ultra purecrystalline powder. Aesar/JohnsonMatthey, Ward Hill, MA.
III.111
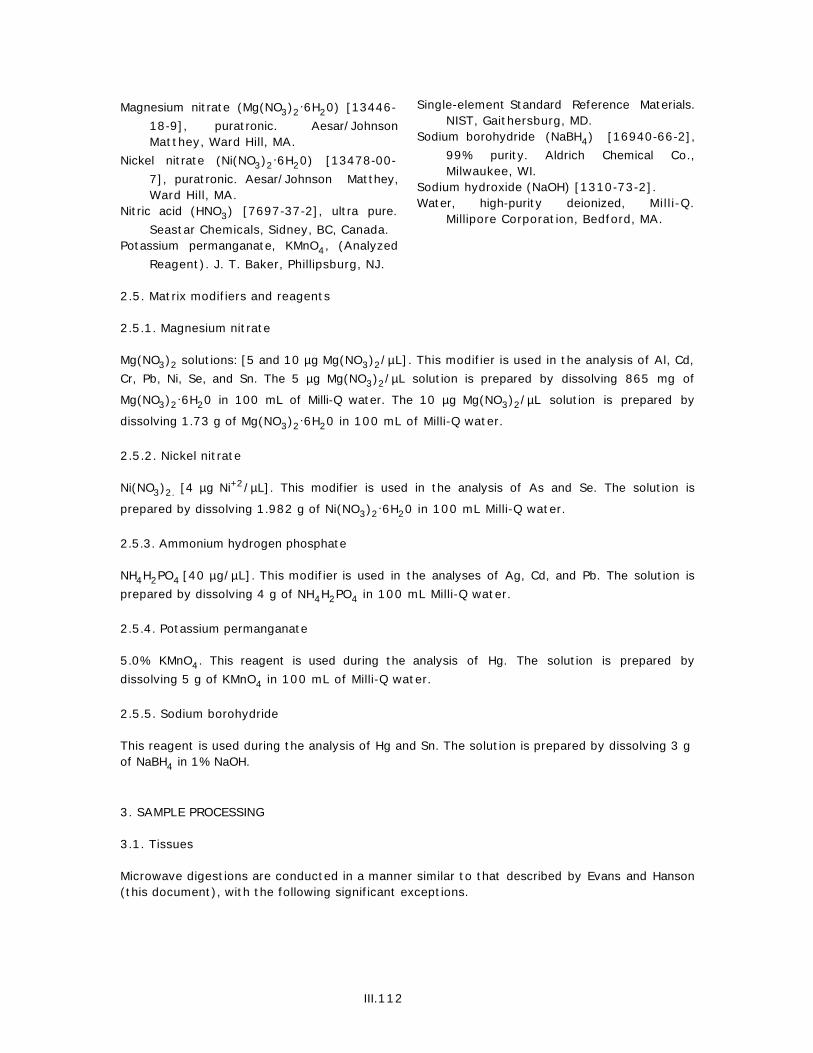
Magnesium nitrate (Mg(NO3)2.6H20) [13446-
18-9], puratronic. Aesar/JohnsonMatthey, Ward Hill, MA.
Single-element Standard Reference Materials.NIST, Gaithersburg, MD.
Sodium borohydride (NaBH4) [16940-66-2],99% purity. Aldrich Chemical Co.,Milwaukee, WI.
Nickel nitrate (Ni(NO3)2.6H20) [13478-00-
7], puratronic. Aesar/Johnson Matthey,Ward Hill, MA.
Sodium hydroxide (NaOH) [1310-73-2].Water, high-purity deionized, Mill i-Q.
Millipore Corporation, Bedford, MA.Nitric acid (HNO3) [7697-37-2], ultra pure.
Seastar Chemicals, Sidney, BC, Canada.Potassium permanganate, KMnO4, (Analyzed
Reagent). J. T. Baker, Phillipsburg, NJ.
2.5. Matrix modifiers and reagents
2.5.1. Magnesium nitrate
Mg(NO3)2 solutions: [5 and 10 µg Mg(NO3)2/µL]. This modifier is used in the analysis of Al, Cd,Cr, Pb, Ni, Se, and Sn. The 5 µg Mg(NO3)2/µL solution is prepared by dissolving 865 mg of
Mg(NO3)2.6H20 in 100 mL of Milli-Q water. The 10 µg Mg(NO3)2/µL solution is prepared by
dissolving 1.73 g of Mg(NO3)2.6H20 in 100 mL of Milli-Q water.
2.5.2. Nickel nitrate
Ni(NO3)2. [4 µg Ni+2/µL]. This modifier is used in the analysis of As and Se. The solution is
prepared by dissolving 1.982 g of Ni(NO3)2.6H20 in 100 mL Milli-Q water.
2.5.3. Ammonium hydrogen phosphate
NH4H2PO4 [40 µg/µL]. This modifier is used in the analyses of Ag, Cd, and Pb. The solution isprepared by dissolving 4 g of NH4H2PO4 in 100 mL Milli-Q water.
2.5.4. Potassium permanganate
5.0% KMnO4. This reagent is used during the analysis of Hg. The solution is prepared bydissolving 5 g of KMnO4 in 100 mL of Milli-Q water.
2.5.5. Sodium borohydride
This reagent is used during the analysis of Hg and Sn. The solution is prepared by dissolving 3 gof NaBH4 in 1% NaOH.
3. SAMPLE PROCESSING
3.1. Tissues
Microwave digestions are conducted in a manner similar to that described by Evans and Hanson(this document), with the following significant exceptions.
III.112

3.1.1. Acid addition
Ten milliliters of high-purity concentrated HNO3 were added to 0.20-0.30 g of tissue (dry wt)and the resulting mixture was allowed to stand at room temperature for two hours beforeheating.
3.1.2. Microwave digestion
Twelve digestion vessels were processed simultaneously in a 650-watt oven. With thepressure controller set at 90 psi, the following program sequence was used.
Step Time (min) Amount Power (%)
1 4 502 2 03 3 504 2 05 3 506 12 07 3 508 2 09 3 50
The capped, digested samples were stored overnight at approximately 5°C. The vesselscontaining the digested samples were then uncapped and 1.0 mL of high-purity H2O2 was added.After at least 15 min of holding time, a second 1.0 mL aliquot of H2O2 was added, followed byanother 1.0 mL after a 15 min holding time. After a holding time of 2 hr, a final 1.0 mL of H2O2
was added. The sample was recapped and with the pressure controller reset at 90 psi, thefollowing microwave digestion program was used:
Step Time (min) Amount Power (%)
1 2 502 2 03 2 504 2 05 2 506 5 07 3 50
Alternating stages with no heating power are needed to keep the pressure resulting from thedecomposition of the peroxide from increasing too rapidly.
3.1.3. Sample dilution
The digested samples were cooled to approximately 5°C before being quantitatively transferredto a 25-mL volumetric flask. Each sample was diluted to 25 mL with Milli-Q water. The dilutedsamples were transferred to a 60-mL low density polyethylene (Nalgene) bottle for storage.
3.2. Sediments
Microwave digestions are conducted in a manner similar to that described by Evans and Hanson(this document), with the following significant exceptions.
III.113

3.2.1. Acid addition
Two milliliters of high-purity concentrated aqua regia, freshly made by mixing HCl and HNO3 ina ratio of 3:1, and 6 mL of high-purity HF, were added to 0.20-0.30 g of sediment (dry wt.).
3.2.2. Microwave digestion
Six digestion vessels were processed simultaneously in a 650-watt oven. With the pressurecontroller set at 90 psi, the following program sequence was used.
Step Time (min) Amount Power (%)
1 2 552 23 503 90 45
3.2.3. Sample dilution
The digested samples were allowed to cool for approximately one hour, or until the pressuredecreased to 20 psi, before being quantitatively transferred to a 50-mL volumetric flask. Eachsample was diluted to 50 mL with saturated H3BO3. The diluted samples were transferred to a60-mL low density polyethylene (Nalgene) bottle for storage.
4. CALIBRATION AND COMPUTATION OF ANALYTE CONCENTRATIONS
Calibration standards for each individual element were prepared using the single elementspectrometric Standard Reference Materials (SRMs) series. A primary stock solution of 100µg/mL was prepared for each element by diluting 500 µL of the 10 mg/mL SRM solution to 50mL maintaining the exact matrix of the original SRM solution. Secondary calibration standardsat ng/mL levels were prepared as needed by diluting appropriate aliquots of the 100 µg/mLprimary standard using a diluent to match the same matrix as the samples to be analyzed. Thediluent used for sediment analyses was a solution of 6 mL concentrated HF and 2 mL aqua regiaand brought to volume with saturated H3BO3. The diluent used for tissue analyses was asolution of 12 mL concentrated HNO3 and brought to volume with Milli-Q water.
Calibration for the elements analyzed using graphite furnace and flame atomic absorptionspectrometry (GFAAS) was done on-line using the accompanying dedicated computer of thePerkin-Elmer model Z/5100 spectrophotometer. Calibration was done using two independently-made secondary calibration standards from the 100 µg/mL primary standard described above,which were then used to make additional standards with the computerized auto-dilutioncapability of the spectrophotometer. Using selenium as an example, two secondary standards of40 and 120 ng/mL were used to give a final calibration curve consisting of five points: 10, 20,40, 60, and 120 ng/mL. The 10 and 20 ng/mL points were made by the computerizedautosampler from the 40 ng/mL standard and the 60 ng/mL from the 120 ng/mL standard.Three replicate injections were analyzed for each standard. Full or partial recalibration wasperformed as necessary, usually after 15 to 20 samples were analyzed. A partial calibrationwas performed using the reslope function built into the spectrophotometer software. Allcalibration curves were drawn through the origin. The calibration curves were routinelycalculated using the non-linear equations from the online computer.
III.114

Table III.8. Typical method detection limits for 0.3 g digestion samples (µg/g).
Sediment Tissue Sediment Tissue
Ag 0.01 (HGA) 0.01 (HGA) Ni 0.1 (HGA) 0.1 (HGA)Al 500 (Flame) 0.1 (HGA) Pb 0.1 (HGA) 0.1 (HGA)As 0.1 (HGA) 0.1 (HGA) Sb 0.1 (HGA) 0.1 (HGA)Cd 0.01 (HGA) 0.01 (HGA) Se 0.1 (HGA) 0.1 (HGA)Cr 1 (Flame) 0.1 (HGA) Si 500 (Flame)Cu 1 (Flame) 0.1 (HGA) Sn 0.1 (HGA) 0.1 (MHS)Hg 0.01 (Vapor) 0.01 (Vapor) Zn 5 (Flame) 1 (Flame)Mn 5 (Flame) 0.5 (Flame)
Calibration curves for those elements analyzed using graphite furnace, flame, hydride, and coldvapor with the Perkin-Elmer model Z/5000 spectrophotometer were calculated using a two-coefficient calibration function and an off-line Apple Macintosh computer. All individualsecondary standards for the Model 5000 were made independently from the primary standard.
Typical method detection limits (MDLs) are listed in Table III.8.
5. CONCLUSIONS
The methods of analyses for major and trace elements used in marine sediments by the NMFSNorthwest Fisheries Science Center as part of the National Status and Trends Program arebased on those developed by the NMFS Northeast Fisheries Science Center. The methods usedfor tissues are based on those developed by the NMFS Southeast Fisheries Science Center. Themodifications to these methods have been described.
6. REFERENCES
In addition to the references listed in Zdanowicz and Finneran (this document), the followingcitations proved valuable.
Grosser, Z. (ed.) (1985) Techniques in graphite furnace atomic absorption spectrophotometry.Perkin-Elmer Corp., Ridgefield, CT. 224 pp.
Kingston, H. M., and L. B. Jassie (eds.) (1988) Introduction to Microwave Sample Preparation:Theory and Practice. American Chemical Society, Washington, DC. 263 pp.
Nakashima, S., R. E. Sturgeon, S. N. Willie, and S. S. Berman (1988) Acid digestion of marinesamples for trace element analysis using microwave heating. Analyst, 113(1):159-63.
Rantala, R. T. T., and D. H. Loring (1975) Multi-element analysis of silicate rocks and marinesediments by atomic absorption spectrophotometry. At. Abs. Newsletter, 14(5):117-20.
III.115

Sturgeon, R. E., J. A. H. Desaulniers, S. S. Berman, and D. S. Russell (1982) Determination oftrace metals in estuarine sediments by graphite-furnace atomic absorption spectrometry. Anal.Chim. Acta, 134:283-291.
Slavin, W., G. R. Carnrick, D. C. Manning, and E. Pruszkowska (1983) Recent experiences withthe stabilized temperature platform furnace and Zeeman background correction. At. Spectrosc.,4(3):69-86.
III.116

7. SEDIMENT ANALYSIS
7.1. Silver
METHOD: Graphite furnace atomic absorption
INSTRUMENT: Perkin-Elmer Model 5100, Zeeman background correction
SAMPLE DIGESTION: Microwave, 6 mL HF + 2 mL aqua regia; final volume, 50 mL withsaturated H3BO3.
SAMPLE WEIGHT: 0.2 - 0.3 g (dry weight)
SPECTROPHOTOMETER SETTINGS:
Lamp: HCL, 10 ma; modulated energy: 65Wavelength: 328.1 nmSlit Width: 0.7 nmRead Delay: 0 secIntegration Time: 5 secIntegration: Peak areaReplicate Injections: 3
FURNACE CONDITIONS:
Pyrolytic grooved graphite tube with L'vov solid pyrolytic platform
Carrier Gas: Argon (prepurified)
FURNACE PROGRAM:
Step T(°C) Time (sec) Internal GasRamp Hold Flow (mL/min)
1 130 5 45 3002 700 5 40 3003 20 1 20 3004 1700 0 5 05 2650 1 5 3006 20 1 10 300
STANDARDS: 0, 0.5, 1.0, 2.0, 3.0, 4.0, and 6.0 ng/mL in HF/aqua regia/boricacid.
MATRIX MODIFIERS: 0.2 mg NH4H2PO4 [5 µL of 40 µg NH4H2PO4/µL]
INJECTION VOLUME: 20 µL
CALIBRATION: Two-coefficient least squares fit calibration line calculated byinstrument computer using above standards. Reslope or calibrateafter 10-20 samples.
TYPICAL SENSITIVITY: 0.182 abs-sec for 6 ng/mL standard.
III.117

7.2. Aluminum
METHOD: Flame atomic absorption, nitrous oxide flame
INSTRUMENT: Perkin-Elmer Model 5000; deuterium background correction
SAMPLE DIGEST: Microwave, 6 mL HF + 2 mL aqua regia: final volume, 50 mL withsaturated H3BO3.
SAMPLE WEIGHT: 0.2 - 0.3 g (dry weight)
SPECTROPHOTOMETER SETTINGS:
Lamp: HCL, 25 ma; continuous energy: 62Wavelength: 309.3 nmSlit Width: 0.7 nmIntegration Time: 5 secIntegration: Peak areaReplicate Injections: 3Nebulization: Glass impact beadFlame: N2O/acetylene, 37:20
STANDARDS: 40, 100, 200, 400, 600, and 800 µg/mL in HF/aqua regia/boricacid.
CALIBRATION: 6 point (standards) best-fit quadratic calibration line.
TYPICAL SENSITIVITY: 0.248 abs-sec for 100 µg/mL standard.
III.118

7.3. Arsenic
METHOD: Graphite furnace atomic absorption
INSTRUMENT: Perkin-Elmer Model 5100; Zeeman background correction
SAMPLE DIGEST: Microwave, 6 mL HF + 2 mL aqua regia: final volume, 50 mL withsaturated H3BO3.
SAMPLE WEIGHT: 0.2 - 0.3 g (dry weight)
SPECTROPHOTOMETER SETTINGS:
Lamp: EDL, 8 watts, modulated energy: 52Wavelength: 193.7 nmSlit Width: 0.7 nmRead Delay: 0 secIntegration Time: 5 secIntegration: Peak areaReplicate Injections: 3
FURNACE CONDITIONS:
Pyrolytic grooved graphite tube with L'vov solid pyrolytic PlatformCarrier Gas: Argon (prepurified)
FURNACE PROGRAM:
Step T(°C) Time (sec) Internal GasRamp Hold Flow (mL/min)
1 130 5 40 3002 700 5 45 3003 20 1 20 3004 2500 0 4 05 2650 1 5 3006 20 1 10 300
STANDARDS: 0, 15, 30, 60, and 80 ng/mL in HF/aqua regia/boric acid.
MATRIX MODIFIERS: 0.02 mg Ni+2 [5 µL of 19.8 µg Ni(NO3)2.6H20/µL]
INJECTION VOLUME: 20 µL
CALIBRATION: Two-coefficient least squares fit calibration line performed byinstrument computer using above standards. Reslope or calibrateafter 10-20 samples.
TYPICAL SENSITIVITY: 0.269 abs-sec for 60 ng/mL standard.
III.119

7.4. Cadmium
METHOD: Graphite furnace atomic absorption
INSTRUMENT: Perkin-Elmer Model 5100; Zeeman background correction
SAMPLE DIGEST: Microwave, 6 mL HF + 2 mL aqua regia: final volume, 50 mL withsaturated H3B03.
SAMPLE WEIGHT: 0.2 - 0.3 g (dry weight)
SPECTROPHOTOMETER SETTINGS:
Lamp: EDL, 5 watts, modulated energy: 65Wavelength: 193.7 nmSlit Width: 0.7 nmRead Delay: 0 secIntegration Time: 5 secIntegration: Peak areaReplicate Injections: 3
FURNACE CONDITIONS:
Pyrolytic grooved graphite tube with L'vov solid pyrolytic Platform
Carrier Gas: Argon (prepurified)
FURNACE PROGRAM:
Step T(°C) Time (sec) Internal GasRamp Hold Flow (mL/min)
1 130 5 45 3002 500 5 45 3003 20 1 20 3004 1700 0 5 05 2650 1 5 3006 20 1 10 300
STANDARDS: 0, 0.3, 0.6, 1.0, 1.2, and 2.0 ng/mL in HF/aqua regia/boric acid.
MATRIX MODIFIERS: 0.2 mg NH4H2PO4 [5 µL of 40 µg NH4H2PO4/µL]2 µL of 5 µg Mg(NO3)2/µL
INJECTION VOLUME: 20 µL
CALIBRATION: Two-coefficient least squares fit calibration line performed byinstrument computer using above standards. Reslope or calibrateafter 10-20 samples.
TYPICAL SENSITIVITY: 0.185 abs-sec for 1.2 ng/mL standard.
III.120

7.5. Chromium
METHOD: Graphite furnace atomic absorption
INSTRUMENT: Perkin-Elmer Model 5000; no background correction
SAMPLE DIGEST: Microwave, 6 mL HF + 2 mL aqua regia: final volume, 50 mLsaturated H3BO3.
SAMPLE WEIGHT: 0.2 - 0.3 g (dry weight)
SPECTROPHOTOMETER SETTINGS:
Lamp: HCL, 25 ma; continuous energy: 65Wavelength: 357.9 nmSlit Width: 0.7 nmRead Delay: 0 secIntegration Time: 5 secIntegration: Peak areaReplicate Injections: 3
FURNACE CONDITIONS:
Pyrolytic grooved graphite tube with L'vov solid pyrolytic platform
Carrier Gas: Argon (prepurified)
FURNACE PROGRAM:
Step T(°C) Time (sec) Internal GasRamp Hold Flow (mL/min)
1 120 15 30 3002 450 15 10 3003 1650 1 10 3004 2500 0 10 05 2600 1 5 3006 20 1 20 300
STANDARDS: 100, 200, 400, 800, 1000, 1600, 2000, and 4000 ng/mL inHF/aqua regia/boric acid.
MATRIX MODIFIERS: 5 µL of 10 µg Mg(NO3)2/µL
INJECTION VOLUME: 20 µL
CALIBRATION: 8 point (standards) best fit quadratic calibration line.
TYPICAL SENSITIVITY: 0.909 abs-sec for 100 ng/mL standard.
III.121

7.6. Copper
METHOD: Graphite furnace atomic absorption
INSTRUMENT: Perkin-Elmer Model 5000; no background correction
SAMPLE DIGEST: Microwave, 6 mL HF + 2 mL aqua regia: final volume, 50 mLsaturated H3BO3.
SAMPLE WEIGHT: 0.2 - 0.3 g (dry weight)
SPECTROPHOTOMETER SETTINGS:
Lamp: HCL, 25 ma; continuous energy: 65Wavelength: 324.7 nmSlit Width: 0.7 nmRead Delay: 0 secIntegration Time: 5 secIntegration: Peak areaReplicate Injections: 3
FURNACE CONDITIONS:
Pyrolytic grooved graphite tube with L'vov solid pyrolytic platform
Carrier Gas: Argon (prepurified)
FURNACE PROGRAM:
Step T(°C) Time (sec) Internal GasRamp Hold Flow (mL/min)
1 120 15 30 3002 450 15 10 3003 900 1 10 3004 2000 0 10 05 2400 1 5 3006 20 1 20 300
STANDARDS: 50, 100, 200, 300, 500, 1000, and 2000 ng/mL in HF/aquaregia/boric acid.
MATRIX MODIFIERS: None
INJECTION VOLUME: 20 µL
CALIBRATION: 7 point (standards) best fit quadratic calibration line.
TYPICAL SENSITIVITY: 0.296 abs-sec for 50 ng/mL standard.
III.122

7.7. Iron
METHOD: Atomic Absorption, Acetylene Flame
INSTRUMENT: Perkin-Elmer Model 5000; deuterium background correction
SAMPLE DIGEST: Microwave, 6 mL HF + 2 mL aqua regia: final volume, 50 mLsaturated H3BO3.
SAMPLE WEIGHT: 0.2 - 0.3 g (dry weight)
SPECTROPHOTOMETER SETTINGS:
Lamp: HCL, 25 ma; continuous energy: 68Wavelength: 248.3 nmSlit Width: 0.7 nmIntegration Time: 5 secIntegration: Peak areaReplicate Injections: 3Nebulization: Glass impact beadFlame: Air/acetylene, 20:30
STANDARDS: 50, 100, 200, 400, 600, 800, and 1000 µg/mL in HF/aquaregia/boric acid.
MATRIX MODIFIERS: None
CALIBRATION: 7 point (standards) best fit quadratic calibration line.
TYPICAL SENSITIVITY: 0.188 abs-sec for 100 µg/mL standard.
III.123

7.8. Iron
METHOD: Atomic Absorption, Acetylene Flame
INSTRUMENT: Perkin-Elmer Model 5100; no background correction
SAMPLE DIGEST: Microwave, 6 mL HF + 2 mL aqua regia: final volume, 50 mLsaturated H3BO3.
SAMPLE WEIGHT: 0.2 - 0.3 g (dry weight)
SPECTROPHOTOMETER SETTINGS:
Lamp: HCL, 30 ma; continuous energy: 71Wavelength: 373.7 nmSlit Width: 0.2 nmIntegration Time: 5 secIntegration: Peak areaReplicate Injections: 3Nebulization: Glass impact beadFlame: Air/acetylene, 9.9:2.0
STANDARDS: 50, 100, 400, and 600 µg/mL in HF/aqua regia/boric acid.
MATRIX MODIFIERS: None
CALIBRATION: Two-coefficient least squares fit calibration line performed byinstrument computer using above standards. Reslope or calibrateafter 10-20 samples.
TYPICAL SENSITIVITY: 0.257 abs-sec for 100 µg/mL standard.
III.124
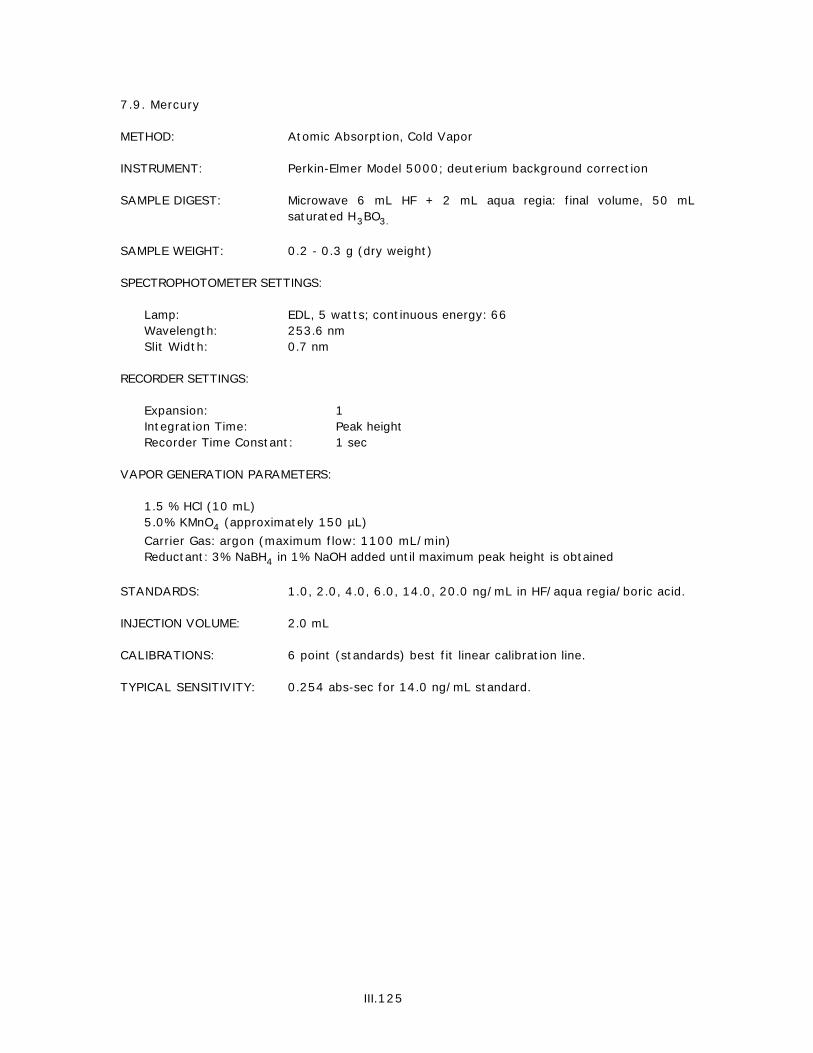
7.9. Mercury
METHOD: Atomic Absorption, Cold Vapor
INSTRUMENT: Perkin-Elmer Model 5000; deuterium background correction
SAMPLE DIGEST: Microwave 6 mL HF + 2 mL aqua regia: final volume, 50 mLsaturated H3BO3.
SAMPLE WEIGHT: 0.2 - 0.3 g (dry weight)
SPECTROPHOTOMETER SETTINGS:
Lamp: EDL, 5 watts; continuous energy: 66Wavelength: 253.6 nmSlit Width: 0.7 nm
RECORDER SETTINGS:
Expansion: 1Integration Time: Peak heightRecorder Time Constant: 1 sec
VAPOR GENERATION PARAMETERS:
1.5 % HCl (10 mL)5.0% KMnO4 (approximately 150 µL)Carrier Gas: argon (maximum flow: 1100 mL/min)Reductant: 3% NaBH4 in 1% NaOH added until maximum peak height is obtained
STANDARDS: 1.0, 2.0, 4.0, 6.0, 14.0, 20.0 ng/mL in HF/aqua regia/boric acid.
INJECTION VOLUME: 2.0 mL
CALIBRATIONS: 6 point (standards) best fit linear calibration line.
TYPICAL SENSITIVITY: 0.254 abs-sec for 14.0 ng/mL standard.
III.125
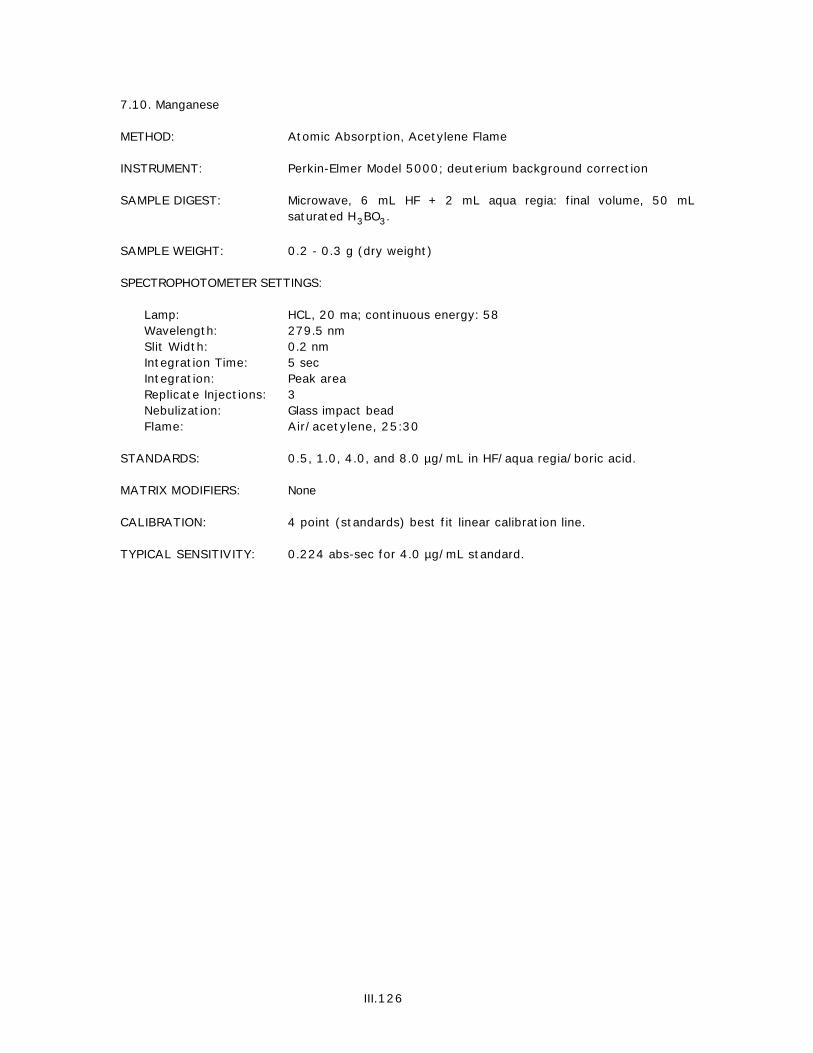
7.10. Manganese
METHOD: Atomic Absorption, Acetylene Flame
INSTRUMENT: Perkin-Elmer Model 5000; deuterium background correction
SAMPLE DIGEST: Microwave, 6 mL HF + 2 mL aqua regia: final volume, 50 mLsaturated H3BO3.
SAMPLE WEIGHT: 0.2 - 0.3 g (dry weight)
SPECTROPHOTOMETER SETTINGS:
Lamp: HCL, 20 ma; continuous energy: 58Wavelength: 279.5 nmSlit Width: 0.2 nmIntegration Time: 5 secIntegration: Peak areaReplicate Injections: 3Nebulization: Glass impact beadFlame: Air/acetylene, 25:30
STANDARDS: 0.5, 1.0, 4.0, and 8.0 µg/mL in HF/aqua regia/boric acid.
MATRIX MODIFIERS: None
CALIBRATION: 4 point (standards) best fit linear calibration line.
TYPICAL SENSITIVITY: 0.224 abs-sec for 4.0 µg/mL standard.
III.126

7.11. Nickel
METHOD: Graphite furnace atomic absorption
INSTRUMENT: Perkin-Elmer Model 5000; no background correction
SAMPLE DIGEST: Microwave, 6 mL HF + 2 mL aqua regia: Final volume, 50 mLsaturated H3BO3.
SAMPLE WEIGHT: 0.2 - 0.3 g (dry weight)
SPECTROPHOTOMETER SETTINGS:
Lamp: HCL, 25 ma; continuous energy: 52Wavelength: 232.0 nmSlit Width: 0.2 nmRead Delay: 0 secIntegration Time: 5 secIntegration: Peak areaReplicate Injections: 3
FURNACE CONDITIONS:
Pyrolytic grooved graphite tube with L'vov solid pyrolytic platform
Carrier Gas: Argon (prepurified)
FURNACE PROGRAM:
Step T(°C) Time (sec) Internal GasRamp Hold Flow (mL/min)
1 120 15 30 3002 450 15 10 3003 1000 1 10 3004 2400 0 10 05 2550 1 5 3006 20 1 20 300
STANDARDS: 5, 15, 30, 60, 90, 150, and 300 ng/mL in HF/aqua regia/boricacid.
MATRIX MODIFIERS: 5 µL of 10 µg Mg(NO3)2/µL.
INJECTION VOLUME: 20 µL
CALIBRATION: 7 point (standards) best fit quadratic calibration line.
TYPICAL SENSITIVITY: 0.236 abs-sec for 300 ng/mL standard.
III.127

7.12. Lead
METHOD: Graphite furnace atomic absorption
INSTRUMENT: Perkin-Elmer Model 5100; Zeeman background correction
SAMPLE DIGEST: Microwave, 6 mL HF + 2 mL aqua regia: final volume, 50 mLsaturated H3BO3.
SAMPLE WEIGHT: 0.2 - 0.3 g (dry weight)
SPECTROPHOTOMETER SETTINGS:
Lamp: EDL, 10 watts, modulated energy: 68Wavelength: 283.3 nmSlit Width: 0.7 nmRead Delay: 0 secIntegration Time: 5 secIntegration: Peak areaReplicate Injections: 3
FURNACE CONDITIONS:
Pyrolytic grooved graphite tube with L'vov solid pyrolytic platform
Carrier Gas: Argon (prepurified)
FURNACE PROGRAM:
Step T(°C) Time (sec) Internal GasRamp Hold Flow (mL/min)
1 130 5 45 3002 600 5 60 3003 20 1 20 3004 1600 0 5 05 2650 1 5 3006 20 1 1 0 300
STANDARDS: 0, 10, 20, 40, 80, and 160 ng/mL HF/aqua regia/boric acid.
MATRIX MODIFIERS: 0.2 mg NH4H2PO4 [5 µL of 40 µg/µL]2 µL of 5 µg Mg(NO3)2/µL
INJECTION VOLUME: 20 µL
CALIBRATION: Two-coefficient least squares fit calibration line performed byinstrument computer using above standards. Reslope or calibrateafter 10-20 samples.
TYPICAL SENSITIVITY: 0.204 abs-sec for 40 ng/mL standard.
III.128

7.13. Antimony
METHOD: Graphite furnace atomic absorption
INSTRUMENT: Perkin-Elmer Model 5100; Zeeman background correction
SAMPLE DIGEST: Microwave, 6 mL HF + 2 mL aqua regia: final volume, 50 mLsaturated H3BO3.
SAMPLE WEIGHT: 0.2 - 0.3 g (dry weight)
SPECTROPHOTOMETER SETTINGS:
Lamp: EDL, 8 watts; continuous energy: 62Wavelength: 217.6 nmSlit Width: 2.0 nmRead Delay: 0 secIntegration Time: 5 secIntegration: Peak areaReplicate Injections: 3
FURNACE CONDITIONS:
Pyrolytic grooved graphite tube with L'vov solid pyrolytic platform
Carrier Gas: Argon (prepurified)
FURNACE PROGRAM:
Step T(°C) Time (sec) Internal GasRamp Hold Flow (mL/min)
1 130 5 45 3002 900 5 40 3003 20 1 20 3004 2200 0 5 05 2650 1 5 3006 20 1 10 300
STANDARDS: 15, 30, 60, and 90 ng/mL in HF/aqua regia/boric acid.
MATRIX MODIFIERS: 0.02 mg Ni+2 [5 µL of 19.8 µg Ni(NO3)2.6H20/µL]
INJECTION VOLUME: 20 µL
CALIBRATION: Two-coefficient least squares fit calibration line performed byinstrument computer using above standards. Reslope or calibrateafter 10-20 samples.
TYPICAL SENSITIVITY: 0.188 abs-sec for 60 ng/mL std.
III.129

7.14. Selenium
METHOD: Graphite furnace atomic absorption
INSTRUMENT: Perkin-Elmer Model 5100; Zeeman background correction
SAMPLE DIGEST: Microwave, 6 mL HF + 2 mL aqua regia: final volume, 50 mLsaturated H3BO3.
SAMPLE WEIGHT: 0.2 - 0.3 g (dry weight)
SPECTROPHOTOMETER SETTINGS:
Lamp: EDL, 6 watts, modulated energy: 63Wavelength: 196.0 nmSlit Width: 0.7 nmRead Delay: 0 secIntegration Time: 5 secIntegration: Peak areaReplicate Injections: 3
FURNACE CONDITIONS:
Pyrolytic grooved graphite tube with L'vov solid pyrolytic platform
Carrier Gas: Argon (prepurified)
FURNACE PROGRAM:
Step T(°C) Time (sec) Internal GasRamp Hold Flow (mL/min)
1 130 5 40 3002 600 5 45 3003 20 1 20 3004 2200 0 5 05 2650 1 5 3006 20 1 10 300
STANDARDS: 0,15, 30, 60, 80, and 100 ng/mL in HF/aqua regia/boric acid.
MATRIX MODIFIERS: 5 µL of 4 µg/µL Ni(NO3)2
5 µL of 5 µg Mg(NO3)2/µL
INJECTION VOLUME: 20 µL
CALIBRATION: Two-coefficient least squares fit calibration line performed byinstrument computer using above standards. Reslope or calibrateafter 10-20 samples.
TYPICAL SENSITIVITY: 0.130 abs-sec for 60 ng/mL standard.
III.130

7.15. Tin
METHOD: Hydride generation atomic absorption
INSTRUMENT: Perkin-Elmer Model 5000; no background correction
SAMPLE DIGEST: Microwave, 6 mL HF + 2 mL aqua regia: final volume, 50 mLsaturated H3BO3.
SAMPLE WEIGHT: 0.2 - 0.3 g (dry weight)
HYDRIDE REACTION MIXTURE:
1 mL sample digestate + 50 mL Milli-Q water + 0.5 mL 2 N aceticacid + 3 mL 3% NaBH4 in 1% NaOH. The NaBH4 was added slowlyusing a syringe.
SPECTROPHOTOMETER SETTINGS:
Lamp: EDL, 8 watts, continuous energy: 48Wavelength: 224.6 nmSlit Width: 0.7 nmRead Delay: 5 secIntegration Time: 1 secIntegration: Peak areaReplicate Injections: 2
FURNACE CONDITIONS:
Non-grooved, uncoated graphite tube with enlarged port (9/64 inch)
Carrier Gas: Argon (prepurified)
FURNACE PROGRAM (A and B):
Step T(°C) Time (sec) Internal GasRamp Hold Flow (mL/min)
Introducing the SnH4 into the graphite tubeA-1 700 20 360 0Atomization of the SnH4
B-1 300 10 5 300B-2 2400 0 4 0B-3 2500 1 4 300B-4 20 1 20 300
STANDARDS: 5, 10, 20, and 80 ng/L in HF/aqua regia/boric acid.
CALIBRATION: 4 point (standards) best fit quadratic calibration line.
TYPICAL SENSITIVITY: 0.224 abs-sec for 20 ng/L standard.
III.131

7.16. Tin
METHOD: Atomic Absorption, Hydride Generation
INSTRUMENT: Perkin-Elmer Model 5000; no background correction
SAMPLE DIGEST: Microwave, 6 mL HF + 2 mL aqua regia: final volume, 50 mLsaturated H3BO3.
SAMPLE WEIGHT: 0.2 - 0.3 g (dry weight)
SPECTROPHOTOMETER SETTINGS:
Lamp: EDL, 8 watts; continuous energy: 48Wavelength: 224.6 nmSlit Width: 0.7 nm:Integration Time: 5 secRead Delay: 1 secIntegration: Peak areaReplicate Injections: 2
FURNACE CONDITIONS:
Non-grooved, uncoated graphite tube, drilled 9/64" bit
RECORDER SETTINGS:
Expansion: 1Integration Time: 5 secTime Constant: 1 sec
VAPOR GENERATION PARAMETERS:
In Chamber/bubbler system (with quartz tip in graphite tube)50 mL MilliQ water0.5 mL Acetic acid (2N)1.0 mL sample3.0 mL of 3% NaBH4 in 1% NaOH added slowly (45 sec) using a syringeCarrier Gas: prepurified argon
FURNACE PROGRAM:
Step T(°C) Time (sec) Internal GasRamp Hold Flow (mL/min)
A-1 700 20 360 0(with quartz tip removed from graphite tube)
B-1 300 10 5 300B-2 2400 0 4 0B-3 2500 1 4 300B-4 20 1 20 300
STANDARDS: 5, 10, 20, and 80 ng/mL in HF/aqua regia/boric acid.
III.132

CALIBRATION: 4 point (standards) best fit linear calibration line.
TYPICAL SENSITIVITY: 0.224 abs-sec for 20 ng/mL standard.
III.133
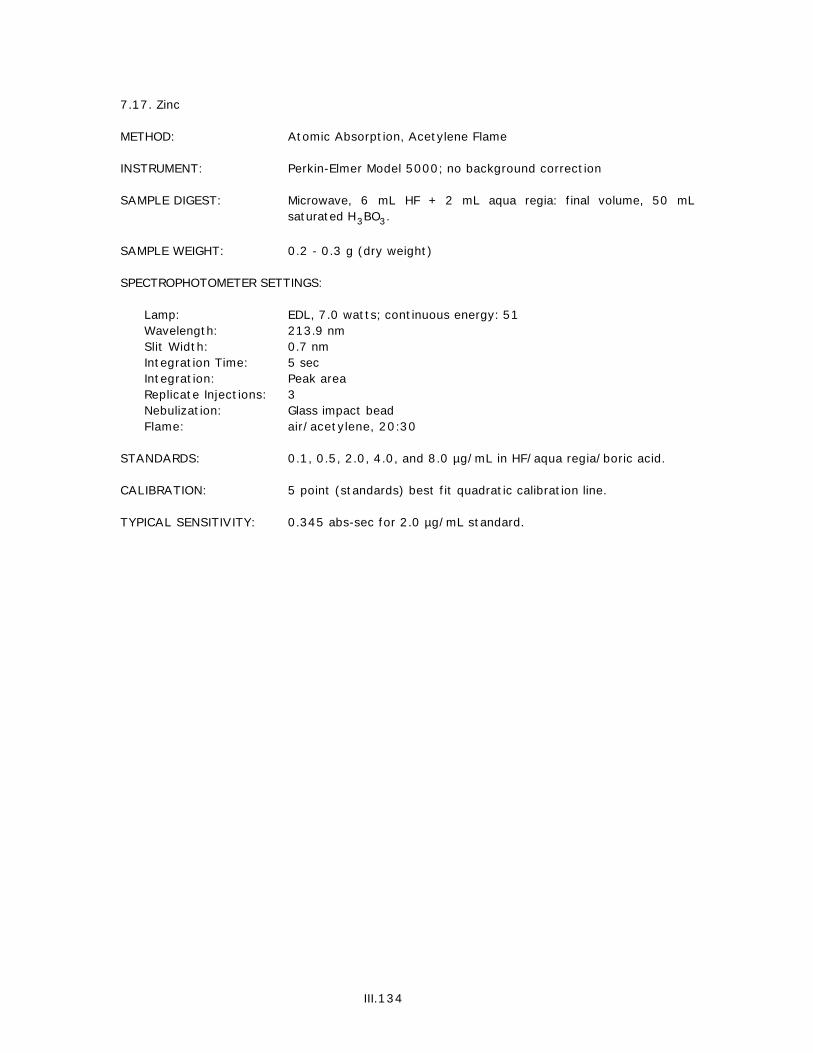
7.17. Zinc
METHOD: Atomic Absorption, Acetylene Flame
INSTRUMENT: Perkin-Elmer Model 5000; no background correction
SAMPLE DIGEST: Microwave, 6 mL HF + 2 mL aqua regia: final volume, 50 mLsaturated H3BO3.
SAMPLE WEIGHT: 0.2 - 0.3 g (dry weight)
SPECTROPHOTOMETER SETTINGS:
Lamp: EDL, 7.0 watts; continuous energy: 51Wavelength: 213.9 nmSlit Width: 0.7 nmIntegration Time: 5 secIntegration: Peak areaReplicate Injections: 3Nebulization: Glass impact beadFlame: air/acetylene, 20:30
STANDARDS: 0.1, 0.5, 2.0, 4.0, and 8.0 µg/mL in HF/aqua regia/boric acid.
CALIBRATION: 5 point (standards) best fit quadratic calibration line.
TYPICAL SENSITIVITY: 0.345 abs-sec for 2.0 µg/mL standard.
III.134
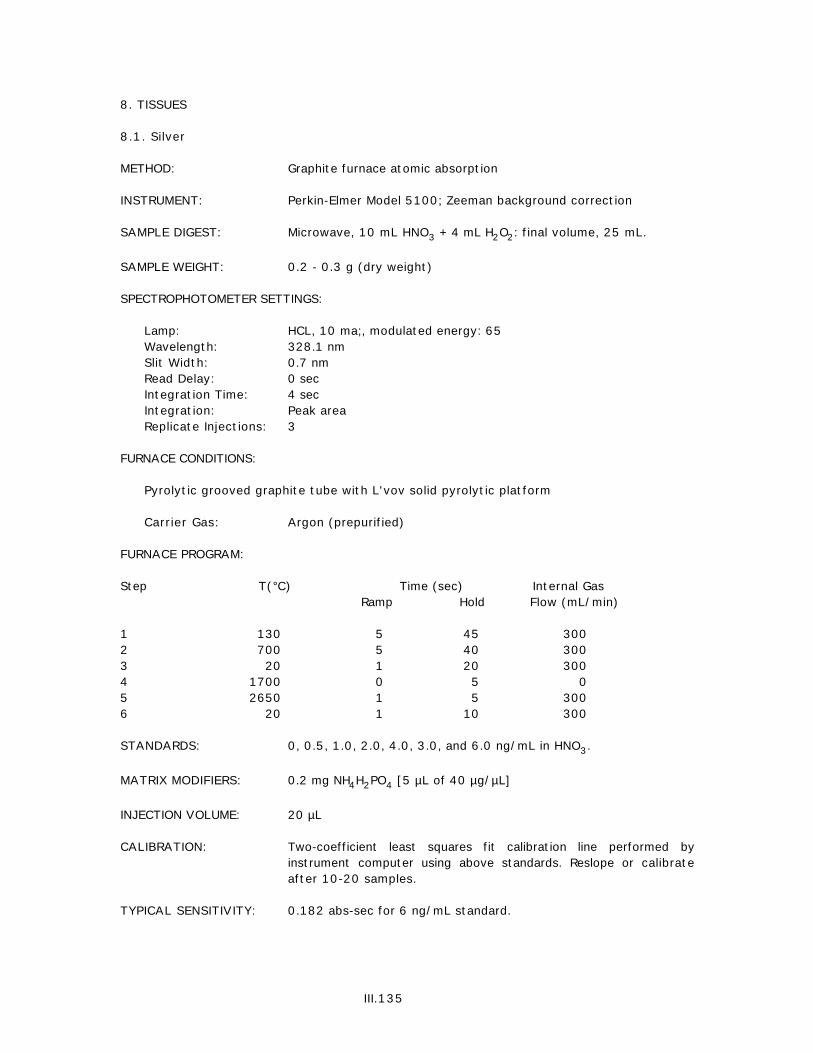
8. TISSUES
8.1. Silver
METHOD: Graphite furnace atomic absorption
INSTRUMENT: Perkin-Elmer Model 5100; Zeeman background correction
SAMPLE DIGEST: Microwave, 10 mL HNO3 + 4 mL H2O2: final volume, 25 mL.
SAMPLE WEIGHT: 0.2 - 0.3 g (dry weight)
SPECTROPHOTOMETER SETTINGS:
Lamp: HCL, 10 ma;, modulated energy: 65Wavelength: 328.1 nmSlit Width: 0.7 nmRead Delay: 0 secIntegration Time: 4 secIntegration: Peak areaReplicate Injections: 3
FURNACE CONDITIONS:
Pyrolytic grooved graphite tube with L'vov solid pyrolytic platform
Carrier Gas: Argon (prepurified)
FURNACE PROGRAM:
Step T(°C) Time (sec) Internal GasRamp Hold Flow (mL/min)
1 130 5 45 3002 700 5 40 3003 20 1 20 3004 1700 0 5 05 2650 1 5 3006 20 1 10 300
STANDARDS: 0, 0.5, 1.0, 2.0, 4.0, 3.0, and 6.0 ng/mL in HNO3.
MATRIX MODIFIERS: 0.2 mg NH4H2PO4 [5 µL of 40 µg/µL]
INJECTION VOLUME: 20 µL
CALIBRATION: Two-coefficient least squares fit calibration line performed byinstrument computer using above standards. Reslope or calibrateafter 10-20 samples.
TYPICAL SENSITIVITY: 0.182 abs-sec for 6 ng/mL standard.
III.135

8.2. Aluminum
METHOD: Graphite furnace atomic absorption
INSTRUMENT: Perkin-Elmer Model 5000; deuterium background correction
SAMPLE DIGEST: Microwave, 10 mL HNO3 + 4 mL H2O2: final volume, 25 mL.
SAMPLE WEIGHT: 0.2 - 0.3 g (dry weight)
SPECTROPHOTOMETER SETTINGS:
Lamp: HCL, 25 ma; continuous energy: 62Wavelength: 309.3 nmSlit Width: 0.7 nmRead Delay: 0 secIntegration Time: 5 secIntegration: Peak areaReplicate Injections: 3
FURNACE CONDITIONS:
Pyrolytic grooved graphite tube with L'vov solid pyrolytic platform
Carrier Gas: Argon (prepurified)
FURNACE PROGRAM:
Step T(°C) Time (sec) Internal GasRamp Hold Flow (mL/min)
1 120 15 30 3002 450 15 10 3003 1700 1 10 3004 2400 0 10 05 2500 1 5 3006 20 1 20 300
STANDARDS: 10, 50, 100, 300, 600, 1000, 2000, and 4000 ng/mL in HNO3.
MATRIX MODIFIERS: 5 µL of 10 µg Mg(NO3)2/µL
INJECTION VOLUME: 20 µL
CALIBRATION: 8 point (standards) best fit quadratic calibration line.
TYPICAL SENSITIVITY: 0.205 abs-sec for 300 ng/mL standard.
III.136
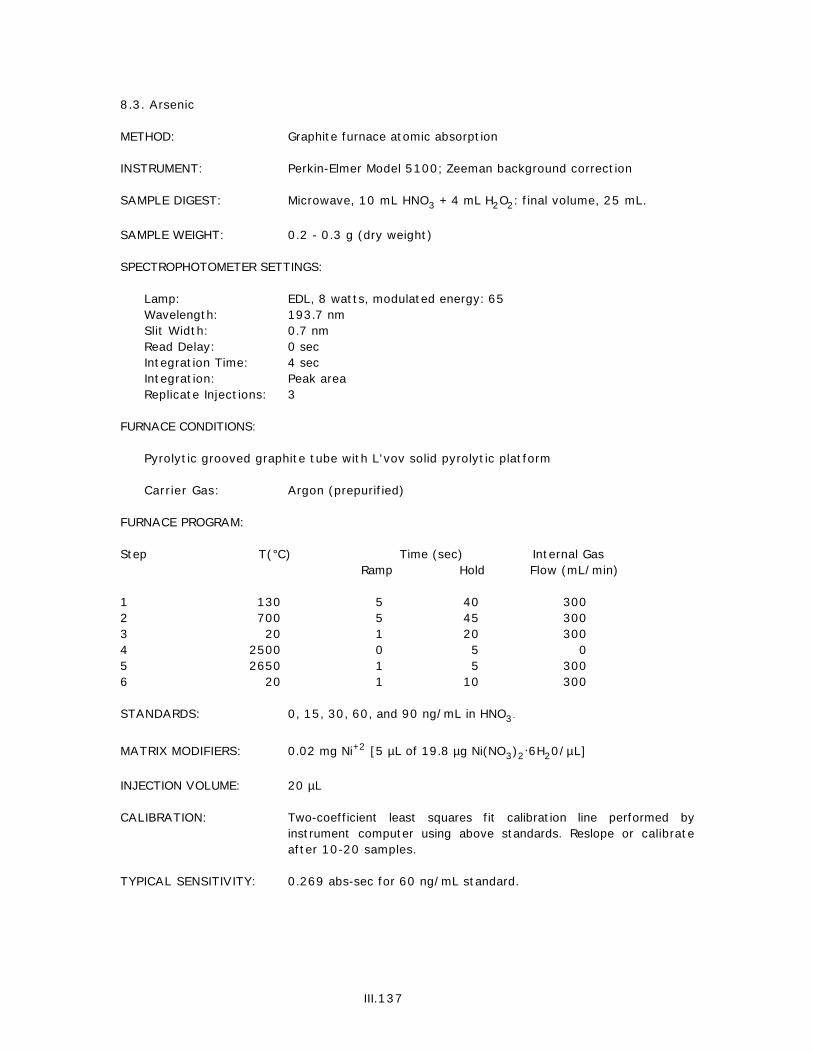
8.3. Arsenic
METHOD: Graphite furnace atomic absorption
INSTRUMENT: Perkin-Elmer Model 5100; Zeeman background correction
SAMPLE DIGEST: Microwave, 10 mL HNO3 + 4 mL H2O2: final volume, 25 mL.
SAMPLE WEIGHT: 0.2 - 0.3 g (dry weight)
SPECTROPHOTOMETER SETTINGS:
Lamp: EDL, 8 watts, modulated energy: 65Wavelength: 193.7 nmSlit Width: 0.7 nmRead Delay: 0 secIntegration Time: 4 secIntegration: Peak areaReplicate Injections: 3
FURNACE CONDITIONS:
Pyrolytic grooved graphite tube with L'vov solid pyrolytic platform
Carrier Gas: Argon (prepurified)
FURNACE PROGRAM:
Step T(°C) Time (sec) Internal GasRamp Hold Flow (mL/min)
1 130 5 40 3002 700 5 45 3003 20 1 20 3004 2500 0 5 05 2650 1 5 3006 20 1 10 300
STANDARDS: 0, 15, 30, 60, and 90 ng/mL in HNO3.
MATRIX MODIFIERS: 0.02 mg Ni+2 [5 µL of 19.8 µg Ni(NO3)2.6H20/µL]
INJECTION VOLUME: 20 µL
CALIBRATION: Two-coefficient least squares fit calibration line performed byinstrument computer using above standards. Reslope or calibrateafter 10-20 samples.
TYPICAL SENSITIVITY: 0.269 abs-sec for 60 ng/mL standard.
III.137

8.4. Cadmium
METHOD: Graphite furnace atomic absorption
INSTRUMENT: Perkin-Elmer Model 5100; Zeeman background correction
SAMPLE DIGEST: Microwave, 10 mL HNO3 + 4 mL H2O2: final volume, 25 mL.
SAMPLE WEIGHT: 0.2 - 0.3 g (dry weight)
SPECTROPHOTOMETER SETTINGS:
Lamp: EDL, 5 watts, modulated energy: 64Wavelength: 193.7 nmSlit Width: 0.7 nmRead Delay: 0 secIntegration Time: 4 secIntegration: Peak areaReplicate Injections: 3
FURNACE CONDITIONS:
Pyrolytic grooved graphite tube with L'vov solid pyrolytic platform
Carrier Gas: Argon (prepurified)
FURNACE PROGRAM:
Step T(°C) Time (sec) Internal GasRamp Hold Flow (mL/min)
1 130 5 45 3002 500 5 45 3003 20 1 20 3004 1700 0 5 05 2650 1 5 3006 20 1 10 300
STANDARDS: 0, 0.3, 0.6, 1.0, 1.2, and 2.0 ng/mL in HNO3.
MATRIX MODIFIERS: 0.2 mg NH4H2PO4 [5 µL of 40 µg/µL]2 µL of 5 µg Mg(NO3)2/µL
INJECTION VOLUME: 20 µL
CALIBRATION: Two-coefficient least squares fit calibration line performed byinstrument computer using above standards. Reslope or calibrateafter 10-20 samples.
TYPICAL SENSITIVITY: 0.185 abs-sec for 1.2 ng/mL standard.
III.138

8.5. Chromium
METHOD: Graphite furnace atomic absorption
INSTRUMENT: Perkin-Elmer Model 5000; no background correction
SAMPLE DIGEST: Microwave, 10 mL HNO3 + 4 mL H2O2: final volume, 25 mL.
SAMPLE WEIGHT: 0.2 - 0.3 g (dry weight)
SPECTROPHOTOMETER SETTINGS:
Lamp: HCL, 25 ma; continuous energy: 65Wavelength: 357.9 nmSlit Width: 0.7 nmRead Delay: 0 secIntegration Time: 5 secIntegration: Peak areaReplicate Injections: 3
FURNACE CONDITIONS:
Pyrolytic grooved graphite tube with L'vov solid pyrolytic platform
Carrier Gas: Argon (prepurified)
FURNACE PROGRAM:
Step T(°C) Time (sec) Internal GasRamp Hold Flow (mL/min)
1 120 15 30 3002 450 15 10 3003 1650 1 10 3004 2500 0 10 05 2600 1 5 3006 20 1 20 300
STANDARDS: 0.6, 2.0, 4.0, 6.0,10.0, 20.0, 50.0, and 100.0 ng/mL in HNO3.
MATRIX MODIFIERS: 5 µL of 10 µg Mg(NO3)2/µL.
INJECTION VOLUME: 20 µL
CALIBRATION: 8 point (standards) best fit linear calibration line.
TYPICAL SENSITIVITY: 0.125 abs-sec for 20.0 ng/mL standard.
III.139

8.6. Copper
METHOD: Graphite furnace atomic absorption
INSTRUMENT: Perkin-Elmer Model 5000; no background correction
SAMPLE DIGEST: Microwave, 10 mL HNO3 + 4 mL H2O2: final volume, 25 mL.
SAMPLE WEIGHT: 0.2 - 0.3 g (dry weight)
SPECTROPHOTOMETER SETTINGS:
Lamp: HCL, 15 ma; continuous energy: 65Wavelength: 324.7 nmSlit Width: 0.7 nmRead Delay: 0 secIntegration Time: 5 secIntegration: Peak areaReplicate Injections: 3
FURNACE CONDITIONS:
Pyrolytic grooved graphite tube with L'vov solid pyrolytic platform.
Carrier Gas: Argon (prepurified)
FURNACE PROGRAM:
Step T(°C) Time (sec) Internal GasRamp Hold Flow (mL/min)
1 120 15 30 3002 450 15 10 3003 900 1 10 3004 2000 0 10 05 2400 1 5 3006 20 1 20 300
STANDARDS: 10, 20, 40, 100, 500, 1000, 2000, and 4000 ng/mL in HNO3.
MATRIX MODIFIERS: None
INJECTION VOLUME: 20 µL
CALIBRATION: 8 point (standards) best fit quadratic calibration line.
TYPICAL SENSITIVITY: 0.282 abs-sec for 100 ng/mL standard.
III.140

8.7. Iron
METHOD: Atomic Absorption, Acetylene Flame
INSTRUMENT: Perkin-Elmer Model 5000; deuterium background correction
SAMPLE DIGEST: Microwave, 10 mL HNO3 + 4 mL H2O2: final volume, 25 mL.
SAMPLE WEIGHT: 0.2 - 0.3 g (dry weight)
SPECTROPHOTOMETER SETTINGS:
Lamp: HCL, 20 ma; continuous energy: 68Wavelength: 244.3 nmSlit Width: 0.7 nmIntegration Time: 5 secIntegration: Peak areaReplicate Injections: 3Nebulization: Glass impact beadFlame: air/acetylene, 20:30
STANDARDS: 0.2, 0.6, 1.0, 2.0, 10.0, 20.0, 40.0, and 100.0 µg/mL in HNO3.
CALIBRATION: 8 point (standards) best fit quadratic calibration line.
TYPICAL SENSITIVITY: 0.177 abs-sec for 10.0 µg/mL standard.
III.141

8.8. Mercury
METHOD: Atomic Absorption, Cold Vapor
INSTRUMENT: Perkin-Elmer Model 5000; deuterium background correction
SAMPLE DIGEST: Microwave 10 mL HNO3 + 4 mL H2O2: final volume 25 mL.
SAMPLE WEIGHT: 0.2 - 0.3 g (dry weight)
SPECTROPHOTOMETER SETTINGS:
Lamp: EDL, 5 watts; continuous energy: 66Wavelength: 253.6 nmSlit Width: L
RECORDER SETTINGS:
Expansion: 1Integration Time: peak heightRecorder Time Constant: 1 sec
VAPOR GENERATION PARAMETERS:
1.5 % HCl (10 mL)5.0% KMnO4 (approximately 150 µL)Carrier Gas: argon (maximum flow: 1100 mL/min)Reductant: 3% NaBH4 in 1% NaOH added until maximum peak height is obtained
STANDARDS: 2, 6, 10, and 16 ng/mL in HNO3.
INJECTION VOLUME: 2.0 mL
CALIBRATIONS: 8 point (standards) best fit quadratic calibration line.
TYPICAL SENSITIVITY: 0.044 abs-sec for 10.0 ng/mL standard.
III.142

8.9. Manganese
METHOD: Atomic Absorption, Acetylene Flame
INSTRUMENT: Perkin-Elmer Model 5000; deuterium background correction
SAMPLE DIGEST: Microwave, 10 mL HNO3 + 4 mL H2O2: final volume, 25 mL.
SAMPLE WEIGHT: 0.2 - 0.3 g (dry weight)
SPECTROPHOTOMETER SETTINGS:
Lamp: HCL, 20 ma; continuous energy: 68Wavelength: 279.5 nmSlit Width: 0.7 nmIntegration Time: 5 secIntegration: Peak areaReplicate Injections: 3Nebulization: Glass impact beadFlame: air/acetylene, 25:30
STANDARDS: 0.02, 0.06, 0.10, 0.30, 0.50, 1.00, 2.00, and 4.00 µg/mL inHNO3.
CALIBRATION: 8 point (standards) best fit linear calibration line.
TYPICAL SENSITIVITY: 0.397 abs-sec for 0.06 µg/mL standard.
III.143

8.10. Nickel
METHOD: Graphite furnace atomic absorption
INSTRUMENT: Perkin-Elmer Model 5000; no background correction
SAMPLE DIGEST: Microwave, 10 mL HNO3 + 4 mL H2O2: final volume, 25 mL.
SAMPLE WEIGHT: 0.2 - 0.3 g (dry weight)
SPECTROPHOTOMETER SETTINGS:
Lamp: HCL, 25 ma; continuous energy: 52Wavelength: 232.0 nmSlit Width: 0.7 nmRead Delay: 0 secIntegration Time: 5 secIntegration: Peak areaReplicate Injections: 3
FURNACE CONDITIONS:
Pyrolytic grooved graphite tube with L'vov solid pyrolytic platform
Carrier Gas: Argon (prepurified)
FURNACE PROGRAM:
Step T(°C) Time (sec) Internal GasRamp Hold Flow (mL/min)
1 120 15 30 3002 450 15 10 3003 1000 1 10 3004 2400 0 10 05 2500 1 5 3006 20 1 20 300
STANDARDS: 5, 15, 30, 60, 100, and 200 ng/mL in HNO3.
MATRIX MODIFIERS: 5 µL of 10 µg Mg(NO3)2/µL.
INJECTION VOLUME: 20 µL
CALIBRATION: 6 point (standards) best fit linear calibration line.
TYPICAL SENSITIVITY: 0.169 abs-sec for 200 ng/mL standard.
III.144

8.11. Lead
METHOD: Graphite furnace atomic absorption
INSTRUMENT: Perkin-Elmer Model 5100; Zeeman background correction
SAMPLE DIGEST: Microwave, 10 mL HNO3 + 4 mL H2O2: final volume, 25 mL.
SAMPLE WEIGHT: 0.2 - 0.3 g (dry weight)
SPECTROPHOTOMETER SETTINGS:
Lamp: EDL, 10 watts, modulated energy: 68Wavelength: 283.3 nmSlit Width: 0.7 nmRead Delay: 0 secIntegration Time: 4 secIntegration: Peak areaReplicate Injections: 3
FURNACE CONDITIONS:
Pyrolytic grooved graphite tube with L'vov solid pyrolytic platform
Carrier Gas: Argon (prepurified)
FURNACE PROGRAM:
Step T(°C) Time (sec) Internal GasRamp Hold Flow (mL/min)
1 130 5 45 3002 600 5 60 3003 20 1 20 3004 1600 0 5 05 2650 1 5 3006 20 1 10 300
STANDARDS: 0, 10, 20, 40, and 80 ng/mL in HNO3
MATRIX MODIFIERS: 0.2 mg NH4H2PO4 [5 µL of 40 µg/µL]2 µL of 5 µg Mg(NO3)2/µL
INJECTION VOLUME: 20 µL
CALIBRATION: Two-coefficient least squares fit calibration line performed byinstrument computer using above standards. Reslope or calibrateafter 10-20 samples.
TYPICAL SENSITIVITY: 0.219 abs-sec for 40 ng/mL standard.
III.145
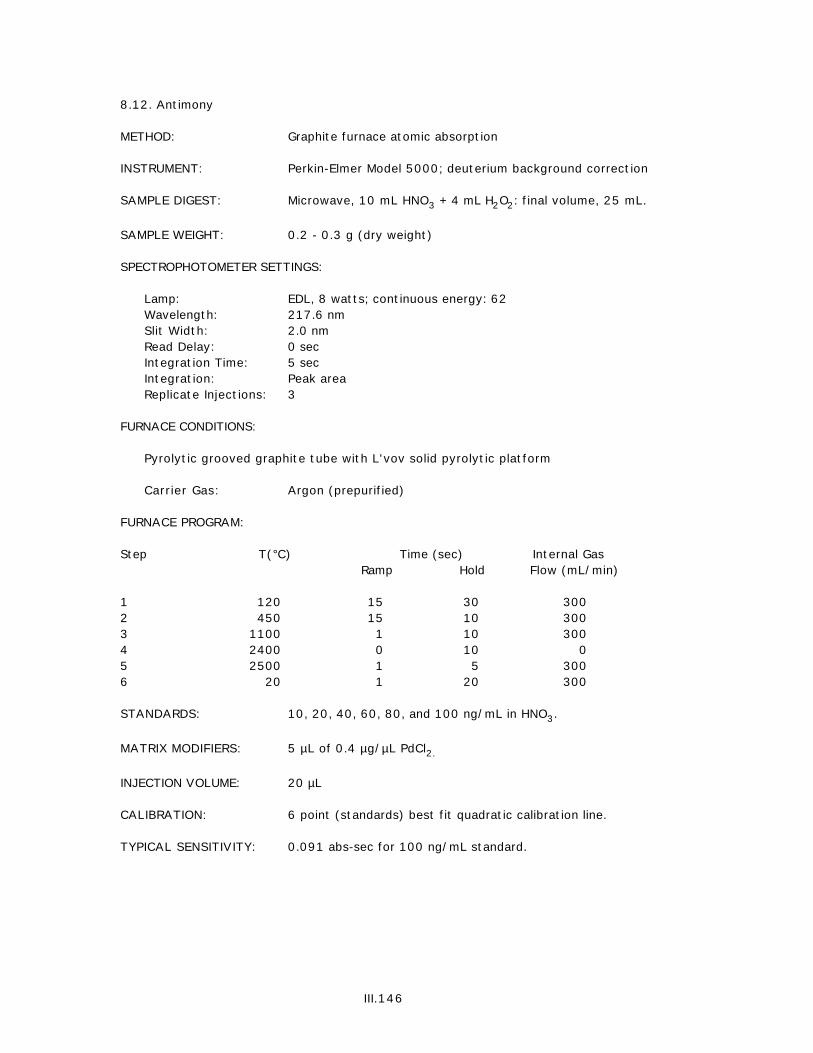
8.12. Antimony
METHOD: Graphite furnace atomic absorption
INSTRUMENT: Perkin-Elmer Model 5000; deuterium background correction
SAMPLE DIGEST: Microwave, 10 mL HNO3 + 4 mL H2O2: final volume, 25 mL.
SAMPLE WEIGHT: 0.2 - 0.3 g (dry weight)
SPECTROPHOTOMETER SETTINGS:
Lamp: EDL, 8 watts; continuous energy: 62Wavelength: 217.6 nmSlit Width: 2.0 nmRead Delay: 0 secIntegration Time: 5 secIntegration: Peak areaReplicate Injections: 3
FURNACE CONDITIONS:
Pyrolytic grooved graphite tube with L'vov solid pyrolytic platform
Carrier Gas: Argon (prepurified)
FURNACE PROGRAM:
Step T(°C) Time (sec) Internal GasRamp Hold Flow (mL/min)
1 120 15 30 3002 450 15 10 3003 1100 1 10 3004 2400 0 10 05 2500 1 5 3006 20 1 20 300
STANDARDS: 10, 20, 40, 60, 80, and 100 ng/mL in HNO3.
MATRIX MODIFIERS: 5 µL of 0.4 µg/µL PdCl2.
INJECTION VOLUME: 20 µL
CALIBRATION: 6 point (standards) best fit quadratic calibration line.
TYPICAL SENSITIVITY: 0.091 abs-sec for 100 ng/mL standard.
III.146

8.13. Selenium
METHOD: Graphite furnace atomic absorption
INSTRUMENT: Perkin-Elmer Model 5100; Zeeman background correction
SAMPLE DIGEST: Microwave, 10 mL HNO3 + 4 mL H2O2: final volume, 25 mL.
SAMPLE WEIGHT: 0.2 - 0.3 g (dry weight)
SPECTROPHOTOMETER SETTINGS:
Lamp: EDL, 6 watts, modulated energy: 65Wavelength: 196.0 nmSlit Width: 0.7 nmRead Delay: 0 secIntegration Time: 5 secIntegration: Peak areaReplicate Injections: 3
FURNACE CONDITIONS:Pyrolytic grooved graphite tube with L'vov solid pyrolytic Platform
Carrier Gas: Argon (prepurified)
FURNACE PROGRAM:
Step T(°C) Time (sec) Internal GasRamp Hold Flow (mL/min)
1 130 5 40 3002 600 5 45 3003 20 1 20 3004 2200 0 5 05 2650 1 5 3006 20 1 10 300
STANDARDS: 0, 15, 30, 60, 80, and 160 ng/mL in HNO3.
MATRIX MODIFIERS: 0.02 mg Ni+2 [5 µL of 4 µg/µL Ni(NO3)2]5 µL of 5 µg Mg(NO3)2/µL
INJECTION VOLUME: 20 µL
CALIBRATION: Two-coefficient least squares fit calibration line performed byinstrument computer using above standards. Reslope or calibrateafter 10-20 samples.
TYPICAL SENSITIVITY: 0.197 abs-sec for 60 ng/mL standard.
III.147

8.14. Tin
METHOD: Graphite furnace atomic absorption
INSTRUMENT: Perkin-Elmer Model 5000; deuterium background correction
SAMPLE DIGEST: Microwave, 10 mL HNO3 + 4 mL H2O2: final volume, 25 mL.
SAMPLE WEIGHT: 0.2 - 0.3 g (dry weight)
SPECTROPHOTOMETER SETTINGS:
Lamp: EDL, 8 watts, continuous energy: 45Wavelength: 224.6 nmSlit Width: 0.7 nmRead Delay: 0 secIntegration Time: 5 secIntegration: Peak areaReplicate Injections: 3
FURNACE CONDITIONS:
Pyrolytic grooved graphite tube with L'vov solid pyrolytic Platform
Carrier Gas: Argon (prepurified)
FURNACE PROGRAM:
Step T(°C) Time (sec) Internal GasRamp Hold Flow (mL/min)
1 120 15 30 3002 450 10 10 3003 900 1 10 3004 2100 0 10 05 2400 1 5 3006 20 1 20 300
STANDARDS: 4, 6, 10, 20, 50, and 100 ng/mL in HNO3.
MATRIX MODIFIERS: 5 µL of 10 µg Mg(NO3)2/µL.
INJECTION VOLUME: 20 µL
CALIBRATION: 6 point (standards) best-fit quadratic calibration line.
TYPICAL SENSITIVITY: 0.161 abs-sec for 100 ng/mL standard.
III.148

8.15. Tin
METHOD: Atomic Absorption, Hydride Generation
INSTRUMENT: Perkin-Elmer Model 5000; no background correction
SAMPLE DIGEST: Microwave 10 mL HNO3 + 4 mL H2O2: final volume 25 mL.
SAMPLE WEIGHT: 0.2 - 0.3 g (dry weight)
SPECTROPHOTOMETER SETTINGS:
Lamp: EDL, 8 watts; continuous energy: 48Wavelength: 224.6 nmSlit Width: LRead Delay: 1 secIntegration Time: 5 secIntegration: Peak areaReplicate Injections: 2
FURNACE CONDITIONS:
Non-grooved, uncoated graphite tube, drilled 9/64" bit
RECORDER SETTINGS:
Expansion: 1Integration Time: 5 secTime Constant: 1 sec
VAPOR GENERATION PARAMETERS:
In chamber/bubbler system (with quartz tip in graphite tube)50 mL MilliQ water0.5 mL acetic acid (2N)1.0 mL sample3.0 mL of 3% NaBH4 in 1% NaOH added slowly (45 sec) using a syringe.Carrier Gas: prepurified argon
FURNACE PROGRAMS (A and B):
Step T(°C) Time (sec) Internal GasRamp Hold Flow (mL/min)
A-1 700 20 360 0(with quartz tip removed from graphite tube)
B-1 300 10 5 300B-2 2400 0 4 0B-3 2500 1 4 300B-4 20 1 20 300
STANDARDS: 4, 6, 10, 20, 30, 50, 100, and 200 ng/mL in HNO3.
TYPICAL SENSITIVITY: 0.166 abs-sec for 20 ng/mL standard.
III.149

8.16. Zinc
METHOD: Atomic Absorption, Acetylene Flame
INSTRUMENT: Perkin-Elmer Model 5000; no background correction
SAMPLE DIGEST: Microwave, 10 mL HNO3 + 4 mL H2O2: final volume, 25 mL.
SAMPLE WEIGHT: 0.2 - 0.3 g (dry weight)
SPECTROPHOTOMETER SETTINGS:
Lamp: EDL, 6.0 watts; continuous energy: 64Wavelength: 213.9 nmSlit Width: 0.7 nmIntegration Time: 5 secIntegration: Peak areaReplicate Injections: 3Nebulization: Glass impact beadFlame: Air/acetylene, 20:30
STANDARDS: 0.1, 0.5, 2.0, 6.0, and 10.0 µg/mL in HNO3.
CALIBRATION: 5 point (standards) best fit quadratic calibration line.
TYPICAL SENSITIVITY: 0.101 abs-sec for 05 µg/mL standard.
III.150

GERG Trace Element Quantification Techniques
B. J. Taylor and B. J. PresleyOceanography Department
Texas A&M UniversityCollege Station, TX
1. INTRODUCTION
This report documents the analytical procedures used for major and minor element analysis ofmarine sediments and tissue samples collected from the Gulf of Mexico coast of the UnitedStates as part of the Mussel Watch Project of NOAA's National Status and Trends Program.These procedures were used by the Department of Oceanography at Texas A&M University toanalyze samples collected from 1986 to 1990.
2. EQUIPMENT AND SUPPLIES
2.1. Instrumentation
Perkin-Elmer model Z/3030 atomic absorption spectrophotometer. Perkin-Elmer, Norwalk, CT.Printer, Apple Imagewriter. Apple Computer, Cupertino, CA.Graphite furnace, Perkin-Elmer HGA-600Graphite furnace cooling unit:
Constant Temperature Circulator Model FK. Haake, Paramus, NJ.IC-6 refrigeration unit, Lauda water bath. Curtin-Matheson, Houston, TX.
Autosampler, Perkin-Elmer AS-60EDL power supply, Perkin-Elmer Model 040-0354
Perkin-Elmer model 306 atomic absorption spectrophotometerBackground correction, deuterium arcBurner (0040-0146) with standard nebulizer, flow spoiler, and single-slot acetylene(0040-0266) and nitrous oxide (0040-0277) burner headsDigital absorbance readout
Atomic absorption spectrophotometer Thermo Jarrell Ash Smith-Heiftje 12. Jarrell Ash,Franklin, MA.Printer, FACIT 4513 graphics printerGraphite furnace, Thermo Jarrell Ash model 188Graphite furnace cooling unit, Bernard Constant Temperature Circulator Model 3500SSAutosampler, Thermo Jarrell Ash Model 109619Burner with standard nebulizer, flow spoiler, and single-slot acetylene head, 121534-02
Mercury Monitor, Model 1235. Laboratory Data Control Analytical, Riviera Beach, FL.Wavelength setting, 254 nmAbsorbance cell, 30 cmRecorder, OmniScribe Model A5101-2. Houston Instruments, Houston, TX.
SpectraSpan VI dc-plasma emission spectrophotometer. Applied Research Laboratories/FisonInstruments, Valencia, CA.Spectrometer, Czerny-Tumer with Echelle gratingPlasma, direct current argon with tungsten and pyrolytic carbon electrodes
III.151

Data processing, multitasking, computer-controlled operation with statistics and qualityassurance
Ortec pure germanium large volume co-axial detectors, GEM-22170S and 23185-P, with 1.68KeV and 1332.5 KeV resolution, 22% efficient compared to NaI detector. EG&G Ortec, OakRidge, TN.
Nuclear Data model 9900 MCA, implemented on a VAX station II-GPX.
2.2. Supplies
Hollow cathode lamps (HCL). Perkin-Elmer, Norwalk, CT.Electrodeless discharge lamps (EDL). Perkin-Elmer, Norwalk, CT.Argon, high-purity (99.999%)Acetylene, industrialNitrous oxideGraphite tubes, pyrolytically coated, grooved, Perkin-Elmer B010-9322Graphite tubes, pyrolytically coated, ungrooved, Perkin-Elmer B010-9322Graphite tubes, pyrolytically coated, ungrooved, Thermo Jarrell Ash 124544-01L'vov graphite platforms, pyrolytically coated, Perkin-Elmer B010-9324Autosampler cups, 2 ml, polystyrene, B2713-2. Baxter Scientific Products, McGawPark, IL.
2.3. Labware
Balance, 0.01 g, Fisher 200 Ainsworthtoploader. Fisher Scientific, Pittsburgh,PA.
Jars, large, TeflonPipette tips, for Finnpette, Finntip 62.
LabsystemsBalance, 0.01 g, Mettler PC2000. Pipette tips, polypropylene for Eppendorf
pipets, 10-100 mL Model 22 34190-1 and200-1000 mL, 22 35 090-1.
Balance, analytical, 0.0001 g, Mettler H10.Balls, 1-cm diam., TeflonBalls, 3.5-cm diam, Teflon Pipette, Finnpette, adjustable, 1000-5000 ml
9402020. Curtin-Matheson Scientific,Houston, TX.
Bench, clean, with HEPA filter. LibertyIndustries, East Berlin, CT.
Bottles, screw-cap bottles, polyethylene,wide-mouth, 1-oz., Nalgene 2104-0001
Pipette, transfer, polyethylene.Pipettes, Eppendorf, fixed volume: 10-mL,
22350102; 25-mL, 22350307; 50-mL,22350404; 100-mL, 22350501; 200-mL, 22350609; 500-mL, 22350706;1000-mL, 22350803.
Digestion vessels, 50-mL, Teflon (PFA), 561-R. Savillex, Minnetonka, MN.
Drying oven, 60°C, NAPCO 332. Curtin-Matheson Scientific, Houston, TX.
Drying oven, 130° C, Thelco Vials, snap-cap vials, polystyrene, 5-, 15-,and 40-dram. Baxter Scientific Products,McGaw Park, IL.
Freeze dryer (Virtis 10-100) and vacuumpump (Welch Duo-Seal 1402B80). VirtisCo., Gardner, NY, and Welch, Skokie, IL.
2.4. Reagents
Ammonium dihydrogen phosphate (NH4H2PO4)[7722-76-1], Spectropure Grade, P30.Spex, Edison, NJ.
Boric acid (H3BO3) [10043-35-3], 10659,Grade 1. Johnson Matthey, West Chester,PA.
Ascorbic acid (C6H8O6) [50-81-7], A-7506.Sigma, St. Louis, MO.
Citric acid (C6H8O7) [77-92-9], 0110. J. T.Baker, Phillipsburg, NJ.
III.152

Hydrochloric acid (HCl) [7647-01-0],concentrated (37%), Ultrex 6900-05. J.T. Baker, Phillipsburg, NJ.
Nitric acid (HNO3) [7697-37-2], concentrated(70%), Ultrex 6901-05. J. T. Baker,Phillipsburg, NJ.
Hydrofluoric acid (HF) [7664-39-3],concentrated (48%), 9560-06. J. T.Baker, Phillipsburg, NJ.
Palladium metal [7440-05-3], Specpure,560001. Johnson Matthey, West Chester,PA.
Magnesium nitrate [Mg(NO3)2 . 6H20] [13446-18-9], MG60-50. Spex, Edison, NJ.
Perchloric acid (HClO4) [7601-90-3], con-centrated (70%), Ultrex 4805-01. J. T.Baker, Phillipsburg, NJ.Nickel oxide (Ni0) [1313-99-1], powder.
Spex, Edison, NJ. Stannous chloride, (SnCl2 . 2H2O) [10025-69-1], 8176. Mallinckrodt, Paris, KY.Nitric acid (HNO3) [7697-37-2], concentrated
(70%), 2704-7x6. Mallinckrodt, Paris,KY.
Water, redistilled in quartz sub-boiling still.
2.5. Matrix modifiers
Ammonium phosphate: 0.04 g/ml in quartz-distilled waterAscorbic acid: 2% w/v made with quartz-distilled waterCitric acid: 2% w/v made with quartz-distilled waterHydroxylamine hydrochlorideMagnesium nitrate: 0.02 g/ml in quartz-distilled waterPalladium nitrate: 1000 mg Pd/ml made by dissolving 0.05 g Pd metal in 2 mlConcentrated Ultrex HNO3 and diluted to 50 ml with quartz-distilled water
2.6. Standards
Baxter Ricca standards, 1000 ppm. Ricca Chemical Co., Arlington, TX.
Element Stock number Element Stock number
Ag 7100-16UK Mn 4600-16UKAl 600-16UK Ni 5300-16UKAs 800-16UK Pb 4300-16UKCd 1700-16UK Sb 700-16UKCr 2100-16UK Se 6700-16UKCu 2300-16UK Sn 8500-16UKFe 4200-16UK Zn 9500-16UKHg 4800-16UK
3. SAMPLE TREATMENT
3.1. Oyster tissue
3.1.1. Oyster shucking
Oysters are rinsed with distilled water to remove extraneous material and shucked with astainless steel knife (using care not to touch the tissue). Tissue is removed with plastic forcepsand rinsed with distilled, deionized water to remove sediment particles from gills and exteriortissue surfaces. Oyster soft parts are transferred to a tared Ziploc polyethylene bag, and thenumber of oysters shucked and placed in the bag is recorded. When all the oysters from a sitehave been shucked, they are weighed on a top loading balance to measure the total sample wetweight. The pooled samples are placed in a freezer to await further processing.
III.153
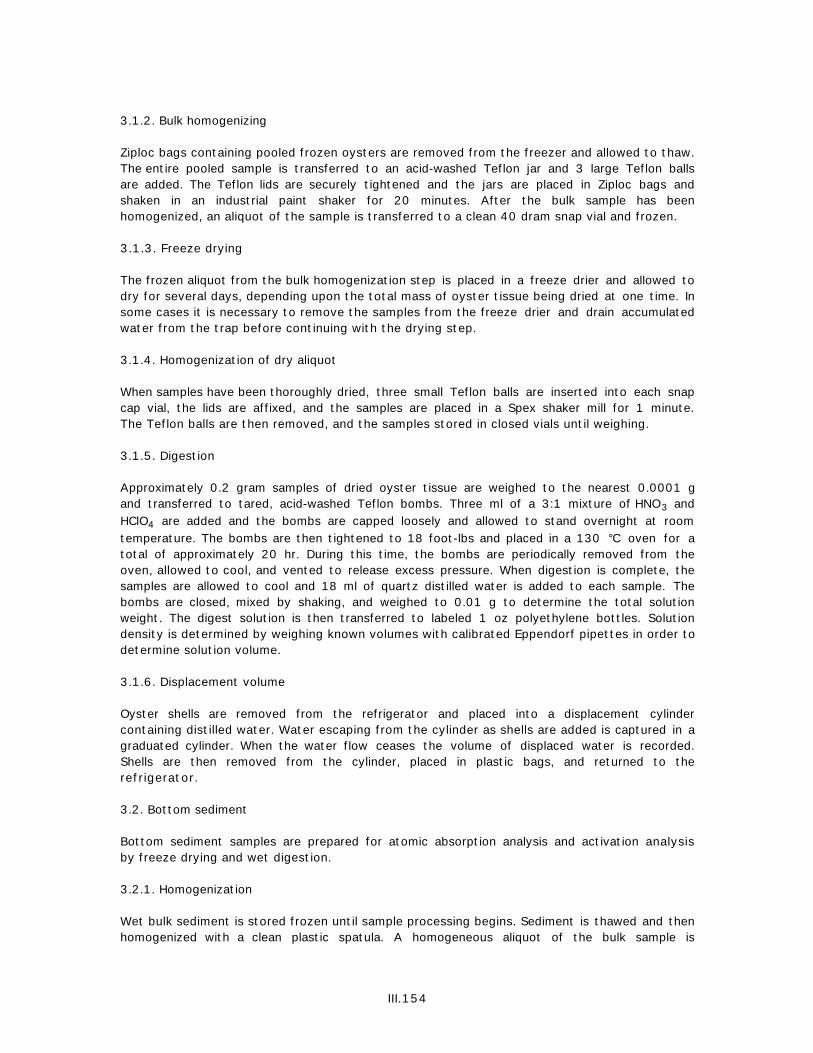
3.1.2. Bulk homogenizing
Ziploc bags containing pooled frozen oysters are removed from the freezer and allowed to thaw.The entire pooled sample is transferred to an acid-washed Teflon jar and 3 large Teflon ballsare added. The Teflon lids are securely tightened and the jars are placed in Ziploc bags andshaken in an industrial paint shaker for 20 minutes. After the bulk sample has beenhomogenized, an aliquot of the sample is transferred to a clean 40 dram snap vial and frozen.
3.1.3. Freeze drying
The frozen aliquot from the bulk homogenization step is placed in a freeze drier and allowed todry for several days, depending upon the total mass of oyster tissue being dried at one time. Insome cases it is necessary to remove the samples from the freeze drier and drain accumulatedwater from the trap before continuing with the drying step.
3.1.4. Homogenization of dry aliquot
When samples have been thoroughly dried, three small Teflon balls are inserted into each snapcap vial, the lids are affixed, and the samples are placed in a Spex shaker mill for 1 minute.The Teflon balls are then removed, and the samples stored in closed vials until weighing.
3.1.5. Digestion
Approximately 0.2 gram samples of dried oyster tissue are weighed to the nearest 0.0001 gand transferred to tared, acid-washed Teflon bombs. Three ml of a 3:1 mixture of HNO3 andHClO4 are added and the bombs are capped loosely and allowed to stand overnight at roomtemperature. The bombs are then tightened to 18 foot-lbs and placed in a 130 °C oven for atotal of approximately 20 hr. During this time, the bombs are periodically removed from theoven, allowed to cool, and vented to release excess pressure. When digestion is complete, thesamples are allowed to cool and 18 ml of quartz distilled water is added to each sample. Thebombs are closed, mixed by shaking, and weighed to 0.01 g to determine the total solutionweight. The digest solution is then transferred to labeled 1 oz polyethylene bottles. Solutiondensity is determined by weighing known volumes with calibrated Eppendorf pipettes in order todetermine solution volume.
3.1.6. Displacement volume
Oyster shells are removed from the refrigerator and placed into a displacement cylindercontaining distilled water. Water escaping from the cylinder as shells are added is captured in agraduated cylinder. When the water flow ceases the volume of displaced water is recorded.Shells are then removed from the cylinder, placed in plastic bags, and returned to therefrigerator.
3.2. Bottom sediment
Bottom sediment samples are prepared for atomic absorption analysis and activation analysisby freeze drying and wet digestion.
3.2.1. Homogenization
Wet bulk sediment is stored frozen until sample processing begins. Sediment is thawed and thenhomogenized with a clean plastic spatula. A homogeneous aliquot of the bulk sample is
III.154

transferred to a labeled 40 dram snap cap vial and frozen. The remainder of the sample isarchived in the freezer.
3.2.2. Freeze drying
The snap cap vial containing the sediment sub-sample is placed in a freeze drier for the periodof time required for complete drying. Depending upon the amount of water in the freeze drier,this may range from 12-76 hr.
3.2.3. Homogenization of dry aliquot
In some cases, homogenization of freeze dried sediment can be accomplished by simply placingthe snap cap vials in a Spex shaker. When this is not sufficient, the samples are individuallyground in alumina mortar and pestles and the powdered samples are returned to the vials inwhich they were freeze dried.
3.2.4. Digestion
Approximately 0.2 grams of homogenized, dried sediment are weighed to the nearest 0.0001 gand transferred to tared, acid-washed Teflon bombs. Three ml of a 3:1 mixture of HNO3 andHClO4 are added and the bombs are tightened to 18 foot-lbs and placed in a 130° C oven for atotal of approximately 12 hr. During this time, the bombs are periodically removed from theoven, allowed to cool, and vented to release excess pressure. After this period, the bombs areremoved from the oven and allowed to cool. Two ml of concentrated HF are added and the bombsare retightened and returned to the oven for 12 hr. After cooling, 18 ml of 4% boric acid areadded and the bombs are retightened and returned to the oven for another 12 hr. After thesamples are allowed to cool, the bombs are mixed by shaking and weighed to 0.01 g todetermine the total solution weight. The digest solution is then transferred to labeled 1 ozpolyethylene bottles. Solution density is determined by weighing known volumes with calibratedEppendorf pipettes in order to determine solution volume. At this point, a 20-fold dilution ismade for FAAS analysis of Al, Fe, Mn, Si, and Zn. One ml of digest solution is diluted with 19ml of an acidified seawater solution containing 2:1:17 proportions of seawater:HNO3:deionizedwater.
4. CALIBRATION AND ANALYSIS
Calibration standards are prepared by serial dilution of commercially available atomicabsorption standards using calibrated micropipettes, new snap-cap vials, a top loading balance,and 2 N HNO3. Concentrations of working standards are verified by comparison with US EPAwater quality trace metal standards.
In all cases, final working standards are made up in an acid matrix that matches that of thesamples being analyzed. For some elements, it is necessary to further attempt to match themajor ion composition of the samples; this is most apparent in graphite furnace AAS when thepeak shape of the samples is significantly different from that of the standards. For example,the standards may have a relatively broad, Gaussian-shaped peak while the sediment samplesmay have an extremely sharp peak indicative of rapid volatilization of the metal. In this case,the standards are made up in a solution that has Si, Al, Fe, Ca, and Mg added at finalconcentrations of 3000, 400, 200, 100, and 100 ppb, respectively.
For graphite furnace atomic absorption analysis, standards were placed in positions 1 - 4 of theautosampler tray, and samples and associated quality control samples in positions 5 - 40.
III.155

Matrix modifiers are placed in positions 0 and 40 if necessary. Analysis begins with position 1,thus standards are analyzed first. After the samples in positions 16, 28, and 40, the standardsare rerun before sample analysis continues. After one tray is finished, another tray is placedon the autosampler and analysis is begun in position 5.
5. CALCULATIONS
Trace metal concentrations are calculated by comparing analytical signals of unknowns withthose of calibration standards, and then multiplying the observed concentration by theinstrumental and digestion dilution factors.
Obtain the least-squares fit of the data, treating Abs (or Abs-sec) as the dependent variable("y"), and concentration as the dependent variable ("x"). If the concentration range extendsinto the non-linear range, a second order fit must be used. Calculate the intercept, the first andsecond order coefficients (if appropriate), and R, the correlation coefficient.
Abs = a + b (concobs)
concobs = Abs - a
b
5.1. Concentration
The Perkin-Elmer Z3030 used in much of this project incorporates a patented curve-fittingroutine, and is described here. In this method, the concentration is determined as
C = K1 A + K3 A
2
K2 A - 1
where C is the concentration, A is the absorbance-sec, and K1, K2, and K3 are the coefficientsdetermined by solution of simultaneous equations or by the method of least squares.
In our laboratory, the instrument is allowed to auto-select the appropriate equation to fit thedata. In all cases, the standard curve is computed from a blank and three standards that areequally spaced from zero to the maximum concentration. For example, concentrations might be0, 1, 2, and 3 ppb. If the highest standard is within 15% of the value expected fromextrapolation of the lowest standard, a 2-coefficient equation is used. If the highest standard isnot within 15% of the value expected from extrapolation of the lowest standard, a 3-coefficient equation is used. Because of the number of standards analyzed, the 2-coefficientequation is calculated via least squares regression and the 3-coefficient equation via solution ofsimultaneous equations. The instrument has the capability to perform a "reslope" based on asingle point, however, our recalibrations always involved completely rerunning all standards.Comparison of observed values predicted by the Perkin-Elmer curve fitting routine with thosecalculated independently by least squares shows insignificant differences that are withinrounding errors of the printout.
5.2. Dilution factor
Calculate the dilution factor, DF, resulting from sample digestion using the equation
DF = [(bomb tot) - (bomb tare)]
(spl wt) x (soln dens)
III.156

where bomb tare is the tare weight of the digestion vessel (g); bomb tot is the total weight ofthe digestion vessel plus digest solution (g); spl wt is the weight of the dry sample (g); and solndens is the density of the digest solution (g/cm3).
5.3. Concentration
The concentration in the original sample was calculated according to the relationship:
If concobs < DL, final concentration ≤ (DL) (DFinstr) (DFdign)
If concobs ≥ DL, final concentration = (concobs) (DFinstr) (DFdign)
where concobs is the concentration observed in the aqueous sample. DL is the detection limit ofthe analytical technique; DFinstr is the dilution factor of the analytical technique, if necessary;and DFdign is the dilution factor of the sample digestion.
III.157

6. INSTRUMENTAL ANALYSIS
6.1. Mercury
METHOD: Cold vapor atomic absorption
INSTRUMENTATION: Laboratory Data Control Model 1205 Spectrophotometer with 30-cm path length gas cell.
ATOMIC ABSORPTION SPECTROPHOTOMETER SETTINGS:
Wavelength: 254 nmLamp: Low pressure, hot cathode Hg lampPeak measurement: Peak height (absorbance)Range: 0.2 absorbance unitsOutput: To strip chart recorder, 10 mV full scale
Reaction Conditions:
Sample volume: 1 mlReductant: 10% SnCl2Reductant volume 0.1 mlReaction vessel 25 ml Erlenmeyer flask
STANDARDS: 0, 0.5, 1.0, and 2.0 ppb prepared from 1000 ppm Ricca standard in0.2 M HNO3 / 0.1 M HCl.
APPROXIMATE SENSITIVITY: Approximately 0.160 Abs for 1 mL of 2 ng/mL solution.
III.158

6.2. Aluminum
METHOD: Flame atomic absorption
INSTRUMENTATION: Atomic absorption spectrophotometer Perkin-Elmer 306
ATOMIC ABSORPTION SPECTROPHOTOMETER SETTINGS:
Wavelength: 309.3 nmSlit width: 0.7 nmLamp: Al HCL, 10 mABackground correction: Deuterium arcPeak measurement: Peak height (absorbance)Read mode: Peak
FLAME SETTINGS:
Fuel: AcetyleneOxidant: Nitrous oxideFlame: OxidizingBurner: Single slot, 5.5 cm, parallel
STANDARDS: 0, 10, 30, and 50 ppm prepared from 1000 ppm Ricca standard in0.2 M HNO3.
MATRIX MODIFIERS: Samples and standards are spiked with La (prepared from LaCl3) toa final concentration of 1000-2000 ppm La to suppress ionizationinterferences.
APPROXIMATE SENSITIVITY: 50 µg/ml gives approximately 0.200 Abs.
III.159

6.3. Copper
METHOD: Flame atomic absorption
INSTRUMENTATION: Atomic absorption spectrophotometer Perkin-Elmer 306
ATOMIC ABSORPTION SPECTROPHOTOMETER SETTINGS:
Wavelength: 324.7 nmSlit width: 0.7 nmLamp: Cu HCL, 15 mABackground correction: deuterium arcPeak measurement: Peak height (absorbance)Read mode: Peak
FLAME SETTINGS:
Fuel: AcetyleneOxidant: AirFlame: OxidizingBurner: Single slot, 10 cm, parallel
STANDARDS: 0, 1, 2.5, and 5 ppm prepared from 1000 ppm Riccastandard in 0.2 M HNO3.
APPROXIMATE SENSITIVITY: 2 µg/ml gives approximately 0.125 Abs.
III.160
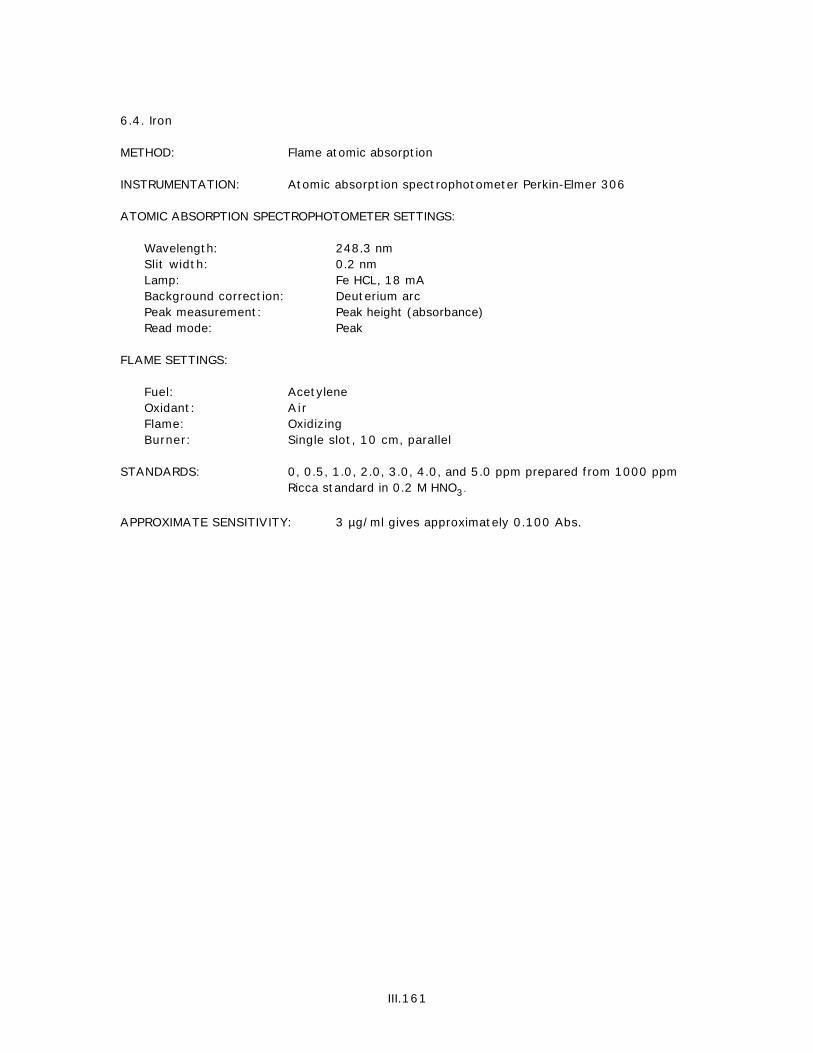
6.4. Iron
METHOD: Flame atomic absorption
INSTRUMENTATION: Atomic absorption spectrophotometer Perkin-Elmer 306
ATOMIC ABSORPTION SPECTROPHOTOMETER SETTINGS:
Wavelength: 248.3 nmSlit width: 0.2 nmLamp: Fe HCL, 18 mABackground correction: Deuterium arcPeak measurement: Peak height (absorbance)Read mode: Peak
FLAME SETTINGS:
Fuel: AcetyleneOxidant: AirFlame: OxidizingBurner: Single slot, 10 cm, parallel
STANDARDS: 0, 0.5, 1.0, 2.0, 3.0, 4.0, and 5.0 ppm prepared from 1000 ppmRicca standard in 0.2 M HNO3.
APPROXIMATE SENSITIVITY: 3 µg/ml gives approximately 0.100 Abs.
III.161

6.5. Manganese
METHOD: Flame atomic absorption
INSTRUMENTATION: Atomic absorption spectrophotometer Perkin-Elmer 306
ATOMIC ABSORPTION SPECTROPHOTOMETER SETTINGS:
Wavelength: 279.5 nmSlit width: 0.2 nmLamp: Mn HCL, 20 mABackground correction: Deuterium arcPeak measurement: Peak height (absorbance)Read mode: Peak
FLAME SETTINGS:
Fuel: AcetyleneOxidant: AirFlame: OxidizingBurner: Single slot, 10 cm, parallel
STANDARDS: 0, 0.4, 0.8, and 1.2 ppm prepared from 1000 ppm Ricca standardin 0.2 M HNO3.
APPROXIMATE SENSITIVITY: 1 µg/ml gives approximately 0.100 Abs.
III.162
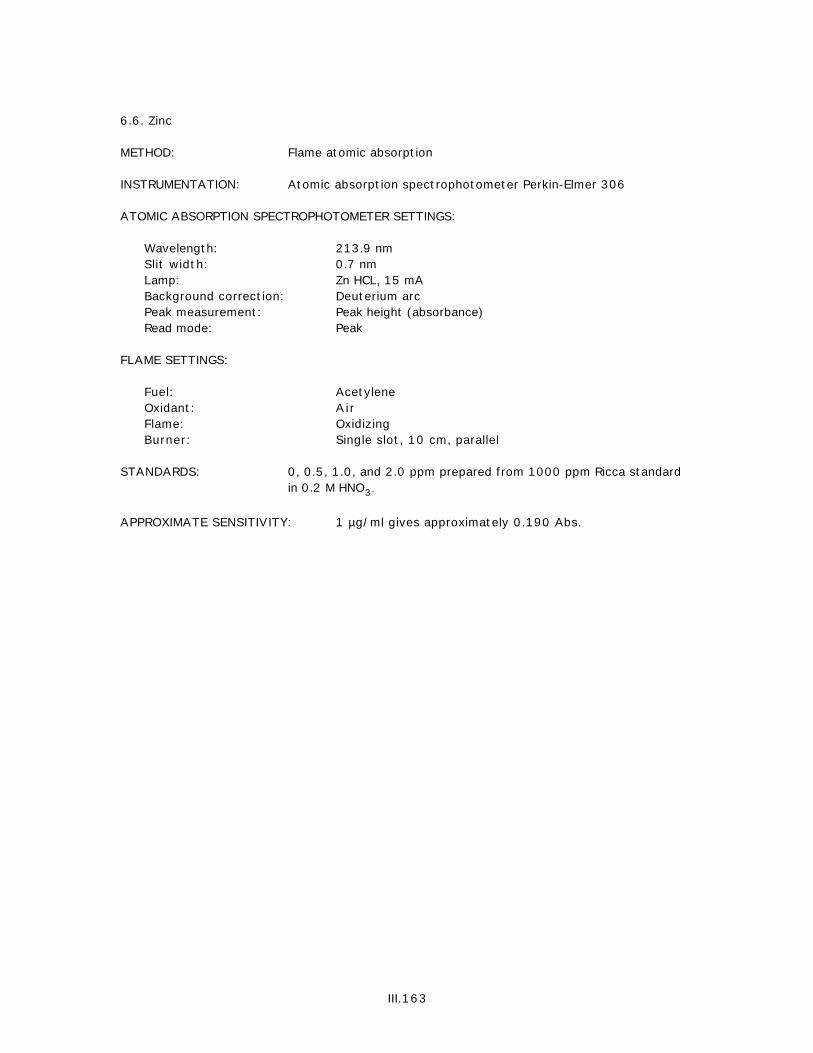
6.6. Zinc
METHOD: Flame atomic absorption
INSTRUMENTATION: Atomic absorption spectrophotometer Perkin-Elmer 306
ATOMIC ABSORPTION SPECTROPHOTOMETER SETTINGS:
Wavelength: 213.9 nmSlit width: 0.7 nmLamp: Zn HCL, 15 mABackground correction: Deuterium arcPeak measurement: Peak height (absorbance)Read mode: Peak
FLAME SETTINGS:
Fuel: AcetyleneOxidant: AirFlame: OxidizingBurner: Single slot, 10 cm, parallel
STANDARDS: 0, 0.5, 1.0, and 2.0 ppm prepared from 1000 ppm Ricca standardin 0.2 M HNO3.
APPROXIMATE SENSITIVITY: 1 µg/ml gives approximately 0.190 Abs.
III.163

6.7. Silver
METHOD: Graphite furnace atomic absorption
INSTRUMENTATION:
Spectrophotometer: Perkin-Elmer Z3030Graphite furnace: Perkin-Elmer HGA 600Autosampler: Perkin-Elmer AS 60Printer: Apple Imagewriter
ATOMIC ABSORPTION SPECTROPHOTOMETER SETTINGS:
Wavelength: 328.1 nmSlit width: 0.7 nmLamp: Ag HCL, 10 mABackground correction: Zeeman effectPeak measurement: Peak areaRead delay: 0 secRead time: 5 secOutput: To printer
GRAPHITE FURNACE SETTINGS:
Tube/platform: L’vov platform, pyrolytically coatedCarrier gas: Argon (high purity)
FURNACE PROGRAM:
Step T(°C) Time (sec) Internal GasRamp Hold Flow (mL/min)
1 130 10 50 2002 900 10 20 2003 100 1 5 2004 1400 0 5 05 2500 1 4 300
AUTOSAMPLER PROGRAM:
Solution: Volume (µL):
Sample 20Blank 0Modifier 1 10Modifier 2 0
Number of injections: 1Recalibrate after positions: 16, 28, and 40
STANDARDS: 0, 3, 6, and 9 ppb prepared from 1000 ppm Ricca standard in 0.2 MHNO3.
III.164

MATRIX MODIFIERS: (1) 2.5 % ammonium phosphate in 1 M HNO3; prepared from SPEXammonium dihydrogen orthophosphate(2) none
APPROXIMATE SENSITIVITY: Approximately 0.130 A-sec for 20 µL of 3 ng/mL.
III.165

6.8. Arsenic
METHOD: Graphite furnace atomic absorption
INSTRUMENTATION:
Spectrophotometer: Perkin-Elmer Z3030Graphite furnace: Perkin-Elmer HGA 600Autosampler: Perkin-Elmer AS 60Printer: Apple Imagewriter
ATOMIC ABSORPTION SPECTROPHOTOMETER SETTINGS:
Wavelengths: 193.7 nm197.0 nm (samples with high Al)
Slit width: 0.7 nmLamp: As EDL, 8 WBackground correction: Zeeman effectPeak measurement: Peak areaRead delay: 0 secRead time: 4 secOutput: To printer
GRAPHITE FURNACE SETTINGS:
Tube/platform: L’vov platform, pyrolytically coatedCarrier gas: Argon (high purity)
FURNACE PROGRAM:
Step T(°C) Time (sec) Internal GasRamp Hold Flow (mL/min)
1 130 10 50 2002 1300 10 10 2003 100 1 5 2004 2400 0 4 05 2400 1 5 300
AUTOSAMPLER PROGRAM:
Solution: Volume (µL):
Sample 20Blank 0Modifier 1 10Modifier 2 0
Number of injections: 1Recalibrate after positions: 16, 28, and 40
III.166

STANDARDS: 0, 20, 40, and 60 ppb prepared from 1000 ppm Ricca standard in0.2 M HNO3.
MATRIX MODIFIERS (1) 1:1:1 citric acid (2%): palladium (1000 ppm): Ni (4000 ppm)(2) none
APPROXIMATE SENSITIVITY: Approximately 0.200 A-sec for 20 µL of 40 ng/mL at193.7 nm; and 0.100 A-sec at 197.0 nm.
III.167

6.9. Cadmium
METHOD: Graphite furnace atomic absorption
INSTRUMENTATION:
Spectrophotometer: Perkin-Elmer Z3030Graphite furnace: Perkin-Elmer HGA 600Autosampler: Perkin-Elmer AS 60Printer: Apple Imagewriter
ATOMIC ABSORPTION SPECTROPHOTOMETER SETTINGS:
Wavelength: 228.8 nmSlit width: 0.7 nmLamp: Cd EDL, 5 WBackground correction: Zeeman effectPeak measurement: Peak areaRead delay: 0 secRead time: 5 secOutput: To printer
GRAPHITE FURNACE SETTINGS:
Tube/platform: L’vov platform, pyrolytically coatedCarrier gas: Argon (high purity)
FURNACE PROGRAM:
Step T(°C) Time (sec) Internal GasRamp Hold Flow (mL/min)
1 130 10 35 3002 350 10 20 3003 100 1 5 3004 1300 0 5 05 2300 1 4 300
AUTOSAMPLER PROGRAM:
Solution: Volume (µL):
Sample 10Blank 0Modifier 1 5Modifier 2 0
Number of injections: 1Recalibrate after positions: 16, 28, and 40
STANDARDS: 0, 1, 2.5, and 4 ppb prepared from 1000 ppm Ricca standard in0.2M HNO3.
III.168

MATRIX MODIFIERS: (1) 2% citric acid(2) none
APPROXIMATE SENSITIVITY: Approximately 0.110 A-sec for 10 µL of 1.4 ng/mL.
III.169

6.10. Chromium
METHOD: Graphite furnace atomic absorption
INSTRUMENTATION:
Spectrophotometer: Perkin-Elmer Z3030Graphite furnace: Perkin-Elmer HGA 600Autosampler: Perkin-Elmer AS 60Printer: Apple Imagewriter
ATOMIC ABSORPTION SPECTROPHOTOMETER SETTINGS:
Wavelength: 357.9 nmSlit width: 0.7 nmLamp: Cr HCL, 25 mABackground correction: Zeeman effectPeak measurement: Peak areaRead delay: 0 secRead time: 5 secOutput: To printer
GRAPHITE FURNACE SETTINGS:
Tube/platform: L’vov platform, pyrolytically coatedCarrier gas: Argon (high purity)
FURNACE PROGRAM:
Step T(°C) Time (sec) Internal GasRamp Hold Flow (mL/min)
1 130 10 50 2002 1000 10 20 2003 100 1 5 2004 2400 0 5 05 2500 1 4 300
AUTOSAMPLER PROGRAM:
Solution: Volume (µL):
Sample 15Blank 0Modifier 1 15Modifier 2 0
Number of injections: 1Recalibrate after positions: 16, 28, and 40
STANDARDS: 0, 7, 14, and 21 ppb prepared from 1000 ppm Ricca standard in0.2 M HNO3.
III.170

MATRIX MODIFIERS: (1) Dilute NH3, prepared in quartz-distilled water by isothermaldistillation(2) none
APPROXIMATE SENSITIVITY: Approximately 0.160 A-sec with 15 µL of 7 ng/ml.
III.171

6.11. Copper
METHOD: Graphite furnace atomic absorption
INSTRUMENTATION:
Spectrophotometer: Perkin-Elmer Z3030Graphite furnace: Perkin-Elmer HGA 600Autosampler: Perkin-Elmer AS 60Printer: Apple Imagewriter
ATOMIC ABSORPTION SPECTROPHOTOMETER SETTINGS:
Wavelength: 324.8 nmSlit width: 0.7 nmLamp: Cu HCL, 15 mABackground correction: Zeeman effectPeak measurement: Peak areaRead delay: 0 secRead time: 5 secOutput: To printer
GRAPHITE FURNACE SETTINGS:
Tube/platform: L’vov platform, pyrolytically coatedCarrier gas: Argon (high purity)
FURNACE PROGRAM:
Step T(°C) Time (sec) Internal GasRamp Hold Flow (mL/min)
1 110 10 35 2002 500 10 20 2003 100 1 5 2004 1600 0 5 05 2500 1 4 300
AUTOSAMPLER PROGRAM:
Solution: Volume (µL):
Sample 10Blank 0Modifier 1 5Modifier 2 0
Number of injections: 1Recalibrate after positions: 16, 28, and 40
STANDARDS: 0, 20, 40, and 60 ppb prepared from 1000 ppm Ricca standard in0.2 M HNO3.
III.172
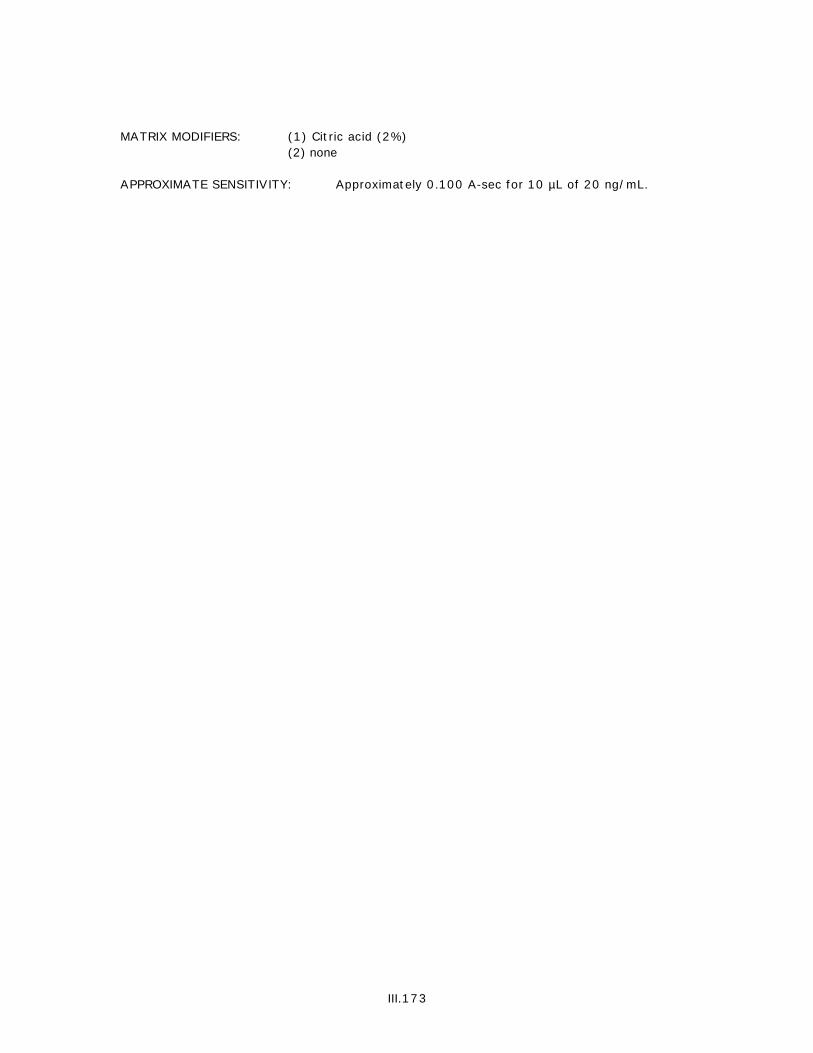
MATRIX MODIFIERS: (1) Citric acid (2%)(2) none
APPROXIMATE SENSITIVITY: Approximately 0.100 A-sec for 10 µL of 20 ng/mL.
III.173
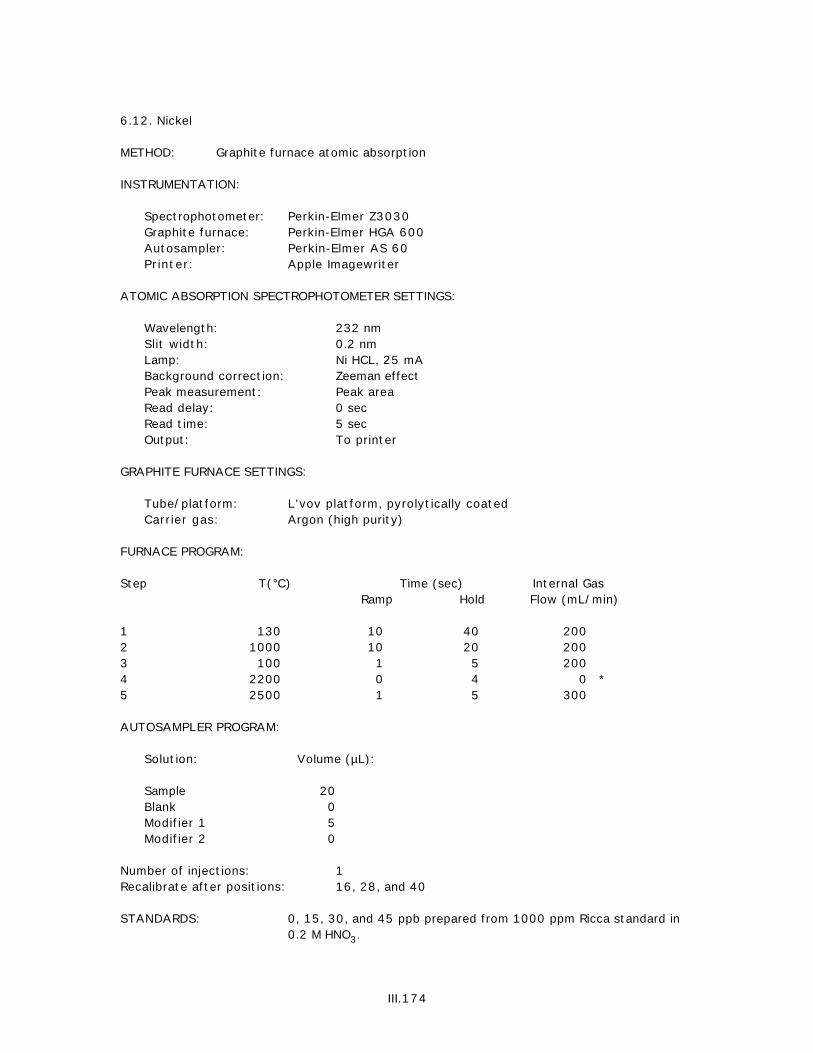
6.12. Nickel
METHOD: Graphite furnace atomic absorption
INSTRUMENTATION:
Spectrophotometer: Perkin-Elmer Z3030Graphite furnace: Perkin-Elmer HGA 600Autosampler: Perkin-Elmer AS 60Printer: Apple Imagewriter
ATOMIC ABSORPTION SPECTROPHOTOMETER SETTINGS:
Wavelength: 232 nmSlit width: 0.2 nmLamp: Ni HCL, 25 mABackground correction: Zeeman effectPeak measurement: Peak areaRead delay: 0 secRead time: 5 secOutput: To printer
GRAPHITE FURNACE SETTINGS:
Tube/platform: L’vov platform, pyrolytically coatedCarrier gas: Argon (high purity)
FURNACE PROGRAM:
Step T(°C) Time (sec) Internal GasRamp Hold Flow (mL/min)
1 130 10 40 2002 1000 10 20 2003 100 1 5 2004 2200 0 4 0 *5 2500 1 5 300
AUTOSAMPLER PROGRAM:
Solution: Volume (µL):
Sample 20Blank 0Modifier 1 5Modifier 2 0
Number of injections: 1Recalibrate after positions: 16, 28, and 40
STANDARDS: 0, 15, 30, and 45 ppb prepared from 1000 ppm Ricca standard in0.2 M HNO3.
III.174

MATRIX MODIFIERS: (1) 2:2:1 Pd (1000 ppm) : La (1000 ppm) : MgNO3 (2 %)(2) none
APPROXIMATE SENSITIVITY: Approximately 0.150 A-sec for 20 µL of 30 ng/mL.
III.175

6.13. Lead
METHOD: Graphite furnace atomic absorption
INSTRUMENTATION:
Spectrophotometer: Perkin-Elmer Z3030Graphite furnace: Perkin-Elmer HGA 600Autosampler: Perkin-Elmer AS 60Printer: Apple Imagewriter
ATOMIC ABSORPTION SPECTROPHOTOMETER SETTINGS:
Wavelength: 283.3 nmSlit width: 0.7 nmLamp: Pb EDL, 10 WBackground correction: Zeeman effectPeak measurement: Peak areaRead delay: 0 secRead time: 5 secOutput: To printer
GRAPHITE FURNACE SETTINGS:
Tube/platform: L’vov platform, pyrolytically coatedCarrier gas: Argon (high purity)
FURNACE PROGRAM:
Step T(°C) Time (sec) Internal GasRamp Hold Flow (mL/min)
1 130 10 45 2002 800 10 15 2003 100 1 5 2004 1800 0 5 05 2500 1 5 300
AUTOSAMPLER PROGRAM:
Solution: Volume (µL):
Sample 20Blank 0Modifier 1 10Modifier 2 0
Number of injections: 1Recalibrate after positions: 16, 28, and 40
STANDARDS: 0, 10, 20, and 30 ppb prepared from 1000 ppm Ricca standard in0.2 M HNO3.
III.176

MATRIX MODIFIERS: (1) 1:1 ammonium phosphate (4%, prepared from ammoniumdihydrogen orthophosphate) and citric acid (2 %)(2) none
APPROXIMATE SENSITIVITY: Approximately 0.160 A-sec for 20 µL of 30 ng/mL.
III.177

6.14. Selenium
METHOD: Graphite furnace atomic absorption
INSTRUMENTATION:
Spectrophotometer: Perkin-Elmer Z3030Graphite furnace: Perkin-Elmer HGA 600Autosampler: Perkin-Elmer AS 60Printer: Apple Imagewriter
ATOMIC ABSORPTION SPECTROPHOTOMETER SETTINGS:
Wavelength: 196.0 nmSlit width: 0.7 nmLamp: Se EDL, 6 WBackground correction: Zeeman effectPeak measurement: Peak areaRead delay: 0 secRead time: 5 secOutput: To printer
GRAPHITE FURNACE SETTINGS:
Tube/platform: L’vov platform, pyrolytically coatedCarrier gas: Argon (high purity)
FURNACE PROGRAM:
Step T(°C) Time (sec) Internal GasRamp Hold Flow (mL/min)
1 130 10 50 2002 900 10 15 2003 100 1 5 2004 2300 0 5 05 2500 1 4 300
AUTOSAMPLER PROGRAM:
Solution: Volume (µL):
Sample 20Blank 0Modifier 1 10Modifier 2 0
Number of injections: 1Recalibrate after positions: 16, 28, and 40
STANDARDS: 0, 25, 50, and 75 ppb prepared from 1000 ppm Ricca standard in0.2 M HNO3.
III.178

MATRIX MODIFIERS: (1) 5:3:1 Pd (1000 ppm) : Ni (4000 ppm) : hydroxylaminehydrochloride (2%)(2) none
APPROXIMATE SENSITIVITY: Approximately 0.140 A-sec for 20 µL of 50 ng/mL.
III.179

6.15. Tin
METHOD: Graphite furnace atomic absorption
INSTRUMENTATION:
Spectrophotometer: Perkin-Elmer Z3030Graphite furnace: Perkin-Elmer HGA 600Autosampler: Perkin-Elmer AS 60Printer: Apple Imagewriter
ATOMIC ABSORPTION SPECTROPHOTOMETER SETTINGS:
Wavelength: 286.3 nmSlit width: 0.7 nmLamp: Sn EDL, 8 WBackground correction: Zeeman effectPeak measurement: Peak areaRead delay: 0 secRead time: 5 secOutput: To printer
GRAPHITE FURNACE SETTINGS:
Tube/platform: L’vov platform, pyrolytically coatedCarrier gas: Argon (high purity)
FURNACE PROGRAM:
Step T(°C) Time (sec) Internal GasRamp Hold Flow (mL/min)
1 130 10 50 2002 800 10 10 2003 100 1 5 2004 2100 0 5 05 2300 1 4 300
AUTOSAMPLER PROGRAM:
Solution: Volume (µL):
Sample 20Blank 0Modifier 1 10Modifier 2 0
Number of injections: 1Recalibrate after positions: 16, 28, and 40
STANDARDS: 0, 10, 25, and 50 ppb prepared from 1000 ppm Ricca standard in0.2M HCl.
III.180

MATRIX MODIFIERS: (1) 1:1 magnesium nitrate (0.2 %) and ammonium phosphate (4%,prepared from ammonium dihydrogen orthophosphate)(2) none
APPROXIMATE SENSITIVITY: Approximately 0.200 A-sec for 20 µL of 50 ng/ml.
III.181

6.16. Aluminum
METHOD: Instrumental neutron activation analysis for Al in sediments
INSTRUMENTATION:
TRIGA 1 MW reactorOrtec high-resolution germanium detectorNuclear Data Genie MCA
IRRADIATION CONDITIONS:
Position: PneumaticsNominal neutron flux: 1 x 10¹³ neutrons/cm2/secLength of irradiation: 30 secCooling period: 15 minPeak measurement: Net peak area using Nuclear Data peak program
COUNTING CONDITIONS:
Counting position: 2-10 cmg-ray peak energy: 1779 KeVCount time: 300 sec
STANDARDS:
Pure element standards: 0.01 g prepared from 1000 ppm Ricca standard.Matrix standards: 0.1 g of: TAMU HS2* , USGS GXR-5, NBS 1646, NRC BCSS-
1.
SAMPLE PREPARATION: Approximately 0.1 g weighed to nearest 0.0001 g into 0.4-dram polyethylene vials.
APPROXIMATE SENSITIVITY: Depends upon background; 100 µg results in approximately1000 counts with associated counting error of 10 %; withtypical background and 0.1 g sample size, this correspondsto 0.1% Al.
* TAMU HS2 is a "house" reference sediment standard collected using a box corer in the Mississippi river delta. The sedimentwas washed several times in distilled water to remove dissolved salts, freeze dried, ground with a mortar and pestle, andhomogenized.
III.182

6.17. Chromium
METHOD: Instrumental neutron activation analysis for Cr in sediments
INSTRUMENTATION:
TRIGA 1 MW reactorOrtec high-resolution germanium detectorNuclear Data Genie MCA
IRRADIATION CONDITIONS:
Position: RotisserieNominal neutron flux: 1 x 10¹³ neutrons/cm2/secLength of irradiation: 14 hrCooling period: 10 daysPeak measurement: Net peak area using Nuclear Data peak program
COUNTING CONDITIONS:
Counting position: 10 cmg-ray peak energy: 320.1 KeVCount time: 60 min
STANDARDS:
Pure element standards: 1000 µg prepared from 1000 ppm Ricca standard.Matrix standards: 0.5 g of: TAMU HS2, USGS GXR-5, NBS 1646, NRC
BCSS-1.
SAMPLE PREPARATION: Approximately 0.5 g weighed to nearest 0.0001 g into 0.4-dram polyethylene vials.
APPROXIMATE SENSITIVITY: Depends upon background; 1 µg results in approximately1000 counts with associated counting error of 15%; withtypical background and 0.5 g sample size, this correspondsto 2 ppm Cr.
III.183

6.18. Iron
METHOD: Instrumental neutron activation analysis for Fe in sediments
INSTRUMENTATION:
TRIGA 1 MW reactorOrtec high-resolution germanium detectorNuclear Data Genie MCA
IRRADIATION CONDITIONS:
Position: RotisserieNominal neutron flux: 1 x 10¹³ neutrons/cm2/secLength of irradiation: 14 hrCooling period: 10 daysPeak measurement: Net peak area using Nuclear Data peak program
COUNTING CONDITIONS:
Counting position: 10 cmg-ray peak energy: 1099.2 KeVCount time: 60 min
STANDARDS:
Pure element standards: 0.01 g prepared from 1000 ppm Ricca standard.Matrix standards: 0.5 g of: TAMU HS2, USGS GXR-5, NBS 1646, NRC
BCSS-1.
SAMPLE PREPARATION: Approximately 0.5 g weighed to nearest 0.0001 g into 0.4-dram polyethylene vials.
APPROXIMATE SENSITIVITY: Depends upon background; 150 µg results in approximately1000 counts with associated counting error of 10%; withtypical background and 0.5 g sample size, this correspondsto 300 ppm Fe.
III.184
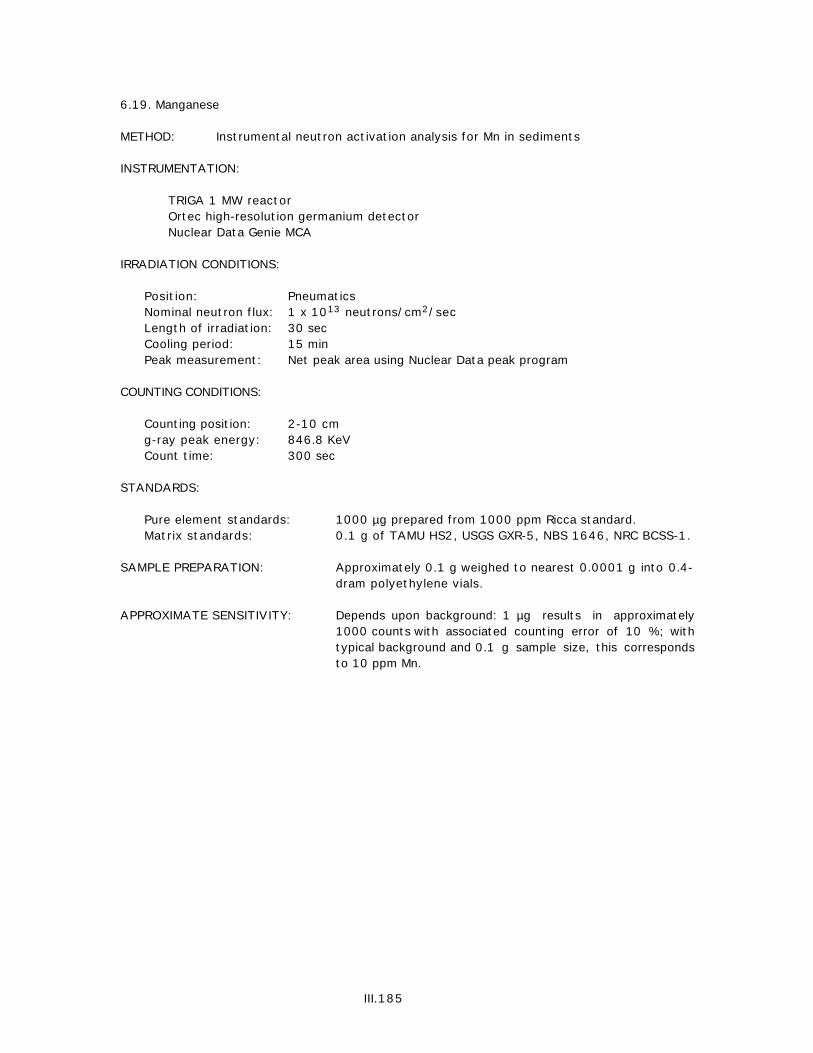
6.19. Manganese
METHOD: Instrumental neutron activation analysis for Mn in sediments
INSTRUMENTATION:
TRIGA 1 MW reactorOrtec high-resolution germanium detectorNuclear Data Genie MCA
IRRADIATION CONDITIONS:
Position: PneumaticsNominal neutron flux: 1 x 10¹³ neutrons/cm2/secLength of irradiation: 30 secCooling period: 15 minPeak measurement: Net peak area using Nuclear Data peak program
COUNTING CONDITIONS:
Counting position: 2-10 cmg-ray peak energy: 846.8 KeVCount time: 300 sec
STANDARDS:
Pure element standards: 1000 µg prepared from 1000 ppm Ricca standard.Matrix standards: 0.1 g of TAMU HS2, USGS GXR-5, NBS 1646, NRC BCSS-1.
SAMPLE PREPARATION: Approximately 0.1 g weighed to nearest 0.0001 g into 0.4-dram polyethylene vials.
APPROXIMATE SENSITIVITY: Depends upon background: 1 µg results in approximately1000 counts with associated counting error of 10 %; withtypical background and 0.1 g sample size, this correspondsto 10 ppm Mn.
III.185

III.186

Analysis of Marine Sediment and Bivalve Tissue by X-Ray Fluorescence,Atomic Absorption and Inductively Coupled Plasma Mass Spectrometry
E. Crecelius, C. Apts, L. Bingler, O. Cotter, S. Kiesser, and R. SandersBattelle/Marine Sciences Laboratory
1529 West Sequim Bay Rd.Sequim, Washington 98382
ABSTRACT
Analytical chemistry techniques including atomic absorption spectrophotometry,inductively coupled plasma mass spectrometry (ICP-MS) and energy dispersive x-rayfluorescence (XRF) have been applied to the analysis of 17 elements in aquaticsediment and bivalve tissue in support of the NOAA NS&T Program. Complete aciddigestion of samples at elevated pressure and temperature in a sealed Teflon containerminimizes contamination and loss of elements. Multielemental techniques such as ICP-MS and XRF provide sensitive, accurate, and precise results for a variety of elementsat a reasonable cost.
1. INTRODUCTION
Methods used for analysis of 17 metals in estuarine sediments and tissues were developed aspart of the Mussel Watch Project of the National Status and Trends (NS&T) Program. The totaldigestion procedure used for sediments, without loss of volatile elements, was developed byTaylor and Presley at Texas A&M University (TAMU) (this volume). The digestion procedurefor tissues was either a modification of the microwave digestion method described byPatterson, Veillon, and Kingston (1988) or a modified TAMU procedure. Metals were analyzedpredominantly by graphite furnace atomic absorption (GFAA) spectrometry and x-rayfluorescence (XRF). Mercury was analyzed by cold vapor atomic absorption (CVAA) and Snwas analyzed using a hydride generation procedure. Selected metals were determined byinductively-coupled plasma mass spectrometry (ICP-MS). The primary objective in developingeach instrumental method was to keep the method as simple and straightforward as possiblewhile producing acceptable accuracy and precision.
It is expected that users of the instrumental methods described below will modify certainparameters to suit their particular instrumentation and equipment due to variations inperformance between instruments. Such variations are caused by differences in furnacecalibration, lamp intensities, nebulizer characteristics, and other parameters.
2. EQUIPMENT AND SUPPLIES
2.1. Instrumentation
Perkin-Elmer model Z/5000 spectrophotometer. Perkin-Elmer, Norwalk, CT.
Dual lamp EDL power supplyModel 500 graphite furnace atomizer with Zeeman background correction systemModel 3600 data terminalModel AS40 autosampler
III.187

Perkin-Elmer model Z/3030 spectrophotometer
Dual lamp EDL power supplyModel 600 graphite furnace atomizer with Zeeman background correction systemModel AS60 autosamplerModel PRS 100 printer
Laboratory Data Control atomic absorption spectrophotometer, LDC UV 1235. Laboratory DataControl, Division of Milton Roy Co., Riviera, FL.
Dual-voltage variable auto transformer (Statco model 2PF1010)Flow meter, 0-150 mm. Cole-Parmer Instrument Co., Chicago, IL.Integrator CR6A. Shimadzu, Columbia, MD.
CEM Microwave digestion system (model MDS-81D). CEM Corp., Mathews, NC.
Pressure monitor. CEM Corp., Mathews, NC.
KEVEX x-ray fluorescence excitation and detection subsystem, 0810Z. Fisons Instruments,San Carlos, CA.
Canberra series 80 multichannel analyzer. Canberra Nuclear Products, Merider, CT.Digital PDP-11/34A computer operating systemDigital RL01 floppy disc driveDigital RL01 hard disc driveDigital video terminal (model 102)KEVEX 4620 detector bias supplyKEVEX high voltage generatorPHA/LTC model 8623 amplifierVersatec printer/plotter. Versatec Inc., Santa Clara, CA.
VG Plasma Quad 2+ inductively-coupled plasma mass spectrometer. Fisons Instruments,Danvers, MA.
Perkin-Elmer model 5000 inductively coupled plasma mass spectrometer
2.2. Supplies
Air mixture Hollow cathode lamps (HCL)Argon, 99.999% purity HydrogenElectrodeless discharge lamps (EDL) Laboratory press, 3.2-cm diameter, 27,000
kgElectron multiplier, model 4870V, Galileochanneltron. Galileo Inc., Sturbridge,MA.
Nitrogen, ultra-purePlatforms, pyrolytically coated L'vov,
Perkin-Elmer B0121-091Four-way valve, SRV-4. Pharmacia Co.,Piscataway, NJ. Quartz torch
Gold foil, Speyer, Inc. Sample cones, nickelGraphite tubes, pyrolytically coated,
grooved, Perkin-Elmer B0121-092.Perkin-Elmer, Norwalk, CT.
Skimmer cones, nickelThin film standards. Micro Matter,
Eastsound, WAGraphite tubes, pyrolytically coated, non-
grooved, Perkin-Elmer B0135-653.Perkin-Elmer, Norwalk, CT.
UV source lamp, LDC G4T4\1. LaboratoryData Control, Division of Milton Roy Co.,Riviera, FL.
Helium
III.188

2.3. Labware
Balance, Mettler model AC100 and H30,Sartorius MCI LAB LC1200 S
Mixer/Mills, model 8000. Spex Industries,Edison, NJ.
Bomb lids, 120-mL, Teflon perfluoralkoxy(PFA), double-ported, 0104-4-2.Savillex, Minnetonka, MN.
Oven, stainless steel, Imperial II RadiantHeat Oven. Lab Line Inc., Melrose Park,IL.
Bombs, 60-mL, Teflon perfluoralkoxy (PFA)bomb, 561R2; 120-mL, Teflonperfluoralkoxy (PFA), 577. Savillex,Minnetonka, MN.
Pipets, macro and microPolyethylene tubing, 7420. Clay Adams Co.,
Parsippany, NJ.Spatulas
Capping station. CEM Corp., Mathews, NC. Stopwatch or timerCups, 2-mL, polystyrene, B2713-2. Baxter,
McGaw Park, IL.Syringe needles, 3-mL, 72-38D. Pharmaseal
Inc., Glendale, CA.Flask, volumetric, polyethylene, 100-mL Teflon tubing, 1-mm i.d.Freeze dryers, 6206-0101. Virtis Co.,
Gardiner, NY.Test tube, 5-inch, glassVials, 20-mL, polyethylene, threaded, with
screw caps, Kimble 66022-241Jars, 125-mL, polystyrene, 8002. SpexIndustries, Edison, NJ. Vials, dry grinding, ceramic, 8003. Spex
Industries, Edison, NJ.Methacrylate balls, 3112. Spex Industries,Edison, NJ.
Polyethylene vials were cleaned by soaking for five days in 5% HNO3, at room temperature,rinsed with deionized water and dried in Class 100 laminar flow hoods. All other plasticwarewas soaked for three days in 10% HNO3 at room temperature, rinsed with deionized water,and dried as above. Teflon bombs were soaked for two days in 50% concentrated HNO3.
2.4. Reagents
All reagents are ultrapure grades except where so designated.
Acetic acid (CH3COOH) [64-19-7], glacial(99%), 9524-33. J. T. Baker, Phillips-burg, NJ.
Hydrofluoric acid (HF) [7664-39-3], Instra-analyzed, 9563-01. J. T. Baker,Phillipsburg, NJ.
Magnesium nitrate [Mg(NO3)2. 6H2O]
[13446-18-9], solid, Puratonic Grade.Johnson Matthey Chemicals, WestChester, PA.
Ammonium dihydrogen phosphate (NH4H2PO4)[7722-76-1], Ultrex 7-9431. J. T.Baker, Phillipsburg, NJ.
Ammonium nitrate (NH4NO3) [6484-52-2],,solid, reagent grade, 729-1. J. T. Baker,Phillipsburg, NJ.
Nickel nitrate [Ni(NO3)2 . 6H2O] [13478-00-
7], solid, Puratonic Grade. JohnsonMatthey Chemicals, West Chester, PA.Ascorbic acid (C6H8O6) [50-81-7], solid,
reagent grade, 581-5. J. T. Baker,Phillipsburg, NJ.
Nitric acid (HNO3) [7697-37-2], concen-trated (70%), Instra-analyzed, 9598-33. J. T. Baker, Phillipsburg, NJ.Atomic absorption standards, 1000 µg/mL.
High-Purity Standards, Inc., Charleston,SC
Perchloric acid (HClO4) [7601-90-3],concentrated (70%), 230. G. FrederickSmith, Columbus, OH.Hydrochloric acid (HCl) [7647-01-0],
concentrated (37%), Instra-analyzed,9530-33. J. T. Baker, Phillipsburg, NJ.
III.189

Soda lime [variable mixture of NaOH andCaO/Ca(OH)2] [8006-28-8], 4-8 mesh,used as acid fume trap in CVAA, 3448-01. J. T. Baker, Phillipsburg, NJ.
Sulfuric acid (H2SO4) [7664-93-9], con-centrated (98%), Instra-analyzed,9673-33. J. T. Baker, Phillipsburg, NJ.
Water, deionized, 10 megohm-cm re-sistivity.Stannous chloride (SnCl2 . 2H2O) [10025-
69-1], 3980-01. J. T. Baker,Phillipsburg, NJ.
2.5. Solvents and matrix modifiers
Ammonium phosphate: 2%, monobasic, 2 g of NH4H2PO4 and 0.200 g of Mg(NO3)2 per literof deionized water.
Ammonium phosphate: 4%, monobasic, 4 g NH4H2PO4 and 13 g NH4NO3 diluted to 100 mLwith deionized water.
Magnesium nitrate solution: 250 mg/L of deionized water.0.10 M Nickel nitrate: 2.91 g Ni(NO3)2
.6H2O in 100 mL of deionized water.2 N Acetic acid: Dilute 11.5 mL of glacial acetic acid (99.7%) to 100 mL with deionized
water.Sulfuric acid modifier solution: Dilute 1 mL of concentrated sulfuric acid to 99 mL with
deionized water and add 10 µL of 0.1 M Ni(NO3)2.6H2O.
3. SAMPLE TREATMENT
3.1. Drying and homogenization
3.1.1. Sediments
Sediments were collected with a grab sampler that collects the top 2 cm of surface sediment.Sample aliquots were weighed, freeze-dried for approximately 5 days to constant weight in125-mL polystyrene Spex jars in a freeze dryer, and reweighed to determine percent dryweight. Approximately 3 g were ground for 5 min using a Spex ceramic ball mill. Aliquots of0.5 g were used for X-ray fluorescence, or digested for atomic absorption or ICP-MSanalysis.
3.1.2. Tissues
Bivalves were hand-collected and shucked at the lab. Tissues were freeze-dried in Spex jarsand homogenized using methacrylate balls in a Spex mixer/mill.
3.2. Digestion
Battelle used minor modifications of the total digestion techniques for sediments and tissuesdeveloped by Taylor and Presley (this volume).
Two reagent blanks and three standard reference material samples are included in eachanalytical string of 50 samples. Reagent blanks contain no sediment or tissue and areprocessed like the samples.
III.190

3.2.1. Sediments
Approximately 200 ± 7 mg of homogenized ground dried sediment was weighed into a tared60-mL Teflon digestion bomb. One mL of 4:1 HNO3/HClO4 was added to each bomb and thelid tightened at the capping station.
The bombs were heated in the oven at 130 ± 10°C for 4 hr and allowed to cool.
Three mL of concentrated HF were added to each bomb, rinsing the walls of the bomb toinsure that all solids were washed down into the acid mixture. The lid was tightened at thecapping station.
The bombs were heated in the oven at 130 ± 10°C for 8 hr and allowed to cool.
The bombs were opened and the digestates diluted to approximately 20 mL with deionizedwater.
The solutions were weighed in the Teflon bombs and the volume calculated using a densityfactor of 1.05 g/mL.
The contents of each bomb were transferred quantitatively to a 20-mL polyethylenescrew-cap vial for storage prior to analysis.
Digestates can be analyzed directly by GFAA or CVAA. Before analysis by ICP-MS, a 10-mLaliquot was transferred to a Teflon bomb and dried slowly, uncovered, on a hot plate (203°C)in a perchloric acid hood to eliminate chloride and fluoride. White fumes are indicative ofsuccessful elimination of these elements. The dried digestate was dissolved in 1 mL of 10%HNO3 and heated again to dryness. The dried digestate is dissolved again with 1 mL of 10%HNO3 and 9 mL of deionized water.
3.2.2. Tissues
Approximately 500 ± 15 mg of homogenized, dried sediment was weighed into a tared 60-mL Teflon digestion bomb. Three mL of 4:1 HNO3/HClO4 was added to each bomb and the lidscrewed on but not tightened.
The bombs were placed in a cold water bath in a perchloric hood and the water bath washeated slowly to 60 ± 3°C. Perchloric acid ignites in the presence of organics compoundsif heated rapidly. The temperature was raised to 95 ± 5°C to eliminate NOx fumes. Thetotal heating time was 3 to 4 hr.
The bombs were allowed to cool. The lids were tightened at the capping station.
The bombs were heated in the oven at 130 ± 10°C for 4 hr and allowed to cool.
The bombs were opened and the digestates diluted to approximately 20 mL with deionizedwater.
The solutions were weighed in the Teflon bombs and the volume calculated using a densityfactor of 1.04 g/mL.
Digestates were analyzed directly by GFAA and CVAA, or diluted 10:1 for ICP-MS analysis.
III.191

3.3. Microwave digestion
The microwave digestion was conducted in a CEM model MDS-81D oven equipped with a 12-sample carousel and a pressure monitor. The pressure monitor tube was connected to one ofthe digestion bombs allowing the pressure to be monitored during the entire digestion. Thecarousel rotated in an alternating direction so the pressure monitoring tube was not twisted.
Approximately 300 ± 5 mg of dried, homogenized sample was weighed into a tared 120-mLTeflon digestion bomb. Five mL of concentrated HNO3 were added to each bomb and the lidstightened at the capping station.
The digestion program should allow a minimum of 20 minutes at 85-95 psi.
When digestion was completed, the bombs were allowed to cool and the pressure releasedslowly and carefully.
Each sample was transferred quantitatively to a tared polyethylene scintillation vial. Eachbomb was rinsed three times with 5-mL portions of deionized water and the rinsings addedto the vial. The lid was rinsed with one additional 5-mL portion of deionized water and therinsing added to the vial.
The vials were weighed and the average density of three representative digestates permatrix was determined. The final volume of each sample was calculated by dividing thedigestate weight by the average density.
4. CALIBRATION
Calibration standards were prepared by serial dilution of commercially available atomicabsorption standards using class-A glass pipets, volumetric flasks, and 10% HNO3. Somemetals, such as Sb and Sn, require use of a different acid diluent. Final working standards areprepared in 1% HNO3 or the appropriate acid diluent, using micropipets and glass volumetricflasks. The element concentrations in each standard should be sufficient to cover theappropriate range of sample concentrations and produce good measurement precision andaccurately define the slope of the response curve. Concentrations of commercial standards areverified by comparison with National Institute of Standards and Technology (NIST)spectrophotometric standards.
5. SPECTRAL INTERFERENCES
Spectral interferences may be minimized by sample dilution, use of an alternate analytewavelength, or selective volatilization of the analyte. Non-spectral interferences may bedetected and compensated for using the method of standard additions. Matrix modifiers thatare used include Mg(NO3)2, NH4H2PO4, Ni(NO3)2, and H2SO4. Their specific use is described inthe instrumental analysis section for each element.
III.192

6. CALCULATIONS
6.1. Graphite furnace and ICP-MS
Sample concentrations are determined from calibration results and from the dilution factorsusing the following equation:
Concentration (µg/g dry wt) = (SA - B A) m SV
1000 (SDW) (DF)
where SA is the sample absorbance or intensity value, BA is the procedural blank absorbanceor intensity value, m is the slope of standard addition calibration line, SV is the samplevolume, SDW is the sample dry weight in grams, and DF is the dilution factor.
6.2. Cold vapor atomic absorption
Sample concentrations are determined from calibration results and from the dilution factorsinvolved in instrumental analysis and sample digestion according to the following equation:
Concentration (µg/g dry wt) = (SA - B A) m SV
1000 (SDW) (DF)
where SA is the sample absorbance value, BA is the procedural blank absorbance value, m isthe slope of the calibration line, SV is the sample volume, SDW is the sample dry weight ingrams, and DF is the dilution factor.
6.3. X-ray fluorescence
This procedure uses energy dispersive x-ray fluorescence spectroscopy to quantify elementalconcentrations in sediment and tissue samples (Nielson et al., 1982). Thebackscatter/fundamental parameter approach using the SAP3 computer code incorporates thinfilm standards and scattering rations to produce matrix corrections (Nielson and Sanders,1982).
Thin film standards are used for the determination of intensity in count/min/µg(element)/cm2 versus element energy in KeV. Thin film standards produced by vapor depositof the elements on Mylar or polycarbonate substrate are available from Micro Matter ofEastsound, Washington. These standards are traceable to the U.S. National Institute ofStandards and Technology.
The peak analysis and elemental concentration sections of the computer program (SAP3) usearrays of fundamental physical parameters of x-ray energies, mass adsorption coefficients,cross sections, fluorescence yields, absorption edge, and jump ratios to perform the matrixcorrections for relating net peak intensities to element concentrations. These arrays are readinto the computer from a disc file when the program in initiated. Each excitation source has itsown unique disc file or library. Thin film sensitivities or calibration factors of thespectrometer using the intended excitation source is also part of the library.
III.193

7. CONCLUSIONS
A variety of analytical instruments provide the optimum method for the analysis of 17elements in sediment and bivalve tissue. The advantage of XRF is that the sample does notrequire digestion but is analyzed as a dry powder. Crustal elements such as Al, Cr, Fe, Ni, andSi, that are difficult to dissolve in sediment, can be quantified by XRF. Also, Se and As can bedifficult to quantify in tissue digestates by MS but can be quantified simpler by XRF. ICP-MShas the advantage of simultaneous analysis of many elements with detection limits much lowerthan the XRF and similar to those of GFAA. Elements that are particularly sensitive andrelatively interference free by ICP-MS include Ag, Cd, Pb, Sb, Sn, and Tl. Cold vapor atomicabsorption with gold amalgamation is a very sensitive and reliable technique for Hg analysis.Care must be taken to avoid leakage at high pressure or Hg can be lost during digestion. Withthe use of the sealed Teflon digestion vessel, mercury can be analyzed from the samedigestion as the other metals.
The advantage of freeze drying both sediment and tissue is that the dry material is easilyground or homogenized. No Hg loss occurs during freeze drying. The microwave digestion withnitric acid is an ideal matrix for ICP-MS analysis of tissue. Sediment digestates must receivespecial treatment to remove silicon, fluoride and perchloric acid before analysis by ICP-MS.Analysis by GFM requires matrix modifiers and standardization of the instrument by methodof addition to the sample matrix to provide accurate results.
8. REFERENCES
Nielson, K. K., and R. W. Sanders (1982) The SAP3 computer program for quantitative multi-element analysis by energy-dispersive x-ray fluorescence. PNL-4173, Battelle PacificNorthwest Laboratory, Richland, WA. 120 pp.
Nielson, K. K., R. W. Sanders, and J. C. Evans (1982) Analysis of steels by energy-dispersivex-ray fluorescence with fundamental parameters. Anal. Chem., 54(11):1782-6.
Patterson, K. Y., C. Veillon, and H. M. Kingston (1988) Microwave digestion of biologicalsamples. In: Introduction to Microwave Sample Preparation. H. M. Kingston and L. B. Jassie(eds.). 155-66. ACS Professional Reference Book, American Chemical Society, Washington,DC.
III.194

9. INSTRUMENTAL ANALYSIS
9.1. Atomic absorption spectrometry
9.1.1. Aluminum
Graphite furnace atomic absorption for tissue
METHOD: Graphite furnace atomic absorption
DIGEST MATRIX: ~15% 4:1 HNO3:HClO4 by volume.
INSTRUMENT SETTINGS:
Wavelength: 309.3 nmLamp: HCL, 25 ma (Perkin-Elmer 0303-6009)Tube: Non-platform, pyrolytically coatedCarrier gas: ArgonSlit width: 0.7Background correction: ZeemanSignal mode: Peak heightScale expansion: NoneRead time: 5 secOutput: Recorded from spectrophotometer display
FURNACE PROGRAM:
Step T(°C) Time (sec) Internal GasRamp Hold Flow (mL/min)
Dry 1 80 9 1 300Dry 2 140 45 5 300Dry 3 250 20 5 300Char 1600 45 25 300Atomize 2300 0 4 50Cleanout 2650 1 3 300Cool 20 1 10 300
STANDARDS: Addition calibration using 22.2, 43.5, and 83.3 µg/L Al to CRMDOLT-1 tissue digestate. Method of standard addition.
TYPICAL SENSITIVITY: Absorbance is approximately 0.100 for 0.4 µg Al standard.
CALIBRATION: Peak height versus concentration of standards used to compute theslope, intercept, and correlation coefficient of calibration lineusing linear, least-squares regression.
INJECTION VOLUME: 5 µL
MATRIX MODIFIER: 5 µL of 2% NH4H2PO4.
III.195

9.1.2. Chromium
Graphite furnace atomic absorption for tissue
METHOD: Graphite furnace atomic absorption
DIGEST MATRIX: ~15% 4:1 HNO3:HClO4 by volume.
INSTRUMENT SETTINGS:
Wavelength: 357.9 nmLamp: HCL, 25 ma (Perkin-Elmer 0303-6021)Tube: Pyro, non-platformCarrier gas: ArgonSlit width: 0.7Background correction: ZeemanSignal mode: Peak heightScale expansion: NoneRead time: 5 secOutput: Recorded from spectrophotometer display
FURNACE PROGRAM:
Step T(°C) Time (sec) Internal GasRamp Hold Flow (mL/min)
Dry 1 80 9 1 300Dry 2 140 45 5 300Dry 3 250 20 5 300Char 1500 20 25 300Atomize 2500 0 4 0Cleanout 2650 1 3 300Cool 20 1 10 300
STANDARDS: Method of standard addition calibration using 20.0, 33.3, and 66.7µg/L Cr to CRM DOLT-1 tissue digestate.
TYPICAL SENSITIVITY: Absorbance is approximately 0.200 for 0.165 µg Cr standard.
CALIBRATION: Peak height versus concentration of standards used to compute theslope, intercept, and correlation coefficient of calibration lineusing linear, least-squares regression.
INJECTION VOLUME: 5 µL
MATRIX MODIFICATION: 5 µL of 250 mg/L Mg as Mg(NO3)2.
III.196

9.1.3. Nickel
Graphite furnace atomic absorption for tissues
METHOD: Graphite Furnace Atomic Absorption
DIGEST MATRIX: ~15% 4:1 HNO3:HClO4 by volume.
INSTRUMENT SETTINGS:
Wavelength: 232.0 nmLamp: HCL, 35 ma (Perkin-Elmer 0303-6047)Tube: Pyro, non-platformCarrier gas: ArgonSlit width: 0.2Background correction: ZeemanSignal mode: Peak heightScale expansion: NoneRead time: 5 secOutput: To printer
FURNACE PROGRAM:
Step T(°C) Time (sec) Internal GasRamp Hold Flow (mL/min)
Dry 1 80 9 1 300Dry 2 140 45 5 300Dry 3 250 20 5 300Char 1200 20 20 300Atomize 2300 0 4 0Cleanout 2650 1 3 300Cool 20 1 10 300
STANDARDS: Method of standard addition calibration using 24.39, 47.62, and90.91 µg/L Ni to CRM DOLT-1 digestate.
TYPICAL SENSITIVITY: Absorbance is approximately 0.100 for 0.6 µg Ni standard.
CALIBRATION: Peak height of standard versus concentration of standard. Computethe slope, intercept, and correlation coefficient using linear,least-squares regression.
INJECTION VOLUME: 5 µL
MATRIX MODIFICATION: 5 µL of 2% NH4H2PO4.
MODIFIER VOLUME: 5 µL
III.197

9.1.4. Selenium
Graphite furnace atomic absorption for sediment
METHOD: Graphite Furnace Atomic Absorption
DIGEST MATRIX: ~4% 4:1 HNO3:HClO4 + 12% HF by volume.
INSTRUMENT SETTINGS:
Wavelength: 195.9 nmLamp: EDL, 6 watts (Perkin-Elmer 0303-6262)Tube: L’vov, pyro coatedCarrier gas: ArgonSlit width: 2.0Background correction: ZeemanSignal mode: Peak heightScale expansion: NoneRead time: 5 secOutput: Recorded from spectrophotometer display
FURNACE PROGRAM:
Step T(°C) Time (sec) Internal GasRamp Hold Flow (mL/min)
Dry 1 80 9 1 300Dry 2 140 45 5 300Dry 3 250 20 5 300Char 1300 20 20 300Atomize 2100 0 4 0Cleanout 2650 1 3 300Cool 20 1 10 300
STANDARDS: Method of standard addition calibration using 47.6, 90.9, and130.4 µg/L Se to CRM MESS-1 sediment digestate.
TYPICAL SENSITIVITY: Absorbance is approximately 0.100 for 1.0 µg Se standard.
CALIBRATION: Peak height of standard versus concentration of standard. Computethe slope, intercept, and correlation coefficient using linear,least-squares regression.
INJECTION VOLUME: 20 µL
MATRIX MODIFICATION: 10 µL of 0.1 M Ni(NO3)2.
III.198

9.1.5. Silver
9.1.5.1. Graphite furnace atomic absorption for tissue
METHOD: Graphite Furnace Atomic Absorption
DIGEST MATRIX: ~15% 4:1 HNO3:HClO4 by volume.
INSTRUMENT SETTINGS:
Wavelength: 327.9 nmLamp: HCL, 12 ma (Perkin-Elmer 0303-6064)Tube: L’vov, pyro coatedCarrier gas: ArgonSlit width: 0.7Background correction: ZeemanSignal mode: Peak heightScale expansion: NoneRead time: 4 secOutput: To printer
FURNACE PROGRAM:
Step T(°C) Time (sec) Internal GasRamp Hold Flow (mL/min)
Dry 1 80 9 1 300Dry 2 140 45 5 300Dry 3 250 20 5 300Char 800 20 20 300Atomize 2100 0 4 0Cleanout 2650 1 3 300Cool 20 1 10 300
STANDARDS: Addition calibration using 0.99, 1.96, and 4.76 µg/L Ag to CRMDOLT-1 tissue digestate.
TYPICAL SENSITIVITY: Absorbance is approximately 0.100 for 0.03 µg Ag standard.
CALIBRATION: Peak height of standard versus concentration of standard. Computethe slope, intercept, and correlation coefficient using linear,least-squares regression.
INJECTION VOLUME: 10 µL
MATRIX MODIFICATION: 5 µL of 2% NH4H2PO4.
III.199

Silver
9.1.5.2. Graphite furnace atomic absorption for sediment
METHOD: Graphite Furnace Atomic Absorption
DIGEST MATRIX: ~4% 4:1 HNO3:HClO4 +12% HF by volume.
INSTRUMENT SETTINGS:
Wavelength: 327.9 nmLamp: HCL, 12 ma (Perkin-Elmer 0303-6064)Tube: L’vov, pyro coatedCarrier gas: ArgonSlit width: 0.7Background correction: ZeemanSignal mode: Peak heightScale expansion: NoneRead time: 4 secOutput: To printer
FURNACE PROGRAM:
Step T(°C) Time (sec) Internal GasRamp Hold Flow (mL/min)
Dry 1 80 9 1 300Dry 2 140 45 5 300Dry 3 250 20 5 300Char 800 20 20 300Atomize 2100 0 4 0Cleanout 2650 1 3 300Cool 20 1 10 300
STANDARDS: Addition calibration using 2.44, 4.76, and 9.09 µg/L Ag to SRM1646 sediment digestate.
TYPICAL SENSITIVITY: Absorbance is approximately 0.120 for 0.05 µg Ag standard.
CALIBRATION: Peak height of standard versus concentration of standard. Computethe slope, intercept, and correlation coefficient using linear,least-squares regression.
INJECTION VOLUME: 10 µL
MATRIX MODIFICATION: 5 µL of 2% NH4H2PO4.
III.200
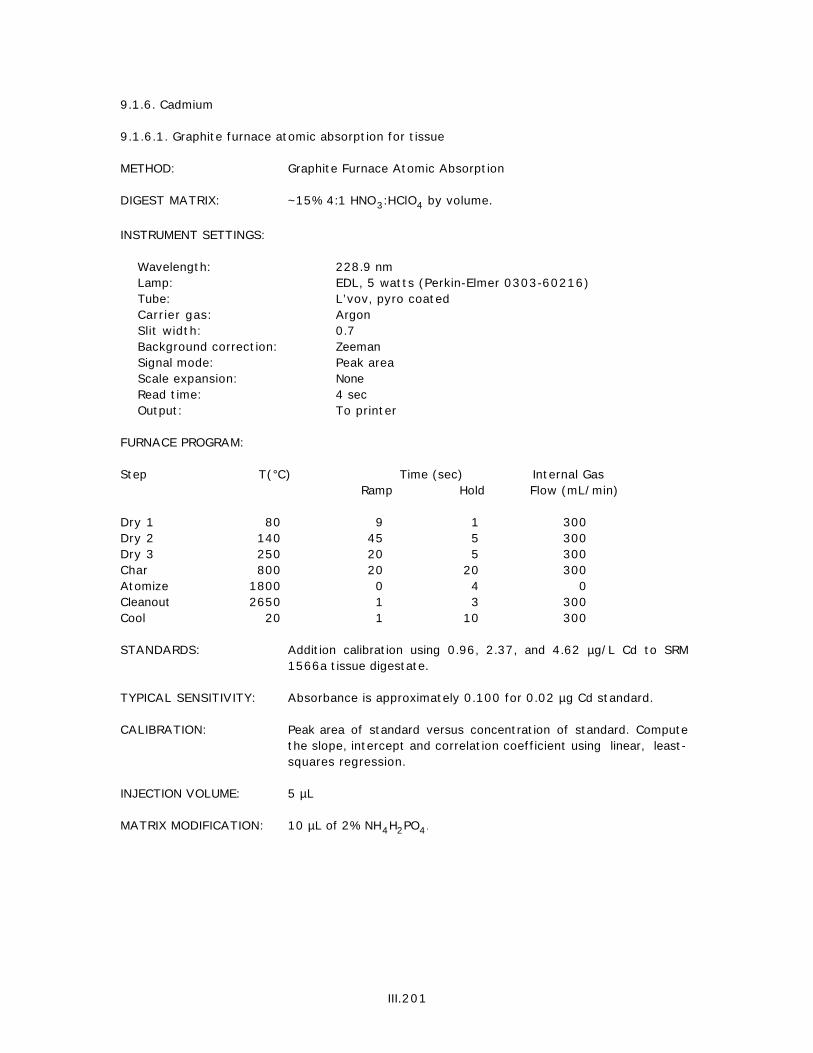
9.1.6. Cadmium
9.1.6.1. Graphite furnace atomic absorption for tissue
METHOD: Graphite Furnace Atomic Absorption
DIGEST MATRIX: ~15% 4:1 HNO3:HClO4 by volume.
INSTRUMENT SETTINGS:
Wavelength: 228.9 nmLamp: EDL, 5 watts (Perkin-Elmer 0303-60216)Tube: L’vov, pyro coatedCarrier gas: ArgonSlit width: 0.7Background correction: ZeemanSignal mode: Peak areaScale expansion: NoneRead time: 4 secOutput: To printer
FURNACE PROGRAM:
Step T(°C) Time (sec) Internal GasRamp Hold Flow (mL/min)
Dry 1 80 9 1 300Dry 2 140 45 5 300Dry 3 250 20 5 300Char 800 20 20 300Atomize 1800 0 4 0Cleanout 2650 1 3 300Cool 20 1 10 300
STANDARDS: Addition calibration using 0.96, 2.37, and 4.62 µg/L Cd to SRM1566a tissue digestate.
TYPICAL SENSITIVITY: Absorbance is approximately 0.100 for 0.02 µg Cd standard.
CALIBRATION: Peak area of standard versus concentration of standard. Computethe slope, intercept and correlation coefficient using linear, least-squares regression.
INJECTION VOLUME: 5 µL
MATRIX MODIFICATION: 10 µL of 2% NH4H2PO4.
III.201
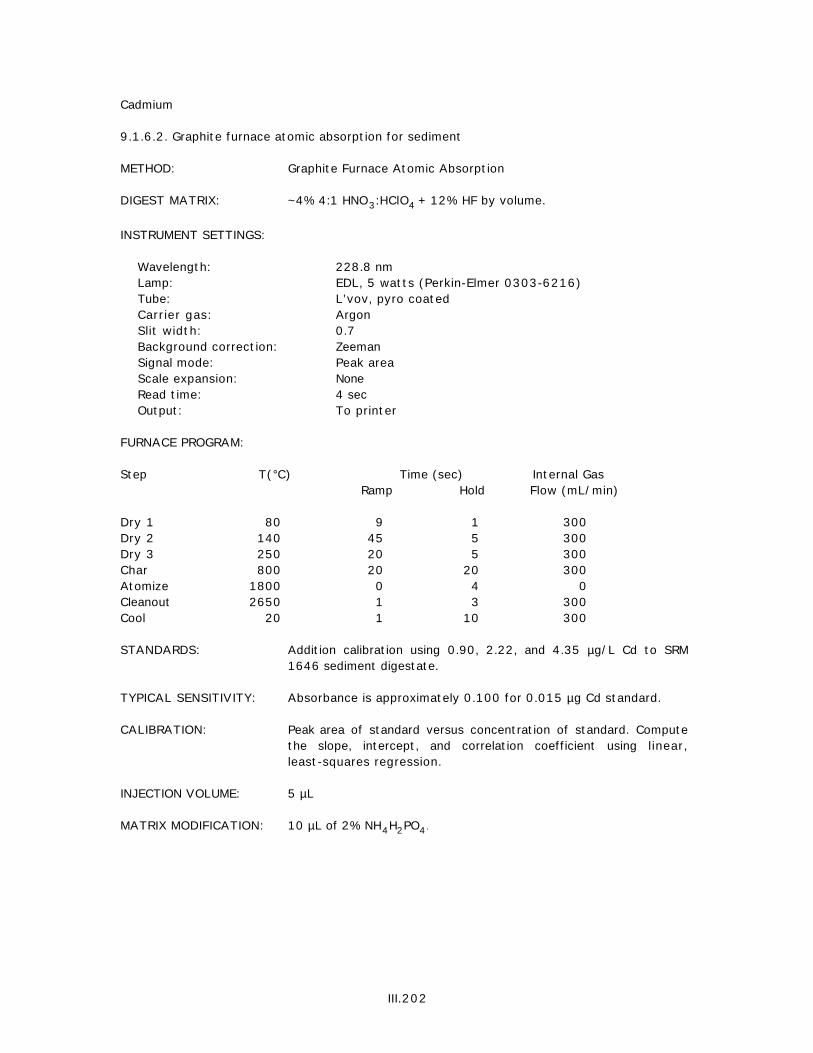
Cadmium
9.1.6.2. Graphite furnace atomic absorption for sediment
METHOD: Graphite Furnace Atomic Absorption
DIGEST MATRIX: ~4% 4:1 HNO3:HClO4 + 12% HF by volume.
INSTRUMENT SETTINGS:
Wavelength: 228.8 nmLamp: EDL, 5 watts (Perkin-Elmer 0303-6216)Tube: L’vov, pyro coatedCarrier gas: ArgonSlit width: 0.7Background correction: ZeemanSignal mode: Peak areaScale expansion: NoneRead time: 4 secOutput: To printer
FURNACE PROGRAM:
Step T(°C) Time (sec) Internal GasRamp Hold Flow (mL/min)
Dry 1 80 9 1 300Dry 2 140 45 5 300Dry 3 250 20 5 300Char 800 20 20 300Atomize 1800 0 4 0Cleanout 2650 1 3 300Cool 20 1 10 300
STANDARDS: Addition calibration using 0.90, 2.22, and 4.35 µg/L Cd to SRM1646 sediment digestate.
TYPICAL SENSITIVITY: Absorbance is approximately 0.100 for 0.015 µg Cd standard.
CALIBRATION: Peak area of standard versus concentration of standard. Computethe slope, intercept, and correlation coefficient using linear,least-squares regression.
INJECTION VOLUME: 5 µL
MATRIX MODIFICATION: 10 µL of 2% NH4H2PO4.
III.202

9.1.7. Tin
9.1.7.1. Hydride generation atomic absorption for tissue
METHOD: Graphite Furnace Atomic Absorption by Hydride Generation
DIGEST MATRIX: ~15% 4:1 HNO3:HClO4 by volume.
INSTRUMENT SETTINGS:
Wavelength: 286.5 nmLamp: EDL, 8 watts (Perkin-Elmer 0303-6274)Tube: Non-platform, non-coatedCarrier gas: ArgonSlit width: 0.7Background correction: ZeemanSignal mode: Peak heightScale expansion: NoneRead time: 4 secOutput: To printer
FURNACE PROGRAM:
Step T(°C) Time (sec) Internal GasRamp Hold Flow (mL/min)
Dry 1 700 10 99 0Dry 2 700 1 99 0Dry 3 700 1 99 0Dry 4 700 1 99 0Dry 5 700 1 99 0Cool 1 350 5 5 300Atomize 2300 0 4 0Cleanout 2600 1 4 300Cool 2 20 1 10 300
STANDARDS: Spike addition at 1.0, 2.5, and 5.0 ng Sn.
TYPICAL SENSITIVITY: Absorbance is approximately 0.150 for a 2.0 ng Sn spike.
CALIBRATION: Peak height of standard versus concentration of standard. Computethe slope, intercept, and correlation coefficient using linear,least-squares regression.
INJECTION VOLUME: 0.5 mL
MATRIX MODIFICATION: 0.5 mL of 2 N acetic acid.
NOTES: See hydride generation method for Sn. Note that the auto sampleris not used in this technique, and 50 mL of DI water is used as acarrier for the Sn standard, the modifier, and the borohydride.
III.203

Tin
9.1.7.2. Hydride generation atomic absorption for sediment
METHOD: Graphite furnace atomic absorption by hydride generation
DIGEST MATRIX: ~4% 4:1 HNO3:HClO4 + 12% HF by volume.
INSTRUMENT SETTINGS:
Wavelength: 286.5 nmLamp: EDL, 8 watts (Perkin-Elmer 0303-6274)Tube: Non-platform, non-coatedCarrier gas: ArgonSlit width: 0.7Background correction: ZeemanSignal mode: Peak heightScale expansion: NoneRead time: 4 secOutput: To printer
FURNACE PROGRAM:
Step T(°C) Time (sec) Internal GasRamp Hold Flow (mL/min)
Dry 1 700 10 99 0Dry 2 700 1 99 0Dry 3 700 1 99 0Dry 4 700 1 99 0Dry 5 700 1 99 0Cool 1 350 5 5 300Atomize 2300 0 4 0Cleanout 2600 1 4 300Cool 2 20 1 10 300
STANDARDS: Method of standard addition calibration at 1, 2.5, and 5.0 ng Sn toSRM 1646 sediment digestate.
TYPICAL SENSITIVITY: Absorbance is approximately 0.100 for a 3.0 ng Sn spike.
CALIBRATION: Peak height of standard versus concentration of standard. Computethe slope, intercept, and correlation coefficient using linear,least-squares regression.
INJECTION VOLUME: 0.100 mL
MATRIX MODIFICATION: 0.25 mL of 2 N acetic acid.
NOTES: See hydride generation method for Sn. Note that the auto sampleris not used in this technique, and 50 mL of DI water is used as acarrier for the Sn standard, the modifier, and the borohydride.
III.204
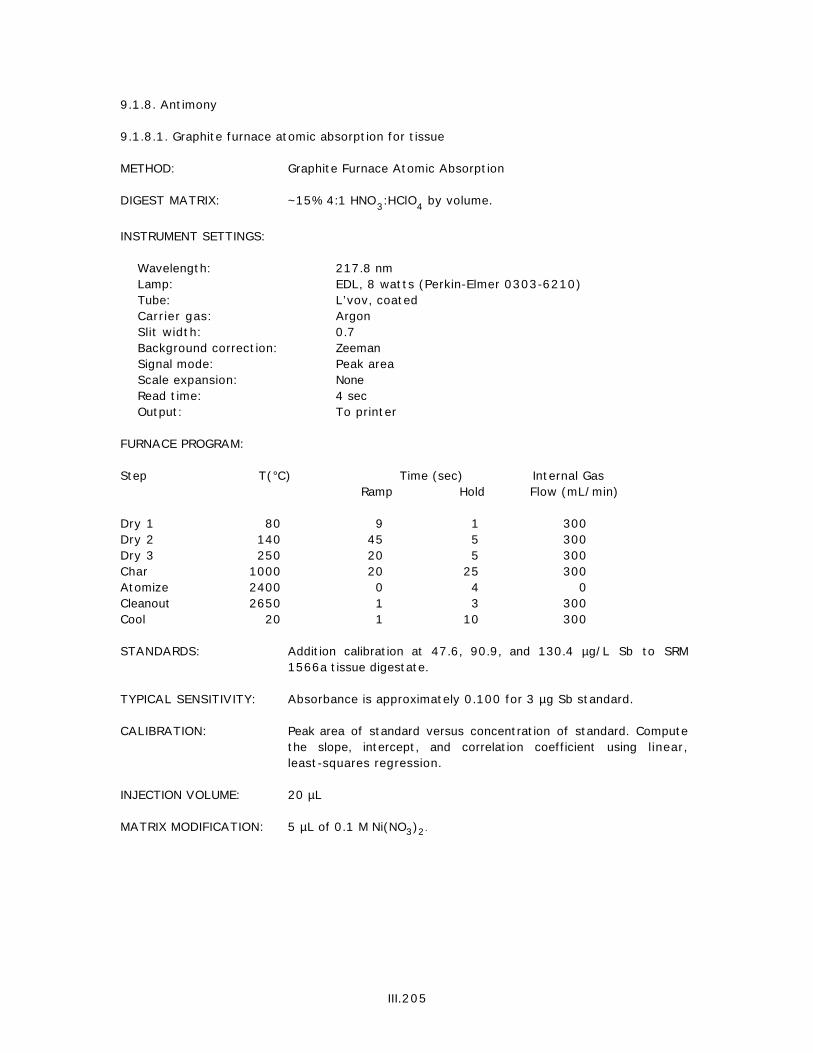
9.1.8. Antimony
9.1.8.1. Graphite furnace atomic absorption for tissue
METHOD: Graphite Furnace Atomic Absorption
DIGEST MATRIX: ~15% 4:1 HNO3:HClO4 by volume.
INSTRUMENT SETTINGS:
Wavelength: 217.8 nmLamp: EDL, 8 watts (Perkin-Elmer 0303-6210)Tube: L’vov, coatedCarrier gas: ArgonSlit width: 0.7Background correction: ZeemanSignal mode: Peak areaScale expansion: NoneRead time: 4 secOutput: To printer
FURNACE PROGRAM:
Step T(°C) Time (sec) Internal GasRamp Hold Flow (mL/min)
Dry 1 80 9 1 300Dry 2 140 45 5 300Dry 3 250 20 5 300Char 1000 20 25 300Atomize 2400 0 4 0Cleanout 2650 1 3 300Cool 20 1 10 300
STANDARDS: Addition calibration at 47.6, 90.9, and 130.4 µg/L Sb to SRM1566a tissue digestate.
TYPICAL SENSITIVITY: Absorbance is approximately 0.100 for 3 µg Sb standard.
CALIBRATION: Peak area of standard versus concentration of standard. Computethe slope, intercept, and correlation coefficient using linear,least-squares regression.
INJECTION VOLUME: 20 µL
MATRIX MODIFICATION: 5 µL of 0.1 M Ni(NO3)2.
III.205

Antimony
9.1.8.2. Graphite furnace atomic absorption for sediment
METHOD: Graphite Furnace Atomic Absorption
DIGEST MATRIX: ~4% 4:1 HNO3:HClO4 + 12% HF by volume.
INSTRUMENT SETTINGS:
Wavelength: 217.8 nmLamp: EDL, 8 watts (Perkin-Elmer 0303-6210)Tube: L’vov, coatedCarrier gas: ArgonSlit width: 0.7Background correction: ZeemanSignal mode: Peak heightScale expansion: NoneRead time: 4 secOutput: To printer
FURNACE PROGRAM:
Step T(°C) Time (sec) Internal GasRamp Hold Flow (mL/min)
Dry 1 80 9 1 300Dry 2 140 45 5 300Dry 3 250 20 5 300Char 1200 20 20 300Atomize 2500 0 4 0Cleanout 2650 1 3 300Cool 20 1 10 300
STANDARDS: Addition calibration at 42.9, 81.8, and 117.4 µg/L Sb to CRMMESS-1 sediment digestate.
TYPICAL SENSITIVITY: Absorbance is approximately 0.100 for 0.8 µg Sb standard.
CALIBRATION: Peak height of standard versus concentration of standard. Computethe slope, intercept, and correlation coefficient using linear,least-squares regression.
INJECTION VOLUME: 10 µL
MATRIX MODIFICATION: 10 µL of 0.1M Ni(NO3)2.
III.206

9.1.9. Mercury
Cold vapor/gold foil amalgam for tissue or sediment
METHOD: Cold vapor/gold foil amalgam
DIGEST MATRIX: ~15% 4:1 HNO3 and HClO4 by volume for tissues.
~4% 4:1 HNO3 and HClO4 + 12% HF by volume for sediments.
INSTRUMENT SETTINGS:
Reaction volume: 0.020 -1 mLDiluent: 1% HNO3
Carrier Gas: N2
Flow rate: 300 mL/min (purge), 100 mL/min (trap burn)Scale expansion: Attenuation - mid-rangeIntegration time: 1 minOutput: Shimadzu Integrator
REDUCTANT: 10% SnCl2 in 10% H2SO4
STANDARDS: 0, 0.5, 1.0, 2.5, 5.0, and 10.0 ng Hg from a 100 ng/mL standardin 1% HNO3 using High Purity standards. Use aliquots of 0, 5, 10,25, 50 and 100 µL.
TYPICAL SENSITIVITY: 0.01 µg/g Hg.
CALIBRATION: Instrument read-out is in peak area and input is in ng Hg, socalibration curve is based on Hg input versus Hg output reading.The slope, intercept, and correlation coefficient are calculatedusing linear, least-squares regression.
INJECTION VOLUME: 0.005 to 1 mL
REDUCTANT VOLUME: 0.5 mL
MATRIX MODIFICATION: None
III.207

9.1.10. Thallium
9.1.10.1. Graphite furnace atomic absorption for tissue
METHOD: Graphite Furnace Atomic Absorption
DIGEST MATRIX: ~15% 4:1 HNO3:HClO4 by volume.
INSTRUMENT SETTINGS:
Wavelength: 276.8 nmLamp: EDL, 7 watts (Perkin-Elmer 0303-6271)Tube: L’vov, coatedCarrier gas: ArgonSlit width: 0.7Background correction: ZeemanSignal mode: Peak areaScale expansion: NoneRead time: 4 secOutput: To printer
FURNACE PROGRAM:
Step T(°C) Time (sec) Internal GasRamp Hold Flow (mL/min)
Dry 1 80 9 1 300Dry 2 140 45 5 300Dry 3 250 20 5 300Char 600 20 25 300Atomize 1700 0 4 0Cleanout 2650 1 3 300Cool 20 1 10 300
STANDARDS: Method of standard addition calibration at 24.4, 47.6, and 90.0µg/L Tl to SRM 1566a tissue digestate.
TYPICAL SENSITIVITY: Absorbance is approximately 0.100 for 1.25 µg Tl standard.
CALIBRATION: Peak area of standard versus concentration of standard. Computethe slope, intercept, and correlation coefficient using linear,least-squares regression.
INJECTION VOLUME: 25 µL
MATRIX MODIFICATION: 5 µL of 1% H2SO4.
III.208

Thallium
9.1.10.2. Graphite furnace atomic absorption for sediment
METHOD: Graphite furnace atomic absorption
DIGEST MATRIX: ~4% 4:1 HNO3:HClO4 + 12% HF by volume.
INSTRUMENT SETTINGS:
Wavelength: 276.9 nmLamp: EDL, 7 watts (Perkin-Elmer 0303-6271)Tube: L’vov, coatedCarrier gas: ArgonSlit width: 0.7Background correction: ZeemanSignal mode: Peak areaScale expansion: NoneRead time: 4 secOutput: To printer
FURNACE PROGRAM:
Step T(°C) Time (sec) Internal GasRamp Hold Flow (mL/min)
Dry 1 80 9 1 300Dry 2 140 45 5 300Dry 3 250 20 5 300Char 600 20 25 300Atomize 1700 0 4 0Cleanout 2650 1 3 300Cool 20 1 10 300
STANDARDS: Method of standard addition calibration at 24.4, 47.6, and 90.0µg/L Tl to SRM 1646 sediment digestate.
TYPICAL SENSITIVITY: Absorbance is approximately 0.060 for 1.25 µg Tl standard.
CALIBRATION: Peak area of standard versus concentration of standard. Computethe slope, intercept, and correlation coefficient using linear,least-squares regression.
INJECTION VOLUME: 25 µL
MATRIX MODIFICATION: 10 µL of 1% H2SO4 + 10 µL 0.1 M Ni(NO3)2.
III.209

9.1.11. Lead
Graphite furnace atomic absorption for tissue
METHOD: Graphite Furnace Atomic Absorption
DIGEST MATRIX: ~15% 4:1 HNO3:HClO4 by volume.
INSTRUMENT SETTINGS:
Wavelength: 283.3 nmLamp: EDL, 5 ma (Perkin-Elmer 0303-6039)Tube: L’vov, coatedCarrier gas: ArgonSlit width: 0.7Background correction: ZeemanSignal mode: Peak heightScale expansion: NoneRead time: 5 secOutput: Recorded from Spectrophotometer display
FURNACE PROGRAM:
Step T(°C) Time (sec) Internal GasRamp Hold Flow (mL/min)
Dry 1 80 9 1 300Dry 2 140 45 5 300Dry 3 250 20 5 300Char 800 20 20 300Atomize 2100 0 4 0Cleanout 2650 1 3 300Cool 20 1 10 300
STANDARDS: Method of standard addition calibration at 9.9, 19.6, and 24.4µg/L Pb to CRM DOLT-1 tissue digestate.
TYPICAL SENSITIVITY: Absorbance is approximately 0.160 for 0.25 µg Pb standard.
CALIBRATION: Peak height of standard versus concentration of standard. Computethe slope, intercept, and correlation coefficient using linear,least-squares regression.
INJECTION VOLUME: 5 µL
MATRIX MODIFICATION: 10 µL of 2% NH4H2PO4.
III.210

9.2. Inductively coupled plasma mass spectrometry
Silver, aluminum, chromium, cadmium, nickel, lead, antimony, and tin in sediments or tissues
METHOD: Inductively coupled plasma mass spectrometry
DIGEST MATRIX: 1 to 10 dilution of digestate with deionized water plus 0.1 mL of 1ppm In standard.
INSTRUMENT SETTINGS: Instrument settings change on a daily basis as sensitivity isoptimized. This is especially true of lens settings. The followinggives general ranges on parameters that remain relativelyconstant in day-to-day operation:
Power: 1250-1500 wattsCoolant flow: 13-14 L/min.Auxiliary flow: 0.5-1.0 L/min.Nebulizer flow: 0.85-1.0 L/min.EM voltage: 2000-3000 voltsSample uptake: 0.5-1.5 mL/min.Integration method: Constant areaIntegration area: 0.8Background counts: 35Dead time: 40 nsecQuad slew factor: 0.10
PROCEDURE:
Element menu: tissue2Mass range: 25.98 to 212.05 amuNumber of channels: 2048Number of sweeps: 100Dwell time: 320 µsecCollector type: pulseInternal standards: InSkipped mass regions: 28.00 - 43.00, 63.00 - 105.00, 125.00 - 200
STANDARDS: Appropriate calibration standards (representative of sampleconcentration) are prepared from dilutions of NIST single- and/ormulti-element standards. Other reference materials (NIST orsecond party single/multi-element standards) are used as checkstandards. Method of standard addition can be used to produceinstrumental response curve.
TYPICAL SENSITIVITY: Sensitivity is approximately 5 x 10⁴ million counts per sec perppm for In115.
CALIBRATION: Constant area integration (using 0.8 of total peak) versusconcentration of standard. Compute the slope, intercept, andcorrelation coefficient using linear, least-squares regression.
III.211

9.3. X-Ray fluorescence
Elements in sediment: Al, As, Cr, Cu, Fe, Mn, Ni, Pb, Si, and Zn.Elements in tissue: As, Cu, Fe, Mn, Se, Si, and Zn.
METHOD: X-ray fluorescence
Sample preparation: 0.5 g dried and homogenized sediment or tissue pressed in a pellet,2 cm in diameter.
INSTRUMENT SETTINGS:
Gain: PHA/LTC for Series 80 MCASecondary target: ZrTarget gain: 25 eV/channelResolution: 182 eV at 6.4 KeVTiming counter: 12 µsecBias: -1000 VLive time: 1500 secDead time: < 40%Tungsten tube voltage: 40 VTube current: 20 milliamps
III.212

Analytical Procedures Followed by Science Applications InternationalCorporation for Trace and Major Element Analyses
C. Peven, A. Uhler and D. WestBattelle Ocean Sciences
Marine ChemistryDuxbury, MA
1. INTRODUCTION
During Year 1 (1986) of the Mussel Watch Project, two analytical laboratories performed thetrace and major element analyses on tissue and sediment samples. Battelle's Pacific NorthwestLaboratory in Sequim, WA, prepared and analyzed all samples collected on the East Coast, andthose collected in Oregon, Washington, and Alaska. Science Applications InternationalCorporation (SAIC), La Jolla, CA, performed similar analyses on samples collected from theCalifornia coast. A summary of laboratory responsibilities is found in Table III.9. The analyticalmethods used for each element by Battelle and SAIC for each year of the Mussel Watch Projectare summarized in Tables III.10 to III.12. The analytical methods used by SAIC are describedbelow. These methods have been summarized from information in Battelle's Quality AssuranceWork Plans and Final Reports to NOAA for 1986 through 1989 of the National Status and TrendsProgram Mussel Watch Project.
2. TRACE METAL ANALYSIS
2.1. Equipment and reagents
2.1.1. Instruments
Perkin-Elmer 603 atomic absorption spectrophotometer. Perkin-Elmer, Norwalk, CT.HGA-2200 graphite furnacePerkin-Elmer Model 056 recorderAutosampler, model AS-1Deuterium lamp background correctorElectrodeless discharge lamps
Perkin-Elmer 5100PC absorption spectrophotometerHGA-600 graphite furnaceAutosampler, model AS-60Zeeman background correctorElectrodeless discharge dual lamp power supplyEpson Equity 3+ color computer with printer. Wakefield, MA.
Mercury monitor, Laboratory Data Control, model 1235
Hitachi 100-80 uv/visible spectrophotometer. Hitachi Instruments, Danbury, CT.
Air/acetylene burner for (flame atomic absorption analysis)
Nitrous oxide/acetylene burner for (flame atomic absorption analysis)
III.213

Table III.9. Summary of laboratory responsibilities.
Sample Origin LaboratoryYear 1986 Year 1987 Year 1988 Year 1989
East Coast (all sites) Battelle Battelle Battelle Battelle
West CoastCalifornia SAIC SAIC SAIC* SAIC* *
Oregon Battelle Battelle Battelle BattelleWashington Battelle Battelle Battelle BattelleAlaska Battelle Battelle NS NSHawaii Battelle Battelle NS NS
* Sn analyzed by Battelle. ** Se and Sn analyzed by Battelle. NS - Not Sampled
Table III.10. Analytical methods for trace elements used by Battelle and SAIC, 1986.
Element Battelle SAICTissue Sediment Tissue Sediment
Al GFAA XRF GFAA/FAA FAAAg GFAA GFAA GFAA GFAAAs XRF XRF GFAA GFAACd GFAA GFAA GFAA/FAA GFAACr GFAA XRF GFAA GFAACu XRF XRF GFAA/FAA GFAAFe XRF XRF FAA FAAHg CVAA CVAA CVAA CVAAMn XRF XRF GFAA/FAA FAANi GFAA XRF GFAA GFAAPb GFAA XRF GFAA GFAASb NA NA GFAA GFAASe XRF GFAA GFAA GFAASi XRF XRF COLOR COLORSn HAA HAA GFAA GFAATl GFAA GFAA GFAA GFAAZn XRF XRF FAA FAA
GFAA - Graphite furnace atomic absorption spectrometry. HAA - Hydride generation atomic absorption spectrometry. CVAA -
Cold vapor atomic absorption spectrometry. FAA - Flame atomic absorption spectrometry. XRF - X-Ray fluorescence
spectrometry. NAA - Neutron activation analysis. COLOR - Colorimetry.
III.214

Table III.11. Analytical methods for trace elements used by Battelle and SAIC, 1987.
Element Battelle SAICTissue Sediment Tissue Sediment
Al GFAA XRF GFAA/FAA FAAAg GFAA GFAA GFAA GFAAAs XRF XRF GFAA GFAACd GFAA GFAA GFAA GFAACr GFAA XRF GFAA GFAACu XRF XRF GFAA/FAA GFAAFe XRF XRF GFAA/FAA GFAA/FAAHg CVAA CVAA CVAA CVAAMn XRF XRF GFAA/FAA GFAA/FAANi GFAA XRF GFAA GFAAPb GFAA XRF GFAA GFAASb NA NA GFAA GFAASe XRF GFAA GFAA GFAASi XRF XRF COLOR COLORSn HAA HAA GFAA GFAATl GFAA GFAA GFAA GFAAZn XRF XRF FAA FAA
GFAA - Graphite furnace atomic absorption spectrometry. HAA - Hydride generation atomic absorption spectrometry. CVAA -
Cold vapor atomic absorption spectrometry. FAA - Flame atomic absorption spectrometry. XRF - X-Ray fluorescence
spectrometry. NAA - Neutron activation analysis. COLOR - Colorimetry.
2.1.2. Labware
Autoclave Jars, 60 mL, polyethyleneBalance Mill, Mixer-Mill. Spex Industries, Edison, NJ.Bottles, 50 mL, borosilicate Tubes, centrifuge, 25 mL, Oak Ridge style,
TeflonBottles, polyethyleneBottles, polyethylene, 60-mL Virtis Unitrap II freeze-dryer. Gardiner, NY.Flasks, volumetric, 50 mL, polypropylene
2.1.2. Reagents
[Sources and purity of some reagents not available. Ed. Note.]
Hydrochloric acid (HCl) [7647-01-0],concentrated (semi-conductor grade). J.T. Baker, Phillipsburg, NJ.
Nitric acid (HNO3) [7697-37-2], concentrated(semi-conductor grade). J. T. Baker,Phillipsburg, NJ.
Hydrofluoric acid (HF) [7664-39-3], concen-trated. J. T. Baker, Phillipsburg, NJ.
Nitric acid (HNO3) [7697-37-2], doubledistilled from Vycor. G. Frederick SmithChemicals, Columbus, OH.NIST SRM series 3100 spectrometric
solutions. NIST, Gaithersburg, MD. Potassium permanganate (KMnO4) [7722-64-7], (Hg free).
NIST SRM series 3133 spectrometricsolutions. NIST, Gaithersburg, MD.
Sodium chloride (NaCl) [7647-14-5].
III.215

Table III.12. Analytical methods for trace elements used by Battelle and SAIC, 1988 and 1989.
Element Battelle SAICTissue Sediment Tissue Sediment
Al GFAA XRF GFAA GFAAAg GFAA GFAA GFAA GFAAAs XRF XRF GFAA GFAACd GFAA GFAA GFAA GFAACr GFAA XRF GFAA GFAACu XRF XRF GFAA GFAAFe XRF XRF FAA FAAHg CVAA CVAA CVAA CVAANi GFAA XRF GFAA GFAAPb GFAA XRF GFAA GFAASe XRF GFAA GFAA ∆ GFAA ∆Sn HAA HAA ◊ ◊Zn XRF XRF FAA FAA
GFAA - Graphite furnace atomic absorption spectrometry. HAA - Hydride generation atomic absorption spectrometry. CVAA -Cold vapor atomic absorption spectrometry. FAA - Flame atomic absorption spectrometry. XRF - X-Ray fluorescencespectrometry. NAA - Neutron activation analysis. ∆ Se analyzed by Battelle for Year 4. ◊ Sn analyzed by Battelle for Years 3and 4.
Standards, atomic absorption standards,1000 ppm. Fisher Scientific, Pittsburgh,PA.
Sulfuric acid (H2SO4) [8014-95-7], semi-conductor grade.
Water, Milli-Q. Millipore Corp., Bedford, MA.Stannous chloride (SnCl2 . 2H2O) [10025-
69-1]
2.2. Bivalve tissues digestion - SAIC
2.2.1. For all elements except Hg
The following methodology was used for sample processing for the analyses of all elementsexcept mercury.
All bivalve specimens were sized and shucked prior to analytical processing. Bivalve specimenswere shucked and the entire tissue mass of each animal placed in a sufficiently large, labeledpolyethylene bottle. The bottles were tightly capped and the samples frozen. The samples werethen macerated using a stirrer with a polypropylene shaft and cutting blades, and blended for aminimum of 10 min or until the samples appeared to be a homogenized slurry. Approximately 2g of each sample were then weighed into 50-mL borosilicate bottles and reserved for later Hganalysis. An additional 50 g of each sample was transferred to labeled preweighed 60-mLpolypropylene jars, the wet weights recorded, and the samples frozen. Sample aliquots weretaken to a constant dry weight using a Virtis Unitrap II freeze-dryer. The sample dry weightswere recorded and dry:wet weight ratios calculated. The dry and wet weights were used toconvert the wet weights of the Hg samples to dry weights, since wet samples were used for Hganalysis. Wet samples were used for Hg analysis due to possible loss of Hg during the drying
III.216

process. Following the drying process, samples were ground to a homogeneous powder in theiroriginal containers using a Spex Mixer-Mill.
The samples were digested following a modification of Gorsuch (1970) and Risby (1979).Approximately 1.0 g of the dry sample from each station was placed in a 25-mL screw capTeflon centrifuge tube. Five mL of concentrated nitric acid was added to each sample and thetubes capped prior to overnight digestion at room temperature. The next day, the tubes wereloosely capped and placed in a 95°C water bath in the fume hood for 2 hr. The samples wereswirled often. The caps were tightened and the samples placed in an autoclave for 2 hr at115°C. The samples were removed from the autoclave, cooled, and transferred to 50-mLpolypropylene volumetric flasks. The flasks were brought to volume with Milli-Q water and thesamples transferred to labeled 60-mL polyethylene bottles and stored until analysis.
2.2.2. For Hg analysis
The following methodology, modified from EPA (1983), was used for preparation of Hgsamples. Five milliliters of concentrated nitric acid (semi-conductor grade) was added to thesamples, in 2 g borosilicate bottles. The sample bottles were capped and allowed to digestovernight at room temperature. Five milliliters of concentrated H2SO4 were then added to eachsample. The sample bottles were loosely capped and heated in a 95°C water bath for 2 hr. Thebottles were allowed to cool and approximately 10 mL of a saturated solution of KMnO4 (Hg-free) was added until a purple color persisted. The samples were reheated for 1 hr, allowed tocool, tightly capped, and refrigerated until analysis.
2.3. Surficial sediments
2.3.1. For all elements except Hg
For all elements except Hg, samples were thawed, allowed to warm to room temperature, andhomogenized while wet. Approximately 20 g of each sample was transferred to labeled 60-mLpolyethylene bottles and stored frozen for later Hg analysis. An additional 50-g aliquot of eachsample was transferred to labeled preweighed 60-mL polypropylene jars, the wet weightrecorded, and the samples frozen. Unused portions of the samples were refrozen and archived.Sample aliquots, except those for Hg, were taken to a constant dry weight using a VirtisUnitrap II freeze-dryer. The sample dry weights were determined and the resulting dry:wetratios were used to convert the wet weights of the Hg samples to dry weights. The driedsamples were ground to a homogeneous powder in their original containers using a Spex Mixer-Mil l.
Samples were digested following modifications of Eggimann and Betzer (1976) and Johnson andMaxwell (1981). Approximately 0.2-g aliquots of homogenized sediment were placed in 25-mLscrew-cap Teflon centrifuge tubes. Four milliliters of concentrated HCl and 2 mL ofconcentrated HNO3 were added to each tube. The tubes were loosely capped and placed in a 95°Cwater bath in fume hood for 2 h and frequently swirled. The samples were cooled, and 3 mL ofconcentrated HF were added. The bottles were re-capped tightly. Samples were placed in anautoclave at 115°C for 2 hr. The samples were cooled, transferred to 50-mL polypropylenevolumetric flasks, and brought to volume with Milli-Q water. The samples were thentransferred to labeled 60-mL polyethylene bottles and stored until analyzed.
III.217
2.3.2. For Hg analysis
Sample preparation for Hg analysis followed a modification of EPA Method 245.1 (1983).Approximately 1 g wet weight of the samples was weighed into labeled 50-mL borosilicatebottles. Five milliliters of concentrated HNO3 and 5 mL of concentrated H2SO4 were added toeach sample. The bottles were loosely capped and heated in a 95°C water bath for 2 hr,swirling often. Samples were cooled, the caps tightened, and refrigerated until analysis.
2.4. Sample analysis
The following equipment and techniques were used by SAIC to determine trace elementconcentrations in bivalve tissues and surficial sediments.
2.4.1. Graphite furnace atomic absorption spectrometry
Atomic absorption spectrophotometry (AAS) (using the graphite furnace according to themanufacturer's conditions) was used to analyze samples which had analyte concentrations notdetectable by flame atomic absorption. A Perkin-Elmer No. 603 AAS equipped with an HGA-2200 graphite furnace, an AS-1 autosampler, a deuterium (D2) lamp background corrector,electrodeless discharge lamps, and a Perkin-Elmer No. 056 Recorder were used. The D2
background corrector was used for all analyses.* Standard additions were routinely performedalong with standard calibrations. All sample values were calculated using the method ofadditions.
Manufacturer's instrument operating conditions were followed. AAS working standards wereprepared from a mixed 10-ppm stock in 1% HNO3 using Fisher 1000 ppm standards. Silverstandards were prepared separately from a Fisher 1000-ppm standard.
2.4.2. Flame atomic absorption spectrometry
Samples not requiring the sensitivity of the graphite furnace atomic absorption were analyzedby flame atomic absorption. The Perkin-Elmer No. 603 was modified with air/acetylene andnitrous oxide/acetylene burners for flame analysis. A deuterium (D2) lamp backgroundcorrector included with this instrument was used for all analyses. Standard additions andstandard calibrations were performed regularly. AAS working standards were prepared from amixed 10-ppm stock in 1% HNO3 using Fisher 1000-ppm standards. Silver standards wereprepared separately from a Fisher 1000-ppm standard.
2.4.3. Cold vapor atomic absorption spectrometry
Hg was determined by cold vapor atomic absorption spectrophotometry (CVAA) using aLaboratory Data Control No. 1235 Mercury Monitor equipped with a Perkin-Elmer 023Recorder. A modification of EPA Method 245 (1983) was followed for analysis. Samples werereduced to destroy the excess KMnO4 using a 10% solution of NH2OH/HCl in 10% sodiumchloride (NaCl). Next, the samples were reduced to the Hg° state using a 20% solution ofstannous chloride (SnCl2) in 3N HCl. The resulting Hg vapor was purged with a nitrogen (N2)vapor through the above system. Working standards were prepared from a 10 ppm stock in 1%HNO3 using a Fisher 1000-ppm standard. Standard additions were routinely performed.
* During Year 4, additional instrumentation was used to analyze sediments and tissues by GFAA. The second instrument was acomputer-controlled Perkin-Elmer 5100PC equipped with a HGA-600 graphite furnace, AS-60 autosampler, Zeemanbackground correction, electrodeless discharge dual lamp power supply, and an Epson 3+ color computer with printer.
III.218

2.4.4. Colorimetry
Sample aliquots of the original digestates were diluted appropriately and analyzedcolorimetrically forming a silicomolybdate complex (Strickland and Parsons, 1972). Thesample absorbance was read at 810 nm, using 1-cm cells and a Hitachi No. 100-80 UV/Visiblespectrophotometer. Working standards were prepared from a 10-ppm stock in 1% HNO3 using aFisher 1000-ppm standard. Standard additions were routinely performed.
3. REFERENCES
Eggimann, D. W., and P. R. Betzer (1976) Decomposition and analysis of refractory oceanicsuspended materials. Anal. Chem., 48:886-890.
Environmental Protection Agency (1983) Methods for Chemical Analysis of Water and Wastes.EPA-600/4-79-020. Method 245. EPA, Cincinnati, OH.
Gorsuch, T. T. (1970) The destruction of organic matter. Pergamon Press, NY. 152 pp.
W. M. Johnson, W. M., and J. A. Maxwell (1981) Sample decomposition. In: Chemical Analysis,Vol. 27, Rock and Mineral Analysis. John Wiley and Sons, NY.
Risby, T. H. (1979) Ultratrace Metal Analysis in Biological Sciences and Environment.American Chemical Society, Washington, D.C. 10-25.
III.219