NOAA Technical Memorandum NMFS-NWFSC-103. A Synthesis of Diets
99
NOAA Technical Memorandum NMFS-NWFSC-103 U.S. DEPARTMENT OF COMMERCE National Oceanic and Atmospheric Administration National Marine Fisheries Service A Synthesis of Diets and Trophic Overlap of Marine Species in the California Current November 2009
Transcript of NOAA Technical Memorandum NMFS-NWFSC-103. A Synthesis of Diets

NOAA Technical Memorandum NMFS-NWFSC-103
U.S. DEPARTMENT OF COMMERCENational Oceanic and Atmospheric AdministrationNational Marine Fisheries Service
A Synthesis of Dietsand Trophic Overlapof Marine Speciesin the California Current
November 2009

NOAA Technical MemorandumNMFS-NWFSC SeriesThe Northwest Fisheries Science Center of the National Marine Fisheries Service, NOAA, uses the NOAA Techni-cal Memorandum NMFS-NWFSC series to issue scientific and technical publications. Manuscripts have been peer reviewed and edited. Documents published in this series may be cited in the scientific and technical literature.
The NMFS-NWFSC Technical Memorandum series of the Northwest Fisheries Science Center continues the NMFS-F/NWC series established in 1970 by the Northwest & Alaska Fisheries Science Center, which has since been split into the Northwest Fisheries Science Center and the Alaska Fisheries Science Center. The NMFS-AFSC Techni-cal Memorandum series is now being used by the Alaska Fisheries Science Center.
Reference throughout this document to trade names does not imply endorsement by the National Marine Fisheries Service, NOAA.
This document should be referenced as follows:Dufault, A.M., K. Marshall, and I.C. Kaplan. 2009. A synthesis of diets and trophic overlap of marine species in the California Current. U.S. Dept. Commer., NOAA Tech. Memo. NMFS-NWFSC-103, 81 p.

NOAA Technical Memorandum NMFS-NWFSC-103
U.S. DEPARTMENT OF COMMERCENational Oceanic and Atmospheric AdministrationNational Marine Fisheries Service
A Synthesis of Dietsand Trophic Overlapof Marine Speciesin the California Current
Aaron M. Dufault,1 Kristin Marshall ,2 and Issac C. Kaplan
Northwest Fisheries Science CenterConservation Biology Division2725 Montlake Boulevard EastSeattle, Washington 98112
Present affiliation:California State UniversityDepartment of Biology18111 Nordhoff StreetNorthridge, California 91330
Present affiliation:Colorado State UniversityGraduate Degree Program in Ecology1472 Campus DeliveryFort Collins, Colorado 80523
November 2009
1
2

ii
Most NOAA Technical MemorandumsNMFS-NWFSC are available online at the Northwest Fisheries Science Centerweb site (http://www.nwfsc.noaa.gov)
Copies are also available from:National Technical Information Service5285 Port Royal RoadSpringfield, VA 22161phone orders (1-800-553-6847)e-mail orders ([email protected])

Table of Contents
List of Figures ............................................................................................................................................... v List of Tables ..............................................................................................................................................vii Executive Summary .....................................................................................................................................xi Acknowledgments......................................................................................................................................xiii Introduction................................................................................................................................................... 1 Methods ........................................................................................................................................................ 3
Data........................................................................................................................................................... 3 Data Analysis............................................................................................................................................ 4
Functional Groups ................................................................................................................................ 4 Species Data ......................................................................................................................................... 4 Food Web ............................................................................................................................................. 5
Results........................................................................................................................................................... 6 Diet Summary........................................................................................................................................... 6 Cluster Analysis: Functional Group Level ............................................................................................... 6 PSI: Functional Group Level .................................................................................................................... 6 Food Web Structure Analysis................................................................................................................... 7 Analyses for Fish at the Species Level ..................................................................................................... 7
Discussion ..................................................................................................................................................... 9 Figures 1–17 and Tables 1–5 ...................................................................................................................... 11 References................................................................................................................................................... 37 Appendix A: Sources for Diets ................................................................................................................... 45
Fish ......................................................................................................................................................... 45 Seabirds .................................................................................................................................................. 50 Marine Mammals.................................................................................................................................... 51 Invertebrates ........................................................................................................................................... 52
Appendix B: Tables of Functional Group Diets ......................................................................................... 55 Appendix C: Tables of Fish Species Diets.................................................................................................. 67
iii

iv

List of Figures
Figure 1. Dendrogram of California Current diets derived from the hierarchical cluster analysis ............ 12 Figure 2. Percent diet composition of feeding guilds A and B .................................................................. 13 Figure 3. Percent diet composition of feeding guilds C and D .................................................................. 13 Figure 4. Percent diet composition of feeding guild E............................................................................... 14 Figure 5. Percent diet composition of feeding guild F............................................................................... 14 Figure 6. Percent diet composition of feeding guild G .............................................................................. 15 Figure 7. Percent diet composition of feeding guild H .............................................................................. 16 Figure 8. Percent diet composition of feeding guild I................................................................................ 16 Figure 9. Percent diet composition of feeding guild J ............................................................................... 17 Figure 10. Visual representation of California Current food web structure............................................... 17 Figure 11. Dendrogram of California Current fish-only diets derived from the hierarchical cluster analysis........................................................................................................................................................ 18 Figure 12. Percent diet composition of feeding guild A from the species-level hierarchical cluster analysis........................................................................................................................................................ 19 Figure 13. Percent diet composition of feeding guilds B and C from the species-level hierarchical cluster analysis ............................................................................................................................................ 19 Figure 14. Percent diet composition of feeding guild D and E from the species-level hierarchical cluster analysis ............................................................................................................................................ 20 Figure 15. Percent diet composition of feeding guilds F and G from the species-level hierarchical cluster analysis ............................................................................................................................................ 20 Figure 16. Percent diet composition of feeding guild H from the species-level hierarchical cluster analysis........................................................................................................................................................ 21 Figure 17. MANOVA plot of the PSI of species-level data ...................................................................... 22
v

vi

List of Tables
Table 1. Vertebrate species included in the functional group analysis and their respective proportional biomass within the functional group ...................................................................................... 23 Table 2. Invertebrate taxa included in each functional group.................................................................... 27 Table 3. PSI of California Current functional groups ................................................................................ 29 Table 4. Comparison of our California Current food web to other marine food webs, using common food web structure properties...................................................................................................................... 33 Table 5. PSI for all fish species diets ......................................................................................................... 34 Table B-1. Diet composition by percent weight for members of feeding guild A..................................... 55 Table B-2. Diet composition by percent weight for members of feeding guild B..................................... 56 Table B-3. Diet composition by percent weight for members of feeding guild C..................................... 57 Table B-4. Diet composition by percent weight for members of feeding guild D..................................... 58 Table B-5. Diet composition by percent weight for members of feeding guild E ..................................... 59 Table B-6. Diet composition by percent weight for members of feeding guild F ..................................... 61 Table B-7. Diet composition by percent weight for members of feeding guild G..................................... 62 Table B-8. Diet composition by percent weight for members of feeding guild H..................................... 63 Table B-9. Diet composition by percent weight for members of feeding guild I ...................................... 66 Table B-10. Diet composition by percent weight for members of feeding guild J .................................... 66 Table C-1. Diet composition by weight for albacore tuna, a member of feeding guild B ......................... 68 Table C-2. Diet composition by weight for arrowtooth flounder, a member of feeding guild H .............. 68 Table C-3. Diet composition by weight for Bering skate, a member of feeding guild E........................... 69 Table C-4. Diet composition by weight for big skate, a member of feeding guild E ................................ 69 Table C-5. Diet composition by weight for black rockfish, a member of feeding guild B........................ 69 Table C-6. Diet composition by weight for blue lanternfish, a member of feeding guild A ..................... 69 Table C-7. Diet composition by weight for blue rockfish, a member of feeding guild B.......................... 69 Table C-8. Diet composition by weight for California headlightfish, a member of feeding guild ............ 69 Table C-9. Diet composition by weight for canary rockfish, a member of feeding guild A...................... 70 Table C-10. Diet composition by weight for Chinook salmon, a member of feeding guild B .................. 70 Table C-11. Diet composition by weight for darkblotched rockfish, a member of feeding guild A ......... 70 Table C-12. Diet composition by weight for deepsea sole, a member of feeding guild D ........................ 70 Table C-13. Diet composition by weight for Dover sole, a member of feeding guild D........................... 71 Table C-14. Diet composition by weight for English sole, a member of feeding guild D......................... 71
vii

Table C-15. Diet composition by weight for garnet lampfish, a member of feeding guild C.................... 71 Table C-16. Diet composition by weight for giant grenadier, a member of feeding guild E..................... 71 Table C-17. Diet composition by weight for greenstriped rockfish, a member of feeding guild A .......... 72 Table C-18. Diet composition by weight for jack mackerel, a member of feeding guild A...................... 72 Table C-19. Diet composition by weight for lingcod, a member of feeding guild H ................................ 72 Table C-20. Diet composition by weight for longnose skate, a member of feeding guild E ..................... 73 Table C-21. Diet composition by weight for longspine thornyhead, a member of feeding guild H.......... 73 Table C-22. Diet composition by weight for northern anchovy, a member of feeding guild A ................ 73 Table C-23. Diet composition by weight for northern lampfish, a member of feeding guild C ................ 73 Table C-24. Diet composition by weight for northern smoothtongue, a member of feeding guild G ....... 74 Table C-25. Diet composition by weight for Pacific grenadier, a member of feeding guild F.................. 74 Table C-26. Diet composition by weight for Pacific hake, a member of feeding guild A......................... 74 Table C-27. Diet composition by weight for Pacific halibut, a member of feeding guild H ..................... 74 Table C-28. Diet composition by weight for Pacific herring, a member of feeding guild A..................... 75 Table C-29. Diet composition by weight for Pacific mackerel, a member of feeding guild A.................. 75 Table C-30. Diet composition by weight for Pacific ocean perch, a member of feeding guild A ............. 75 Table C-31. Diet composition by weight for Pacific sanddab, a member of feeding guild E.................... 75 Table C-32. Diet composition by weight for Pacific sardine, a member of feeding guild A..................... 76 Table C-33. Diet composition by weight for Pacific viperfish, not a member of a feeding guild ............. 76 Table C-34. Diet composition by weight for petrale sole, a member of feeding guild E .......................... 76 Table C-35. Diet composition by weight for pygmy rockfish, a member of feeding guild A ................... 76 Table C-36. Diet composition by weight for redstripe rockfish, a member of feeding guild A ................ 76 Table C-37. Diet composition by weight for rex sole, a member of feeding guild D................................ 76 Table C-38. Diet composition by weight for rosethorn rockfish, a member of feeding guild G ............... 77 Table C-39. Diet composition by weight for rougheye rockfish, a member of feeding guild G ............... 77 Table C-40. Diet composition by weight for sablefish, a member of feeding guild H .............................. 78 Table C-41. Diet composition by weight for sharpchin rockfish, a member of feeding guild A............... 78 Table C-42. Diet composition by weight for shortspine thornyhead, a member of feeding guild A.......... 79 Table C-43. Diet composition by weight for sixgill shark, a member of feeding guild F ......................... 79 Table C-44. Diet composition by weight for sleeper shark, a member of feeding guild H ....................... 79 Table C-45. Diet composition by weight for soupfin shark, a member of feeding guild H....................... 80 Table C-46. Diet composition by weight for spiny dogfish, a member of feeding guild A....................... 80 Table C-47. Diet composition by weight for splitnose rockfish, a member of feeding guild A ................ 80 Table C-48. Diet composition by weight for spotted ratfish, a member of feeding guild H...................... 80 Table C-49. Diet composition by weight for twoline eelpout, a member of feeding guild G.................... 81
viii

Table C-50. Diet composition by weight for widow rockfish, a member of feeding guild G ................... 81 Table C-51. Diet composition by weight for yelloweye rockfish, a member of feeding guild H.............. 81 Table C-52. Diet composition by weight for yellowtail rockfish, a member of feeding guild G .............. 81
ix

x

Executive Summary
A key step toward ecosystem-based management is to better understand how interactions within food webs affect species of commercial and conservation importance. Here we provide comprehensive diet information and food web analysis for major taxa within the California Current ecosystem, including fish, marine mammals, birds, and invertebrates.
We synthesized 75 published diet studies from this ecosystem and calculated representative diets for each species or aggregated functional group. We assessed diet relatedness using hierarchical cluster analysis and calculated diet overlaps based on percent similarity index (PSI). Both analyses were performed on functional group data and also separately for each vertebrate species.
Cluster analysis identified distinct feeding guilds and revealed both intuitive and novel diet similarities between several species and functional groups. One intuitive example is that functional groups preying on euphausiids, a key forage species in the California Current, show a high amount of overlap. A novel example is the significant diet overlap of shallow small rockfish and baleen whales (e.g., grey whales [Eschrichtius robustus]), both of which consume large amounts of benthic invertebrates.
Functional groups were highly significant in explaining the PSI differences between species, which suggests that key ecological interactions will be preserved in ecosystem models that use these functional groups. A visual representation of the complete food web and calculation of food web statistics suggest that there are strong similarities between the food webs of the California Current and the Benguela Current, a similar upwelling-driven eastern boundary current off the southwest coast of Africa.
xi

xii

Acknowledgments
This work was supported by grants to support ecosystem models and management from the Gordon and Betty Moore Foundation and the David and Lucille Packard Foundation. Nick Tolimieri assisted with the MANOVA plots, Cameron Ainsworth pointed us toward the hierarchical clustering algorithms in R, Jameal Samhouri suggested the use of FoodWeb3D, and Eliza Heery provided assistance with R. Data and feedback were supplied by more individuals than can be listed here, but key contributors included John Field, Richard Brodeur, Todd Miller, and Patrick Ressler. Brad Hanson and Mike Ford improved our diet sources for marine mammals. We are deeply indebted to more than 75 authors listed in Appendix A, who performed the diet studies summarized here.
xiii

xiv
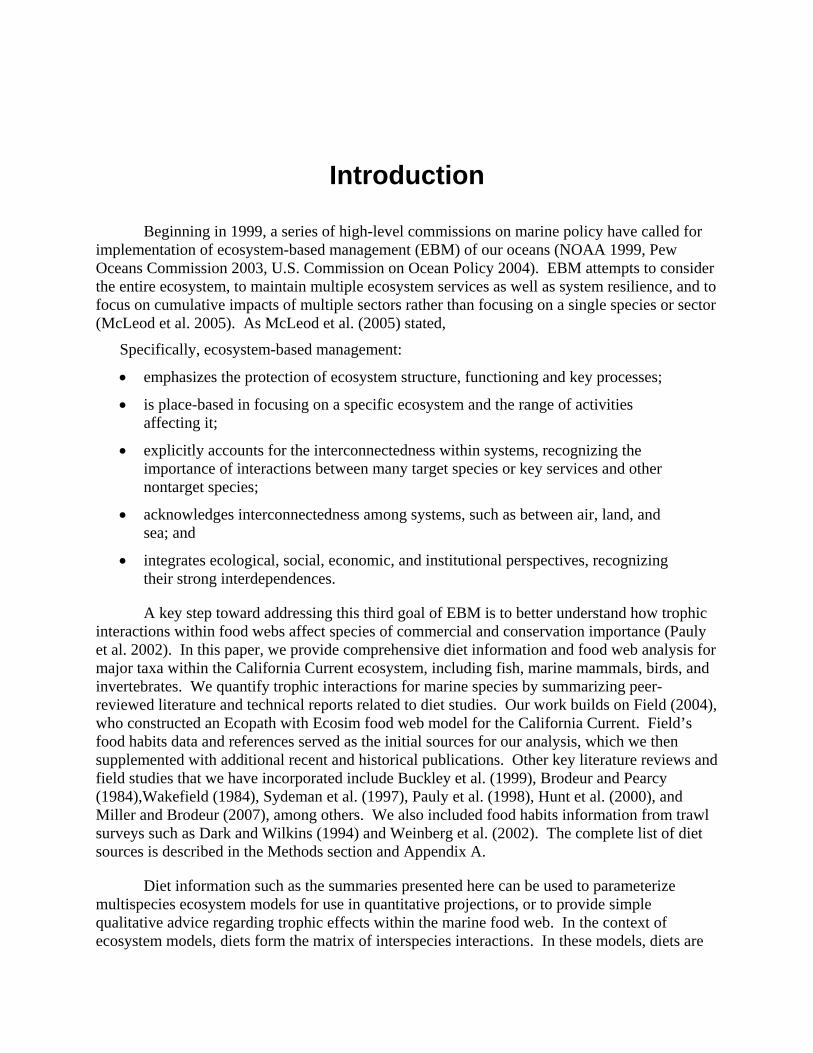
Introduction
Beginning in 1999, a series of high-level commissions on marine policy have called for implementation of ecosystem-based management (EBM) of our oceans (NOAA 1999, Pew Oceans Commission 2003, U.S. Commission on Ocean Policy 2004). EBM attempts to consider the entire ecosystem, to maintain multiple ecosystem services as well as system resilience, and to focus on cumulative impacts of multiple sectors rather than focusing on a single species or sector (McLeod et al. 2005). As McLeod et al. (2005) stated,
Specifically, ecosystem-based management:
• emphasizes the protection of ecosystem structure, functioning and key processes;
• is place-based in focusing on a specific ecosystem and the range of activities affecting it;
• explicitly accounts for the interconnectedness within systems, recognizing the importance of interactions between many target species or key services and other nontarget species;
• acknowledges interconnectedness among systems, such as between air, land, and sea; and
• integrates ecological, social, economic, and institutional perspectives, recognizing their strong interdependences.
A key step toward addressing this third goal of EBM is to better understand how trophic interactions within food webs affect species of commercial and conservation importance (Pauly et al. 2002). In this paper, we provide comprehensive diet information and food web analysis for major taxa within the California Current ecosystem, including fish, marine mammals, birds, and invertebrates. We quantify trophic interactions for marine species by summarizing peer-reviewed literature and technical reports related to diet studies. Our work builds on Field (2004), who constructed an Ecopath with Ecosim food web model for the California Current. Field’s food habits data and references served as the initial sources for our analysis, which we then supplemented with additional recent and historical publications. Other key literature reviews and field studies that we have incorporated include Buckley et al. (1999), Brodeur and Pearcy (1984),Wakefield (1984), Sydeman et al. (1997), Pauly et al. (1998), Hunt et al. (2000), and Miller and Brodeur (2007), among others. We also included food habits information from trawl surveys such as Dark and Wilkins (1994) and Weinberg et al. (2002). The complete list of diet sources is described in the Methods section and Appendix A.
Diet information such as the summaries presented here can be used to parameterize multispecies ecosystem models for use in quantitative projections, or to provide simple qualitative advice regarding trophic effects within the marine food web. In the context of ecosystem models, diets form the matrix of interspecies interactions. In these models, diets are

either fixed proportions, or more frequently vary in response to predator and prey abundance following a functional response (e.g., Atlantis, Ecosim, Walters et al. 2000, Christensen and Walters 2004, Fulton 2004, Fulton et al. 2007). For instance, the diets estimated in this study have been incorporated into two Atlantis ecosystem models of the U.S. West Coast and California Current (Kaplan and Levin 2009, Horne et al. in prep.). In the context of U.S. fishery management plans, decision makers may soon need to identify the predators and prey of species of commercial or conservation concern. Such requirements for strategic advice can be addressed graphically (as we have done in this report) or diets can be converted to food webs to qualitatively identify interactions within these food webs (Dambacher et al. 2002). The diet information provided in our synthesis can serve both these quantitative and qualitative roles.
Ecosystem models and EBM policies often aggregate species into functional groups or feeding guilds on the basis of diet, habitat, life history parameters, or fishery targeting. This is a necessary simplification for reasons related to field identification of species or specificity of catch or landings data, for computational reasons, and for ease of interpretation. However, ecological interactions such as intragroup competition and predation are lost in the formation of functional groups. Furthermore, functional groups are often formed based on expert opinion, as a compromise between the characteristics listed above. The ecosystem modeling literature suggests some guidelines for functional group formation, such as not aggregating species with drastically different turnover times or other rates, and not aggregating predators and prey (O’Neill and Rust 1979, Cale and Odell 1980, Gardner et al. 1982, Fulton et al. 2003). However, rarely have ecosystem modelers compared functional groups formed using these rules of thumb to those formed from statistical analyses of diet data, such as hierarchical clustering algorithms.
The goals of this study are to summarize diet information for key marine species of the U.S. West Coast at both the functional group and species levels, to identify key forage species in the California Current and diet overlaps between predators, to compare the functional groups from an Atlantis ecosystem model of the California Current (Brand et al. 2007, Kaplan and Levin 2009, Horne et al. in prep.) to functional groups based on diet similarity, and to compare this food web to other published marine food webs.
2

Methods
Data
We summarized the diets of marine species of the California Current ecosystem, which spans the entire U.S. West Coast. We compiled 75 sources, with 52 fish species comprising 22 functional groups (Appendix A). We also compiled diets from marine mammal, seabird, and invertebrate functional groups (Appendix A). Fish diets were from peer-reviewed journals and technical reports from 1957 to 2008, but primarily from the 1970s to present. The data span the oceanographic and ecological regime shift in the northern California Current in the late 1970s (Hare and Mantua 2000). Diet data for marine mammals relied heavily on a marine mammal diet review (Pauly 1998) and a review for seabird diets (Hunt 2000). We used diet data for invertebrates primarily from Field (2004) and a limited number of other sources. When diet data for a particular species were not available within the California Current, we included diets from other areas (e.g., Bering Sea) and noted these sources.
Our analysis focused on functional groups defined for the Atlantis ecosystem model of the California Current (Brand et al. 2007, Kaplan and Levin 2009). Most of these functional groups typically include several species. However, several functional groups are comprised of a single commercially important fish species, as these species are of particular interest to those working within the California Current.
For fish functional groups that were composed of multiple predator species, we weighted the diets by the relative biomass of the species within the functional group, based on NOAA Northwest Fisheries Science Center trawl survey data from 1998 to 2003 (Turk et al. 2001, Builder Ramsey et al. 2002, Keller et al. 2005, 2006a, 2006b, 2007). Prior to aggregating predator species into functional groups, we summarized all diet information for each predator species, differentiating between adult and juvenile predators and including percent by mass or volume diet data. When more than one data source was available for a species, we weighted each source by its sample size. Within studies, categories labeled as “unidentified” (e.g., unidentified flatfish or crustacea) were split among corresponding groups in the diet according to their existing relative weights. Specifically for “unidentified rockfish” as a prey item, we determined prey functional groups by considering the spatial overlap of predators and potential prey, as determined from trawl survey data (Turk et al. 2001, Builder Ramsey et al. 2002, Keller et al. 2005, 2006a, 2006b, 2007).
Diet data and population biomass estimates were available for most marine mammal, seabird, and invertebrate functional groups. In the absence of biomass estimates (most commonly for invertebrate groups), we inferred the final diet proportion based on related available literature (Appendix A). We adapted the majority of invertebrate diets from Field (2004).
3

Where possible, we differentiated between diets of adult predators and juvenile predators. For several functional groups, only one or a few species had published juvenile data, which we then used to calculate the juvenile diet data using the same method described above. In the absence of juvenile data, we assumed diets of juveniles were the same as that for adults (unless otherwise noted).
Table 1 summarizes the vertebrate species in each functional group and their relative proportion based on biomass. The species that comprise each functional group are ordered from largest to smallest proportion within the group, as stated in the first sentence for each group in Appendix A. Invertebrate functional groups are summarized in Table 2 and Appendix A.
Data Analysis
Functional Groups
To compare diet similarities between functional groups, we created a dendrogram using an agglomerative hierarchical cluster analysis. We first formed a complete diet matrix containing predator functional groups as rows and prey functional groups as columns. A Euclidian distance matrix was created in the statistical program R (MASS package, R version 2.9.1, University of Auckland, New Zealand) from the diet data. The data were clustered using the complete (MAX) method of linkage to create a dendrogram. We used the dendrogram in conjunction with the raw diet data to establish feeding guilds and to more effectively display functional group diet data.
We calculated percent similarity index (PSI) to assess diet overlap between functional groups. Complete diets of fish feeding guilds were arranged in a matrix similar to that described above for the cluster analysis. We used the PSI methods as described by Miller and Brodeur (2007), adapted from Schoener (1974), and implemented in the statistical software R. Diet overlaps were deemed significant if their index value was greater than 60 (Wallace and Ramsay 1983).
1005.11
, ×⎥⎦
⎤⎢⎣
⎡−−= ∑
=
n
kjkikji ppPSI
where p is the proportion of diet of predator i or j that is comprised of prey species k (Miller and Brodeur 2007).
Species Data
Our fish functional groups were defined prior to this work (Brand et al. 2007), based on a compromise between qualitative diet information, fishery targeting, habitat use, and management concerns. Here we used species-level quantitative fish diet information to assess how these original functional groups compare to feeding guilds suggested by hierarchical clustering and the PSI. Our methods for species data analysis were hierarchical cluster analysis and PSI, similar to the approach for functional groups. We calculated average PSI values and proportion of significant diet overlaps for species pairs within versus between functional groups. We analyzed
4

the significance of these values by performing a multivariate analysis of variance (MANOVA) in Primer (Primer, Version 6.1.11 with Permanova+, Version 1.0.1, Plymouth Marine Laboratory, Plymouth, United Kingdom).
Food Web
We constructed a visual representation of the complete California Current food web using the software Foodweb3d (Ver. 1.01, 2002, Pacific Ecoinformatics and Computational Ecology Laboratory, Berkeley, California). We used the diet data at the functional group level. Constructing a three-dimensional food web at the species level would require further resolution of all predators and prey to species-level taxonomic resolution.
For the food web analysis, any juvenile prey items were aggregated with their adult counterpart. This ensured that there were no species duplicated within the food web. Additionally, many published food webs lack any distinction between life stages of the included species (Opitz 1996, Yodzis 1998, Link 2002).
Summary statistics that we used to describe food web characteristics (Pimm 1980) include:
%B (basal species)—the percent of species (functional groups) that have no prey linkages in the food web (These groups can be autotrophs or groups that lack diet data.),
%T (top species)—the percent of species with no known predator, and
%I (intermediate species)—the percent of species that are neither basal nor top species.
We also describe the food web with metrics from Dunne et al. (2004), including:
L/S—links per species,
C = L/S2—connectance,
%O (omnivorous)—the percent of species that are omnivorous (have trophic linkages to multiple trophic levels), and
%C (cannibalistic)—the percent of species that are cannibalistic.
We compared this study’s food web to others compiled by Dunne et al. (2004).
5
Results
Diet Summary
Diet sources for each species or functional group are included in Appendix A. Complete diet summaries of functional groups are listed in Appendix B and complete diets of fish species are listed in Appendix C.
Cluster Analysis: Functional Group Level
Results from the hierarchical cluster analysis are shown in Figure 1. Based on this dendrogram, we subjectively formed 10 feeding guilds (boxes in Figure 1) that we used to structure the discussion below.
Feeding guilds generally contain species with similar diets (Figure 2 through Figure 9). Benthic detritivores and meiobenthos make up feeding guild A, primarily preying on detritus (Figure 2). Guild B contains groups feeding on large zooplankton (e.g., euphausiids, Figure 2). Guild C contains piscivorous groups targeting small planktivorous fishes (Figure 3). Guild D includes invertebrate consumer groups that prey on phytoplankton and small zooplankton groups (Figure 3). Transient killer whales (Orcinus orca) do not share diets with any groups and are excluded from all guilds (Figure 3). Guild E functional groups feed on benthic invertebrate taxa in high proportions, particularly deposit feeders such as polychaetes, amphipods, and other small crustaceans (Figure 4). Guild F preys primarily on various benthic invertebrate taxa such as herbivorous grazers (urchins) and megazoobenthos (crabs) (Figure 5). Guild G feeds on a variety of zooplankton groups including large zooplankton (euphausiids), mesozooplankton (copepods), and gelatinous zooplankton (jellyfish) (Figure 6). Other components of this guild’s diets vary considerably by species, from phytoplankton to fish. Guild H contains largely high trophic level carnivorous functional groups (Figure 7). This group can be subdivided into groups specializing in benthic versus pelagic prey, although overlaps exist. Large demersal predators (lingcod [Ophiodon elongatus]), pelagic sharks, diving seabirds, and large flatfish all consume large amounts of pelagic prey such as small planktivores and miscellaneous nearshore fishes. The remaining groups including skates and rays, deep small rockfish, and deep miscellaneous fishes target benthic prey such as deposit feeders (amphipods and small crustacea), deep miscellaneous fishes, and shrimp (Figure 7). Guild I is composed of high trophic level functional groups that prey heavily on cephalopods (squid) (Figure 8). Guild J contains two invertebrate functional groups which rely heavily upon detritus in their diet (Figure 9).
PSI: Functional Group Level
PSIs for functional groups revealed few diet overlaps higher than 60% (Table 3). Of these significant diet overlaps, a large proportion occurred in guild B, which feed primarily on zooplankton (Table 3, Figure 2). These groups include Pacific hake (Merluccius productus),
6

canary rockfish (Sebastes pinniger), shallow large rockfish, small planktivores, cephalopods, and large planktivores. Functional groups preying on small planktivorous fish also had significant diet overlaps, including Chinook salmon (Oncorhynchus tshawytscha), albacore tuna (Thunnus alalunga), migrating seabirds, and surface seabirds. Further significant diet overlaps occurred for English sole (Parophrys vetulus), small flatfish, small cetaceans, and toothed whales, but are not surprising given the similar dietary habits of each group. We calculated a high percent similarity for baleen whales and shallow small rockfish such as rosethorn (Sebastes helvomaculatus) and greenstriped (S. Elongatus) rockfish. These species are in feeding guild E and prey heavily on benthic deposit feeders (e.g., primarily small crustacea and polychaetes) and large zooplankton (euphausiids).
Food Web Structure Analysis
Food web metrics indicate that the California Current is highly connected, has a high proportion of cannibalistic and basal species, and has a low proportion of omnivorous species (i.e., those that prey on multiple trophic levels) when compared to other food webs (Table 4, Figure 10). The number of functional groups included in our food web is also comparable to those reported in Dunne et al. (2004), despite the aggregation of our species into functional groups. The Benguela Current food web is comparable to the California Current food web in that it is an eastern boundary current with strong upwelling and high abundances of clupeids and hake (Merluccius spp.). Yodzis’ (1998) Benguela food web is highly comparable to ours across most metrics (connectivity, links/species, and percent intermediate and top predators). However, relative to the Benguela Current (located off the southwest coast of Africa), the California Current has a lower proportion of omnivorous species and a higher percentage of basal groups and cannibalistic groups. These characteristics of the California Current are also apparent when comparing it to the three other reef and shelf food webs (Table 4) (Opitz 1996, Link 2002).
It is likely that the California Current food web’s increased proportion of basal species is due to sampling methods. The number of basal species is highly sensitive to the completeness of the food web. Our food web, like many others used for ecosystem modeling, is biased toward fish species, while basal and low trophic level species are aggregated into larger functional groups, decreasing the number of basal groups represented in the food web. The northeast U.S. shelf (Link 2002) food web has fewer species per functional group than our representation of the California Current. The taxonomic groups included by Link (2002) are very similar, however.
We were unable to accurately enumerate total species that contributed to the food web because our literature sources frequently only identified prey to functional group. However, we estimate approximately 200 (±50) vertebrate and invertebrate species in total were included in this food web.
Analyses for Fish at the Species Level
Cluster analysis of species-level data for fish yielded eight feeding guilds similar to those described above for functional groups (Figure 11). A large number of species clustered in guild A, all feeding heavily on large zooplankton (Figure 12). Pacific viperfish diets were dissimilar from any other species and were excluded from feeding guilds. Guild B contains species that feed primarily on small planktivorous fish (Figure 13). Guild C contains two species of lampfish
7

feeding largely on mesozooplankton (e.g., copepods) (Figure 13). Guild D includes four species of flatfish feeding on small benthic prey, such as benthic carnivores (polychaetes) and deposit feeders (small crustaceans). Guild E species, ranging from skates to flatfish, fed on a variety of benthic fauna including small flatfish and shrimp (Figure 14). Guild F species largely feed on cephalopods (squid) and to a lesser degree on high trophic level fishes (Figure 15). Guild G species feed on a variety of large zooplankton (euphausiids), gelatinous zooplankton (jellyfish), deposit feeders (amphipods), and benthic herbivorous grazers (snails, urchins, etc.). Guild H contains species feeding on various fish (e.g., Pacific hake and small planktivores) and benthic invertebrates including deposit feeders (amphipods) and megazoobenthos (crabs) (Figure 16).
The cluster analysis for fish at the species level (Figure 17) indicated that most species had very similar diets to other species within their functional group. For example, the small flatfish group, made up of Dover sole (Microstomus pacificus), rex sole (Glyptocephalus zachirus), Pacific sanddab (Citharichthys sordidus) and deepsea sole (Embassichthys bathybius) all cluster within species guild D. Similarly, the three species within the skate functional group all cluster into guild E. The species-level dendrogram reveals other similarities that might be expected based on our preconceptions about functional groups, such as clustering of sardines and anchovies, arrowtooth flounder (Atheresthes stomias) and Pacific halibut (Hippoglossus stenolepis), widow (Sebastes entomelas) and yellowtail rockfish (S. flavidus), and sixgill (Hexanchus griseus) and sleeper sharks (Somniosus pacificus).
A few species do not cluster close to others within their functional group. The deep vertical migratory group, consisting of Pacific viperfish (Chauliodus macouni), blue lanternfish (Tarletonbeania crenularis), California headlightfish (Diaphus theta), garnet lampfish (Stenobrachius nannochir), and northern lampfish (S. leucopsarus), is only loosely related according to the species-level cluster analysis. Pacific viperfish (Figure 11 and Figure 12) diets are dissimilar from those of other species within this functional group, which generally feed on large and small zooplankton. Pacific viperfish feed almost exclusively on other deep vertically migrating fish (e.g., Myctophids) and were not assigned to a feeding guild for this reason. Blue lanternfish and California headlightfish cluster in group A, though their diets are less related. The remaining two species, garnet lampfish and northern lampfish, both cluster together in species guild C.
PSIs between fish species support the appropriateness of the majority of our functional groups for explaining diet variation between species (Table 5). On average, PSI was higher between species within a single functional group than between species in different groups (37.2 to 19.6, respectively). In addition, significant diet overlaps (>60%) were three times more likely within a functional group (21% and 7%, respectively). We found our functional groups to be highly significant in explaining the PSI between species (MANOVA, F13 = 2.6138, p = 0.001). A MANOVA plot of the species-level fish diets (Figure 17) identifies seven major axes of prey species, including large zooplankton, benthic invertebrates, Pacific hake and small pelagic fish; these are similar to the prey that define the species-level feeding guilds identified in the dendrogram (Figure 11).
8

Discussion
The diet summaries presented in Figure 2 through Figure 9, Figure 12 through Figure 16, and Appendix B and Appendix C present a synoptic view of marine species diets in the California Current. We have attempted to compile a comprehensive list of more than 75 sources of diet information (Appendix A). The diet summaries provide a convenient representative diet per predator species or functional group, averaging across disparate studies. For instance, our estimate that 40% of yellowtail rockfish diets are large zooplankton (euphausiids) is the weighted average of four studies, including but down-weighting a study of only 22 fish by Pereyra et al. (1969) that attributed only 13% of the diet to large zooplankton. In other cases our diet summaries for a predator stem from a single study (e.g., English sole) or several studies reporting similar diet composition (e.g., all four diets studies for canary rockfish indicate heavy predation on euphausiids and other large zooplankton). In these cases our summaries do not add any novel interpretation but may provide an easy reference for future applications.
Key prey functional groups were identified through both the functional group-level and species-level analyses. Many predator functional groups preyed heavily on the following, ranked by order of importance: large zooplankton (primarily euphausiids), deposit feeders (amphipods and other crustaceans), small planktivores (Pacific herring [Clupea pallasii], northern anchovy [Engraulis mordax], Pacific sardine [Sardinops sagax]), and phytoplankton. Large zooplankton such as euphausiids were particularly important, and were consumed by large planktivores, cephalopods, small planktivores, shallow large rockfish, canary rockfish, Pacific hake, deep vertical migrators, small demersal sharks, and midwater rockfish. The species-level analysis of fish predators yielded similar prey groups, with shrimp replacing phytoplankton as the fourth most utilized prey resource.
The PSI analysis identified both intuitive and novel overlaps in diet composition. We generally calculated high overlap when comparing species within functional groups and functional groups within guilds. One intuitive interaction is among Chinook salmon, albacore tuna, migrating seabirds, surface seabirds, and diving seabirds, all of which compete for small planktivorous fish prey. Similarly, we calculated high PSI for functional groups that fed primarily on euphausiids, cephalopods, or deposit feeders such as amphipods and snails. A diet overlap that may be somewhat unexpected was between baleen whales and shallow small rockfish. Gray whales (Eschrichtius robustus), which compose the majority of the baleen whale functional group biomass, scour the bottom to prey on deposit feeders. In addition, both baleen whales and shallow small rockfish prey heavily on euphausiids and other large zooplankton.
The species-level cluster analysis, PSIs, and MANOVA support the aggregation of fish species within the California Current into the functional groups considered here and originally defined for the Atlantis ecosystem model of Brand et al. (2007). Examples where our analysis of diets suggested a substantially different aggregation than our original functional groups were primarily cases where life history characteristics or fishery targeting rather than diets had driven the original functional group aggregation (e.g., combining the chondrichthyans spotted ratfish
9

[Hydrolagus colliei] and Pacific dogfish [Squalus acanthias] or aggregating Pacific sanddabs with other flatfish such as rex, deepsea, and Dover soles). For a few species (such as Pacific viperfish), new diet information from our literature search suggests specific improvements for future functional group aggregation.
As noted above, the California Current food web is particularly dependent on euphausiids as a key forage resource. This may imply substantial impacts of climate change on this food web. Current projections of CO2 emissions and atmospheric modeling suggest declines in pH of ocean water of 0.14–0.35 by 2100 (IPCC 2007) that could lead to decreased shell calcification rates and increased mortality for arthropods such as euphausiids. However, Fabry et al. (2008) suggest that the effect of acidification on euphausiids is unknown, though Yamada and Ikeda (1999) found increased mortality with prolonged exposure to very low pH (<7.6). Other calcifying groups likely to decline under acidification include bivalves, sea urchins, brittle stars, and pteropods (Fabry et al. 2008), and predators of these would either switch to alternate prey or themselves decline in abundance or weight-at-age.
The diet summaries presented here are primarily derived from data from the 1970s to present. However, diets are likely to change with fluctuations in predator and prey abundance. For instance, northward range expansions in fish have been documented in the North Sea (Perry et al. 2005), and similar range expansions of subtropical species may occur in the California Current as water temperatures rise. For instance, Humboldt squid (Dosidicus gigas) once common off Baja California, Mexico, migrated as far north as British Columbia during warm El Niño periods and established themselves in those ranges thereafter (Field et al. 2007, Zeidberg and Robison 2007). This may drastically change the food web by introducing new competitive and predatory interactions. Field et al. (2007) suggest that Pacific hake, rockfish, and cephalopods are the three dominant prey items of Humboldt squid, and that the high productivity and consumption rates makes this predator’s impacts particularly strong.
In conclusion, the diet summaries presented here can serve as the backbone of a range of analyses meant to support EBM and modeling. Stock assessment authors and managers setting allowable biological catches may consult the diet tables and figures, cluster diagrams of feeding guilds, or PSIs to identify impacts of harvest decisions in the food web context of the California Current. The diet data can be used at a range of levels, ranging from qualitative descriptions of predators and prey of a target species (e.g., Kaplan and Helser 2007) to quantitative modeling of tradeoffs in the food web for tactical management decisions (similar to Dorn et al. 2008) or strategic scoping of policy options (Kaplan and Levin 2009, Horne et al. in prep).
10

11
Figures 1–17 and Tables 1–5

Figure 1. Dendrogram of California Current diets derived from the hierarchical cluster analysis. The
Height scale is the Euclidian distance created by the distance matrix prior to clustering. Feeding guilds A through J, subjectively formed to simplify discussion of results, are delineated. For a synopsis of species included in vertebrate and invertebrate groups, see Table 1 and Table 2, respectively. For raw diet data, see Figure 2 through Figure 9 and Appendix B.
12

0% 20% 40% 60% 80% 100%
Deposit feeders
Meiobenthos
Deep vert. migrators
Pacific hake
Canary rockfish
Shallow large rockfish
Small planktivores
Cephalopods
Large planktivoresA
AB
BB
BB
BB
Percent diet composition
Deposit feeders
Benthic herb. grazers
Megazoobenthos
Cephalopods
Detritus in sediment
Deep vert. migrators
Pacific hake
Small planktivores
Large phytoplankton
ShrimpLarge zooplanton
Mesozooplankton
Figure 2. Percent diet composition of feeding guilds A and B (Figure 1). The feeding guilds were formed
based on the functional group level hierarchical cluster analysis. The two groups in guild A feed almost exclusively on detritus. All groups in guild B prey heavily on large zooplankton. Prey taxa making up less than 2% of total diet proportion are excluded from this figure. For species names per vertebrate or invertebrate functional group, see Table 1 and Table 2, respectively.
0% 20% 40% 60% 80% 100%
Transient orcas
Large pelagicpredators
Chinook salmon
Migratingseabirds
Surface seabirds
Other benthicfilter feeders
Mesozooplankton
Benthic herb.grazers
Largezooplankton
CC
CC
DD
DD
Percent diet composition
Deposit feedersOther benthic filter feedersMegazoobenthosCephalopodsCarrionLabile detritusDetritus in sedimentDeep vert. migratorsDeep small rockfishDeep misc. fishesMisc. nearshore fishDeep large rockfishMidwater rockfishPacific hakeSmall planktivoresMacroalgaePinnipedsBaleen whalesSmall cetaceansToothed whalesLarge phytoplanktonSmall phytoplanktonGelatinous zooplanktonLarge zooplantonMesozooplanktonMicrozooplankton
Figure 3. Percent diet composition of feeding guilds C and D (Figure 1) from the functional group level
hierarchical cluster analysis. Functional groups in guild C prey on a mixture of small planktivores and zooplankton. Guild D groups feed on a mixture of phytoplankton and microzooplankton (dinoflagellates and ciliates). Transient orcas were not assigned to a feeding guild because their diet was dissimilar from all other functional groups. Prey taxa making up less than 2% of total diet proportion are excluded from this figure. For species names per vertebrate or invertebrate functional group, see Table 1 and Table 2, respectively.
13

0% 20% 40% 60% 80% 100%
Shrimp
Small flatfish
Megazoobenthos
Misc. nearshorefish
Shallow smallrockfish
Baleen whales
Benthiccarnivores
English soleE
EE
EE
EE
E
Percent diet composition
Benthic carnivores
Deposit feeders
Other benthic filter feeders
Benthic herb. grazers
Deep macrozoobenthos
Megazoobenthos
Labile detritus
Detritus in sediment
Deep vert. migrators
Small planktivores
Shrimp
Large zooplanton
Figure 4. Percent diet composition of feeding guild E (Figure 1) from the functional group level
hierarchical cluster analysis. All functional groups in this guild largely prey on benthic taxa including deposit feeders (amphipods, small crustacea) and other small benthic invertebrates. Prey taxa making up less than 2% of total diet proportion are excluded from this figure. For species names per vertebrate or invertebrate functional group, see Table 1 and Table 2, respectively.
0% 20% 40% 60% 80% 100%
Shallowmacrozoobenthos
Deepmacrozoobenthos
Sea otters
FF
F
Percent diet composition
Deposit feeders
Deep benthic filter feeders
Other benthic filter feeders
Benthic herb. grazers
Deep macrozoobenthos
Megazoobenthos
Labile detritus
Large zooplanton
Figure 5. Percent diet composition of feeding guild F (Figure 1) from the functional group level hierarchical cluster analysis. Functional groups in this guild prey on a range of large benthic invertebrate taxa including other benthic filter feeders (bivalves) and megazoobenthos (crabs). Prey taxa making up less than 2% of total diet proportion are excluded from this figure. For species names per vertebrate or invertebrate functional group, see Table 1 and Table 2, respectively.
14

0% 20% 40% 60% 80% 100%
Midwaterrockfish
Small demersalsharks
Deep benthicfilter feeders
Gelatinouszooplankton
GG
GG
Percent diet composition
Benthic bacteriaDeposit feedersOther benthic filter feedersBenthic herb. grazersMegazoobenthosCephalopodsLabile detritusDeep vert. migratorsSmall flatfishMidwater rockfishSmall planktivoresLarge phytoplanktonSmall phytoplanktonShrimpSmall demersal sharksGelatinous zooplanktonLarge zooplantonMesozooplanktonMicrozooplankton
Figure 6. Percent diet composition of feeding guild G (Figure 1) from the functional group level
hierarchical cluster analysis. Functional groups in this guild prey on a variety of zooplankton groups including large zooplankton (euphausiids), mesozooplankton (copepods), and gelatinous zooplankton (jellyfish). Prey taxa making up less than 2% of total diet proportion are excluded from this figure. For species names per vertebrate or invertebrate functional group, see Table 1 and Table 2, respectively.
15

0% 20% 40% 60% 80% 100%
Large demersal pred.
Pelagic sharks
Diving seabirds
Large flatfish
Deep large rockfish
Sablefish
Skates and rays
Deep small rockfish
Deep misc. fishesH
HH
HH
HH
HH
Percent diet composition
Benthic carnivoresDeposit feedersSh. benthic filter feedersBenthic herb. grazersDeep macrozoobenthosMegazoobenthosSh. macrozoobenthosMeiobenthosCephalopodsCarrionDeep vert. migratorsShallow small rockfishDeep small rockfishDeep misc. fishesMisc. nearshore fishSmall flatfishDeep large rockfishMidwater rockfishPacific hakeLarge planktivoresSmall planktivoresChinook salmonLarge flatfishShrimpSmall demersal sharksLarge zooplanton
Figure 7. Percent diet composition of feeding guild H (Figure 1) from the functional group level
hierarchical cluster analysis. Guild H contains high trophic level carnivorous functional groups. This group can be subdivided into groups specializing in benthic versus pelagic prey. Large demersal predators (lingcod), pelagic sharks, diving seabirds, and large flatfish primarily consume pelagic prey such as small planktivores and miscellaneous nearshore fish. The remaining groups, including skates and rays, deep small rockfish, and deep miscellaneous fishes, target benthic prey such as deposit feeders (amphipods and small crustacea), deep miscellaneous fishes, and shrimp. Prey taxa making up less than 2% of total diet proportion are excluded from this figure. For species names per vertebrate or invertebrate functional group, see Table 1 and Table 2, respectively.
0% 20% 40% 60% 80% 100%
Pinnipeds
Toothed whales
Large demersalsharks
Small cetaceans
II
II
Percent diet composition
Deposit feedersOther benthic filter feedersMegazoobenthosCephalopodsDeep vert. migratorsDeep small rockfishDeep misc. fishesMisc. nearshore fishMidwater rockfishPacific hakeLarge planktivoresSmall planktivoresChinook salmonLarge pelagic predatorsPinnipedsShrimpSmall demersal sharksSkates and rays
Figure 8. Percent diet composition of feeding guild I (Figure 1) from the functional group level
hierarchical cluster analysis. Functional groups in this guild all prey on cephalopods to some degree. Prey taxa making up less than 2% of total diet proportion are excluded from this figure. For species names per vertebrate or invertebrate functional group, see Table 1 and Table 2, respectively.
16

0% 20% 40% 60% 80% 100%
Shallow benthicfilter feeders
MicrozooplanktonJ
J
Percent diet composition
Labile detritus
Large phytoplankton
Small phytoplankton
Mesozooplankton
Microzooplankton
Figure 9. Percent diet composition of feeding guild J (Figure 1) from the functional group level
hierarchical cluster analysis. Functional groups in this guild eat detritus and microzooplankton (dinoflagellates and ciliates). Prey taxa making up less than 2% of total diet proportion are excluded from this figure. For species names per vertebrate or invertebrate functional group, see Table 1 and Table 2, respectively.
Figure 10. Visual representation of California Current food web structure. Each node represents a
functional group, and height of the nodes represents trophic level. Diet linkages are indicated by lines. Basal species are indicated by red nodes and top species are indicated by yellow nodes. Intermediate species fall somewhere between red and yellow and are indicated by shades of orange. Predator linkages to basal species are indicated by yellow lines and predatory linkages to other intermediate or top species are indicated by green lines. Loops from a node to itself indicate cannibalism. (Image produced with FoodWeb3D, written by R. J. Williams, and provided by the Pacific Ecoinformatics and Computational Ecology Laboratory, Berkeley, California.)
17

Figure 11. Dendrogram of California Current fish-only diets derived from the hierarchical cluster
analysis. The Height scale is the Euclidian distance created by the distance matrix prior to clustering. Feeding guilds A through H, subjectively formed to simplify discussion of results, are delineated. For a synopsis of species included in fish functional groups, see Table 1. For raw diet data, see Figure 12 through Figure 16.
18
0% 20% 40% 60% 80% 100%
Pacific viperfishBlue lanternfishPygmy rockfish
Redstripe rockfishCanary rockfish
Splitnose rockfishPacific hake
Pacific herringSharpchin rockfish
Jack mackerelNorthern anchovy
Pacific sardineSpiny dogfish
California headlightfishPacific mackerel
Pacific ocean perchDarkblotched rockfishGreenstriped rockfish
AA
AA
AA
AA
AA
AA
AA
AA
A
Percent diet composition
Deposit feeders
Benthic herb. grazers
Megazoobenthos
Cephalopods
Deep vert. migrators
Juv. deep misc. fishes
Small flatfish
Pacific hake
Juv. Pacific hake
Lg. planktivores
Sm. planktivores
Lg. phytoplankton
Shrimp
Sm. demersal sharks
Gelatinous zooplankton
Lg. zooplankton
Mesozooplankton
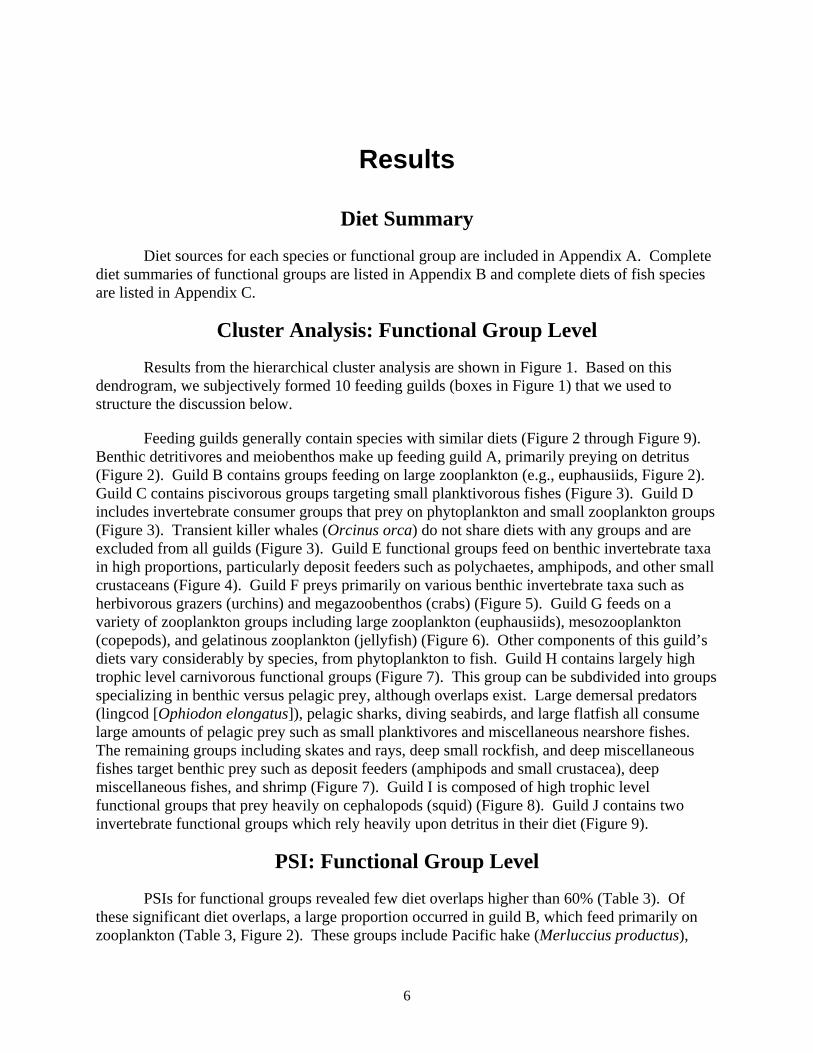
Figure 12. Percent diet composition of feeding guild A (Figure 11) from the species-level hierarchical
cluster analysis. All species contain substantial contributions of zooplankton in their diet. Pacific viperfish were not assigned to a feeding guild because their diet was dissimilar from all other functional groups. Prey taxa making up less than 2% of total diet proportion are excluded from this figure. For predator species names and invertebrate prey functional group taxa, see Table 1 and Table 2, respectively.
0% 20% 40% 60% 80% 100%
Blue rockfish
Albacore tuna
Black rockfish
Chinook salmon
Garnet lampfish
Northern lampfish
BB
BB
CC
Percent diet composition
Deposit feeders
Sh. benthic filter feeders
Megazoobenthos
Cephalopods
Deep vert. migrators
Juv. deep sm. rockfish
Juv. deep lg. rockfish
Juv. midwater rockfish
Juv. Pacific hake
Small planktivores
Juv. Chinook salmon
Mesozooplankton Figure 13. Percent diet composition of feeding guilds B and C (Figure 11) from the species-level
hierarchical cluster analysis. Species in guild B feed predominately on small planktivorous fish. Feeding guild C species target mesozooplankton (copepods). Prey taxa making up less than 2% of total diet proportion are excluded from this figure. For predator species names and prey functional group taxa, see Table 1 and Table 2, respectively.
19
0% 20% 40% 60% 80% 100%
English sole
Rex sole
Deepsea sole
Dover sole
Petrale sole
Bering skate
Big skate
Pacific sanddab
Giant grenadier
Longnose skateD
DD
DE
EE
EE
E
Percent diet composition
Benthic carnivoresDeposit feedersDp. benthic filter feedersOther benthic filter feedersBenthic herb. grazersDeep macrozoobenthosMegazoobenthosSh. macrozoobenthosCephalopodsDeep vert. migratorsSh. small rockfishJuv. deep sm. rockfishDeep misc. fishesMisc. nearshore fishSmall flatfishJuv. midwater rockfishPacific hakeLarge flatfishShrimpLarge zooplankton
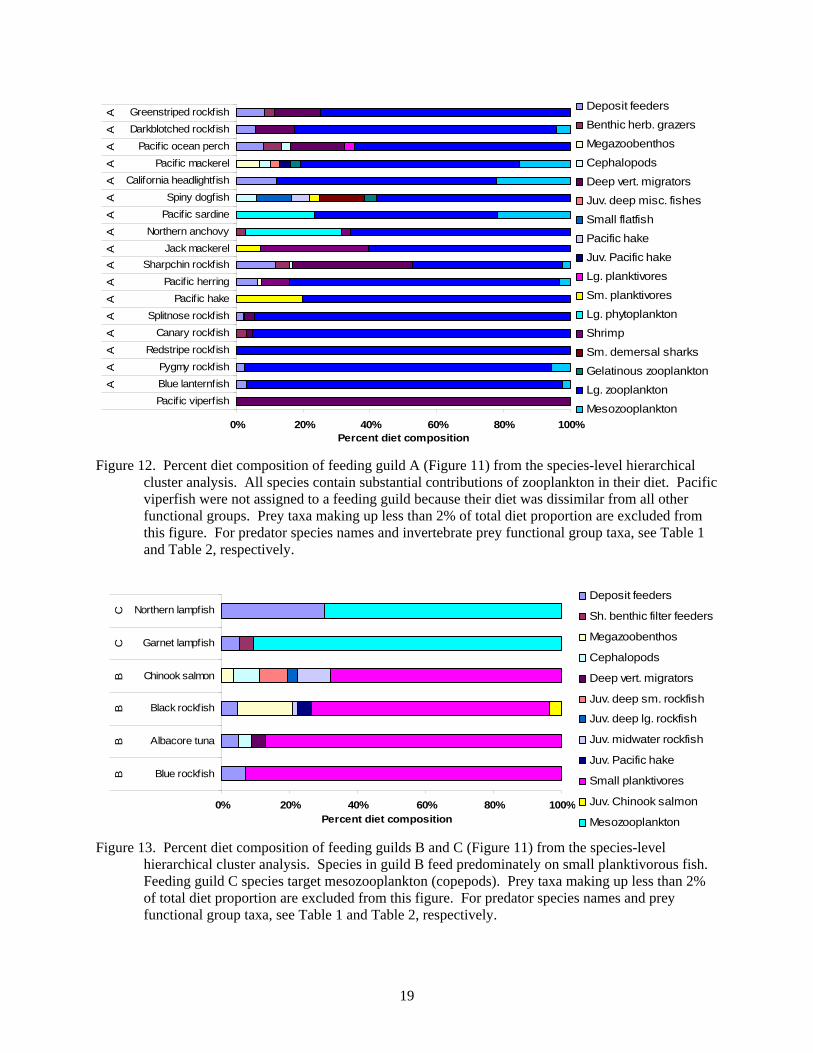
Figure 14. Percent diet composition of feeding guild D and E (Figure 11) from the species-level
hierarchical cluster analysis (Figure 9). Guild D contains four species of flatfish feeding on small benthic prey such as benthic carnivores (polychaetes) and deposit feeders (small crustacean). Guild E primarily feeds on shrimp and small flatfish. Prey taxa making up less than 2% of total diet proportion are excluded from this figure. For predator species names and prey functional group taxa, see Table 1 and Table 2, respectively.
0% 20% 40% 60% 80% 100%
Pacific grenadier
Sixgill shark
Sleeper shark
Widow rockfish
Yellowtail rockfish
Northern smoothtongue
Twoline eelpout
Rosethorn rockfish
Rougheye rockfish
FF
FG
GG
GG
G
Percent diet Composition
Benthic carnivoresDeposit feedersOther benthic filter feedersSh. benthic filter feedersBenthic herb. grazersMegazoobenthosCephalopodsDeep vert. migratorsDeep small rockfishDeep misc. fishesMisc. nearshore fishJuv. small flatfishPacific hakeJuv. Pacific hakeJuv. sablefishSmall planktivoresChinook salmonLarge planktivoresPinnipedsShrimpSmall demersal sharksGelatinous zooplanktonLarge zooplanktonMesozooplankton
Figure 15. Percent diet composition of feeding guilds F and G (Figure 11) from the species-level hierarchical cluster analysis. Species in guild F largely feed on cephalopods (squid) and to a lesser degree high trophic level fishes. Guild G species feed on a variety of large zooplankton (euphausiids), gelatinous zooplankton (jellyfish), deposit feeders (amphipods), and benthic herbivorous grazers (snails, urchins, etc.). Prey taxa making up less than 2% of total diet proportion are excluded from this figure. For predator species names and prey functional group taxa, see Table 1 and Table 2, respectively.
20

0% 20% 40% 60% 80% 100%
Spotted ratfish
Longspine thornyhead
Shortspine thornyhead
Lingcod
Soupfin sharks
Yelloweye rockfish
Sablefish
Arrowtooth flounder
Pacific halibutH
HH
HH
HH
HH
Percent diet composition
Benthic carnivoresDeposit feedersOther benthic filter feedersBenthic herb. grazersDeep macrozoobenthosMegazoobenthosCephalopodsCarrionDeep vert. migratorsSh. small rockfishDeep small rockfishJuv. deep sm. rockfishDeep misc. fishesMisc. nearshore fishSmall flatfishDeep large rockfishMidwater rockfishJuv. midwater rockfishPacific hakeJuv. Pacific hakeLarge planktivoresSmall planktivoresChinook salmonLarge flatfishLingcodShrimpJuv. sm. demersal sharksLarge zooplankton
Figure 16. Percent diet composition of feeding guild H (Figure 11) from the species-level hierarchical
cluster analysis. Species within this guild feed on various fish (e.g., Pacific hake and small planktivores) and benthic invertebrates including deposit feeders (amphipods) and megazoobenthos (crabs). Prey taxa making up less than 2% of total diet proportion are excluded from this figure. For predator species names and prey functional group taxa, see Table 1 and Table 2, respectively.
21

Figure 17. MANOVA plot of the PSI of species-level data. CAP1 and CAP2 are axes that represent diet
composition from the canonical analysis of principal coordinates. Each symbol on the graph represents a predator species and the legend indicates functional groups for those species. Black axes radiating from the center represent key prey items that differentiate predator feeding habits. Fish prey group 1 includes juvenile rockfish species, shallow large rockfish, and small demersal sharks. Fish prey group 2 includes small flatfish, sablefish, and Chinook salmon. Fish prey group 3 includes midwater rockfish, juvenile sablefish, deep small rockfish, and large flatfish.
22

Table 1. Vertebrate species included in the functional group analysis and their respective proportional biomass within the functional group. Relative abundances for all fish groups except miscellaneous nearshore fish (e.g., sculpin, croakers) are taken from the NWFSC trawl survey data, 1998–2003. See Appendix A for seabird and marine mammal relative abundances. Functional groups and codes are from Brand et al. (2007), though group compositions may change slightly. NA = not available.
Code Group Common name Scientific name ProportionSHR Shallow large rockfish Adult Redstripe rockfish Sebastes proriger 0.95 Adult Yelloweye rockfish S. ruberrimus 0.05 Adult Blue rockfish S. mystinus <.01 Juv. Copper rockfish S. caurinus 0.50 Juv. Blue rockfish S. mystinus 0.50FDP English sole Adult English sole Parophrys vetulus 1.00 Juv. English sole P. vetulus NAFDC Deep small rockfish Adult Longspine thornyhead Sebastolobus altivelis 0.63 Adult Sharpchin rockfish Sebastes zacentrus 0.20 Adult Splitnose rockfish S. diploproa 0.17 Juv. Splitnose rockfish S. diploproa NAFDO Deep large rockfish Adult Shortspine thornyhead Sebastolobus alascanus 0.75 Adult Darkblotched rockfish Sebastes crameri 0.24 Adult Rougheye rockfish S. aleutianus 0.01 Juv. Darkblotched rockfish S. crameri 1.00FPO Canary rockfish Adult Canary rockfish S. pinniger 1.00 Juv. Canary rockfish S. pinniger 1.00FDS Midwater rockfish Adult Widow rockfish S. entomelas 0.43 Adult Pacific ocean perch S. alutus 0.34 Adult Yellowtail rockfish S. flavidus 0.23 Adult Black rockfish S. melanops <0.01 Juv. Chilipepper rockfish S. goodei 0.64 Juv. Yellowtail rockfish S. flavidus 0.22 Juv. Widow rockfish S. entomelas 0.12 Juv. Bocaccio S. paucispinis 0.03FDB Shallow small rockfish Adult Rosethorn rockfish S. helvomaculatus 0.71 Adult Greenstriped rockfish S. elongatus 0.24 Adult Pygmy rockfish S. wilsoni 0.06 Juv. Shortbelly rockfish S. jordani 1.00FDE Misc. nearshore fish Juv. White croaker Genyonemus lineatus NA Juv. Sculpin Cottidae NA Juv. Midshipman Porichthys notatus NAFPL Large planktivores Adult Pacific mackerel Scomber japonicus 0.59 Adult Jack mackerel Trachurus symetricus 0.41 Juv. Jack mackerel T. symetricus NAFPS Small planktivores Adult Northern anchovy Engraulis mordax 0.59 Adult Pacific sardine Sardinops sagax 0.39 Adult Pacific herring Clupea pallasii 0.02
23

Table 1 continued. Vertebrate species included in the functional group analysis and their respective proportional biomass within the functional group. Relative abundances for all fish groups except miscellaneous nearshore fish (e.g., sculpin, croakers) are taken from the NWFSC trawl survey data, 1998–2003. See Appendix A for seabird and marine mammal relative abundances. Functional groups and codes are from Brand et al. (2007), though group compositions may change slightly. NA = not available.
Code Group Common name Scientific name ProportionFPS Small planktivores
(continued) Juv. Pacific herring C. pallasii NA
FVD Large flatfish Adult Arrowtooth flounder Atheresthes stomias 0.71 Adult Pacific halibut Hippoglossus stenolepis 0.15 Adult Petrale sole Eopsetta jordani 0.14 Juv. Arrowtooth flounder Atheresthes stomias 0.83 Juv. Pacific halibut Hippoglossus stenolepis 0.17FVB Chinook salmon Adult Chinook salmon Oncorhynchus
tshawytscha 1.00
Juv. Chinook salmon O. tshawytscha 1.00FDD Deep misc. fishes Adult Pacific grenadier Coryphaenoides acrolepis 0.49 Adult Giant grenadier Albatrossia pectoralis 0.38
Adult Adult
Misc. fishes California smoothtongue Twoline eelpout
Bathylagus stilbius Bothrocara brunneum
0.13
Juv. Pacific grenadier Coryphaenoides acrolepis 0.57 Juv. Giant grenadier Albatrossia pectoralis 0.43SHP Pelagic sharks Adult Soupfin shark Galeorhinus galeus 1.00 Juv. Soupfin shark G. galeus NASSK Skates and rays Adult Longnose skate Raja rhina 0.80 Adult Bering skate Bathyraja interrupta 0.16 Adult Big skate Raja binoculata 0.04 Juv. Big skate R. binoculata NASHD Large demersal sharks Adult Sleeper shark Somniosus pacificus 0.97 Adult Sixgill shark Hexanchus griseus 0.03 Juv. Sixgill shark H. griseus NAFVS Large demersal predators Adult Lingcod Ophiodon elongatus 1.00 Juv. Lingcod O. elongatus 1.00FMN Sablefish Adult Sablefish Anoplopoma fimbria 1.00 Juv. Sablefish A. fimbria 1.00FMM Pacific hake Adult Pacific hake Merluccius productus 1.00 Juv. Pacific hake M. productus 1.00FDF Small flatfish Adult Dover sole Microstomus pacificus 0.76 Adult Rex sole Glyptocephalus zachirus 0.14 Adult Pacific sanddab Citharichthys sordidus 0.08 Adult Deepsea sole Embassichthys bathybius 0.02 Juv. Deepsea sole E. bathybius NA
24
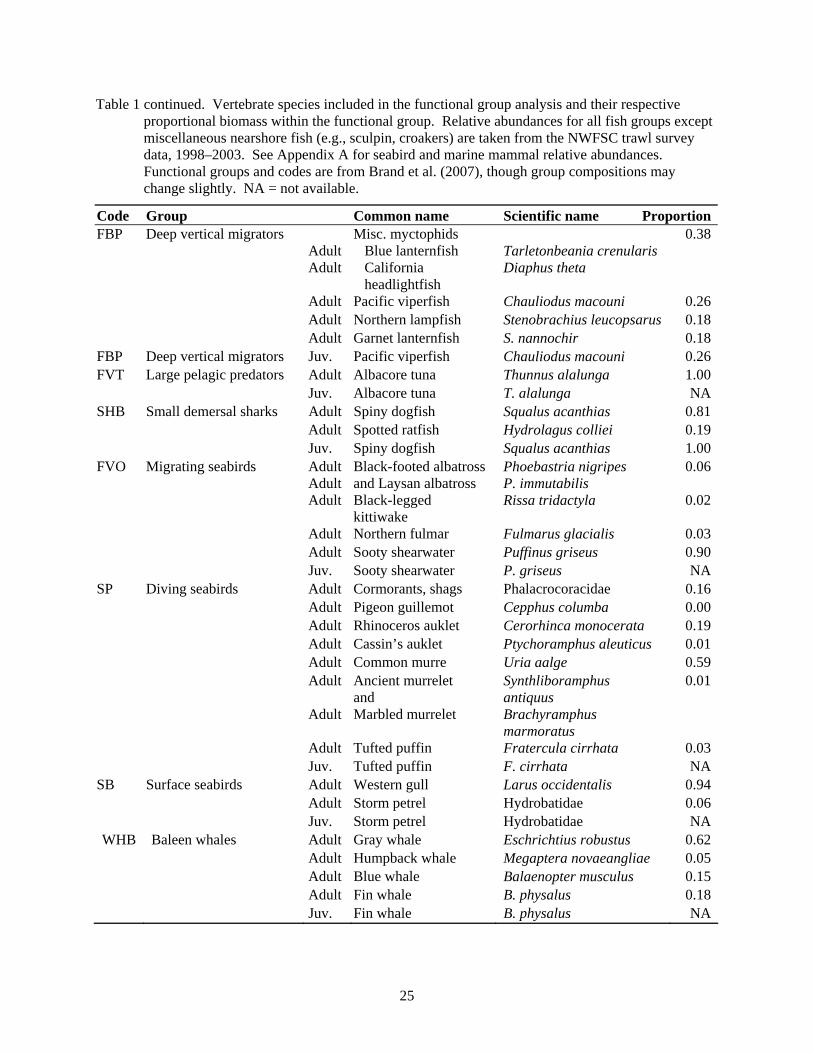
Table 1 continued. Vertebrate species included in the functional group analysis and their respective proportional biomass within the functional group. Relative abundances for all fish groups except miscellaneous nearshore fish (e.g., sculpin, croakers) are taken from the NWFSC trawl survey data, 1998–2003. See Appendix A for seabird and marine mammal relative abundances. Functional groups and codes are from Brand et al. (2007), though group compositions may change slightly. NA = not available.
Code Group Common name Scientific name ProportionFBP Deep vertical migrators Misc. myctophids 0.38
Adult Blue lanternfish Tarletonbeania crenularis Adult California Diaphus theta headlightfish
Adult Pacific viperfish Chauliodus macouni 0.26 Adult Northern lampfish Stenobrachius leucopsarus 0.18 Adult Garnet lanternfish S. nannochir 0.18FBP Deep vertical migrators Juv. Pacific viperfish Chauliodus macouni 0.26FVT Large pelagic predators Adult Albacore tuna Thunnus alalunga 1.00 Juv. Albacore tuna T. alalunga NASHB Small demersal sharks Adult Spiny dogfish Squalus acanthias 0.81 Adult Spotted ratfish Hydrolagus colliei 0.19 Juv. Spiny dogfish Squalus acanthias 1.00FVO Migrating seabirds Adult Black-footed albatross Phoebastria nigripes 0.06
Adult and Laysan albatross P. immutabilis Adult Black-legged
kittiwake Rissa tridactyla 0.02
Adult Northern fulmar Fulmarus glacialis 0.03 Adult Sooty shearwater Puffinus griseus 0.90 Juv. Sooty shearwater P. griseus NASP Diving seabirds Adult Cormorants, shags Phalacrocoracidae 0.16 Adult Pigeon guillemot Cepphus columba 0.00 Adult Rhinoceros auklet Cerorhinca monocerata 0.19 Adult Cassin’s auklet Ptychoramphus aleuticus 0.01 Adult Common murre Uria aalge 0.59 Adult Ancient murrelet Synthliboramphus 0.01
and antiquus Adult Marbled murrelet Brachyramphus
marmoratus Adult Tufted puffin Fratercula cirrhata 0.03 Juv. Tufted puffin F. cirrhata NASB Surface seabirds Adult Western gull Larus occidentalis 0.94 Adult Storm petrel Hydrobatidae 0.06 Juv. Storm petrel Hydrobatidae NAWHB Baleen whales Adult Gray whale Eschrichtius robustus 0.62 Adult Humpback whale Megaptera novaeangliae 0.05 Adult Blue whale Balaenopter musculus 0.15 Adult Fin whale B. physalus 0.18 Juv. Fin whale B. physalus NA
25

Table 1 continued. Vertebrate species included in the functional group analysis and their respective proportional biomass within the functional group. Relative abundances for all fish groups except miscellaneous nearshore fish (e.g., sculpin, croakers) are taken from the NWFSC trawl survey data, 1998–2003. See Appendix A for seabird and marine mammal relative abundances. Functional groups and codes are from Brand et al. (2007) though group compositions may change slightly. NA = not available.
Code Group Common name Scientific name ProportionWHT Toothed whales Adult Resident orcas Orcinus orca 0.03 Adult Baird’s beaked whale Berardius bairdii 0.07 Adult Cuvier’s beaked whale Ziphius cavirostris 0.17 Adult Mesoplodon beaked
whales Mesoplodon spp. 0.05
Adult Short-finned pilot whale
Globicephala macrorhynchus
0.00
Adult Sperm whale Physeter macrocephalus 0.68WHT Toothed whales Juv. Sperm whale P. macrocephalus NAREP Transient orcas Adult Transient orca Orcinus orca 1.00 Juv. Transient orca O. orca NAWHS Small cetaceans Adult Dall’s porpoise Phocoenoides dalli 0.20 Adult Harbor porpoise Phocoena phocoena 0.07 Adult Short-beaked common
dolphin Delphinus delphis 0.31
Adult Bottlenose dolphin Tursiops truncatus 0.03 Adult Striped dolphin Stenella coeruleoalba 0.05 Adult Risso’s dolphin Grampus griseus 0.12 Adult N. right whale dolphin Lissodelphis borealis 0.07 Adult Pacific white-sided
dolphin Lagenorhynchus obliquidens
0.15
Juv. Pacific white-sided dolphin
L. obliquidens NA
PIN Pinnipeds Adult California sea lion Zalophus californianus 0.27 Adult Steller sea lion Eumetopias jubatus 0.02 Adult Harbor seal Phoca vitulina 0.15 Adult N. elephant seal Mirounga angustirostris 0.32 Adult N. fur seal Callorhinus ursinus 0.25 Juv. N. elephant seal Mirounga angustirostris 0.38 Juv. California sea lion Zalophus californianus 0.31 Juv. N. fur seal Callorhinus ursinus 0.29 Juv. Steller sea lion Eumetopias jubatus 0.02WDG Sea otters Adult Sea otter Enhydra lutris 1.00 Juv. Sea otter E. lutris NA
26

Table 2. Invertebrate taxa included in each functional group. Functional groups and codes are from Brand et al. (2007).
Code Group Species BB Benthic bacteria Not identified BC Benthic carnivores Polychaetes, nematodes, burrowing crustacea, peanut worms
(Sipuncula), flatworms BD Deposit feeders Amphipods, isopods, small crustacea, snails, ghost shrimp
(Thalassinidea), sea cucumbers (Holothuroidea), worms, sea mouse (polychaete worm), sea slugs, barnacles, solenogaster (Aplacophora), hermit crabs
BFD Deep benthic filter feeders Anemones, deep corals, lampshells, reticulate sea anemone (Actinauge verrilli), rough purple sea anemone (Paractinostola faeculenta), swimming sea anemone (Stomphia coccinea), gigantic sea anemone (Metridium farcimen), corals, sponges
BFF Other benthic filter feeders Geoduck (Panopea abrupta), barnacles, razor clam (Siliqua patula), littleneck clam (Venerupis philippinarum), Manila clam (Ruditapes philippinarum), miscellaneous bivalves, Vancouver scallop (Delectopecten vancouverensis), glass scallop (Cyclopecten davidsoni), green sea urchin (Strongylocentrotus droebachiensis), red sea urchin (Strongylocentrotus franciscanus)
BFS Shallow benthic filter feeders Barnacles, seafans, soft corals, gorgonian corals, black corals, green colonial tunicate (Didenmum molle), sea pens, sea whips, sea potatoes, vase sponge (Leucandra heathi), mussels, scallops
BG Benthic herbivorous grazers Snails, abalone (Haliotis spp.), nudibranchs, sand dollars, naked solarelle (Solariella nuda), dorid nudibranchs, limpets, heart sea urchin (echinoderm), spot prawns, pandalid shrimps
CEP Cephalopods Market squid (Loligo opalescens), Japetella spp., armhook squids (Gonatus spp.), Chiroteuthis spp., Abraliopsis spp., robust clubhook squid (Moroteuthis robusta), rhomboid squid (Thysanoteuthis rhombus), sandpaper squid (Cranchia scabra), vampire squid (Vampyroteuthis infernalis)
DC Carrion — DL Labile detritus — BMD Deep macrozoobenthos Sea stars, moonsnail (Naticidae), whelks, leather sea star
(Dermasterias imbricata), bat star (Asterina miniata), sunflower sea star (Pycnopodia helianthoides), common mud star (Ctenodiscus crispatus), crinoids, brittlestars, basketstar (Gorgonocephalus eucnemis)
DR Refractory detritus — MA Macroalgae Kelp BO Meiobenthos Flagellates, ciliates, nematodes
27

28
Table 2 continued. Invertebrate taxa included in each functional group. Functional groups and codes are from Brand et al. (2007).
Code Group Species BML Megazoobenthos Dungeness crab (Cancer magister), tanner crab
(Chionoecetes bairdi), spiny lobster (Panulirus interruptus), pinchbug crabs, red rock crab (Cancer productus), graceful rock crab (Cancer gracilis), spider crabs, grooved tanner crab (Chionoecetes tanneri), bairdi, scarlet king crab (Lithodes couesi), California king crab (Paralithodes californiensis)
PL Large phytoplankton Diatoms PS Small phytoplankton Microphytoplankton PWN Shrimp Crangon and mysid shrimps BMS Shallow macrozoobenthos Giant Pacific octopus (Enteroctopus dofleini), north Pacific
bigeye octopus (Octopus californicus), yellowring octopus (Japetella heathi), smoothskin octopus (Benthoctopus leioderma), flapjack devilfish (Opisthosteuthis californiana)
ZG Gelatinous zooplankton Salps, jellyfish, ctenophores, comb jellies ZL Large zooplankton Euphausiids, chaetognaths, pelagic shrimps, pelagic
polychaetes, pasiphaeids ZM Mesozooplankton Copepods, cladocera ZS Microzooplankton Ciliates, dinoflagellates, nanoflagellates, gymnodinoids,
protozoa

Table 3. PSI of California Current functional groups. Significant diet overlaps (>60%) are shaded in gray.
Group Ben
thic
det
ritiv
ores
Mei
oben
thos
Dee
p ve
rtic
al m
igra
tors
Paci
fic h
ake
Can
ary
rock
fish
Shal
low
larg
e ro
ckfis
h
Smal
l pla
nktiv
ores
Cep
halo
pods
Lar
ge p
lank
tivor
es
Tra
nsie
nt o
rca
Alb
acor
e tu
na
Chi
nook
salm
on
Mig
ratin
g se
abir
ds
Surf
ace
seab
irds
Oth
er b
enth
ic fi
lter
feed
ers
Mes
ozoo
plan
kton
Ben
thic
her
b. g
raze
rs
Lar
ge z
oopl
ankt
on
Shri
mp
Smal
l fla
tfis
h
Meg
azoo
bent
hos
Mis
c. n
ears
hore
fish
Shal
low
smal
l roc
kfis
h
Bal
een
wha
les
Ben
thic
car
nivo
res
Eng
lish
sole
Shal
low
mac
rozo
oben
thos
Dee
p m
acro
zoob
enth
os
Sea
otte
r
Benthic detritivores X Meiobenthos 82 X Deep vertical migrators
5 0 X
Pacific hake 0 0 41 X Canary rockfish 0 0 43 80 X Sh. large rockfish 0 0 42 81 95 X Small planktivores 18 0 49 63 63 62 X Cephalopods 5 0 51 72 73 72 72
29 X Large planktivores 5 0 49 64 61 63 71 78 X
0 0 0 0 0 0 0 0 0 X
Transient orc a Albacore tuna 0 0 11 23 6 6 3 11 10 0 X Chinook salmon 0 0 26 46 27 28 26 32 36 0 58 X Migrating seabirds 0 0 16 24 6 5 4 7 13 0 70 66 X Surface seabirds 0 0 6 26 7 9 6 9 16 0 60 73 74 X
4 0 0 0 0 0 5 0 0 0 0 0 0 0 X
6 0 0 0 0 0 0 0
Other benthic filter feeders
1 2
Mesozooplankton 14 0 0 0 0 0 2 70 X Benthic herb. grazers
3 4 0 0 0 0 0 6 0 0 0 0 0 0 0 5 0
0 0 4 0 0 1 1 6 1 0 5 0 0 3 5 0 0 1 Xh 0 0 8 6 6 5 6 6 9 0 9 7 4 6 0 0 0 5 9 X
5 8 4 0 0 1 9 5 X0 0 4 0 0 1 3 7 4 0 5 3 0 2 0 0 0 1 9 8 8 X
2 2 2 4 X
Large zooplankton p
18 0 23 14 14 15 49 21 24 0 4 14 3 9 32 47 56 XShrim 2 Small flatfis 1 5Megazoobenthos 0 0 4 6 2 4 4 12 9 0 9 5 4 5Misc. nearshore fish
1 1 5 5 5

Table 3 continued vertically. PSI of California Current functional groups. Significant diet overlaps (>60%) are shaded in gray.
Group Ben
thic
det
ritiv
ores
Mei
oben
thos
Dee
p ve
rtic
al m
igra
tors
Paci
fic h
ake
Can
ary
rock
fish
Shal
low
larg
e ro
ckfis
h
Smal
l pla
nktiv
ores
Cep
halo
pods
Lar
ge p
lank
tivor
es
Tra
nsie
nt o
rca
Alb
acor
e tu
na
Chi
nook
salm
on
Mig
ratin
g se
abir
ds
Surf
ace
seab
irds
Oth
er b
enth
ic fi
lter
feed
ers
Mes
ozoo
plan
kton
Ben
thic
her
b. g
raze
rs
Lar
ge z
oopl
ankt
on
Shri
mp
Smal
l fla
tfis
h
Meg
azoo
bent
hos
Mis
c. n
ears
hore
fish
Shal
low
smal
l roc
kfis
h
Bal
een
wha
les
Ben
thic
car
nivo
res
Eng
lish
sole
Shal
low
mac
rozo
oben
thos
Dee
p m
acro
zoob
enth
os
Sea
otte
r
Sh. small rockfish 1 0 1 9 2 9 1 9 2 0 3 9 3 8 0 0 0 7 5 2 6 6 X 4 2 3 2 3 3 3 1 2 1 1 3 4 3 3Baleen whales 0 0 40 41 36 38 36 41 39 0 14 32 9 12 0 0 0 15 38 42 38 40 63 XBenthic carnivore
es 0 0 4 0 0 1 0 4 0 0 5 0 0 0 0 0 0 1 8 8 4 0 4 0 X
0 0 4 1 3 1 4 3 5 0 5 2 0 2 0 0 0 1 82 2 2 3 3 3 4 3 5
English sol 1 5 63 43 58 40 59 50 XShallow macrozoo-benthos
0 0 4 1 2 1 2 4 4 0 6 3 0 2 0 0 0 1 3 4 7 4 6 3 3 1 X
r 0 0 0 1 3 0 2 2 4 0 1 3 0 2 0 0 0 0 0 2 7 6 7 0 0 0 1 0 X
1 2 2 2 4 1 1 1 2
Deep macrozoo-benthos
0 0 20 20 20 20 20 20 20 0 3 20 3 8 20 0 0 14 30 9 34 20 20 20 0 4 12 X
Sea otte
30 1 1 1 3 3 2 1 3 3Midwater rockfish 0 0 48 48 41 41 38 47 47 0 25 45 29 29 0 0 0 17 6 11 13 5 43 46 5 8 7 20 2Small demersal sharks
0 0 42 47 43 47 46 58 60 0 3 7 6 4 0 7 7 6 3 1 1 0 1 9 8 5 7
8 0 1 3 3 3 7 9 3 0 3 6 3 9 8 8 5 5 0 4 0 0 9 3 0 0 0 0 0
0 0 1 9 4 5 2 8 1 0 2 1 5 8 0 0 0 1 1 3 8 0 5 7 0 4 3 1 3
s 0 0 0 0 1 3 0 3 0 0 2 9 7 6 0 0 0 0 1 0 6 0 1 5 0 0 0 0 0
1 3 1 2 0 0 1 1 1 2 3 4 1 2 1
Deep benthic filter feeders
18 0 26 14 14 15 38 24 23 0 8 14 3 6 43 29 14 50 29 18 18 14 30 29 14 15 13 29 0
Gelatinous zooplankton
1 4 3 3 3 5 3 4 2 4 4 1 5 2 3 2
Large demersal predators
1 1 2 2 2
Pelagic shark 2 1 3 3 4 4 Diving seabirds 0 0 16 29 11 12 9 12 19 0 48 59 64 66 0 0 0 8 1 4 6 0 7 4 0 0 0 8 0
s 2 0 6 2 4 3 6 4 1 0 2 3 4 7 0 0 0 4 5 2 6 6 3 2 9 9 5 1 2
1 1Large flatfish 0 0 14 24 14 14 14 28 27 0 22 26 27 27 0 0 0 11 5 13 17 12 23 20 4 12 9 10 9Deep large rockfish 1 0 15 11 13 11 13 28 22 0 13 25 23 28 0 0 0 10 11 21 15 31 33 19 9 18 40 9 28Sablefish 0 0 9 10 6 7 5 13 17 0 20 25 32 36 0 0 0 5 9 13 15 8 15 16 7 9 8 4 2Skates and rays 0 0 13 8 9 8 9 19 31 0 18 19 25 21 0 0 0 6 7 14 14 18 19 13 6 11 9 5 3Deep small rockfish
0 0 27 21 14 14 13 28 23 0 26 30 36 30 0 0 0 12 35 48 41 47 53 47 30 40 27 10 14
Deep misc. fishe 2 1 1 1 1 2 3 1 1 1 1 2 3 2 3 4 3 3 2 1 1

Table 3 continued vertically. PSI of California Current functional groups. Significant diet overlaps (>60%) are shaded in gray.
Group Ben
thic
det
ritiv
ores
Mei
oben
thos
Dee
p ve
rt. m
igra
tors
Paci
fic h
ake
Can
ary
rock
fish
Shal
low
larg
e ro
ckfis
h
Smal
l pla
nktiv
ores
Cep
halo
pods
Lar
ge p
lank
tivor
es
Tra
nsie
nt o
rca
Alb
acor
e tu
na
Chi
nook
salm
on
Mig
ratin
g se
abir
ds
Surf
ace
seab
irds
Oth
er b
enth
ic fi
lter
feed
ers
Mes
ozoo
plan
kton
Ben
thic
her
b. g
raze
rs
Lar
ge z
oopl
ankt
on
Shri
mp
Smal
l fla
tfis
h
Meg
azoo
bent
hos
Mis
c. n
ears
hore
fish
Shal
low
smal
l roc
kfis
h
Bal
een
wha
les
Ben
thic
car
nivo
res
Eng
lish
sole
Shal
low
mac
rozo
oben
thos
Dee
p m
acro
zoob
enth
os
Sea
otte
r
Pinniped s 0 0 0 4 1 2 0 3 9 0 0 0 7 1 0 0 0 0 0 0 5 0 1 5 0 0 0 0 0 1 2 3 3 4 Toothed whale s 0 0 0 3 2 3 0 9 1 0 5 1 3 8 0 0 0 1 3 7 6 6 2 6 3 5 6 0 3
0 0 0 1 0 0 3 8 8 6 5 4 1 9 0 0 0 0 6 8 8 1 2 0 0 8 8 5 8
3 6 7 6 3 9 3 5 6 0 38 0 8 0 0 0 9 6 8 0 0 0 0 0
1 1 1 1 2 1 1Large demersal sharks
1 1 1 1 1
Small cetaceans 0 0 19 9 3 3 0 9 10 0 20 17 36 27 0 0 0 1 1Shallow benthic filter feeders
1 2 65 4 0 0 7 5 0 4 0 1 0 0 0 0 0 0
0 0 0 0 0 0 0 0 0
2 4 3 2
Microzooplankton 0 0 0 0 0 67 4 2 0 7 5 0 4 0 0 0 0 0 0 0 0 3 231

32
Table 3 continued horizontally. PSI of California Current functional groups. Significant diet overlaps (>60%) are shaded in gray. Group column list on this page repeats last 19 items from same list of previous two pages of this table.
Group Mid
wat
er r
ockf
ish
Smal
l dem
ersa
l sha
rks
Dee
p be
nthi
c fil
ter
feed
ers
Gel
atin
ous z
oopl
ankt
on
Lar
ge d
emer
sal p
reda
tors
Pela
gic
shar
ks
Div
ing
seab
irds
Lar
ge fl
atfis
h
Dee
p la
rge
rock
fish
Sabl
efis
h
Skat
es a
nd r
ays
Dee
p sm
all r
ockf
ish
Dee
p m
isc.
fish
es
Pinn
iped
s
Too
thed
wha
les
Lar
ge d
emer
sal s
hark
s
Smal
l cet
acea
ns
Shal
low
ben
thic
filte
r fe
eder
s
Mic
rozo
opla
nkto
n
Midwater rockfish X
Small demersal sharks 5 2 X9 5 X
Deep benthic filter feeders 1 1
Gelatinous zooplankton 36 36 57 X
Large demersal predators 24 30 1 1 X
Pelagic sharks 21 15 0 0 51 X
Diving seabirds 37 25 8 8 37 51 X
Large flatfish 33 36 14 10 33 32 34 X
Deep large rockfish 27 31 19 9 23 16 21 36 X
Sablefish 27 24 10 4 31 30 30 36 47 X
Skates and rays 26 32 12 5 33 17 30 38 36 39 X
Deep small rockfish 38 33 25 11 14 17 35 32 43 35 27 X
Deep misc. fishes 25 17 27 13 2 0 17 23 31 21 42 48 X
Pinnipeds 19 19 0 0 35 41 34 25 19 34 15 20 0 X
Toothed whales 18 15 3 0 14 18 26 16 16 24 21 27 16 58 X
Large demersal sharks 3 16 0 0 12 13 12 8 13 22 13 14 4 46 49 X
Small cetaceans 24 16 3 0 28 36 39 27 15 26 18 36 13 50 61 44 X
Shallow benthic filter feeders
0 0 57 49 0 0 0 0 1 0 0 0 2 0 0 0 0 X
Microzooplankton 0 0 29 32 0 0 0 0 0 0 0 0 0 0 0 0 0 57 X

Table 4. Comparison of our California Current food web to other marine food webs from Dunne et al. (2004), using common food web structure properties including: taxa (the number of species), s (the number of lumped trophic species), c (connectance [C=L/S2]), links per species (L/S), percent top species (%T), percent intermediate species (%I), percent basal species (%B), percent cannibalistic species (%Can), and percent omnivorous species (%Omn).
Food web Taxa S C L/S %T %I %B %Can %Omn Source California Current * 49 0.23 11.3 4 83 14 39 37 This study Other marine food webs Benguela Current 29 29 0.24 7.0 0 93 7 24 76 Yodzis 1998 Caribbean reef small 50 50 0.22 11.1 0 94 6 42 86 Opitz 1996 Northeast U.S. shelf 81 79 0.22 17.8 4 94 3 32 78 Link 2002 Caribbean reef large 249 245 0.05 13.8 0 98 2 4 87 Opitz 1996 *The number of species which contributed to this study is unknown due to the aggregation of prey into functional groups; however, we estimate the total to be approximately 200 (±50) species.
33

Table 5. PSI for all fish species diets. The borders outline comparisons of species within functional groups. Significant diet overlaps (>60%) are shaded in gray. Table is continued vertically on next page, then horizontally on third page to encompass all function groups and species.
Group Species Red
stri
pe r
ockf
ish
Yel
low
eye
rock
fish
Blu
e ro
ckfis
h
Eng
lish
sole
Lon
gspi
ne th
orny
head
Shar
pchi
n ro
ckfis
h
Split
nose
roc
kfis
h
Shor
tspi
ne th
orny
head
Dar
kblo
tche
d ro
ckfis
h
Rou
ghey
e ro
ckfis
h
Can
ary
rock
fish
Wid
ow r
ockf
ish
Paci
fic o
cean
per
ch
Yel
low
tail
rock
fish
Bla
ck r
ockf
ish
Ros
etho
rn r
ockf
ish
Gre
enst
ripe
d ro
ckfis
h
Pygm
y ro
ckfis
h
Paci
fic m
acke
rel
Jack
mac
kere
l
Nor
ther
n an
chov
y
Paci
fic sa
rdin
e
Paci
fic h
erri
ng
Arr
owto
oth
floun
der
Paci
fic h
alib
ut
Petr
ale
sole
Sh. large rockfis h h XRedstripe rockfis Yelloweye rockfis h 1 X Blue rockfi sh 6 7 X 3
English sole English sole 1 23 4 X Deep small rockfish Longspine thornyhead 2 35 19 34 X
Sharpchin rockfish 45 16 10 16 24 X Splitnose rockfish 95 2 8 2 7 50 X
Deep large rockfish Shortspine thornyhead 1 24 4 18 44 14 3 X Darkblotched rockfish 79 6 9 6 15 64 84 6 X Rougheye rockfish 9 29 19 17 32 25 14 26 18 X
Canary rockfish Canary rockfish 95 3 8 3 5 50 97 4 80 1
34
4 X Midwater rockfish Widow rockfish 35 7 9 6 14 45 40 11 43 19 37 X
Pacific ocean perch 65 14 10 12 22 74 70 15 82 28 69 4 4 X Yellowtail rockfish 41 10 15 2 20 48 44 12 45 26 44 68 4 9 X Black rockfish 16 39 50 5 20 19 18 9 19 24 16 23 19 27 X
Sh. small rockfish Rosethorn rockfish 7 29 10 52 35 32 12 23 21 55 12 17 28 15 11 X Greenstriped rockfish 73 12 10 13 22 71 78 13 90 26 77 44 90 48 20 26 X Pygmy rockfish 92 2 8 3 4 49 94 2 85 11 92 37 67 41 18 11 75 X
Large planktivores Pacific mackerel 63 2 7 2 6 49 63 5 67 13 63 43 66 51 27 10 66 69 X Jack mackerel 57 9 13 3 10 46 57 4 57 28 58 37 58 51 28 8 58 57 60 X
Small planktivores Northern anchovy 66 2 7 5 4 48 65 4 66 14 68 34 67 42 19 10 69 66 64 61 X Pacific sardine 55 0 6 2 3 47 54 1 58 10 54 34 54 40 17 8 56 60 69 56 79 X Pacific herring 81 7 9 8 10 53 82 8 87 24 81 40 71 42 25 14 80 86 68 67 69 59 X
Large flatfish Arrowtooth flounder 15 33 24 7 23 20 16 15 15 34 18 18 23 25 33 17 20 15 17 24 18 15 17 X Halibut 1 30 7 24 49 15 3 35 7 21 3 8 13 7 9 24 13 3 3 6 2 1 8 55 X Petrale sole 1 21 2 4 3 2 1 4 1 16 0 2 2 1 6 2 3 1 2 27 3 1 10 12 12 X

Table 5 continued vertically. PSI for all fish species diets. Significant diet overlaps (>60%) are shaded in gray.
Group Species Red
stri
pe r
ockf
ish
Yel
low
eye
rock
fish
Blu
e ro
ckfis
h
Eng
lish
sole
Lon
gspi
ne th
orny
head
Shar
pchi
n ro
ckfis
h
Split
nose
roc
kfis
h
Shor
tspi
ne th
orny
head
Dar
kblo
tche
d ro
ckfis
h
Rou
ghey
e ro
ckfis
h
Can
ary
rock
fish
Wid
ow r
ockf
ish
Paci
fic o
cean
per
ch
Yel
low
tail
rock
fish
Bla
ck r
ockf
ish
Ros
etho
rn r
ockf
ish
Gre
enst
ripe
d ro
ckfis
h
Pygm
y ro
ckfis
h
Paci
fic m
acke
rel
Jack
mac
kere
l
Nor
ther
n an
chov
y
Paci
fic sa
rdin
e
Paci
fic h
erri
ng
Arr
owto
oth
floun
der
Paci
fic h
alib
ut
Petr
ale
sole
Chinook salmon Chinook salmon 27 40 41 0 21 27 27 1 26 23 27 29 29 40 69 8 8 6 3 6 6 6 8 2 6 12 2 3 3 2 2 2 3Deep misc. fishes Pacific grenadier 2 20 4 39 45 15 4 24 8 20 2 9 13 7 8 28 13 5 7 5 5 4 11 7 29 5 Giant grenadier 16 16 10 17 27 30 18 22 21 35 17 21 28 22 22 22 27 18 20 46 20 17 30 21 20 28 Northern smoothtongue 21 20 9 28 31 36 23 10 30 18 21 33 29 28 19 33 30 29 39 21 22 39 30 16 21 2 Twoline eelpout 38 20 9 37 32 50 39 19 43 22 37 40 48 42 19 44 47 39 41 37 37 37 43 17 25 2Pelagic sharks Soupfin shark 1 46 26 0 23 1 0 8 0 17 0 2 6 12 27 0 1 0 3 7 0 0 1 35 26 11Skates and rays Longnose skate 7 27 10 12 25 22 12 22 17 37 10 18 24 20 17 22 23 9 12 31 11 8 21 24 27 37 Bering skate 1 3 0 4 6 0 0 7 0 4 0 0 0 0 4 1 1 0 1 0 3 1 8 6 9 9
0 9 0 6 0 1 3 5 0 0 2 0 3 0 0 0 0 4 7 1
1 1 3 5 Big skate 1 13 0 4 23 0 0 27 0 14 0 0 0 0 4 1 1 0 1 30 3 1 8 7 24 41Dp. demersal sharks Sleeper shark 0 1 0 8 14 1 0 14 0 10 0 1 2 5 3 2 3 0 4 3 3 1 3 4 6 3 Sixgill shark 1 1 0 1 12 1 1 1Lingcod Lingcod 1 39 8
35
3 11 5 1 5 1 15 4 4 6 11 10 5 5 1 4 10 3 1 2 28 23 15Sablefish Sablefish 4 18 12 9 38 14 7 36 10 24 6 12 14 17 13 14 15 6 9 10 5 4 11 31 39 6Pacific hake Pacific hake 79 21 26 1 17 46 79 3 79 19 80 36 66 49 36 8 74 79 63 65 66 54 79 32 5 1Small flatfish Dover sole 1 12 4 34 23 13 3 13 6 12 3 7 11 3 4 13 12 3 1 1 3 0 7 4 13 2 Rex sole 1 19 3 49 29 12 2 10 6 9 0 6 8 0 3 32 8 2 1 0 0 0 6 1 20 1 Pacific sanddab 1 28 4 39 31 16 2 24 6 45 3 6 14 2 7 49 12 3 2 31 6 2 15 12 23 27 Deepsea sole 1 18 4 36 28 14 2 13 6 11 2 6 11 2 4 18 11 2 1 1 3 1 7 4 18 2Deep vert. migrators Blue lanternfish 95 3 9 3 5 05 97 3 84 12 95 37 67 41 19 11 76 97 65 57 66 57 85 15 3 1 California headlightfish 67 12 9 2 3 81 1 5 10 76 17 66 39 73 41 19 20 7568 74 78 57 66 76 76 15 12 1 Pacific viperfis h 1 0 0 0 8 6 3 0 2 3 2 4 6 5 0 7 4 0 0 0 0 0 0 1 1 0
h 0 4 9 6 9 6 1 5 8 3 9 5 3 0 9 2 4 7 5 0 0 1 7 5 5 1
3 1 1 1 Northern lampfish 29 19 9 22 23 42 30 10 38 17 28 33 36 28 19 30 37 36 43 28 29 50 37 15 20 1 Garnet lanternfis 2 2 2 2 1 1 2 2 2 1 1 2 2 3 2 2 4 2 1Albacore tuna Albacore tuna 3 39 41 5 29 12 8 9 11 24 5 13 15 18 57 12 13 5 7 10 3 3 9 23 12 2Sm. demersal sharks Spiny dogfish 53 15 9 3 18 47 53 8 53 21 53 40 55 53 22 10 56 53 60 59 54 54 55 29 20 12 Spotted ratfish 1 19 3 13 28 6 2 41 6 21 0 5 6 0 8 7 7 2 1 10 3 1 14 15 33 25

36
Table 5 continued horizontally. PSI for all fish species diets. The borders outline comparisons of species within functional groups. Significant diet overlaps (>60%) are shaded in gray. Group column list on this page is repeated from previous page and this page has 26 additional columns to the right.
Group Species Chi
nook
salm
on
Paci
fic g
rena
dier
Gia
nt g
rena
dier
Nor
ther
n sm
ooth
tong
ue
Tw
olin
e ee
lpou
t
Soup
fin sh
ark
Lon
gnos
e sk
ate
Ber
ing
skat
e
Big
skat
e
Slee
per
shar
k
Sixg
ill sh
ark
Lg.
dem
ersa
l pre
d.
Sabl
efis
h
Paci
fic h
ake
Dov
er so
le
Rex
sole
Paci
fic sa
ndda
b
Dee
psea
sole
Blu
e la
nter
nfis
h
Cal
iforn
ia h
eadl
ight
fish
Paci
fic v
iper
fish
Nor
ther
n la
mpf
ish
Gar
net l
ante
rnfis
h
Alb
acor
e tu
na
Spin
y do
gfis
h
Spot
ted
ratf
ish
Chinook salmon Chinook salmon X Deep misc. fishes Pacific grenadier 7 X Giant grenadier 21 48 X Northern smoothtongue 21 30 29 X Twoline eelpout 31 52 54 44 X Pelagic sharks Soupfin shark 31 6 5 0 5 X Skates and rays Longnose skate 20 27 52 15 28 14 X Bering skate 0 5 37 0 0 1 34 X Big skate 0 9 41 0 4 2 38 79 X Dp. demersal sharks Sleeper shark 5 40 10 0 5 13 9 6 6 X Sixgill sharks 6 47 19 0 16 17 20 0 4 48 X Lg. demersal pred . d 1 3 5 1 3 3 8 8 8 7 1 XLingco 2 4 3 1 Sablefish Sablefish 14 26 25 12 22 29 37 4 8 21 28 24 X Pacific hak e e 6 2 7 1 7 0 9 0 0 0 0 9 0 XPacific hak 4 1 2 3 2 1 Small flatfis h e 1 1 3 6 1 0 0 1 1 6 1 3 0 2 XDover sol 2 1 1 1 1 1 Rex so le 0 4 3 7 2 0 8 0 0 1 1 0 7 0 5 X 3 1 2 3 5 Pacific sanddab 1 35 52 28 24 0 31 42 42 3 0 4 9 2 21 32 X Deepsea so le 0 6 6 1 5 0 0 1 1 1 0 3 9 1 2 1 2 1 1 74 74 27 XDeep vert. migrator s Blue lanternfis h 6 5 8 6 0 0 0 0 0 0 0 1 62 1 2 4 1 78 3 3 3 3 X California headlightfis h 6 4 7 0 9 0 5 0 0 0 0 1 02 1 2 5 4 1 1 66 10 12 12 12 72 X Pacific viperfis h 0 0 0 0 0 0 5 0 0 0 0 0 1 0 0 0 0 0 0 0 X Northern lampfish 26 24 28 60 50 0 5 0 0 0 0 1 0 8 0 2 2 5 31 1 2 1 2 2 1 3 62 0 X Garnet lanternfis h 9 8 9 6 3 0 1 0 0 0 0 1 8 0 7 6 6 7 5 6 01 1 4 2 1 2 2 4 74 XAlbacore tun a a 6 1 1 8 1 2 6 1 1 5 4 0 0 3 6 5 5 5 6 8 4 8 7 XAlbacore tun 5 1 1 1 3 1 1 2 2 Sm. demersal sharks Spiny dogfish 37 11 22 24 42 15 30 16 17 9 21 20 23 56 2 0 2 1 53 53 0 28 20 11 X Spotted ratfish 0 12 16 6 7 8 31 25 43 11 5 15 15 1 13 7 15 6 3 6 0 6 4 6 21 X
References
Adams, P. B. 1987. The diet of widow rockfish (Sebastes entomelas) in northern California. In W. H. Lenarz and D. R. Gunderson (eds.), Widow rockfish: Proceedings of a workshop, Tiburon, CA, 11–12 December 1980, p. 37–41. U.S. Dept. Commer., NOAA Tech. Rep. NMFS 48.
Ainley, D. G., L. B. Spear, S. G. Allen, and C. A. Ribic. 1996. Temporal and spatial patterns in the diet of the common murre in California waters. Condor 98:691–705.
Angliss, R. P., and R. B. Outlaw. 2008. Alaska marine mammal stock assessments, 2007. U.S. Dept. Commer., NOAA Tech. Memo. NMFS-AFSC-180.
Antonelis Jr., G. A., and C. H. Fiscus. 1980. The pinnipeds of the California Current. Calif. Coop. Ocean. Fish. Investig. Rep. 21:68–78.
Balanov, A. A. 1994. Diet of common mesopelagic fishes of the Bering Sea. J. Ichthyol. 34:73–82.
Barlow, J., and K. A. Forney. 2007. Abundance and population density of cetaceans in the California Current ecosystem. Fish. Bull. 105:509–526.
Beamish, R. J., K. D. Leask, O. A. Ivanov, A. A. Balanov, A. M. Orlov, and B. Sinclair. 1999. The ecology, distribution, and abundance of midwater fishes of the subarctic Pacific gyres. Prog. Oceanogr. 43:399–442.
Beaudreau, A. H., and T. E. Essington. In press. Spatial, temporal, and ontogenetic patterns of predation by lingcod. Trans. Am. Fish. Soc.
Bernard, H. J., J. B. Hedgepeth, and S. B. Reilly. 1985. Stomach contents of albacore, skipjack, and bonito caught off southern California during summer 1983. Calif. Coop. Ocean. Fish. Investig. Rep. 26:175–182.
Bonham, K. 1949. Preliminary report on the soupfin shark fishery in Washington. Washington Dept. Fisheries, Olympia.
Bonham, K. 1954. Food of the dogfish Squalus Acanthias. Wash. Dept. Fish. Res. Pap. 1:25–36.
Brand, E. J., I. C. Kaplan, C. J. Harvey, P. S. Levin, E. A. Fulton, A. J. Hermann, and J. C. Field. 2007. A spatially explicit ecosystem model of the California Current’s food web and oceanography. U.S. Dept. Commer., NOAA Tech. Memo. NMFS-NWFSC-84.
Brodeur, R. D., H. V. Lorz, and W. G. Pearcy. 1987. Food habits and dietary variability of pelagic nekton off Oregon and Washington, 1979–1984. U.S. Dept. Commer., NOAA Tech. Rep. NMFS 57.
Brodeur, R. D., and W. G. Pearcy. 1984. Food habits and dietary overlap of some shelf rockfishes (Genus Sebastes) from the northeastern Pacific Ocean. Fish. Bull. 82:269–293.
Brodeur, R. D., and W. G. Pearcy. 1990. Trophic relations of juvenile Pacific salmon off the Oregon and Washington coast. Fish. Bull. 88:617–636.
37

Buckley, T. W., G. E. Tyler, D. M. Smith, and P. A. Livingston. 1999. Food habits of some commercially important groundfish off the coasts of California, Oregon, Washington, and British Columbia. U.S. Dept. Commer., NOAA Technical Memorandum NMFS-AFSC-102.
Builder Ramsey, T., T. A. Turk, E. L. Fruh, J. R. Wallace, B. H. Horness, A. J. Cook, K.L. Bosley, D. J. Kamikawa, L. C. Hufnagle Jr., and K. Piner. 2002. The 1999 Northwest Fisheries Science Center Pacific West Coast upper continental slope trawl survey of groundfish resources off Washington, Oregon, and California: Estimates of distribution, abundance, and length composition. U.S. Dept. Commer., NOAA Tech. Memo. NMFS-NWFSC-55.
Cailliet, G. M., and A. W. Ebeling. 1990. The vertical distribution and feeding habits of two common midwater fishes (Leuroglossus stilbius and Stenobrachius leucopsarus) off Santa Barbara. Calif. Coop. Ocean. Fish. Investig. Rep. 31:106–123.
Cailliet, G. M., E. K. Osada, and M. Moser. 1988. Ecological studies of sablefish in Monterey Bay. Calif. Fish Game 74:132–153.
Cale, W. G., and P. L. Odell. 1980. Behavior of aggregate state variables in ecosystem models. Math. Biosci. 49:121–137.
Cale, W. G., R. V. O’Neill, and R. H. Gardner. 1983. Aggregation error in nonlinear ecological models. J. Theor. Biol. 100:539–550.
Chess, J. R., S. E. Smith, and P. C. Fischer. 1988. Trophic relationships of the shortbelly rockfish, Sebastes jordani, off central California. Calif. Coop. Ocean. Fish. Investig. Rep. 29:129–136.
Christensen, V., and C. J. Walters. 2004. Ecopath with Ecosim: Methods, capabilities, and limitations. Ecol. Model. 172:109–139.
Clapham, P. J., S. Leatherwood, I. Szczepaniak, and R. L. Browner Jr. 1997. Catches of humpback and other whales from shore stations at Moss Landing and Trinidad, CA, 1919–1926. Mar. Mamm. Sci. 13(3):368–394.
Clemens, W. A., and G. V. Wilby. 1933. Food of the fur seal off the coast of British Columbia. J. Mammal. 14(1):43–46.
Collette, B. B., and C. E. Nauen. 1983. FAO species catalogue. Vol. 2. Scombrids of the world. An annotated and illustrated catalogue of tunas, mackerels, bonitos, and related species known to date. FAO Fish. Synop. 125(2).
Cortes, E. 1999. Standardized diet compositions and trophic levels of sharks. ICES J. Mar. Sci. 56:707–717.
Croll, D. A., B. R. Tershy, R. P. Hewitt, D. A. Demer, P. C. Fiedler, S. E. Smith, W. Armstrong, J. M. Popp, T. Kiekhefer, V. R. Lopez, J. Urban, and D. Gendron. 1998. An integrated approach to the foraging ecology of marine birds and mammals. Deep-Sea. Res. II 45:1353–1371.
Dambacher, J. M., H. W. Li, and P. A. Rossignol. 2002. Relevance of community structure in assessing indeterminacy of ecological predictions. Ecology 83:1372–1385.
Dark, T. A., and M. E. Wilkins. 1994. Distribution, abundance, and biological characteristics of groundfish off the coast of Washington, Oregon, and California, 1977–1986. U.S. Dept. Commer., NOAA Tech. Rep. NMFS 117.
38

Dorn, M., K. Aydin, S. Barbeaux, M. Guttormsen, B. Megrey, K. Spalinger, and M. Wilkins. 2008. Gulf of Alaska walleye pollock. In Stock assessment and fishery evaluation report for the groundfish resources of the Gulf of Alaska region, p. 53–168. (Available from North Pacific Fisheries Management Council, P.O. Box 103136, Anchorage, AK.) Online at http://www.afsc.noaa .gov/REFM/docs/2008/GOApollock.pdf [accessed 21 October 2009].
Drazen, J. C., T. W. Buckley, and G. R. Hoff. 2001. The feeding habits of slope dwelling macrourid fishes in the eastern North Pacific. Deep-Sea Res. I 48:909–935.
Dunne, J. A., R. J. Williams, and N. D. Martinez. 2004. Network structure and robustness of marine food webs. Mar. Ecol. Prog. Ser. 273:291–302.
Ebert, E. E. 1968. A food habits study of the southern sea otter, Enhydra lutris nereis. California Fish Game. 54:33–42.
Emmett, R. L., R. D. Brodeur, T. W. Miller, S. S. Pool, G. K. Krutzikowsky, P. J. Bentley, and J. McCrae. 2005. Pacific sardine (Sardinops sagax) abundance, distribution, and ecological relationships in the Pacific Northwest. Calif. Coop. Ocean. Fish. Investig. Rep. 46:122–143.
Estes, J. A., M. L. Riedman, M. M. Staedler, M. T. Tinker, and B. E. Lyon. 2003. Individual variation in prey selection by sea otters: Patterns, causes, and implications. J. Anim. Ecol. 72:144–155.
Fabry, V. J., B. A. Seibel, R. A. Feely, and J. C. Orr. 2008. Impacts of ocean acidification on marine fauna and ecosystem processes. ICES J. Mar. Sci. 65:414–432.
Ferry, L. A. 1997. Food habits of the twoline eelpout (Bothrocara brunneum: Zoarcidae) at two deep sea sites in the eastern North Pacific. Deep-Sea Res. I 44:521–531.
Field, J. 2004. Application of ecosystem-based fishery management approaches in the northern California Current. Doctoral dissertation. Univ. Washington, Seattle.
Field, J. C., K. Baltz, A. J. Phillips, and W. A Walker. 2007. Range expansion and trophic interactions of the jumbo squid, Dosidicus gigas, in the California Current. Calif. Coop. Ocean. Fish. Investig. Rep. 48:131–146.
Fiscus, C. H., and G. A. Baines. 1966. Food and feeding behavior of Steller and California sea lions. J. Mammal. 47:195–200.
Ford, J. K. B., and G. M. Ellis. 2006. Selective foraging by fish-eating killer whales Orcinus orca in British Columbia. Mar. Ecol. Prog. Ser. 316:185–199.
Ford, J. K. B., G. M. Ellis, L. G. Barret-Lennard, A. B. Morton, R. S. Palm, and K. C. Balcomb III. 1998. Dietary specialization in two sympatric populations of killer whales (Orcinus orca) in coastal British Columbia and adjacent waters. Can. J. Zool. 76:1456–1471.
Fulton, E. A., J. S. Parslow, A. D. M. Smith, and C. R. Johnson. 2004. Biogeochemical marine ecosystem models. 2. The effect of physiological detail on model performance. Ecol. Model. 173:371–406.
Fulton, E. A., A. D. M. Smith, and C. R. Johnson. 2003. Effect of complexity on marine ecosystem models. Mar. Ecol. Prog. Ser. 253:1–16.
Fulton, E. A., A. D. M. Smith, and D. C. Smith. 2007. Alternative management strategies for southeast Australian Commonwealth fisheries: Stage 2: Quantitative management strategy evaluation.
39

Australian Fisheries Management Authority, Fisheries Research and Development Corp. Online at http://atlantis.cmar.csiro.au/ [accessed 21 October 2009].
Gardner, R. H., W. G. Cale, and R. V. O’Neill. 1982. Robust analysis of aggregation error. Ecology 63:1771–1779.
Gabriel, W. L. 1978. Feeding selectivity of the Dover sole (Microstomus pacificus) off Oregon. Master’s thesis. Oregon State Univ., Corvallis.
Gabriel, W. L., and W. G. Pearcy. 1981. Feeding selectivity of Dover sole, Microstomus pacificus, off Oregon. Fish. Bull. 79:749–763.
Gotshall, D. W. 1969. Stomach contents of Pacific halibut and arrowtooth flounder from northern California. Calif. Fish Game 55:75–82.
Hall, K. R. L., and G. B. Schaller. 1964. Tool-using behavior of the California sea otter. J. Mammal. 45(2):287–298.
Hare, S. R., and N. J. Mantua. 2000. Empirical evidence for North Pacific regime shifts in 1977 and 1989. Prog. Oceanogr. 47:103–145.
Hart, J. L. 1973. Pacific fishes of Canada. Fisheries Research Board of Canada, Ottawa.
Horne, P., I. C. Kaplan, K. Marshall, P. S. Levin, and E. A. Fulton. In prep. Central California Atlantis Model (CCAM): Design and parameterization. U.S. Dept. Commer., NOAA Tech. Memo. NMFS-NWFSC. (Available from I. C. Kaplan, NWFSC, Conservation Biology Division, 2725 Montlake Blvd. E., Seattle, WA 98112.)
Hunt Jr., G. L., and J. L. Butler. 1980. Reproductive ecology of western gulls and Xantus’ murrelets with respect to food resources in the Southern California Bight. Calif. Coop. Ocean. Fish. Investig. Rep. 21:62–67.
Hunt Jr., G. L., H. Kato, S. M. McKinnell (eds.). 2000. Predation by marine birds and mammals in the subarctic North Pacific Ocean. PICES Scientific Rep. Vol. 14.
IPCC (Intergovernmental Panel on Climate Change). 2007. Climate change 2007—Impacts, adaptation, and vulnerability. Contribution of Work Group II to the Fourth Assessment Rep. of the IPCC. M. L. Perry, O. F. Canziani, J. P. Patulikof, P. J. van der Linden, and C. E. Hanson (eds.). Cambridge University Press, Cambridge, UK.
Iverson, I. L. K. 1971. Albacore food habits. Calif. Dept. Fish Game Fish Bull. 152:12–47.
Jefferson, T. A., P. J. Stacey, and R. W. Baird. 1991. A review of killer whale interactions with other marine mammals: Predation to coexistence. Mammal Rev. 21:151–180.
Kaplan, I. C., and T. E. Helser. 2007. Stock assessment of the arrowtooth flounder (Atheresthes stomias) population off the West Coast of the United States in 2007. Pacific Fishery Management Council, Portland, Oregon. Online at http://www.pcouncil.org/bb/2007/0907/G4a_Att13_ Arrowtooth_Assess.pdf [accessed 21 October 2009].
Kaplan, I. C., and P. S. Levin. 2009. Ecosystem-based management of what? An emerging approach for balancing conflicting objectives in marine resource management. In R. J. Beamish and B. J. Rothschild (eds.), The future of fisheries in North America, p. 77–95. Springer, NY.
40

Kaplan, I. C., P. S. Levin, M. Burden, and E. A. Fulton. In prep. Fishing catch shares in the face of global change: A framework for integrating cumulative impacts and single species management. (Available from I. C. Kaplan, NWFSC, Conservation Biology Division, 2725 Montlake Blvd. E., Seattle, WA 98112.)
Karpov, K. A., and G. M. Cailliet. 1979. Prey composition of the market squid, Loligo opalescens Berry, in relation to depth and location of capture, size of squid, and sex of spawning squid. Calif. Coop. Ocean. Fish. Investig. Rep. 20:51–57.
Keller A. A., E. L. Fruh, K. L. Bosley, D. J. Kamikawa, J. R. Wallace, B. H. Horness, V. H. Simon, and V. J. Tuttle. 2006a. The 2001 U.S. West Coast upper continental slope trawl survey of groundfish resources off Washington, Oregon, and California: Estimates of distribution, abundance, and length composition. U.S. Dept. Commer., NOAA Tech. Memo. NMFS-NWFSC-72.
Keller, A. A., B. H. Horness, V. J. Tuttle, J. R. Wallace, V. H. Simon, E. L. Fruh, K. L. Bosley, and D. J. Kamikawa. 2006b. The 2002 U.S. West Coast upper continental slope trawl survey of groundfish resources off Washington, Oregon, and California: Estimates of distribution, abundance, and length composition. U.S. Dept. Commer., NOAA Tech. Memo. NMFS-NWFSC-75.
Keller, A. A., V. H. Simon, B. H. Horness, J. R. Wallace, V. J. Tuttle, E. L. Fruh, K. L. Bosley, D. J. Kamikawa, and J. C. Buchanan. 2007. The 2003 U.S. West Coast bottom trawl survey of groundfish resources off Washington, Oregon, and California: Estimates of distribution, abundance, and length composition. U.S. Dept. Commer., NOAA Tech. Memo. NMFS-NWFSC-86.
Keller, A. A., T. L. Wick, E. L. Fruh, K. L. Bosley, D. J. Kamikawa, J. R. Wallace, and B. H. Horness. 2005. The 2000 U.S. West Coast upper continental slope trawl survey of groundfish resources off Washington, Oregon, and California: Estimates of distribution, abundance, and length composition. U.S. Dept. Commer., NOAA Tech. Memo. NMFS-NWFSC-70.
Kruger, L. M., and C. L. Griffiths. 1998. Sea anemones as secondary consumers on rocky shores in the southwestern Cape, South Africa. J. Nat. Hist. 32(5):629–644.
Laidig, T. E., and P. B. Adams. 1997. Feeding habits of sablefish, Anoplopoma fimbria, off the coast of Oregon and California. In M. E. Wilkins and M. W. Saunders (eds.), Biology and management of sablefish, Anoplopoma fimbria: Papers from the international symposium, p. 65–79. U.S. Dept. Commer., NOAA Tech. Rep. NMFS 130.
Landingham, J. H., M. V. Sturdevant, and R. D. Brodeur. 1998. Feeding habits of juvenile Pacific salmon in marine waters of southeastern Alaska and northern British Columbia. Fish. Bull. 96:285–302.
Lea, R. N., R. D. McAllister, and D. A. Ventresca. 1999. Biological aspects of nearshore rockfishes of the genus Sebastes from central California. Calif. Dept. Fish Game Fish Bull. 177.
Lee, Y. W. 2002. Oceanographic effect on the dynamics of food habits and growth conditions of some groundfish species of the Pacific Northwest. Oregon State Univ., Corvallis.
Link, J. 2002. Does food web theory work for marine ecosystems? Mar. Ecol. Prog. Ser. 230:1–9.
Livingston, P. A. 1983. Food habits of Pacific whiting, Merluccius productus, off the west coast of North America, 1967 and 1980. Fish. Bull. 81:629–636.
41

Livingston, P. A., and M. S. Alton (eds.). 1982. Stomach contents of Pacific whiting, Merluccius productus, off Washington and Oregon, April–July 1967. U.S. Dept. Commer., NOAA Tech. Memo. NMFS-F/NWC-32.
McHugh, J. L. 1952. The food of albacore (Germo alalunga) off California and Baja California. Bull. Scripps Inst. Oceanogr. Univ. Calif. 6:161–172.
McLean, J. H. 1962. Sublittoral ecology of kelp beds of the open coast near Carmel, CA. Biol. Bull. 122:95–114.
McLeod, K. L., J. Lubchenco, S. R. Palumbi, and A. A. Rosenburg. 2005. Scientific consensus statement on marine ecosystem-based management. Signed by 217 academic scientists and policy experts with relevant expertise. Communication Partnership for Science and the Sea (COMPASS). Online at http://www.compassonline.org/resources/ [accessed 22 October 2009].
Merkel, T. J. 1957. Food habits of the king salmon (Walbaum) in the vicinity of San Francisco, CA. Calif. Fish Game 43:249–270.
Miller, T. W., and R. D. Brodeur. 2007. Diets of and trophic relationships among dominant marine nekton within the northern California Current ecosystem. Fish. Bull. 105(4):548–559.
NOAA (National Oceanic and Atmospheric Administration). 1999. Ecosystem-based fishery management: A report to Congress by the Ecosystem Principles Advisory Panel. National Marine Fisheries Service, Silver Spring, MD.
O’Neill, R. V., and B. Rust. 1979. Aggregation error in ecological models. Ecol. Model. 7:91–105.
Opitz, S. 1996. Trophic interactions in Caribbean coral reefs. International Center for Living Aquatic Resources, Makati City (Manila), Philippines.
Pauly, D., V. Chistensen, S. Guénette, T. J. Pitcher, U. R. Sumaila, C. J. Walers, R. Watson, and D. Zeller. 2002. Towards sustainability in world fisheries. Nature 418:689–695.
Pauly, D., A. W. Trites, E. Capulis, and V. Christensen. 1998. Diet composition and trophic levels of marine mammals. ICES J. Mar. Sci. 55:467–481.
Pearcy, W. G., and J. W. Ambler. 1974. Food habits of deep-sea macrourid fishes. Deep-Sea Res. 21:745–759.
Pearcy, W. G., and D. Hancock. 1978. Feeding habits of Dover sole, Microstomus pacificus; rex sole, Glyptocephalus zachirus; slender sole, Lyopsetta exilis; and Pacific sanddab, Citharichthys sordidus; in a region of diverse sediments and bathymetry off Oregon. Fish. Bull. 76:641–651.
Pereyra, W. T., W. G. Pearcy, and F. E. J. Carvey. 1969. Sebastodes flavidus, a shelf rockfish feeding on mesopelagic fauna, with consideration of the ecological implications. J. Fish. Res. Board Can. 26:2211–2215.
Perez, M. A., and M. A. Bigg. 1986. Diet of northern fur seals, Callorhinus ursinus, off western North America. Fish. Bull. 84:957–971.
Perry, A. L., P. L. Low, J. R. Ellis, and J. D. Reynolds. 2005. Climate change and distribution shifts in marine fishes. Science 308:1912–1915.
Pew Oceans Commission. 2003. America’s living oceans: Charting a course for sea change. A report to the nation. Pew Oceans Commission, Arlington, VA.
42

Pimm, S. L. 1980. Properties of food webs. Ecology 61(2):219–225.
Reilly, C. A., T. W. Echeverria, and S. Ralston. 1992. Interannual variation and overlap in the diets of pelagic juvenile rockfish (Genus: Sebastes) off central California. Fish. Bull. 90:505–515.
Ressler, P. H., J. A. Holmes, G. W. Fleischer, R. E. Thomas, and K. C. Cooke. 2007. Pacific hake, Merluccius productus, autecology: A timely review. Mar. Fish. Rev. 69:1–24.
Rexstad, E. A., and E. K. Pikitch. 1986. Stomach contents and food consumption estimates of Pacific Hake, Merluccius productus. Fish. Bull. 84:947–956.
Ribes, M., R. Coma, and J. M. Gili. 1999a. Heterogeneous feeding in benthic suspension feeders: The natural diet and grazing rate of the temperate gorgonian Paramuricea clavata (Cnidaria: Octocorallia) over a year cycle. Mar. Ecol. Prog. Ser.183:125–137.
Ribes, M., R. Coma, and J. M. Gili. 1999b. Natural diet and grazing rate of the temperate sponge Dysidea avara (Demospongiae, Dendroceratida) throughout an annual cycle. Mar. Ecol. Prog. Ser. 176:179–190.
Ripley, E. 1946. The biology of the soupfin Galeorhinus zyopterus and biogeochemical studies of the liver. Calif. Dept. Fish Game Fish Bull. 64:1–94.
Robinson, H. J., G. M. Cailliet, and D. A. Ebert. 2007. Food habits of the longnose skate, Raja rhina (Jordan and Gilbert, 1880), in California waters. Environ. Biol. Fishes 80:165–179.
Schabetsberger, R., C. A. Morgan, R. D. Brodeur, C. L. Potts, W. T. Peterson, and R. L. Emmett. 2003. Prey selectivity and diel feeding chronology of juvenile Chinook (Oncorhynchus tshawytscha) and coho (O. kisutch) salmon in the Columbia River plume. Fish. Oceanogr. 12:523–540.
Schoener, T. W. 1974. Resource partitioning in ecological communities. Science 185:27–39.
Shaw, F. R. 1999. Life history traits of four species of rockfish (genus Sebastes). Master’s thesis. Univ. Washington, Seattle.
Silliman, R. P. 1941. Fluctuations in the diet of the Chinook and silver salmons (Oncorhynchus tshawytscha and O. kisutch) off Washington, as related to the troll catch of salmon. Copeia 2:80–87.
Sinclair, E. H. 1994. Prey of juvenile northern elephant seals (Mirounga angustirostris) in the southern California Bight. Mar. Mamm. Sci. 10:230–239.
Singer, M. M. 1982. Food habitat and activity patterns of juvenile rockfishes (Sebastes) in a central California kelp forest. San Jose State Univ., San Jose, CA.
Steiner, R. G. 1979. Food habits and species composition of neritic reef fishes off Depoe Bay, OR. Oregon State Univ., Corvallis.
Sydeman, W. J., K. A. Hobson, P. Pyle, and E. B. McLaren. 1997. Trophic relationships among seabirds in central California: Combined stable isotope and conventional dietary approach. Condor 99:327–336.
Tanasichuck, R. W., D. M. Ware, W. Shaw, and G. A. MacFarlane. 1991. Variations in diet, daily ration, and feeding periodicity of Pacific hake (Merluccius productus) and spiny dogfish (Squalus acanthias) off the lower west coast of Vancouver Island. Can. J. Fish. Aquat. Sci. 48:2118–2128.
43

Turk, T. A., T. Builder, C. W. West, D. J. Kamikawa, J. R. Wallace, and R. D. Methot. 2001. The 1998 Northwest Fisheries Science Center Pacific West Coast upper continental slope trawl survey of groundfish resources off Washington, Oregon, and California: Estimates of distribution, abundance, and length composition. U. S. Dept. Commer., NOAA Tech. Memo. NMFS-NWFSC-50.
Tyler, H. R. J. 1970. The feeding habits of three species of lanternfishes (Myctophidae) off central Oregon. Oregon State Univ., Corvallis.
U.S. Commission on Ocean Policy. 2004. An ocean blueprint for the 21st century. Final report. Online at http://oceancommission.gov/documents/full_color_rpt/welcome.html [accessed 22 October 2009].
Van Blaricom, G. R., and J. A. Estes (eds.). 1988. The community ecology of sea otters. Springer-Verlag, New York.
Vincent, T. L. S., D. Scheel, and K. R. Hough. 1998. Some aspects of diet and foraging behavior of Octopus dofleini (Wulker, 1910) in its northernmost range. Mar. Ecol. 19:13–29.
Wakefield, W. W. 1984. Feeding relationships within assemblages of nearshore and midcontinental shelf benthic fishes off Oregon. Oregon State Univ., Corvallis.
Wallace, H., and J. S. Ramsay. 1983. Reliability in measuring diet overlap. Can. J. Fish. Aquat. Sci. 40:347–351.
Walters, C. J., J. F. Kitchell, V. Christensen, and D. Pauly. 2000. Representing density dependent consequences of life history strategies in aquatic ecosystems: Ecosim II. Ecosystems 3:70–83.
Weinberg, K. L., M. E. Wilkins, F. R. Shaw, and M. Zimmermann. 2002. The 2001 Pacific West Coast bottom trawl survey of groundfish resources: Estimates of distribution, abundance, and length and age composition. U.S. Dept. Commer., NOAA Tech. Memo. NMFS-AFSC-128.
Wiens, J. A., and J. M. Scott. 1975. Model estimation of energy flow in Oregon coastal seabird populations. Condor 77:439–452.
Yamada, Y., and T. Ikeda. 1999. Acute toxicity of lowered pH to some oceanic zooplankton. Plankton Biol. Ecol. 46:62–67.
Yang, M. 1994. Food habits and diet overlap of arrowtooth flounder (Atheresthes stomias) and Pacific halibut (Hippoglossus stenolepis) in the Gulf of Alaska. In International Symposium on North Pacific Flatfish, p. 205–223. Alaska Sea Grant College Program, Anchorage.
Yang, M. S., and M. W. Nelson. 2000. Food habits of the commercially important groundfishes in the Gulf of Alaska in 1990, 1993, and 1996. U.S. Dept. Commer., NOAA Tech. Memo. NMFS-AFSC-112.
Yodzis, P. 1998. Local trophodynamics and the interaction of marine mammals and fisheries in the Benguela ecosystem. J. Anim. Ecol. 67:635–658.
York, K. J. 2005. Resource partitioning in an assemblage of deepwater, demersal rockfish (Sebastes spp.) on the northeast Pacific. Master’s thesis. Washington State Univ., Pullman.
Zeidberg, L. D., and B. H. Robison. 2007. Invasive range expansion by the Humboldt squid, Dosidicus gigas, in the eastern North Pacific. Proc. Natl. Acad. Sci. USA 104(31):12948–12950.
44

45
Appendix A: Sources for Diets
Below are summaries of the publications that contributed to each species’ diet and subsequently each functional group’s diet. Two or three letter abbreviations for each functional group are listed for consistency with Brand et al. (2007). The species that comprise each functional group are listed in the first sentence of each summary, with the species ordered from most to least abundant by biomass.
Fish
Shallow Large Rockfish (SHR)
Adult shallow large rockfish diets consist of data from redstripe (Sebastes proriger), yelloweye (S. ruberrimus), and blue rockfishes (S. mystinus). Redstripe stomachs came from Shaw (1999) as mentioned in Field (2004). Steiner (1979) sampled an unknown number of yelloweye rockfish stomachs off the Oregon coast and York (2005) sampled 9 stomachs, also off the Oregon coast. Steiner also surveyed 51 blue rockfish off the Oregon coast. Juvenile large shallow rockfish diets consisted of copper (S. caurinus) and blue rockfish data. Singer (1982) analyzed 38 juvenile copper rockfish stomachs and 23 juvenile blue rockfish stomachs, all from central California.
English Sole (FDP)
Wakefield (1984) collected 49 English sole (Parophrys vetulus) stomachs off Newport, Oregon. There was no distinction between juvenile and adult diets in this study; therefore, adult diets were used for juvenile diets as well.
Deep Small Rockfish (FDC)
Longspine thornyhead (Sebastolobus altivelis), sharpchin rockfish (Sebastes zacentrus), and splitnose rockfish (S. diploproa) comprise this group. York (2005) collected 36 sharpchin stomachs from Oregon and Shaw (1999) collected 8 stomachs from this species. Brodeur and Pearcy (1984) analyzed 62 splitnose stomachs, and longspine thornyhead data were taken from Laidig (unpublished data) as described in the Field (2004) and Buckley et al. (1999) samples of 281 longspine thornyhead stomachs. No juvenile data were available for this group. Juvenile diet data were adapted from adult data by reducing fish prey items to juveniles of the associated species. Small-bodied fish prey such as small planktivores and benthopelagics were left unchanged.
Deep Large Rockfish (FDO)
Deep large rockfish diets are based on shortspine thornyhead (Sebastolobus alascanus), darkblotched (Sebastes crameri), and rougheye rockfish (S. aleutianus). Buckley (1999) collected 473 shortspine thornyhead stomachs and Brodeur and Pearcy (1984) collected 30 darkblotched stomachs. Yang and Nelson (2000) analyzed 238 rougheye stomach samples from Alaska sampled in 1991 and 1993. Juvenile data came from 18 darkblotched rockfish diets collected by Miller and Brodeur (2007).
Canary Rockfish (FPO)
Adult canary rockfish (S. pinniger) diets come from 561 stomach samples. Brodeur and Pearcy (1984) collected 368 stomachs from Oregon and Washington, Lee (2002) collected 104 stomachs off Oregon and Washington, and York (2005) analyzed 29 stomachs from Oregon. An additional 60 stomachs were analyzed by the NOAA-AFSC food habits database from the West Coast trawl survey. Juvenile data were adapted from Lea et al. (1999), which contained only frequency of occurrence data.
Midwater Rockfish (FDS)
Adult midwater rockfish diets consist of widow rockfish (S. entomelas), Pacific ocean perch (S. alutus), and yellowtail rockfish (S. flavidus). Yellowtail rockfish made up the greatest number of stomachs. Pereyra et al. (1969) collected 22 stomachs off Vancouver Island, Brodeur and Pearcy (1984) collected 264 off Oregon and Washington, and Lee (2002) collected 167 off Oregon. Additional unpublished data (526 stomachs) were summarized by Field (2004). Unpublished diet data (186 stomachs) for Pacific ocean perch were also summarized by Field (2004). Brodeur and Pearcy (1984) collected 73 stomachs off Washington and Oregon. Widow rockfish stomachs were analyzed from Oregon and northern California by Adams (1987) and Lee (2002). Ressler et al. (unpublished) analyzed 41 stomachs from Oregon in 2003. Field (2004) also summarized an unpublished analysis of 18 widow rockfish stomachs. Studies of adult bocaccio rockfish (Sebastes paucispinis) diet were not available, so this species was not included in species-level analysis. However, due to the overfished status of this species and its conservation importance, we have separated bocaccio from this functional group in ongoing work (Horne et al. in prep.).
Juvenile midwater rockfish diets come from chilipepper rockfish (S. goodei), yellowtail rockfish, widow rockfish, and bocaccio. Reilly et al. (1992) analyzed 195 juvenile widow stomachs, 97 yellowtail, 145 chilipepper, and 128 bocaccio from central California. Miller and Brodeur (2007) examined an additional 26 yellowtail and 41 juvenile widow rockfish.
Shallow Small Rockfish (FDB)
Rosethorn (S. helvomaculatus), greenstriped (S. elongatus), and pygmy rockfish (S. wilsoni) are the species in this functional group for which diet information is available. Shortbelly (S. jordani) and stripetail (S. saxicola) rockfish accounted for 70% of the biomass for this group (NMFS trawl survey, Keller et al. 2007); unfortunately, no adult diet information is available for either species. York (2005) analyzed stomachs from each species from Oregon,
46

with 60 rosethorn, 51 greenstriped, and 49 pygmy stomachs sampled. Juvenile diets came from 1,027 shortbelly rockfish from central California (Chess et al. 1988, Reilly et al. 1992).
Large Planktivores (FPL)
Pacific mackerel (Scomber japonicus) and jack mackerel (Trachurus symetricus) are the only 2 species to compose this group. Brodeur et al. (1987) sampled 290 Pacific mackerel and 132 jack mackerel diets from 1982 to 1984. Miller and Brodeur (2007) analyzed an additional 316 jack mackerel and 24 Pacific mackerel diets. There was no distinction between adult and juvenile diets in either of these studies. There exists a large degree of variability in prey items between sample years for these 2 species.
Small Planktivores (FPS)
Northern anchovy (Engraulis mordax), Pacific sardine (Sardinops sagax), and Pacific herring (Clupea pallasii) constitute the three species in this group. Anchovy and herring diets were summarized by Brodeur et al. (1987) from samples collected in 1981 to 1984. Northern anchovy data from 1981 consisted of 15 nonempty stomachs. Pacific herring diets consisted of 94 samples collected from 1981 to 1984. Emmett et al. (2005) examined 184 Pacific sardine stomachs from 1999 to 2002. Miller and Brodeur (2007) analyzed stomach samples from each of the three species off the Oregon coast in 2000 and 2002 (anchovy n = 132, sardine n = 268, herring n = 286). No juvenile data exist for these three species.
Large Flatfish (FVD)
Arrowtooth flounder (Atheresthes stomias), Pacific halibut (Hippoglossus stenolepis), and petrale sole (Eopsetta jordani) make up the large flatfish group. Large piscivorous flatfish diets have been well sampled. Arrowtooth flounder diet studies have largely been concentrated in the Gulf of Alaska. Buckley (1999) collected 178 adult stomachs, Yang (1994) collected 337, Gotshall (1969) collected 253, and Yang and Nelson (2000) analyzed nearly 3,000. Yang and others (Yang 1994, Yang and Nelson 2000) also analyzed 1,657 adult Pacific halibut diets from the Gulf of Alaska. Petrale sole diet data were less abundant, with Wakefield (1984) being the only source of percent by weight data. Juvenile piscivorous flatfish diets rely again on Yang (1994), who analyzed diets from 201 juvenile arrowtooth flounder and 91 juvenile Pacific halibut from the Gulf of Alaska.
Chinook Salmon (FVB)
Chinook salmon (Oncorhynchus tshawytscha) is the sole species of this group. Brodeur et al. (1987) collected 86 adult Chinook salmon stomachs off Washington and Oregon from 1979 to 1984. Other sources of adult Chinook salmon diets included Silliman (1941), who analyzed 818 stomachs from 1,939 salmon off Washington, and Merkel (1957), who collected 1,004 from near San Francisco. For juveniles, Brodeur and Pearcy (1990) collected 795 stomachs off Oregon and Washington, Landingham et al. (1998) collected 38 from British Columbia waters, and Schabetsberger (2003) collected 249 from the Columbia River plume.
47

Deep Miscellaneous Fish (FDD)
Diets for deep demersal fish are based on Pacific grenadiers (Coryphaenoides acrolepis), giant grenadiers (Albatrossia pectoralis), and two deepwater miscellaneous fishes (California smoothtongue [Bathylagus stilbius] and twoline eelpout [Bothrocara brunneum]). For adult diets, Buckley et al. (1999) collected 29 giant grenadier and 33 Pacific grenadier stomachs from the 1992 trawl survey, and Pearcy and Ambler (1974) described two additional Pacific grenadier stomachs. Deepwater miscellaneous diets came from 385 California smoothtongue off Santa Barbara, California (Cailliet and Ebeling 1990), and 228 twoline eelpout stomachs off central California (Monterey Bay) and the Columbia River plume (Ferry 1997). Juvenile diet data were available for 483 Pacific grenadiers and 304 giant grenadiers from the 1997 NMFS slope survey from Pt. Conception to the U.S.-Canadian border (Drazen et al. 2001).
Pelagic Sharks (SHP)
Soupfin sharks (Galeorhinus galeus) are the primary members of this functional group and diets were available only for adults. Brodeur et al. (1987) collected 12 soupfin shark stomachs off Oregon and Washington from 1981 to 1984, Bonham (1949) analyzed 50 off Washington, and Ripley (1946) examined 170 off California.
Skates and Rays (SSK)
Longnose (Raja rhina), Bering (Bathyraja interrupta), and big skates (R. binoculata) represent this group’s diet data; no juvenile data are available. Longnose skate diets were available for central California from Robinson et al. (2007), who analyzed 563 stomachs. Wakefield (1984) analyzed an additional 4 samples from Newport, Oregon. A single Bering skate and 98 big skate stomachs were also available from Wakefield (1984), caught off Newport. No juvenile data were available for of this group.
Large Demersal Sharks (SHD)
Sleeper sharks (Somniosus pacificus) make up the majority of this group’s diet data, with a small contribution from sixgill sharks (Hexanchus griseus). All shark diets were adapted from a review of shark diets worldwide by Cortes (1999), although adult and juvenile diets were not differentiated.
Large Demersal Predators (FVS)
Lingcod (Ophiodon elongatus) is the sole species making up this group. Lingcod diets were not widely available through the California Current. Wakefield (1984) collected 4 adult stomachs off Newport, Oregon. A larger sample size was available from Beaudreau and Essington (in press), who collected 160 adults and 400 juveniles from the San Juan Islands, Washington.
Sablefish (FMN)
Sablefish (Anoplopoma fimbria) diets have been well examined coast-wide. Buckley et al. (1999) reported on diets from 601 adult sablefish, from Washington to Pt. Conception in the
48

mid-1990s. Laidig and Adams (1997) also reported 1,868 stomachs collected from Oregon to central California, and Cailliet et al. (1988) analyzed 249 from central California as well. Brodeur et al. (1987) reported on 138 juvenile stomachs from Oregon and Washington and Cailliet et al. (1988) examined 65 juveniles from central California.
Pacific Hake (FMM)
Pacific hake (Merluccius productus) is the sole species to represent gadids in the California Current because they make up the vast majority of gadid biomass (Keller et al. 2007). Both adult and juvenile diets were available from multiple studies coast-wide. In Washington and Oregon, Brodeur et al. (1987) collected 156 adult stomachs, Livingston and Alton (1982) examined 164 adult stomachs, and Livingston (1983) analyzed 1,499 adult stomachs. Gotshall (1969) collected 450 stomachs from the California-Oregon border south to Pt. Conception and Rexstad and Pikitch (1986) analyzed 347 stomachs from the West Coast. Additionally, 1,201 stomachs were available from the NMFS trawl survey, with approximately twice as many samples north of Cape Blanco than south (Buckley et al. 1999), and 253 samples from more recent surveys (Ressler et al. 2007). Diets of 40 juvenile Pacific hake were available from Oregon and Washington (Livingston and Alton 1982) and 364 were analyzed from the trawl survey coast-wide (Buckley et al. 1999).
Small Flatfish (FDF)
Dover sole (Microstomus pacificus), rex sole (Glyptocephalus zachirus), Pacific sanddab (Citharichthys sordidus), and deepsea sole (Embassichthys bathybius) make up this group. Juvenile data were unavailable for all 4 species. Dover sole diets were available coast-wide; 770 stomachs were analyzed from the NMFS trawl survey (Buckley et al. 1999). The remainder of samples were from Oregon: 326 from Pearcy and Hancock (1978), 265 from Gabriel and Pearcy (1981), 243 from Gabriel (1978), and 24 from Wakefield (1984). Pearcy and Hancock (1978) analyzed 614 rex sole and 723 Pacific sanddab diets. Eight additional samples off Oregon were examined by Wakefield (1984). Deepsea sole stomachs were analyzed by Buckley et al. (1999), with 131 samples coast-wide.
Deep Vertical Migrators (FBP)
Myctophids (blue lanternfish [Tarletonbeania crenularis] and California headlightfish [Diaphus theta]), Pacific viperfish (Chauliodus macouni), and northern lampfish (Stenobrachius leucopsarus) compose this group. Tyler (1970) analyzed 326 samples from two species of lampfish. Balanov (1994) analyzed 7 adult Pacific viperfish stomachs from the Bering Sea. Northern lampfish stomachs were available from central California (n = 494, Cailliet and Ebeling 1990) and Oregon (n = 440, Tyler 1970). An unknown number of garnet lampfish (Stenobrachius nannochir) stomachs were analyzed by Beamish (1999). Juvenile data came from 7 Pacific viperfish from Balanov (1994).
Large Pelagic Predators (FVT)
Albacore tuna (Thunnus alalunga) is the sole contributor to this group. All available albacore diets were from relatively small individuals, which are immature according to published literature (90 cm, Collette and Nauen 1983). Despite the lack of large adults, the data were used
49
for both adults and juveniles. The majority of data were collected from the 1950s and 1960s in central and southern California by Iverson (1971, n = 905 collected from 1968 to 1969) and McHugh (1952, n = 107). In the early 1980s Bernard et al. (1985) examined 94 stomachs from the same region.
Small Demersal Sharks (SHB)
This group is composed of spiny dogfish (Squalus acanthias) and spotted ratfish (Hydrolagus colliei). This group was dominated by dogfish biomass (Keller et al. 2007), which in turn makes up the majority of predators sampled. For adults, 185 dogfish (Bonham 1954) from Washington and 28 ratfish from Oregon (Wakefield 1984) made up the diet. Juvenile data were only available for dogfish. Brodeur et al. (1987) examined 113 stomachs from Washington and Oregon. Since this was the only data source for juveniles from within the California Current, we also included 3,396 juvenile stomachs from off Vancouver Island (Tanasichuck et al. 1991).
Miscellaneous Nearshore Fish (FDE)
This group contains croakers (Sciaenidae), wrymouths (Cryptacanthodidae), and sculpins (Cottidae). Quantitative studies were lacking for this group and subsequently the group was excluded from the analysis as a predator, though it is included as a prey diet item.
Seabirds
Migrating Seabirds (FVO)
The migratory bird group consists primarily of sooty shearwaters (Puffinus griseus), but also includes black-footed albatross (Phoebastria nigripes), Laysan albatross (P. immutabilis), Northern fulmar (Fulmarus glacialis), and black-legged kittiwakes (Rissa tridactyla). There were no data differentiating adult and juvenile diets. Hunt et al. (2000) conducted a review of bird and mammal diets in the subarctic North Pacific, and subdivided the study area into regions, one of which approximates the area of the California Current. Also, Wiens and Scott (1975) estimated energetic fluxes to sooty shearwaters in Oregon. Because neither data source had a sample size associated with it, estimates from the two sources were averaged to determine the final diet for this group.
Diving Seabirds (SP)
Diving seabird diets are largely informed by two studies: a review of bird and mammal diets in the subarctic North Pacific by Hunt et al. (2000) and a broad survey of bird diets in central California by Sydeman et al. (1997). For cormorants (Phalacrocorax spp.), pigeon guillemots (Cepphus columba), Cassin’s auklets (Ptychoramphus aleuticus), and rhinoceros auklets (Cerorhinca monocerata), the review and the empirical study were given equal weights. Ancient murrelet (Synthliboramphus antiquus), marbled murrelet (Brachyramphus marmoratus), and tufted puffin (Fratercula cirrhata) diets were only available from Hunt et al. (2000). Common murres (Uria aalge) make up the largest proportion of biomass for this group, with multiple empirical diet studies existing. Sydeman et al. (1997) described 1,985 chick-feeding
50

events and Ainley et al. (1996) observed 554 feeding bouts, both in central California. Because these two empirical studies existed and had such large sample sizes, we did not include the Hunt et al. (2000) review data for common murre.
Surface Seabirds (SB)
This seabird group is dominated by gulls and empirical diet data were collected from chick feeding at western gull (Larus occidentalis) colonies in California (n = 449, Hunt and Butler 1980). Storm petrels (Hydrobatidae) play a relatively small role in this group, but some diet data were available for them from a review (Hunt et al. 2000).
Marine Mammals
Baleen Whales (WHB)
Gray (Eschrichtius robustus), blue (Balaenoptera musculus), fin (B. physalus), and humpback (Megaptera novaeangliae) whales make up the baleen whale group. Baleen whale diets were adapted from a marine mammal diet review by Pauly et al. (1998), who provided diet data for all four species. Clapham et al. (1997) analyzed stomach contents from fin (n = 1,355) and humpback whales (n = 141) caught from 1919 to 1926. Croll et al. (1998) also analyzed an unknown number of blue whale fecal samples. Individual species biomass estimates were calculated from California Current abundance estimates from Barlow and Fourney (2007). Gray whale biomass estimates were obtained from Angliss and Outlaw (2008).
Toothed Whales (WHT)
Large toothed whale diets consist of contributions from sperm whales (Physeter macrocephalus), pilot whales (Globicephala macrorhynchus), Baird’s beaked whales (Berardius bairdii), Cuvier’s beaked whales (Ziphius cavirostris), mesoplodon beaked whales (Mesoplodon spp.), and resident killer whales (Orcinus orca). Data for resident killer whales came from Ford and Ellis (2006), who observed 529 feeding events from 1974 to 2005 along the coast of British Columbia, and Ford et al. (1996), who recorded 135 confirmed fish kills. All remaining species data came from a review of marine mammal diets (Pauly et al. 1998). Species biomass estimates were adapted from California Current abundance estimates from Barlow and Fourney (2007).
Transient Orcas (REP)
Transient killer whale data came from three sources. The majority of data for this group contained only predation observation events. From these predation events, we derived a diet proportion by accounting for killer whale feeding behavior and biomass of prey items. Jefferson et al. (1991) reviewed historic literature predation events on marine mammals, amounting to 764 different predation observations. Ford et al. (1998) observed 130 predation events on marine mammals and seabirds. Pauly et al. (1998) also reviewed literature to derive a proportion diet estimate.
51

Small Cetaceans (WHS)
Small cetaceans include eight species: short-beaked common dolphin (Delphinus delphis), Dall’s porpoise (Phocoenoides dalli), Pacific white-sided dolphin (Lagenorhynchus obliquidens), Risso’s dolphin (Grampus griseus), harbor porpoise (Phocoena phocoena), northern right whale dolphin (Lissodelphis borealis), striped dolphin (Stenella coeruleoalba), and bottlenose dolphin (Tursiops truncatus). All diet data were obtained from the 1998 review by Pauly et al.
Sea Otters (WDG)
Sea otter (Enhydra lutris) diets come from the southern regions of the California Current. The method of data collection for sea otter diets is visual identification of prey items that animals retrieve on each dive. As such, sample size is the number of successful dives observed and diet is represented by percent frequency of prey types. Van Blaricom et al. (1988) observed 1,025 successful dives from central California and the Channel Islands. Twenty years prior, Hall and Schaller observed 455 dives (1964), McLean (1962) observed 5,882 dives, and Ebert (1968) observed 243 dives in central California. Adults and juveniles diets were not differentiated in any of the studies; however, since juveniles are thought to learn feeding preferences directly from their mothers (Estes et al. 2003), it can be reasonably assumed that adults and juveniles have similar diets.
Pinnipeds (PIN)
California sea lion (Zalophus californianus), Steller sea lion (Eumetopias jubatus), northern fur seal (Callorhinus ursinus), harbor seal (Phoca vitulina), and northern elephant seal (Mirounga angustirostris) comprise this group. Adult California sea lion diets were sampled from 3 beached individuals in California (Fiscus and Baines 1966). Adult northern fur seals were sampled from the California coast from 1958 to 1966 (n = 2,566, Antonelis and Fiscus 1980). Perez and Biggs (1986) also described the diets of 3,798 individuals from Washington to California. Fiscus and Baines (1966) examined 6 northern fur seals from California and 3 Stellar sea lions, 2 from California and 1 from Oregon. Clemens and Wilby (1933) sampled 25 juvenile fur seals off Vancouver Island, Sinclair (1994) looked at 20 juvenile elephant seals from the Channel Islands, and Fiscus and Baines (1966) examined 1 juvenile Steller and 3 juvenile California sea lions from California.
Invertebrates
No empirical diet data are available for most invertebrate groups. Most invertebrate diets came from Field (2004), adapted to differences in functional group members, where necessary. A list of invertebrate groups and their contributing species is in Table 2.
Benthic Carnivores (BC)
This group is composed of polychaetes, burrowing crustacea, peanut worms, and flatworms. Diets were adapted from Field (2004).
52

Deposit Feeders (BD)
Benthic detritivores consist of primarily of small crustacea such as amphipods and isopods. Diets came from Field (2004).
Deep Benthic Filter Feeders (BFD)
This group spans a broad taxonomic range but consisted primarily of anemones, deep sea corals, and sponges. Diet data for anemones came from Kruger and Griffiths (1998), who analyzed the diet of single temperate species for a year. Sponge diets came from Ribes et al. (1999b).
Other Benthic Filter Feeders (BFF)
Bivalves and barnacles make up the majority of this group. Field (2004) constituted the only source for this group.
Shallow Benthic Filter Feeders (BFS)
Soft corals, gorgonians, tunicates, and sea pens are some of the taxa present in this group. Diets came from Ribes et al. (1999a) and Field (2004).
Benthic Herbivorous Grazers (BG)
The benthic herbivorous grazer group consists of primarily gastropods and urchins, but also includes herbivorous decapod shrimps. Data from Field (2004) were used for this group’s diets.
Deep Macrozoobenthos (BMD)
Sea stars, brittle stars, and carnivorous gastropods comprise this group. Data from Field (2004) was adapted for this group’s diet.
Meiobenthos (BO)
Flagellates, cilliates, and nematodes make up this group. Data were not available for their diet, so it was assumed they eat primarily detritus.
Megazoobenthos (BML)
Cancer (genus) and tanner (Chionoecetes bairdi) crabs and lobsters are the primary components of this group. Large crab diets are based on Field (2004). We assumed that tanner and Dungeness crabs (Cancer magister) contribute the majority of biomass for this group, and we weighted Field’s (2004) species diets by their relative biomass to obtain a diet for this functional group.
53
54
Shallow Macrozoobenthos (BMS)
The only species for which diet data are available is giant octopus (Enteroctopus dofleini). Vincent et al. (1998) examined 193 octopus dens in the Gulf of Alaska.
Cephalopods (CEP)
Only one source is available to inform squid diets. Karpov and Cailliet (1995) examined 277 squid stomachs from Monterey Bay.
Shrimp (PWN)
Crangon and mysid shrimp comprise this group. Diets were derived from Field (2004).
Gelatinous Zooplankton (ZG)
Salps, jellyfish, ctenophores, and comb jellies all contribute to this group. Diets were adapted from Field (2004).
Microzooplankton (ZS)
Ciliates, dinoflagellates, nanoflagellates, etc., make up this group. Diets were solely based on Field (2004).
Mesozooplankton (ZM)
Copepods and cladocera comprise this group. Diets were adapted from Field (2004).
Large Zooplankton (ZL)
Euphausiids, chaetognaths, pelagic shrimp, pelagic polychaetes, etc., make up this group. Diets were adapted from Field (2004) to account for multiple taxa.

Appendix B: Tables of Functional Group Diets
Here diet composition is summarized in Tables B-1 through B-10 from the literature review by percent weight for members of the 10 feeding guilds in Figure 1. Functional groups are from Brand et al. (2007) and the species that comprise them are listed in Table 1 and Table 2. Vertebrate predator diets can vary between the juvenile and adult stages. Similarly, vertebrate prey may be either juveniles or adults. A Microsoft Excel file of the data is online at http:// www.nwfsc.noaa.gov/publications/displayinclude.cfm?incfile=technicalmemorandum2009.inc.
Table B-1. Diet composition by percent weight for members of feeding guild A in Figure 1.
Prey Deposit feeders Meiobenthos Labile detritus in sediment 0.8182 — Large phytoplankton 0.1364 — Mesozooplankton 0.0455 — Sedimentary detritus — 1.0000
55

Table B-2. Diet composition by percent weight for members of feeding guild B in Figure 1.
Deep vertical migrators
Large planktivores
Pacific hake
Shallow large rockfish
Small planktivoresCanary rockfish Cephalopods
Prey Adult Juv. Adult Juv. Adult Juv. Adult Juv. Adult Juv. Adult Juv. Benthic carnivores — — 0.0077 0.0005 0.0005 — — — — — 0.0393 — — Benthic herb. grazers 0.0285 — 0.0420 — — 0.0031 0.0031 0.0107 — 0.0044 — 0.0143 0.0143Cephalopods — — 0.0207 — — 0.0182 0.0182 0.0009 0.0001 0.0003 — 0.0002 0.0002Deep misc. fish — — — — — — — 0.0004 — — — — — Deep small rockfish — — — — — — — 0.0001 — — — — — Deep vertical migrators 0.0199 — 0.0106 0.0106 — — 0.0007 — — — — — Deposit feeders — 0.2640 0.0406 0.0948 0.0948 0.0044 0.0044 0.0020 0.0057 0.0094 0.2466 0.0017 0.0017Gelatinous zooplankton 0.0004 — — — — 0.0164 0.0164 — — 0.0006 0.1316 — — Juv. deep misc. fish — — — — — 0.0167 0.0167 — — — — — — Juv. canary rockfish — 0.0069 0.0001 — — — — — — — — — — Juv. deep large rockfish — 0.0244 0.0002 — — 0.0027 0.0027 0.0001 — — — — — Juv. deep small rockfish — 0.0666 0.0006 — — 0.0030 0.0030 — — — — — — Juv. Pacific hake 0.0010 — — — — 0.0200 0.0200 0.0059 0.0401 — — — — Juv. large demersal pred. — — — — — 0.0062 0.0062 — — — — — — Juv. large flatfish — — — — — — — 0.0002 — — — — — Juv. midwater rockfish — 0.0804 0.0007 — — 0.0030 0.0030 0.0001 — 0.0025 — — — Juv. misc. nearshore fish — — — — — — — — — 0.0071 — — — Juv. sh. large rockfish — 0.0122 0.0001 — — 0.0006 0.0006 — — 0.0004 — — — Juv. sh. small rockfish — 0.0095 0.0001 — — 0.0111 0.0111 — — 0.0003 — — — Juv. small flatfish — — — — — 0.0070 0.0070 — — 0.0062 — — — Large phytoplankton — — — — — — — — — — 0.1402 0.2575 0.2575Large zooplankton 0.9461 0.3120 0.6938 0.6670 0.6670 0.5983 0.5983 0.7827 0.8029 0.9500 — 0.6129 0.6129Megazoobenthos 0.0001 — 0.0765 — — 0.0373 0.0373 0.0004 — — 0.1198 0.0024 0.0024Mesozooplankton — — 0.0612 0.2260 0.2260 0.0789 0.0789 — 0.1419 — 0.2369 0.0876 0.0876Midwater rockfish — — — — — — — — — 0.0019 — — — Misc. nearshore fish — — — — — 0.0030 0.0030 0.0003 — — — — — Other benthic filter feed. — — — — — — — — — — 0.0028 — — Sh. benthic filter feeders — — — 0.0010 0.0010 — — — — — — — — Shallow large rockfish — — — — — — — — — 0.0003 — — — Shallow macrozoobenth. — — — — — — — — 0.0004 — — — — Shallow small rockfish — — — — — — 0.0005 — 0.0002 — — — Shrimp — 0.2240 0.0422 — — 0.1395 0.1395 0.0006 0.0015 — 0.0828 0.0233 0.0233Small flatfish — — 0.0017 — — — — 0.0015 — — — — — Small planktivores 0.0040 — 0.0098 — — 0.0305 0.0305 0.1929 — 0.0164 — 0.0002 0.0002
56

Table B-3. Diet composition by percent weight for members of feeding guild C in Figure 1.
Large pelagic predators Migrating seabirds Chinook salmon Surface seabirds
Prey Adult Juv. Adult Juv. Adult Juv. Adult Juv. Benthic herbivorous grazers — — — — 0.0003 0.0040 — — Carrion — — — — — — 0.0608 0.0608 Cephalopods 0.0363 0.0363 0.0720 0.0720 0.0534 0.0142 0.1193 0.1193 Deep misc. fish — — 0.0227 0.0227 — 0.0045 — — Deep small rockfish 0.0078 0.0078 — — — — — — Deep vertical migrators 0.0366 0.0366 0.1293 0.1293 0.0025 0.0030 — — Deposit feeders 0.0465 0.0465 — — 0.0002 0.0469 — — English sole — — — — — 0.0043 — — Gelatinous zooplankton 0.0003 0.0003 — — 0.0002 — 0.0264 0.0264 Juv. canary rockfish — — 0.0028 0.0028 — — — — Juv. deep large rockfish 0.0029 0.0029 0.0099 0.0099 0.0214 0.0145 0.0163 0.0163 Juv. deep small rockfish — — 0.0271 0.0271 0.0584 0.0397 0.0444 0.0444 Juv. Pacific hake — — 0.0813 0.0813 — — 0.0439 0.0439 Juv. large flatfish 0.0002 0.0002 — — — 0.0011 — — Juv. midwater rockfish — — 0.0327 0.0327 0.0704 0.0479 0.0536 0.0536 Juv. misc. nearshore fish — — — — — — 0.0268 0.0268 Juv. shallow large rockfish — — 0.0050 0.0050 0.0107 0.0073 0.0082 0.0082 Juv. shallow small rockfish — — 0.0039 0.0039 0.0083 0.0091 0.0063 0.0063 Juv. small flatfish 0.0002 0.0002 — — — 0.0118 — — Large planktivores 0.0078 0.0078 — — — — — — Large zooplankton 0.0298 0.0298 0.0347 0.0347 0.2603 0.0859 0.0610 0.0610 Megazoobenthos 0.0083 0.0083 — — 0.0262 0.0651 — — Mesozooplankton — — — — — 0.0039 — — Midwater rockfish 0.0094 0.0094 — — — — — — Misc. nearshore fish 0.0016 0.0016 — — 0.0002 0.0558 — — Other benthic filter feeders — — — — — — 0.0200 0.0200 Pacific hake 0.0012 0.0012 — — 0.0020 0.0064 — — Shallow benthic filter feeders — — — — — 0.0004 — — Shallow macrozoobenthos 0.0014 0.0014 — — 0.0001 — — — Shrimp — — — — 0.0001 0.0328 — — Small flatfish — — — — 0.0006 0.0607 — — Small planktivores 0.8097 0.8097 0.5786 0.5786 0.4840 0.4773 0.5130 0.5130
57

Table B-4. Diet composition by percent weight for members of feeding guild D in Figure 1.
Prey
Benthic herbivorous
grazers Large
zooplankton Meso-
zooplankton Other benthic filter feeders
Deposit feeders — 0.0070 — — Labile detritus in sediment 0.2000 — — — Gelatinous zooplankton — 0.0245 — — Labile detritus — — — 0.2500 Large phytoplankton 0.7000 0.5557 0.4000 0.2500 Large zooplankton — 0.1400 — — Macroalgae 0.1000 — — — Mesozooplankton — 0.2011 — — Microzooplankton — 0.0717 0.2000 0.2500 Small phytoplankton — — 0.4000 0.2500
58

Table B-5. Diet composition by percent weight for members of feeding guild E in Figure 1.
Baleen whales Benthic English sole Prey Adult Juv. carnivores Adult Juv. Megazoobenthos Benthic carnivores — — — 0.1600 0.1600 — Benthic herbivorous grazers — — — 0.0426 0.0426 — Carrion — — — — — 0.0125 Cephalopods 0.0049 0.0049 — — — 0.0005 Deep benthic filter feeders — — — — — — Deep macrozoobenthos — — — 0.0169 0.0169 0.1595 Deep vertical migrators 0.0049 0.0049 — — — — Deposit feeders 0.5863 0.5863 0.5000 0.7020 0.7020 0.2613 Labile detritus in sediment — — 0.2000 — — — Gelatinous zooplankton — — — — — — Juv. deep large rockfish — — — — — 0.0001 Juv. deep misc. fish — — — — — 0.0018 Juv. deep small rockfish — — — — — 0.0002 Juv. large demersal predators — — — — — 0.0002 Juv. midwater fish — — — — — — 59
Juv. midwater rockfish — — — — — 0.0002 Juv. misc. nearshore fish — — — — — 0.0017 Juv. sablefish — — — — — 0.0002 Juv. shallow large rockfish — — — — — — Juv. shallow small rockfish — — — — — — Juv. small demersal sharks — — — — — 0.0017 Juv. small flatfish — — — — — 0.0050 Labile detritus — — — — — 0.0451 Large zooplankton 0.3539 0.3539 — — — — Megazoobenthos — — — 0.0199 0.0199 — Meiobenthos — — 0.3000 — — — Mesozooplankton — — — 0.0029 0.0029 — Other benthic filter feeders — — — 0.0356 0.0356 0.3991 Shallow benthic filter feeders — — — — — — Shrimp — — — 0.0201 0.0201 0.0502 Small flatfish — — — — — 0.0105 Small planktivores 0.0501 0.0501 — — — 0.0502

60
Table B-5 continued horizontally. Diet composition by percent weight for members of feeding guild E in Figure 1.
Misc. nearshore fish
Shallow small rockfish Small flatfish Prey (Column list is repeated
from previous page.) Adult Juv. Adult Juv. Shrimp Adult Juv. Benthic carnivores 0.1000 0.1000 — 0.0027 0.1550 0.1713 0.1713 Benthic herbivorous grazers — — 0.2570 — — 0.0170 0.0170 Carrion — — — — 0.0050 — — Cephalopods — — 0.0042 — — 0.0021 0.0021 Deep benthic filter feeders — — — — — 0.0011 0.0011 Deep macrozoobenthos — — — — — 0.2759 0.2759 Deep vertical migrators — — 0.0816 — — 0.0005 0.0005 Deposit feeders 0.4000 0.4000 0.3449 0.0179 0.3800 0.3776 0.3776 Labile detritus in sediment — — — — — — — Gelatinous zooplankton — — 0.0074 0.0364 — 0.0006 0.0006 Juv. deep large rockfish — — 0.0007 — — — — Juv. deep misc. fish — — — — — — — Juv. deep small rockfish — — 0.0019 — — — — Juv. large demersal predators — — — — — — — Juv. midwater fish — — — — — — — Juv. midwater rockfish — — 0.0023 — — — — Juv. misc. nearshore fish — — — — — 0.0002 0.0002 Juv. sablefish — — — — — — — Juv. shallow large rockfish — — 0.0003 — — — — Juv. shallow small rockfish — — 0.0003 — — — — Juv. small demersal sharks — — — — — — — Juv. small flatfish — — — — 0.0050 0.0004 0.0004 Labile detritus — — — — 0.3500 — — Large zooplankton — — 0.2716 0.5892 — 0.0393 0.0393 Megazoobenthos 0.2000 0.2000 0.0122 0.0003 — 0.0512 0.0512 Meiobenthos — — — — — — — Mesozooplankton — — 0.0143 0.3535 — 0.0016 0.0016 Other benthic filter feeders 0.2000 0.2000 — — 0.1000 0.0501 0.0501 Shallow benthic filter feeders — — — — — 0.0076 0.0076 Shrimp 0.1000 0.1000 0.0013 — 0.0050 0.0035 0.0035 Small flatfish — — — — — — — Small planktivores — — — — — — —

Table B-6. Diet composition by percent weight for members of feeding guild F in Figure 1.
Sea otters Prey
Deep macrozoobenthos Adult Juv.
Shallow macrozoobenthos
Benthic herbivorous grazers — 0.2596 0.2596 0.0238 Deep benthic filter feeders 0.3000 — — — Deep macrozoobenthos — 0.0008 0.0008 — Deposit feeders — — — 0.1260 Labile detritus 0.2000 — — — Large zooplankton 0.2000 — — — Megazoobenthos — 0.1631 0.1631 0.7305 Other benthic filter feeders 0.3000 0.5760 0.5760 0.1187 Shallow macrozoobenthos — 0.0005 0.0005 0.0010
61

Table B-7. Diet composition by percent weight for members of feeding guild G in Figure 1.
Midwater rockfish
Small demersal sharks
Prey
Deep benthic
filter feeders Gelatinous
zooplankton Adult Juv. Adult Juv. Benthic bacteria 0.1429 — — — — — Benthic carnivores — — 0.0054 — 0.0016 — Benthic herbivorous grazers — — 0.0236 — — — Cephalopods — — 0.0233 — 0.0435 0.0001 Deep misc. fish — — — — 0.0024 — Deep vertical migrators — — 0.0763 — — — Deposit feeders 0.1429 — 0.0505 0.0016 0.0120 — Gelatinous zooplankton — 0.0268 0.2433 0.0016 0.0268 0.0027 Juv. canary rockfish — — — — 0.0005 — Juv. deep large rockfish — — 0.0164 — 0.0017 — Juv. deep small rockfish — — 0.0080 — 0.0047 — Juv. English sole — — — — — 0.0054 Juv. large flatfish — — — — — 0.0018 Juv. midwater rockfish — — 0.0502 — 0.0057 — Juv. Pacific hake — — 0.0182 — 0.0452 0.2099 Juv. sablefish — — 0.0012 — — — Juv. shallow large rockfish — — 0.0008 — 0.0009 — Juv. shallow small rockfish — — 0.0015 — 0.0007 — Juv. small flatfish — — 0.0340 — 0.0997 0.0003 Labile detritus 0.1429 — — — — — Large phytoplankton 0.1429 0.1547 — — — — Large planktivores — — 0.0117 — — — Large zooplankton 0.1429 0.3323 0.3799 0.3855 0.4282 0.5904 Megazoobenthos — — — 0.0017 0.1199 — Mesozooplankton 0.1429 0.1607 — 0.6035 — — Microzooplankton 0.1429 0.1708 — — — — Misc. nearshore fish — — — — 0.0095 — Other benthic filter feeders — — 0.0503 — Shallow macrozoobenthos — — 0.0001 — — — Shrimp — — — — 0.0258 — Small demersal sharks — — — — 0.0964 — Small phytoplankton — 0.1547 — — — — Small planktivores — — 0.0929 — 0.0245 0.1894
62

Table B-8. Diet composition by percent weight for members of feeding guild H in Figure 1.
Deep large rockfish Deep misc. fish Deep small rockfish Prey Adult Juv. Adult Juv. Adult Juv. Benthic carnivores 0.0021 — 0.0447 0.0315 0.0316 0.0316 Benthic herbivorous grazers 0.1114 — 0.0088 0.0009 0.0150 0.0150 Canary rockfish — — — — — — Carrion 0.0677 — — 0.0975 0.0336 0.0336 Cephalopods 0.0058 — — 0.3412 0.0880 0.0880 Chinook salmon — — — — — — Deep benthic filter feeders — — — — — — Deep large rockfish — — — — 0.0114 — Deep macrozoobenthos 0.0001 — 0.0031 0.0053 0.0259 0.0259 Deep misc. fish 0.0735 — 0.1310 0.0173 0.0141 — Deep small rockfish — — — — 0.0118 — Deep vertical migrators 0.0137 — 0.0870 0.0773 0.1251 0.1251 Deposit feeders 0.0919 0.1798 0.2007 0.1847 0.3041 0.3041 Gelatinous zooplankton — 0.2871 0.0048 0.0004 0.0025 0.0025 Juv. canary rockfish — — — — — — Juv. deep large rockfish 0.0309 — — — — 0.0114 Juv. deep misc. fish — — — — — 0.0141 Juv. deep small rockfish 0.0771 — — — — 0.0118 Juv. large flatfish 0.0020 — — — — — Juv. midwater rockfish 0.0405 — — — — 0.0008 Juv. Pacific hake 0.0773 — — 0.0657 0.0043 0.0043 Juv. sablefish — — — — — — Juv. shallow large rockfish — — — — — — Juv. shallow small rockfish 0.0048 — — — — 0.0001 Juv. small demersal sharks — — — — — — Juv. small flatfish 0.0033 — — — — — Large demersal predators — — — — — — Large demersal sharks — — — — — — Large flatfish — — — — — — Large pelagic predators — — — — — — Large planktivores — — — — — — Large zooplankton 0.0867 0.1780 0.1112 0.0457 0.1030 0.1030 Macroalgae — — — — — — Megazoobenthos 0.2830 — 0.0121 0.0371 0.1243 0.1243 Meiobenthos — — 0.1863 0.0002 — — Mesozooplankton 0.0077 0.1083 0.0167 0.0139 0.0045 0.0045 Midwater fish — — — — — — Midwater rockfish — — — — 0.0008 — Migrating seabirds — — — — — — Misc. nearshore fish — — — — — — Other benthic filter feeders — — — 0.0014 — — Pacific hake — — — — — — Pelagic sharks — — — — — — Sablefish — — — — — — Shallow benthic filter feeders 0.0006 — 0.0226 — 0.0079 0.0079 Shallow large rockfish — — — — — — Shallow macrozoobenthos 0.0006 — 0.0003 0.0005 — — Shallow small rockfish — — — — 0.0001 — Shrimp 0.0164 0.2467 0.1707 0.0794 0.0050 0.0050 Skates and rays — — — — — — Small demersal sharks — — — — — — Small flatfish — — — — — — Small planktivores 0.0029 — — — 0.0870 0.0870
63

Table B-8 continued horizontally. Diet composition by percent weight for members of feeding guild H in Figure 1.
Diving seabirds Large flatfish Large demersal
predators Prey (Column list is repeated from previous page.) Adult Juv. Adult Juv. Adult Juv. Benthic carnivores — — 0.0026 — — — Benthic herbivorous grazers — — 0.0635 — 0.0326 0.0571 Canary rockfish — — — — — — Carrion — — 0.0075 — — — Cephalopods 0.1016 0.1016 0.0119 0.0063 0.0195 0.0058 Chinook salmon 0.0091 0.0091 0.0033 0.0022 0.0492 — Deep benthic filter feeders — — 0.0003 — — — Deep large rockfish — — 0.0008 — — — Deep macrozoobenthos — — — 0.0347 — — Deep misc. fish 0.0084 0.0084 0.0140 0.0090 — 0.0012 Deep small rockfish — — 0.0022 — — — Deep vertical migrators 0.0755 0.0755 0.0057 0.0270 0.0011 0.0062 Deposit feeders — — 0.0370 0.1277 0.0022 0.0169 Gelatinous zooplankton — — — — — — Juv. canary rockfish 0.0095 0.0095 — — 0.0042 0.0080 Juv. deep large rockfish — — — — 0.0148 0.0283 Juv. deep misc. fish — — — — — — Juv. deep small rockfish — — — — 0.0404 0.0773 Juv. large flatfish — — — — — — Juv. midwater rockfish 0.1117 0.1117 — — 0.0487 0.0934 Juv. Pacific hake — — — — — — Juv. sablefish — — — — — — Juv. shallow large rockfish 0.0170 0.0170 — — 0.0074 0.0142 Juv. shallow small rockfish 0.0173 0.0173 — — 0.0058 0.0110 Juv. small demersal sharks — — — — 0.1118 — Juv. small flatfish — — — — — — Large demersal predators — — — — — — Large demersal sharks — — — — — — Large flatfish — — 0.0175 — — — Large pelagic predators — — — — — — Large planktivores — — 0.0045 — — — Large zooplankton 0.0823 0.0823 0.0984 0.0956 0.0076 0.0022 Macroalgae — — — — — — Megazoobenthos — — 0.0267 — — — Meiobenthos — — — — — — Mesozooplankton — — — — — — Midwater fish — — — — — — Midwater rockfish — — 0.0027 — — — Migrating seabirds — — — — — — Misc. nearshore fish 0.0910 0.0910 0.0347 0.0259 0.2024 0.2135 Other benthic filter feeders — — — — — — Pacific hake 0.0395 0.0395 0.3752 0.0612 0.0861 0.0612 Pelagic sharks — — — — — — Sablefish — — 0.0003 — — — Shallow benthic filter feeders — — 0.0005 — — — Shallow large rockfish — — — — — — Shallow macrozoobenthos — — 0.0015 — 0.0217 0.0174 Shallow small rockfish 0.0466 0.0466 — — 0.2067 0.0773 Shrimp 0.0019 0.0019 0.0489 — — — Skates and rays — — 0.0005 — — — Small demersal sharks — — — — — — Small flatfish 0.0337 0.0337 0.1240 0.0203 0.0763 0.0130 Small planktivores 0.3549 0.3549 0.1158 0.5901 0.0615 0.2960
64

65
Table B-8 continued horizontally. Diet composition by percent weight for members of feeding guild H in Figure 1.
Pelagic sharks Sablefish Skates and rays Prey (Column list is repeated from previous page.) Adult Juv. Adult Juv. Adult Juv. Benthic carnivores — — 0.0032 — — — Benthic herbivorous grazers — — 0.0077 0.0325 0.0112 0.0112 Canary rockfish 0.0027 0.0027 — — — — Carrion — — 0.0602 — — — Cephalopods 0.0545 0.0545 0.0894 0.0293 0.0444 0.0444 Chinook salmon 0.0384 0.0384 0.0016 — — — Deep benthic filter feeders — — 0.0006 — — — Deep large rockfish 0.0096 0.0096 0.0236 — — — Deep macrozoobenthos — — 0.0006 — — — Deep misc. fish — — 0.0664 0.0470 0.0704 0.0704 Deep small rockfish 0.0262 0.0262 0.3350 — — — Deep vertical migrators — — 0.0109 — 0.0391 0.0391 Deposit feeders — — 0.0668 0.1183 0.0639 0.0639 Gelatinous zooplankton 0.0003 0.0003 0.0080 0.1308 — — Juv. canary rockfish — — — — 0.0035 0.0035 Juv. deep large rockfish — — — 0.0051 0.0048 0.0048 Juv. deep misc. fish — — — — — — Juv. deep small rockfish — — — 0.0140 0.0276 0.0276 Juv. large flatfish — — 0.0016 — — — Juv. midwater rockfish — — — 0.0169 0.0173 0.0173 Juv. Pacific hake — — — — — — Juv. sablefish — — 0.0094 — — — Juv. shallow large rockfish — — — — 0.0042 0.0042 Juv. shallow small rockfish — — — — 0.0034 0.0034 Juv. small demersal sharks — — — — 0.0009 0.0009 Juv. small flatfish — — — — — — Large demersal predators 0.0322 0.0322 — 0.0093 — — Large demersal sharks 0.0089 0.0089 — — — — Large flatfish 0.1019 0.1019 — — — — Large pelagic predators 0.0089 0.0089 — — — — Large planktivores 0.0359 0.0359 — — — — Large zooplankton — — 0.0339 0.2531 0.0534 0.0534 Macroalgae — — 0.0025 — — — Megazoobenthos — — 0.0073 0.0473 0.0177 0.0177 Meiobenthos — — — — — — Mesozooplankton — — — 0.0006 — — Midwater fish — — — — — — Midwater rockfish 0.0317 0.0317 0.0086 — — — Migrating seabirds 0.0024 0.0024 — — — — Misc. nearshore fish 0.2246 0.2246 0.0008 0.0132 0.0032 0.0032 Other benthic filter feeders — — 0.0015 0.0001 — — Pacific hake 0.1156 0.1156 0.1338 — 0.0431 0.0431 Pelagic sharks 0.0088 0.0088 — — — — Sablefish 0.0049 0.0049 — — 0.0002 0.0002 Shallow benthic filter feeders — — 0.0021 — — — Shallow large rockfish 0.0048 0.0048 0.0012 — — — Shallow macrozoobenthos 0.0043 0.0043 0.0089 0.0254 0.0456 0.0456 Shallow small rockfish 0.0037 0.0037 0.0186 — 0.0828 0.0828 Shrimp — — 0.0043 0.0002 0.2956 0.2956 Skates and rays 0.0121 0.0121 0.0020 — — — Small demersal sharks — — 0.0079 — — — Small flatfish 0.0120 0.0120 0.0321 0.0027 0.1659 0.1659 Small planktivores 0.2556 0.2556 0.0495 0.2542 0.0018 0.0018

66
Table B-9. Diet composition by percent weight for members of feeding guild I.
Large demersal sharks Pinnipeds Small cetaceans Toothed whales
Prey Adult Juv. Adult Juv. Adult Juv. Adult Juv. Cephalopods 0.3945 0.3945 0.4531 0.3719 0.3334 0.3334 0.6740 0.6740 Chinook salmon 0.1073 0.1073 0.0116 — 0.0710 0.0710 0.0639 0.0639 Deep large rockfish — — 0.0109 — — — — — Deep small rockfish 0.1073 0.1073 0.0384 — — — — — Deep vertical migrators — — — — 0.1580 0.1580 0.0724 0.0724 Deep. misc. fish 0.0037 0.0037 — 0.0616 — — 0.0397 0.0397 Deposit feeders — — — 0.0214 0.0276 0.0276 0.0316 0.0316 Gelatinous zooplankton — — — 0.0060 — — — — Juv. Chinook salmon — — — 0.0482 — — — — Juv. deep large rockfish — — — 0.0012 — — — — Juv. deep small rockfish — — — 0.0034 — — — — Juv. midwater rockfish — — — 0.0041 — — — — Juv. Pacific hake — — 0.1035 0.0428 — — — — Juv. sablefish — — — 0.0086 — — — — Juv. shallow large rockfish — — — 0.0006 — — — — Juv. shallow small rockfish — — — 0.0005 — — — — Juv. skates and rays — — 0.0550 0.0199 — — — — Juv. small demersal sharks — — 0.0550 0.0311 — — — — Juv. small flatfish — — — 0.0212 — — — — Large flatfish — — — — — — <0.00005 <0.00005Large pelagic predators 0.1073 0.1073 — — — — — — Large planktivores — — 0.0018 — 0.0847 0.0847 0.0236 0.0236 Megazoobenthos 0.0271 0.0271 — — 0.0276 0.0276 0.0316 0.0316 Midwater rockfish — — 0.0358 — — — — — Misc. nearshore fish — — — 0.0207 0.0710 0.0710 — — Other benthic filter feeders 0.0542 0.0542 — — — — — — Pacific hake 0.0037 0.0037 0.0967 — 0.0710 0.0710 0.0397 0.0397 Pinnipeds 0.1643 0.1643 — — — — — — Sablefish — — 0.0046 — — — <0.00005 <0.00005Shallow large rockfish — — 0.0054 — — — <0.00005 <0.00005Shallow macrozoobenthos — — — 0.0172 — — — — Shallow small rockfish — — 0.0068 — — — — — Shrimp 0.0271 0.0271 — — — — — — Small demersal sharks 0.0035 0.0035 — — — — — — Small planktivores — — 0.1214 0.3196 0.0847 0.0847 0.0236 0.0236
Table B-10. Diet composition by percent weight for members of feeding guild J in Figure 1.
Prey Shallow benthic filter feeders Microzooplankton Labile detritus 0.4000 0.2500 Large phytoplankton 0.2000 0.3750 Mesozooplankton 0.2000 — Microzooplankton 0.2000 — Small phytoplankton — 0.3750

Appendix C: Tables of Fish Species Diets
Here diet composition for fish species is summarized in Tables C-1 through C-52 from the literature review by percent weight. Each table lists prey by descending percent. A Microsoft Excel file of the data is online at http://www.nwfsc.noaa.gov/publications/ displayinclude.cfm?incfile=technicalmemorandum2009.inc. The predator species appear in alphabetical order as follows:
Albacore tuna (Thunnus alalunga) Table C-1 Arrowtooth flounder (Atheresthes stomias) Table C-2 Bering skate (Bathyraja interrupta) Table C-3 Big skate (Raja binoculata) Table C-4 Black rockfish (Sebastes melanops) Table C-5 Blue lanternfish (Tarletonbeania crenularis) Table C-6 Blue rockfish (Sebastes mystinus) Table C-7 California headlightfish (Diaphus theta) Table C-8 Canary rockfish (Sebastes pinniger) Table C-9 Chinook salmon (Oncorhynchus tshawytscha) Table C-10 Darkblotched rockfish (Sebastes crameri) Table C-11 Deepsea sole (Embassichthys bathybius) Table C-12 Dover sole (Microstomus pacificus) Table C-13 English sole (Parophrys vetulus) Table C-14 Garnet lampfish (Tactostoma macropus) Table C-15 Giant grenadier (Albatrossia pectoralis) Table C-16 Greenstriped rockfish (Sebastes elongatus) Table C-17 Jack mackerel (Trachurus symetricus) Table C-18 Lingcod (Ophiodon elongatus) Table C-19 Longnose skate (Raja rhina) Table C-20 Longspine thornyhead (Sebastolobus altivelis) Table C-21 Northern anchovy (Engraulis mordax) Table C-22 Northern lampfish (Stenobrachius leucopsarus) Table C-23 Northern smoothtongue (Bathylagus stilbius) Table C-24 Pacific grenadier (Coryphaenoides acrolepis) Table C-25 Pacific hake (Merluccius productus) Table C-26 Pacific halibut (Hippoglossus stenolepis) Table C-27 Pacific herring (Clupea pallasii) Table C-28 Pacific mackerel (Scomber japonicus) Table C-29 Pacific ocean perch (Sebastes alutus) Table C-30 Pacific sanddab (Citharichthys sordidus) Table C-31 Pacific sardine (Sardinops sagax) Table C-32 Pacific viperfish (Chauliodus macouni) Table C-33 Petrale sole (Eopsetta jordani) Table C-34
67

68
Pygmy rockfish (Sebastes wilsoni) Table C-35 Redstripe rockfish (Sebastes proriger) Table C-36 Rex sole (Glyptocephalus zachirus) Table C-37 Rosethorn rockfish (Sebastes helvomaculatus) Table C-38 Rougheye rockfish (Sebastes aleutianus) Table C-39 Sablefish (Anoplopoma fimbria) Table C-40 Sharpchin rockfish (Sebastes zacentrus) Table C-41 Shortspine thornyhead (Sebastolobus alascanus) Table C-42 Sixgill shark (Hexanchus griseus) Table C-43 Sleeper shark (Somniosus pacificus) Table C-44 Soupfin shark (Galeorhinus galeus) Table C-45 Spiny dogfish (Squalus acanthias) Table C-46 Splitnose rockfish (Sebastes diploproa) Table C-47 Spotted ratfish (Hydrolagus colliei) Table C-48 Twoline eelpout (Bothrocara brunneum) Table C-49 Widow rockfish (Sebastes entomelas) Table C-50 Yelloweye rockfish (Sebastes ruberrimus) Table C-51 Yellowtail rockfish (Sebastes flavidus) Table C-52
Table C-1. Diet composition by weight for albacore tuna, a member of feeding guild B in Figure 11.
Prey PercentSmall planktivores 0.8097Deposit feeders 0.0465Deep vertical migrators 0.0366Cephalopods 0.0363Large zooplankton 0.0298Midwater rockfish 0.0094Megazoobenthos 0.0083Deep small rockfish 0.0078Large planktivores 0.0078Juv. deep large rockfish 0.0029Miscellaneous nearshore fish 0.0016Shallow macrozoobenthos 0.0014Pacific hake 0.0012Gelatinous zooplankton 0.0003Juv. large flatfish 0.0002Juv. small flatfish 0.0002
Table C-2. Diet composition by weight for arrowtooth flounder, a member of feeding guild H in Figure 11.
Prey PercentPacific hake 0.4556Small planktivores 0.1588Large zooplankton 0.1402Benthic herbivorous grazers 0.0881Small flatfish 0.0411Miscellaneous nearshore fish 0.0331Shrimp 0.0155Cephalopods 0.0134Deep miscellaneous fishes 0.0109Large flatfish 0.0106Deposit feeders 0.0069Deep vertical migrators 0.0064Carrion 0.0050Megazoobenthos 0.0044Large planktivores 0.0037Benthic carnivores 0.0035Chinook salmon 0.0026Shallow benthic filter feeders 0.0001Gelatinous zooplankton <0.00005Mesozooplankton <0.00005

Table C-3. Diet composition by weight for Bering skate, a member of feeding guild E in Figure 11.
Prey PercentShrimp 0.6150Small flatfish 0.3380Megazoobenthos 0.0470
Table C-5. Diet composition by weight for
black rockfish, a member of feeding guild B in Figure 11.
Prey PercentSmall planktivores 0.5076Large zooplankton 0.1577Juv. megazoobenthos 0.1158Gelatinous zooplankton 0.0660Deposit feeders 0.0346Shrimp 0.0322Juv. Pacific hake 0.0272Juv. Chinook salmon 0.0261Juv. midwater rockfish 0.0129Small flatfish 0.0114Juv. small flatfish 0.0042Juv. shallow large rockfish 0.0020Juv. shallow small rockfish 0.0015Cephalopods 0.0010Benthic herbivorous grazers 0.0003
Table C-7. Diet composition by weight for blue rockfish, a member of feeding guild B in Figure 11.
Prey PercentGelatinous zooplankton 0.5502Small planktivores 0.3517Large zooplankton 0.0586Deposit feeders 0.0265Benthic herbivorous grazers 0.0130
Table C-4. Diet composition by weight for big skate, a member of feeding guild E in Figure 11.
Prey PercentShrimp 0.5879Megazoobenthos 0.2165Small flatfish 0.1542Deep miscellaneous fishes 0.0356Sablefish 0.0058Benthic herbivorous grazers <0.00005
Table C-6. Diet composition by weight for blue lanternfish, a member of feeding guild A in Figure 11.
Prey PercentLarge zooplankton 0.9467Deposit feeders 0.0296Mesozooplankton 0.0237
Table C-8. Diet composition by weight for California headlightfish, a member of feeding guild A in Figure 11.
Prey PercentLarge zooplankton 0.6618Mesozooplankton 0.2206Deposit feeders 0.1176
69

Table C-9. Diet composition by weight for canary rockfish, a member of feeding guild A in Figure 11.
Prey PercentLarge zooplankton 0.9461Benthic herbivorous grazers 0.0285Deep vertical migrators 0.0199Small planktivores 0.0040Juv. Pacific hake 0.0010Gelatinous zooplankton 0.0004Megazoobenthos 0.0001
Table C-11. Diet composition by weight for darkblotched rockfish, a member of feeding guild A in Figure 11.
Prey PercentLarge zooplankton 0.7845Deep vertical migrators 0.1188Deposit feeders 0.0552Mesozooplankton 0.0414
Table C-10. Diet composition by weight for Chinook salmon, a member of feeding guild B in Figure 11.
Prey PercentSmall planktivores 0.4840Large zooplankton 0.2603Juv. midwater rockfish 0.0704Juv. deep small rockfish 0.0584Cephalopods 0.0534Juv. megazoobenthos 0.0262Juv. deep large rockfish 0.0214Juv. shallow large rockfish 0.0107Juv. shallow small rockfish 0.0083Deep vertical migrators 0.0025Pacific hake 0.0020Miscellaneous nearshore fish 0.0008Small flatfish 0.0006Benthic herbivorous grazers 0.0003Deposit feeders 0.0002Gelatinous zooplankton 0.0002Shallow macrozoobenthos 0.0001Shrimp 0.0001
Table C-12. Diet composition by weight for deepsea sole, a member of feeding guild D in Figure 11.
Prey PercentBenthic carnivores 0.5891Deep macrozoobenthos 0.1790Deposit feeders 0.1545Deep benthic filter feeders 0.0343Benthic herbivorous grazers 0.0229Shallow benthic filter feeders 0.0131Shrimp 0.0050Megazoobenthos 0.0017Other benthic filter feeders 0.0003
70

Table C-13. Diet composition by weight for Dover sole, a member of feeding guild D in Figure 11.
Prey PercentBenthic carnivores 0.4316Deep macrozoobenthos 0.3597Deposit feeders 0.0992Other benthic filter feeders 0.0635Benthic herbivorous grazers 0.0216Shallow benthic filter feeders 0.0096Megazoobenthos 0.0065Large zooplankton 0.0040Cephalopods 0.0027Deep benthic filter feeders 0.0006Gelatinous zooplankton 0.0006Deep vertical migrators 0.0002Mesozooplankton 0.0001Macroalgae <0.00005Microzooplankton <0.00005
Table C-15. Diet composition by weight for garnet lampfish, a member of feeding guild C in Figure 11.
Prey PercentMesozooplankton 0.7150Large zooplankton 0.1934Deposit feeders 0.0415Shallow benthic filter feeders 0.0334Benthic carnivores 0.0167
Table C-14. Diet composition by weight for English sole, a member of feeding guild D in Figure 11.
Prey PercentDeposit feeders 0.7020Benthic carnivores 0.1600Benthic herbivorous grazers 0.0426Other benthic filter feeders 0.0356Shrimp 0.0201Megazoobenthos 0.0199Deep macrozoobenthos 0.0169Mesozooplankton 0.0029
Table C-16. Diet composition by weight for giant grenadier, a member of feeding guild E in Figure 11.
Prey PercentShrimp 0.3704Deep miscellaneous fishes 0.2499Large zooplankton 0.1523Deposit feeders 0.1299Cephalopods 0.0743Benthic herbivorous grazers 0.0198Deep macrozoobenthos 0.0032Shallow macrozoobenthos 0.0003
71

Table C-17. Diet composition by weight for greenstriped rockfish, a member of feeding guild A in Figure 11.
Prey PercentLarge zooplankton 0.7220Deep vertical migrators 0.1349Deposit feeders 0.0826Benthic herbivorous grazers 0.0272Cephalopods 0.0141Megazoobenthos 0.0075Mesozooplankton 0.0062Shrimp 0.0056
Table C-19. Diet composition by weight for lingcod, a member of feeding guild H in Figure 11.
Prey PercentShallow small rockfish 0.2067Miscellaneous nearshore fish 0.2024Juv. small demersal sharks 0.1118Pacific hake 0.0861Small flatfish 0.0763Small planktivores 0.0615Chinook salmon 0.0492Juv. midwater rockfish 0.0487Juv. deep small rockfish 0.0404Benthic herbivorous grazers 0.0326Shallow macrozoobenthos 0.0217Cephalopods 0.0195Juv. deep large rockfish 0.0148Large zooplankton 0.0076Juv. shallow large rockfish 0.0074Juv. shallow small rockfish 0.0058Juv. canary rockfish 0.0042Deposit feeders 0.0022Deep vertical migrators 0.0011
Table C-18. Diet composition by weight for jack mackerel, a member of feeding guild A in Figure 11.
Prey PercentLarge zooplankton 0.5674Shrimp 0.2996Small planktivores 0.0668Juv. small flatfish 0.0130Miscellaneous nearshore fish 0.0066Benthic herbivorous grazers 0.0061Juv. Pacific hake 0.0058Juv. deep miscellaneous fish 0.0057Juv. megazoobenthos 0.0055Juv. midwater rockfish 0.0052Juv. deep small rockfish 0.0051Juv. deep large rockfish 0.0050Juv. shallow small rockfish 0.0049Deposit feeders 0.0016Cephalopods 0.0010Juv. shallow large rockfish 0.0003Mesozooplankton 0.0003
72

Table C-20. Diet composition by weight for longnose skate, a member of feeding guild E in Figure 11.
Prey PercentShrimp 0.2126Small flatfish 0.1293Shallow small rockfish 0.1044Deep miscellaneous fishes 0.0870Deposit feeders 0.0803Large zooplankton 0.0673Shallow macrozoobenthos 0.0575Cephalopods 0.0559Pacific hake 0.0543Deep vertical migrators 0.0493Juv. deep small rockfish 0.0348Juv. midwater rockfish 0.0218Benthic herbivorous grazers 0.0141Juv. deep large rockfish 0.0060Juv. shallow large rockfish 0.0053Juv. canary rockfish 0.0044Juv. shallow small rockfish 0.0042Miscellaneous nearshore fish 0.0040Surfperch 0.0023Small planktivores 0.0023Megazoobenthos 0.0017Small demersal sharks 0.0011
Table C-22. Diet composition by weight for northern anchovy, a member of feeding guild A in Figure 11.
Prey PercentLarge zooplankton 0.6515Large phytoplankton 0.2855Shrimp 0.0277Benthic herbivorous grazers 0.0241Mesozooplankton 0.0070Juv. megazoobenthos 0.0035Deposit feeders 0.0004Cephalopods 0.0003
Table C-21. Diet composition by weight for longspine thornyhead, a member of feeding guild H in Figure 11.
Prey PercentDeposit feeders 0.2362Megazoobenthos 0.1966Small planktivores 0.1375Cephalopods 0.0869Deep vertical migrators 0.0812Carrion 0.0531Benthic carnivores 0.0499Deep macrozoobenthos 0.0410Deep miscellaneous fishes 0.0223Deep small rockfish 0.0187Deep large rockfish 0.0180Large zooplankton 0.0167Shallow benthic filter feeders 0.0124Benthic herbivorous grazers 0.0114Shrimp 0.0080Pacific hake 0.0068Gelatinous zooplankton 0.0015Midwater rockfish 0.0012Mesozooplankton 0.0002Shallow small rockfish 0.0001
Table C-23. Diet composition by weight for
northern lampfish, a member of feeding guild C in Figure 11.
Prey PercentLarge zooplankton 0.6401Mesozooplankton 0.2509Deposit feeders 0.1090
73

Table C-24. Diet composition by weight for northern smoothtongue, a member of feeding guild G in Figure 11.
Prey PercentShallow benthic filter feeders 0.2779Deposit feeders 0.2323Large zooplankton 0.2073Mesozooplankton 0.1788Gelatinous zooplankton 0.0592Benthic carnivores 0.0399Benthic herbivorous grazers 0.0034Cephalopods 0.0011
Table C-26. Diet composition by weight for Pacific hake, a member of feeding guild A in Figure 11.
Prey PercentLarge zooplankton 0.7827Small planktivores 0.1929Benthic herbivorous grazers 0.0107Juv. Pacific hake 0.0059Deposit feeders 0.0020Small flatfish 0.0015Cephalopods 0.0009Deep vertical migrators 0.0007Shrimp 0.0006Shallow small rockfish 0.0005Deep miscellaneous fishes 0.0004Megazoobenthos 0.0004Miscellaneous nearshore fish 0.0003Juv. large flatfish 0.0002Deep small rockfish 0.0001Juv. deep large rockfish 0.0001Juv. midwater rockfish 0.0001
Table C-25. Diet composition by weight for Pacific grenadier, a member of feeding guild F in Figure 11.
Prey PercentCephalopods 0.3490Deposit feeders 0.2426Deep miscellaneous fishes 0.2283Benthic carnivores 0.0980Megazoobenthos 0.0278Shrimp 0.0267Large zooplankton 0.0180Mesozooplankton 0.0050Deep macrozoobenthos 0.0040Shallow macrozoobenthos 0.0005
Table C-27. Diet composition by weight for Pacific halibut, a member of feeding guild H in Figure 11.
Prey PercentPacific hake 0.3763Deposit feeders 0.2003Megazoobenthos 0.1551Deep miscellaneous fishes 0.0366Small flatfish 0.0364Small planktivores 0.0333Large flatfish 0.0305Carrion 0.0260Miscellaneous nearshore fish 0.0208Cephalopods 0.0128Large planktivores 0.0125Shallow macrozoobenthos 0.0098Benthic herbivorous grazers 0.0096Chinook salmon 0.0096Shrimp 0.0085Deep vertical migrators 0.0079Large zooplankton 0.0039Skates and rays 0.0035Shallow benthic filter feeders 0.0031Sablefish 0.0021Benthic carnivores 0.0011Deep macrozoobenthos 0.0002Deep benthic filter feeders 0.0001
74

Table C-28. Diet composition by weight for Pacific herring, a member of feeding guild A in Figure 11.
Prey Percent Large zooplankton 0.8010Shrimp 0.0833Deposit feeders 0.0610Mesozooplankton 0.0325Juv. megazoobenthos 0.0130Small planktivores 0.0089Benthic herbivorous grazers 0.0003
Table C-30. Diet composition by weight for Pacific ocean perch, a member of feeding guild A in Figure 11.
Prey PercentLarge zooplankton 0.6452Deep vertical migrators 0.1605Deposit feeders 0.0822Benthic herbivorous grazers 0.0549Large planktivores 0.0324Cephalopods 0.0248
Table C-29. Diet composition by weight for Pacific mackerel, a member of feeding guild A in Figure 11.
Prey Percent Large zooplankton 0.6242Mesozooplankton 0.1448Juv. megazoobenthos 0.0640Cephalopods 0.0326Juv. Pacific hake 0.0318Gelatinous zooplankton 0.0301Juv. deep miscellaneous fish 0.0258Juv. shallow small rockfish 0.0164Juv. large demersal predators 0.0115Deposit feeders 0.0067Shrimp 0.0055Juv. small flatfish 0.0019Juv. deep small rockfish 0.0012Juv. midwater rockfish 0.0012Juv. deep large rockfish 0.0009Juv. shallow large rockfish 0.0008Benthic herbivorous grazers 0.0006
Table C-31. Diet composition by weight for Pacific sanddab, a member of feeding guild E in Figure 11.
Prey PercentShrimp 0.4166Benthic herbivorous grazers 0.2514Deposit feeders 0.2374Benthic carnivores 0.0866Large zooplankton 0.0028Small flatfish 0.0018Gelatinous zooplankton 0.0012Mesozooplankton 0.0010Miscellaneous nearshore fish 0.0006Cephalopods 0.0004Pacific hake 0.0002
75

Table C-32. Diet composition by weight for Pacific sardine, a member of feeding guild A in Figure 11.
Prey PercentLarge zooplankton 0.5429Large phytoplankton 0.2279Mesozooplankton 0.2157Shrimp 0.0131Deposit feeders 0.0005
Table C-34. Diet composition by weight for petrale sole, a member of feeding guild E in Figure 11.
Prey PercentSmall flatfish 0.6212Shrimp 0.2546Miscellaneous nearshore fish 0.0585Large flatfish 0.0378Deposit feeders 0.0122Deep miscellaneous fishes 0.0056Benthic herbivorous grazers 0.0041Cephalopods 0.0041Deep benthic filter feeders 0.0020
Table C-36. Diet composition by weight for redstripe rockfish, a member of feeding guild A in Figure 11.
Prey PercentLarge zooplankton 1.0000
Table C-33. Diet composition by weight for Pacific viperfish, not a member of a feeding guild.
Prey PercentDeep vertical migrators 0.9989Mesozooplankton 0.0011
Table C-35. Diet composition by weight for pygmy rockfish, a member of feeding guild A in Figure 11.
Prey PercentLarge zooplankton 0.9193Mesozooplankton 0.0568Deposit feeders 0.0226Cephalopods 0.0009Benthic herbivorous grazers 0.0004
Table C-37. Diet composition by weight for
rex sole, a member of feeding guild D in Figure 11.
Prey Percent Benthic carnivores 0.6667Deposit feeders 0.3189Other benthic filter feeders 0.0144
76

Table C-38. Diet composition by weight for rosethorn rockfish, a member of feeding guild G in Figure 11.
Prey PercentDeposit feeders 0.4592Benthic herbivorous grazers 0.3549Deep vertical migrators 0.0706Large zooplankton 0.0675Megazoobenthos 0.0149Mesozooplankton 0.0135Gelatinous zooplankton 0.0105Juv. midwater rockfish 0.0032Juv. deep small rockfish 0.0027Cephalopods 0.0011Juv. deep large rockfish 0.0010Juv. shallow large rockfish 0.0005Juv. shallow small rockfish 0.0004
Table C-39. Diet composition by weight for rougheye rockfish, a member of feeding guild G in Figure 11.
Prey PercentBenthic herbivorous grazers 0.4875Shrimp 0.1129Large zooplankton 0.0875Small planktivores 0.0869Deposit feeders 0.0810Cephalopods 0.0494Deep vertical migrators 0.0340Megazoobenthos 0.0262Miscellaneous nearshore fish 0.0261Pacific hake 0.0036Benthic carnivores 0.0032Other benthic filter feeders 0.0012Small flatfish 0.0004
77

Table C-40. Diet composition by weight for sablefish, a member of feeding guild H in Figure 11.
Prey PercentDeep small rockfish 0.3350Pacific hake 0.1338Cephalopods 0.0894Deposit feeders 0.0668Deep miscellaneous fishes 0.0664Carrion 0.0602Small planktivores 0.0495Large zooplankton 0.0339Small flatfish 0.0321Deep large rockfish 0.0236Shallow small rockfish 0.0186Deep vertical migrators 0.0109Juv. sablefish 0.0094Shallow macrozoobenthos 0.0089Midwater rockfish 0.0086Gelatinous zooplankton 0.0080Small demersal sharks 0.0079Benthic herbivorous grazers 0.0077Megazoobenthos 0.0073Shrimp 0.0043Benthic carnivores 0.0032Macroalgae 0.0025Shallow benthic filter feeders 0.0021Skates and rays 0.0020Chinook salmon 0.0016Juv. large flatfish 0.0016Other benthic filter feeders 0.0015Shallow large rockfish 0.0012Miscellaneous nearshore fish 0.0008Deep benthic filter feeders 0.0006Deep macrozoobenthos 0.0006
Table C-41. Diet composition by weight for sharpchin rockfish, a member of feeding guild A in Figure 11.
Prey PercentLarge zooplankton 0.4462Deep vertical migrators 0.3571Deposit feeders 0.1164Benthic herbivorous grazers 0.0399Mesozooplankton 0.0221Cephalopods 0.0103Gelatinous zooplankton 0.0080
78

Table C-42. Diet composition by weight for shortspine thornyhead, a member of feeding guild A in Figure 11.
Prey PercentMegazoobenthos 0.3196Benthic herbivorous grazers 0.1206Deposit feeders 0.0955Juv. Pacific hake 0.0872Deep small rockfish 0.0871Deep miscellaneous fishes 0.0830Carrion 0.0764Midwater rockfish 0.0457Deep large rockfish 0.0349Shrimp 0.0185Cephalopods 0.0066Shallow small rockfish 0.0054Canary rockfish 0.0039Juv. small flatfish 0.0037Small planktivores 0.0032Benthic carnivores 0.0024Juv. large flatfish 0.0023Deep vertical migrators 0.0017Large zooplankton 0.0009Shallow benthic filter feeders 0.0007Shallow macrozoobenthos 0.0007Deep macrozoobenthos 0.0001
Table C-44. Diet composition by weight for sleeper shark, a member of feeding guild H in Figure 11.
Prey PercentCephalopods 0.3890Pinnipeds 0.1670Chinook salmon 0.1110Deep small rockfish 0.1110Large pelagic predators 0.1110Other benthic filter feeders 0.0560Megazoobenthos 0.0280Shrimp 0.0280
Table C-43. Diet composition by weight for sixgill shark, a member of feeding guild F in Figure 11.
Prey PercentCephalopods 0.5689Deep miscellaneous fishes 0.1143Pacific hake 0.1143Small demersal sharks 0.1068Pinnipeds 0.0888Other benthic filter feeders 0.0030
79

Table C-45. Diet composition by weight for soupfin shark, a member of feeding guild H in Figure 11.
Prey PercentSmall planktivores 0.2556Miscellaneous nearshore fish 0.2246Pacific hake 0.1156Large flatfish 0.1019Cephalopods 0.0545Chinook salmon 0.0384Large planktivores 0.0359Large demersal predators 0.0322Midwater rockfish 0.0317Deep small rockfish 0.0262Skates and rays 0.0121Small flatfish 0.0120Deep large rockfish 0.0096Large demersal sharks 0.0089Large pelagic predators 0.0089Pelagic sharks 0.0088Sablefish 0.0049Shallow large rockfish 0.0048Shallow macrozoobenthos 0.0043Shallow small rockfish 0.0037Canary rockfish 0.0027Migrating seabirds 0.0024Gelatinous zooplankton 0.0003
Table C-47. Diet composition by weight for splitnose rockfish, a member of feeding guild A in Figure 11.
Prey Percent Large zooplankton 0.9462Deep vertical migrators 0.0310Deposit feeders 0.0207Cephalopods 0.0021
Table C-46. Diet composition by weight for spiny dogfish, a member of feeding guild A in Figure 11.
Prey PercentLarge zooplankton 0.5265Small demersal sharks 0.1209Small flatfish 0.0968Megazoobenthos 0.0569Cephalopods 0.0535Pacific hake 0.0465Gelatinous zooplankton 0.0330Small planktivores 0.0308Shrimp 0.0096Miscellaneous nearshore fish 0.0039Juv. shallow small rockfish 0.0030Juv. canary rockfish 0.0030Juv. deep large rockfish 0.0030Juv. deep small rockfish 0.0030Juv. midwater rockfish 0.0030Juv. shallow large rockfish 0.0030
Table C-48. Diet composition by weight for spotted ratfish, a member of feeding guild H in Figure 11.
Prey PercentMegazoobenthos 0.3945Other benthic filter feeders 0.2696Small flatfish 0.1051Shrimp 0.0965Deposit feeders 0.0558Pacific hake 0.0379Miscellaneous nearshore fish 0.0296Deep miscellaneous fishes 0.0111
80

81
Table C-49. Diet composition by weight for twoline eelpout, a member of feeding guild G in Figure 11.
Prey PercentDeposit feeders 0.3704Large zooplankton 0.3704Deep miscellaneous fishes 0.2111Cephalopods 0.0482
Table C-51. Diet composition by weight for yelloweye rockfish, a member of feeding guild H in Figure 11.
Prey PercentSmall planktivores 0.3273Deposit feeders 0.1913Miscellaneous nearshore fish 0.1450Small flatfish 0.1267Benthic herbivorous grazers 0.0900Juv. midwater rockfish 0.0508Midwater rockfish 0.0382Juv. shallow large rockfish 0.0077Cephalopods 0.0066Juv. shallow small rockfish 0.0060Shallow large rockfish 0.0058Shallow small rockfish 0.0045Large zooplankton 0.0001
Table C-50. Diet composition by weight for widow rockfish, a member of feeding guild G in Figure 11.
Prey PercentGelatinous zooplankton 0.4829Large zooplankton 0.3419Deposit feeders 0.0460Deep vertical migrators 0.0422Juv. Pacific hake 0.0422Benthic carnivores 0.0126Cephalopods 0.0095Small planktivores 0.0074Juv. sablefish 0.0029Juv. shallow small rockfish 0.0018Juv. deep large rockfish 0.0018Juv. deep small rockfish 0.0018Juv. midwater rockfish 0.0018Juv. shallow large rockfish 0.0018Benthic herbivorous grazers 0.0017Juv. small flatfish 0.0013Shallow macrozoobenthos 0.0003Deep miscellaneous fishes <0.00005Small flatfish <0.00005
Table C-52. Diet composition by weight for yellowtail rockfish, a member of feeding guild G in Figure 11.
Prey PercentLarge zooplankton 0.4013Gelatinous zooplankton 0.2208Juv. Pacific hake 0.1498Small planktivores 0.0699Cephalopods 0.0523Deep vertical migrators 0.0459Juv. small flatfish 0.0324Benthic herbivorous grazers 0.0132Deposit feeders 0.0046Juv. midwater rockfish 0.0041Juv. deep small rockfish 0.0034Juv. deep large rockfish 0.0012Juv. shallow large rockfish 0.0006Juv. shallow small rockfish 0.0005

Most NOAA Technical Memorandums NMFS-NWFSC are available online at theNorthwest Fisheries Science Center web site (http://www.nwfsc.noaa.gov).
NOAA Technical Memorandum NMFS-NWFSC-102 Reppond, K.D. 2009. Biochemistry of red king crab (Paralithodes camtschaticus) from different locations in
Alaskan waters. U.S. Dept. Commer., NOAA Tech. Memo. NMFS-NWFSC-102, 16 p. NTIS number pending.
101 Sands, N.J., K. Rawson, K.P. Currens, W.H. Graeber, M.H. Ruckelshaus, R.R. Fuerstenberg, and J.B. Scott. 2009. Determination of independent populations and viability criteria for the Hood Canal summer chum salmon evolutionarily significant unit. U.S. Dept. Commer., NOAA Tech. Memo. NMFS-NWFSC-101, 58 p. NTIS number pending.
100 Linbo, T.L. 2009. Zebrafish (Danio rerio) husbandry and colony maintenance at the Northwest Fisheries Sci-ence Center. U.S. Dept. Commer., NOAA Tech. Memo. NMFS-NWFSC-100, 62 p. NTIS number PB2009-113299.
99 Rawson, K., N.J. Sands, K.P. Currens, W.H. Graeber, M.H. Ruckelshaus, R.R. Fuerstenberg, and J.B. Scott. 2009. Viability criteria for the Lake Ozette sockeye salmon evolutionarily significant unit. U.S. Dept. Commer., NOAA Tech. Memo. NMFS-NWFSC-99, 38 p. NTIS number PB2009-113298.
98 Johnson, L.L., G.M. Ylitalo, M.S. Myers, B.F. Anulacion, J. Buzitis, W.L. Reichert, and T.K. Collier.
2009. Polycyclic aromatic hydrocarbons and fish health indicators in the marine ecosystem in Kitimat, British Columbia. U.S. Dept. Commer., NOAA Tech. Memo. NMFS-NWFSC-98, 123 p. NTIS number PB2009-110295.
97 Roegner, G.C., H.L. Diefenderfer, A.B. Borde, R.M. Thom, E.M. Dawley, A.H. Whiting, S.A. Zimmerman, and G.E. Johnson. 2009. Protocols for monitoring habitat restoration projects in the lower Columbia River and estuary. U.S. Dept. Commer., NOAA Tech. Memo. NMFS-NWFSC-97, 63 p. NTIS number PB2009-113671.
96 Currens, K.P., R.R. Fuerstenberg, W.H. Graeber, K. Rawson, M.H. Ruckelshaus, N.J. Sands, and J.B. Scott. 2009. Identification of an independent population of sockeye salmon in Lake Ozette, Washington. U.S. Dept. Commer., NOAA Tech. Memo. NMFS-NWFSC-96, 18 p. NTIS number PB2009-108060.
95 Harms, J.H., J.A. Benante, and R.M. Barnhart. 2008. The 2004–2007 hook and line survey of shelf rockfish in the Southern California Bight: Estimates of distribution, abundance, and length composition. U.S. Dept. Commer., NOAA Tech. Memo. NMFS-NWFSC-95, 110 p. NTIS number PB2009-106740.
Recent NOAA Technical Memorandumspublished by theNorthwest Fisheries Science Center