NOAA TM GLERL-86. Great Lakes states monthly precipitation data ...
NOAA Technical Memorandum ERL GLERL-15
WINTER CURRENTS IN LAKE HURON
James H. SaylorGerald S. Miller
Environmental Protection Agency Report No. EPA-905/4-75-004
Great Lakes Environmental Research LaboratoryAnn Arbor, MichiganDecember 1976
UNITED STATES
DEPARTMENT OF COMMERCE
Juanita M. Kreps. Secretary
NATIONAL CCtANlC ANC
ATMOSPHERIC ADMINISIRAIION
Richard A Frank Admtnislraloi
tnv~ronmenlal Research
latmalcNe5
Miilmot N Hess D~~eclot

NOTICE
The NOAA Environmental Research Laboratories do notapprove, recommend, or endorse any proprietary product orproprietary material mentioned in this publication. Noreference shall be made to the NOAA Environmental ResearchLaboratories, or to this publication furnished by the NOAAEnvironmental Research Laboratories, in~any advertising orsales promotion which would indicate or imply that the NOAAEnvironmental Research Laboratories approve, recommend, orendorse any proprietary product or proprietary materialmentioned herein, or which has as its purpose an intent tocause directly or indirectly the advertised product to beused or purchased because of this NOAA Environmental ResearchLaboratories publication.
ii

FOREWORD
This report presents the results of an investigation of water flow andtemperature structure during winter in Lake Huron. Twenty-one current metermoorings were deployed in the lake in November 1974 and retrieved approximately6 months later. Collected data were analyzed to determine the character ofcurrent flow during conditions of an almost isothermal lake water mass. Thisstudy was a cooperative effort of the National Oceanic and Atmospheric Admin-istration's Great Lakes Environmental Research Laboratory, the Canada Centrefor Inland Waters, and Region V of the Environmental Protection Agency. Itwas partially supported by the Environmental Protection Agency through an Inter-agency Agreement and is a contribution to the International Joint CommissionUpper Lakes Reference Study. The authors are particularly grateful to Dr. E.B. Bennett of the Canada Centre for Inland Waters for his arrangement for andcoordination of Canadian participation in the study and to Mr. R. J. Bowden ofthe Environmental Protection Agency, Region V, for his generous support offield operations from the Research VesseZ Roger R. Sim~ns.
iii

c P
Abstract
1. INTRODUCTION
2. METHOD
3. RESULTS
CONTENTS
Page
1
1
4
6
3.1 The Character of the Wind Field 6
3.2 Water Temperature Structure a
3.3 Seasonal and Monthly Current Patterns 11
3.4 Episode Analysis 16
3.5 Effects of Ice Cover 20
3.6 The Annual Cycle of the Variation of Current Speeds with Depth 23
3.7 Comparison of Summer Current Patterns 26
4. CONCLUSIONS 28
5. REFERENCES 31
Appendix A. MONTHLY AND SEASONAL WATER CURRENT TRANSPORT AND WIND RUNROSES FOR CONDITIONS OBSERVED IN LARE HURON DURING WINTER1974-75 34
Appendix B. WATER CURRENT TRANSPORT AND WIND RUN ROSES FOR SELECTEDEPISODES OF DIRECTIONALLY STEADY WIND STRESS IN LAKE HURONDURING WINTER 1974-75 67
/Y
I

1.
2.
3.
4.
5.
6.
7.
8.
9.
10.
11.
12.
13.
14.
15.
FIGURES
Location map showing current meter mooring sites and Lake Huronbathymetry. 3
Summary of data returned from each current meter deployed in LakeHuron during winter 1974-75. 5
Comparison of air temperature measurements at meteorologicalstations near the west coast of Lake Huron and water temperaturesat 15 m depth at nearby current meter moorings during winter1974-75. 7
Monthly wind speeds measured at five meteorological stationsabout the perimeter of Lake Huron. 8
Monthly mean water temperatures from Lake Huron's deep northeasternbasin (mooring 113). the northern part of the lake off Alpena, Mich.(mooring 109). and the southern end (mooring 101). 9
Monthly mean water temperatures ("C) at 15 m depth during February1975 in Lake Huron. Distributions in the eastern parts of thelake are assumed. but ice was rresent along the east coast, indicat-ing the presence of near O'C water. 10
Water temperature distribution across the mid-lake ridge. 11
Vector resultant current flows in Lake Huron during winter 1974-75. 16
Side-Looking Airborne Radar Image showing the ice cover on westernLake Huron on 12 February 1975.
Vector resultant current flows in Lake Huron during 9-15 February1975.
Vector resultant current flows in Lake Huron during 26 February-6March 1975.
Monthly mean current speeds at the four levels of measurement inLake Huron during winter 1974-75.
Lake-wide average of the RMS current speed at four depths observedin Lake Ontario during 1972.
Surface water flow patterns in Lake Huron during the open waternavigation season.
Flow patterns of epilimnion water in Lake Huron during summer.
vi
21
22
22
24
25
27
27

16. Surface water temperatures ("C) of Lake Huron as observed in 1971on three CCIW monitor cruises. 29
17. Temperature isopleths ("C) of the Lake Huron water mass on a crosssection of the lake from Black River, Mich., to Tobermory, Or&.,for the cruise intervals of Figure 16. 30
vii

A.la.
A.lb.
A.lc.
A.ld.
A.2a.
A.2b.
A.2c.
A.2d.
A.3a.
A.3b.
A.3c.
A.3d.
A.4a.
A.4b.
A.4c.
A.4d.
A.5a.
A.5b.
A.5c.
A.5d.
A.6a.
A.6b.
L , 3
APPENDIX FIGURES
Page
Water current transport roses at 15 m depth in Lake Huronand wind run roses at five perimeter meteorological stationsfor November 1974.
Current roses at 25 m depth for November 1974.
Current roses at 50 m depth for November 1974.
Current roses at 2 m above the bottom for November 1974.
Current roses at 15 m depth and wind roses for December1974.
Current roses at 25 m depth for December 1974.
Current roses at 50 m depth for December 1974.
Current roses at 2 m above the bottom for December 1974.
Current roses at 15 m depth and wind roses for January1975.
Current roses at 25 m depth for January 1975.
Current roses at 50 m depth for January 1975.
Current roses at 2 m above the bottom for January 1975.
Current roses at 15 m depth and wind roses for February 1975.
Current roses at 25 m depth for February 1975.
Current roses at 15 m depth for February 1975.
Current roses at 2 m above the bottom for February 1975.
Current roses at 15 m depth and wind roses for March 1975.
Current roses at 25 m depth for March 1975.
Current roses at 50 m depth for March 1975.
Current roses at 2 m above the bottom for March 1975.
Current roses at 15 m depth and wind roses for April 1975.
Current roses at 25 m depth for April 1975.
viii
35
36
37
38
39
40
41
42
43 1,
44 I
45
46
47
48
49
50
51
52
53
54
55
56

A.6c.
A.6d.
A.7a.
A.7b.
A.?c.
A.Ba.
A.Bb.
A.Bc.
A.Bd.
B.la.
B.lb.
B.lc.
B.ld.
B.2a.
B.2b.
B.2c.
B.2d.
B.3a.
B.3b.
B.3c.
B.3d.
B.4a.
B.4b.
B.4c.
Current roses at 50 m depth for April 1975.
Current roses at 2 m above the bottom for April 1975.
Current roses at 15 m depth and wind roses for May 1975.
Current roses at 25 m depth for May 1975.
Current roses at 50 m depth for May 1975.
Current roses at 15 m depth and wind roses for winter 1974-75.
Current roses at 25 m depth for winter 1974-75.
Current roses at 50 m depth for winter 1974-75.
Current roses at 2 m above the bottom for winter 1974-75.
Current roses at 15 m depth and wind roses for 20-22 November1974.
Current roses at 25 m depth for 20-22 November 1974.
Current roses at 50 m depth for 20-22 November 1974.
Current roses at 2 m above the bottom for 20-22 November 1974.
Current roses at 25 m depth for 30 November-2 December 1974.
Current roses at 25 m depth for 30 November-2 December 1974.
Current roses at 50 m depth for 30 November-2 December 1974.
Current roses at 2 m above the bottom for 30 November-2December 1974.
Current roses at 15 m depth and wind roses for 26-29 December1974.
Current roses at 25 m depth for 26-29 December 1974.
Current roses at 50 m depth for 26-29 December 1974. ,
Current roses at 2 m above the bottom for 26-29 December 1974.
Current roses at 15 m depth and wind roses for Y-11 January1975.
Current roses at 25 m depth for Y-11 January 1975.
Current roses at 50 m depth for Y-11 January 1975.
is
57
58
59
60
61
63
64
65
66
68
69
70
71
72
73
74
75
76
77
78
79
80
81
82

B.4d.
B.5a.
B.5b.
B.5c.
B.5d.
B.6a.
B.6b.
B.6c.
B.6d.
B.7a.
B.7b.
B.7c.
B.7d.
B.Ba.
B.Bb.
B.Bc.
B.Bd.
B.Ya.
B.Yb.
B.Yc.
B.Yd.
B.lOa.
B.lOb.
B.lOc.
Current roses at 2 m above the bottom for Y-11 January 1975.
Current roses at 25 m depth and wind roses for 11-14 January1975.
Current roses at 25 m depth for 11-14 January 1975.
Current roses at 50 m depth for 11-14 Janyary 1975.
Current ruses at 2 m above the bottom for 11-14 January 1975.
Current roses at 15 m depth and wind roses for Y-15 February1975.
Current roses at 25 m depth for 9-15 February 1975.
Current roses at 50 m depth for Y-15 February 1975.
Current roses at 2 m above the bottom for Y-15 February 1974.
Current roses at 15 m depth and wind roses for 26 February-6March 1975.
Current roses at 25 m depth for 26 February-6 March 1975.
Current roses at 50 m depth for 26 February-6 March 1975.
Current roses at 2 m above the bottom for 26 February-6 March1975.
Current roses at 15 m depth and wind roses for l-8 April 1974.
Current roses at 25 m depth for l-8 April 1975.
Current roses at 50 m depth for l-8 April 1975.
Current roses at 2 m above the bottom for l-8 April 1975.
Current roses at 15 m depth and wind roses for 3-13 April1974.
Current roses at 25 m depth for 3-13 April 1975.
Current roses at 50 m depth for 3-13 April 1975.
Current roses at 2'" above the bottom for 3-13 April 1975.
Current roses at 15 m depth and wind roses for 3-J hY 1974.
Current roses at 25 m depth for 3-7 May 1975.
Current roses at 50 m depth for 3-7 May 1975.
x
I83
84
85
86
87
88
89
90
91
92
93
94
95
96
97
98
99
100
101
102
103
104
195
106

WINTER CURRENTS IN LAKE HURON*
James H. Saylor and Gerald S. Miller
Twenty-one current meter moorings were deployed in Lake Huronduring winter 1974-75. The moorings were set in November 1974 andretrieved approximately 6 months later. The stations were configuredon a coarse grid to measure the lake-scale circulation during winter.Water temperature was also recorded in nearly all of the 65 currentmeters deployed. Results reveal a strong cyclonic flow pattern inthe Lake Huron Basin persisting throughout the winter. The observedwinter circulation was in essence very similar to what is nowbelieved to be the summer circulation of epilimnion water, althoughthe winter currents penetrated to deeper levels in the water columnand were more intense. Winter cyclonic flow persisted in a nearlyhomogeneous water mass, while summer currents exhibited an almostgeostrophic balance with observed water density distributions.This suggests that the current field driven by prevailing windstresses across the lake's water surface may be largely responsiblefor establishing the horizontal gradients of water density ob-served in the lake during summer. Analyses of energetic windstress impulses reveal the prevailing wind directions that drivethe dominant circulations. The winter studies permit a descrip-tion of the annual cycle of horizontal current speed variationwith depth in Lake Huron, and in the other Great Lakes as well.The effects of ice cover are examined and the distribution andmovement of the ice cover with respect to lake current andtemperature fields are discussed.
1. INTRODUCTION
This report presents the results of an investigation of the character ofwinter current flow in Lake Huron. The investigative effort was undertakenduring winter 1974-75 as a part of the International Joint Commission UpperLakes Reference Study. The current surveys were accomplished through a coopera-tive effort of the Great Lakes Environmental Research Laboratory (GLERL) of theNational Oceanic and Atmospheric Administration, The Canada Centre for InlandWaters (CCIW), and the United States Environmental Protection Agency (EPA),Region V. The study reported here represents the first serious attempt todescribe the winter circulation of Lake Huron.
The earliest study of Lake Huron currents was reported by Harrington (1895)Drift bottles were released from cargo ships traversing Lake Huron during thesummers of 1892 and 1893. By correlating release and recovery points of thedrift bottles, he deduced a prevailing cyclonic flow pattern of Lake Huronsurface water. noting especially a persistent southward flow along the entirelength of the lake's west coast. Water moving southward along this shore wasobserved to return northward along the lake's east coast, closing the circula-tion pattern to form essentially a single cyclonic cell. We shall return to
"GLERL Contribution No. 111.

Harrington's observations later in this report as the winter observationsreported here reveal some remarkable comparisons with this early effort todescribe currents.
Ayers et al. (1956) performed three multiship synoptic surveys of LakeHuron during the summer of 1954, observing on several Lake Huron cross sectionsdistributions of physical, chemical, and biological properties of the watermass. Using the observed water temperature distributions and a dynamic heightmethod developed for fresh water to compute geostrophic currents, they deter-mined current flows from the water density field for each survey. The currentpatterns determined were in general more complex than Harrington's results,although there were certain similarities in the reported cyclonic characterof the gross circulation.
In the summer of 1966, the Federal Water Pollution Control Administration(FWPCA) performed extensive measurements of currents in Lake Huron by mooringa large number of current meters at numerous open lake locations. Subsequentto this data collection effort, reorganization within the Federal governmentplaced this activity within the EPA. Changing program priorities preventedtimely analyses and reporting of these surveys. As part of the InternationalJoint Commission Upper Lakes Reference Study, GLERL undertook analyses of thesecurrent data and the results were reported by Sloss and Saylor (1975). Thiseffort was subject to many shortcomings because of inherent instrument limita-tions in the generation of current meters used in the surveys and the loss ofdocumentation in the interval between data collection and analysis. In spiteof these shortcomings, evidence of a general cyclonic lake circulation wasrevealed to support the nature of the gross summer current patterns reportedpreviously.
All of these previous investigative programs were performed during summerand fall, when the Lake Huron water mass is typically density stratified.Several current meter moorings were set along the west coast of the lake dur-ing winter 1965-66 by FWPCA, but the effort was unsatisfactory for determininglarge-scale characteristics of winter circulation (FWPCA, 1967). With thenear absence of any knowledge of winter currents in Lake Huron, the programdescribed in this report was initiated. The winter season is characterized byan almost isothermal water mass in Lake Huron, as is true of the other GreatLakes as well. Circulation during this long season of nearly homogeneouswater in the lake basins has received very little attention, primarily becauseof the difficulties and rigors of working during the severe weather associatedwith winter on the Great Lakes.
The bathymetry of Lake Huron is shown in Figure 1. Also shown in the fig-ure are locations of the 21 current meter moorings placed in the lake duringthe winter of 1974-75. Comparison of the bottom topography with station config-uration gives some idea of the plan of study, which we will discuss in more de-tail later in this report. The geology of the region played an important rolein shaping the Lake Huron Basin. The north shore of the lake, along the NorthChannel and northeastern shore of Georgian Bay, is on the edge of the Precam-brian Canadian Shield. The lake basin otherwise was carved out of the Paleozoic
2
ti I,
I

Figure 1. Location r-a;, showing currentmeter mooring sites and Lake Uuror:bathymetq. Only the 50 and 100 mcontours are shown as the bottom inthe deep northeastern Sasin is veryirregular, exceeding depths of 150m in over 30 percmt of its area.
SaulI Ste. Marie& LAKE HURON
rock province of the region (Hough, 1958). Resistant formations within thePaleozoic province may be correlated with the major bathymetric features ofthe lake bottom. Niagara Dolomite is the hard, erosion-resistant formationthat forms the Lake Huron shoreline for a distance of nearly 60 km east of theStraits of Mackinac. It continues southeastward to form the southern and south-western shores of the chain of islands separating Lake Huron from Georgian Bayand the Bruce Peninsula. Along the Michigan shore, resistant formation9 of theRogers City and Traverse Group formed lake shores and headlands from ThunderBay at Alpena, Mich., northward to Presque Isle, Mich. From Thunder Bay south-eastward, the underwater extensions of these resistant formations formed themost important bathymetric feature of the lake basin, a ridge that extends
, across the lake to Clark Point on the Canadian shoreline nearly 15 km southwestof Kincardine, Ont. This ridge is a very prominent feature of basin topographyand it rises to within 11 m of the lake surface near the middle of the lake atSix Fathom Bank. The northeastern face of the ridge is very steep as the lakebottom descends to depths exceeding 200 m, while the ridge itself is generally30 to 60 m deep. Southwest of the ridge the lake bottom descends more gradu-ally to depths of 70 to 100 m. Thus, the southeastward trending ridge sepa-rates the lake into two distinct basins.
3

I" this report we will present evidence that there is in fact a prevailingand dominant patter" of water current flow in Lake Huron during winter. season-al and monthly current roses of water transport will be presented, and the re-sponse of the lake to episodes of strong and steady wind Stress will be examined.The winter Studies make possible a description of the annual kinetic energy cycleof the Lake Huron water mass.
2. METHOD
Twenty-one current meter moorings were Set in Lake Huron during the latterhalf of Sovember 1974. Each mooring consisted of a string of current meterssuspended on a taut line beneath a subsurface float. Current meterS were plannedfor placement at uniform depths of 15, 25, and 50 m below the water surface andat ? m above the bottom; actual depths of the current meters deployed variedonly slightly from the planned depths. Elost of the moorings were Set in waterabout 50 m deep and included three current meters. Three moorings were Set inmuch deeper water and included the full complement ol four current meters. CUPrent meter depths on each mooring and the length of record obtained from eachmeter are summarized in Figure 2. Moorings numbered 114 and 117 were not re-covered in the spring of 1975, having been lost in regions of large surface wavestreSS during winter storms.
Twelve moorings were deployed by CCIW from the WV& Su~Uey Sh$ SimnOS.Current meterS on these moorings were a mix of Plessey model M021's and Geodynemodel 850’s. All of the current meters had a" integral temperature recorder.The remaining nine moorings were deployed from the EPA .&search Vessel RogerF. Simons and included a mix of .NF vector avcragin,0 current meters and Geodynemodel A-100's. Only the ANF meterS had a" integral temperature recorder onthese moorings. All of the winter moorings included an acoustic release justabove each mooring's sinker for recovery in the spring of 1975 and a groundline of several hundred meters of polypropelene for recovery with a grapnel inthe event of release failure.
No other measurements were attempted during the cour‘se of the winter cur-rent meter deployments. It was felt that existing meteorological stationsaround the perimeter of the lake were sufficient for adequate description ofwind and air temperature fields influencing Lake Huron. Many of the currentmeter stations were placed fairly close to shore (10 to 20 km) St a water depthof about 50 m. The placement of current meterS "ear the lake boundaries wasbased on considerations of the present knowledge of lake circulations duringthe density stratified seaSo" as all of the lakes have revealed that the strong-est and most persistent currents are observed within the first 20 km or there-abouts lakeward of the coaSts. Flow in the coastal strips in long-:erm averagesis essentially parallel with the bathymetric contours and during summer theseregions are characterized by strong, though variable, horizontal density grad-ients. I" retrospect, the placement of current meterS "ear the lake boundarieswas a good choice as the results presented herein will illustrate. Other areasof current meter concentrations included the mouth of Saginaw Bay and the south-eastern section of the ridge scpaxating the lake into two distinct basins.
4

0 United States CI Canadaz 19755 t N.‘gDz Jan. FCb. MM.
z 1975A&l,. MW
B3li “I” “I”I”5 g ..‘“,Z. Jan. Feb. Mar. Apr. m)r
I ~~~l~~l~~l~‘i”l”l”l
k-l06 0Ed
rlq
107 lg63
n0;
1
El10 lg
l5l
Llm
ElEl03 ElIs4
0Ed
110 q EIa
0111i’
0
q :112 Iif☺
I34
114 mooring not recovered117 mwring not recwcred
/ Firure 2. Smar:/ of data returned from each current meter deployed inLake Huron during wintm 1974-75.
1

3. RESULTS
3.1 The Character of the Wind Field
Great Lakes weather is characterized by high-pressure systems with associ-ated fair skies interrupted every 3 to 4 days by the passage of synoptic-scalelow-pressure storm systems. Air masses determining Great Lakes weather are ofPacific origin about 30 percent of the time during summer and 75 percent of thetime during winter. Gulf of Mexico air masses constitute 10 to 40 percent ofthe summer weather, but seldom penetrate as far north as the upper lakes inwinter (Phillips and McCulloch, 1972). Arctic air outbreaks during winter arecommon over the basin.
The Great Lakes act as a vast reservoir for the storage of heat energy andits subsequent exchange with the atmosphere. During fall and winter, intenseheat and momentum transfers occur and the Great Lakes' interaction with, andinfluence on, synoptic and mesoscale weather are greatest. Cold, dry Arctic airmoving across the warm water of the Lakes triggers numerous phenomena such asincreased cloudiness, convective precipitation, increased down-wind air tempera-ture, and intensification of low-pressure systems due to large inputs of heatand moisture.
Air mass modification occurs rapidly. Phillips (1972) found that duringcold air outbreaks over Lake Ontario more than half the total temperature modi-fication occurs over the first 3 km of water. The degree of modification is afunction of the initial air-water temperature difference and the length of timethe air is over the water. Phillips's results also show that, in the lowest 15q , the maximum modification usually does not exceed 55 percent of the total pos-sible modification. (Total modification is when the air warms to the same tem-perature as the water.) A mesoscale consequence of the addition of heat energyand moisture is the creation of a local system with cyclonic vorticity, a low-pressure trough that in terms of pressure translates into a deficit of up to 6mb over the lake area (Petterssen and Calabrese, 1959).
With upward heat flux, a high intensity of turbulence in the atmosphericboundary layer is produced by buoyancy. This increased vertical exchange ofmomentum during winter results in increased wind speeds in the surface layerand, presumably, a decrease of speed in the upper layers. It has been estab-lished that overwater wind speed is indeed a function of the difference betweenland air temperature and water temperature, which is a measure of the atmos-phere's stability. For example, with the water 8°C warmer than the air tempera-ture, Richards et al. (1966) found that the overwater wind speed over the lowerGreat Lakes was about twice that of the upwind land station. The mean monthlythermal stability values (T , - T ) using Alpena and Saginaw, Mich., air'temperatures and 15 m water"&per%%s from nearby moorings show the charac-teristic pattern (Fig. 3). Very unstable conditions exist from November throughMarch, implying that for this period the wind speeds over Lake Huron are prob-ably about twice those recorded at nearby land stations. During April the airbecomes increasingly warmer and hence is neutral to slightly stable, while con-ditions during May are extremely stable.
I 6

,
Figure 3. Comparison of air tempera-ture measurements at meteorologicaZstations near the west coast of LakeHuron and water temperatures at 1.5 mdepth at nearby current meter moorings during winter 1974-75.
12 -12 -
SAGINAW - 106 (SAGINAW - 106 (8-8-
- ALPENA - 109 (15 m)- ALPENA - 109 (15 m)
During April and May the cold water rapidly cools the air above by conduc-tion and a cold dome of extremely stable air extends 100 m to occasionally 1500m above the lake surface (Lyons, 1970). The conduction inversion that developsis generally less than 100 m deep and strengths of 25"C/lOO m have been reported(Bellaire, 1965). The cold air dome and inversion effectively shield the lakefrom surrounding atmospheric influences. Vertical exchange of momentum is dras-tically reduced with the results that cumulus clouds are absent over the waterdue to subsidence, thunderstorms are suppressed, and most important for thisstudy, wind speed and consequently waves and currents are dramatically reduced.This mesoscale anticyclone appears to be a separate feature of each of the GreatLakes (Strong, 1972) and is more pronounced over large, deep lakes like LakeHuron.
Wind data from five stations, Alpena and Saginaw, Mich., and Goderich,Bruce Ontario Hydro, and Southampton, Ont., were used to define the wind fieldover the lake. The mean monthly wind speeds for November 1974 through May1975 show that speeds at most stations peaked in January, dropped off slightlythrough April, then decreased markedly in May (Fig. 4). The decrease in Maywas due to the cold air over the lake, which spilled over the nearshore landarea, and the general decrease in the synoptic pressure g;-adients. Note thatSaginaw, farthest from the lake and probably out of the cold air influence,experienced a lesser speed decrease.
Wind run roses for the fiire recording stations, expressed as a percentageof the total wind flow past each anemometer during the analysis interval, areshown on all subsequent 15 m current maps. The wind roses are displayed accord-ing to meteorological convention, i.e., the direction is that from which the
7

- GODERICH. . . . . . . SOUTHAMPTON
Figure 4. Monthly mean wind speedsmeasured at five me teomlogicalstations about the perimeter ofLake Huron.
- - - ALPENAI / I
ON 0 J F M A MMONTH OF YEAR
wind blows. The prevailing directions, soufpwest through northwest, and meanscalar speeds for the period of about 4 m s , Indicate that the November 1974through May 1975 wind regime was near "normal." No attempt has been made toadjust the measured land winds to simulate overwater conditions. It must bekept in mind that instrument location and exposure can cause variations in themeasured winds and that overwater winds are dependent on thermal stability asdescribed by Richards et al. (1966) and others.
3.2 Water Temperature Structure
A comprehensive study describing water temperatures in the Great Lakes was
published by Millar (1952). who constructed monthly temperature charts for eachof the lakes during 1935 to 1941 using temperature data from ships' intakes.Data from the navigation months were extrapolated to obtain means for the win-ter months. Measurements of winter temperatures were limited to the surfacelayer using the airborne radiation thermometer (ART) technique (Richards et al.,1969). Satellites also provided infrared data. However, both methods are lim-ited to cloudless days and measure only surface temperature. Temperature dataobtained during the 1974-75 Lake Huron winter study provided the first'contin-uous large-scale synoptic picture of winter temperatures in Lake Huron.
During the period of study, the winter temperature structure was essen-tially isothermal at all stations (Fig. 5), indicating that mixing was takingplace throughout the water co1Um-1. Though the shallowest depth at which watertemperature measurements were taken was at 15 m, bathythermograph results fromLake Michigan show that the water temperature in winter is uniform from thesurface to at least 120 m (FWT'CA, 1967). There are periods during calm, coldconditions when a shallow reverse thermocline forms, but such stratificationis readily destroyed by wind and turbulence. A winter thermocline of unspeci-fied magnitude at a depth of about 180 m was observed in Lake Michigan, withindications of large-amplitude internal waves on the thermocline (FWPCA, 1967).
I
- ., . ..-?s-

Figure 5. Nonthly mean water tempera-tures from Lake Huon’s deep north-eastern basir (mooring 113), thenorthern part of the lake off Alpena,f&h. (moorino 1031, and the south-ern end (mom&g 101).
/
!
/
1!
’
MONTH OF YEAR
In Lake Huron a temperature difference of up to 0.8"C was observed between 25and 136 m depths in the deep northeastern basin in March, but it is doubtfulthat this weak temperature gradient would result in significant internal wavedevelopment.
Some spatial characteristics of the observed Lake Huron winter temperaturefield are shown in Figure 5. The nearshore areas (moorings 101 and 109) cooledrapidly, with the minimum temperature of 0.2"C first occurring in middle-to-lateFebruary, while the northeastern basin did not reach its minimum of 1.5"C untilearly April. The monthly cooling rate in the northern basin was about l°C permonth from December through March, while the rate was 1.6"C per month in thesouthern basin. The largest horizontal temperature gradient was in February,when the nearshore areas had cooled to near zero and the mid-lake region wasstill about 3°C. It was also the month with the coldest air temperatures andmaximum ice cover. Figure 6 shows the isotherm pattern for the upper 15 m.Lack of data in the eastern part of the lake required some suppositions (givenas dashed lines). Other winter months showed basically the same isotherm pat-tern, although the horizontal gradient was less, and were similar to ART results(Richards et al., 1969).
The winter thermal structure is established and maintained through theinteraction of several processes. The coldest air temperatures are associatedwith westerly and northwesterly winds and so the greatest heat flux takes place
within the first 10-20 km lakeward from the west shore. When the shallow near-shore water cools to near zero, ice formation retards wind generated mixing,prevents conductive heat flux with the air, and reduces radiational heating.A winter thermal bar, a sharply defined boundary between the near-zero inshorewater and 2°C offshore water, was observed about 16 km offshore in Lake Michiganfrom bathythermograph surveys (FWf'CA, 1967). Although bathythermograph surveys
9

Figure 6. MonthZy mean water tempera-tures ("C) at 15 m depth duringFebruary 1975 in Lake Huron. Dis-tributions in the eastern parts ofthe lake are assumed, but ice waspresent aZong the east coast, in-dicating the pre&znce of near O'Cwat&r.
were not performed during the Lake Huron winter study, the monthly temperaturesfrom inshore and midlake locations and the extent of the ice formation suggeststhat a winter thermal bar probably exists in Lake Huron also, at least aroundthe northern basin. The sharpness of the thermal discontinuity and its effec-tiveness in inhibiting mixing between the two water masses needs further clari-fication.
The shallower southern basin cools most rapidly through conduction andconvection and the mid-lake ridge inhibits subsurface water movement betweenthe two basins. A comparison of temperatures to the north, south, and on theridge (moorings 116, 119, and 118, respectively, in Fig. 7) shows that thenorthern basin was cooler until mid-January and thereafter warmer through April.The temperature difference reached a maximum of 1.6"C in March. During Januaryand February the ridge temperature (at mooring 118) was colder than eitherbasin, which is consistent with previous data observed in this area. Individ-ual ART surveys in winter and spring showed the isotherms following the generalisobaths of the ridge; transparency measurements showed a tongue of mire turbidwater extending northwestward into the lake (Ayers et al., 1956), and satelliteimagery showed turbid plumes meandering lakeward in the ridge area, with thewater over the ridge warmer than either basin during the summer warming period(Strong, 1974). Apparently a part of the northward flow along the easternshore is deflected lakeward by the ridge, resulting in more turbid water overthe ridge and cooler or warmer temperatures, depending on the season.
10
tFttFdthdca10

654 1
I I I / I
Figure 7. Water tempermtrc"e distri-bution across the mid-Zake ridge.!horir.~ 116 was just nom% of therid,-e zn the southem,;zrt ofdeep -mrtheastern basrz,
_ ,Glemoomn~
118 :';s on the ridge, cd .vooringlZ9 L.ES just south o,+" the ridgein tk southern &sir,.
ID F
Mb-H OF YEiF!n
3.3 Seasonal and Monthly Current Patterns
Currents observed during the winter surveys are summarized as monthly andseasonal current roses in Appendix A.tion of current run,
The current roses present the distribu-expressed as a percentage of the total water transport
past each current meter suspended in the water column, in a fashion analogousto our presentation of wind statistics. The current roses are draw" to showthe percentage of flow past each meter toward each octant in the oceanographicpreference, while the wind run roses retain their usual presentation in thedirection from which the wind is blowing. There are, of course, many alterna-tive techniques for the presentation of flow statistics. The choice made herehas the advantage that it is easily interpreted visuarly to give patterns ofdominant water transport in addition to some indication of the variability ofcurrent flow. The disadvantage of this sort of presentation is the absence ofa suitable display of the lake-scale distribution of current speeds.representative current speeds for lake currents,
To display
of resultant current vectors.we will include several charts
3.3.1 November 1974
The winter current studies started in November and current patterns pre-sented represent only the latter third of the month.current and wind roses for this period.
Figures A.la-d, show theEach level of observation is show" on
a separate chart and it should be noted that several current meters used at the25 m level were just 2 m off the bottom (those at the mouth of Saginaw Bay and

at the extreme southern end of the lake), as were many of the current metersshown at the 50 m level about the perimeter of the lake and on the mid-lakeridge. I" general, current meters at the 25 and 50 m levels showed flow charac-teristics very similar to shallower current meters on the same mooring for theduration of the winter season. Therefore, current meters near the bottom at 25and 50 m were usually still very much within the upper level flow regime duringwinter in Lake Huron and are presented as such. Bottom currents at 2 m off thelake floor are shown only in much deeper water.
November winds prevailed from the southwest quadrant at meteorologicalstations in the southern half of the Lake Huron basin, while Alpena recorded ahigher percentage of wind from the north-northwest. Lake water temperatureswere nearly uniform throughout the upper SO m, averaging a little less than 6°Cin the northern half of the lake and just over 7°C in the southern half of thelake. Along the Michigan coast a dominant southward flow characterized thecirculation. This steady southward flow ran parallel to the bathymetry andwas present from surface to bottom with unchanging steadiness. Not all of thecurrent meter moorings were deployed in the eastern part of the lake, but ra-porting stations showed a return northward flow along the east coast closingthe circulation to form one large cyclooic cell. The pattern of flow wasespecially steady and persistent about the perimeter of the lake, with onlymooring 113 in the center of Lake Huron's northern reaches showing much varia-bility. Here the resultant flow was northward at all levels. East-southeast-ward flow at the 50 m level at mooring 112 persisted for the entire winter sea-
son. Mooring 112 was placed on a ridge-like structure protruding eastward intothe lake basin from the vicinity of Cove Island. The lake bottom is deeperboth north and south of the station, and the 50 m level flow was nearly paral-lel with the local bathymetry.
The coherent pattern of lake-scale circulation illuminated by the Novem-ber data is unusual in comparison with earlier reported surveys of currents i*Lake Huron during summer (cf., Sloss and Saylor, 1975). The consistent patternof lake-scale flow, as observed especially along the western coast of the lake,is attributed to the improved instrumentation used in the surveys and not toany fundamental changes in the character of Lake Huron currents.
3.3.2 December 1974
December winds were predominantly southwesterly over the entire lake basin(Fig. A.2a). Water temperature was nearly isothermal throughout the lake,averaging just over 4°C. Currents observed during December are shown in FiguresA.2a-d. Southward flow along the west coast of Lake Huron south of Alpena con-tinued to be the dominant feature of lake circulation. Return flow along theeastern shore was not as persistent as observed in November, although the east-ern shore current meters and'most of the mid-lake stations exhibited a generalnortherly drift. Mooring 118 on the mid-lake ridge showed northwesterly flowat both 25 and 50 m, while at mooring 119 south of the ridge the flow below 50m was northerly. North of the ridge the current meters at 50 m and near thebottom at mooring 116 exb.ibited southeasterly flow, a pattern that persistedthroughout the winter.
12

At the mouth of Saginaw Bay, current meters at 15 and 25 m depth indicateda clockwise flow pattern. This is consistent with the work of Danek and Saylor(1976). who found that a clockwise eddy occupied the outer reaches of the bayduring southwest wind conditions, with..the core of southerly flow along thewest coast of Lake Huron pushed lakeward. On the other hand, northeasterlywind caused a part of the Lake Huron flow to sweep in a counterclockwise loopthrough the outer reaches of the bay, exiting the bay in eastward flow justnorth of the Michigan thumb.
3.3.3 January 1975
Southwesterly wind flow in January (Fig. A.3a) was similar to the winddistribution observed in December, although the mean wind speed was greater,as January recorded the highest mean wind speed during the 1974-75 winter sea-son. Cooling of the lake's water mass resulted in nearshore water temperaturesaveraging about Z"C, while over the deep northeastern basin,water temperatureaveraged a little less than 4°C. Current flow during the month is summarizedin Figures A.3a-d. The circulation was essentially unchanged from December.Southward flow along the east coast of Lake Huron continued to be the dominantfeature in the lake. Flow along the mid-lake ridge retained the characteristicsobserved the previous month, with northwestward movement on the ridge itselfand a southeastward return in deeper water to the north along the southern mar-gin of the deep northeastern basin. The clockwise eddy at the mouth of SaginawBay intensified from the December pattern, and the southerly coastal flow mi-grated lakeward far enough for mooring 106 to be influenced by this localizedcell of circulation.
3.3.4 February 1975
In February, winds shifted to a more westerly direction with more episodesof wind with a northerly component. Continued cooling of lake water near thecoasts caused water at nearly O'C to encircle a warmer core of denser watercentered over the deep northeastern lake basin. Currents, shown in Figures A.4a-d, were strongly cyclonic. Currents along the Michigan coast were almostexclusively southward, and northward return flow along the Ontario coast wasvery steady in the southern basin. Flow through the outer reaches of SaginawBay was in one large counterclockwise loop.
We note that with the westerly wind of February, flow at mooring 118 onthe mid-lake ridge lost its strong northwestward character, changing to south-eastward flow at 25 m and bimodal at 50 m. The flow remained nearly parallelwith the bathymetry, though, as it did throughout the season. North of theridge, mooring 116 continued to record southeastward flow at deeper levels inthe northeastern basin of the lake. South of the ridge, southeastward flow at
. 25 m at mooring 119 was accompanied by more northward flow components deeper
j;
in the water column.

3.3.5 March 1975
The water temperature patterns of February continued into March, as cold,near 0°C water surrounded slightly warmer water centered over the deep north-eastern basin. This warmer water had cooled somewhat from February, however,and averaged about 2°C for the month. Wind over the Lake Huron basin prevailedfrom the northwesterly quadrant (Fig. A.Sa). Currents observed during Marchare shown in Figures A.Sa-d. Flow throughout the lake basin was very stronglycyclonic, almost exclusively southward along the west shore, and northward alongthe southeast shore. Flow toward the southeast along the mid-lake ridge at 50m (mooring 118) conformed with bathymetric constraints and was similar to theFebruary currents. Southeastward flow at mooring 112 at 50 m still persistedas it had all winter, while mooring 110 at 50 m was now dominantly southeast-ward also.
3.3.6 April 1975
April winds were northwesterly, very similar to the wind distribution ob-served in March. Currents during April (Figs. A.6a-d) were very similar tothose during March, characterized by very steady southward flow along the westshore of the lake and northward return flow along the east shore south of ClarkPoint. A steady counterclockwise flushing of Lake Huron water through theouter reaches of Saginaw Bay was also prominent. The start of spring warmingnear the coasts of the lake established an almost isothermal lake during April,with monthly averaged water temperatures varying no more than 1°C throughoutthe basin.
3.3.7 May 1975
The Canadian current meters were removed in early May, while the UnitedStates meters were removed in late May. Therefore only the west shore of thelake is covered in Figures A.7a-c, but data from these meters show a remark-able change in the character of Lake Huron current flow. As noted earlier,intense atmospheric stability over the cold lake surface in May was associatedwith reduced wind speeds at stations along the perimeter of the lake. Thissheltering of the lake surface from strong wind stress resulted in a catas-trophic decrease in the kinetic energy of the water mass and, inferred from theobserved current patterns, the loss of an organized pattern of current flow inthe lake. The southward flow along the lake's west coast, as observed in allearlier months, was absent although a counterclockwise flow through the outerparts of Saginaw Bay was still apparent. The warming of nearshore water thatstarted in April continued through May so that at the time of current meterremoval, shorebound water as WLIPI as 8” to 10°C had reached offshore to the 15m level at several of the current meter stations. The neat-shore warming andconcomitant establishment of significant horizontal temperature gradients doesnot in itself, however, prove the existence of characteristic circulation pat-terns in the absence of significant wind stress.
14

3.3.8 Winter Circulation
Wind and current roses for the entire winter season are shown in FiguresA.8a-d. Only those meters operating a significant part of the season areincluded. The patterns show that there was clearly a dominant, or character-istic, current flow during the 1974-75 winter season in Lake Huron. Southwardflow along the lake's west coast was very steady and extended from Alpena tothe southernmost end of the lake. The mouth of Saginaw Bay exhibited two pat-terns of circulation, either a counterclockwise loop of Lake Huron water flow-ing through the outer bay during northerly wind, OK a clockwise eddy in theouter bay during southwesterly wind. Return northward flow along the eastcoast of the lake was not as clearly defined except in the region south ofClark Point. Unfortunately, many of the current meters in the important coastalzone in the northeastern part of the lake failed to return useable currentrecords.
To indicate current speeds associated with the winter circulation, resul-tant current vectors for the season are shown in Figure 8. The highest cur-rent speeds wet-e observed close to the coast, with speeds decreasing towardthe center of the basin. The strongest resultant currents were associatedwith the southward flow along the lake's west coast, with the remainder of thelake exhibiting a less intense northerly drift forming one large cyclonic cellof circulation. Flow along the mid-lake ridge was usually parallel with thebathymetry, either northwesterly or southeasterly, although the vector resul-tant current was northward. Just north of the ridge, currents at deeper levelsat mooring 116 were southeasterly along the southern flank of the deep north-eastern lake basin.
Mooring 111 between Georgian Bay and Lake Huron has not been discussed inconnection with lake circulation as it was placed in a north-to-south trendingchannel separated from the lake by intervening shallower depths. The resultantcurrent vector for the season indicates an inflow of water to Georgian Bay atthe 25 m level, however, which was probably balanced by a return flow to LakeHuron at deeper depths as reported during summer (Sloss and Saylor, 1975).The 50 m level at mooring 109 was also poorly exposed and probably exhibitedlocal effects not closely tuned to whole lake patterns because of the shoalwater that protruded eastward in the lake just north of North Point at Alpena.(Depths shallower that 10 m occur south-southeast of this mooring.)
To get an idea of the volume of water transported about the lake by theresultant circulation, we computed the south-southeastward volume transport
_^^ ..^,across the section of the lake between moorings lU3 and IUQ, lust east ofSaginaw Bay. The lake bottom between these two stations is flat, with an aver-age depth of about 50 m. We know the velocity distribution in the upper 25 mand could reasonably assume a conservative velocity profile as linearly decreas-ing from the 25 m level to no flow at the lake bottom. The resulting volumeflux was about 40,000 m3/s, or roughly eight times the long-term average dis-charge of the St. Clair RiveS. Throughout the survey interval (about 180 days),this meant that about 625 km of water was transported southward through thesection. This is nearly one-fifth of the total water volume of Lake Huron(3,500 km3). Most of this water must have returned northward in the easternparts of the lake basin. This implies that the bulk of the lake's water mass
15

s
““;\
>#%@“a *\ $: &$Q
Ey5 =& p- 1Y
A /.,#! **Y= m 2zLHarbor
ia- ;,;;;;g ;yjikik;
Figure 8. vector resultant currentflows in Lake Huron during winter1974-75. The depth Cm) of eachcurrent velocity measurement isshown with the current vector.
is certainly in a well-mixed condition. Short-term transports through thesection, both southward and northward, were of course much greater, accelerat-ing the mixing of lake water.
3.4 Episode Analysis
Circulation patterns depicted by the seasonal and monthly current maps arethe integrated result of all the wind stress fluctuations and accompanying cur-rents that occurred during that particular time period. It is also instructive
to examine the current response and circulation patterns that develop duringshort-term episodes of steady wind stress.
Synoptic weather systems pass over the Great Lakes region rather quickly;therefore times when winds are directionally steady are usually limited toseveral days duration. The episodes discussed in the following sections wereselected on the basis of wind data, primarily from Saginaw and Alpena. All
periods of 3 days or longer with nearly steady wind direction and mean wind
16

L *
-1speeds of 5 m s or greater are presented. The wind and current data are con-current; lag time to allow for current response was not applied because theperiods of steady wind stress did not always exactly coincide between stationsand current response varies with several factors such as location and depth.This does not present a serious problem since there are normally generation,steady state, and decay epochs associated with significant storms so that anyresidual currents from a previous regime are soon overpowered by currents gen-erated during the selected episode. Data are presented in the same form as inthe previous section and are contained in Appendix B.
3.4.1 20-22 November 1974
A deepening low-pressure center moved acros.s the northern states andpassed over Lake Huron on 20 November. Strong cyclonic circulation over thenortheast United States continued as the center migrated across New York onthe 21st. Winds over the lakes were westerly to northerly during the 3-dayperiod (20132 November), with mean speeds along the perimeter of Lake Huron of5toJms . Not all the current meters had been deployed, but large-scalecyclonic circulation in the lake with a counterclockwise loop through the outerportion of Saginaw Bay is evident in charts (Figs. B.la-d) for that date. Thecurrent penetrates to at least 50 m with little change in direction except atmooring 112, where the current is almost exclusively northwesterly at 15 m,northerly at 25 m, and easterly at 50 m. As pointed out in the discussion ofthe monthly currents, mooring 112 was positioned on a ridge and the 50 m depthflow paralleled the bathymetry during the entire winter. Although the shallowmeters on moorings 110 and 112 failed shortly after this episode, the currentsare indicative of what can be expected during the rest of the winter when thereis a northwest wind.
3.4.2 30 November-2 December 1974
Northeasterly winds 5 to 8 m s-1
across Lake Huron 30 November through 2December resulted from a deep low-pressure system that developed over the south-western states and migrated across Tennessee and Virginia. Currents duringthese 3 days (Figs. B.2a-d) showed a clockwise gyre in the southern part of thelake. The counterclockwise looping through the outer region of Saginaw Bay wasconsistent with patterns observed by Danek and Saylor (1976). There was consid-erable shear in the bay. Mooring 108 showed the water moving into the bay atthe 15 m level with the wind stress; however, the outflow speed at 25 m wasabout twice that df the inflow and caused a net eastward flow past the site.The current speed at mooring 105 was about 60 percent higher at the 25 m depth
i than at 15 m. Flow at the 15 m depth at mooring 109 was northwesterly, a typi-cal response to northeast winds and not unexpected because of the shoal watersouth and east of the mooring. Mooring 104 showed a similar response, possiblydue to the shape of the shoreline. Northwesterly flow on the shallower waterof the mid-lake ridge (mooring 118) was just exactly opposite to the flow Of
water in the deeper water north and south of the ridge, a pattern that persistedfor much of the winter due to the local bathymetry.
17

3.4.3 26-29 December 1974
A week of west to southwest wind across Lake Huron dominated the weatherin late December as the eastern half of the United States and Canada were underthe influence of a massive high-pressure system centered over the southeasternstates. Figures B.3a-d show the general cyclonic flow pattern that existed inLake Huron during the last 4 days of the week-long episode when the currentpatterns were well established. The currents were very similar to those ob-served for the entire month of December, when southwesterly winds prevailed.Southward flow along the lake's west coast was not quite as sharply delineatedas it was during more westerly and northwesterly wind stresses, and a clock-wise pattern of current flow existed in the mouth of Saginaw Bay. Northwest-ward flow along the crest of the mid-lake ridge was again evident.
3.4.4 9-11 .lzlnuary 1975
A deep trough extending from northwest Canada to Texas developed over thePlains States. The center moved northeastward over the Midwest and the GreatLakes Basin on 11 Januafy and continued into Canada. The strong cyclonic airflow resulted in 7 m s winds from the southeast over the basin during the 3days. Lake circulation was essentially anticyclonic, a rare event in LakeHuron since southeast winds are generally less intense with shorter (c 2 days)duration (Figs. B.4a-d). The pattern of flow across the mid-lake ridge as notedin the northeasterly wind episode was repeated, with northwesterly currentsalong the ridge and a southeasterly return in deeper water north and south ofthe ridge. Clockwise water transport in the mouth of Saginaw Bay was especiallyclear in the currents at 25 m depth.
This episode does demonstrate that given the right combination of windspeed, direction, and duration, the characteristic cyclonic lake circulationcan be reversed.
3.4.5 11-14 January 1975
The deep low continued into Canada. Winds remained about 8 m s-1
, butswitched to the southwest as Lake Huron came under the influence of the back-side of the low. The current pattern (Figs. B.Sa-d) was similar to the justconcluded episode, but several meters, e.g., 102, 104, were showing bidirec-iional characteristics, indicating that the current was adjusting to the newwind regime. This adjustment was not immediate, however, and showed that con-siderable time (on the order of a day OK two) is required for the lake to ad-just its current flow to be in harmony with the newly applied wind stress ifthis stress does not reinforce an already existing pattern of flow. A longerepisode of southwesterly wind presented earlier showed a substantially differ-ent circulation for this wind direction.
3.4.6 9-15 February 1975
During the first 3 days of ti:e O-15 February episode, anticyclonic circu-lation prevailed over the Great L;ke Basin from a weak high. On the 12th, a
I
18

weak trough over the Lakes area extended to the Gulf of Mexico. Flat pressuregradients prevailed during the remainder of the period. This episode wasselected to determine the effect of ice.cover on current patterns. Ice, of70- to 90-percent concentration, extending from Alpena to Port Huron and east-ward to moorings 103 and 101, was observed on 12 February. Winds were west tonorthwest during the period so cyclonic lake circulation would be expected.The current rose map does show the anticipated cyclonic flow (Figs. B.6a-d);however, the four moorings at the head of Saginaw Bay were less directionalthan when the lake was ice free and current speeds were much less.
3.4.7 26 February-6 March 1975
The Great Lakes were under the influence of a low centered in easternCanada during 26-29 February, followed by another closed low north of LakeHuron on the 1st of March. This low moved over Quebec, while yet another lowtravelled up the East Coast, causing cyclonic circulation over the East. LakeHuron therefore experiepfed generally westerly winds for the g-day period withmean speeds up to 9 m s at Saginaw. The lake circulation (Figs. B.7a-d) wasagain cyclonic, with little variation with depth except in Saginaw Bay at moor-ing 108 where the 15 m current was eastward and the 25 m current more westward.Also the 50 m currents at 109 were northwesterly, opposite to that at 15 m, dueto the local bathymetry. Temperatures were between 0.0" and 0.8"C in the west-ern half of the lake, and 1.6' and 2.8"C in the eastern half.
3.4.8 1-8 April 1975
A cold front passed over Lake Huron on 1 April and a deep upper troughover the West spawned a low-pressure center, which passed over the lower GreatLakes on the 3rd. This system moved over New England, moved offshore, andfilled over the next 5 days. The resulting northwest winds over Lake Huronproduced the familiar cyclonic circulation pattern (Figs. B.8a-d). Tempera-tures illustrated little spatial variation. The minimum was 0.3"C at mooring102 and the maximum was 1.8OC at mooring 113 in the deep northern basin. CUPrent flow during this important episode was especially steady and gave an ex-traordinary picture of lake circulation during northwest wind in those areasof the lake covered with functioning current meters. An identical picture ofcirculation, and some idea of its persistence is afforded by the current rosesprepared for a slightly different interval of time, 3-13 April, shown inFigures B.9a-d.
3.4.9 3-7 May 1975
This episode was selected to determine what circulation pattern existsduring light, variable wind conditions. The atmospheric pressure gradientswere small during most of the period, interrupted by two weak lows moving overLake Huron on the 4th and 6th. The r_egulting winds for the 5-day period werenorth to northeasterly at about 3 m s . A conduction inversion, discussed ina previous section, undoubtedly formed over the lake, reducing the overwater
19

wind stress. The Canadian moorings had been retrieved so only currents in thewestern part of the lake were measured. The current pattern (Figs. B.lOa-c)was somewhat disorganized. Water flowed through the outer reaches of SaginawBay in one large counterclockwise loop as is characteristic of the bay mouthduring episodes of northeast wind. Current directions at 15 m were north andnorthwest off Alpena (mooring 109) and Harbor Beach (mooring 102), respectively,which must have been in response to the northeasterly winds, as seen on otheroccasions, and the bathymetry, even though the winds were light.
The circulation pattern was confused, not unlike the monthly histograms,which showed considerable transport variability. As pointed out earlier, Elaywas a somewhat unique month; wind speeds decreased considerably around thelake, and the conduction inversion that was present a large percentage of thetime effectively decoupled the water from direct wind stress; hence currentswere very weak and directionally variable.
3.5 Effects of Ice Cover
The 1974-75 winter season saw the first successful attempt at year-roundnavigation on the Great Lakes due in part to less than normal ice cover. Airtemperatures well above normal through early January delayed significant icegrowth. A month of cold temperatures beginning in mid-January produced rapidice growth with Lake Huron's maximum ice cover of 45 percent occurring in mid-February (Leshkevich, 1976). Warm temperatures during the last half of Februarysignificantly decreased the amount of ice and, although March and April airtemperatures were well below normal, the number of freezing degree-days wasnot sufficient to redevelop significant ice cover on the lake. The percentagesof lake surface that can be expected to be ice covered during a mild, normal,and severe winter are about 40, 60, and 80 percent, respectively, for LakeHuron (Randy, 1969).
In an effort to describe qualitatively the effect of ice cover on CirCu-
lation patterns in Lake Huron, currents during the 9-15 February 1975 maximumice period were compared with currents of the 26 February-6 March 1975 period,which had similar wind conditions but little ice cover. Results from SideLooking Airborne Radar (SLAR) surveys on 8, 10-13, and 16 February revealed thebasic features of ice coverage at its maximum development. Figure 9 shows aSLAR image on 12 February 1976. Winds during the ice period were light tomoderate westerly with the exception of light easterly winds on the 11th and15th. A 10 to 20 km-wide band of close pack ice (70-90 percent ice cover)along the western shore of the lake persisted through the period, while thesouthern portion was almost totally covered. The eastern shore showed a 5km-wide ice pack along the shore up to at least Clark Point. Both shores re-sponded somewhat to winds and cold temperatures. The western band moved off-
' shore somewhat during stronger westerly winds with new ice forming behind it,while the eastern band became more compact. The opposite occurred during east-erly winds. Even though the wind was westerly during most of the period, noevidence of ice moving across the lake was seen. Only shifting of the outerboundary and the degree of compactness was noted. The cyclonic character ofthe circulation was evidenced by strong shear zones and lakeward extention of
20

I7igure 9. Side-Looking Airborne Radarimage showing the ice cover on westernLake Huron on 12 February 1975. Whiteareas indicate edges and cracks in theice.
ice near Alpena and the head of Saginaw Bay and by the northward movement ofpack ice along the Ontario shore. A combination of warm air temperatures andwind and current activity broke up the ice into smaller floes, so that by 16February the amount of ice decreased and only a 5 to 10 km band of floe iceremained on the western half of Lake Huron.
Figures 10 and 11 show the resultant speed and direction for each meterand the average ice cover for the two episodes (Leshkevich, 1976). Currentsdisplayed in histogram form for the two periods are included in Appendix B.Current direction and magnitude appeared unaffected in most parts of the lakeexcept off the Saginaw Bay area, whe e the resultant speeds were near zeroduring the ice period and 5-17 cm s
-5at the end of February. Particularly
obvious was the greatly reduced speed at mooring 104 off Point aux Barques.This particular site was in an area gf intense currents.at 15 and 25 m we~l2.3 and 0.5 cm s
The resultant speeds
10.3 and 16.7 cm srespectively, during ice cover and
during the comparison period. Offshore currents north(mooring 107) and south (mooring 102) of Saginaw Bay showed little change inspeed or direction. A decrease'in mean monthly kinetic energy of the lake inFebruary was attributable in part to ice growth.
The only empirical study of currents in a large lake with partial icecover that is known to the authors was reported by Palmer and Izatt (1972).
21

F1
Saul, Sk Marie LAKE H”RON
‘OYJ 0, OQ”
7
“,q b -=“,\ I’Alpen.Ml I I I01 491625cm 9-1 f& IY
3 II
cl5
*‘>.” w4 -g
“BQ4* POl”t““,,J .,, 15 722% \ ;,/ Clark
Bay CllY -I r2~~~Y~;~ Hrj!g;
Figure 10. Vector resultant currentflows in Lake Huron during 9-15February 1975. The average icecover during the interval is shownby the broken line.
Figure 11. Vector resultant currentflows in Lake Huron during 26 Feb-ruary-6 March 1975. The averageice cover during the interval isshown by the broken line.
22
i
1
I
11
<
I
111<;<

Their results from one current meter 0.8 km offshore at Nanticoke, Lake Erie,indicate that during the ice formation period, with ice extending 0.5 kmbeyond the meter site, the currents did not vary appreciably from those whenthe lake was ice free. When the ice cover extended 1.5 !a beyond the mooringlocation, currents were weak, with long periods of no movement. Also no sig-nificant energy was detected at the free oscillation periods as there was dur-ing the ice formation period. Palmer and Izatt gave no information on theamount of ice cover on the whole lake so that the surface area available fordirect wind stress forcing is not known. Arctic ice investigations have con-centrated on determining the momentum exchange from the atmosphere through theice into the oceanic boundary layer and ice-water stress. Sheng and Lick (1973)calculated numerically the steady-state wind-driven currents in Lake Erie whenthe eastern third or western third of the lake was ice covered and comparedthese results with those calculated for ice-free conditions. The comparisonbasically showed that currents under the ice were weak except near the iceboundary, where velocities were comparable to ice-free conditions.
The presented evidence indicates that ice on the western portion of LakeHuron does result in dramatic current speed decreases in areas, such as thehead of Saginaw Bay, where the meters are far enough removed from the openwater to prevent significant lateral momentum transfer. There may be little orno change in the observed current velocity north and south of the Bay becausethe meters were not always within the ice-cover area or were very near the iceboundary. Distribution of ice cover is controlled by the general cyclonic lakecirculation, forcing it southward along the western side and northward alongthe east coast. Ice forced into midlake, as occurs north of Point Clark andthe Alpena area, is melted by the higher temperature of the water.
The 1974-75 winter season was mild, with little ice cover, and we can only
speculate on what effects greater amounts of ice would have on the current pat-tern in Lake Huron. Obviously as the ice cover increases, the area upon whichwind stress can act decreases and the kinetic energy of the lake will decrease.As the ice cover approaches the severe classification as in 1967 (80 percentcoverage), the currents would probably be greatly diminished.
3.6 The Annual Cycle of the Variation of Current Speeds with Depth
There have been few studies of currents and concomitant water temperaturedistributions during winter in the Great Lakes. It is therefore instructive tolook at the distribution of current speeds throughout the water column +s winterprogresses and to compare this distribution with what is known during other sea-
sons of the year. Figure 12 presents mean monthly current speeds observed atall moorings at the four levels of measurement in the water column. Mean cur-rent speeds in November exhibited considerable variation with depth, with speedshighest at the 15 m level and decreasing monotonically with depth. The Novem-ber currents were associated with the last vestiges of summer density stratifi-cation. December mean currents decreased from November values at the 15 and25 m levels and increased at 50 m and near the bottom. There were no signifi-cant differences in current speeds in the upper 50 m of the water column inDecember, establishing a pattern of flow variation with depth that continuedfor the remainder of the winter months in nearly isothermal water.
23

$̂8 - -‘.E .A’E6B2w! ;..’-#. /* \.gf ‘LJ 1
&-1- 1 5 m-225m-.-50m-1Zmoffbottom j
Figure 12. Monthly mean currentqeeds at the four 7,evels of meas-urement in Lake Huron during winter1374-75, Scalar mean speeds wereaveraged for all opera&g currentmeters at each depth.
ON 0I I I J
h&m LF YE2A M
Mean monthly wind speeds at five stations scattered about the perimeterof Lake Huron were shown in Figure 4. The average winds were nearly the sameat all stations during November and December, peaked at all stations in January,and then exhibited a rather uniform decrease through the winter and into April.The station most representative of overwater wind speed was the Bruce OntarioHydro installation at Douglas Point, Ont., as its location on the shorelinegives good exposure to the prevailing westerly winds. Wind speeds measuredhere were, as expected, greater than those recorded at the other four stations,which varied in exposure and were not situated as close to the lake shore. Allstations showed markedly decreased wind speeds in May, with the Bruce stationon the lake shore showing the largest relative decrease.
Mean current speeds at the three levels of measurement in the upper 50 mof the water column showed only insignificant differences during the months ofDecember 1974 through April 1975, when the water mass of Lake Huron was nearlyhomogeneous. Current speeds near the bottom were less, but followed closelythe trend of speed increase or decrease in the near surface water. The slack-ening of current speeds during February and March 1975 was greater than wouldbe predicted by simple relationships with the observed wind speeds and wasprobably caused by ice cover during these months. Since a majority of the cur-rent meters were placed within 20 km of the coast, the mean current speeds areweighted toward what is occurring in the coastal zone. But this area is wherethe ice is. A rapid decrease in current speeds at all levels in May, as thenearshore waters were rapidly warming, was caused by lessening wind stress onthe lake surface, due in part to the intense atmospheric stability cover thelake surface.
For the ice-free, warm weather months of April through October, a compara-tively large quantity of current and water temperature data has been collectedin the Great Lakes. Figure 13 (Bennett and Saylor, 1974) shows a typical re-suit of current studies during this season of the year, with mean current speeds
24
f
ie4'ctsilmts;
t:"I

25 [LAKE ONTARIORMS CURRENT SPEED AT
20;10.15.30.&50 m DEPTH )I”\, ;
10; \I ’
Figure 13. Lake-wide average ofthe .%W current speed at fourdepths observed in Lake titarioduring 1972 (from Bennett andSaylor, 1974).
0 ,MAY JUN JUL AUG SEP OCT
1972
increasing steadily from small values in May and with considerable verticalgradients of horizontal current velocity from higher speeds near the surfaceand decreasing with depth. PM values of current speed are presented in thisfigure and the trend of increasing kinetic energy at all depths throughout theice-free season is clear. The general increase in energy in Lake Ontario wasfound to be associated with a similar trend in the surface wind stress overthe lake, a trend characteristic of the Great Lakes region. Peak energy levelsin late June, early August, and early October were related to three intensestorms. Studies in the other Great Lakes have shown similar trends of seasonalkinetic energy increase.
Comparisons of power spectra computed from flow data collected during theice-free months indicate that the seasonal increase in kinetic energy is gen-eral across all frequencies and is especially pronounced at near-inertial,fre-quencies, when the lakes are strongly density stratified. While these seasonalchanges correspond with increasing momentum flux from the surface wind stress,the greater growth at near-inertial frequencies represents the fact that, withstratification, the dominant response of the lake to forcing is in the form ofinertia-gravitational internal waves. The internal wave activity causes themean current speeds to be greater than would be observed in the absence ofstratification and accentuates the vertical gradient of horizontal velocity.
It is apparent that we observe an annual cycle in the lakewide distribu-tion of kinetic energy. Starting from very low current speeds in late spring,which result from high stability in the overlake boundary layer because of warm
25

air over a cold lake surface, average current speeds increase in a rathersteady fashion at all water depths in response to a similar SeaSonal trend inapplied wind stress. Horizontal current speeds decrease rapidly with depth,with vertical gradients in harmony with the spreading and thickening densitydiscontinuities in a stably Stratified water ma** as Summer progresses. Withvery stable stratification, kinetic energy grows rapidly in favored "ear-iner-tial frequencies because of the dominant response of the lake to forcing in theform of inertio-gravitational internal waves. With the breakup of stratifica-tion in late fall, kinetic energy is evenly distributed in at least the UpPer50 m of the water column in Lake Huron and rises or falls in close agreementwith the winter-long trend of applied wind stress. Volume transports arelarge during winter because of strong wind Stress and the deep penetration andstability of the mea" current flow patterns. Currents in very deep water areSignificant during winter and respond to increases or decreases in wind stressin the *ame fashion as nearer surface intensities. ICY formation is evidencedby reduced current speeds, as a part of the water Surface is sheltered fromthe wind. Kinetic energy falls catastrophically during late spring with theformation of a stable boundary layer of warm air over the cold lake surface.Subsequent warming of the Surface water and the *tart of stable density Strati-fication initiates the gradual lakewide increase of current speeds all overagain.
3.7 Comparison of Summer Current Patterns
HarKington's (1895) current chart of Lake Huron, which was compiled fromdrift bottle releases and recoveries during *urnmu, is summarized in Figure14. His studies revealed persistent southward flowing currents along the westshore of the lake and a return northward flow along the Ontario coast as farnorth as the mouth of Georgia" Bay. Drift bottles released to the east ofGeorgia" Bay had a tendency to mea"der through the mouth of the bay and disperseabout its perimeter. This feature led Harringto" to close a counterclockwiseflow cell in latitudes just south of the bay mouth. Another cell of cyclonicflow was tucked into the northwestern cor"er of Lake Huron to xcount for west-ward drift observed along the northern CoaSt of the lake, i.e., the shore ex-tending northwestward from the mouth of Georgian Bay.
Slos* and Saylor (1975) analyzed ="rre"t meter recordings made in LakeHuron during the summer of 1966 and deduced a patter" of flow in epilimnionwater (Fig. 15). Again the circulation of Surface water was found to be of acvclonic nature. Essential differences from the Harrington studies conkistedOf en1argeme"t of the cyclonic circulation cell over the deep northeasternbasin of the lake. The northern limit of this cell was placed just east ofthe shoal water that protrudes "early 30 km southward from the western end ofNzinitoulin Island.the shoal
Another cyclonic patter" was found to exist to the west of9 occuPYi"g a" area about half the size indicated by Harrington.
:loss ="d SaYlor al*0 reported a rather steady flow of Lake Huron surface waterInto Ceorgia" Bay and a subsurface retur" flow of bay water into the lake.Ti'is frature Probably accounts for S large part of the difference in flow pat-fernS reported in the reaches of Lake Huron ea*t of the bay mouth in the twostudies.
26

G
o 0’
\
-b\-3 0
i -L%-7\~ --h -Alpe”a.q.y) - - - \ 1.
MICHIGAN
so Q’
A-,,PC.;-
MICHIGAN
Figure 14. Surface water flow patternsin Lake Huron during the open wate?navigation season (after Harrington,18951.
Figwe 15. Flow Fatterns of epilim-nion water in Lake ~itmn duringsmer (after SZoss and Saylqr, 1.0751.

As the surface water warms in spring and early *ummer, an epilimnion formsinitially near shore and gradually spreads and thicken* as summer progresses.Typical features of surface water temperature distributions observed during thewarming cycle are shown in Figure 16. Warm water confined in May to coastalareas gradually expands lakeward in July to surround a colder, denser pool ofwater centered over the deep northeastern basin of Lake Huron. Similar distri-butions observed in 1966 have been reported by Bolsenga (1976). Temperaturedistributions within the lake basin on a cross section of the lake from BlackRiver, Mich., to Tobermory, Ont., were taken during the *ame time intervals as
the surface temperature measurements (Fig. 17). All isotherms exhibit similarcharacteristics, being depressed near the coast* and shallow near the center ofthe lake basin. This feature is not unique to Lake Huron, but rather appearsto be characteristic of the development of summer stratification in all of theGreat Lakes.
The importance of the temperature distributions to lake circulation arisesbecause of observations that show that in the Great Lakes, as in oceans, persi*-tent horizontal water density gradient* are supported by nearly geostrophiccurrent flows, which represent a balance between pressure and Coriolis forces.A cold core of dense water surrounded by warmer, less dense water is supportedby currents flowing counterclockwise about the cell, characterized by conver-gence (sinking) along the coasts and divergence (upwelling) over the core.Thus, the horizontal temperature gradients observed during the warm weather*ea*on on Lake Huron and repeatedly observed year after year give supportingevidence to a circulation pattern very similar to the reported current surveys.
Now it is also apparent that the winter current patterns in Lake Huron arevery similar to those observed in Summer. The winter observations reveal adeeper penetration of high current speeds in the nearly isothermal water ma**and larger volume transports, which can be attributed to larger momentum fluxesbecause of increased wind speed*. Winter circulation persists in a character-istic cyclonic pattern unsupported by significant horizontal water densitygradients. The small gradients observed exhibit features similar to summerdistributions, with a denser core of water over the lake's deep basin surroundedby colder, less dense water and ice about the lake coasts. The obvious conclu-sion drawn from these observation* is that the prevailing wind-driven currentpatterns support the observed thermal structure (the currents are similar withor without horizontal temperature gradients). It is not the thermal structurethat drives the current*.
4. CONCLUSIONS
Winter in Lake Huron is accompanied by an almost isothermal water mass.In 1974 the last vestiges qf summer stratification were observed in November.Following a month of no discernible temperature gradient* (December), the win-ter months of January, February, and March showed faint temperature differen-tials consisting of a pool of warmer water (1' to Z°C warmer) centered over thelake's deep northeastern basin surrounded by colder water and ice about thelake coa*ts. April exhibited a return to near isothermal conditions, followedin Kay by the start of the cyclical v sming trend.
28

LAKE HURON LAKE HURONLAKE HURON
MICHIGANMICHIGAN
Figure 16. Surface water tempera-tures (‘CI of Lake Huron as ob-served in 1971 on three CClWmonitor cruises. Clockwise fromupper left the cruise dates were:al 17-25 May, bl 12-28 June, andc) 19-27 July. Temperature s truc-ture of the lake water mass%shown in Figure 17 aZong the crosssection of the lake shown herefrom Black River, tich., toTobermozy, Ont.
29

Figure 17. Temperature isopleths(‘Cl of the Lake Huron water masson a cross section of the lakefrom Black River, tich., toTobemoq, Ont., for the cruiseintervals of Figure 16.
WEST SHORE0
50Gi55= 100
%
150
Cc)
30
(b)

Wind speeds about the perimeter of the lake during winter were relativelyhigh compared with winds during summer. Instability in the overwater atmos-phere caused by cold air moving over a warmer water surface peaked in January,as did observed wind speeds. Unstable conditions endured from November throughMarch. April was a month of nearly neutral atmospheric stability over the lakeand May was a month of extreme stability. With large momentum fluxes from theatmosphere to homogeneous water in winter, mean current speeds were nearly thesame throughout at least the upper 50 m of the water column. This distributioncontrasted vividly with summer observations showing strong vertical gradientsof horizontal current velocity with depth, the velocity gradients being veryclosely related to vertical water temperature (or density) gradients. Month-to-month variations of mean current speeds in winter closely paralleled the month-to-month variations in mean wind speeds observed about the lake's perimeter,although ice cover in February and March appeared to reduce the momentum fluxfrom air to water on a whole basin view. Intense stability in the ova-lakeboundary layer in Nay was very effective in shielding the lake surface from sig-nificant wind stress and caused a remarkable decrease in the lake's kineticenergy.
Current patterns in Lake Huron in winter 1974-75 were dominated by south-ward flow along the entire west coast south of Alpena. This southward currentwas especially intense during episodes of strong west and northwesterly winds.With westerly winds prevailing throughout the winter months, southerly flowalong the west coast persisted from month to month and was the most prominentfeature of the resultant winter current flow. The steady southward flow pene-trated to at least the 50 m level of coastal bathymetry and apparently occupieda wide coastal strip with rather uniform characteristics (at least 30 km widejust east of the mouth of Saginaw Bay). Large volumes of water were transportedsouthward in this current. Much less data was collected in the eastern half ofthe lake. The available information suggests that a broad northward return flowcharacterizes the current field in this area. This return flow appeared wellestablished in the south end of the lake, but the pattern was uncertain in thenorthern parts because of the scarcity of data. Perturbations to this lakewidepattern occurred during episodes of strong wind stress, but long period meanflows showed a definite preference for cyclonic flow during the winter season.
Flow patterns during winter 1974-75 were very similar to those observed insummer. Long-lived horizontal gradients of water density established in summerwere supportive of observed large-scale cyclonic flow and in fact may haveestablished almost geostrophic equilibrium. The winter current studies, whichestablished similar current features existing in a homogeneous lake, suggestthat the summer thermal structure is supported in part by the wind-driven lakecirculation, as it is certainly not the temperature field that is controllingcurrent patterns.
5. REFEREXCES
Ayers, J. C., D. V. Anderson, D. C. Chandler, and G. H. Lauff (1956): Currentsand water masses in Lake Huron, Technical Paper No. 1, Great Lakes Re-search Division, University of Nichigan, Ann .irbor, Michigan.
31

Bellair, F. R. (1965): The modification of warm air moving over cold water.In: Proceedings, 8th Conference on Great Lakes Research, Publication No.13, Great Lakes Research Division, The University of Michigan, Ann Arbor,Michigan, 249-256.
Bennett, E. B., and J. H. Saylor (1974): IFYGL water movement program - apost field work review. In: Proceedings, IFYGL Symposium, Fifty-fifthAnnual Meeting of the American GeophysicaZ Union, U.S. Department ofCommerce, National Oceanic and Atmospheric Administration, Rockville,Maryland, 102-127.
Bolsenga, S. J. (1976): Lake Huron surface water temperature May-November,1966. Water Resow. Bull., 12~147-156.
Danek, L. J., and J. H. Saylor (1976): Saginaw Bay water circulation, NOAATechnical Report ERL 359-GLEIU 6, U.S. Department of Commerce, Boulder,Colorado, 51 pp.
Federal Water Pollution Control Administration (1967): Lake Michigan currents.U.S. Department of Interior, Federal Water Pollution Control Administra-tion, Great Lakes Region, Chicago, Illinois.
Harrington, M. W. (1895): Surface currents of the Great Lakes, as deduced fromthe movements of bottle papers during the season of 1892, 1893, and 1894.Bulletin B (revised), U.S. Weather Bureau, Washington, D.C., 14 pp.
Hough, J. L. (1958): Geology of the Great Lakes. University of Illinois Press,Urbana, Illinois, 313 pp.
Leshkevich, G. N. (1976): Great Lakes ice cover, 1974-1975, NOAA TechnicalReport ERL 370-GLERL 11, U.S. Department of Commerce, Boulder, Colorado,
39 PP.
Lyons, W. A. (1970): Numerical simulation of Great Lakes summertime conductioninversions. In: Proceedings 13th Conference on Great Lakes Research,International Association for Great Lakes Research, 369-387.
Millar, F. G. (1952): Surface temperatures of the Great Lakes. J. Fish. Res.Board Cam&, 9~329-376.
Palmer, M. H., and J. B. Izatt (1972): Lake movements with partial ice cover.Limnol. and Oceanogr., 17:403-409.
Petterssen, S., and P. A. Calabrese (1959): On some weather influences due towarming of the air by the Great Lakes in winter. J. of Meteorol.,16:646-652.
Phillips, D. W. (1972): Modification of surface air over Lake Ontario in win-ter. Mon. Weather Rev., 100:662-670.
32

Phillips, D. W., and J. A. W. McCulloch (1972): The climate of the GreatLakes Basin, Climatological Studies No. 20, Atmospheric EnvironmentService, Toronto, Canada, 40 pp and illustrations.
Richards, T. L., H. Dragert, and D. R. McIntyre (1966): Influence of atmos-pheric stability and over-water fetch on winds over the lower GreatLakes. Mon. Weather Rev., 94:448-453.
Richards, T. L., J. G. Irbe, and D. G. Massey (1969): Aerial surveys of GreatLakes water temperatures April 1966 to March 1968, ClimatologicalStudies No. 14, Canada Department of Transportation, Meteorology Branch,Toronto, Canada, 55 pp.
Rondy, D. R. (1969): Great Lakes ice atlas, Technical Report, Great LakesResearch Center, U.S. Army Engineer District Lake Survey, Detroit,Michigan, 8 pp and illustrations.
Sheng, Y. P., and J. B. Izatt (1972):Limnol. and oceanogr., 17:403-4o9.
Lake movements with partial ice cover.
Sloss, P. W., and J. H. Saylor (1975): Measurements of current flow duringmummer in Lake Huron, NOAA Technical Report ERL 353-GLERL 5, U.S. De-partment of Commerce, Boulder, Colorado, 39 pp.
Strong, A. E. (1972): The influence of a Great Lakes anticyclone on atmos-pheric circulation. J. Appt. MeteomZ., 11:598-612.

Appendix A
MONTHLY AND SEASONAL WATER CURRENT TRANSPORT AND NIND RUN ROSES FOR CONDITIONSOBSERVED IN LAKE HURON DURING WINTER 1974-75.
34

?f
*1 --i *1
* w
‘c v .J+
. ..OO/
-3,
==/ \
-;&
/-““:“cmy” ,dpia 40 eo .w
I
‘;\
LAI<E HURONNOVEMBER 1974 IS m
Figure A.la. Water cwrerrt transport poses at 15 m depth in LakeHuron and wind mn roses at five perimeter mcteoroZogicaZ sta-tions for November 1374. C:trrent roses shou the percentage ofcurrent mm toward each o&art, whiZe blind mses show the per-ccntafjfe of wind run from em;2 octant.
35

L
yzTzro . OF TOTALosag4nawLAKE HURONNOVEMBER 1974 .75m
Figure A.lb. Current r0se.s at 25 m depth for November 1974.
36

1-~.;.T\
d,Alpe”a qg c/,~“O ~‘c.-’.I.
‘d, ‘00
f
(
&
4
u
l“‘“~mmy3” -4
mo . OF TOTAL .0:iaginaw kLAKE HURONNOVEMBER 1971 50 m
KILOMETERScz: .0 10 20 30 40 50
/
Lll.00 Y l_l.OD
Figure A.lc. Current roses at 50 m depth for November 1974.
37

~-LilO” jTiz?% % OF TOTAL \ .O%Q,“.3W
LAKE HURONNOVEMBER ,874 2 m ABOVE BOTTOM
KLOMETERS-3
0
1P
20 30 40 ,’ 50BlOO b,m.00
Figure A. Id. Current roses at 2 m above the bottom for November1974.
38

LAKE HURONDECEMeER 1974 15 m
KILOMETERS-
0 10 20 30 4oZ?o
Figure A.Za. Current roses at I5 m depth and wind roses forDecember 1974.

aft
vfib
\Ii*v
&$,A
4
/MT0&
“‘“ydy” ’L4‘:m~O%OFTOTIL \3saginaw
LAKE HURON
c4
Figure A.2b. Current roses at 25 m depth for December 1974.
40

14.00’
2a 3
R
I;“‘*Tyy” e
ZssQ *OF TOTALosag,naw f
LAKE HURONDECEMBER 191a 50 m
KILOMETERS .c:- - I0 10 20 30 40 soi/
111.m Y,112.00
Figwe A. 2~. Current roses at 50 m depth for December 1974.
.

OSagl”aW
LAKEHURONDECEMBER 191. *In ABOVE BOTTOM
KILOMETERScl 10 20 30 40 so
Figure A. 2d. Current poses at 2 m above the bottom for December1974.
42

,
osagtnav
LAKE HURONJAWIRY ,915 IS m
IKILOMETERS
-I
0
10 20 30 40
so
Lll.00’
1;” 5c
ll:.on
Figure A.3a. Current roses at 15 m depth and wind poses forJanuary 1975.
43

O%gl”.3W
LAKEHURONKILOMETERSOK0 aI 3o 4o sb 1---;f4
(11vo v Il:30
Figure A. 3b. Current roses at 25 m depth for Jmtuary 1975.
44

id. .
.
11.00
(a.
&
I
“‘“lpw:‘“” ;
z?iEo x OF TOTAL
.
LAKEHURONJANURY 29’5 50 m
KlLOMETERS
-’0
10 20 30 40 50
e,Tc L-fe:_oo
Figure A.3c. Current mxes at 50 m depth for January 1975.

>A8pena 1.IVO
.
osagmaw
LAKE HURON.JAH"AR" ,815 2 m ABOVE BOTTOM
KlLOMETERS
0 10 20 30 40 50
Figure A. 3d. CLtrrent roses at 2 m above the bottom for January1975.
46
,

-l
ii
?
Alpena&df
;_A *
A
b
4% -
*.wo
I % OF TOTALosag,naw
LAKE HURON
+svw
IFEBRUAR” 1915 IS m
IKlLOMETERS0 10 20 30 40 50-TX
#1 0”
\/;I 4b
8: UCFigure A.4a. Current roses at 15 m depth and wind roses for
February 1975.

LAKE HURONFEBRUIR” ,915 25 m
.I IFigure A. 4b. Current y0se.s at 25 m depth for February 1975.Figure A. 4b. Current y0se.s at 25 m depth for February 1975.
48

d..OO&I
‘I\
it““Ty:‘“” c4TEizo % OF TOTAL .osag,naw
LAKEHURONFEBR"IR" 107s mm /KILOMETERS.~~0 IO 20 30 40 50
01’00 s2.00
Figure A. 4~. Current roses at 50 m depth for February 1975.
49

L--J k/ I
d.30 i---l
.I- \ .-[ *-;?7Eso *OF TOTAL .OSagl”aWI LAKEHURON
FEBRUARV 1915 2 m ABOVE BOTTOM \ / IKILOMETERS
0
10 20 30
-, 4or&111.00 y82.00
Figure A. 4d. Current 11oses at 2 m above the bottom for February1975.
50

.,vo
i
k
P-,saginaw
AlpemJt*-6N
J1
LAKE HURONYIRCH ,815 15m
.v
r%4 .._OO’%K!~OMETERSI-O 10 20 30 40 50
81 A W”ODFigure A.Sa. Current roses at 15 m depth and wind poses for
March 1975.
51

I _ ; : _
A
““Tp~‘“” 4hI 20 LO 60 x
LAKE HURON
.
MARC” ,915 25 mKlLOMETERS{Z~_~ ---~-~ 7
0 10 20 30 40 50
‘1100’ I700
Figure A. 5b. Current roses at 25 m depth for March 1975.
52

.
..m
&
-::Q
u
iro’s’o”:my” , 20 .o 80 . OF TOTAL .
>.%apmaw
LAKE HURONWRCH ,975 mm
KlCOMETERS
0 IO 20 30 40 50
KL
1.
k./
Figure A.Sc. Current roses at 50 m depth for Mazvh 1975.
53

.4
osagmawLAKEHURON
YARCH ,9,5 2 m ABOVE BOTTOMKLOMETERS
070 20 30 40 50
81VO~ Y 82.00
Figure A. 5d. Current roses at 2 m above the bottom for Marc1975.
54

;“..‘iAlpellaI570 w,?
-351
IE
4 ‘i.- -A A
>S?ZplnaWLAKEHURON
APRIL ,975 3s m
.- :d
t:
Figure A.6a. Current rose.s at 15 m depth and wind poses forApril 1975.

:;..;
I\11
iI $1;
B 4
f-d I+I
%4 y\I. n:
Lzl \i~‘;oao % 06 TOTALosag\naw
LAKE HURONAPRlL ,975 25 m
KILOMETERS0 ib 20~ 3bo ~~50
Fipx A. 6b. Current roses at 25 m depth ,foor April 1375.
56

‘4
::
\Aipena
i’or
OS&p”M
LAKE HURONAPRlL lo75 mm
Bl.“e 62 i:’
Figure A.fic. Curent roses at 50 m depth for April 1975.
57

N
~;I;
.4 .. . -. .;;i-
I .- a1.00 ..(oo’-
.
A
:-.1- 1
““TyJ;‘“” -ZiT% li oc T0T.L . .
OSagi”aW I.LAKEHURON
APRIL ,976 In, ABOVE BOTTOMKlLOMETERS
0 10 20 30 40 50
I . ..“” IFigure A.6d. Current roses at 2 m above the bottom for April
1975.
58

.
LAKE HURONMAY ,P15 158-nKlLOMETERS
0 10 20 30 40 50
Figure A.7a. Current roses at 15 m depth and wind roses forMay 1975.

{&S * -t1,:a 7,e .
. ,.i
t.. *
CL 3 a
““:“:%‘“” e!J ~ OF ,O,IL +wLAKE HURON
WAY ,915 25 mKILOMETERSo Ibio ~~3mo&&
Figure A.75. Current roses at 25 m depth for Mag 1975.
60

.
>Saglnaw
LAKE HURONYAY ,975 50 m
Figure A.7c. Current roses at 50 m depth for May 1975.

No current data received from 2 m off the bottom for May 1975.

. .
osaginawLAKE HURONKlLOMETERS-’0 10 20 30 40 50RI_“” v 4II1’00
Figure A.8a. Current roses at 15 m depth and uind roses forwinter 1974-75.
63!

Q Je,-Ydwov
3
.(
7
%
A
Alpenaa.4
5 :, “-!I
-1
.I ,lQ
c
;I-:
1se$
y* ./
4’I‘
1-‘.a“;4 g
/- ‘r\:)
GoS3glnaw iiLAKE HURONWNTER 1974-1915 15 m
KiLOMETERSi
0 10 20 35-70 50
Fipm A. Sk. ~urr;-.f roses at 25 m depth for l.l?nter 1274-75.
64

. .
. ..OC \I&=-a.r““Tpy” :4I 20 .oao ‘i OF TOThL
LAKE HURONWINTER 1914-1915 50 m
I
KlLOMETERS ~~-
0
10 20 30 40 50
\
Figure A.Ec. Current roses at 50 m depth for winter 1974-75.
65

.
IdI.00’
:I
LAKE HURONWINTER Wll-,915 *m ABOVE BOTTOM
KlLOMETERS0 10 20 30 40 50
81’00 Y,llW0 IFigure A. Ed. Current rooses at 2 m above the bottom for winter
1974-75.
66

. .
Appendix B
WATER CURRENT TRANSPORT AND WIND RUN ROSES FOR SELECTED EPISODES OF DIRECTION-ALLY STEADY WIND STRESS IN LAKE HURON DURING WINTER 1974-75.
67

;
j ./
ii;l
/-i” -il1
,p,4 . I!,.’/\
w, TTO 23 70 % OF TOTALosag:naw i\ *
LAKE HURON
20 22 NOVEMBER 1914 15m
KILOMETERS0 lolO 3040
Figurc B.la. cwwmt loses at 15 m depth and wind POSCS for20-Z' .xxmher 1974.
68

SagNnawLAKE HURON
20 - 22 NOVEMBER 1914KILOMETERS
0 1020 3rto 10
69
.Spre 3. lb. CLcrrent rose.s at 25 I? de?th for 20-22 November 1974.

.-‘1
-t&
b’*““:“:lyl 4;-r,zo ‘i OF T0T.L
LAKE HURON \
//20 - 12 NOVEMBER ,911 50 m
KlLOMETFRS
0 lb0 3zo 50\
.
1-‘~.Figure B.lc. Current roses at 50 m depth for 20-22 November 1974.

. .
..
f. *
si
:I-i
i
‘3
$-.;;V *
J
“‘Sack@‘“” 4
770 ia 70 .: or ToTu
;saginaw
LAKE HUHOX20 22 NOVEMBER ,916 2 m *IBO”E BOTTOM
KILOMETERS
0 100
-
30 40 5c \ .
Figure B.ld. Current Foses at 2 m above the bottom for 20-22!?ovember 1974.

\
“1
\.
--d
YJ
Alpera
1\
* 3
I?
14 \c
“I\1 ( :.iIIi 1&\: “i . Lf-A* v ;:.-1~1‘7””
i 22Fi.
i1 lr
;;- liI/““:“Cm&‘“” 4
;;o;oio OF TOTAL I,!,,,<//JId1W
\ ;(
I
LAKE HCKOS /JO NCWEMBER 2 OECEMBER 191* 15 m / ,
KlLOMtTERS 1ci 1r-20 3040 SC \ -C
zB
/
1‘I
!
-~/~‘1,7:cre B. 2a. Current roses at IS m depth and wind ~00se.s for
20 .‘;ove+er-2 Jecember 1974.
72
- .

. .
.Alpem
3N! E
LAKE HURONJO NOVEMBER - 2 OECEMBER 1074 25 m
II.00
J
c
.
.(1ri/
/
. ..or
Figure B. 2b. Current roses at 25 PI depth for 30 Akwember-2December 1974.

-“\-y’;x+7q
--L L’ Qa4 x
/--t-J;
v:,.-
‘.‘-AlDena
! %kai ,,
/;.r
.&a. *b““:“d~yx 24- -~-5 20 LO eo % OF TOTAL .
I‘;.:,’ .
1-\
osaglnaw
LAI<E HURON
30
NOVEMBER
- 2 DECEMBER 1974 50 m
KILOMETERS0 100 G--20 50
\:.;w
‘r:I,:
c
ai :.
Figure B.2c. Current MS~S at 50 m depth for 30 November-2December 1974.
74

‘,J““~yy”
*I 20 40% % OF TOTAL
1
LAKE HURONJO NOVEMBER - 2 DECEMBER ,911 2 m ABOVE
KlLOMETERS BOTTOM0 lb0 304b 50
Figure B.2d. Current p0.se.s at 2 m above the bottom for 30November-2 December 19 74.

LAKE HURON2e - 29 DECEYBER 191. 15 m
Figure B.3a. Current poses at 15 m depth and wind roses for26-23 December 1974.
76
L.

3
*mena15.00~
,saginawLAKE HURONKlCOMETERSo ‘o 2o 3o ‘O 5b vill
u-a0 1 W’W
Figure B.3b. Current roses at 25 m depth for 26-29 December 1974.

1
cJ \
.&
““:“:E&l”” 4;-ioo *w TOTAL .
osag,na* f
LAKE HURON16 - 29 DECEMBER 1011
Figure B.3c. Current ro.ses at 50 m depth for 26-29 December 1974.
78

. .
>SaglnawLAKE HURON
26- 29 DECEMBER 191, I m ABOVE BOTTOMKlLOMETERS_~~~
0 10 20 30-40 50
Qure B.3d. Current roses at 2 m above the bottom for 26-29December 1974.
79

LAKE HUHOS9 1, JMWARY ,915 IS m
KILOMETERS0 16-k 3i-k 50
Figure B.4a. Current ro.ses at 15 m depth and wind roses for 9-11January 1975.
80

‘. .
:;i
.
.+? 1 \f -(~~.-
1LI: &&,JI?
*1
LAKE HURON9 11 JANUAR” ,975 /
KILOMETERS
Figure B. 4b. Current Poses

Alpen.\.1 :s * v*\-.J1 li
A%b
c;..;
““Tyya” 14-:-:-I m .o 60 a OF TOTAL
>sagina*
LAKE HURON0 - 11 JANUARY ,915 50 m \ /
KILOMETERS-~- _0 10 *II 30 40 so
,,,, ~, \
Figure B.4c. Current roses at 50 m depth for 9-11 January 1975.
82
a

5 20 40 60 % OF TOTAL>?.agmaw
LAKE HURON0 - 11 JANUAR” 1915 2 m ABOVE BOTTOM
KlLOMETERS0 tom0 SW0 70
Figure B. 4d. Current zwses at 2 m above the bottom for 9-11January 1975.
83

AlpenaI, 2,’ r--4\ c.T1
53
I 20 .o 60 *OF TOTALasaglnawLAKE HURON
11 - 11 .lANUIR” ,915KlLOMETERS
0 10 20 3c4b 50
Y
Figure B.5a. Current mses at 15 m depth md wind roses for 11-14January 1975.
84

.v t (r1-w
TllV0c
/“‘“ygp=J &I 20 .P 80 .oOFLAKE HURON
1, - 1. JANUARY ,915 25 m~..~ K’L?!E~E~s~~-~~i~o~~3~~~~~~t;
Figure B. 5b. Current roses at 25 m depth for 11-14 January 1975.
85

“4
‘MY,
a+ a,c
/& l-J** .i .$, \r,
L/‘(
A““Ts”:m&‘“” 4;‘;o 70 70 / OF TOTAL
LAI<E HURON1, - 14 Jwi”ARY ,975 50 m I
KILOMETERS0 1020 3oao 50 \
44 .i
Figure B.5c. Current rmes at 50 m depth for 11-14 January 1975.

Vigure B. 5d. Current mses at 2 m above the bottom for 11-14January 1975.
I4
I
87
I
>S,W”aW
LAI<E HURONII- 14 JANUIR” 1915 2 m &BO”E sOTTOM
KlLOMETERS0 1020 3zo 50 *;/
:;I

is\/v “‘“?wJ~~‘“” _-~ 4 I 20 -- 40 60 *OF TOTALOS.Sgl”aWLAKE HURON
0 - 15 FEBAUAR” 1915 15 mKILOMETERS
0 lbi0 ,570 50
Figure B.6a. Current poses at 15 m depth and wind roses for 9-15February 1975.
88

1-7.I ‘DO
:‘I, .
;
::
.1J!4 -’ & % li
--i:I;.
j
v -4““:“:my” \zriso . OF TOTALLAKE HURON 1
9 - ‘5 FEBRUAR” 1975 25 m
KILOMETERS.d~0 Ill 20 ioo 30
4~oT”~y-&
:;:
.
Figure B.6b. Current nxes at 25 m depth for 9-15 February 1975.
89

\
+hy&%!I J& *
qAlpenaMt.IVOi’
.>‘OOY%. w-. . J
--m. I..TG ..vo.& ib“‘“yy” r4E=%To . OF TOTAL . v*osagmaw
LAKE HURON0 -IS FEBR"*.R* ,075 50 m
KlLOMETEFJS _0 10 20 JO 4OTO
Figure B.&T. Current roses at 50 m depth for 9-15 February 1975.

. .
2. * /.
, / \ I
LAI<E HURON0 - IS FEBRUARY 1915 2 m ABOVE BOTTOM I
o::,%?g&~o \ * i-/
I. ,~>, Ic-’ ,,, <,,,
m_ ,.^, ^rzgure d. da. current roses at 2 m above the bottom for 9-15February 1975.
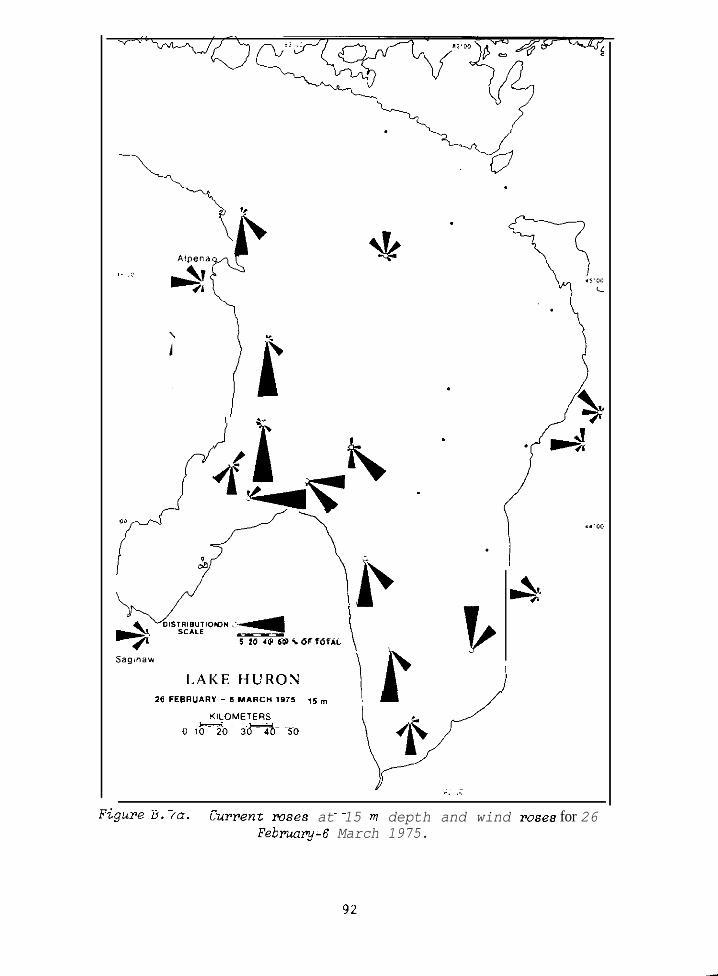
4
:-
,I$ --4 -00
22
JT
J IP-> ““y;‘“” :s
5 70 40 60 .OFTOTlLSaginaw
/LAKE HUROX
26 FEBRUAR” - 6 MARCH ,915 15 mi
KILOMETERS &0 67~ io- 40 ~50
--~.; v
IP
&G
“. /,/
-. - ̂ ^ .~rzpre fl. /a. mrrent roses at 15 m depth and wind rose8 for 26February-6 March 1975.
92

. .
Alpena1.00-3 -
N1 .
.
osapinawLAKE HURONNLOMETERS
o ‘O 2o 3o 4o” ::ii4
.
.
IIVO Y I?ca
Figure B. 7b. Current mxes at 25 m depth for 26 February-6Mwch 1975.
93

\J-’iltpena:r*;I
%-
jl ;,,
4
c
%
sd .
11’
. ,++ //f-y ~- \ . . u,
aSaglnaw
LAKE HURON26 FEBRUARY - 6 MARCH ,915
KILOMETERS0 lb20 3rib 50
Figure B.7c. Current POSTS at 50 m depth for 26 February-6March 1975.

* ,A
/
&
J-l. *
i,
““TRm~:‘“” 4
em -~-5 10 40 $0 ‘. OF TOTAL
,sag,naw
LAKE HURON I
.
6FEBRUAR”
-b MAacn ,915 2 m ABOVE BOTTOMKILOMETERS0 1020 3040 50 v
Figure B. 7d. Current yeses at 2 m above the bottom for 26Febrdary-6 March 1975.

; i
i:
A :14-j i --- .
If- -:-/--\
._osag>naw
LAKE HURON1-B APRlL 1975 15 m
KlLOMETERS0 lb0 3Go 50
4‘-a: &-w --JV&
4
Figure B.Ea. Current loses at 15 m depth and wind roses for l-8April 1975.
96
L.

wa 4s---
-0y2
\‘\i‘i r
JAlllena yy * .v.Y
1
I - I
;-i:’
II‘
I
4
b-e!
oc
i---A
*cm*~izo *OF TOTAL
3ag,naw
LAKE HURONI - 8 APRIL 1915 25 m
KlLOMETERS
0 lb0 3bo 50
,.,’
L--x 1 P
97I
/ zi-.;r-l..-.-~~ -,.~.--lc~ ..-- --,-

. .
d%+y$-&yu,$f4qY
‘c
*-Ja
s.4\
‘4\Alpma
1:i:_3. ,Ic
.
/ 30f .ICLI. *
C““yz3~‘“” ~4_- -~-5 ,o 40 60 %OFTOTALssaglnaw
LAKE HURON I1 - 8 APRIL ,975 50 rn~
KILOMETERS
0 160 G-ib 50
*. ,, ‘:;,’
%gure B. EC. Current roses at 50 m depth for l-8 April 1975.
98
py-’ .’ ‘-~:rrra--7--7~?Tw:<..~< ~. z~.T~yv -. .._. . . -,.~yrr-~ _,.... .._ _T ___ S.7m.n.~~-r.~~~
Q,..-~.C..,.:II~-.I,Cr-.“~~ .I_\ -y_I-- ._.....__-._,._...,,___,.._-. _ i... ^-‘......._ ..,....._~ .._ .~ .~ ., ~~ .~ ..~ .._.. _ .-- ,. -.. .-.-. ., . _.

-
I LAKE HURON1- 8 APRIL 1915 2 m Am”E BOTTOM
~METtRs0 10 20 3bo 5i
Figure B. Ed. Current roses at 2 m above the bottom for 1-8April 1975.
99
,
e---w-. ,w--I.-----.-- -..__.....,__ _...~.~‘~‘-L~~~~~j\~,~*~U7YY~n*l~,-*,.~~~.~”~..”,r..,~,.*,.” ,._,1 ~-.‘_I_ ._-. ._.. . __~..~. _, . _.

I.J
i I.T14 e .
---Y
be.,- \[_-~-I 20 .o 60 z OF TOTAL.-OSagi”aW
LAKE HURON3 - 13 APRIL ,975 15 m
KlLOMEiERSri0 10 20 3bo so
Y I~
Figure B. 9a. Current roses at 15 m depth and wind mxes for 3-13April 1975.

4_ v c
-7
;:‘q&L:Iz.ayf-
--. “i
y
I
IPq ;&
.J/
j+-Y 1. 0
I q/!
\\yy- ;J:
““y;ly;‘“” LdI 26 40 60 t OF TOTAL
Saginaw
LAKE HUROS
3 -
13 APRIL 1915 25 mKILOMETERS
Gzo !!!0 lb0 50
81 5:
i-f .-
I: ,OCI
Figure B.9b. Current roses at 25 m depth for 3-13 Aprit 1975.

3TAlDenaI, .,.
LAKE HURON3 - 13 APRIL ,915 50 m \
Figure B. 9c. Cslrrent roses at 50 m depth for 3-13 April 1975.
102

.-.
_\\___I\Alpen.
’ :__;
x., /25
7t,* .‘1’-11;:i/ L
4. 4vc 7.d/~’ a/““y&ye 4
ii0 ~0~0 / OF TOTAL
OSagl”aW
LAKE HL’ROS3 - 13 APRIL 1975 2 m ABOVE BOTTOM
KILOMETERS0 IF-2 3040 50
Figure B.9d. Current mses at 2 m above the bottom for 3-13April 1975.
103

.
15
f
I$>a ,,/,
4;:I
LAKE HURON
Figure B.lOa. Current roses at 15 m depth and wind loses for 3-7May 1975.
104
pmY--------v~~~~~~~~- .y.v-r--.-.. ~.-.Tr:w,-Ty
“.... ,_... ,~~._-L-d..*- . . . . . . ,. ..-.. ~,..__~ _,,_. ._._._._. _,._,.. ,.,, ,_,

‘-\,
5 “0 3AlLlena;
;~j
6A
aganaw
LAKE HURON3 - I MA” ,975 25 m
0 650 3bo 50
rzgure d. ion. Current roses at 25 m depth for 3-7 May 1975.
--.
105
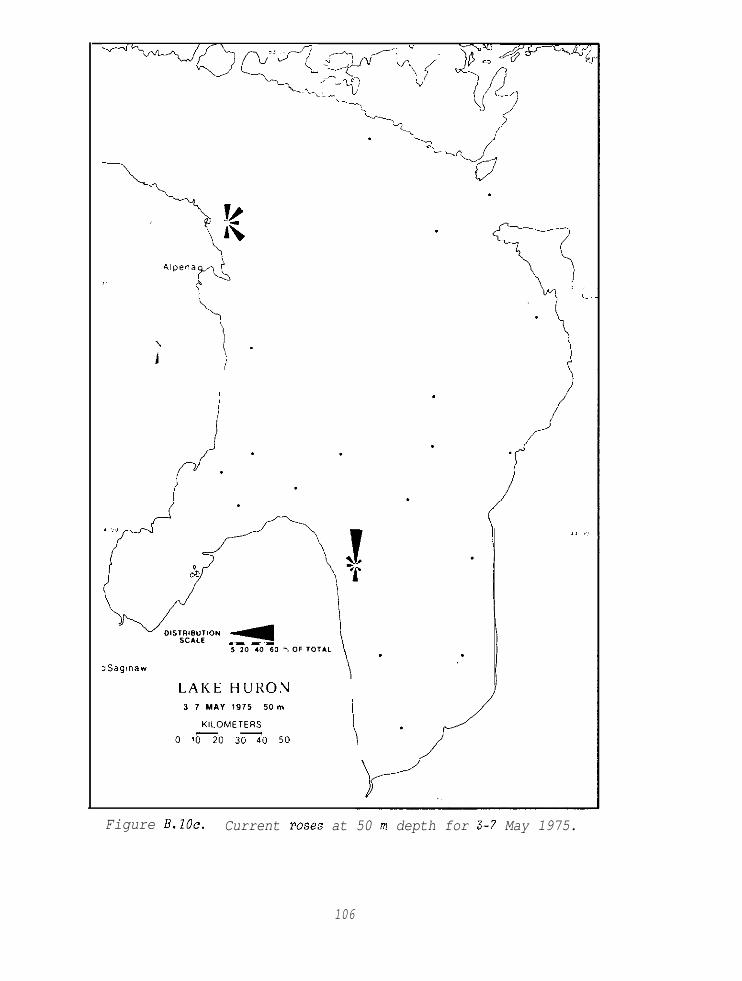
4
--Tp-d\ *T ew; <~
,-?I?$ u-j-I: d@-W$
“-xl -lJ--k -+P
. -k i?‘2. /’-‘--+j
; i .
LAI<E HUKOX3 I MAY 1915 50 m I
KlLOMEiERS0 lb0 3TGo 50 \
Figure B.lOc. Current mse.s at 50 m depth for 3-7 May 1975.
106
~‘--“.-- - .--..%“I~ ,,, li ..~*I‘-. -1- :.~-.r.C____ ,._, --~,~ .-_*.__ .-.-.--*-..------~~
~ e*i.-.Y_s.i..: i.,.. ..s..~I..N_.U”._:M*w .-... ____._,._..__ ~._ .,_._ _,_...._._ ~-I~ .__..__ .~~ ._.__, ,~_~ __ ___.. ,. ,,. .,~.. ,,.___, ~:__‘.... :.-..~,..T~.. .~ .~.~

-.-- . ..- ~-.~_ -.-. ~.~ ~-7-T ----, ---- -... -_ ..-.. -..~~ ._._ ~.--~~ _/_ ..~, ~~.~ . .
No current data received from 2 m off the bottom for May 1975.
107

I. RTVORT NO.
EPA-90514-75-004__-I. 'TITLE ANU SUBTl rLt
TECliNlCAL REPOnT D A T A~P,om ,c”<, ,,,,lll,,r,;o,,r o,, ,hc. ,<.,‘,.rs<, ,ac,o,r <~om,‘kri~lr,
-3. ,aEC,P,tNT’S ACCLSSlOWNO.
-.-~~5. REPORT DATEDecember 1976 (date prepared)
-6. PERFORMlNG ORGANIZATION CODEWinter Currents in Lake Huron'. AUTHORlS, 8. PERFORMlNG oncn~,znrloN REPORT NO
James H. Saylor and Gerald S. Miller GLERL Contribution No. 111,. PERFO"M,NG ORG?NIZATION NAME ANO ADDRESS 10. PROGRAM ELEMENT NO.U.S. Department of CommerceNational Oceanic and Atmospheric Administration
55 (Proiect B-27. ULRG-IJCTRnCTiGRnNT NO.
Great Lakes Environmental Research Laboratory2300 Washtenaw Avenue, Ann Arbor, Michigan 48104
IAG-D5-0631
12. *PON*ORlN‘A‘ENC" NAME AND ADDRESSU.S. Environmental Protection AgencyRegion V230 South Dearborn StreetChicago, Illinois 60604
13. TYPE OF REPORT AND PER,00 ‘OYERECFinal14. sPoNsoRl~C AGENCY CODE
I5 SUPPLEMENTA"" NOTESPrepared for U.S. EPA in support of the International Joint Cormnission - Upper LakesReference Group, Working Group B.
16. ABSTRACTTwenty-one current meter moorings were deployed in Lake Huron during winter 1974-75
?hhe moorings were set in November 1974 and retrieved approximately 6 months later. Thestations were configured on a coarse grid to measure the lake-scale circulation duringIinter. Water temperature "as also recorded in nearly all of the 65 current metersleployed. Results reveal a strong cyclonic flow pattern in the Lake Huron Basin persist:hroughout the winter. The observed winter circulation "as in essence very similar toThat is no" believed to be the summer circulation of epilimnion water, although theiinter currents penetrated to deeper levels in the water column and were more intense.{inter cyclonic flow persisted in a nearly homogeneous water mass, while summer CurrentSxhibited an almost geostrophic balance with observed water density distributions. This
xggests that the current field driven by prevailing wind stresses across the lake's<ate+ surface may be largely responsible for establishing the horizontal gradients Ofater density observed in the lake during summer. Analyses of energetic wind stressimpulses reveal the prevailing wind directions that drive the dominant circulation?. ThJinter studies permit a description of the annual cycle of horizontal current speedJariation with depth in Lake Huron, and in the other Great Lakes as well. The effects 0
the ice cover are examined and the distribution and movement of the ice cover withrespect to lake current and temperature fields are discussed.
7. KEY WORDS ANO DOC
/. DESCRlPTORS b
Great Lakes, Lake Huron, water currents,water circulation, thermostructure
8. DlSTRlB"TlON STATtMENT
Release Unlimited
:?A For”, 1220.1 19.73,
UMENT ANALYSIS
,IDENTIFIERS/OPF.N ~NDEO T E R M S c . COSATI I:icld/Groap
International Joint Field 8. EarthCommission - Upper Lakes Sciences andReference Study oceanography/
Hydrology andLimnology
-9. SECURITY CLASS ,~hirR.-por,, 2,. NO. OF PAGES119
3
,e
f
7
0. SECVRITY CLASS ,~rhi,pogc, 22. PRICE
-I
*u I GO”E~~UENTPRlNTlNOOr~l‘E:lon-nlmlr 1202REOmNHO~*
w .-~-- ..^ _._~ ..__ .~_ _~ ~_.I ,..., ,_
-.~. ..,, -.i.~.....~~.~ . . .-.,...,... ~“.__ .._.” ~. ..~,.~,.” . . ..__,,...,_ ~. ,._... .,~_ ~_ ,. ~..?a. .._,.-.. ~,.. ..~ ,~.~ .~~~