NOAA FORM 76-35A
67
DAPR NOAA NRT-5 2009 1 2009 DAPR NRT-5 NOAA FORM 76-35A U.S. DEPARTMENT OF COMMERCE NATIONAL OCEANIC AND ATMOSPHERIC ADMINISTRATION NATIONAL OCEAN SURVEY Data Acquisition & Processing Report Field Unit: Navigation Response Team 5 Operational Area: Northeast Coast LOCALITY State: NY General Locality: New York Harbor Sub-locality: Gravesend Bay 2009 CHIEF OF PARTY LT(jg) Matthew Jaskoski, NOAA LIBRARY & ARCHIVES DATE
Transcript of NOAA FORM 76-35A

DAPR NOAA NRT-5 2009
1
2009
DA
PR N
RT
-5
NOAA FORM 76-35A
U.S. DEPARTMENT OF COMMERCE
NATIONAL OCEANIC AND ATMOSPHERIC ADMINISTRATION NATIONAL OCEAN SURVEY
Data Acquisition & Processing Report
Field Unit: Navigation Response Team 5 Operational Area: Northeast Coast
LOCALITY
State: NY General Locality: New York Harbor Sub-locality: Gravesend Bay
2009
CHIEF OF PARTY
LT(jg) Matthew Jaskoski, NOAA
LIBRARY & ARCHIVES
DATE

DAPR NOAA NRT-5 2009
2
NOAA FORM 77-28 U.S. DEPARTMENT OF COMMERCE (11-72) NATIONAL OCEANIC AND ATMOSPHERIC ADMINISTRATION
HYDROGRAPHIC TITLE SHEET
REGISTRY NUMBER:
N/A
INSTRUCTIONS: N/A.
State: NY General Locality: New York Harbor Sub-Locality: Gravesend Bay Scale: N/A Date of Survey: 04/13/09 & 04/17/09 Instructions Dated: N/A Project Number: N/A Change No.1 Dated: N/A Change No.2 Dated: N/A Vessel: NOAA NRT-5 S3002 Chief of Party: LT(jg) Matthew Jaskoski, NOAA Surveyed by: NRT-5 Soundings by: Kongsberg Simrad EM 3002 multibeam echosounder Odom CV 200 single beam echosounder Graphic record checked by: N/A Protracted by: N/A Automated Plot: N/A Verification by: Atlantic Hydrographic Branch Personnel Soundings in: Meters at MLLW
Remarks: 1) All Times are UTC. 2) This is a DAPR to accompany all Hydrographic Survey Projects for calendar year 2009. 3) Projection is UTM Zone 18.

DAPR NOAA NRT-5 2009
3
TABLE OF CONTENTS LIST OF FIGURES 5 LIST OF TABLES 5 A. EQUIPMENT 6
A.1. SOUNDING EQUIPMENT 7 A.1.1 ODOM CV200 VERTICAL BEAM ECHOSOUNDER 7 A.1.2 EM3002 MULTIBEAM ECHOSOUNDER 7 A.1.3 LEADLINE 8
A.2. SIDE SCAN SONAR EQUIPMENT 9 A.2.1 GENERAL OPERATIONS 9 A.2.2 KLEIN 3000 SIDE SCAN SONAR 9
A.3 VESSEL POSITION & ORIENTATION EQUIPMENT 10 A.3.1 TRIMBLE DSM212L DGPS RECEIVER 10 A.3.2 TSS POS/MV POSITION & ORIENTATION SENSOR 10
A.4. SHORELINE –ENC VALIDATION EQUIPMENT 11 A.4.1 TRIMBLE GPS BACKPACK 11
A.5. SOFTWARE 12 B. DATA PROCESSING & QUALITY CONTROL 13
B.1. MULTIBEAM ECHOSOUNDER DATA 13 B.2. SINGLEBEAM ECHOSOUNDER DATA 13 B.3. SIDE SCAN SONAR DATA 14
C. CORRECTIONS TO SOUNDING DATA 15
C.1. SOUND SPEED 15 C.2. VESSEL OFFSETS & DYNAMIC DRAFT CORRECTIONS 16 C.3. PITCH, ROLL, AZIMUTH & NAVIGATION TIMING ERRORS 16 C.4. WATER LEVEL CORRECTIONS 16
D. APPROVAL SHEET 17
DAPR NOAA NRT-5 2009
4
APPENDIX I: HYDROGRAPHIC SYSTEMS INVENTORY VESSEL HARDWARE SOFTWARE PERSONNEL ROSTER
APPENDIX II: VESSEL STATIC OFFSETS
NGS SURVEY APPENDIX III: VESSEL DYNAMIC OFFSETS
STATIC DAFT REPORT DYNAMIC DRAFT REPORT
APPENDIX IV: CALIBRATION
POS MV SOUND SPEED VBES LEADLINE CHECK MBES PATCH TEST REPORT SSS TEST REPORT

DAPR NOAA NRT-5 2009
5
LIST OF FIGURES
FIGURE 1: MULTI BEAM ECHOSOUNDER 7 FIGURE 2: SIDE SCAN SONAR 9 FIGURE 3: HARDWARE COMPONENTS OF THE TRIMBLE GPS BACKPACK 12
LIST OF TABLES
TABLE 1: VESSEL CONFIGURATION FILES 16

NOAA NRT5 DAPR 2009
DATA ACQUISITION & PROCESSING REPORT
to accompany Field Season 2009 Survey Operations
NOAA Navigation Response Team 5
LT Matthew Jaskoski, Team Lead A. EQUIPMENT With the exception of sound speed profiler calibration reports, all calibration data were acquired by Navigation Response Team 5 (NRT5) personnel during the month of April, 2009. NRT5 data acquisition systems include side scan sonar (SSS), multibeam echosounder (MBES), vertical beam echosounder (VBES), position and orientation system (POS) surface sound speed sensor (SSVS), sound speed profilers (SVP) and a GPS backpack. Vessel description and offset measurements are described in Appendix II. Any subsequent deviations from this report will be addressed in the respective survey Descriptive Reports. Methods used to test and calibrate all equipment were determined by the hydrographer in accordance with the Hydrographic Survey Specifications and Deliverables, and the Field Procedures Manual with due consideration given to system performance limitations, time availability, and vessel and crew safety.
1

NOAA NRT5 DAPR 2009
A.1 Bathymetric Sounding Equipment A.1.1 Odom Echotrac CV 200 Vertical-Beam Echosounder S3002 is equipped with an Odom CV 200 vertical beam echosounder (VBES). The Odom echosounder has a single-frequency (appx 200kHz) unit with a digital recorder. This unit transducer operates at 208 kHz with a circular beam footprint of 8° at the – 12 dB point. The transducer is controlled using the CV controller software and interfaced with Hypack via an Ethernet connection. VBES data are logged in Hypack survey. A.1.2 Kongsberg Simrad EM3002 Multibeam Echosounder For shallow water bathymetry S3002 is equipped with a pole-mounted Kongsberg Simrad EM3002 MBES (Fig 2). In July the MBES was moved and affixed in a permanent hull-mounted configuration, offsets were measured by NGS in 4 & 5 August 2009 (Appendix II) and a patch test was performed on 18 August 2009 (Appendix IV). The EM3002 is a 293 kHz system with an operating depth range of 1m below the transducer to 150m water depth. Transmit beamwidth is 120° acrosstrack and 1.5° alongtrack; receive beamwidth is 30° alongtrack and 1.5° acrosstrack. The system has a maximum ping rate of 25 Hz, and a total effective beamwidth of 1.5° alongtrack by 1.5° acrosstrack.
2

NOAA NRT5 DAPR 2009
The EM3002 Processing Unit performs beamforming, bottom detection and controls the sonar head with respect to gain, ping rate and receive beam angles. The sonar processor also incorporates real time surface sound speed measurements for initial beam forming and steering. The EM3002 Sonar Interface Software (SIS) application is designed to run under Microsoft Windows, and provides control and monitoring of the EM3002 and the sensors connected to the Processing Unit. SIS can also be used to run the Built-In Self Test (BIST) programs of the system. Sound velocity profiles are applied to the data through SIS during data acquisition. Sonar parameters and vessel speed are adjusted as necessary to ensure adequate coverage in accordance with the NOS Specifications and Deliverables and the Project Instructions. Main scheme MBES line plans generally run parallel to bathymetry contours using a line spacing of y = 2(D-d-n)tanθ; where θ = ½ of the swath angle, D = water depth in meters, d = Transducer draft in meters, and n = the vertical resolution. For item developments, operational swath angle is reduced to θ = ¼ of the total swath angle to ensure least-depth determination by MBES near-nadir beams. Data are acquired using Hypack Hysweep. Hypack *.HSX data, when converted in Caris, cannot have Caris SVP files correctly applied to them. A.1.3 Leadline Leadlines are used for single beam and multibeam echosounder comparisons. Reports for the leadline comparisons are included in Appendix IV.
3

NOAA NRT5 DAPR 2009
A.2. Side Scanning Imagery Sonar A.2.1 L-3 Klein System 3000 The L-3 Klein System 3000 includes the Model 3210 towfish, 35m of Kevlar reinforced tow cable, the Transceiver and Processing Unit (TPU) with VX Works operating system, and a Klein PC workstation with SonarPro. The Model 3210 towfish (fig 3) operates at a nominal frequency of 500/100 kHz and has a vertical beam angle of 40 degrees. Klein TPU contains a network card for transmission of the sonar data to the Klein acquisition computer. The acquisition software (SonarPro) is capable of saving raw data in SDF and/or XTF format. Figure 2: Klein 3000 The SSS towfish is deployed from a davit arm located on starboard quarter using a Dayton electric-hydraulic winch spooled with approximately 30 meters of cable. Tow cable is lead from the winch upward along the davit arm. The tow cable at the winch is connected electro-mechanically to a deck cable through a slip ring assembly. Cable out is controlled manually and is computed by the DynaPro cable counter by the number of revolutions of the cable drum sheave. The cable counter data is inputted into the Hypack acquisition computer serially. The message is parsed over delph-serial connection from the Hypack to the Klein computer via an Ethernet cable and included in the raw data. Cable-out is adjusted to 2.0 meters before deployment of the towfish to account for the distance from the water surface to the wheel. To minimize towing gear stress, and reduce strumming, towed SSS operations are typically limited to approximately 6 knots speed-over-ground. Turns to port require the towfish be drawn in to prevent the tow cable from swinging into the outboard propellers.
4

NOAA NRT5 DAPR 2009
Line spacing for side scan sonar (SSS) operations is determined by range scale and the estimated position error (EPE). EPE is taken as 1.5mm at survey scale. For 200% coverage NRT5 uses the formula y=R-epe. A towfish altitude of 8-20% of the range scale is maintained during data acquisition. Altitude is adjusted by cable out, and vessel speed. Confidence checks are performed daily by observing changes in linear bottom features extending to the outer edges of the digital side scan image, features on the bottom in survey area, and by passing aids to navigation. Daily rub tests are also conducted. A.3 Vessel Position and Orientation Equipment A.3.1 Trimble DSM212L DGPS Receiver S3002 carries a Trimble DSM212L Differential GPS receiver. USCG beacons are used for horizontal position control. The DSM212L is an integrated 12-channel GPS receiver and dual-channel differential beacon receiver. The beacon receiver can simultaneously monitor two beacon stations if within broadcast range. Correctors are received from only one beacon station during data acquisition. Receiver parameters are configured using Trimble TSIPTalker and included; number of visible satellites (4 SV’s), positional dilution of precision (PDOP < 8), maximum pseudo range corrector age (#30 sec), and satellite elevation mask (8 deg). Receiver parameters and configuration are monitored throughout data acquisition. Position quality is monitored by the operator using the POS/MV v.4 controller software. The primary positional quality monitored is HDOP. Where HDOP exceeds 2.5, the data are examined during post-processing, and if necessary, positions interpolated or rejected. A.3.2 TSS POS/MV Position & Orientation Sensor An Applanix POS/MV 320 Version 4 is used to determine vessel position and orientation. NRT5 uses the POS/MV for both data acquisition purposes (bathymetry and imagery) and navigation purposes. Position accuracy and quality are monitored by the operator during data acquisition using the POS/MV Controller software to ensure compliance with NOS Hydrographic Surveys Specifications and Deliverables. The POS/MV combines GPS and Inertial Measurement Unit (IMU) sensor data into an integrated navigation solution. There are two navigation algorithm designs incorporated into the system. In the first algorithm the GPS receiver is strictly a sensor of the GPS observables, i.e. the navigation functions in the GPS receiver are not used. In the second algorithm, GPS position and velocity solution are processed to aid the inertial navigator. The system will automatically switch between the two algorithms to ensure appropriate performance. The POS/MV is capable of delivering data including: Geographic position (latitude, longitude and altitude), Heading, Attitude (roll and pitch), Vertical displacement (heave), Velocity, Acceleration, and Angular rate of turn Within the IMU are three solid-state linear accelerometers and three solid-state gyros arranged in a triaxial orthogonal array. This configuration allows for the accelerometers to sense acceleration in all three directions, and three gyros to sense angular motion around all three axes centered on the IMU. The POS Computer System (PCS) receives these measurements from the IMU and uses them to compute the measurements of motion. Pitch and roll measurements are computed by the IMU after sensor alignment and leveling. The IMU mathematically simulates a gimbaled gyro platform and applies the angular accelerations to this model to determine roll and pitch. Position and attitude
5

NOAA NRT5 DAPR 2009
data are logged in the raw data file during acquisition. True Heave is based on a two sided filter, making use of both past and present vertical motion data to compute a heave estimate. True heave is applied in post processing The PCS utilizes data from both the IMU and the two GPS receivers to compute a highly accurate vessel heading. The IMU determines heading during aggressive maneuvers and is not subject to short-period noise. However, IMU accuracy diminishes over time. The two GPS receivers allow the PCU to calculate vessel heading using carrier-phase differential position measurements. The PCU computes a vector between the two fixed antennas and provides azimuth data using the GPS Azimuth Measurement Subsystem (GAMS). GPS heading data is accurate over time, but is affected by short-period noise. Heading accuracy for the system is ±0.02°. In July the POS/MV IMU was moved to a position above the hull mounted MBES. IMU to sonar offsets were surveyed by NGS personnel in August (Appendix II). A.4. Shoreline - ENC Validation Equipment A.4.1 Trimble GPS Backpack NRT5 is equipped with a Trimble GPS backpack for shoreline and ENC validation. TerraSync software is used to process shoreline data (see sec A.5). The hardware components of the GPS backpack are detailed in figure 4. The data logger may contain a custom data dictionary that allows feature objects and their corresponding attribution to be collected using the IHO S57 standard A.4.2 Trimble GPS Handheld Unit NRT5 is equipped with a Trimble GPS handheld unit for shoreline and ENC validation. The data logger may contain a custom data dictionary that allows feature objects and their corresponding attribution to be collected using the IHO S57 standard.
6

NOAA NRT5 DAPR 2009
Figure 3 Hardware components of the Trimble GPS backpack.
A.5. Software Survey planning is done using Mapinfo. Mapinfo allows the user to import raster nautical charts (RNC) survey limits, pertinent AWOIS item positions and search radii, as well as allowing the user to create line plans that can be exported to Hypack format. Hypack Inc. Hypack MAX is used for vessel navigation and line tracking during acquisition of bathymetry and imagery data. All VBES and MBES data are acquired in Hypack *.hsx format for raw data files. MBES data are acquired via Hypack Hysweep. Vessel offset configurations, attitude data, and (with the exception of EM3002 data see A.1.2) sound speed profiles are applied during post-processing. Raw sound velocity data are processed using Velocwin, supplied by NOAA Hydrographic Systems and Technology Program (HSTP). Velocwin uses raw conductivity, temperature, and pressure measurements to create a sound velocity profile. All bathymetry and imagery data are processed using Caris HIPS & SIPS. Caris software applies vessel configurations, allows the user to apply tide, sound speed, and true heave corrections, calculates total propagated error (TPE), and allows the user to determine bias error values in calibration mode. Caris uses a combined uncertainty model to estimate a bathymetric surface and generate a digital terrain model (DTM) Imagery data are processed and examined using Caris HIPS & SIPS.
7

NOAA NRT5 DAPR 2009
Bathymetry data and imagery features are managed using Pydro. This program was created by the NOS Hydrographic Systems and Technology Programs N/CS11 (HSTP) using the Python 23 programming language to interface with the HIPS and SIPS data directly. Bathymetry data and imagery features can be exported from Pydro in MIF/MID (MapInfo Interchange) format, and imported into MapInfo TerraSync is the software utilized in mapping operations in support of Shoreline Verification, Detached Positions (DP’s), and Electronic Navigational Charts (ENC) data acquisition using a Trimble ProXRS backpack system and a data logger (TSCe). The ProXRS is capable of 30 – 50cm accuracy post processed. A complete list of software and versions is included in Appendix I.
8

NOAA NRT5 DAPR 2009
B. DATA PROCESSING AND QUALITY CONTROL B.1. Multibeam Echosounder Data Raw multibeam data are converted to HDCS format in Caris HIPS. Transformation parameters pertaining to the source of the attitude packet is stored in the log file located in line directory of the HIPS data. After conversion, True heave, and Tide corrections are applied to the dataset and Total Propagated Error (TPE) is calculated. TPE is calculated using the Caris implementation of the multibeam error model. A table of these values is provided in Appendix IV. Vessel heading, attitude, and navigation data are reviewed and edited in line mode. Fliers or gaps in heading, attitude, or navigation data were manually rejected or interpolated for small periods of time. Vessel static and Dynamic offsets are applied to the data during the conversion and post processing procedures. The dynamic draft for a vessel of this size is typically quite small (0.5-2cm). Nonetheless, NRT5 follows HSTP suggestions to maintain a consistent engine trim during survey operations. The trim indicator has been marked to insure the trim is set correctly for operations. After data conversion and application of correctors, all sounding data have estimates of uncertainty in three dimensions attached to them. Uncertainty associated with sensor data (Heave, Pitch, Roll, Position, Heading, Sound speed, and Tide) as well as uncertainties in static and dynamic offsets measurements are used to calculate the total uncertainty for each sounding. These uncertainty-attributed depth measurements are inputted into the Combined Uncertainty Bathymetry Estimator (CUBE) algorithm. The end result of which is a mathematical estimate of the bathymetric surface. The CUBE surface products are then used to evaluate MBES coverage, and to further check for systematic errors such as tide, sound velocity, or attitude and timing errors. The resolution chosen for finalized CUBE surfaces is 0.5m, as per recommendations by HSTP. Once the CUBE surface has been finalized, they are inserted into Pydro for feature evaluation. B.2. Single-Beam Echosounder Data VBES data are acquired concurrently with both MBES data and SSS data. In cases where VBES data are not the primary source of bathymetry, i.e. MBES data are also acquired; VBES data are used only for troubleshooting or confidence check purposes. In these cases, the raw VBES data are submitted for archival purposes only. These data should not be used in the creation of final hydrographic products. In cases where VBES data are the primary source of bathymetry VBES data are processed, passed through quality control, and submitted for the purposes of product creation. Following acquisition, single-beam echosounder data are converted from raw format to HDCS using Caris HIPS. Each line is viewed in Caris HIPS Single Beam Editor against the digital trace of the VBES data. Selected soundings are scanned for missed depths. Additional selected soundings are inserted where necessary to define peaks and abrupt changes in slope. After review and cleaning, Caris HIPS is used to merge depth, position and attitude data with sound velocity, tide, vessel offset, dynamic draft correctors and TPE values to compute the corrected depth and position of each sounding. All soundings are reviewed again in HIPS Subset Mode. Data are compared with adjacent lines and crosslines for systematic errors such as tide or sound velocity
9

NOAA NRT5 DAPR 2009
errors. Caris HIPS uncertainty weighted and/or swath angle grids are created for VBES data at 2m resolution. B.3. Side Scan Sonar Data Side scan sonar data are converted from *.SDF (SonarPro raw format) to SIPS format using Caris SIPS. Post-processing side scan data includes examining and editing fish height, vessel heading (gyro), and vessel navigation records. Towfish navigation is recalculated using Caris SIPS. Tow point measurements (J-arm and cable out), fish height, and depth are used to calculate horizontal layback. After towfish navigation is recalculated, side scan imagery data are slant-range corrected to 0.1m with beam pattern correction. The slant-range corrected side scan imagery data are closely examined for any targets. Targets are evaluated as potential contacts based on apparent shadow length and appearance; particularly targets which appear to be anthropogenic in origin. Contacts are selected and saved to a contact file for each line of SSS data. Contact selection includes measuring apparent height, selecting contact position, and creating a contact snapshot (*.tif) image. Targets are exported to the line file and inserted into Pydro for feature evaluation and correlation with associated bathymetry data.
10

NOAA NRT5 DAPR 2009
C. CORRECTIONS TO ECHO SOUNDINGS C.1. Sound Speed Speed of sound through water is determined by a minimum of one cast every four hours of MBES data acquired, in accordance with the Standing Letter Instructions and NOS Specifications and Deliverables for Hydrographic Surveys. S3002 is equipped with an Odom Digibar Pro surface sound velocity sensor to measure sound speed at the mutibeam transducer head. For water column sound speed profiles NRT5 uses an Odom DigibarPro CTD profiler. Raw conductivity, temperature, and pressure data are processed using Velocwin which generates sound velocity profiles for Caris HIPS (*.svp) and Kongsberg SIS (*.asvp). With the exception of Simrad EM3002 data, sound speed correctors are applied to bathymetry data in Caris HIPS during post processing. Calibration reports for the Odom Digibar profilers are included in Appendix IV. C.2. Vessel offsets and Dynamic Draft Corrections Sensor offsets are stored in the Caris HIPS Vessel Configuration File (NRT5_S3002_EM3000_MBES, NRT5_S3002_EM3002_MBES & NRT5_S3002_Echotrac_VBES) and are applied to MBES & VBES data in post-processing. Vessel offset measurements were made by National Geodetic Survey on S3002 in Norfolk, VA on February 17, 2004 (see Appendix II). Static IMU draft corrections for S3002 were measured 17 April 2009 (see results Appendix III). Dynamic draft measurements for S3002 were made on 13 April 2009 (see Appendix III). After hull modifications and the subsequent new placement of the MBES and IMU, new vessel offset measurements were made by National Geodetic Survey on S3002 in Newport, RI on 4 & 5 August, 2009 (see Appendix II). Static IMU draft corrections for S3002 were measured 12 August 2009 (see results Appendix III). Dynamic draft measurements for S3002 were made on 12 August 2009 (see Appendix III). The following table lists each Vessel Configuration File. Table 1: Vessel Configuration Files for data acquired prior to July 2009
S3002 Caris Vessel Configuration Files: 06 April 2007, DN 096
11

NOAA NRT5 DAPR 2009
Table 2: Vessel Configuration Files for data acquired after 18 August 2009 S3002 Caris Vessel Configuration Files: 18 August 2009 HVF Name Survey System _NRT5_S3002_EM3002_MBES Kongsberg Simrad EM3002 Multibeam Echosounder _NRT5_S3002_Echotrac_VBES Odom Echotrac CV‐200 Singlebeam Echosounder _NRT5_S3002_Klein3000_SSS Klein 3000 Side Scan Sonar High Frequency
C.3. Pitch, Roll, Azimuth and Navigation Timing Errors Static pitch, roll, azimuth and navigation latency biases for the Simrad EM3002 were determined during Patch Tests conducted on 14 April 2009 at Gravesend Bay Anchorage New York Harbor (See Appendix IV). C.4. Water Level Corrections Tide data are downloaded from the Center for Operational Oceanographic Products and Services (CO-OPS) website (http://tidesandcurrents.noaa.gov/olddata/) and applied via a zone definition file (*.zdf) provided by CO-OPS for each project. Approved final tides are applied by field personnel upon receipt.
12

NOAA NRT5 DAPR 2009
13
D. APPROVAL SHEET
Data Acquisition & Processing Report Navigation Response Team 5
For all Hydrographic Surveys & ENC Validation conducted during
Field Season 2009 As Chief of Party, I have ensured that standard field surveying and processing procedures were adhered to during this project in accordance with the most recent editions of; Hydrographic Manual, Hydrographic Survey Guidelines, Field Procedures Manual, and the NOS Hydrographic Surveys Specifications and Deliverables. I acknowledge that all of the information contained in this report is complete and accurate to the best of my knowledge.
Respectfully,
Matthew Jaskoski, LT/NOAA Team Lead NOAA NRT5

DAPR NOAA NRT-5 2007
19
APPENDIX I
HYDROGRAPHIC SYSTEMS INVENTORY

Field Unit: NRT-5Effective Date: 18-Apr-08Updated Through: 18-Apr-08
Vessel Name NOAA NRT 5
Hydrographic Vessel Inventory
SURVEY VESSELVessel Name NOAA NRT-5Hull Number S3002Call LettersManufacturer SeaArk Marine Inc., Portobello, ArkansasYear of Construction 2003Type of Construction AluminumType of Construction AluminumLength Overall 31' 8" / 9.65mBeam 8'6" / 2.58mIMU Draft 1' / 0.32m
17-Feb-05NGS
Date of Effective Full Vessel Static Offset SurveyOrganization which Conducted the Effective Full Offset Survey NGS
18-Apr-09 Base Surface
Additional Information
Organization which Conducted the Effective Full Offset SurveyDate of Last Partial Survey or Offset Verification & Methods UsedDate of Last Static Draft Determination & Method UsedDate of Last Settlement and Squat Measurements & Method Used

Field Unit: NRT-5Effective Date: 15-Apr-09Updated Through: 28-Apr-09
Equipment Type Manufacturer Model Serial Number Firmware and/or Software Version Version Install Date Date of last Calibration Date of last Service Additional Information
Multibeam Echosounder Kongsberg Simrad EM3002 563 Hypack 2008SIS (controller only) May-08 Apr-09 256 Beams
1.5° x 1.5° ResolutionSid S S Kl i S 3000 PU 1517 TPU 348 Fi h 457 S P 11 2 M 08 A 09
Hydrographic Hardware Inventory
SONAR & SOUNDING EQUIPMENT
Side Scan Sonar Klein System 3000 PU=1517, TPU=348, Fish=457 SonarPro 11.2 May-08 Apr-09
Vertical Beam Echosounder Odom Echotrac CV-200 23043 Odom Controller Hypack 2008 May-08 Apr-09
GPS Aided Inertial Naviation Applanix POS/MV 320 V4 2034, IMU=377Roll/Pitch Accuracy: 0.02°Heave Accuracy: the greater of 5cm or 5% for periods of 20s or less
DGPS Reciever Trimble DSM212L O220309909
POSITIONING & ATTITUDE EQUIPMENT
Sound Speed Profiler Odom Digibar Pro 98212 Jun-08Surface Sound Velocimeter Odom Digibar Pro 98214 Jun-08
Optical Level
Level Rod
TIDES & LEVELING EQUIPMENT
SOUND SPEED MEASUREMENT EQUIPMENT
GPS Backpack Trimble Pathfinder Pro XRS 224078542 ver 1.70 2005 N/A
HORIZONTAL AND VERTICAL CONTROL EQUIPMENT
OTHER EQUIPMENT

Field Unit: NRT-5Effective Date: 28-Mar-07Updated Through: 28-Apr-09
OCS-W-NSD-612984 OCS-NSD-613020 NRT5-Processing OCS-L-NRT354569 OCS-L-NRT755358 NRT5-1 Klein TPU Klein PC Trimble TSCe
Office Trailer Office Trailer Office Trailer Office Trailer Office Trailer S3002 S3002 S3002 Office Trailer
Dell Presision T3400 Dell Presision T3400 Dell Dimension 9150 Dell Latitude D600 Dell Latitude D820 Dell Optiplex GX270 Proprietary Proprietary TSCe Field Device
2008 2008 2006 2003 2006 2003 2005
N/A N/A N/A N/A N/A N/A N/A N/A N/A
Q 6700, 2.66 GHz Q 6700, 2.66 GHz P-Dual Core, 3.00 GHz P-M, 1.4GHz Centrino Duo, 2.16GHz P4, 2.8 GHz Proprietary Samsung 300MHz
RAM 4 GB 4 GB 2 GB 512 MB 2 GB 2.5 GB Proprietary 64 MB
Video Card mVidia Quatro FX1700 mVidia Quatro FX1700 nVidia GeForce FX6800 Mobility Radeon 9000 nVidia Quadro NVS 110M nVidia GeForce FX5200 N/A Proprietary
512 MB 512 MB 256 MB 32 MB 256 MB 128 MB N/A Proprietary
Upgrade Needed Upgrade Needed
Upgraded in Oct 2005, larger hard drive, increased
RAM.
SonarPro 11.2 x x
HYPACK 2008 & 2009 x
Kongsberg EM3002 SIS x
POS M/V Controller 3.3 x
TerraSync 2.41 x
CARIS HIPS & SIPS 6.1 CW9604114 CW9604216
Pydro 9.4 c3e32ff80a43aaed64 3b9bf48df4152bba7 d17ccf46575c3ffbe d1722f465023928ea cfaf908043099cd4d9 aef156660a9551026b
SeaTerm 1.3 x
Velocwin 8.92 Jun-08
GPS Pathfinder Office 3.10 011747-00300-07186 011747-00300-07186 011747-00300-07186 011747-00300-07186
Odom Digibar Pro Log 2.3 x
MapInfo 8.5 MIUWEU0850038761 MIUWEU0850038761 MIUWEU0850038761 MIUWEU0850038761 MIUWEU0850038761
OCS-W-NSD-612984 OCS-NSD-613020 NRT5-Process OCS-L-NRT354569 OCS-L-NRT755358 NRT5-1 Klein TPU Klein PC
Windows XP SP2 Jun-08 Feb-05 Jan-06 Nov-05 Dec-06 Feb-05
VX Works x
Windows 2000 x
Windows CE x
OCS-W-NSD-612984 OCS-NSD-613020 NRT5-Process OCS-L-NRT354569 OCS-L-NRT755358 NRT5-1 Klein TPU Klein PC
Hypack 2008 Jun-08 Jun-08
Hypack 2009 4/16/2009
Hydrographic Software Inventory
COMPUTERSMachine Name
Location
Make/Model
Date Purchased
Date of Last Rebuild
Processor, Speed
Video RAM
Comments
SOFTWARE LICENSESSoftware Package License Numbers
Acq
uisi
tion
Proc
essi
ngSu
ppor
t
OPERATING SYSTEM PACKAGE: Machine Name
Ope
ratin
g Sy
stem
Inst
alla
tions
& U
pdat
es (D
ate)
ACQUISITION SOFTWARE PACKAGE: HypackMachine Name
Softw
are
Inst
alla
tions
& U
pdat
es (d
ate)

OCS-W-NSD-612984 OCS-NSD-613020 NRT5-Process OCS-L-NRT354569 OCS-L-NRT755358 NRT5-1 Klein TPU Klein PC
SonarPro 11.2 Jun-08
OCS-W-NSD-612984 OCS-NSD-613020 NRT5-Process OCS-L-NRT354569 OCS-L-NRT755358 NRT5-1 Klein TPU Klein PC
Version 6.1 Jan-07 Jan-07 Jan-07 Jun-08 Jun-08
OCS-W-NSD-612984 OCS-NSD-613020 NRT5-Process OCS-L-NRT354569 OCS-L-NRT755358 NRT5-1 Klein TPU Klein PC
Version 9.4 Apr-09 Apr-09 Apr-09 Apr-09 Apr-09
OCS-W-NSD-612984 OCS-NSD-613020 NRT5-Process OCS-L-NRT354569 OCS-L-NRT755358 NRT5-1 Klein TPU Klein PC
Version 8.5 Install Jun-08 Feb-05 Feb-07 May-06 May-06
8.5.1B Update Jun-08 Jun-08 Mar-07 Jun-08
OCS-W-NSD-612984 OCS-NSD-613020 NRT5-Process OCS-L-NRT354569 OCS-L-NRT755358 NRT5-1 Klein TPU Klein PC
Office 2007 3/1/2009 3/1/2009 3/1/2009 12/4/2006 11/8/2006 2/5/2005
OCS-W-NSD-612984 OCS-NSD-613020 NRT5-Process OCS-L-NRT354569 OCS-L-NRT755358 NRT5-1 Klein TPU Klein PC
Version 6.0 3/1/2006 3/1/2006 3/1/2006 3/1/2006
Version 8.0 4/5/2007
ACQUISITION SOFTWARE PACKAGE: Klein SonarProMachine Name
Softw
are
Inst
alla
tions
& U
pdat
es (d
ate)
PROCESSING SOFTWARE PACKAGE: CARIS HIPS/SIPSMachine Name
Softw
are
Inst
alla
tions
& U
pdat
es (d
ate)
PROCESSING SOFTWARE PACKAGE: PydroMachine Name
Softw
are
Inst
alla
tions
& U
pdat
es (d
ate)
PROCESSING SOFTWARE PACKAGE: MapInfoMachine Name
SUPPORT SOFTWARE PACKAGE: Adobe Acrobat ProfessionalMachine Name
Softw
are
Inst
alla
tions
& U
pdat
es (d
ate)
Softw
are
Inst
alla
tions
& U
pdat
es (d
ate)
SUPPORT SOFTWARE PACKAGE: MS Office 2007Machine Name
Softw
are
Inst
alla
tions
& U
pdat
es (d
ate)

Field Unit: NRT-5Effective Date: 15-Apr-09Updated Through: 15-Apr-09
Name and Grade Current Position Years of Hydro Experience Notes
LT(jg) Matthew Jaskoski Team Lead 4.5
Name and Rate Current Position Years of Hydro Experience Notes
Bert Ho PST 4.5John Doroba PST 2.5
Name and Rate Current Position Years of Hydro Experience Notes & Dates Embarked
NOTES:
Hydrographic Personnel Roster
OFFICERS
SURVEY DEPARTMENT
ROTATING HYDROGRAPHERS & VISITORS (involved in survey work)

DAPR NOAA NRT-5 2007
20
APPENDIX II
VESSEL STATIC OFFSETS
POS MV v 4 0 (205 156 4 3) (255 255 255 000)
1 2 NOAA NRT5 S3002WIRING DIAGRAM
2009-04 - MJJ
1.543m 9600,1Hz,N,8,1,Enabled
DGPS
Com 5 [9600,8,1,N,N] (NMEA OUT)Com 4 [9600,8,1,N,N] (DGPS IN) Com 3 [9600,8,1,N,N] (PPS OUT)
Com 2 [19200,8,1,N,N] TSS 1000 Tate-Bryant
Com 1 [9600,8,1,N,N] (NMEA OUT)
POS MV v 4.0 (205.156.4.3) (255.255.255.000)
Trimble DGPS DSM212L
RTCM Message
DGPS ANT
LAN100B-T (POS Network)
( )
SIMRAD EM3002 (157.237.2.61)
Com 1 (9600, 8,1,N,GGA,ZDA,HDT) Position
PPS
(Com 1 PPS-IN)
NRT5_1(205.156.4.1)
Sonar Head 1( , , , , , , )
Com 2 (19200, 8,1,N,N) IMU/HeadingPPS-IN (Coaxial)Ethernet1 10B-T
Klein Switch 10/100
Com 4 (Port 1)(open)
Com 3 (Port 0)(open)
(Com 1 PPS IN)
Digibar Pro CTD
SeaBird CTDUDP 16163
UD
Klein TPU (192 168 0 81)
Klein Switch 10/100
Com 7 (Port 4)(DGPS Kinematic IN)
Com 6 (Port3)(Garmin IN)
Com 5 (Port 2)(CTD IN)
Echotrac CV 100B-T (Remote host 205.156.4.1)
Cable Counter
Garmin FishFinder
DP
5602
UDP 1600
Klein TPU (192.168.0.81)
Com 1 (9600)Com 2 (4800,GGA,VTG) NEMA 0183 IN
LAN (10B-T)
HYPACKSwitch 10/100
r Pro
Hea
d V
S IN
PU
TCom 9 (Port 6)(Hypack Delpth OUT)
9600, 8, 1, N, N
Com 8 (Port 5)(MBES SSVS IN)
2400,7,1,N,NTowfish In (Coaxial)
Klein PC (192.168.0.82 169.254.33.87)
Com 1 (9600) Hyperterminal & SonarProCom 2 (Delph,9600,8,1,N,N)
LAN 100B-T
Dig
ibar
SS
VCom 10 (Port 7)Open/spare
LANUDP 100B-T

US DEPARTMENT OF COMMERCE NATIONAL OCEANIC & ATMOSPHERIC
ADMINISTRATION NATIONAL OCEAN SERVICE
NATIONAL GEODETIC SURVEY GEODETIC SERVICES DIVISION
INSTRUMENTATION & METHODOLOGIES BRANCH
NOAA BOAT S 3002 POS MV COMPONENTS SPATIAL RELATIONSHIP SURVEY
FIELD REPORT
Kendall L. Fancher February 17, 2005

NOAA BOAT S 3002 POS MV COMPONENTS SPATIAL RELATIONSHIP SURVEY PURPOSE The primary purpose of the survey was to accurately determine the spatial relationship of various components of a POS MV navigation system aboard the NOAA boat SS 3002. Additionally, various reference points (bench marks) and a GPS antenna used for navigation were established onboard the vessel to aid in future spatial surveys aboard the boat. PROJECT DETAILS This survey was conducted at the I & M Branch facility in Corbin, VA on the 16th of February. The weather was unusually mild with a steady breeze. INSTRUMENTATION The Leica (Wild) TC2002 precision total station was used to make all measurements.
Technical Data: Angle Measurement Resolution 0.03 seconds Smallest unit in display 0.1 seconds Standard Deviation Horizontal angle 0.5 seconds Vertical angle 0.5 seconds Distance measurement 1mm + 1ppm A standard “peanut” prism was used as a sighting target. This prism was configured to have a zero mm offset. PERSONNEL Kendall Fancher NOAA/NOS/NGS/GSD/I&M BRANCH (540) 373-1243 Steve Breidenbach NOAA/NOS/NGS/GSD/I&M BRANCH (540) 373-1243

NOAA BOAT S 3002 POS MV COMPONENTS SPATIAL RELATIONSHIP SURVEY ESTABLISHING THE REFERENCE FRAME A primary reference point, CL1, was set on the centerline of the boat and near the physical center of the boat. To conduct this survey a local coordinate reference frame was established where the X axis runs along the centerline of the boat and is positive from the primary reference point towards the bow of the boat. The Y axis is perpendicular to the centerline of the boat (X axis) and is positive from the primary reference point towards the right, when looking at the boat from the stern. The Z axis is positive in an upward direction from the primary reference point. In this reference frame CL1, the primary reference point, has the following coordinates; X = 0.000(m) Y = 0.000(m) Z = 0.000(m) A secondary reference point (CL2) was set on the centerline of the boat, near the stern. The Y value of the secondary reference point was assumed to be zero. Determination of the X value for CL2 was accomplished by measuring the horizontal distance from CL1. Determination of the Z value for CL2 was accomplished by trigonometric leveling from CL1. The determined coordinates for CL2 are; X = -3.115(m) Y = 0.000(m) Z = -0.008 (m) ESTABLISHING ALL OTHER POINTS While occupying CL1, a bearing of 180.0000 was input into the instrument and CL2 was input for initialization. After initialization was conducted, angular and distance measurements were taken to establish the following points; BM2 and TP1. TP1 is a temporary point set off of the boat. The established coordinates for TP1 were then stored internally in the instrument. While occupying TP1, the previously determined bearing to CL1 was recalled and initialization was conducted to CL1. After initialization was conducted, angular and distance measurements were taken to establish the following points; IMU, BM4, BM3, GPS, L1, L2, and TP2. TP2 is a temporary point set off of the boat. The established coordinates for TP2 were then stored internally in the instrument. During these observations, coordinate checks were made to the following previously established points; BM2 X = 0.001(m) Y = 0.003(m) Z = 0.007(m)

NOAA BOAT S 3002 POS MV COMPONENTS SPATIAL RELATIONSHIP SURVEY CL2 X = 0.005(m) Y = 0.000(m) Z = 0.005(m) While occupying TP02, the previously determined bearing to TP01 was recalled and initialization was conducted to TP01. After initialization was conducted, angular and distance measurements were taken to establish the following points; BM1, MB1, SB, and TP3. TP3 is a temporary point set off of the boat. The established coordinates for TP3 were then stored internally in the instrument. During these observations, coordinate checks were made to the following previously determined points; CL1 X = -0.002(m) Y = -0.003(m) Z = 0.013(m) IMU X = 0.006(m) Y = -0.010(m) Z = 0.003 (m) CL2 X = 0.001(m) Y = 0.003(m) Z = 0.007(m) BM3 X = -0.002(m) Y = -0.004(m) Z = 0.000(m) BM2 X = 0.003(m) Y = -0.005(m) Z = 0.003 (m) GPS X = 0.003(m) Y = -0.005(m) Z = 0.003(m)

NOAA BOAT S 3002 POS MV COMPONENTS SPATIAL RELATIONSHIP SURVEY L1 X = 0.003(m) Y = -0.004(m) Z = 0.003(m) While occupying TP3, the previously determined bearing to TP2 was recalled and initialization was conducted to TP2. After initialization was conducted, angular and distance measurements were taken to establish the following points; BM1, MB1, SB, MB2, and MB3. During these observations, coordinate checks were made to the following previously determined points; CL1 X = -0.002(m) Y = 0.002(m) Z = 0.013(m) IMU X = -0.004(m) Y = 0.000(m) Z = 0.005(m) CL2 X = 0.008(m) Y = -0.008(m) Z = 0.002(m) BM3 X = -0.002(m) Y = 0.000(m) Z = 0.005(m) GPS X = 0.005(m) Y = 0.006(m) Z = 0.003(m) L1 X = 0.001(m) Y = -0.003(m) Z = 0.004(m)
NOAA BOAT S 3002 POS MV COMPONENTS SPATIAL RELATIONSHIP SURVEY L2 X = -0.004(m) Y = -0.002(m) Z = 0.001 (m) BM1 X = -0.001(m) Y = 0.000(m) Z = 0.003(m) MB1 X = 0.003(m) Y = -0.001(m) Z = 0.002(m) TP1 X = 0.000(m) Y = 0.000(m) Z = 0.007(m) Points MB2 and MB3 were established for the purpose of determining a length for the Mulitbeam Sensor arm. A plumb bob was used to project the top center of the arm onto the deck. A plumb bob was also used to project the center of the bottom of the Multibeam Sensor can onto the deck. An inverse was computed between these two surveyed positions for a length value of 1.544(m). DISCUSSION All sensor/benchmark coordinates are contained in spreadsheet “S3002.xls. Included in this spreadsheet is the Multibeam Sensor arm length measurement and also an IMU GPS antenna separation value. The positions given for all GPS antenna are to the top center of the antenna. To correct the Z value contained in the spreadsheet for each antenna to the electronic phase center, I recommend the following steps be taken;
1) Measure the total height of each antenna type. This information is probably located on the antenna or with equipment documentation.
2) Investigate to find the electronic phase center offset of the antenna. This information is probably located on the antenna or with equipment documentation. This value may also be available at the NGS website for antenna modeling.
3) Subtract the total height of the antenna from the spreadsheet Z value for each antenna. This will give you a Z value for the antenna ARP (antenna reference point)
4) Then add to this value the electronic phase center offset value.

APPENDIX II NOAA NRT-5 2009 DAPR
S3002 BOAT SHAPE CHARACTERISTICS Boat shape characteristics for the Caris HVF were updated using both the final line drawings provided by SeaArk Marine Inc., and measurements taken by NRT-5 personnel.
Caris Offsets for sonar transducers.

APPENDIX II NOAA NRT-5 2009 DAPR
S3002 Caris HVF Transducer Offsets: Object x y z IMU 0.000 0.000 0.000 Odom Echotrac VBES -0.276 0.400 0.255 Simrad EM3000 MBES 1.174 2.600 1.340 Klein 3000 SSS 1.535 -3.031 -2.310

DAPR NOAA NRT-5 2007
21
APPENDIX III
VESSEL DYNAMIC OFFSETS

APPENDIX III NOAA NRT-5 2009 DAPR
- 1 -
S3002 Dynamic Draft Test 13 April 2009
LT(jg) Matthew Jaskoski
Background: NRT-5 is capable of acquiring both bathymetry data and side scan sonar imagery. Accuracy in data processing is in part dependent on the determination of the change in vessel draft in relation to vessel speed through the water. This test empirically determines the dynamic draft of S3002 using the multibeam echosounder method.
Location, Date, and Personnel: Sonar data were acquired at Gravesend Bay, New York Harbor, NY (Figure 1) on April 13 2009 (DN 103) by LT(jg) Matthew Jaskoski (OIC), PST Bert Ho (data recorder), and PST John Doroba (launch coxswain).
Figure 1: Work Site

APPENDIX III NOAA NRT-5 2009 DAPR
- 2 -
Equipment: TSS POS/MV version 4 + Precise Timing Aero Antenna DSM 212L DGPS receiver Kongsberg Simrad EM 3002 Odom Digibar Pro Sound Velocimeter
Procedure: Data Acquisition: Data were acquired over a flat relatively shallow area (appx. 8m water depth) of the Gravesend Bay anchorage. The survey area is located as close as is practicable to the Battery Park Harmonic water level station. The survey time was planned to coincide as closely as practicable to slack water. To account for any current S3002 made repeated passes at various speed intervals over the survey line in both directions. The survey line was approximately 1000m in length, however due to a barge anchoring on the northern end of the survey line during data acquisition, dead in the water (DIW) data were acquired at positions 250m, 375m and 500m along the line instead of the usual 250m, 500m and 750m positions. A sound velocity cast was taken near the survey area and applied in SIS during data acquisition. Data Processing: Data were converted and processed in accordance with established protocols with the following exceptions; 1) True heave was not applied as long period heave may bias dynamic draft calculations – random short period heave will be canceled out by using the median reference surface depth, and 2) a dummy dynamic draft table was created in the HVF to ensure that historic dynamic draft measurements would not be applied to the dataset. Subsets were cleaned of fliers and Uncertainly weighted surfaces were generated at 0.50m resolution. Surfaces were queried for depth and standard deviation these values were entered into an Excel spreadsheet where the median was calculated for depth and the mean was calculated for standard deviation. Vessel speed was queried in the subsets, entered in the Excel spread sheet and averaged for all subsets. The dynamic draft offset was calculated for each reference area by subtracting the median reference surface depth from median depths for each RPM/speed interval. The mean dynamic draft was calculated by averaging the median values for the subsets at ¼ and ¾ the length of the line (subsets A and C). These values are tabulated below.

APPENDIX III NOAA NRT-5 2009 DAPR
- 3 -
Table 1: Dynamic Draft Offset Data
Figure 2: Dynamic Draft Offset Data
S3002 Dynamic Draft: 13 April 2009, DN 103 RPM Speed (kts) Median A (m) Median B (m) Median C (m) Std. Dev. Mean (m) Idle 0.00 0.00 0.00 0.00 0.05 0.00 900 (1 engine) 2.07 -0.06 -0.03 -0.04 0.04 -0.05 900 ( both engines) 3.40 -0.06 -0.02 -0.02 0.04 -0.04 2000 (Both) 6.50 -0.05 -0.03 -0.03 0.04 -0.04 2200 (Both) 6.55 -0.04 -0.03 -0.01 0.04 -0.03
APPENDIX III NOAA NRT-5 2009 DAPR
- 4 -
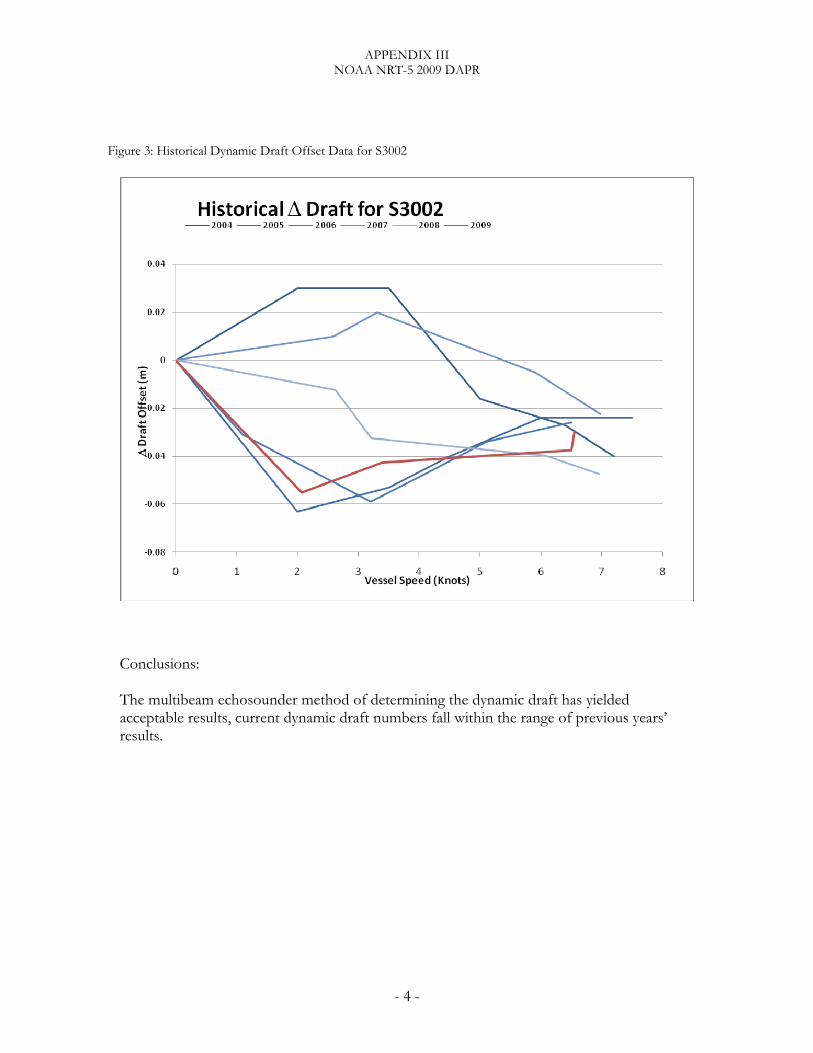
Figure 3: Historical Dynamic Draft Offset Data for S3002
Conclusions: The multibeam echosounder method of determining the dynamic draft has yielded acceptable results, current dynamic draft numbers fall within the range of previous years’ results.
APPENDIX III NOAA NRT-5 2009 DAPR
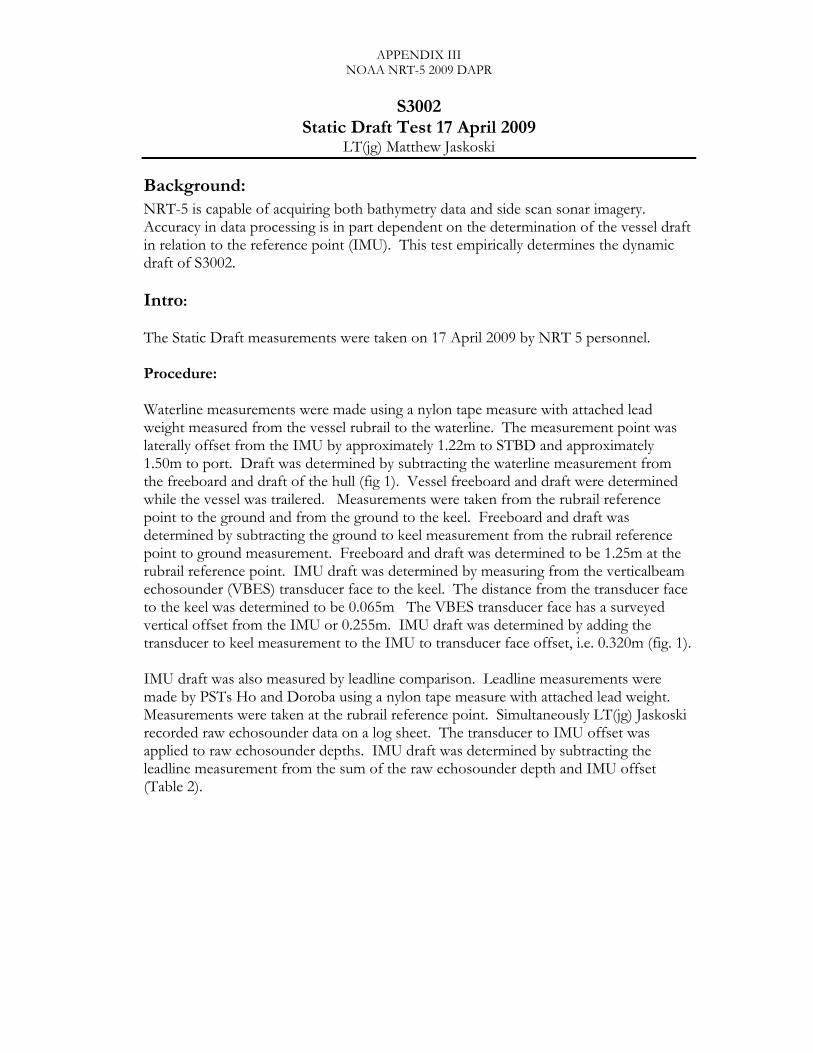
S3002
Static Draft Test 17 April 2009 LT(jg) Matthew Jaskoski
Background: NRT-5 is capable of acquiring both bathymetry data and side scan sonar imagery. Accuracy in data processing is in part dependent on the determination of the vessel draft in relation to the reference point (IMU). This test empirically determines the dynamic draft of S3002. Intro: The Static Draft measurements were taken on 17 April 2009 by NRT 5 personnel. Procedure: Waterline measurements were made using a nylon tape measure with attached lead weight measured from the vessel rubrail to the waterline. The measurement point was laterally offset from the IMU by approximately 1.22m to STBD and approximately 1.50m to port. Draft was determined by subtracting the waterline measurement from the freeboard and draft of the hull (fig 1). Vessel freeboard and draft were determined while the vessel was trailered. Measurements were taken from the rubrail reference point to the ground and from the ground to the keel. Freeboard and draft was determined by subtracting the ground to keel measurement from the rubrail reference point to ground measurement. Freeboard and draft was determined to be 1.25m at the rubrail reference point. IMU draft was determined by measuring from the verticalbeam echosounder (VBES) transducer face to the keel. The distance from the transducer face to the keel was determined to be 0.065m The VBES transducer face has a surveyed vertical offset from the IMU or 0.255m. IMU draft was determined by adding the transducer to keel measurement to the IMU to transducer face offset, i.e. 0.320m (fig. 1). IMU draft was also measured by leadline comparison. Leadline measurements were made by PSTs Ho and Doroba using a nylon tape measure with attached lead weight. Measurements were taken at the rubrail reference point. Simultaneously LT(jg) Jaskoski recorded raw echosounder data on a log sheet. The transducer to IMU offset was applied to raw echosounder depths. IMU draft was determined by subtracting the leadline measurement from the sum of the raw echosounder depth and IMU offset (Table 2).

APPENDIX III NOAA NRT-5 2009 DAPR
Figure 1. Vessel freeboard and IMU Draft
Results: Static draft offset was calculated at -0.19m. Table 1 Calculation of Static Draft offset using tape measure
S3002 Static Draft WL measurement Side Draft (1.25-WL) Offset to IMU (0.32-D)
0.75 STBD 0.55 -0.23 0.76 STBD 0.49 -0.17 0.76 STBD 0.49 -0.17 0.73 Port 0.52 -0.2 0.73 Port 0.52 -0.2 0.74 Port 0.51 -0.19
Offset -0.19 Table 2 Calculation of Static Draft offset check using VBES and Leadline
S3002 SingleBeam Leadline Check A= B= C= D=B-(A+C)
Raw VBES Depth Leadline Reading Draft Draft ES Type Txdcr to Bottom WL to Bottom IMU to Txdcr IMU to WL
Echotrac CV 2.39 2.795 0.255 0.150 Echotrac CV 2.36 2.79 0.255 0.175 Echotrac CV 2.35 2.79 0.255 0.185
Offset 0.17
The mean value of both these methods agree to within 2cm.

APPENDIX III NOAA NRT-5 2009 DAPR
Conclusions: Due to making several measurements - both from the reference point and to the waterline - draft determination using this method is subject to multiple points of potential error. A better method of draft determination would be to use a bubble tube. However, S3002 is not equipped with a bubble tube. This method of determining IMU draft has yielded acceptable results.

DAPR NOAA NRT-5 2007
22
APPENDIX IV
CALIBRATION

Field Unit:
POS/MV Calibration ReportNRT-5
Vessel:
Date: 4/13/2009 Dn: 103
Personnel:
PCS Serial # 2034
SYSTEM INFORMATIONS3002
Jaskoski, Ho, Doroba
IP Address:
POS controller Version (Use Menu Help > About) 3.3
POS Version (Use Menu View > Statistics) MV320 Ver4GPS Receivers
Primary ReceiverSecondary Receiver
SGN 99330009SGN 98370085
205.156.4.3
y
Location: D M SApproximate Position: Lat 40 35 51
Lon 74 1 51DGPS Beacon Station:Frequency: 286 kHZ
CALIBRATION AREAGravesend Bay, NY
Sandy Hook
Satellite ConstellationPrimary GPS (Port Antenna)
HDOP: 0.856VDOP: 1.317
Sattelites in Use: 122,4,7,8,10,15,21,24,26,27,29,30
PDOP 2.030 (Use View> GAMS Solution)
Note: Secondary GPS satellite constellation and number of satellites were exactly the same as the Primary GPS

SettingsG P t S t (U S tti > I t ll ti > GAMS I t ll ti )
POS/MV CONFIGURATION
Gams Parameter Setup (Use Settings > Installation > GAMS Intallation)User Entries, Pre-Calibration Baseline Vector
1.542 Two Antenna Separation (m) -0.024 X Component (m)0.50 Heading Calibration Threshold 1.542 YComponent (m)
0 Heading Correction -0.006 Z Component (m)
Configuration Notes:
Calibration Procedure:
Start time: 13:24 UTCEnd time: 13:27 UTCH di hi d f lib ti 0 024
POS/MV CALIBRATION
(Refer to POS MV V3 Installation and Operation Guide, 4-25)
Heading accuracy achieved for calibration: 0.024
Calibration Results:Gams Parameter Setup (Use Settings > Installation > GAMS Intallation)
POS/MV Post-Calibration Values Baseline Vector1.543 Two Antenna Separation (m) -0.022 X Component (m)0.500 Heading Calibration Threshold 1.543 YComponent (m)
0 Heading Correction -0.007 Z Component (m)0 Heading Correction 0.007 Z Component (m)
YY
GAMS Status Online?Save Settings?
Calibration Notes:
Save POS Settings on PC (Use File > Store POS Settings on PC)File Name:
The POS/MV uses a Right-Hand Orthogonal Reference SystemThe right-hand orthogonal system defines the following:• The x-axis is in the fore-aft direction in the appropriate reference frame.
The a is is perpendic lar to the a is and points to ards the
20090413
GENERAL GUIDANCE
• The y-axis is perpendicular to the x-axis and points towards theright (starboard) side in the appropriate reference frame.
• The z-axis points downwards in the appropriate reference frame.
The POS/MV uses a Tate-Bryant Rotation SequenceApply the rotation in the following order to bring the two frames of reference
into complete alignment:a) Heading rotation - apply a right-hand screw rotation θz about the
z-axis to align one frame with the other.b) Pitch rotation - apply a right-hand screw rotation θy about the
once-rotated y-axis to align one frame with the other.once rotated y axis to align one frame with the other.c) Roll rotation - apply a right-hand screw rotation θx about the
twice-rotated x-axis to align one frame with the other.

SETTINGS (insert screen grabs)Input/Output Ports (Use Settings > Input/Output Ports)
NOTE: COM3 and Analog are not used.

Heave Filter (Use Settings > Heave) Events (Use Settings > Events)
Time Sync (Use Settings > Time Sync)
Installation (Use Settings > Installation)

Tags, Multipath and Auto Start (Use Settings > Installation > Tags, Multipath and Auto Start)
Sensor Mounting (Use Settings > Installation > Sensor Mounting)

User Parameter Accuracy (Use Settings > Installation > User Accuracy)
Frame Control (Use Tools > Config)
Primary GPS Receiver
GPS Receiver Configuration (Use Settings> Installation> GPS Receiver Configuration)
Secondary GPS Receiver


APPENDIX IV NOAA NRT-5 2009 DAPR
S3002
Leadline Comparison 17 April 2009 LT(jg) Matthew Jaskoski
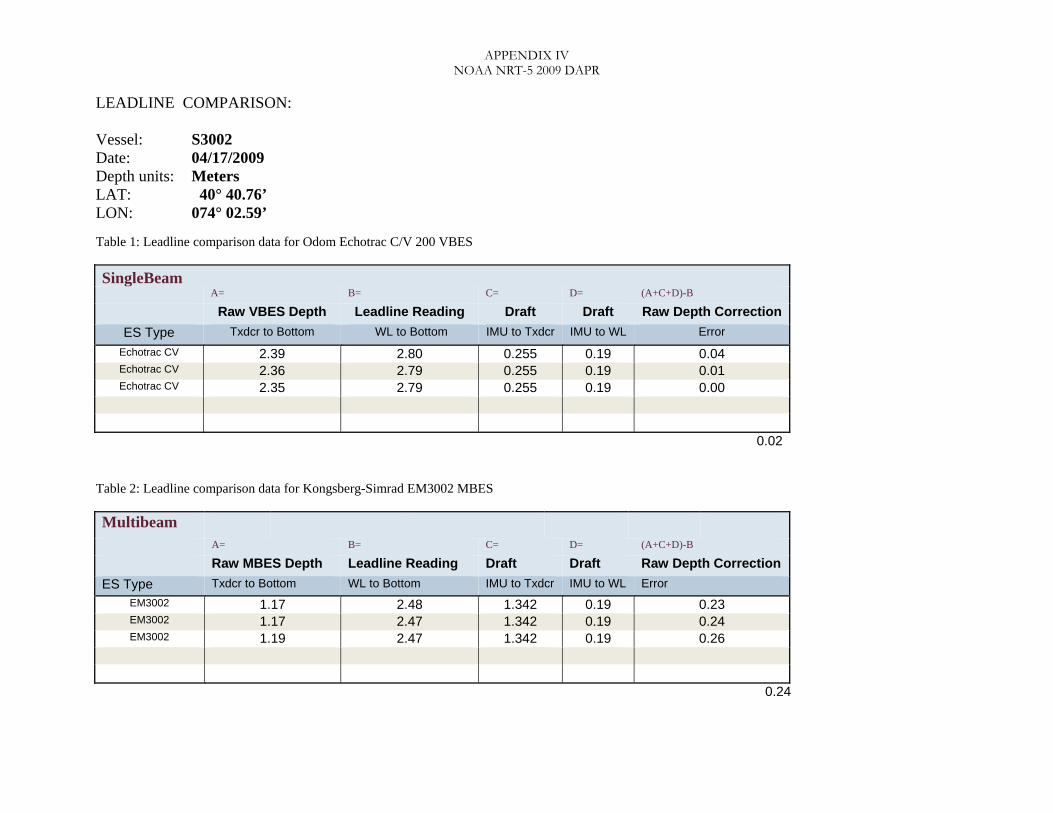
Background: NRT-5 is capable of acquiring both bathymetry data and side scan sonar imagery. Accuracy in echosounder data is in part determined by a comparison of echosounder depth measurements to leadline measurements taken in relation to the reference point (IMU). This test empirically compares leadline depth to transducer depth measurements for S3002. Intro: The Leadline comparison for both singlebeam echosounder (VBES) and multibeam echosounder (MBES) was conducted on 17 April 2009 by NRT 5 personnel PSTs Bert Ho, John Doroba and LT(jg) Matthew Jaskoski. Results of these comparisons are tabulated in Table 1 and Table 2 respectively. Procedure: Leadline measurements were made by PSTs Ho and Doroba using a nylon tape measure with attached lead weight. Measurements were taken at the waterline. The measurement point was laterally offset from the IMU by approximately 1.22m to STBD and approximately 1.50m to port. Simultaneously LT(jg) Jaskoski recorded raw echosounder nadir beam data on a log sheet. Transducer and IMU draft measurements were applied to raw echosounder depths. Transducer error was then determined by subtracting the transducer readings from the leadline measurement (see Tables 1 & 2). Leadline measurements taken off port side were compared to VBES data, leadline measurements take off starboard side were compared to MBES data. Results: The average error for VBES depth was 0.02m; meaning vertical beam depth was on average 0.2cm deeper than leadline measurements. Similarly, average MBES depth was 0.24m or 24cm deeper than leadline depth. Both of these differences are within IHO order 1 allowable sounding error. Conclusions: Due to taking measurements at the IMU reference point there is potentially a bathymetric difference beneath the MBES transducer head that could account for differences in the MBES to leadline measurement. However, the leadline comparison has yielded acceptable results.
APPENDIX IV NOAA NRT-5 2009 DAPR
LEADLINE COMPARISON: Vessel: S3002 Date: 04/17/2009 Depth units: Meters LAT: 40° 40.76’ LON: 074° 02.59’ Table 1: Leadline comparison data for Odom Echotrac C/V 200 VBES
SingleBeam A= B= C= D= (A+C+D)-B
Raw VBES Depth Leadline Reading Draft Draft Raw Depth CorrectionES Type Txdcr to Bottom WL to Bottom IMU to Txdcr IMU to WL Error
Echotrac CV 2.39 2.80 0.255 0.19 0.04 Echotrac CV 2.36 2.79 0.255 0.19 0.01 Echotrac CV 2.35 2.79 0.255 0.19 0.00
0.02 Table 2: Leadline comparison data for Kongsberg-Simrad EM3002 MBES Multibeam
A= B= C= D= (A+C+D)-B
Raw MBES Depth Leadline Reading Draft Draft Raw Depth Correction ES Type Txdcr to Bottom WL to Bottom IMU to Txdcr IMU to WL Error
EM3002 1.17 2.48 1.342 0.19 0.23 EM3002 1.17 2.47 1.342 0.19 0.24 EM3002 1.19 2.47 1.342 0.19 0.26
0.24

APPENDIX IV NOAA NRT-5 2009 DAPR
- 1 -
S3002 MBES Patch Test 14 April 2009
LT(jg) Matthew Jaskoski
Background: NRT-5 is capable of acquiring both bathymetry data and side scan sonar imagery. Multibeam bathymetry data are acquired using a pole mounted Kongsberg Simrad EM 3002 Shallow-Water Multibeam echosounder (MBES). Accuracy in data processing is in part dependent on the determination of the dynamic offsets (Navigation timing error, & Pitch, Roll and Heading biases) of the MBES transducer head. This test empirically determines the dynamic offsets of the EM 3002 MBES.
Location, Date, and Personnel: Sonar data were acquired at Gravesend Bay, New York Harbor, NY (Figure 1) on April 14 2009 (DN 104) by LT(jg) Matthew Jaskoski , PST Bert Ho, and PST John Doroba.
Figure 1: Patch Test Work Site

APPENDIX IV NOAA NRT-5 2009 DAPR
- 2 -
Equipment: TSS POS/MV version 4 + Precise Timing Aero Antenna DSM 212L DGPS receiver Kongsberg Simrad EM 3002 Odom Digibar Pro Sound Velocimeter
Procedure: Data Acquisition: Navigation Time: Data were acquired over a sloped area (approximately 30m to 10m water depth) of the Gravesend Bay anchorage. A second set of lines were run over a conspicuous obstruction near the anchorage. The survey area is located as close as is practicable to the Sandy Hook, NJ Harmonic water level station. The survey time was planned to coincide as closely as practicable to slack water. The lines over the sloped area were approximately 600m in length. Both sets of the coincident lines were run at differing speeds of approximately 2 knots and 7 knots respectively. The lines over the conspicuous object were approximately 250m in length. Both sets of the coincident lines were run at differing speeds of approximately 2 knots and 6 knots respectively. A sound velocity cast was taken near the survey area. Pitch: Data were acquired over a sloped area (approximately 30m to 10m water depth) of the Gravesend Bay anchorage. The survey area is located as close as is practicable to the Sandy Hook, NJ Harmonic water level station. The survey time was planned to coincide as closely as practicable to slack water. The line was approximately 600m in length. The lines were run at a survey speeds of approximately 2 and 6 knots. A sound velocity cast was taken near the survey area. Roll: Data were acquired over two flat areas (approximately 15m and 25m water depth) of the Gravesend Bay anchorage. The survey area is located as close as is practicable to the Sandy Hook, NJ Harmonic water level station. The survey time was planned to coincide as closely as practicable to slack water. The survey lines were approximately 300m and 500m in length respectively. The reciprocal lines were run at survey speed of approximately 6-7 knots. A sound velocity cast was taken near the survey area. Yaw: Data were acquired over a conspicuous obstruction near the Gravesend Bay Anchorage in approximately 25m water depth. One pair of adjacent lines were run in reciprocal direction at a survey speed of approximately 6-7 knots. A sound velocity cast was taken near the survey area.

APPENDIX IV NOAA NRT-5 2009 DAPR
- 3 -
Data Processing: Data were converted and processed in accordance with established protocols; observed tide, true heave and sound speed correctors were applied. Data were analyzed using Caris HIPS 6.1 calibration tool. Calibration methods followed those detailed in the Caris HIPS Operator manual Ch. 21 Calibration. The offset values for error/bias were determined in the following order: Timing, Pitch, Roll and Yaw. For the first scan multiple evaluations were made at various points on each line, and the mean for each offset was then calculated. Offset values were then scanned a second time by a second party in the same fashion the mean for each offset was again calculated. For each offset the mean of the two scans was calculated and taken as the offset value. Offset values were then entered into the HVF. The first scan was performed by PST Doroba; the second scan was performed by LT(jg) Jaskoski. The offset values are tabulated below. Table 1: MBES Dynamic Offset Data
S3002 EM3002 Patch Test Results Error/Bias Offset value Navigation Timing Error: 0.042 Pitch bias: -7.587 Roll bias: 1.708 Yaw/Az/Heading bias: 2.140
Discussion: The patch test has yielded acceptable results. Current offset data were generally in agreement with previous offset data.

APPENDIX IV NOAA NRT-5 2009 DAPR
S3002
Klein 3000 Side Scan Sonar (SSS) Positioning Certification 16 April 2009
LT(jg) Matthew Jaskoski
Daily confidence checks are conducted by observing side scan imagery in the vicinity of known contacts such as buoy blocks or charted wrecks at the dual operating frequencies of 100/500 kHz along with daily rub tests to confirm proper towfish operation. Imagery is considered satisfactory if the selected contacts are distinguishable throughout the entire range of the side scan record. Prcedure: A SSS positioning certification was performed on April 16, 2009 within Gravesend Bay Anchorage. (A deep-water vessel anchorage located in the lower bay of New York Harbor located south of the Verrazano Narrows). The evaluation reflected the parameters typically used for normal survey operations. Line plans were drawn with opposing azimuths to expose port and starboard side transducers and were also drawn to scales of 15, 50, and 85% of range scale across a 75-meter range scale. A targeted contact was selected using existing multi-beam data to ensure a higher confidence in the positional accuracy of the object. For this evaluation an abandoned buoy sinker located near a charted wreck in the southern region of the anchorage was chosen. The center of the buoy sinker was chosen for all contacts and for the MBES sounding position data. This evaluation was conducted under guidance of the Field Procedures Manual section 1.5.7.1.2 Results: The most reliable and accurate passes were used toward calculation with the “Calculate Statistics” tool of MapInfo. A total of 10 contact positions were evaluated. The evaluation results (Figure 1) produced a standard deviation of 1.66 at an approximate 95% confidence level (a standard z-score is typically 1.96 at a 95% confidence level). The dispersion from the mean (Variance) was approximately 2.78 meters with the maximum value from the target of 5.96 meters. In addition 9 contacts were within 2m of the MBES position and of those 9, 5 contacts were within 1m of the MBES position. The results of the evaluation meet the FPM 1.5.7 ten-meter accuracy requirement.

APPENDIX IV NOAA NRT-5 2009 DAPR
Figure 1 Plot of contact results minimum range 0.013m to 5.960m

APPENDIX IV NOAA NRT-5 2009 DAPR
NRT-5
Horizontal Quality Control 9 April 2009 PST Bert Ho
Horizontal Quality Control Horizontal accuracy was determined using Post Processed Differential GPS (DGPS) techniques. DGPS performance checks were conducted in accordance with the Field Procedures Manual (FPM) Section 3.4.3 (Horizontal & Vertical Control) by comparing the position of the GPS receiver to a survey mark (First Order Horizontal). These techniques utilized the United States Coast Guard DGPS nationwide radio beacon network, a surveyor’s tripod, and an optically centered/leveled tribrach and tribrach adapter mounted ProXRS antenna. Trimble ProXRS GPS Control On April 7, 2009, an evaluation of the Trimble ProXRS was conducted on a known NGS benchmark labeled “KV6856” located inside Liberty State Park of Jersey City, NJ ( see figure 8). Data acquisition consisted of a one-second logging interval for the duration of 6 minutes as outlined by FPM 3.4.3. Acquired data were then post-processed in Trimble’s Pathfinder Office 3.10 using a NGS Continuously Operating Reference Station (CORS) site located at the Lamont-Doherty Earth Observatory in Palisades, NY. A filtered set of 360 points were accepted by the C/A code post processing algorithm. At a 95% confidence level, the horizontal accuracy of the unit was determined to be 0.9 meters (see figure 9, 10 & 11) with a 0.81 meter distance from the known survey mark.
Fig 8: USACE bench mark KV6856 and setup overview

APPENDIX IV NOAA NRT-5 2009 DAPR
Figure 9, Time of collection influenced to reduce HDOP error.
Figure 10 Raw acquired unprocessed data.

APPENDIX IV NOAA NRT-5 2009 DAPR
Figure 11, Post Processed using a Coarse Acquisition (C/A) Code algorithm.
Figure 12, Distance calculated from Survey Mark to data point equaled 0.81 meters.

APPENDIX IV NOAA NRT-5 2009 DAPR
NGS Data Sheet
DATABASE = ,PROGRAM = datasheet, VERSION = 7.67 1 National Geodetic Survey, Retrieval Date = APRIL 9, 2009 KV6856 *********************************************************************** KV6856 DESIGNATION - LSP SOUTH KV6856 PID - KV6856 KV6856 STATE/COUNTY- NJ/HUDSON KV6856 USGS QUAD - JERSEY CITY (1981) KV6856 KV6856 *CURRENT SURVEY CONTROL KV6856 ___________________________________________________________________ KV6856* NAD 83(2007)- 40 41 27.03835(N) 074 03 18.68704(W) ADJUSTED KV6856* NAVD 88 - 2.7 (meters) 9. (feet) GPS OBS KV6856 ___________________________________________________________________ KV6856 EPOCH DATE - 2002.00 KV6856 X - 1,330,432.949 (meters) COMP KV6856 Y - -4,656,695.852 (meters) COMP KV6856 Z - 4,136,432.700 (meters) COMP KV6856 LAPLACE CORR- 4.99 (seconds) DEFLEC99 KV6856 ELLIP HEIGHT- -29.334 (meters) (02/10/07) ADJUSTED KV6856 GEOID HEIGHT- -31.98 (meters) GEOID03 KV6856 KV6856 ------- Accuracy Estimates (at 95% Confidence Level in cm) -------- KV6856 Type PID Designation North East Ellip KV6856 ------------------------------------------------------------------- KV6856 NETWORK KV6856 LSP SOUTH 0.25 0.24 0.69 KV6856 ------------------------------------------------------------------- KV6856 KV6856.The horizontal coordinates were established by GPS observations KV6856.and adjusted by the National Geodetic Survey in February 2007. KV6856 KV6856.The datum tag of NAD 83(2007) is equivalent to NAD 83(NSRS2007). KV6856.See National Readjustment for more information. KV6856.The horizontal coordinates are valid at the epoch date displayed above. KV6856.The epoch date for horizontal control is a decimal equivalence KV6856.of Year/Month/Day. KV6856 KV6856.The orthometric height was determined by GPS observations and a KV6856.high-resolution geoid model. KV6856

APPENDIX IV NOAA NRT-5 2009 DAPR
KV6856.The X, Y, and Z were computed from the position and the ellipsoidal ht. KV6856 KV6856.The Laplace correction was computed from DEFLEC99 derived deflections. KV6856 KV6856.The ellipsoidal height was determined by GPS observations KV6856.and is referenced to NAD 83. KV6856 KV6856.The geoid height was determined by GEOID03. KV6856 KV6856; North East Units Scale Factor Converg. KV6856;SPC NJ - 206,314.082 187,594.716 MT 0.99991739 +0 17 24.0 KV6856;SPC NJ - 676,882.12 615,467.00 sFT 0.99991739 +0 17 24.0 KV6856;SPC NY L - 58,209.100 295,334.885 MT 0.99999874 -0 02 10.0 KV6856;SPC NY L - 190,974.36 968,944.54 sFT 0.99999874 -0 02 10.0 KV6856;SPC NY E - 206,314.082 187,594.716 MT 0.99991739 +0 17 24.0 KV6856;SPC NY E - 676,882.12 615,467.00 sFT 0.99991739 +0 17 24.0 KV6856;UTM 18 - 4,504,867.890 579,830.563 MT 0.99967844 +0 36 57.7 KV6856 KV6856! - Elev Factor x Scale Factor = Combined Factor KV6856!SPC NJ - 1.00000460 x 0.99991739 = 0.99992199 KV6856!SPC NY L - 1.00000460 x 0.99999874 = 1.00000334 KV6856!SPC NY E - 1.00000460 x 0.99991739 = 0.99992199 KV6856!UTM 18 - 1.00000460 x 0.99967844 = 0.99968304 KV6856 KV6856 SUPERSEDED SURVEY CONTROL KV6856 KV6856 ELLIP H (10/23/02) -29.328 (m) GP( ) 4 1 KV6856 NAD 83(1996)- 40 41 27.03865(N) 074 03 18.68737(W) AD( ) 1 KV6856 ELLIP H (05/14/99) -29.323 (m) GP( ) 4 1 KV6856 NAD 83(1996)- 40 41 27.03859(N) 074 03 18.68742(W) AD( ) 1 KV6856 NAD 83(1996)- 40 41 27.03774(N) 074 03 18.68818(W) AD( ) 1 KV6856 NAD 83(1992)- 40 41 27.03675(N) 074 03 18.68962(W) AD( ) 1 KV6856 NAD 83(1986)- 40 41 27.03687(N) 074 03 18.68962(W) AD( ) 1 KV6856 KV6856.Superseded values are not recommended for survey control. KV6856.NGS no longer adjusts projects to the NAD 27 or NGVD 29 datums. KV6856.See file dsdata.txt to determine how the superseded data were derived. KV6856 KV6856_U.S. NATIONAL GRID SPATIAL ADDRESS: 18TWL7983104868(NAD 83)

APPENDIX IV NOAA NRT-5 2009 DAPR
KV6856_MARKER: DD = SURVEY DISK KV6856_SETTING: 4 = OBJECT SURROUNDED BY MASS OF CONCRETE KV6856_SP_SET: SURROUNDED BY MASS OF CONCRETE KV6856_STAMPING: LSP SOUTH 1991 KV6856_MARK LOGO: USE KV6856_MAGNETIC: N = NO MAGNETIC MATERIAL KV6856_STABILITY: D = MARK OF QUESTIONABLE OR UNKNOWN STABILITY KV6856_SATELLITE: THE SITE LOCATION WAS REPORTED AS SUITABLE FOR KV6856+SATELLITE: SATELLITE OBSERVATIONS - April 26, 2004 KV6856 KV6856 HISTORY - Date Condition Report By KV6856 HISTORY - 1991 MONUMENTED USE KV6856 HISTORY - 19920306 GOOD NJGS KV6856 HISTORY - 19950920 GOOD NJGS KV6856 HISTORY - 20010902 GOOD NJDEP KV6856 HISTORY - 20040426 GOOD PORANY KV6856 KV6856 STATION DESCRIPTION KV6856 KV6856'DESCRIBED BY NEW JERSEY GEODETIC SURVEY 1992 KV6856'THE STATION IS LOCATED IN THE CITY OF JERSEY CITY ON THE GROUNDS OF KV6856'LIBERTY STATE PARK AT THE SOUTHERN MOST POINT OF THE MONUMENT KV6856'OVERLOOK. TO REACH THE STATION FROM THE NEW JERSEY TURNPIKE EXIT KV6856'14B, GO 0.9 MI (1.4 KM) SOUTHEAST ON MORRIS PESIN DRIVE TO THE KV6856'LIBERTY STATE PARK VISITORS CENTER. ACCESS TO THE OVERLOOK AND KV6856'PERMISSION TO OCCUPY THE STATION MUST BE OBTAINED FROM RANGER CHUCK KV6856'SARY, PHONE 201 915 3401 WHO REQUESTS A ONE WEEK ADVANCE NOTICE SO KV6856'THAT HE CAN DETERMINE IF ANY SPECIAL EVENTS WILL TAKE PLACE DURING KV6856'OUR OBSERVATION PERIOD. HE ALSO REQUESTS THAT OUR VEHICLES KEEP OFF KV6856'THE LAWNS DUE TO A SHALLOW SPRINKLER SYSTEM. THE STATION IS 0.6 M KV6856'(2.0 FT) NORTHEAST FROM THE SOUTHWEST CONCRETE WALL, 6.5 M (21.3 FT) KV6856'NORTHWEST FROM THE BOTTOM STEP LEADING TO THE BRICK OBSERVATION AREA, KV6856'11.5 M (37.7 FT) SOUTH FROM THE SOUTHERN MOST WOOD LAMP POST NUMBER KV6856'1918, 16.3 M (53.5 FT) SOUTH FROM THE CENTER OF AN INLET IN THE LAWN KV6856'AND 10.0 M (32.8 FT) WEST FROM THE WESTERN MOST OF THREE LIGHT POLES KV6856'ON THE BRICK OBSERVATION AREA. THE STATION IS SET FLUSH IN A FLUSH KV6856'MOUNTED CONCRETE RETAINER FOR THE BRICK PAVED WALKWAY SURROUNDING THE KV6856'BRICK OBSERVATION DECK. KV6856 KV6856 STATION RECOVERY (1995) KV6856 KV6856'RECOVERY NOTE BY NEW JERSEY GEODETIC SURVEY 1995 (FAC) KV6856'REECOVERED AS DESCRIBED. KV6856

APPENDIX IV NOAA NRT-5 2009 DAPR
KV6856 STATION RECOVERY (2001) KV6856 KV6856'RECOVERY NOTE BY NJ DEPT OF ENVIR PRO 2001 (BMC) KV6856'CONTACT NOW IS PARK SUPERINTENDENT STEVE ELLIS. ELEVATION TRANSFERRED KV6856'FROM KV0611, +8.75 FEET NAVD 88. KV6856 KV6856 STATION RECOVERY (2004) KV6856 KV6856'RECOVERY NOTE BY PORT AUTHORITY OF NY + NJ 2004 (SSZ) KV6856'NEW CONTACT INFORMATION AS FOLLOWS. CONTACT SUPERINTENDENT OR CHIEF KV6856'RANGER AT 201-915-3403 AT LEAST A WEEK IN ADVANCE. *** retrieval complete. Elapsed Time = 00:00:00