No Vacancy - Transportation Alternatives€¦ · vacancy target on the existing curbside to...
22
No Vacancy Park Slope’s Parking Problem And How to Fix It February 2007
Transcript of No Vacancy - Transportation Alternatives€¦ · vacancy target on the existing curbside to...

No Vacancy Park Slope’s Parking Problem
And How to Fix It
February 2007

NO VACANCY
1
Executive Summary This study gathered information on 7th Avenue, a primary commercial corridor in one of Brooklyn’s most historic and thriving neighborhoods, Park Slope. The purpose of this study is to ascertain the extent of the neighborhood’s ever-worsening traffic and parking problems, and to propose solutions to both. Based on two-hour observation periods conducted over four days in January/February 2007, the study reveals an overwhelming amount of traffic is simply circling the block “cruising” for parking, while the curbside itself is nearly 100% filled with parked vehicles. The study yielded the following results:
• 45% of total traffic is cruising for a parking space.
• 64% of local traffic is cruising for a parking space.
• Nearly 1 in 6 parked vehicles parks illegally, with illegal parking increasing exponentially as the curb fills up.
• The average curb saturation rate over all observation periods is 94%, with nearly
100% occupancy at metered spaces during peak periods. Non-metered spaces show even lower vacancy rates.
To reduce traffic volumes and create desirable vacancies at the curbside, the study makes the following recommendations:
• Implement a locally-managed Parking Improvement District that adopts a curbside parking vacancy target of 15% for 7th Avenue.
• Increase curbside parking rates until the target is met and maintained.
• Implement residential parking permits on adjacent side streets to further reduce
cruising traffic. Both residents and businesses suffer the consequences of Park Slope’s under-priced curbside parking in the form of higher congestion, slower bus service, increased pollution and diminished quality of life. Cruising for parking is a wasteful, frustrating exercise for drivers, and means that local businesses are not deriving the full economic benefits of scarce parking spaces. Increasing curbside vacancies through higher metered rates can alleviate these problems while generating millions of dollars in new revenue to fund local street improvements such as traffic calming and pedestrian safety measures.
NO VACANCY
2
Table of Contents Executive Summary…………………………………………………… 1 Table of Contents……………………………………………………… 2 Recommendations…………………………………………………….... 3 Methodology…………………………………………………………... 4 Background……………………………………………………………. 5 Cruising Patterns……………………………………………………….. 8 Curb Saturation………………………………………………………… 10 Illegal Parking………………………………………………………….. 15 Impact of Curb Saturation on Illegal Parking………………………….. 18 Appendix: Survey Forms………………………………………………. 20

NO VACANCY
3
Recommendations The study illustrates two enormous and closely related problems on Park Slope’s 7th Avenue: a dysfunctional curbside and an especially high percentage of traffic that is cruising for parking. The high incidence of cruising (45% on average) suggests that Park Slope’s oppressive traffic is both unnecessary and manageable. Based on the overwhelming number of cruising-related vehicle miles traveled (VMT) in Park Slope, improving curb performance would drastically reduce overall VMT, smooth traffic flow and deter hazardous illegal parking. 1.) Implement a pilot Parking Improvement District (PID) in the area with a 15% vacancy target along 7th Avenue. Because of Park Slope’s historic and residential character, it is impractical to install new large-scale parking facilities that would induce additional traffic and damage the neighborhood’s unique character. Emphasis should be placed on achieving a 15% vacancy target on the existing curbside to eliminate cruising (the average vacancy rate on 7th Avenue is currently 4%). The leading researcher in this field, Donald Shoup, recommends a 15% vacancy rate to avail one open space per block face. This target would also reduce illegal parking by up to 75%, essentially creating a self-enforcing curbside. The locally-managed pilot project would implement the two measures below.
2.) Install market-rate Muni-Meters that increase price to maintain vacancy targets during periods of peak congestion. The lack of any true “off-peak” period in which the curbside functions properly indicates that the present rate for metered parking ($.25 per half hour) is too low to provide the necessary vacancies at any time. The solution to alleviating over-saturated short-term parking is a system of variable priced Muni-Meters that charge higher fees during congested times. A baseline rate higher than $.25 should be implemented, with rates rising during peak periods to maintain targeted vacancy rates. The largest parking garage in the vicinity charges $3.62 per half-hour. Raising metered rates closer to garage rates encourages drivers to park in a garage while also boosting turn-over at the curb itself.
3.) Implement residential parking permits on adjacent side streets to keep commercial traffic off of residential streets. The even higher rates of curb saturation observed at non-metered spaces (95%) indicate the need for parking reform on adjacent residential streets as well. Residents seeking overnight parking and patrons seeking short-term parking currently compete for these non-metered spaces. Issuing residential parking permits in the form of “hunting licenses” will allow only residents to park along selected streets, though they will not be guaranteed a particular space. Higher meter rates along the commercial corridor will only be successful if cruising is deterred along these side streets as well.

NO VACANCY
4
Methodology No Vacancy studies the degree of curb saturation on 7th Avenue in Park Slope, and quantifies the different types of illegal parking taking place. The study also analyses the percentage of traffic that is “cruising” for a parking space. The study gathered information on 7th Avenue regarding:
• The amount of traffic bound for Park Slope destinations • The amount of traffic searching (“cruising”)for parking • The number of metered and curbside spaces filled or vacant • The number and infraction of illegally parked cars
The study was administered in the form of two surveys:
• Driver Intercept Surveys conducted at red lights • Curbside Saturation and Illegal Parking Surveys conducted from the curbside
Surveyors collected data on four days for two-hour periods. The survey dates were Saturday, January 20th from 12-2pm (weekend high); Tuesday, January 23rd from 10am-12pm (weekday high); Thursday, February 1st from 5-7pm (weekday moderate) and Tuesday, February 13th from 4-6pm (weekday moderate). The Driver Intercept Survey was administered at two points along 7th Avenue. Northbound drivers were randomly interviewed while stopped at a red light at 8th Street. Southbound drivers were randomly interviewed at 2nd Street. Because this procedure required surveyors to stand in the street, locations were slightly adjusted each survey period to ensure the safety of surveyors. A total of 168 drivers were interviewed over four two-hour periods regarding their destination and whether they were actively searching for parking.* The Curbside Saturation and Illegal Parking Survey was collected along 7th Avenue between Union Street and 12th Street. One surveyor noted parking conditions along 7th Avenue between 5th Street and 12th Street, while another surveyed between 5th Street and 1st Street. The two surveyors made four laps along their respective survey area over each two-hour period. Transportation Alternatives (T.A.) designed the study and executed the analysis, with input from Bruce Schaller, Principal of Schaller Consulting. T.A. volunteers and staff conducted the data collection. *Data collected regarding the duration of drivers’ searches for parking was not utilized.
NO VACANCY
5
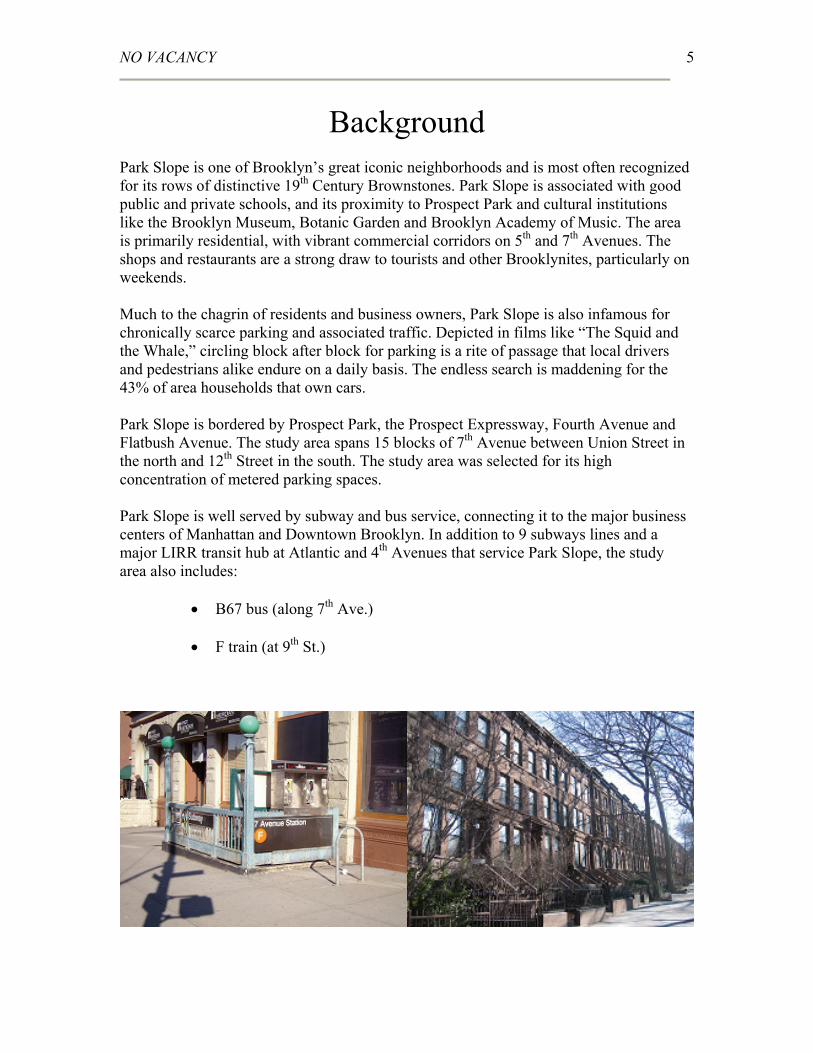
Background Park Slope is one of Brooklyn’s great iconic neighborhoods and is most often recognized for its rows of distinctive 19th Century Brownstones. Park Slope is associated with good public and private schools, and its proximity to Prospect Park and cultural institutions like the Brooklyn Museum, Botanic Garden and Brooklyn Academy of Music. The area is primarily residential, with vibrant commercial corridors on 5th and 7th Avenues. The shops and restaurants are a strong draw to tourists and other Brooklynites, particularly on weekends. Much to the chagrin of residents and business owners, Park Slope is also infamous for chronically scarce parking and associated traffic. Depicted in films like “The Squid and the Whale,” circling block after block for parking is a rite of passage that local drivers and pedestrians alike endure on a daily basis. The endless search is maddening for the 43% of area households that own cars. Park Slope is bordered by Prospect Park, the Prospect Expressway, Fourth Avenue and Flatbush Avenue. The study area spans 15 blocks of 7th Avenue between Union Street in the north and 12th Street in the south. The study area was selected for its high concentration of metered parking spaces. Park Slope is well served by subway and bus service, connecting it to the major business centers of Manhattan and Downtown Brooklyn. In addition to 9 subways lines and a major LIRR transit hub at Atlantic and 4th Avenues that service Park Slope, the study area also includes:
• B67 bus (along 7th Ave.) • F train (at 9th St.)

NO VACANCY
6
Several education, health and religious organizations in the survey area affect parking in the form of no standing zones and other regulations, including:
• Secondary School for Law, Journalism and Research (btw 4th and 5th St.) • PS 321 William Penn School (btw 1st and 2nd St.) • New York Methodist Hospital (btw 6th and 7th St.)
• All Saints Episcopal Church (at 7th St.)
• Greenwood Baptist Church (at 6th St.). • Old First Reformed Church (at Carroll St.)
Local parking garages provide off-street parking at rates roughly 15-times those of area parking meters. The largest garage at Methodist Hospital provides 530 off-street parking spots to hospital staff, local residents and the general public in an underground garage located behind the facility on 7th Street. Smaller garages dot the area, as indicated on the map. The area is represented by Brooklyn Community Board 6, and is served by longstanding civic organizations like the Park Slope Civic Council (established 1896). The Park Slope Neighbors Association is a newer organization which is also committed to the protection and enhancement of Park Slope’s quality of life.

NO VACANCY
7

NO VACANCY
8
Traffic and Cruising Patterns The Driver Intercept Survey separates vehicles into three categories. “Through traffic” comprises drivers destined for locations outside of Park Slope. “Non-cruising” refers to drivers bound for a Park Slope destination, but not in search of parking. “Cruising,” by far the most numerous category, includes vehicles bound for Park Slope destinations and currently in search of parking. Total Traffic The results show that nearly half of the 168 vehicles surveyed in 7th Avenue traffic is cruising for a parking space.
Total Traffic
Cruising45%
Through-Traffic30%
Non-Cruising25%
Figure 1
• 45% of all traffic is cruising for parking.
• Less than a third of all traffic is bound for destinations outside of Park Slope.

NO VACANCY
9
Local Traffic Because through-traffic volumes are affected by conditions outside the survey area, an analysis of Park Slope-bound traffic provides the best basis for locally managed traffic reduction. Removing through-traffic from the analysis, cruising constitutes a clear majority of all local traffic.
Local Traffic
Non-Cruising36%
Cruising64%
Figure 2
• Among all Park Slope-bound traffic, 64% of vehicles are cruising for parking on
average. Cruising includes both vehicles searching for short-term parking along 7th Avenue’s metered spaces, and vehicles searching for long-term parking on adjacent residential streets. The following section titled “Curb Saturation” details conditions on both the metered and non-metered curbside. Driver Intercept Survey ResultsDate 20-Jan-07 23-Jan-07 1-Feb-07 13-Feb-07 AverageNumber of respondents (168 total) 56 47 26 39Driving to a destination in Park Slope 57% 72% 85% 74% 70%Currently searching for parking (% of total) 41% 40% 38% 59% 45%Currently searching for parking (% of local) 72% 56% 45% 79% 64%
Table 1

NO VACANCY 10
Curb Saturation There are 162 metered parking spaces along the 15 block survey area of 7th Avenue. Between 10th and 12th Streets, an additional 32 non-metered spaces are available at all times of the week. Based on the day and time, an additional 17 non-metered spaces are made available when no parking/standing restrictions are lifted. “Saturation” describes the percentage of available spaces occupied by vehicles, while “vacancy rate” describes the percentage of available spaces remaining unoccupied. Meter Saturation Metered spaces along 7th Avenue currently charge $.25 per half hour in a one-hour parking zone. This is less than 10% the market rate charged at nearby garages. During peak periods nearly 100% of available metered parking is occupied.
Meter Saturation
75%
80%
85%
90%
95%
100%
Day
Satu
ratio
n 20-Jan23-Jan1-Feb13-Feb
Figure 3
• The average saturation rate over all four survey periods is 94%.
• At one point on Tuesday 10am-12pm (weekday high), the curb reached 99%
saturation – only 2 spaces out of 162 were available.
• Meter saturation dipped below 90% only once during 16 30-minute observations.
• The highest vacancy rate observed was 15% on Thursday 5-7pm; the lowest was observed on Tuesday 10am-12pm (2%).

NO VACANCY 11
The going-rate for metered parking: 30 minutes for $.25.
Under-priced parking causes low vacancies at the curb.

NO VACANCY 12
Non-Metered Curb Saturation Between 36 and 49 non-metered spaces are available along the survey area of 7th Avenue, depending on the day and time. On 3 of the 4 survey days, these spaces experienced even higher saturation rates than adjacent metered spaces.
Non-Metered Curb Saturation
75%
80%
85%
90%
95%
100%
Day
Sat
urat
ion 20-Jan
23-Jan1-Feb13-Feb
Figure 4
• The average saturation of non-metered spaces is 95%, 1% greater than metered
spaces. • The highest amount of saturation occurs on Saturday 12-2pm, with 100% of non-
metered spaces filled.
• The lowest amount of saturation occurs on Thursday 5-7pm, with just under 95% of non-metered spaces filled.
• Vacancy rates at non-metered spaces vary from 5% on Thursday 5-7pm to 0% on
Saturday 12-2pm.

NO VACANCY 13
Non-metered spaces at full capacity.
Total Curb Saturation To compute the total curb saturation for the entire survey area, we combine the number of vehicles parked in both metered and non-metered spaces, and divide this number by the total number of available metered and non-metered spaces.
Total Curb Saturation
75%
80%
85%
90%
95%
100%
Day
Sat
urat
ion 20-Jan
23-Jan
1-Feb
13-Feb
Figure 5

NO VACANCY 14
• The average saturation of all curbside spaces is 94%.
• The highest curbside saturation was observed on Tuesday 10am-12pm (97%).
• The lowest curbside saturation was observed on Thursday 5-7pm (90%).
• The vacancy rate among all curbside spaces never exceeds 10%.
Percentage Saturation of Metered SpacesPeriod 1 Period 2 Period 3 Period 4 Average
20-Jan 98% 96% 93% 96% 95%23-Jan 98% 98% 98% 99% 98%1-Feb 81% 92% 91% 90% 89%
13-Feb 93% 93% 93% 94% 93% Table 2
Percentage Saturation of Non-Metered SpacesPeriod 1 Period 2 Period 3 Period 4 Average
20-Jan 100% 100% 100% 100% 100%23-Jan 97% 94% 94% 94% 95%1-Feb 96% 91% 93% 98% 95%
13-Feb 96% 100% 92% 92% 95% Table 3
Percentage Saturation of Total SpacesPeriod 1 Period 2 Period 3 Period 4 Average
20-Jan 98% 97% 94% 96% 96%23-Jan 97% 97% 97% 98% 97%1-Feb 85% 92% 91% 92% 90%
13-Feb 94% 94% 92% 93% 93% Table 4
The January 20th sample of non-metered spaces and total spaces do not include non-metered spaces between 10th and 12th Streets.

NO VACANCY 15
Illegal Parking Illegal parking impedes the safe and efficient flow of traffic by obstructing other vehicles from legal uses. The most common infraction-- parking in a no standing or no parking zone-- prevents commercial vehicles from using designated areas while conducting business or making deliveries. Another common offense, double parking, slows bus service, vehicle traffic and emergency service vehicles. Double parking also endangers pedestrians by obstructing sight lines, and endangers motorists and bicyclists by forcing them to swerve further out into the roadway to avoid collisions with double parked vehicles. Bus service is also delayed by vehicles parked in front of bus stops. Similarly, emergency services are hindered by vehicles blocking fire hydrants. Illegal parking data was collected concurrently with the Curb Saturation Survey. Surveyors noted five different types of parking infractions: double parking, blocking fire hydrants, blocking bus stops, parking past the last meter and parking in a No Parking/No Standing zone. Data was collected four times during a two hour period on four days.
Illegal Parking
Double Parked Cars29%
Blocking Hydrants
15%Blocking Bus Stops15%
Parked Past the Last Meter
7%
No Standing/ No Parking
34%
Figure 6
• The greatest parking infraction as a percentage of total parking infractions was No
Standing/No Parking (34%), followed by double parking (29%), blocking bus stops (15%), blocking fire hydrants (15%), and parking past the last meter (7%).

NO VACANCY 16
• During the highest periods of illegal parking on 7th Avenue:
11 fire hydrants were blocked by parked vehicles
10 vehicles blocked bus stops
17 vehicles were double parked
With no space at the curb, a commercial vehicle double parks to make a delivery.
A repairman blocks a hydrant to service a restaurant.
NO VACANCY 17
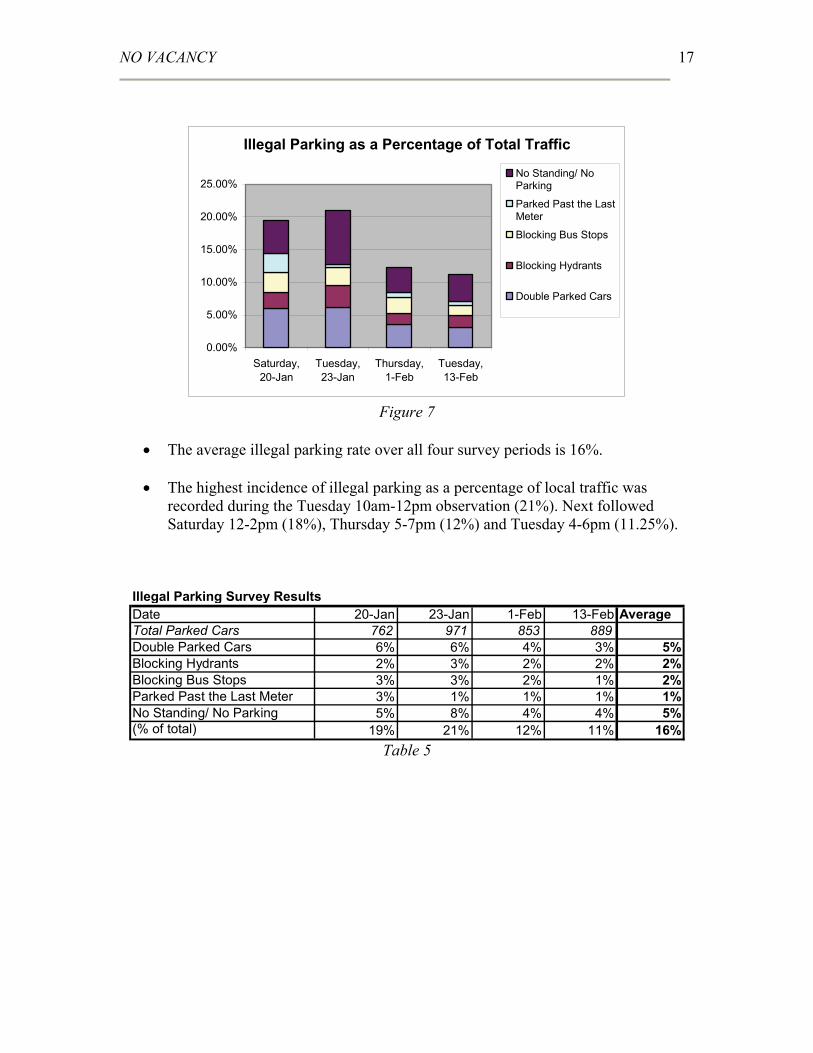
Illegal Parking as a Percentage of Total Traffic
0.00%
5.00%
10.00%
15.00%
20.00%
25.00%
Saturday,20-Jan
Tuesday,23-Jan
Thursday,1-Feb
Tuesday,13-Feb
No Standing/ NoParking
Parked Past the LastMeter
Blocking Bus Stops
Blocking Hydrants
Double Parked Cars
Figure 7
• The average illegal parking rate over all four survey periods is 16%. • The highest incidence of illegal parking as a percentage of local traffic was
recorded during the Tuesday 10am-12pm observation (21%). Next followed Saturday 12-2pm (18%), Thursday 5-7pm (12%) and Tuesday 4-6pm (11.25%).
Illegal Parking Survey ResultsDate 20-Jan 23-Jan 1-Feb 13-Feb AverageTotal Parked Cars 762 971 853 889Double Parked Cars 6% 6% 4% 3% 5%Blocking Hydrants 2% 3% 2% 2% 2%Blocking Bus Stops 3% 3% 2% 1% 2%Parked Past the Last Meter 3% 1% 1% 1% 1%No Standing/ No Parking 5% 8% 4% 4% 5%(% of total) 19% 21% 12% 11% 16%
Table 5

NO VACANCY 18
Impact of Curb Saturation on Illegal Parking The relationship between curb saturation and illegal parking is a logical one. As space at the curb fills up, drivers resort to blocking bus stops and fire hydrants, double parking and taking advantage of loading and no-standing zones. Based on the 16 half-hour curbside observations that assessed bother curb saturation and illegal parking, a trend line projects the exponential increase of illegal parking.
Curb Saturation vs. Illegal Parking
y = 0.3261x13.25
0%
5%
10%
15%
20%
25%
30%
35%
70% 75% 80% 85% 90% 95% 100%
Curb Saturation
Illeg
al P
arki
ng
Figure 8
*2 outliers were omitted from Figure 8’s trend line and appear in Table 6.
• Illegal parking increases exponentially as curb saturation nears 100%.
• Because of the exponential function, even a small reduction in curb saturation on the order of 5% can lead to a 50% reduction in illegal parking.
• The two “high” periods (Saturday 12-2pm and Tuesday 10am-12pm) show both
the highest curb saturation and illegal parking rates, respectively.
• The data points appear in two distinct clusters, with observations from Saturday 12-2pm and Tuesday 10am-12pm in the upper group, and observations from Thursday 5-7pm and Tuesday 4-6pm in the lower group.

NO VACANCY 19
An entire row of double parked vehicles blocks in a packed curbside.
Curb Saturation and Illegal Parking
Date Period Curb Saturation Illegal Parking20-Jan Period 1 98% 13%
Period 2 97% 21%Period 3 94% 15%Period 4 96% 22%
23-Jan Period 1 97% 23%Period 2 97% 21%Period 3 97% 25%Period 4 98% 25%
1-Feb Period 1 85% 15%Period 2 92% 12%Period 3 91% 12%Period 4 92% 11%
13-Feb Period 1 94% 10%Period 2 94% 13%Period 3 92% 12%Period 4 93% 10%
Table 6

NO VACANCY 20
Survey Forms: Park Slope Driver Intercept Survey Date: January/February _____, 2007 Location: 7th Avenue and ______ Street Hi. We’re conducting a study to reduce traffic in Park Slope. May I ask you three brief questions while you are stopped at the light? 1) Are you driving to a destination in Park Slope? (If yes, proceed to question 2). 2) Are you looking for parking right now? (If yes, proceed to question 3). 3) How long have you been searching?

NO VACANCY 21
Survey Forms: Park Slope Curbside Parking SurveyBlock: 7th Avenue between 10th and 11th StreetsSide: East/WestMetered Spaces per Block: 6 Unmetered Spaces:3
Observation (Time) 1st (10am) 2nd (10:45) 3rd (11:30) 4th (11:50)
Vehicles in Metered Spaces III IIIII IIII III
Double Parked Cars I 0 II III
Blocking Hydrants 0 0 I II
Blocking Bus Stops I I 0 I
Parked Past the Last Meter 0 0 0 0
No Parking/No Standing 0 0 0 0
Parked in Unmetered Space III II III 0
Block: 7th Avenue between ______ and ______ StreetsSide: East/WestMetered Spaces per Block: ______ Unmetered Spaces:____
Observation (Time) 1st (________) 2nd (________) 3rd (____) 4th (____)
Vehicles in Metered Spaces
Double Parked Cars
Blocking Hydrants
Blocking Bus Stops
Parked Past the Last Meter
No Parking/No Standing
Parked in Unmetered Space