EVALUATION OF AUTOMATED TRAFFIC ENFORCEMENT SYSTEMS IN TEXAS
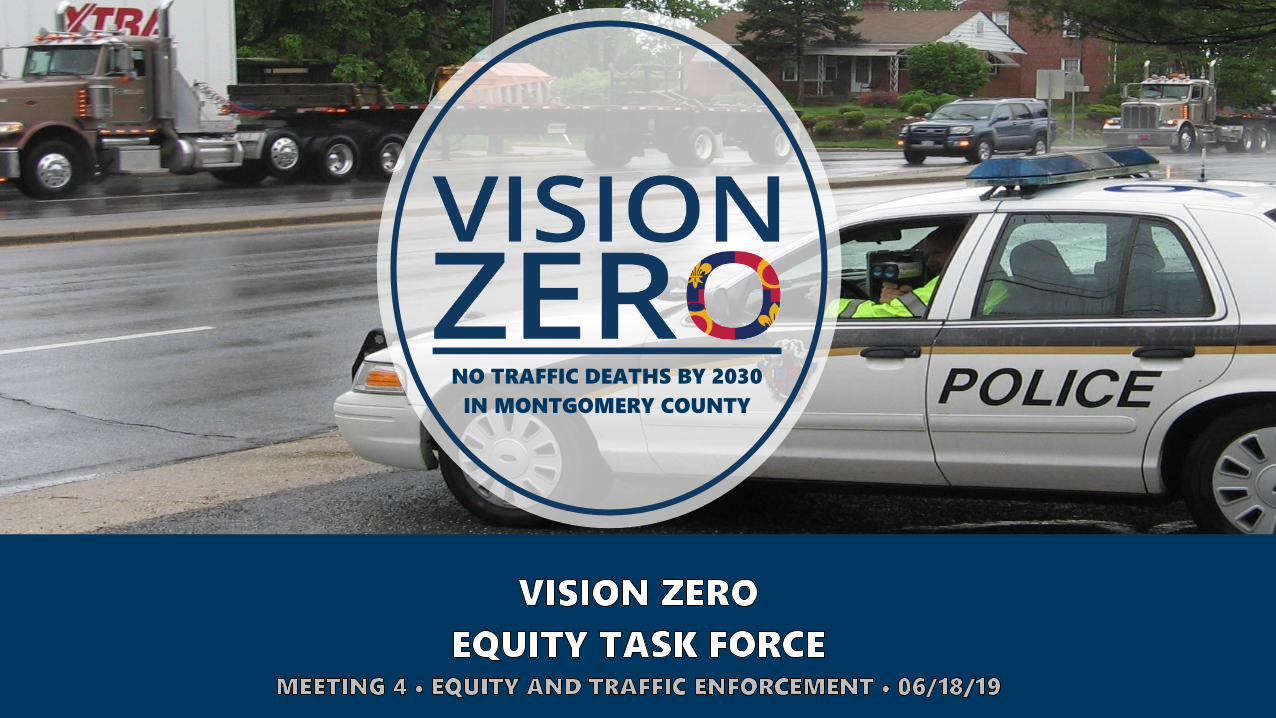
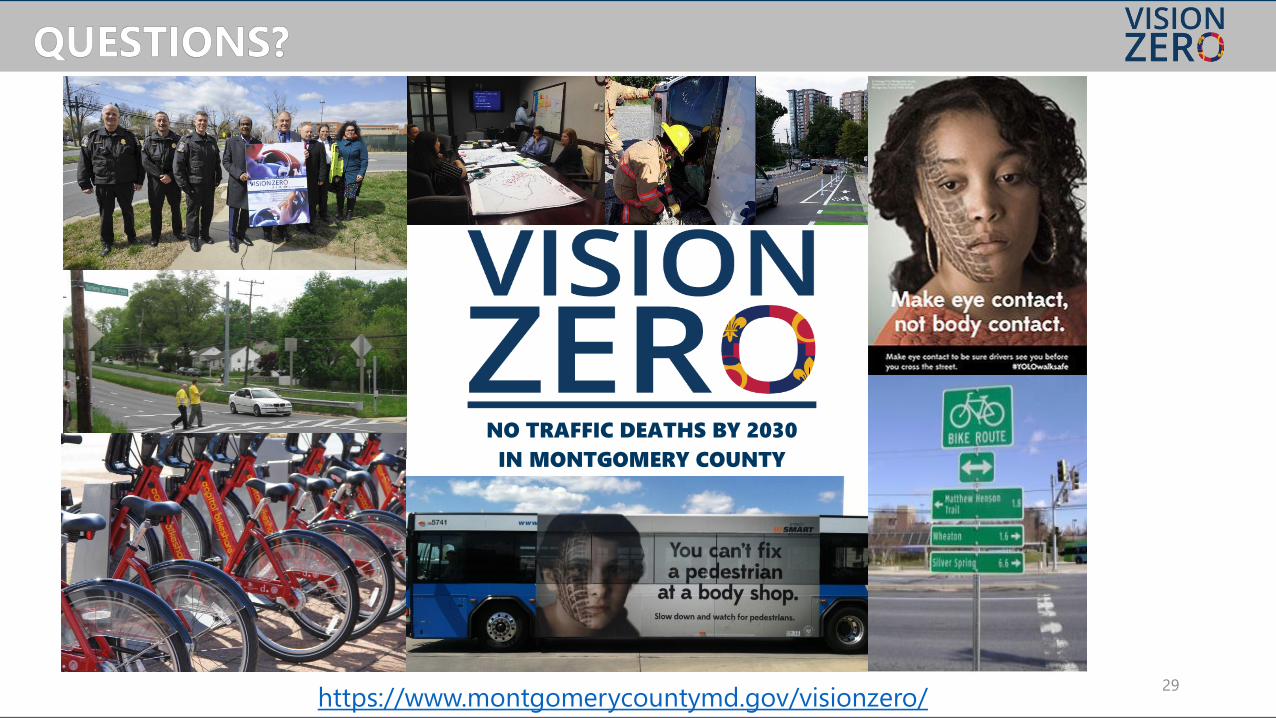
NO TRAFFIC DEATHS BY 2030
IN MONTGOMERY COUNTY

3
MEETING AGENDA,
PURPOSE, & GOALS

4
I. Introduction (10 mins)
1. Introduce all team members
2. Introduce the program and meeting agenda
• Recap of previous meetings and where we are
• Meeting purpose and goals
II. County’s Presentation – Traffic Law Enforcement (40 mins)
1. Traffic Stop Data
2. Overview of High Visibility Enforcement from MCPD
3. Q&A
III.Break (10 mins)
IV.Draft Equity Statement and Discussion (55 mins)
V. Next Steps (5 mins)

5
Meeting 1:
Define Equity
Meeting 2:
Engineering
Meeting 3:
Education
Meeting 4:
Enforcement
Document Photo by Unknown Author is licensed under CC BY-SA
Draft Equity
Statement for
Vision Zero
Task Force &
Public Review
Equity Statement
for Vision Zero
DRAFT
10 – Year Vision
Zero Strategy

6
✓ Review data and practices for traffic law enforcement
✓ Revise draft equity statement developed from Meeting #3
✓ Discuss equity framework considerations and scorecard for
engineering and education
7
➢ During Q&A, raise your hand and wait for the facilitator to call on you.
➢ Avoid interrupting another task force member.
➢ Avoid distracting sidebar conversations.
➢ Question assumptions, but don’t assume someone is wrong. We all have
different perspectives and our task does not have a right or wrong textbook
answer. Build on other’s ideas instead of tearing them down.
8
TRAFFIC SAFETY
ENFORCEMENT
9
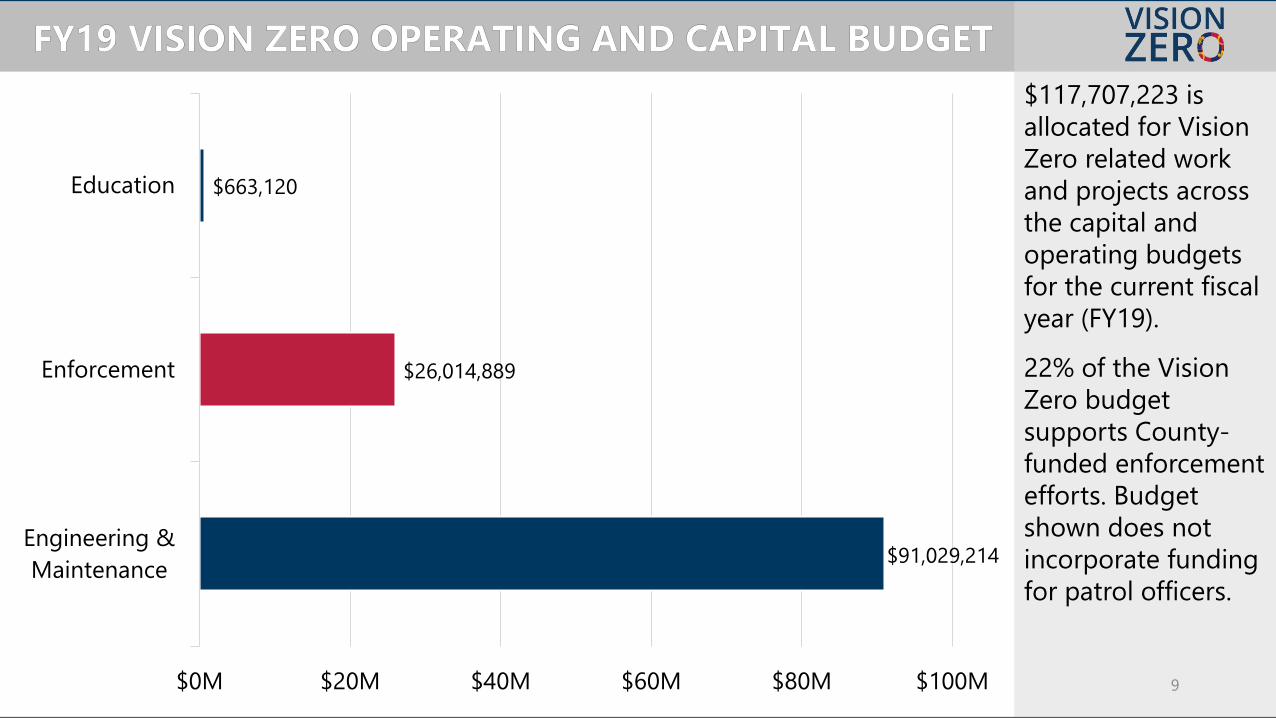
$91,029,214
$26,014,889
$663,120
Engineering &
Maintenance
Enforcement
Education
$0M $20M $40M $60M $80M $100M
$117,707,223 is
allocated for Vision
Zero related work
and projects across
the capital and
operating budgets
for the current fiscal
year (FY19).
22% of the Vision
Zero budget
supports County-
funded enforcement
efforts. Budget
shown does not
incorporate funding
for patrol officers.

10
$83,517
$180,000
$5,943,322
$19,808,050
Police Enforcement for HIAs - Data Analyst
Police Enforcement for HIAs - Overtime
School Safety Program/General Fund
Automated Traffic Enforcement
$0M $5M $10M $15M $20M $25M
Of the $26,014,889
in the FY19 budget
for Enforcement,
76% is for speed
and red light
automated
enforcement. Not
explicitly included in
the Vision Zero
budget are Patrol
and Field Services in
MCPD since officers
perform more duties
than traffic
enforcement.
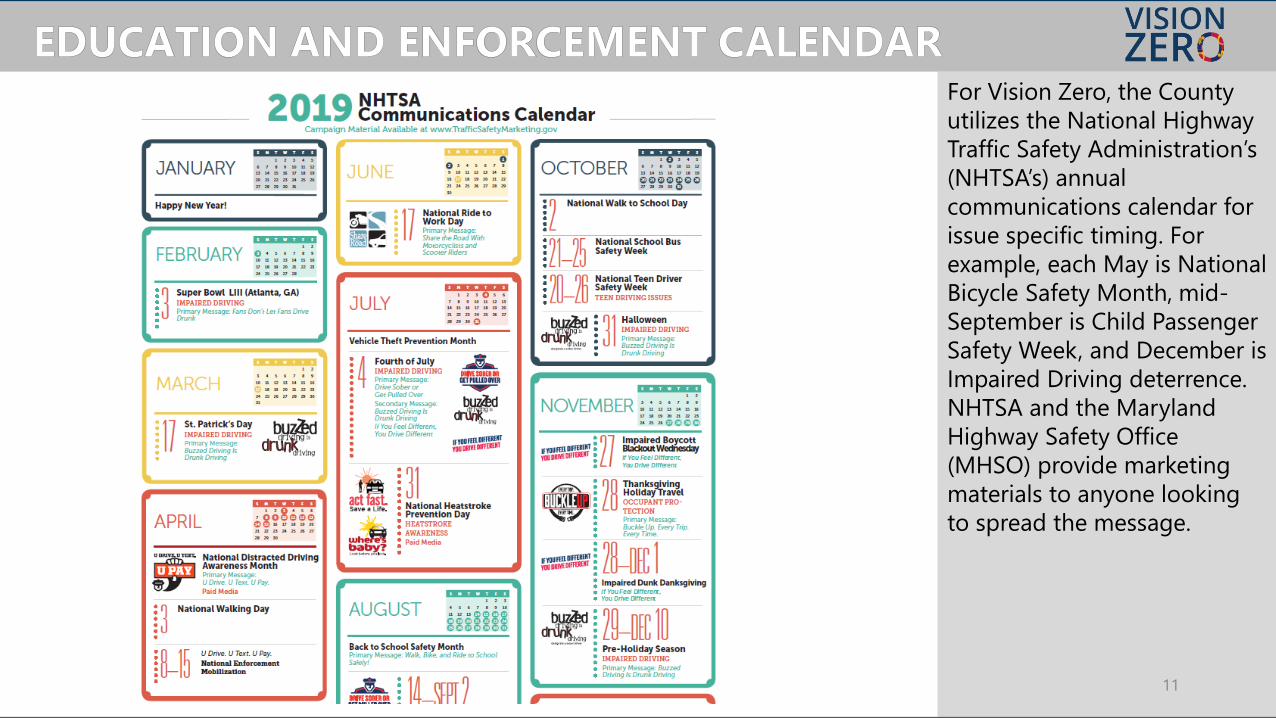
For Vision Zero, the County
utilizes the National Highway
Traffic Safety Administration’s
(NHTSA’s) annual
communications calendar for
issue specific timing. For
example, each May is National
Bicycle Safety Month, mid-
September is Child Passenger
Safety Week, and December is
Impaired Driving deterrence.
NHTSA and the Maryland
Highway Safety Office
(MHSO) provide marketing
materials to anyone looking
to spread the message.
11
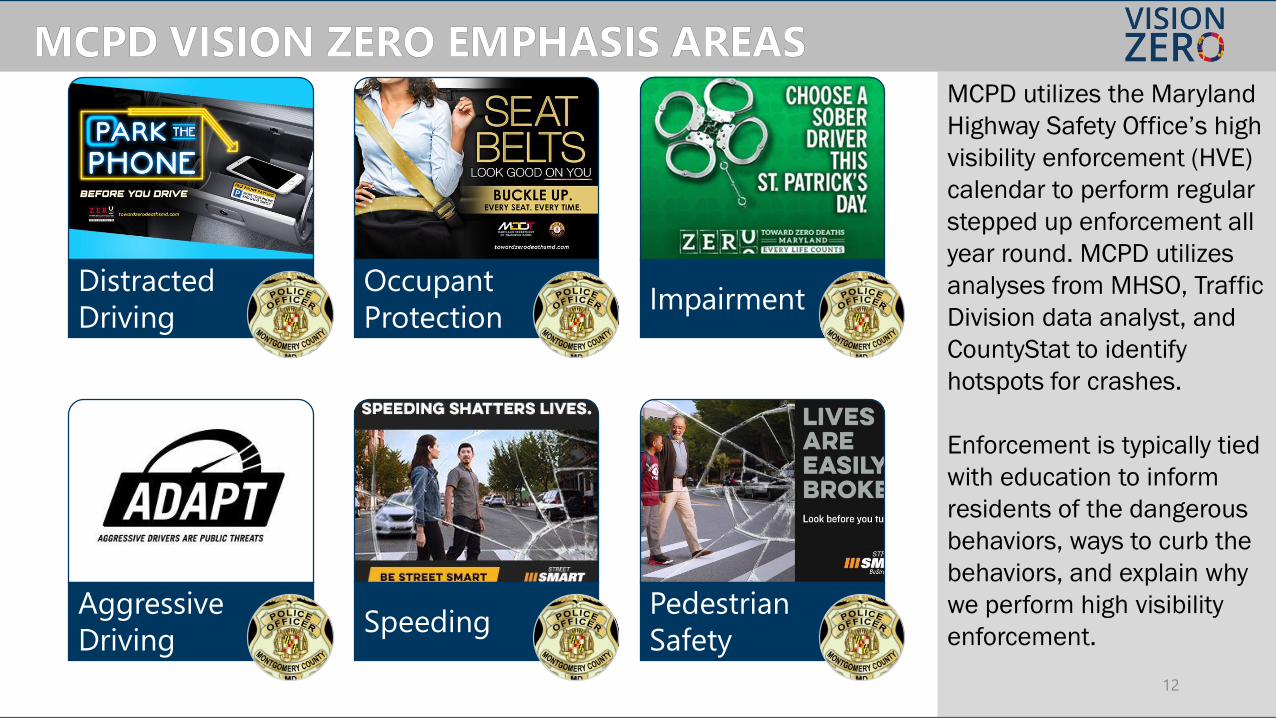
MCPD utilizes the Maryland
Highway Safety Office’s high
visibility enforcement (HVE)
calendar to perform regular
stepped up enforcement all
year round. MCPD utilizes
analyses from MHSO, Traffic
Division data analyst, and
CountyStat to identify
hotspots for crashes.
Enforcement is typically tied
with education to inform
residents of the dangerous
behaviors, ways to curb the
behaviors, and explain why
we perform high visibility
enforcement.
12
Distracted
Driving
Occupant
ProtectionImpairment
Aggressive
DrivingSpeeding
Pedestrian
Safety
13
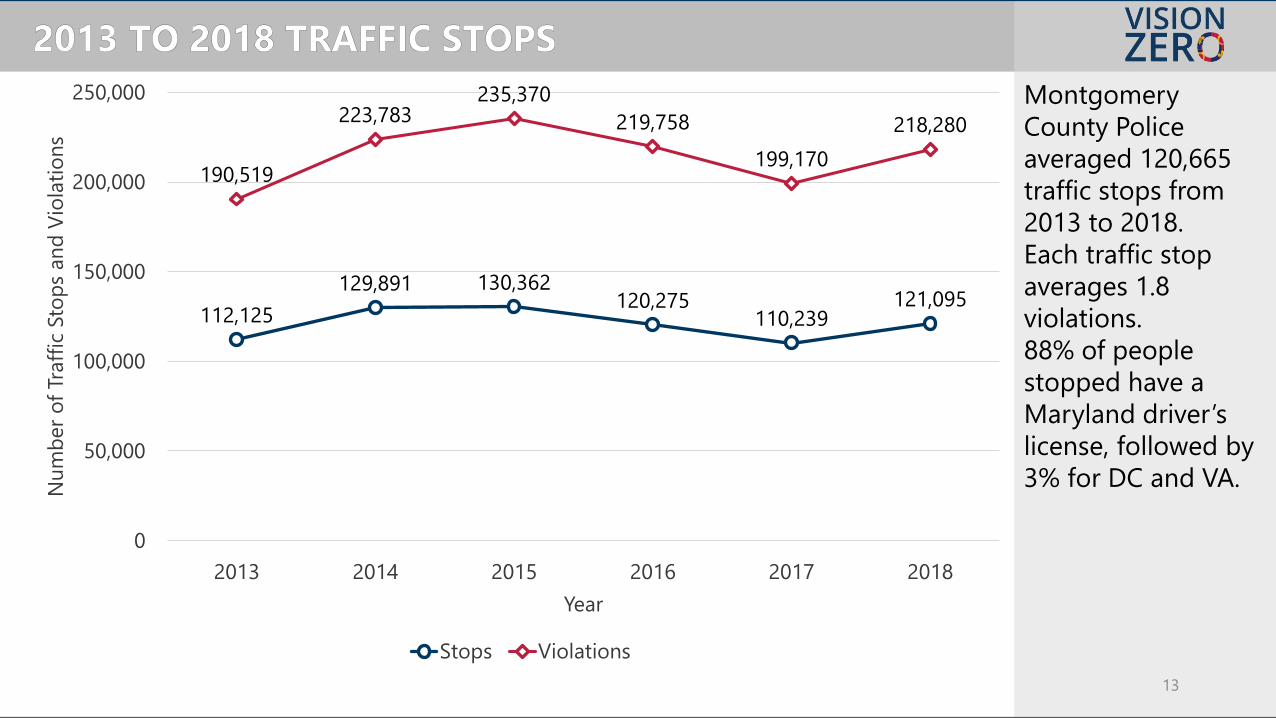
Montgomery
County Police
averaged 120,665
traffic stops from
2013 to 2018.
Each traffic stop
averages 1.8
violations.
88% of people
stopped have a
Maryland driver’s
license, followed by
3% for DC and VA.
112,125
129,891 130,362120,275
110,239121,095
190,519
223,783235,370
219,758
199,170
218,280
0
50,000
100,000
150,000
200,000
250,000
2013 2014 2015 2016 2017 2018
Nu
mb
er
of
Traff
ic S
top
s an
d V
iola
tio
ns
Year
Stops Violations

14
Starting in 2015,
more warnings were
recorded compared
to citations.
The number of
Safety Equipment
Repair Orders
(SEROs) averaged
11,575 during the
time period.
100,318106,989
105,607100,868
81,331 81,65778,498
102,872
115,935
108,058 108,455
126,844
11,703 13,922 13,82810,832 9,384 9,779
0
20,000
40,000
60,000
80,000
100,000
120,000
140,000
2013 2014 2015 2016 2017 2018
Nu
mb
er
of
Vio
lati
on
s
Year
Citation Warning SERO

15
Top violations are
related to speeding,
violating right-of
way, no or expired
license/registration,
and distracted
driving. Note that
charges, such as
those related to
driving under a
suspended license
or registration, have
related charges.
Violation
Avg.
Violations
per Year
Violation
Avg.
Violations
per Year
Exceeding The Posted Speed Limit 25,974
Person Driving Motor Vehicle On Highway Or
Public Use Property On Suspended License
And Privilege
4,150
Driver Failure To Obey Properly Placed
Traffic Control Device17,363
Person Driving Motor Vehicle While License
Suspended Under [Various Rules]3,792
Failure To Display Registration Card
Upon Demand By Police Officer10,237
Driving Vehicle In Excess Of Reasonable And
Prudent Speed On Highway3,610
Driver Failure To Stop At Stop Sign Line 6,816Driving Vehicle On Highway Without Current
Registration Plates And Validation Tabs3,438
Driving Vehicle On Highway With
Suspended Registration6,788 Operator Not Restrained By Seatbelt 3,136
Driver Using Hands To Use Handheld
Phone While Motor Vehicle In Motion5,718 Driver Changing Lanes When Unsafe 3,101
Failure Of Individual Driving On
Highway To Display License To
Uniformed Police On Demand
5,710
Failure Of Veh. On Hwy. To Display Lighted
Lamps, Illuminating Device In Unfavorable
Visibility Cond
2,980
Displaying Expired Registration Plate
Issued By Any State5,203
Negligent Driving Vehicle In Careless And
Imprudent Manner Endangering Property, Life
And Person
2,673
Driving Motor Vehicle On Highway
Without Required License And
Authorization
4,546Failure To Attach Vehicle Registration Plates At
Front And Rear2,585
Repair order - Stop Lights 4,513Driver Failure To Stop At Steady Circular Red
Signal2,540

16
Legend:Violation
Avg.
Violations
per Year
Violation
Avg.
Violations
per Year
Exceeding The Posted Speed Limit 25,974
Person Driving Motor Vehicle On Highway Or
Public Use Property On Suspended License
And Privilege
4,150
Driver Failure To Obey Properly Placed
Traffic Control Device17,363
Person Driving Motor Vehicle While License
Suspended Under [Various Rules]3,792
Failure To Display Registration Card
Upon Demand By Police Officer10,237
Driving Vehicle In Excess Of Reasonable And
Prudent Speed On Highway3,610
Driver Failure To Stop At Stop Sign Line 6,816Driving Vehicle On Highway Without Current
Registration Plates And Validation Tabs3,438
Driving Vehicle On Highway With
Suspended Registration6,788 Operator Not Restrained By Seatbelt 3,136
Driver Using Hands To Use Handheld
Phone While Motor Vehicle In Motion5,718 Driver Changing Lanes When Unsafe 3,101
Failure Of Individual Driving On
Highway To Display License To
Uniformed Police On Demand
5,710
Failure Of Veh. On Hwy. To Display Lighted
Lamps, Illuminating Device In Unfavorable
Visibility Cond
2,980
Displaying Expired Registration Plate
Issued By Any State5,203
Negligent Driving Vehicle In Careless And
Imprudent Manner Endangering Property, Life
And Person
2,673
Driving Motor Vehicle On Highway
Without Required License And
Authorization
4,546Failure To Attach Vehicle Registration Plates At
Front And Rear2,585
Repair order - Stop Lights 4,513Driver Failure To Stop At Steady Circular Red
Signal2,540
Aggressive
Driving
Equipment
License/
Registration
Mobile Phone
Right of Way
Seatbelt Use
Speeding

17
Montgomery
County Police
arrested on average
3,323 people for
driving under the
influence from 2013
to 2018. The top
months for DUI
stops are in
November and
December when the
holiday task force is
underway.
3,302 3,324
3,4823,605 3,160
3,062
0
500
1,000
1,500
2,000
2,500
3,000
3,500
4,000
2013 2014 2015 2016 2017 2018
DU
I C
harg
es
Year

18
Montgomery
County Police utilize
crash and citation
data to prioritize
locations for DUI
high visibility
enforcement and
checkpoints. The
map shows areas
with higher rates of
DUI crashes and
citations around
Halloween 2014-
2017.

19
The number of
violations written to
drivers violating
pedestrians’ right of
way and pedestrians
crossing illegally
were nearly equal
each year. MCPD
conducts 280
pedestrian safety
details each year.
838 867
1,009
1,3081,264
864
692
986
1,818
1,247
1,131
918
0
200
400
600
800
1,000
1,200
1,400
1,600
1,800
2,000
2013 2014 2015 2016 2017 2018
Nu
mb
er
of
Vio
lati
on
s
Year
Drivers Pedestrians

20
The map on the left
shows pedestrian
safety enforcement
locations and
density of violations
from 2013 to 2018.
Enforcement against
drivers and
pedestrians are
based on the
Pedestrian High
Injury Areas and the
Vision Zero High
Injury Network.

21
AUTOMATED
ENFORCEMENT

22
Placement of speed
cameras are set by
Maryland state law,
Traffic Article 21-
809.
Legal Requirements, cameras can only be placed
• Residential roads with a speed limit of 35 MPH or less OR
• School Zones
Site Selection:
• Pre-enforcement verification: requests from citizens,
collision data, community and environmental concerns
(places of worship, schools, public facilities, etc.),
pedestrian activity
• Data collection and analysis
• Site Visit
• Approval by Citizen Advisory Board for Traffic Issues (CAB-
TI), and the Director of MCP’s Traffic Division. The Traffic
Division Director has final approval.
23
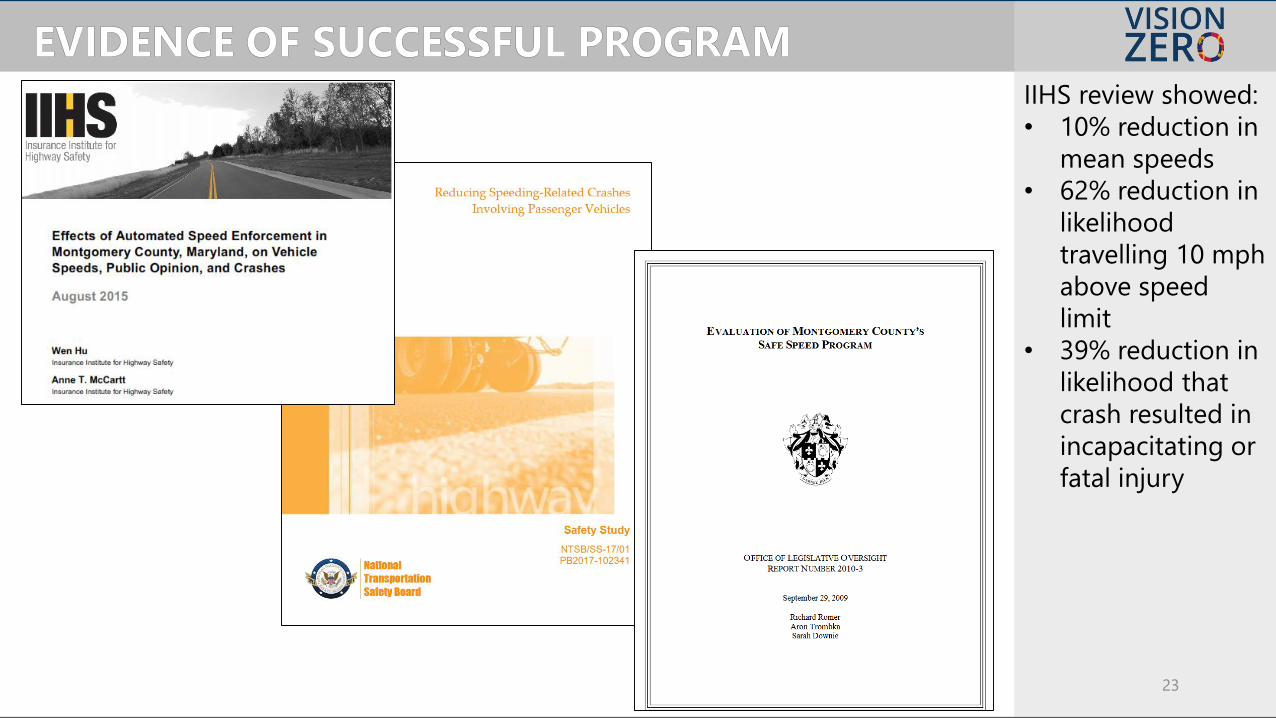
IIHS review showed:
• 10% reduction in
mean speeds
• 62% reduction in
likelihood
travelling 10 mph
above speed
limit
• 39% reduction in
likelihood that
crash resulted in
incapacitating or
fatal injury

24
DRAFTING EQUITY
FRAMEWORK

25
Patient Arrives Intake ProcessPriority is
Determined
Processed in
Order of
Priority
Decision
Framework

26
Vision Zero
Request
Evaluation
Process
Priority is
Determined
Processed in
Order of
Priority
Decision
Framework

1. Definition
2. Discussion
Questions
How do you define
equity of
Montgomery
County’s Vision
Zero Program?
What does Equity
look like if we are
able to achieve it? 27
28
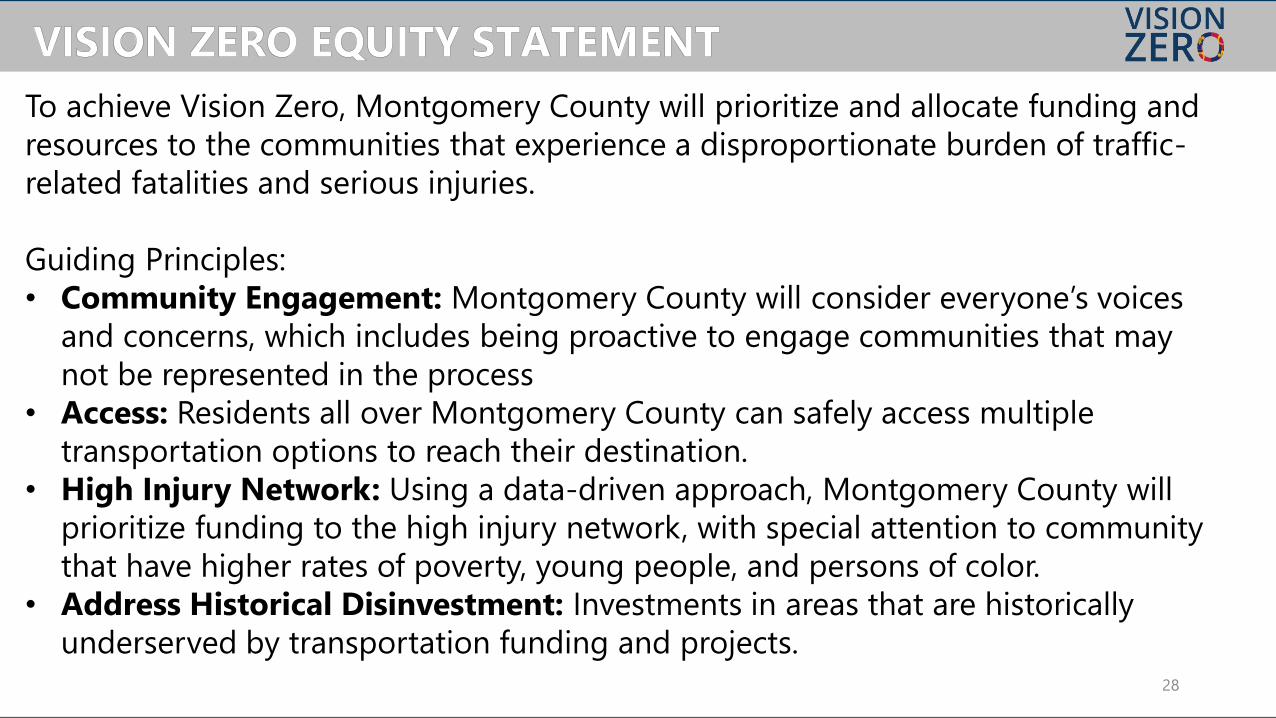
To achieve Vision Zero, Montgomery County will prioritize and allocate funding and
resources to the communities that experience a disproportionate burden of traffic-
related fatalities and serious injuries.
Guiding Principles:
• Community Engagement: Montgomery County will consider everyone’s voices
and concerns, which includes being proactive to engage communities that may
not be represented in the process
• Access: Residents all over Montgomery County can safely access multiple
transportation options to reach their destination.
• High Injury Network: Using a data-driven approach, Montgomery County will
prioritize funding to the high injury network, with special attention to community
that have higher rates of poverty, young people, and persons of color.
• Address Historical Disinvestment: Investments in areas that are historically
underserved by transportation funding and projects.
NO TRAFFIC DEATHS BY 2030
IN MONTGOMERY COUNTY
29https://www.montgomerycountymd.gov/visionzero/

30
APPENDIX

31
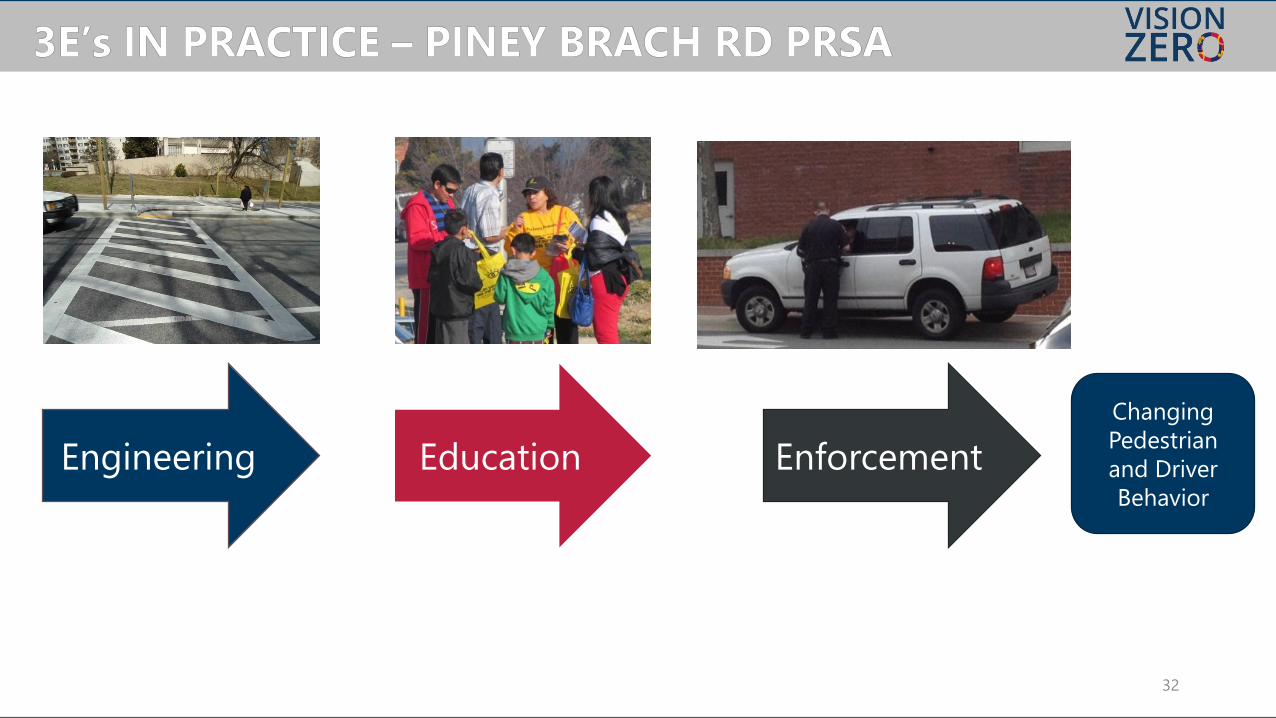
THE “3Es”
IN PRACTICE
32
Changing
Pedestrian
and Driver
Behavior
Engineering EnforcementEducation
33
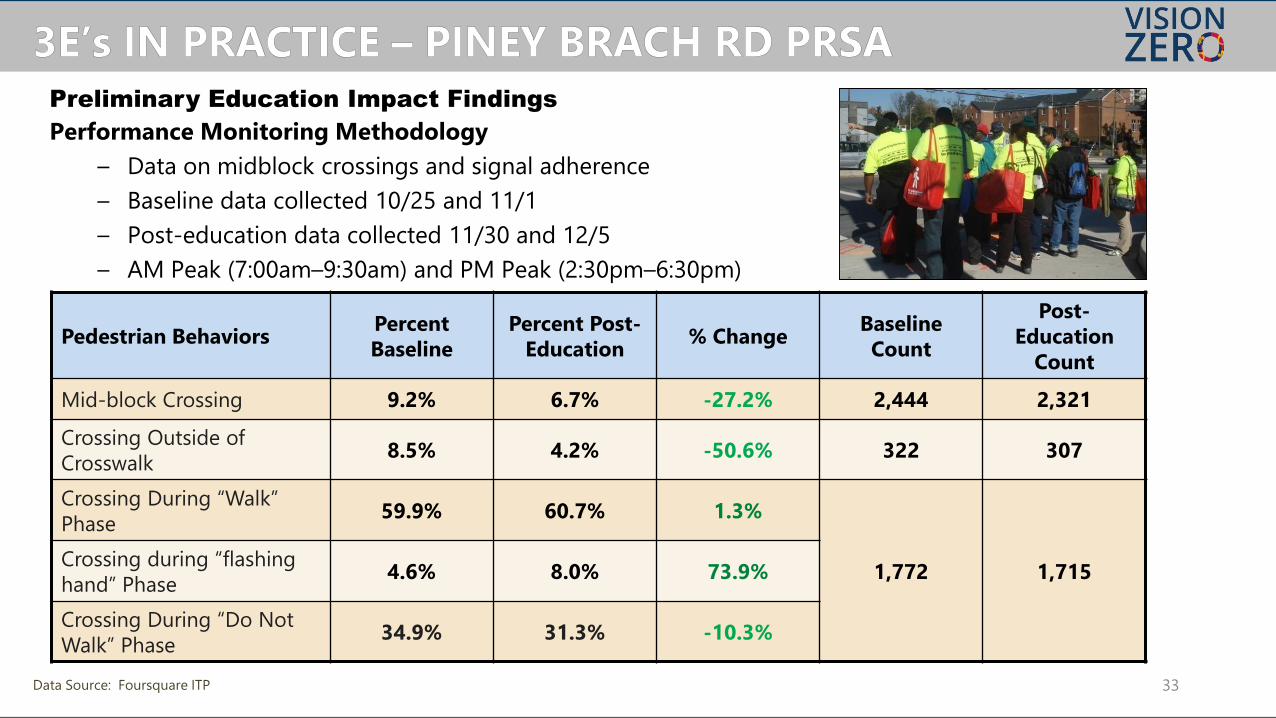
Performance Monitoring Methodology
– Data on midblock crossings and signal adherence
– Baseline data collected 10/25 and 11/1
– Post-education data collected 11/30 and 12/5
– AM Peak (7:00am–9:30am) and PM Peak (2:30pm–6:30pm)
Preliminary Education Impact Findings
Pedestrian BehaviorsPercent
Baseline
Percent Post-
Education% Change
Baseline
Count
Post-
Education
Count
Mid-block Crossing 9.2% 6.7% -27.2% 2,444 2,321
Crossing Outside of
Crosswalk8.5% 4.2% -50.6% 322 307
Crossing During “Walk”
Phase59.9% 60.7% 1.3%
1,772 1,715Crossing during “flashing
hand” Phase4.6% 8.0% 73.9%
Crossing During “Do Not
Walk” Phase34.9% 31.3% -10.3%
Data Source: Foursquare ITP

34
RECAP OF
DATA PRESENTATION

The High Injury Network
(HIN) identifies roadway
segments that have a
higher amount of crashes
(at least one crash per mile
per year) relative to the
amount of traffic on that
road. MCDOT uses this
initial list to identify
roadways for engineering
improvements.
35
Legend
Crash Rate
Low
Low – Medium
Medium
Medium – High
High

275256
202181
168155
130
259
0
50
100
150
200
250
300
13-19 20-29 30-39 40-49 50-59 60-69 70-79 80+
Dri
vers
KSI p
er
100k R
eg
iste
red
Age Group
5
31
53
34 3539
4643
47
0
10
20
30
40
50
60
0-9 10-19 20-29 30-39 40-49 50-59 60-69 70-79 80+
Ped
est
rian
s K
SI p
er
100k p
op
.
Age Group
1
18
8 8 8
10
6
9
5
0
2
4
6
8
10
12
14
16
18
20
0-9 10-19 20-29 30-39 40-49 50-59 60-69 70-79 80+
Cycl
ists
KSI p
er
100k p
op
.
Age Group36
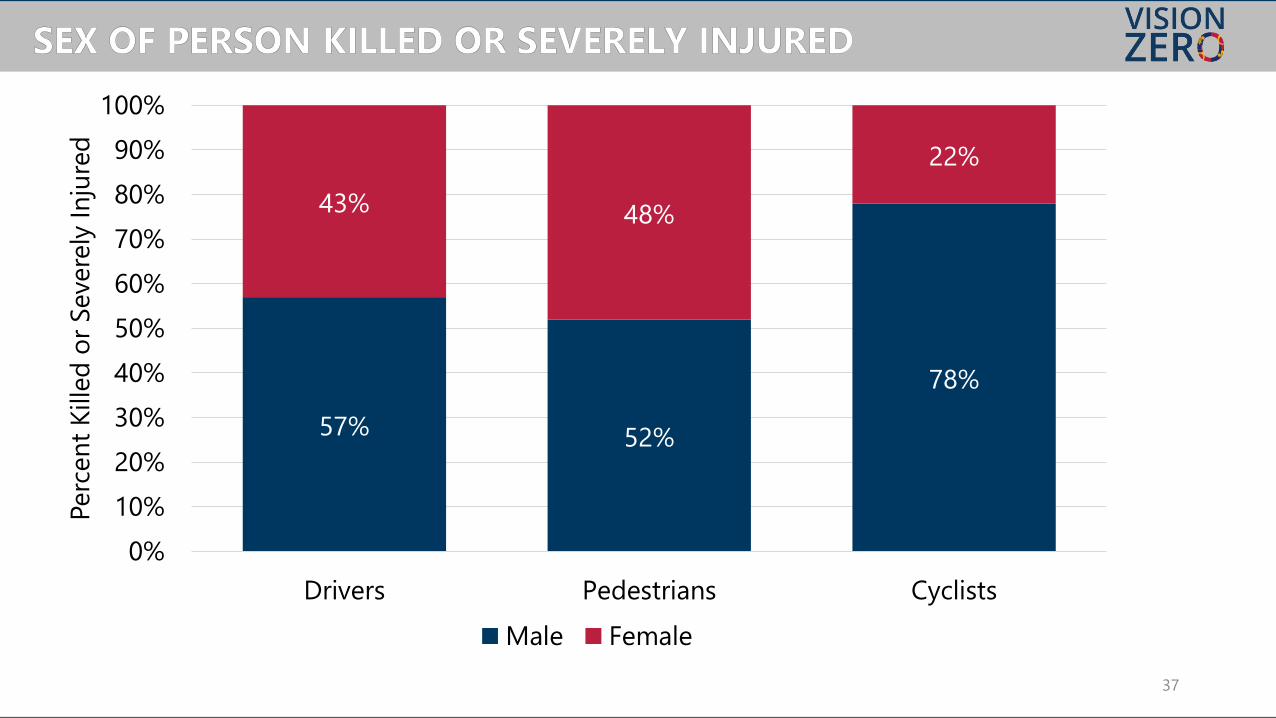
57% 52%
78%
43% 48%
22%
0%
10%
20%
30%
40%
50%
60%
70%
80%
90%
100%
Drivers Pedestrians Cyclists
Perc
en
t K
ille
d o
r Severe
ly In
jure
d
Male Female
37
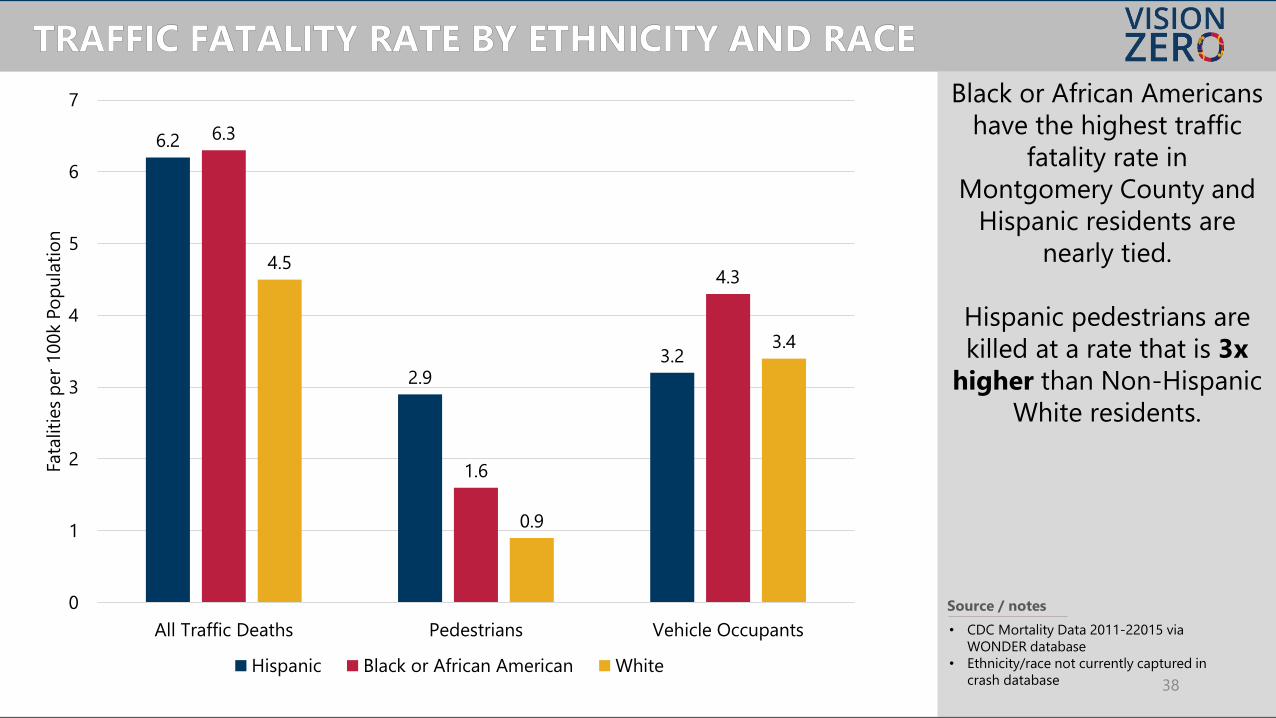
Black or African Americans
have the highest traffic
fatality rate in
Montgomery County and
Hispanic residents are
nearly tied.
Hispanic pedestrians are
killed at a rate that is 3x
higher than Non-Hispanic
White residents.
38
6.2
2.93.2
6.3
1.6
4.34.5
0.9
3.4
0
1
2
3
4
5
6
7
All Traffic Deaths Pedestrians Vehicle Occupants
Fata
liti
es
per
100k P
op
ula
tio
n
Hispanic Black or African American White
Source / notes
• CDC Mortality Data 2011-22015 via
WONDER database
• Ethnicity/race not currently captured in
crash database
39
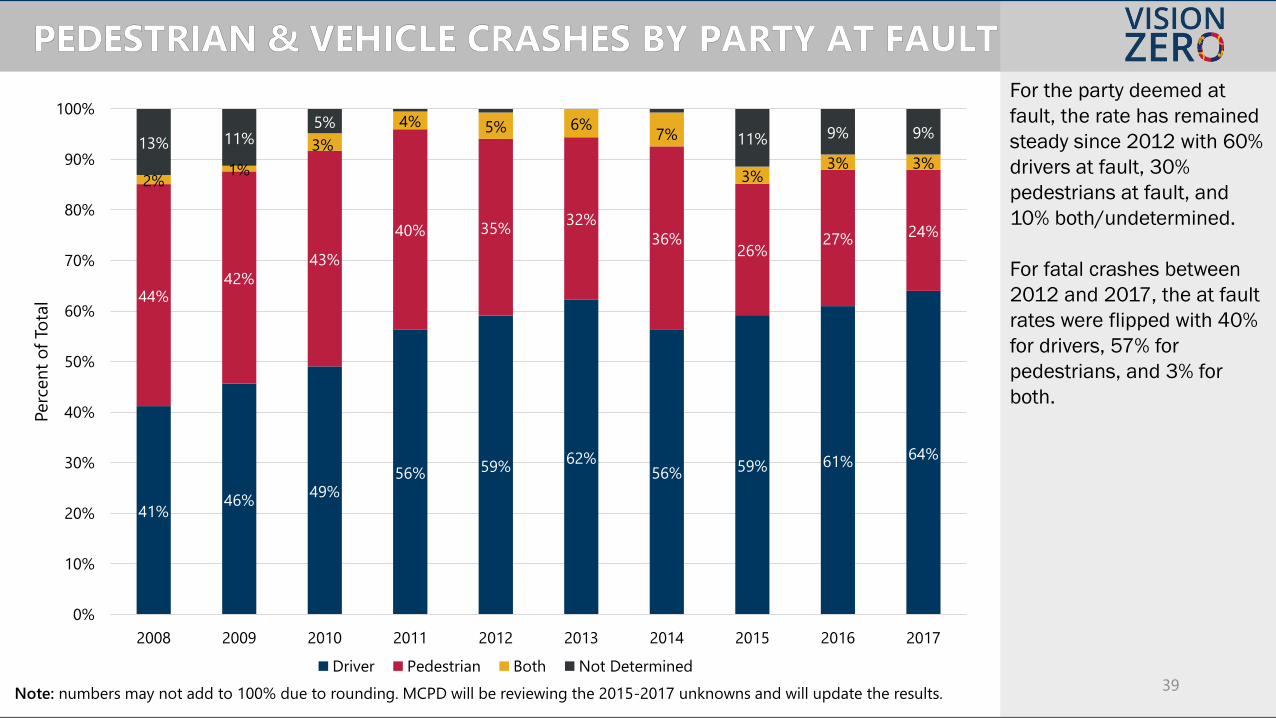
41%46%
49%56% 59%
62%56% 59% 61%
64%
44%42%
43%
40% 35%32%
36%26%
27%24%
2%1%
3%
4% 5% 6%7%
3%3% 3%
13% 11%5%
11% 9% 9%
0%
10%
20%
30%
40%
50%
60%
70%
80%
90%
100%
2008 2009 2010 2011 2012 2013 2014 2015 2016 2017
Perc
en
t o
f To
tal
Driver Pedestrian Both Not Determined
Note: numbers may not add to 100% due to rounding. MCPD will be reviewing the 2015-2017 unknowns and will update the results.
For the party deemed at
fault, the rate has remained
steady since 2012 with 60%
drivers at fault, 30%
pedestrians at fault, and
10% both/undetermined.
For fatal crashes between
2012 and 2017, the at fault
rates were flipped with 40%
for drivers, 57% for
pedestrians, and 3% for
both.
40
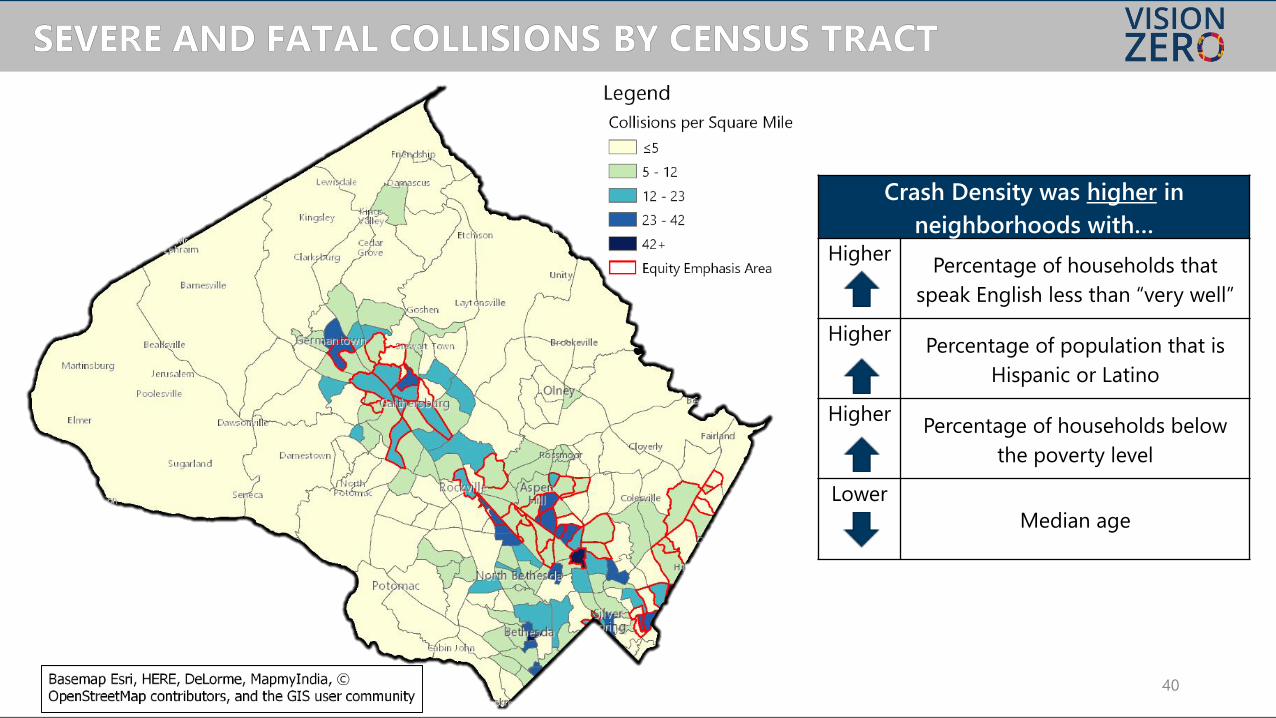
Crash Density was higher in
neighborhoods with…Higher
Percentage of households that
speak English less than “very well”
Higher Percentage of population that is
Hispanic or Latino
HigherPercentage of households below
the poverty level
Lower
Median age