No More Failures: Ten Steps to Equity in Education More Failures TEN STEPS TO EQUITY IN EDUCATION No...
159
Education and Training Policy No More Failures TEN STEPS TO EQUITY IN EDUCATION By Simon Field, Małgorzata Kuczera, Beatriz Pont
Transcript of No More Failures: Ten Steps to Equity in Education More Failures TEN STEPS TO EQUITY IN EDUCATION No...

�����������������������-:HSTCQE=UXWZ^U:
The full text of this book is available on line via this link: www.sourceoecd.org/education/9789264032590
Those with access to all OECD books on line should use this link: www.sourceoecd.org/9789264032590
SourceOECD is the OECD’s online library of books, periodicals and statistical databases. For more information about this award-winning service and free trials, ask your librarian, or write to us at [email protected].
ISBN 978-92-64-03259-0 91 2007 04 1 P
Education and Training Policy
No More Failures TEN STEPS TO EQUITY IN EDUCATIONNo More Failures challenges the assumption that there will always be failures and dropouts, those who can’t or won’t make it in school. In fact, initiatives in many countries demonstrate that it is possible to successfully tackle school failure and dropout rates – and to reduce the huge social cost of adults without basic skills. This book offers a valuable comparative perspective on how different countries have handled equity in education. Among the issues it explores:
• tracking, streaming and academic selection;
• school choice;
• secondary education structures and second chance programmes;
• grade repetition;
• links between school and home;
• early childhood education;
• resource allocation;
• targets for equity;
• the special needs of migrants and minorities.
The book identifies three key areas for delivering equity in education: the design of education systems, classroom practices and resourcing. It proposes ten concrete policy measures, backed by evidence, on how to reduce school failure and dropout rates. It will be of special interest to policy makers, school leaders, teachers and parents.
Ed
ucation and
Training P
olicy
No
Mo
re Failures
Education and Training Policy
No More Failures TEN STEPS TO EQUITY IN EDUCATION
By Simon Field, Małgorzata Kuczera, Beatriz Pont


EDUCATION AND TRAINING POLICY
No More Failures: Ten Steps to Equity
in Education
by
Simon Field, Malgorzata Kuczera, Beatriz Pontł

ORGANISATION FOR ECONOMIC CO-OPERATION AND DEVELOPMENT
The OECD is a unique forum where the governments of 30 democracies worktogether to address the economic, social and environmental challenges of globalisation.The OECD is also at the forefront of efforts to understand and to help governmentsrespond to new developments and concerns, such as corporate governance, theinformation economy and the challenges of an ageing population. The Organisationprovides a setting where governments can compare policy experiences, seek answers tocommon problems, identify good practice and work to co-ordinate domestic andinternational policies.
The OECD member countries are: Australia, Austria, Belgium, Canada, theCzech Republic, Denmark, Finland, France, Germany, Greece, Hungary, Iceland,Ireland, Italy, Japan, Korea, Luxembourg, Mexico, the Netherlands, New Zealand,Norway, Poland, Portugal, the Slovak Republic, Spain, Sweden, Switzerland, Turkey,the United Kingdom and the United States. The Commission of the EuropeanCommunities takes part in the work of the OECD.
OECD Publishing disseminates widely the results of the Organisation’s statisticsgathering and research on economic, social and environmental issues, as well as theconventions, guidelines and standards agreed by its members.
Also available in French under the title:
En finir avec l’échec scolaire : Dix mesures pour une éducation équitable
Corrigenda to OECD publications may be found on line at: www.oecd.org/publishing/corrigenda.
© OECD 2007
No reproduction, copy, transmission or translation of this publication may be made without written permission.
Applications should be sent to OECD Publishing [email protected] or by fax 33 1 45 24 99 30. Permission to photocopy a
portion of this work should be addressed to the Centre français d’exploitation du droit de copie (CFC), 20, rue des
Grands-Augustins, 75006 Paris, France, fax 33 1 46 34 67 19, [email protected] or (for US only) to Copyright Clearance
Center (CCC), 222 Rosewood Drive, Danvers, MA 01923, USA, fax 1 978 646 8600, [email protected].
This work is published on the responsibility of the Secretary-General of
the OECD. The opinions expressed and arguments employed herein do not
necessarily reflect the official views of the Organisation or of the governments
of its member countries.
FOREWORD
ForewordThere is growing attention to the issue of equity in education. Mass expansion ineducation systems was linked to a wave of optimism that it would enable youngpeople, regardless of background, to achieve their full potential. If much has beenachieved, there has also been much disappointment. The spotlight of OECD’s PISAassessments reminds us that in many countries an unacceptably large number ofyoung people are failing to acquire basic skills. No More Failures sets out a challengeto failure, both in individual learners and in education systems, and advances ten stepsin an agenda for enhancing equity in education.
The book is based on an OECD study on equity in education, but it also draws onevidence from across the OECD. The ten participant countries each prepared ananalytical background report, and in five countries an OECD team of experts conducteda review visit and produced a report with policy recommendations. All these reports areavailable on the OECD website at www.oecd.org/edu/equity/equityineducation.
No More Failures argues that equity in education is a key objective of educationsystems and that it needs to be addressed on three fronts: the design of educationsystems, educational practices and resourcing. The book is designed to be accessible tobusy people. The ten steps are set out in a single page at the outset, then expanded –but still in summary form – to provide the key supporting evidence. The detailed reportfollows.
The authors are indebted to the countries who took part in the study, to delegatesof other countries, to the expert teams who participated in the country visits andprovided invaluable comments on the report, and to OECD colleagues in the Directoratefor Education and the Directorate for Employment, Labour and Social Affairs. Ourparticular thanks to Susan Copeland for her role in preparing the final text and toChristine Mercier for the French translation.
NO MORE FAILURES: TEN STEPS TO EQUITY IN EDUCATION – ISBN 978-92-64-03259-0 – © OECD 2007 3


TABLE OF CONTENTS
Table of contentsThe Ten Steps . . . . . . . . . . . . . . . . . . . . . . . . . . . . . . . . . . . . . . . . . . . . . . . . . . . 9
Executive Summary. . . . . . . . . . . . . . . . . . . . . . . . . . . . . . . . . . . . . . . . . . . . . . 11
Chapter 1. Introduction: Setting the Agenda . . . . . . . . . . . . . . . . . . . . . . . . . 251.1. Why look at equity in education? . . . . . . . . . . . . . . . . . . . . . . . . . . 261.2. Background to this study . . . . . . . . . . . . . . . . . . . . . . . . . . . . . . . . . 271.3. The context: equity as a public policy objective . . . . . . . . . . . . . . 291.4. Why equity in education?. . . . . . . . . . . . . . . . . . . . . . . . . . . . . . . . . 31References . . . . . . . . . . . . . . . . . . . . . . . . . . . . . . . . . . . . . . . . . . . . . . . . . 34
Chapter 2. A Look at Inequities in Education . . . . . . . . . . . . . . . . . . . . . . . . 372.1. Unequal improvements in educational attainment . . . . . . . . . . . 382.2. Equity as fairness . . . . . . . . . . . . . . . . . . . . . . . . . . . . . . . . . . . . . . . . 412.3. Equity as inclusion. . . . . . . . . . . . . . . . . . . . . . . . . . . . . . . . . . . . . . . 442.4. The two dimensions of equity overlap . . . . . . . . . . . . . . . . . . . . . 482.5. Policy implications . . . . . . . . . . . . . . . . . . . . . . . . . . . . . . . . . . . . . . 50References . . . . . . . . . . . . . . . . . . . . . . . . . . . . . . . . . . . . . . . . . . . . . . . . . . 52
Chapter 3. Structures and Pathways . . . . . . . . . . . . . . . . . . . . . . . . . . . . . . . . 553.1. Differentiation in schooling structures and the risks to equity . 563.2. Early tracking and comprehensive schooling . . . . . . . . . . . . . . . . 653.3. Designing an inclusive upper secondary education system . . . . 673.4. Removing dead ends and providing second chances. . . . . . . . . . 743.5. Summary conclusions and recommendations . . . . . . . . . . . . . . . 78Annex 3.A1. Correlation coefficients between separation index
and PISA outcomes. . . . . . . . . . . . . . . . . . . . . . . . . . . . . . . . 81Annex 3.A2. Regression analysis: Effects of selection by ability
on different measures . . . . . . . . . . . . . . . . . . . . . . . . . . . . . 81Notes . . . . . . . . . . . . . . . . . . . . . . . . . . . . . . . . . . . . . . . . . . . . . . . . . . . . . . 82References . . . . . . . . . . . . . . . . . . . . . . . . . . . . . . . . . . . . . . . . . . . . . . . . . . 82
Chapter 4. School and Out-of-school Practices . . . . . . . . . . . . . . . . . . . . . . . 874.1. Equity in the classroom: interventions for those in need . . . . . . 884.2. Schools reaching out to homes . . . . . . . . . . . . . . . . . . . . . . . . . . . . 994.3. Home influence on school performance . . . . . . . . . . . . . . . . . . . . 1014.4. Summary conclusions and recommendations . . . . . . . . . . . . . . . 106References . . . . . . . . . . . . . . . . . . . . . . . . . . . . . . . . . . . . . . . . . . . . . . . . . . 108
NO MORE FAILURES: TEN STEPS TO EQUITY IN EDUCATION – ISBN 978-92-64-03259-0 – © OECD 2007 5
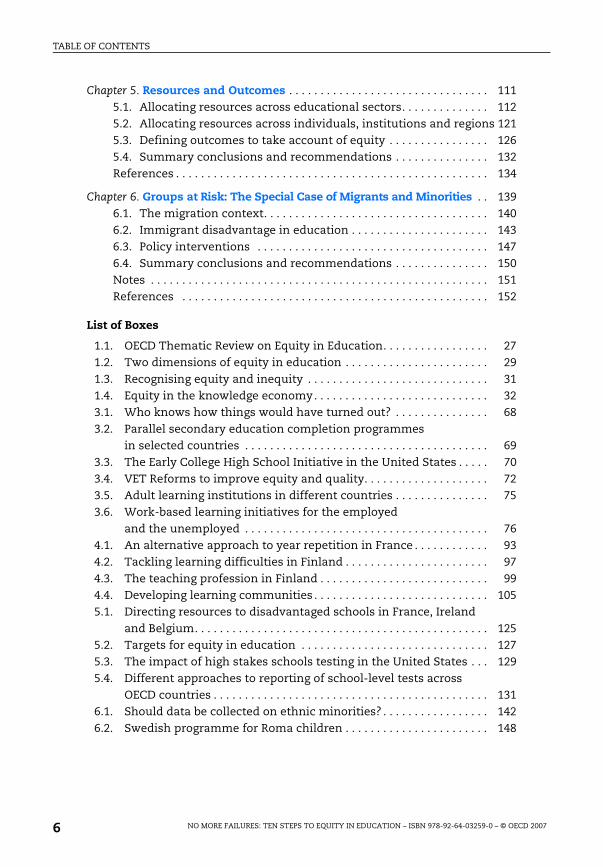
TABLE OF CONTENTS
Chapter 5. Resources and Outcomes . . . . . . . . . . . . . . . . . . . . . . . . . . . . . . . . 1115.1. Allocating resources across educational sectors. . . . . . . . . . . . . . 1125.2. Allocating resources across individuals, institutions and regions 1215.3. Defining outcomes to take account of equity . . . . . . . . . . . . . . . . 1265.4. Summary conclusions and recommendations . . . . . . . . . . . . . . . 132References . . . . . . . . . . . . . . . . . . . . . . . . . . . . . . . . . . . . . . . . . . . . . . . . . . 134
Chapter 6. Groups at Risk: The Special Case of Migrants and Minorities . . 1396.1. The migration context. . . . . . . . . . . . . . . . . . . . . . . . . . . . . . . . . . . . 1406.2. Immigrant disadvantage in education . . . . . . . . . . . . . . . . . . . . . . 1436.3. Policy interventions . . . . . . . . . . . . . . . . . . . . . . . . . . . . . . . . . . . . . 1476.4. Summary conclusions and recommendations . . . . . . . . . . . . . . . 150Notes . . . . . . . . . . . . . . . . . . . . . . . . . . . . . . . . . . . . . . . . . . . . . . . . . . . . . . 151References . . . . . . . . . . . . . . . . . . . . . . . . . . . . . . . . . . . . . . . . . . . . . . . . . 152
List of Boxes
1.1. OECD Thematic Review on Equity in Education. . . . . . . . . . . . . . . . . 271.2. Two dimensions of equity in education . . . . . . . . . . . . . . . . . . . . . . . 291.3. Recognising equity and inequity . . . . . . . . . . . . . . . . . . . . . . . . . . . . . 311.4. Equity in the knowledge economy. . . . . . . . . . . . . . . . . . . . . . . . . . . . 323.1. Who knows how things would have turned out? . . . . . . . . . . . . . . . 683.2. Parallel secondary education completion programmes
in selected countries . . . . . . . . . . . . . . . . . . . . . . . . . . . . . . . . . . . . . . . 693.3. The Early College High School Initiative in the United States . . . . . 703.4. VET Reforms to improve equity and quality. . . . . . . . . . . . . . . . . . . . 723.5. Adult learning institutions in different countries . . . . . . . . . . . . . . . 753.6. Work-based learning initiatives for the employed
and the unemployed . . . . . . . . . . . . . . . . . . . . . . . . . . . . . . . . . . . . . . . 764.1. An alternative approach to year repetition in France . . . . . . . . . . . . 934.2. Tackling learning difficulties in Finland . . . . . . . . . . . . . . . . . . . . . . . 974.3. The teaching profession in Finland . . . . . . . . . . . . . . . . . . . . . . . . . . . 994.4. Developing learning communities . . . . . . . . . . . . . . . . . . . . . . . . . . . . 1055.1. Directing resources to disadvantaged schools in France, Ireland
and Belgium. . . . . . . . . . . . . . . . . . . . . . . . . . . . . . . . . . . . . . . . . . . . . . . 1255.2. Targets for equity in education . . . . . . . . . . . . . . . . . . . . . . . . . . . . . . 1275.3. The impact of high stakes schools testing in the United States . . . 1295.4. Different approaches to reporting of school-level tests across
OECD countries . . . . . . . . . . . . . . . . . . . . . . . . . . . . . . . . . . . . . . . . . . . . 1316.1. Should data be collected on ethnic minorities? . . . . . . . . . . . . . . . . . 1426.2. Swedish programme for Roma children . . . . . . . . . . . . . . . . . . . . . . . 148
NO MORE FAILURES: TEN STEPS TO EQUITY IN EDUCATION – ISBN 978-92-64-03259-0 – © OECD 20076
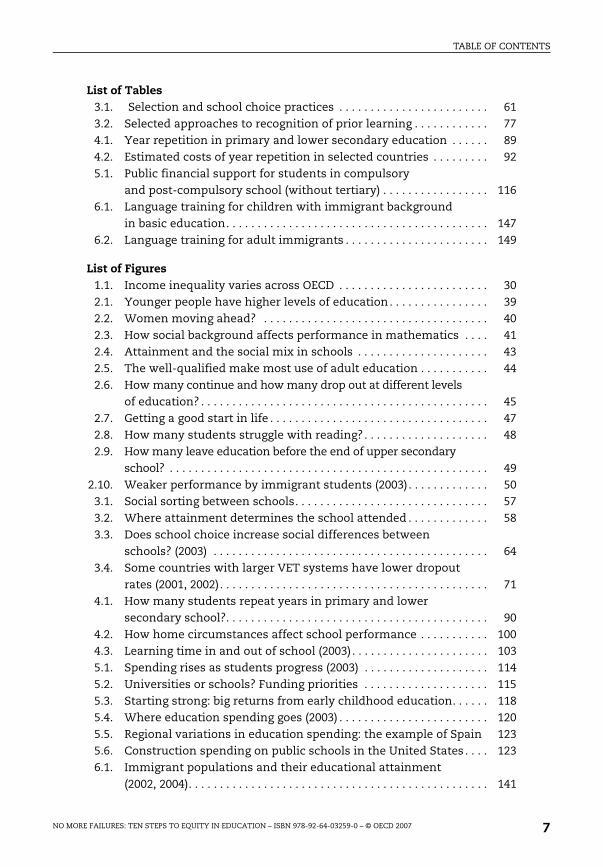
TABLE OF CONTENTS
List of Tables3.1. Selection and school choice practices . . . . . . . . . . . . . . . . . . . . . . . . 613.2. Selected approaches to recognition of prior learning . . . . . . . . . . . . 774.1. Year repetition in primary and lower secondary education . . . . . . 894.2. Estimated costs of year repetition in selected countries . . . . . . . . . 925.1. Public financial support for students in compulsory
and post-compulsory school (without tertiary) . . . . . . . . . . . . . . . . . 1166.1. Language training for children with immigrant background
in basic education. . . . . . . . . . . . . . . . . . . . . . . . . . . . . . . . . . . . . . . . . . 1476.2. Language training for adult immigrants . . . . . . . . . . . . . . . . . . . . . . . 149
List of Figures1.1. Income inequality varies across OECD . . . . . . . . . . . . . . . . . . . . . . . . 302.1. Younger people have higher levels of education. . . . . . . . . . . . . . . . 392.2. Women moving ahead? . . . . . . . . . . . . . . . . . . . . . . . . . . . . . . . . . . . . 402.3. How social background affects performance in mathematics . . . . 412.4. Attainment and the social mix in schools . . . . . . . . . . . . . . . . . . . . . 432.5. The well-qualified make most use of adult education . . . . . . . . . . . 442.6. How many continue and how many drop out at different levels
of education? . . . . . . . . . . . . . . . . . . . . . . . . . . . . . . . . . . . . . . . . . . . . . . 452.7. Getting a good start in life . . . . . . . . . . . . . . . . . . . . . . . . . . . . . . . . . . . 472.8. How many students struggle with reading?. . . . . . . . . . . . . . . . . . . . 482.9. How many leave education before the end of upper secondary
school? . . . . . . . . . . . . . . . . . . . . . . . . . . . . . . . . . . . . . . . . . . . . . . . . . . . 492.10. Weaker performance by immigrant students (2003) . . . . . . . . . . . . . 50
3.1. Social sorting between schools. . . . . . . . . . . . . . . . . . . . . . . . . . . . . . . 573.2. Where attainment determines the school attended . . . . . . . . . . . . . 583.3. Does school choice increase social differences between
schools? (2003) . . . . . . . . . . . . . . . . . . . . . . . . . . . . . . . . . . . . . . . . . . . . 643.4. Some countries with larger VET systems have lower dropout
rates (2001, 2002). . . . . . . . . . . . . . . . . . . . . . . . . . . . . . . . . . . . . . . . . . . 714.1. How many students repeat years in primary and lower
secondary school?. . . . . . . . . . . . . . . . . . . . . . . . . . . . . . . . . . . . . . . . . . 904.2. How home circumstances affect school performance . . . . . . . . . . . 1004.3. Learning time in and out of school (2003) . . . . . . . . . . . . . . . . . . . . . . 1035.1. Spending rises as students progress (2003) . . . . . . . . . . . . . . . . . . . . 1145.2. Universities or schools? Funding priorities . . . . . . . . . . . . . . . . . . . . 1155.3. Starting strong: big returns from early childhood education. . . . . . 1185.4. Where education spending goes (2003) . . . . . . . . . . . . . . . . . . . . . . . . 1205.5. Regional variations in education spending: the example of Spain 1235.6. Construction spending on public schools in the United States . . . . 1236.1. Immigrant populations and their educational attainment
(2002, 2004). . . . . . . . . . . . . . . . . . . . . . . . . . . . . . . . . . . . . . . . . . . . . . . . 141
NO MORE FAILURES: TEN STEPS TO EQUITY IN EDUCATION – ISBN 978-92-64-03259-0 – © OECD 2007 7

ISBN 978-92-64-03259-0
No More Failures: Ten Steps to Equity in Education
© OECD 2007
The Ten Steps
Policy Recommendations for Equity in Education
This report argues that education systems need to be fair and inclusive in their
design, practices, and resourcing. It advances ten steps – major policy
recommendations – which would reduce school failure and dropout, make society
fairer and avoid the large social costs of marginalised adults with few basic skills.
Design
1. Limit early tracking and streaming and postpone academic selection.
2. Manage school choice so as to contain the risks to equity.
3. In upper secondary education, provide attractive alternatives, remove dead ends
and prevent dropout.
4. Offer second chances to gain from education.
Practices
5. Identify and provide systematic help to those who fall behind at school and
reduce year repetition.
6. Strengthen the links between school and home to help disadvantaged parents
help their children to learn.
7. Respond to diversity and provide for the successful inclusion of migrants and
minorities within mainstream education.
Resourcing
8. Provide strong education for all, giving priority to early childhood provision and
basic schooling.
9. Direct resources to students and regions with the greatest needs.
10. Set concrete targets for more equity, particularly related to low school
attainment and dropouts.
The report advances recommendations on priorities for spending within a limited
budget, allowing for public expenditure constraints. Actual costs or savings arising
from these recommendations have not been estimated, as they will depend on
national contexts.
9


EXECUTIVE SUMMARY
Executive Summary
Introduction
Defining equity in education
Equity in education has two dimensions. The first is fairness, whichimplies ensuring that personal and social circumstances – for example gender,socio-economic status or ethnic origin – should not be an obstacle to achievingeducational potential. The second is inclusion, which implies ensuring a basicminimum standard of education for all – for example that everyone should beable to read, write and do simple arithmetic. The two dimensions are closelyintertwined: tackling school failure helps to overcome the effects of socialdeprivation which often causes school failure.
Why does equity in education matter?
The benefits from education are large. In the United States, for example,workers with tertiary qualifications earn more than double the income ofthose with no post-compulsory qualifications. Education is associated withbetter health, a longer life, successful parenting and civic participation. Fairand inclusive education is one of the most powerful levers available to makesociety more equitable.
Fair and inclusive education is desirable because:
● There is a human rights imperative for people to be able to develop theircapacities and participate fully in society. The right to education isrecognised, for example, in the United Nations Declaration of the Rights ofthe Child and in the constitution of most nations.
● The long-term social and financial costs of educational failure are high.Those without the skills to participate socially and economically generatehigher costs for health, income support, child welfare and security.
● Increased migration poses new challenges for social cohesion in somecountries while other countries face long-standing issues of integratingminorities. Fair and inclusive education for migrants and minorities is a keyto these challenges. Equity in education enhances social cohesion and trust.
NO MORE FAILURES: TEN STEPS TO EQUITY IN EDUCATION – ISBN 978-92-64-03259-0 – © OECD 2007 11

EXECUTIVE SUMMARY
Is education a friend to equity?
● In the past half-century education has expanded, but hopes that this wouldbring about a fairer society have been only partly realised. Women havemade dramatic advances (see Figure 2.2), but social mobility has not risenoverall and inequalities of income and wealth have increased in someplaces.
● The general upgrading of qualifications has highlighted the position ofthose who have not shared in this advance. Many adults remain unqualifiedand some young people still do not successfully complete secondaryeducation. Across the OECD nearly one in three adults (30%) have onlyprimary or lower secondary education – a real disadvantage in terms ofemployment and life chances
Women moving ahead? (Figure 2.2, Chapter 2)Difference between men and women in number of years spent in formal education,
for two different age groups (2004)
1. Year of reference 2003.
Source: OECD (2006), Education at a Glance: OECD Indicators 2006, OECD, Paris.
���� ���� ���� ���� � ��� ��� ��� ��� ��� ���
�� �������� ����� ����� ��������� ��� ��
������������� ���
� � ���� ���� ��!�����"
���#$� � ��%��� ��
&�����#�� ����� ��
'���� �� ���( )#*���+�� ,��#*���+��
-��" �).�/�"+����
���" ��0��� 1�/��2 � ��'�����
&�����#0�����"����,��� ��
3��)��
4� ��
�������5��� ������ 5������5��� ������
%�����# �� ��"���6��#6�" ���
%�����# �� ��"���6��#" ���
NO MORE FAILURES: TEN STEPS TO EQUITY IN EDUCATION – ISBN 978-92-64-03259-0 – © OECD 200712

EXECUTIVE SUMMARY
Where are the big problems?
Figure 2.3 illustrates the problem of unfairness. It shows that in mostOECD countries children from poorer homes are between three and four timesmore likely to be in the lowest scoring group in mathematics at age 15.
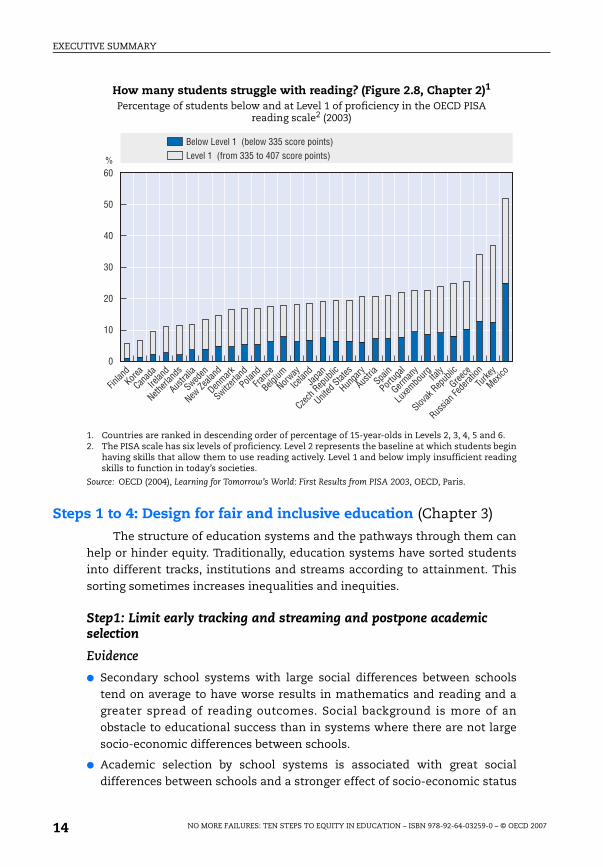
Figure 2.8 illustrates the problem of lack of inclusion. It shows how manystudents struggle with reading in OECD countries and how many risk leavingschool without basic skills for work and life in the 21st century. Significantly,it also shows that there are big differences between countries.
There are three policy domains which may bear on equity in education: thedesign of education systems (covered in Chapter 3), practices in and out of school(Chapter 4) and resourcing (Chapter 5). Chapter 6, which examines the specialcase of migrants and minorities, also contains policy recommendations onpractices. Within these domains, we advance ten steps – major policyrecommendations – to enhance equity in education.
How social background affects performance in mathematics(Figure 2.3, Chapter 2)
Relative chances of students in lowest and highest socio-economic group ending up with very poor (below or at Level 1) performance in mathematics (2003)
1. For example, in Portugal a student with low SES is three times more likely to be a low mathematicsachiever than a student with high SES.
Source: OECD (2006), Education at a Glance: OECD Indicators 2006, OECD, Paris.
7
�
5
�
�
�
�
�� ��
8���#* ���
3��)��
� � 2 � �
�����
���� ��
���� �
�������� ��
������ ��� ��
'�����
��� ��
'���� ��
.�/�"+����0���
���#$� � ��
��� ��
������� ���
&�����#�� ���
����,��� ��
1�/��
-��" �)
,��#*���+��
�� ��
���" ��
%��� ��
���( )#*���+��
!�����"
.�)�������#�6#��������#����#���#������#�9�#��#+�#������#" ���#���6��"���#����#�"� �����#��������#����#����#�9�
NO MORE FAILURES: TEN STEPS TO EQUITY IN EDUCATION – ISBN 978-92-64-03259-0 – © OECD 2007 13
EXECUTIVE SUMMARY
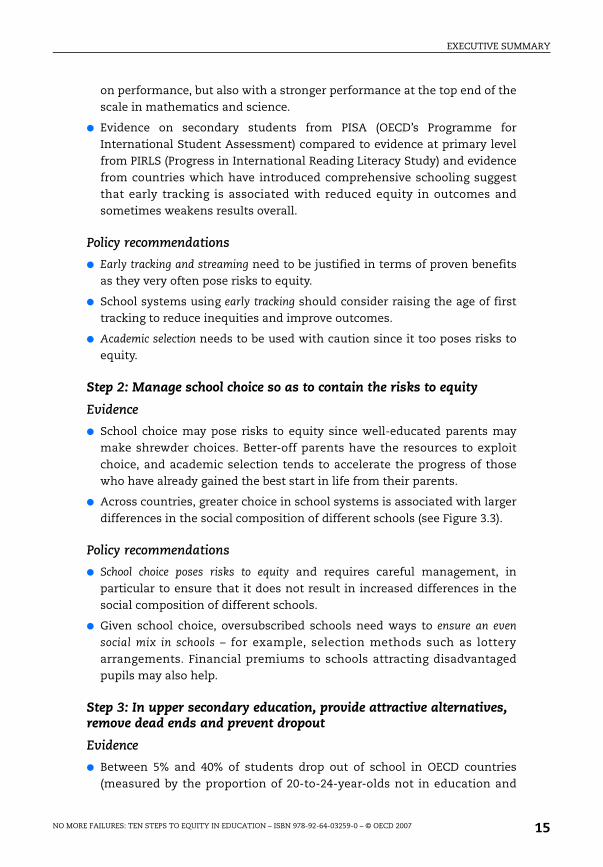
Steps 1 to 4: Design for fair and inclusive education (Chapter 3)
The structure of education systems and the pathways through them canhelp or hinder equity. Traditionally, education systems have sorted studentsinto different tracks, institutions and streams according to attainment. Thissorting sometimes increases inequalities and inequities.
Step1: Limit early tracking and streaming and postpone academic selection
Evidence
● Secondary school systems with large social differences between schoolstend on average to have worse results in mathematics and reading and agreater spread of reading outcomes. Social background is more of anobstacle to educational success than in systems where there are not largesocio-economic differences between schools.
● Academic selection by school systems is associated with great socialdifferences between schools and a stronger effect of socio-economic status
How many students struggle with reading? (Figure 2.8, Chapter 2)1
Percentage of students below and at Level 1 of proficiency in the OECD PISA reading scale2 (2003)
1. Countries are ranked in descending order of percentage of 15-year-olds in Levels 2, 3, 4, 5 and 6. 2. The PISA scale has six levels of proficiency. Level 2 represents the baseline at which students begin
having skills that allow them to use reading actively. Level 1 and below imply insufficient readingskills to function in today’s societies.
Source: OECD (2004), Learning for Tomorrow’s World: First Results from PISA 2003, OECD, Paris.
:7�
��
5�
��
��
��
�
���� ��0���
� �
��� ��
������� ���
'���� ��
������
���#$� � ��
-��" �)
����,��� ��
��� ���� ��
!�����"
���� �
�� ��2 � �
,��#*���+��
&�����#�� ���
%��� ��
'����� �� ��
������ �
���" ��
.�/�"+���� �
��
���( )#*���+��
�����
*���� �#����� ����
3��)��
1�/��
!����#.�(��#�##;+����#���#����#������<
.�(��#�##;6��"#���#��#5�=#����#������<
NO MORE FAILURES: TEN STEPS TO EQUITY IN EDUCATION – ISBN 978-92-64-03259-0 – © OECD 200714
EXECUTIVE SUMMARY
on performance, but also with a stronger performance at the top end of thescale in mathematics and science.
● Evidence on secondary students from PISA (OECD’s Programme forInternational Student Assessment) compared to evidence at primary levelfrom PIRLS (Progress in International Reading Literacy Study) and evidencefrom countries which have introduced comprehensive schooling suggestthat early tracking is associated with reduced equity in outcomes andsometimes weakens results overall.
Policy recommendations
● Early tracking and streaming need to be justified in terms of proven benefitsas they very often pose risks to equity.
● School systems using early tracking should consider raising the age of firsttracking to reduce inequities and improve outcomes.
● Academic selection needs to be used with caution since it too poses risks toequity.
Step 2: Manage school choice so as to contain the risks to equity
Evidence
● School choice may pose risks to equity since well-educated parents maymake shrewder choices. Better-off parents have the resources to exploitchoice, and academic selection tends to accelerate the progress of thosewho have already gained the best start in life from their parents.
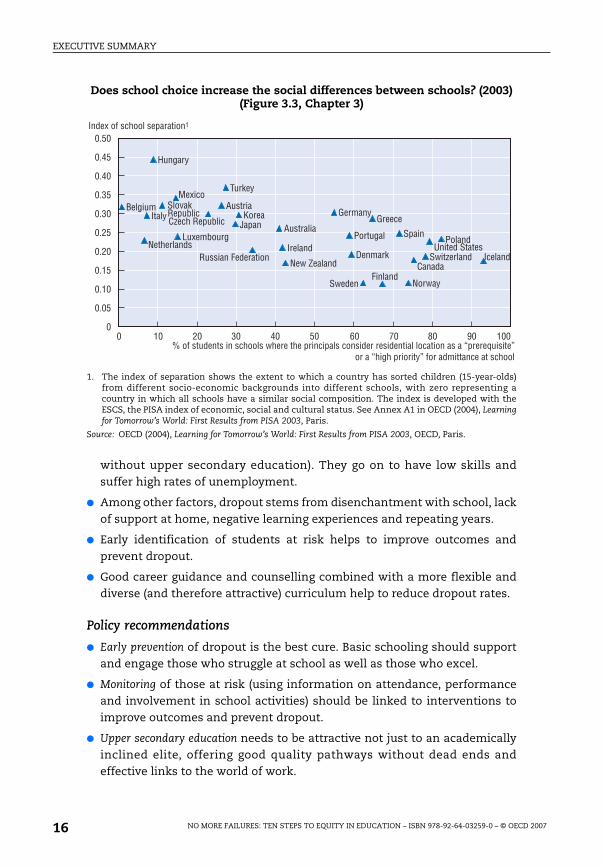
● Across countries, greater choice in school systems is associated with largerdifferences in the social composition of different schools (see Figure 3.3).
Policy recommendations
● School choice poses risks to equity and requires careful management, inparticular to ensure that it does not result in increased differences in thesocial composition of different schools.
● Given school choice, oversubscribed schools need ways to ensure an even
social mix in schools – for example, selection methods such as lotteryarrangements. Financial premiums to schools attracting disadvantagedpupils may also help.
Step 3: In upper secondary education, provide attractive alternatives, remove dead ends and prevent dropout
Evidence
● Between 5% and 40% of students drop out of school in OECD countries(measured by the proportion of 20-to-24-year-olds not in education and
NO MORE FAILURES: TEN STEPS TO EQUITY IN EDUCATION – ISBN 978-92-64-03259-0 – © OECD 2007 15
EXECUTIVE SUMMARY
without upper secondary education). They go on to have low skills andsuffer high rates of unemployment.
● Among other factors, dropout stems from disenchantment with school, lackof support at home, negative learning experiences and repeating years.
● Early identification of students at risk helps to improve outcomes andprevent dropout.
● Good career guidance and counselling combined with a more flexible anddiverse (and therefore attractive) curriculum help to reduce dropout rates.
Policy recommendations
● Early prevention of dropout is the best cure. Basic schooling should supportand engage those who struggle at school as well as those who excel.
● Monitoring of those at risk (using information on attendance, performanceand involvement in school activities) should be linked to interventions toimprove outcomes and prevent dropout.
● Upper secondary education needs to be attractive not just to an academicallyinclined elite, offering good quality pathways without dead ends andeffective links to the world of work.
Does school choice increase the social differences between schools? (2003) (Figure 3.3, Chapter 3)
1. The index of separation shows the extent to which a country has sorted children (15-year-olds)from different socio-economic backgrounds into different schools, with zero representing acountry in which all schools have a similar social composition. The index is developed with theESCS, the PISA index of economic, social and cultural status. See Annex A1 in OECD (2004), Learningfor Tomorrow’s World: First Results from PISA 2003, Paris.
Source: OECD (2004), Learning for Tomorrow’s World: First Results from PISA 2003, OECD, Paris.
�
����
�� �� �� 5� �� 7� =�
��5�
��5�
����
����
����
����
�
����
����
����
>� ?� ���
*���� �#����� ����&�����#�� ���
3��)��
����,��� ��
������
�� ��
���( )*���+��
������ � ��� ��
���� �
���#$� � ��
������� ���
1�/��
.�/�"+����
0��� 2 � �
� ��
��� ���� ��
%��� ��
��������" ��
���� ��
-��" �)
,��#*���+��
� �
!�����" '�����
'���� ��
���/#�6#�����#��� � �����
:#�6#��������#��#������#�����#���#������ ��#�������#��������� �#�� ����# �# #@�����A������B��# #@����#��������B#6��# �"��� ��# �#�����
NO MORE FAILURES: TEN STEPS TO EQUITY IN EDUCATION – ISBN 978-92-64-03259-0 – © OECD 200716

EXECUTIVE SUMMARY
● Smooth transitions prevent school failure and dropout. Additional learningsupport at the end of secondary school may help to encourage students tostay in school.
● Good quality vocational tracks are essential. Removing an academic hurdlefrom entrance to general upper secondary education and allowing access totertiary education from vocational programmes, as Sweden and Norwayhave done, can increase the status of the vocational track.
Step 4: Offer second chances to gain from education
Evidence
● Those who fail at school often find it difficult to recover later on. In all OECDcountries, those with weak basic qualifications are much less likely tocontinue learning in adult life (see Figure 2.5). Significantly, this figure alsoshows that there are big differences between countries.
● Across OECD countries, many adults and young dropouts without basiceducation obtain school qualifications through second chanceprogrammes. In the United States, almost 60% of dropouts eventually earna high school credential (GED certificate).
The well-qualified make most use of adult education (Figure 2.5, Chapter 2) Relative chances of adults with tertiary education participating in adult learning
compared to those with only primary education (2003)
1. For example, in Austria a university graduate is five times more likely to participate in adultlearning than an adult with primary education.
Source: European Labour Force Survey, 2003.
��
?
>
=
�
�
�
�
7
�
5
-��" �)
* ���#+������#� ����� ����#�6# �����#����#����� ��#��� ����#��#�����#����#���" ��#��� ����
������
���� ��
�� ��
,��#*���+��
� ��
����,��� ��
'����� �
���( )#*���+��
������ �
��� ��
� �
&�����#0�����"
���" ��
�� ��
!�����"
%��� ��
NO MORE FAILURES: TEN STEPS TO EQUITY IN EDUCATION – ISBN 978-92-64-03259-0 – © OECD 2007 17
EXECUTIVE SUMMARY
Policy recommendations
● Second chances are necessary for those who lack basic education and skills.These include programmes that provide literacy training, primary andsecondary education, work-based programmes, and arrangements torecognise informal learning.
Steps 5 to 7: Fair and inclusive practices (Chapters 4 and 6)
Practices in the classroom affect equity as do out-of-school practices,particularly relationships between schools, parents and communities.Student learning benefits from an effective school-home relationship, butchildren from deprived backgrounds may not benefit if they have weaksupport at home. Effective provision for migrants and minorities in theeducation system is also a key challenge for equity.
Step 5: Identify and provide systematic help to those who fall behind at school and reduce high rates of school-year repetition
Evidence
● In some school systems, up to one-quarter of students repeat a year at somepoint. In others it is rare. Some countries, such as Luxembourg, are takingsteps to reduce the extent of repetition.
● Although year repetition is often popular with teachers, there is littleevidence that children gain benefit from it. Repetition is expensive – the fulleconomic cost is up to USD 20 000 equivalent for each student who repeatsa year – but schools have few incentives to take into account the costsinvolved.
● The classroom is the first level of intervention for equity. Evidence showsthat it is possible to improve classroom attainment with methods such asformative assessment – a process of feeding back information aboutperformance to student and teacher and adapting and improving teachingand learning in response, particularly with students at risk.
● “Reading recovery” strategies – short-term, intensive interventions of one-on-one lessons – can help many poor readers to catch up.
● Finland uses a hierarchy of successive formal and informal interventions toassist those falling behind at school. This approach appears to besuccessful: only 1% of 15-year-olds are unable to demonstrate basicfunctional reading skills, while the OECD average is 7%.
Policy recommendations
● High rates of year repetition in some countries need to be reduced by changingincentives for schools and encouraging alternative approaches.
NO MORE FAILURES: TEN STEPS TO EQUITY IN EDUCATION – ISBN 978-92-64-03259-0 – © OECD 200718

EXECUTIVE SUMMARY
● Interventions in the classroom can be very effective in tacklingunderachievement. Among the approaches available, we can highlightformative assessment, reading recovery strategies and careful monitoring.
● Many countries could usefully follow the successful Finnish approach tolearning difficulties, offering a sequence of intensifying interventions whichdraw back into the mainstream those who fall behind.
● Teaching professionals should have support to develop their in-classroomtechniques to help those in the class who are falling behind.
Step 6: Strengthen the links between school and home to help disadvantaged parents help their children to learn
Evidence
● On average, children in OECD countries spend more than 20% of their totallearning time out of school – doing homework, working with a tutor or onother activities.
● Home factors, including parental support for education, engagement withchildren's learning and cultural assets (like books) are associated withstronger school performance.
● Homework can improve school outcomes, but reliance on homework mayalso threaten equity, since some children lack the home support necessaryto realise its benefits.
● Parental involvement – working with children at home and activelyparticipating in school activities – does improve results. All other thingsbeing equal, schools that foster communication and participation byparents, and encourage and assist parents to support their children withtheir school work tend to have better outcomes.
Policy recommendations
● To support learning among disadvantaged children, schools need to targettheir efforts to improve communication with parents in the most disadvantagedhomes and help develop home environments conducive to learning.
● After-school homework clubs at school may also provide an environment thatsupports homework for those with weak home support.
Step 7: Respond to diversity and provide for the successful inclusionof migrants and minorities within mainstream education
Evidence
● Success in both education and employment varies widely betweenimmigrant and minority groups and between different countries.
NO MORE FAILURES: TEN STEPS TO EQUITY IN EDUCATION – ISBN 978-92-64-03259-0 – © OECD 2007 19
EXECUTIVE SUMMARY
● Minority groups are, in many cases, less likely than others to participate inearly childhood education and care, more likely to be in special educationand more likely to drop out or end up in low status tracks and streams.
● For some “visible minority” groups, labour market discrimination issometimes extensive. This limits employment prospects and reduces theincentives to obtain qualifications.
● In most countries, immigrant students of first and second generation tendto perform less well than their native counterparts in the PISA assessmentsof mathematics, science and reading, while second-generation studentstend to outperform first-generation students. Analysis suggests that muchbut not all of this is explained by social background factors.
Policy recommendations
● Early childhood education and care is helpful for disadvantaged children andprovides a strong environment in which to learn a second language. Specialmeasures may encourage participation by the children of immigrants.
● Where immigrant and minority groups are disproportionately streamed intospecial education institutions, attention needs to be given to a) the risk ofcultural bias in the diagnosis and b) whether separate schooling is in thebest interests of the students involved.
● Newly arrived immigrant children often need special language training, butfunding mechanisms and the approach selected to deliver this trainingshould not encourage the isolation of such children from mainstreamclasses after an initial period of at most one year.
● Particularly in countries where immigration has risen sharply, teachersneed professional development to deal with new demands on matters such assecond language learning, a multicultural curriculum and teaching fortolerance and antiracism.
Steps 8 to 10: Fair and inclusive resourcing (Chapter 5)
In many countries, aggregate increases in educational expenditure will behard to justify in terms of their contribution to equity, although they maycontribute to economic growth. This highlights the importance of targetingeducation expenditure – both across education sectors and across regions andinstitutions – to ensure that it contributes to equity. National targets for equityoutcomes can help.
NO MORE FAILURES: TEN STEPS TO EQUITY IN EDUCATION – ISBN 978-92-64-03259-0 – © OECD 200720
EXECUTIVE SUMMARY
Step 8: Provide strong education for all, giving priority to early childhood provision and basic schooling
Evidence
● Public provision of education can foster equity when it counterbalancespoor home circumstances at the outset of children's lives. But it mayincrease inequity when it provides a common resource harvested by thosewho are best prepared for it.
● Education expenditure is shifting between sectors in many countries; insome the expansion of tertiary education is a large expenditure pressure.While countries need a high quality well-resourced tertiary educationsystem, public expenditure on tertiary education tends to be regressive.Private sources can be tapped to fund this sector.
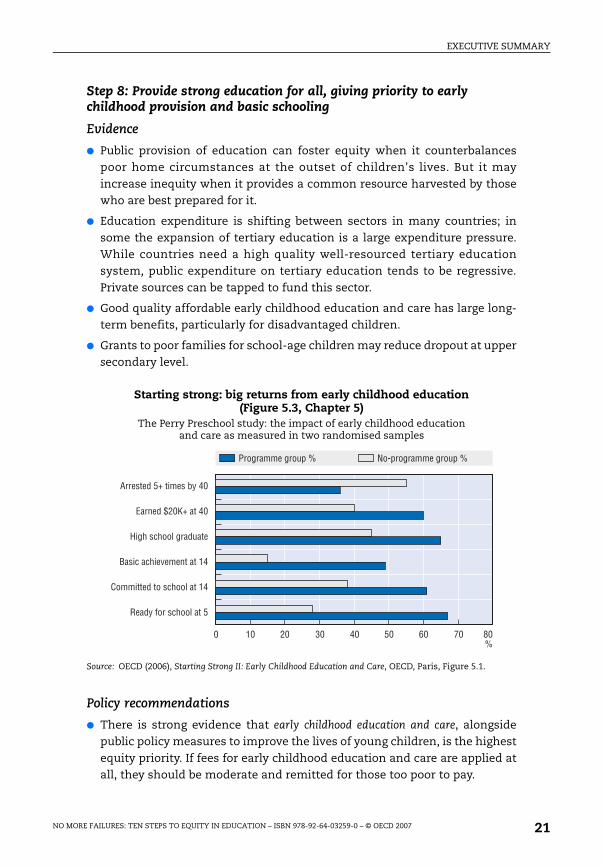
● Good quality affordable early childhood education and care has large long-term benefits, particularly for disadvantaged children.
● Grants to poor families for school-age children may reduce dropout at uppersecondary level.
Policy recommendations
● There is strong evidence that early childhood education and care, alongsidepublic policy measures to improve the lives of young children, is the highestequity priority. If fees for early childhood education and care are applied atall, they should be moderate and remitted for those too poor to pay.
Starting strong: big returns from early childhood education(Figure 5.3, Chapter 5)
The Perry Preschool study: the impact of early childhood education and care as measured in two randomised samples
Source: OECD (2006), Starting Strong II: Early Childhood Education and Care, OECD, Paris, Figure 5.1.
� �� �� �� 5� �� 7� =�:>�
'�������#�C#��"��#+�#5�
9 ����#D��0C# �#5�
%���#�����#�� �� ��
! ��# ���(�"���# �#�5
�""�����#��#�����# �#�5
*� ��#6��#�����# �#�
����� ""�#�����#: �������� ""�#�����#:
NO MORE FAILURES: TEN STEPS TO EQUITY IN EDUCATION – ISBN 978-92-64-03259-0 – © OECD 2007 21

EXECUTIVE SUMMARY
● Basic education remains an equity priority because it includes the entirecohort. Within this sector, particular attention should be given to efforts tosustain the performance of those with learning difficulties.
● When budgets are limited, public expenditure on tertiary education will rarelybe an equity priority. Countries charging fees for early childhood educationand care but not for tertiary education need to review their policies.
● Countries where grants to families for school age children are tied to schoolperformance need to review their policies, since this may in fact encouragedropout.
Step 9: Direct resources to students and regions with the greatest needs
Evidence
● Within countries, regional autonomy in spending may cause disparities inthe level of provision, unless it is balanced by mechanisms to redistributeresources to poorer regions.
● Many countries have special schemes to direct additional resources toschools or school areas serving disadvantaged pupils. Such schemes need
Regional variations in education spending: the example of Spain (Figure 5.5, Chapter 5)
Public expenditure on education (other than universities) in Spainand in two autonomous communities of Spain, with the highest and lowest spending
on education per student
1. In Andalusia and Basque Country, expenditure as a percentage of GDP in the autonomouscommunities.
Source: Teese, R., S. Field, B. Pont (2005), Equity in Education Thematic Review: Spain Country Note, OECD,Paris; Calero, J. (2005), Equity in Education Thematic Review: Country Analytical Report – Spain.
7#��� ��>
��=
��7
���
���
���
��?
��>
��5
���
���
�#���
5#���
�#���
�#���
�#���
�
9����
'��� �#�/���������#���#�������#��#����� 9/���������# �# #������ ��#�6#�-��
'�� ����
:#�6#�-�
! �A��# ������ '��#�� ��
NO MORE FAILURES: TEN STEPS TO EQUITY IN EDUCATION – ISBN 978-92-64-03259-0 – © OECD 200722

EXECUTIVE SUMMARY
to ensure that the extra resources are used to assist those most in need andavoid labelling certain schools as “disadvantaged”, which may discouragestudents, teachers and parents.
● In many countries, less experienced teachers are working in “difficult”schools.
Policy recommendations
● Countries need adequate mechanisms to redistribute resources and minimiseregional inequities of provision, so that minimum standards are meteverywhere.
● Extra resources need to be channelled through schools to help disadvantagedstudents. This should help overcome the disadvantaging effect of socialbackground, help to tackle poor performance without rewarding it anddiscourage schools from “selecting out” children from disadvantagedbackgrounds. The stigma arising from labelling of particular schools as “fordisadvantaged children” should be avoided.
● Experienced teachers are an important resource for disadvantaged schools.There should be incentives for them to work in these schools.
Step 10: Set concrete targets for more equity – particularly related to low school attainment and dropout
Evidence
● Numerical targets can be a useful policy lever for equity in education, byarticulating policy in terms of what is to be achieved rather than in terms offormal processes or laws. A number of countries have adopted targets forequity in education.
● International comparisons with the best performing countries suggest thatsome countries could significantly reduce the number of dropouts andstudents failing to acquire basic skills.
● National testing of individual student performance on basic skills is afundamental tool to measure both individual performance and theperformance of elements of the education system. But test results arelimited in what they measure, and results for schools depend on schoolintake as well as school quality.
● Many countries believe that the publication of results at school level isdesirable or politically and/or legally inevitable. A minority of countries aretesting but seeking to avoid publication. Some countries are pursuing“value-added” measures of school quality which take account of schoolintake.
NO MORE FAILURES: TEN STEPS TO EQUITY IN EDUCATION – ISBN 978-92-64-03259-0 – © OECD 2007 23

EXECUTIVE SUMMARY
Policy recommendations
● Countries should consider adopting a small number of numerical targets forequity, particularly for reducing the number of school-leavers with poorbasic skills and the number of early school dropouts.
● Education systems need to plan carefully how to manage and respond tothe public debate which follows publication of school-level test results andgive strong support to those schools with weak results – using the data to bringall schools up to a level, rather than allowing the pressures of league tablesto polarise school quality.
NO MORE FAILURES: TEN STEPS TO EQUITY IN EDUCATION – ISBN 978-92-64-03259-0 – © OECD 200724
ISBN 978-92-64-03259-0
No More Failures: Ten Steps to Equity in Education
© OECD 2007
Chapter 1
Introduction: Setting the Agenda
This chapter introduces the issue of equity in education anddescribes the methods of this study and the scope of this report. Itaddresses issues such as equity in compulsory education, earlyschool leaving and the impact of different education pathways onequity, and argues that although these are very common problems,they can be, and have been, successfully tackled. The chapter refersto the philosophical discussion on equity and offers a simpledefinition of two main dimensions of equity in education: fairness(that social background should be no barrier to outcomes) andinclusion (a basic minimum standard of education for all). It thenlooks at the broader public policy context within which equityobjectives are pursued and the evidence of trends in inequalities ofincome. The final section argues that equity in education is afundamental policy objective.
25

1. INTRODUCTION: SETTING THE AGENDA
1.1. Why look at equity in education?
In 2003, the Programme for International Student Assessment (PISA)found that across OECD countries, 8% of 15-year-olds had very poor readingskills (below PISA Level 1) – a blight on the lives of the millions of school-children involved. Poor basic skills mean less chance of a job, worse health,more criminality and a shorter life. Evidence shows that the risks arecompounded for those from deprived backgrounds and those who receiveweak schooling. It is a familiar story which generates many familiarresponses. Some say that there will always be a proportion of failures in anygroup, always some losers, some dropouts, some no-goods, some who won’tor can’t make it – and that schools, teachers and even parents can’t makemuch of a difference. They say that some will always fail, that largeinequalities are an inevitable part of life and to think otherwise is simplyunrealistic.
That is a dismal picture. But when it came to the test in Finland virtuallyno girls were found to be poor readers – only 0.3% of 15-year-old girls. Finnishboys did not do quite so well: 1.8% were poor readers. But that is still less thana fifth of the OECD average for boys. The reasons for these extraordinaryoutcomes have to do with schooling in Finland and will be described later inthis report. But the scale of what can be achieved is evident. It is not just aquestion of small reductions; the example suggests that the problem can belargely solved.
Of course, not everyone can do well at school, but the goal of equity ineducation is to ensure that as many as possible do so – acquiring basic andfurther skills, fulfilling themselves as human beings, overcoming accidents ofpersonal circumstances and home background. There is no inevitability tofailure in education. In Finland, and through other initiatives in manydifferent countries, school failure and dropout can be successfully tackled.There are a number of clear lessons, backed by evidence, which if appliedthroughout the OECD would improve the life chances of millions ofdisadvantaged people and avoid a huge and shameful waste of humanpotential. We have set out these lessons in this report in the form of ten stepsto equity in education.
It should be said at once that some of these lessons are not new; many ofthem echo the findings of other published reports. We make no apology forthat. Desirable policies cannot always be implemented immediately, not least
NO MORE FAILURES: TEN STEPS TO EQUITY IN EDUCATION – ISBN 978-92-64-03259-0 – © OECD 200726

1. INTRODUCTION: SETTING THE AGENDA
because there are many political pressures on education systems, interestgroups to satisfy, and practical issues of implementation to work through andresolve. But our aim here is to provide a set of principles for equity ineducation and an agenda for policy.
1.2. Background to this study
This report aims to draw policy lessons on how to improve equity ineducation using material from the countries involved in the OECD ThematicReview of Equity in Education (Box 1.1), but it is set in the wider context ofOECD countries. It draws on analytical reports prepared by authorities in eachcountry, country notes by OECD review teams and other relevant research.
This report focuses on the following issues, which participating countrieshighlighted as important equity challenges:
● Equity in compulsory education: Despite universal education, some fail atschool. PISA revealed a complex pattern of international variability inresults, with differences between schools and within schools. Also, theincrease in a number of countries of private or publicly supported privateschools is giving rise to concerns about school choice and its impact onequity.
Box 1.1. OECD Thematic Review on Equity in Education
The Thematic Review on Equity in Education involved two strands of work
for its ten participants: Belgium (Flanders), Finland, France, Hungary, Norway,
the Russian Federation, Slovenia, Spain, Sweden and Switzerland. Each
country prepared an analytical report on equity in education; and, in a subset
of participating countries, country visits by teams of experts led to the
preparation of country notes.
The analytical reports describe each country’s context and current equity
situation, provide a profile of equity in education, examine causes and
explanations, and explore the effectiveness of existing policies and potential
policy solutions to problems.
Five of the participating countries (Finland, Hungary, Norway, Spain and
Sweden) opted for a country visit. The objective of these visits was to assess
policy by exploring the perspectives of different stakeholders and observing
practice in specific institutional contexts. OECD review teams of experts
conducted in-depth examinations of national policies and practices and
prepared a country note containing evaluation and policy recommendations.
All documents are available at www.oecd.org/edu/equity/equityineducation.
NO MORE FAILURES: TEN STEPS TO EQUITY IN EDUCATION – ISBN 978-92-64-03259-0 – © OECD 2007 27
1. INTRODUCTION: SETTING THE AGENDA
● Early school leaving: The transition to upper secondary education and thelevel of dropouts at this stage of education is a significant challenge foreducation systems in some countries. In Spain, for example, only 57% ofthose over 16 continue into upper secondary, while the EU objective for 2010is to raise completion rates to 85%.
● Different educational pathways and how they might be having an impact on equity:In some countries, vocational education is a weak option, and otheralternatives may not allow re-entry into the education system.
● Integration of migrants and minorities in the education system: Thisphenomenon is of long-standing importance in a number of countries, butit is a new and growing issue for others, particularly European countries. InHungary, the provision of good quality education to the Roma populationwas a key concern.
The report offers a comparative perspective on how different countrieshave responded to their equity in education challenges. It brings together thedifferent policies and strategies adopted across a number of OECD countries totarget equity issues, seeks to raise awareness of the problem of inequity andprovide a coherent set of policy levers for action. At the same time it isselective, in that it explores a number of particular issues emerging fromreviews of the countries concerned in this exercise. It therefore aims to addvalue to the existing literature both through its international scope andbreadth, and through its depth on specific issues.
Because much existing OECD work on education bears on equity issues,this report makes use of the results of previous thematic reviews such as thoseon early childhood education, teacher policy, transition from school to workand adult learning, as well as the results of the various PISA studies. We havesought to avoid duplication with these and ongoing OECD thematic reviewsincluding the review of tertiary education. The combined effect has been togive this exercise more of a focus on schools. Other OECD work covers thesituation of students with special learning needs or with disabilities (OECD,2004a), so limited attention has been given to this issue here.
This report also draws from a paper commissioned for this review (Levin,2003), which provides an in-depth conceptual discussion of equity and policyin education and reviews the outcome of a range of previous OECD work in thefield. Other recent reports deserve immediate recognition. First, the recentcommunication from the European Union Commission (Council of theEuropean Union, 2006; Commission of the European Communities, 2006) hasprovided some very useful analysis and recommendations, bearing on similarthemes. EU work on indicators of equity (Baye et al., 2006) is also very relevant.
Chapter 1 describes the objectives of the study and the methods adopted.Chapter 2 provides a largely statistical snapshot of inequities in education,
NO MORE FAILURES: TEN STEPS TO EQUITY IN EDUCATION – ISBN 978-92-64-03259-0 – © OECD 200728

1. INTRODUCTION: SETTING THE AGENDA
examining how educational attainment is distributed and how socialbackground affects attainment. The remainder of the report concentrates onthe three sets of policy levers which may be used to deliver equity ineducation: the design of education systems, in-school and out-of-schoolpractices, and resourcing. Chapter 3 looks at design – the structure of theeducation system and pathways through it. Chapter 4 looks at practices in andout of school and the home-school environment. Chapter 5 looks at howresources can be prioritised and targeted with equity in mind. Chapter 6examines one major set of groups at risk – migrants and minorities.
1.3. The context: equity as a public policy objective
Equity is different from equality. It is associated with broader ideas ofjustice and fairness, sometimes with “equality of opportunity” and sometimeswith “equivalent treatment”. There is a great deal of philosophical literature onthis. This report will not add to that literature, but will instead workpragmatically with two dimensions of equity: fairness and inclusion (see Box 1.2).
There is a wider context of public policy concerned with equity and socialprotection. The development of OECD welfare mechanisms in the past halfcentury shows how different countries approach equity. Some countries havetended to limit social protection to very disadvantaged groups – providing nomore than a very basic safety net – while others have extended benefits to awide range of groups in society. These approaches display a varyingwillingness to redistribute resources, and reflect different values placed onequality as opposed to other goals, such as economic growth or rewardingenterprise. However, what these systems nearly all have in common is thatthey have aimed to provide a basic network of social protection to reducesocial risks and they have promoted mass education as a vehicle for equity(Esping-Andersen, 2002).
Inequalities of income and wealth vary across countries, with the Nordiccountries, the Netherlands, Austria, the Czech Republic and Luxembourg
Box 1.2. Two dimensions of equity in education
For the purposes of our study, equity in education includes two
dimensions, fairness and inclusion:
● Fairness implies that personal and social circumstances such as gender,
socio-economic status or ethnic origin should not be an obstacle to
educational success.
● Inclusion implies a minimum standard of education for all.
NO MORE FAILURES: TEN STEPS TO EQUITY IN EDUCATION – ISBN 978-92-64-03259-0 – © OECD 2007 29
1. INTRODUCTION: SETTING THE AGENDA
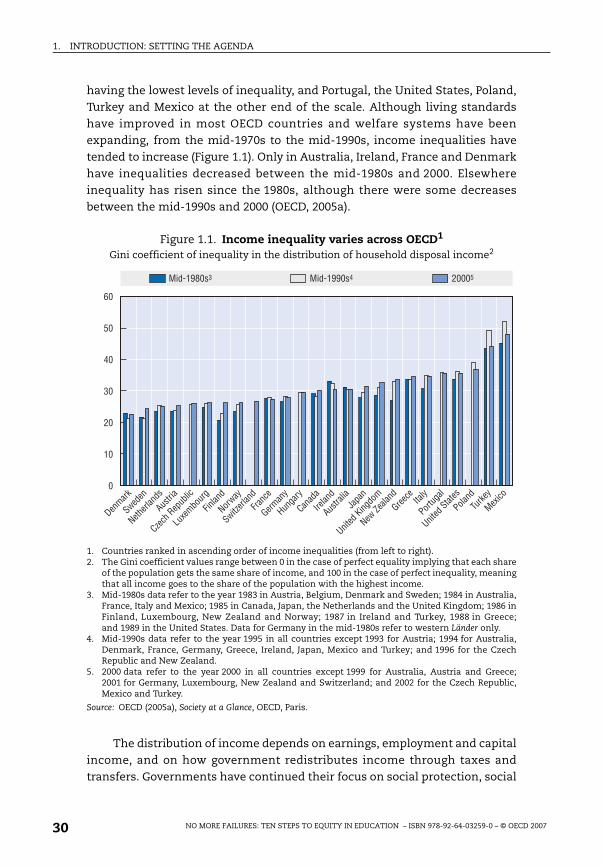
having the lowest levels of inequality, and Portugal, the United States, Poland,Turkey and Mexico at the other end of the scale. Although living standardshave improved in most OECD countries and welfare systems have beenexpanding, from the mid-1970s to the mid-1990s, income inequalities havetended to increase (Figure 1.1). Only in Australia, Ireland, France and Denmarkhave inequalities decreased between the mid-1980s and 2000. Elsewhereinequality has risen since the 1980s, although there were some decreasesbetween the mid-1990s and 2000 (OECD, 2005a).
The distribution of income depends on earnings, employment and capitalincome, and on how government redistributes income through taxes andtransfers. Governments have continued their focus on social protection, social
Figure 1.1. Income inequality varies across OECD1
Gini coefficient of inequality in the distribution of household disposal income2
1. Countries ranked in ascending order of income inequalities (from left to right).2. The Gini coefficient values range between 0 in the case of perfect equality implying that each share
of the population gets the same share of income, and 100 in the case of perfect inequality, meaningthat all income goes to the share of the population with the highest income.
3. Mid-1980s data refer to the year 1983 in Austria, Belgium, Denmark and Sweden; 1984 in Australia,France, Italy and Mexico; 1985 in Canada, Japan, the Netherlands and the United Kingdom; 1986 inFinland, Luxembourg, New Zealand and Norway; 1987 in Ireland and Turkey, 1988 in Greece;and 1989 in the United States. Data for Germany in the mid-1980s refer to western Länder only.
4. Mid-1990s data refer to the year 1995 in all countries except 1993 for Austria; 1994 for Australia,Denmark, France, Germany, Greece, Ireland, Japan, Mexico and Turkey; and 1996 for the CzechRepublic and New Zealand.
5. 2000 data refer to the year 2000 in all countries except 1999 for Australia, Austria and Greece;2001 for Germany, Luxembourg, New Zealand and Switzerland; and 2002 for the Czech Republic,Mexico and Turkey.
Source: OECD (2005a), Society at a Glance, OECD, Paris.
7�
��
5�
��
��
��
�
�����1����?>���
-��" �)
������
������� ���
'�����
,��#*���+��
.�/�"+����
���� ��
���� �
����,��� ��
�� ��
���" ��
%��� ��
� �
��� ��
'���� �� 2 � �
&�����#0�����"
���#$� � ��
����� �
��
������ �
&�����#�� ���
��� ��3��)��
1�/��
1����??��5
NO MORE FAILURES: TEN STEPS TO EQUITY IN EDUCATION – ISBN 978-92-64-03259-0 – © OECD 200730

1. INTRODUCTION: SETTING THE AGENDA
cohesion and education as a way to act upon the problems of poverty andincome inequality in different countries. Thus, governments play a significantrole in accelerating or moderating trends in income distribution and poverty(OECD, 2005b) and education is a key in this strategy, as it is one of the keycontributors to productivity and earnings.
In terms of wages, Nickell (2004) has shown that most of the cross-country variation in earning inequality can be assigned to cross-countryvariation in skill dispersion. The distribution of educational attainment iscrucial to explaining the dispersion of earnings and poverty (Schütz andWössmann, 2006). Providing education and training for all is, therefore,important to increase labour market participation and to reduce socialexclusion of particular groups (Brunello and de Paola, 2006).
For education, two questions arise. What role has education played in thepast in these changing patterns of inequality, and how can education policyact in the future to limit these inequalities?
1.4. Why equity in education?
This background of income inequality is important, but it is not the onlyreason for pursuing equity in education. Education has been found to be a
Box 1.3. Recognising equity and inequity
“Philosophers have been struggling for a long time to clarify what might be
meant in social policy by the term ‘equity’. Summarizing that discussion, let
alone seeking to add to it, is beyond the capacity and fortunately, beyond the
scope of this publication. There is general agreement that the aim of public
policy cannot and should not be equality in the sense that everyone is the
same or achieves the same outcomes – a state that appears to be both
impossible and undesirable. Rather, a commitment to equity suggests that
differences in outcomes should not be attributable to differences in areas
such as wealth, income, power or possessions. The question is then of what
state or degree of inequality is acceptable. The answer to this question will
always be a contested one, fought out in political arenas of all kinds on a
continuing basis. The grounds of this struggle seem to have shifted in the last
30 years towards reducing the gap in outcomes between the top and bottom
by helping those at the bottom move up. This may be unsatisfactory as a
definition from an analytic perspective but is workable from the standpoint
of policy. The argument has been made about quality (Pirsig, 1974) that while
we may not be able to define it, we know it when we see it. For equity, it may
be that while we cannot define what it is, we know when we are far from it.”
(Levin, 2003)
NO MORE FAILURES: TEN STEPS TO EQUITY IN EDUCATION – ISBN 978-92-64-03259-0 – © OECD 2007 31
1. INTRODUCTION: SETTING THE AGENDA
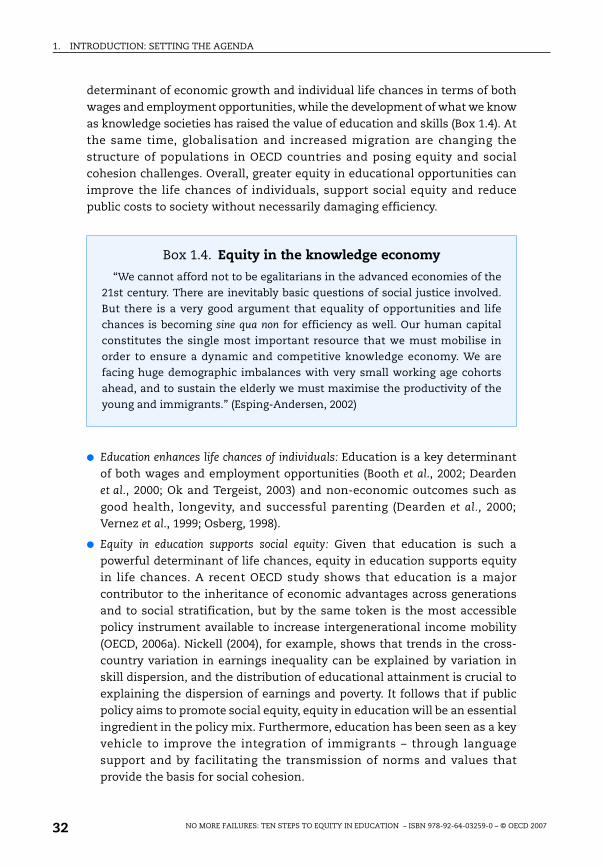
determinant of economic growth and individual life chances in terms of bothwages and employment opportunities, while the development of what we knowas knowledge societies has raised the value of education and skills (Box 1.4). Atthe same time, globalisation and increased migration are changing thestructure of populations in OECD countries and posing equity and socialcohesion challenges. Overall, greater equity in educational opportunities canimprove the life chances of individuals, support social equity and reducepublic costs to society without necessarily damaging efficiency.
● Education enhances life chances of individuals: Education is a key determinantof both wages and employment opportunities (Booth et al., 2002; Deardenet al., 2000; Ok and Tergeist, 2003) and non-economic outcomes such asgood health, longevity, and successful parenting (Dearden et al., 2000;Vernez et al., 1999; Osberg, 1998).
● Equity in education supports social equity: Given that education is such apowerful determinant of life chances, equity in education supports equityin life chances. A recent OECD study shows that education is a majorcontributor to the inheritance of economic advantages across generationsand to social stratification, but by the same token is the most accessiblepolicy instrument available to increase intergenerational income mobility(OECD, 2006a). Nickell (2004), for example, shows that trends in the cross-country variation in earnings inequality can be explained by variation inskill dispersion, and the distribution of educational attainment is crucial toexplaining the dispersion of earnings and poverty. It follows that if publicpolicy aims to promote social equity, equity in education will be an essentialingredient in the policy mix. Furthermore, education has been seen as a keyvehicle to improve the integration of immigrants – through languagesupport and by facilitating the transmission of norms and values thatprovide the basis for social cohesion.
Box 1.4. Equity in the knowledge economy
“We cannot afford not to be egalitarians in the advanced economies of the
21st century. There are inevitably basic questions of social justice involved.
But there is a very good argument that equality of opportunities and life
chances is becoming sine qua non for efficiency as well. Our human capital
constitutes the single most important resource that we must mobilise in
order to ensure a dynamic and competitive knowledge economy. We are
facing huge demographic imbalances with very small working age cohorts
ahead, and to sustain the elderly we must maximise the productivity of the
young and immigrants.” (Esping-Andersen, 2002)
NO MORE FAILURES: TEN STEPS TO EQUITY IN EDUCATION – ISBN 978-92-64-03259-0 – © OECD 200732

1. INTRODUCTION: SETTING THE AGENDA
● Unequal results in education have heavy costs: School failures and dropouts aremore at risk of benefit dependency, juvenile delinquency and the associatedcosts to society (Lochner and Moretti, 2004; Schütz and Wössmann, 2006;McMahon 2002). Some modelling exercises suggest that improving theeducational attainment of the disadvantaged can pay over the long run, notonly through long-term savings in income transfer, public socialprogrammes and public health, but also through the resulting increase intax revenues and higher disposable income for those involved (Rand, 2003;Statistics Canada and OECD, 2001). Other research has demonstrated thatthe greater the educational inequality, the lower the levels of socialcohesion (Green et al., 2003, Dayton-Johnson, 2001).
● Public expenditure on education reduces initial income differences: An OECD studyon public expenditure shows that spending on education reduces initialdifferences in income, mainly because progressive taxation bears moreheavily on the better-off and is used to fund education for all, at least in thecompulsory phase. Spending on pre-primary and compulsory educationsignificantly narrows income inequalities, as it is the population in thelower tail of income distribution that benefits the most. Expenditure ontertiary education sometimes makes no difference to income inequality, butin many countries it favours the affluent, widening income inequality(OECD, 2006b).
● Equity in education is an end in itself: Equity is widely seen as one of the basicnecessities of life and the right to education is recognised, for example, inthe United Nations Declaration of the Rights of the Child and theconstitution of most nations.
● There is no contradiction between equity and efficiency in education: Someeconomists have argued that redistribution of resources to the needy helpsequity but damages efficiency, since it involves confiscating some of thereturns from hard work and enterprise to assist those worst off. Others havedisagreed. A recent World Bank report argues that equity and efficiency arein fact complementary in economic development (World Bank, 2006).Within basic education, the economists’ trade-off between equity andefficiency is hard to discern. School failure has large costs not only to thoseinvolved, but also to society, because the welfare costs of marginalisedpersons is large. Thus, reasonably priced and effective cures will benefitboth efficiency and equity (Box 1.3). The European Union has called on itsmember states to support both equity and efficiency in education, as theyare mutually reinforcing (Council of the European Union, 2006; Commissionof the European Communities, 2006). Some studies suggest that anequitable distribution of skills across populations also has a strong impacton overall economic performance (Coulombe et al., 2004).
NO MORE FAILURES: TEN STEPS TO EQUITY IN EDUCATION – ISBN 978-92-64-03259-0 – © OECD 2007 33

1. INTRODUCTION: SETTING THE AGENDA
References
Barth, E. and C. Lucifora (2006), “Wage Dispersion, Markets and Institutions: The Effectof the Boom in Education on the Wage Structure”, Institute for the Study of Labor(IZA)Discussion Paper, No. 2181.
Baye, A., M. Demeuse, C. Monseur, C. Goffin (2006), A Set of Indicators to Measure Equityin 25 European Union Education Systems, European Commission, University of Liège.
Booth, A. and M. Bryan (2002), “Who Pays for General Training? New Evidence forBritish Men and Women”, IZA Discussion Paper, No. 486, April.
Budria, S. and P. Pereira (2005), “Educational Qualifications and Wage Inequality:Evidence for Europe”, IZA Discussion Paper No. 1763.
Budria, S. and A. Egido (2005), “Education, Over-Education, and Wage Inequality:Evidence for Spain”, Munich Personal RePEc Archive, Paper No. 93.
Commission of the European Communities (2006), Communication from theCommission to the Council and to the European Parliament, Efficiency and Equity inEuropean Education and Training Systems, SEC(2006)1096.
Coulombe, S., S. Marchand and J. Tremblay, (2004), International Adult Literacy Survey,Literacy Scores, Human Capital and Growth across Fourteen OECD Countries, StatisticsCanada, Ottawa.
Council of the European Union (2006), Conclusions of the Council and the Representativesof the Governments of the Member States, Meeting within the Council, on Efficiency andEquity in Education and Training, 15 November 2006.
Dayton-Johnson, J. (2001), Social Cohesion and Economic Prosperity, James Lorimerand Co., Toronto.
Dearden, L., H. Reed and J. Van Reenen (2000), “Estimates of the impact of improvementsin basic skills on aggregate wages, employment, taxes and benefits”, in J. Bynner(ed.), The Social Benefits of Basic Skills, DfEE Research Centre on the Wider Benefits ofLearning, London.
Esping-Andersen, G. (2002), Why We Need a New Welfare State, Oxford University Press,Oxford.
Green, A., J. Preston and R. Sabates (2003), “Education, Equality and Social Cohesion: aDistributional Approach”, Compare, Vol. 33, No. 4, December, Routledge, pp. 453-470.
Levin, B. (2003), Approaches to Equity in Policy for Lifelong Learning, a paper commissionedby the Education and Training Policy Division, OECD, for the Equity in EducationThematic Review, www.oecd.org/dataoecd/50/16/38692676.pdf.
Lochner, L. and E. Moretti (2004), “The Effects of Education on Crime: Evidence from PrisonInmates, Arrests and Self-Reports”, American Economic Review 94 (1), pp. 155-189.
Martins, P. and P. Pereira (2004), “Does Education Reduce Wage Inequality? QuantileRegression Evidence from 16 Countries”, Labour Economics, Vol. 11 (2004), pp. 355-371.
McMahon, W. (2002), Education and Development: Measuring the Social Benefits, OxfordUniversity Press, Oxford.
Nickell, S. (2004), “Poverty and Worklessness in Britain”, Economic Journal, Vol. 114,Royal Economic Society, Blackwell Publishing, Oxford, pp. C1-C25.
OECD (2003), The Sources of Economic Growth in OECD Countries, OECD, Paris.
NO MORE FAILURES: TEN STEPS TO EQUITY IN EDUCATION – ISBN 978-92-64-03259-0 – © OECD 200734
1. INTRODUCTION: SETTING THE AGENDA
OECD (2004a), Equity in Education: Students with Disabilities, Learning Difficulties andDisadvantages, OECD, Paris.
OECD (2005a), Society at a Glance, OECD, Paris.
OECD (2005b), Extending Opportunities: How Active Social Policy Can Benefit Us All, OECD,Paris.
OECD (2006a), “Intergenerational Transmission of Disadvantage”, Directorate forEmployment, Labour and Social Affairs, OECD, Paris.
OECD (2006b), “Publicly Provided Goods and the Distribution of Resources”, Directoratefor Employment, Labour and Social Affairs, OECD, Paris.
Ok, W. and P. Tergeist (2003), “Improving Workers' Skills: Analytical Evidence and theRole of the Social Partners,” OECD Social Employment and Migration Working Papers10, OECD Directorate for Employment, Labour and Social Affairs, Paris.
Osberg, L. (1998), “Economic Policy Variables and Population Health”, in Canada HealthAction: Determinants of Health: Settings and Issues, Vol. 3, MultiMondes, Sainte-Foy,Québec, pp. 579-610.
Pirsig, R. (1974), Zen and the Art of Motorcycle Maintenance, Bantam, New York.
Schütz, G. and L. Wössmann (2006), Efficiency and Equity in European Education andTraining Systems, prepared by the European Expert Network in Economics inEducation to accompany the Communication and Staff Working Paper by theEuropean Commission under the same title, http://ec.europa.eu/education/policies/2010/doc/eenee.pdf.
Statistics Canada and OECD (2001), Literacy, Numeracy and Labour Market Outcomes inCanada, Statistics Canada, Ottawa and OECD, Paris.
Vernez, G., R. Krop and P. Rydell (1999), Closing the Education Gap: Benefits and Costs,Rand, Santa Monica.
World Bank (2005), World Development Report 2006: Equity and Development, World Bankand Oxford University Press, Washington DC and New York.
NO MORE FAILURES: TEN STEPS TO EQUITY IN EDUCATION – ISBN 978-92-64-03259-0 – © OECD 2007 35

ISBN 978-92-64-03259-0
No More Failures: Ten Steps to Equity in Education
© OECD 2007
Chapter 2
A Look at Inequities in Education
This chapter summarises selected quantitative evidence of equityin education and lays the groundwork for the policy chapters thatfollow. It starts by looking at the historical expansion of educationand whether it has helped equity, noting the gains by women andthe more disappointing evidence on other fronts. It then examineshow inequalities change and develop over the lifecycle, the differentphases of education and the position of vulnerable groupsincluding migrants and dropouts. Expanding on the previouschapter, it explores how fairness and inclusion are intertwined, asit is often the disadvantaged who are underperforming, and howinequities may be perpetuated by features of the education system.
37

2. A LOOK AT INEQUITIES IN EDUCATION
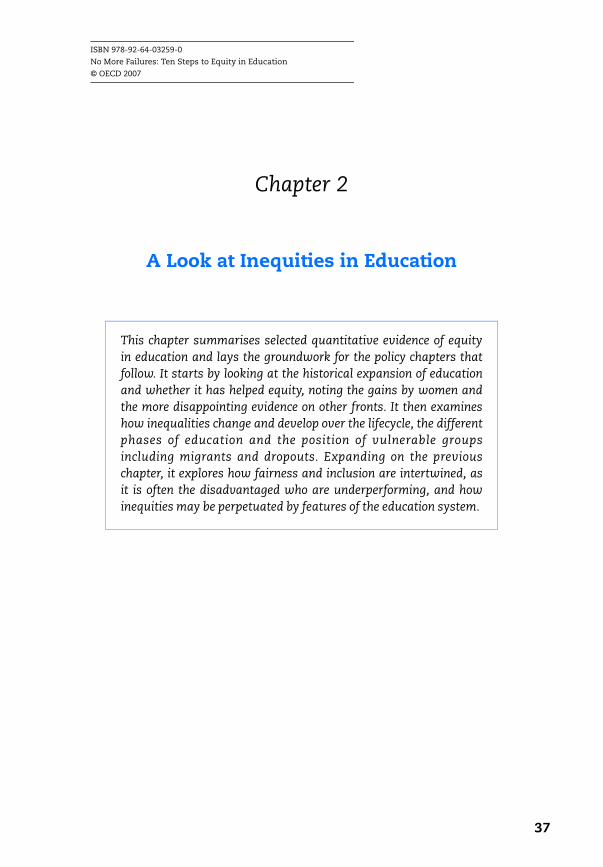
In Korea, the economic miracle which has taken living standards from thoseof a developing country to OECD levels in the course of a generation has beenaccompanied by extraordinary changes in education. In 2004, half of allKorean young people (aged 25 to 34) were educated to tertiary level, a figurefive times higher than for older Koreans (aged 55 to 64). Throughout the OECD,post-compulsory education has expanded rapidly, if not at Korean rates. Thisgrowth is the background to this chapter, for it corresponds to a big socialinvestment and a revolution in expectations. It raises the question of howfairly these improvements have been shared by different groups and howeducation systems are currently managing to provide greater equality ofopportunities and outcomes.
2.1. Unequal improvements in educational attainment
Over a 20-year period, upper secondary attainment in OECD countrieshas increased by 13% on average, as indicated by a comparison of older andyounger age cohorts (see Figure 2.1). During the same period, there has beenan increase of 8% in tertiary attainment. Around two-thirds of this increasehas been due to the spectacular advance of women. In 22 OECD countries,younger women now have higher levels of educational attainment than men(see Figure 2.2). When compared with the gender inequity of a generation ago,that is a social revolution to be celebrated. For women, the main equitychallenges are now in the labour market and social policy rather than ineducation, although some issues remain in the strong gender-specificpreferences for fields of study, particularly in tertiary education. Theachievements of women have highlighted an emerging problem of maleunderachievement, with lower attainment by boys in reading (twice as manyvery poor readers on average), a higher dropout rate and lower participation inmost kinds of post-compulsory education.
At the same time, the general upgrading of qualifications has highlightedthe position of those left out in the educational race. Many adults remainunqualified and some young people still do not successfully completesecondary education. On average across the OECD nearly one in three adults(30%) has only primary or lower secondary education (OECD, 2006c).
Many people hoped that educational expansion would improveeducational outcomes and reduce the impact of social origin on life chances.Some countries appear to have managed educational expansion in such a way
NO MORE FAILURES: TEN STEPS TO EQUITY IN EDUCATION – ISBN 978-92-64-03259-0 – © OECD 200738
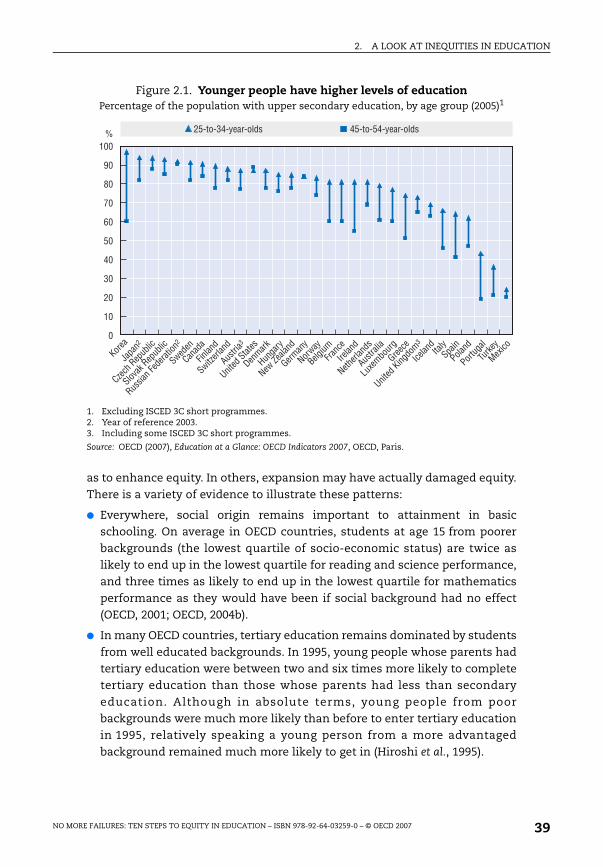
2. A LOOK AT INEQUITIES IN EDUCATION
as to enhance equity. In others, expansion may have actually damaged equity.There is a variety of evidence to illustrate these patterns:
● Everywhere, social origin remains important to attainment in basicschooling. On average in OECD countries, students at age 15 from poorerbackgrounds (the lowest quartile of socio-economic status) are twice aslikely to end up in the lowest quartile for reading and science performance,and three times as likely to end up in the lowest quartile for mathematicsperformance as they would have been if social background had no effect(OECD, 2001; OECD, 2004b).
● In many OECD countries, tertiary education remains dominated by studentsfrom well educated backgrounds. In 1995, young people whose parents hadtertiary education were between two and six times more likely to completetertiary education than those whose parents had less than secondaryeducation. Although in absolute terms, young people from poorbackgrounds were much more likely than before to enter tertiary educationin 1995, relatively speaking a young person from a more advantagedbackground remained much more likely to get in (Hiroshi et al., 1995).
Figure 2.1. Younger people have higher levels of educationPercentage of the population with upper secondary education, by age group (2005)1
1. Excluding ISCED 3C short programmes. 2. Year of reference 2003.3. Including some ISCED 3C short programmes.
Source: OECD (2007), Education at a Glance: OECD Indicators 2007, OECD, Paris.
:���
?�
>�
=�
7�
��
��
5�
��
��
�
0���
2 � ��
,��#*���+��
���( )#*���+��
*���� �#����� �����
������
� �
���� ��
����,��� ��
'����� �
&�����#�� ���
-��" �)
%��� ��
���#$� � ��
���" ��
���� �
!�����"�� ��
��� ��
������� ���
�������5��� ������ 5������5��� ������
'���� ��
.�/�"+����
�����
&�����#0�����"�
�� ��� ���� ��
��� ��
������ �
3��)��
1�/��
NO MORE FAILURES: TEN STEPS TO EQUITY IN EDUCATION – ISBN 978-92-64-03259-0 – © OECD 2007 39
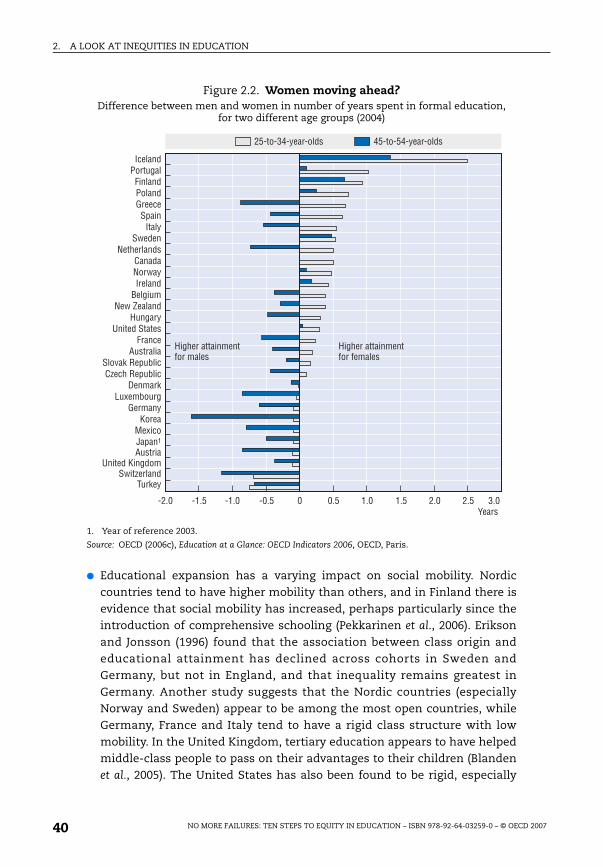
2. A LOOK AT INEQUITIES IN EDUCATION
● Educational expansion has a varying impact on social mobility. Nordiccountries tend to have higher mobility than others, and in Finland there isevidence that social mobility has increased, perhaps particularly since theintroduction of comprehensive schooling (Pekkarinen et al., 2006). Eriksonand Jonsson (1996) found that the association between class origin andeducational attainment has declined across cohorts in Sweden andGermany, but not in England, and that inequality remains greatest inGermany. Another study suggests that the Nordic countries (especiallyNorway and Sweden) appear to be among the most open countries, whileGermany, France and Italy tend to have a rigid class structure with lowmobility. In the United Kingdom, tertiary education appears to have helpedmiddle-class people to pass on their advantages to their children (Blandenet al., 2005). The United States has also been found to be rigid, especially
Figure 2.2. Women moving ahead? Difference between men and women in number of years spent in formal education,
for two different age groups (2004)
1. Year of reference 2003.
Source: OECD (2006c), Education at a Glance: OECD Indicators 2006, OECD, Paris.
���� ���� ���� ���� � ��� ��� ��� ��� ��� ���
�� �������� ����� ����� ��������� ��� ��
������������� ���
� � ���� ���� ��!�����"
���#$� � ��%��� ��
&�����#�� ����� ��
'���� �� ���( )#*���+�� ,��#*���+��
-��" �).�/�"+����
���" ��0��� 1�/��2 � ��'�����
&�����#0�����"����,��� ��
3��)��
4� ��
�������5��� ������ 5������5��� ������
%�����# �� ��"���6��#6�" ���
%�����# �� ��"���6��#" ���
NO MORE FAILURES: TEN STEPS TO EQUITY IN EDUCATION – ISBN 978-92-64-03259-0 – © OECD 200740

2. A LOOK AT INEQUITIES IN EDUCATION
when compared to Nordic countries (Breen and Luijkx, 2004). Otherevidence, based on France, the United Kingdom and the United States,suggests that in countries with higher average enrolment in tertiaryeducation, the impact of parents’ income is lower (OECD, 2006b).
● Many school systems have become comprehensive, with fewer distinctionsand selection mechanisms at lower secondary level. But the expansion ofpost-compulsory education means that for many there is still an extensivephase of selective education prior to entry into the labour market, even if itis now typically in upper secondary and tertiary education rather than (as ageneration ago) in lower secondary school.
2.2. Equity as fairness
The impact of socio-economic background on student performance is high
Poor school outcomes are the result of many factors, but Figure 2.3 showsthat students with low socio-economic status are much more likely to beunderperformers in all OECD countries. While there are international
Figure 2.3. How social background affects performance in mathematicsRelative chances of students in lowest and highest socio-economic group ending up
with very poor (below or at Level 1) performance in mathematics (2003)
1. For example, in Portugal a student with low SES is three times more likely to be a low mathematicsachiever than a student with high SES.
Source: OECD (2006c), Education at a Glance: OECD Indicators 2006, OECD, Paris.
7
�
5
�
�
�
�
�� ��
8���#* ���
3��)��
� � 2 � �
�����
���� ��
���� �
�������� ��
������ ��� ��
'�����
��� ��
'���� ��
.�/�"+����0���
���#$� � ��
��� ��
������� ���
&�����#�� ���
����,��� ��
1�/��
-��" �)
,��#*���+��
�� ��
���" ��
%��� ��
���( )#*���+��
!�����"
.�)�������#�6#��������#����#���#������#�9�#��#+�#������#" ���#���6��"���#����#�"� �����#��������#����#����#�9�
NO MORE FAILURES: TEN STEPS TO EQUITY IN EDUCATION – ISBN 978-92-64-03259-0 – © OECD 2007 41
2. A LOOK AT INEQUITIES IN EDUCATION
differences, in this respect the vast majority of countries lie in a fairly narrowband (Shavit and Blossfeld, 1993; Erikson and Jonsson, 1996; OECD, 2001;OECD, 2004b).
Differences between and across schools and performance
PISA also offers one very striking result. Any individual student outcomeis correlated not only with that individual’s own social background, but alsowith the social background of other students in the same school. Figure 2.4shows differences in student results from different schools (between-school
variance) and from the same school (within-school variance). While allcountries show large within-school variance, in most countries between-school variance is also wide and explained in significant part by the social mixof students in different schools.
In some countries, there is little association between individualperformance and the schools children attend. This includes the Nordiccountries, Poland, the United Kingdom, the United States, Canada, Ireland,New Zealand, Australia, Spain and Mexico. On the other side, in countries likeGermany, Austria, Italy, Japan and Hungary, there are large differencesbetween schools, much of it linked to the socio-economic background ofschools and students.
Adults: to those that hath shall be given
Adults who have more initial education tend to participate more in latereducation. People leave formal education with unequal attainment and theseinequalities then widen over time as better educated adults seek and obtainmore subsequent training (Figure 2.5), as well as undertaking work using anddeveloping higher level skills (OECD, 2005d). The implication is twofold. First,initial education needs to ensure that everyone gains sufficient basic skills,and sufficient engagement with education and the learning process to be ableto upgrade those skills later. Second, well targeted second chanceprogrammes need to concentrate their efforts on those with the lowest levelsof qualifications. Figure 2.5 shows that some countries are much moresuccessful at this than others. Participation of low skilled adults in learning isimportant not only for their own sake but also for their children, as better-educated parents can better support the learning of their children.
Overall, on fairness, socio-economic status remains important toattainment in basic schooling everywhere (Marks et al., 2006). Students frompoorer backgrounds (the lowest quartile of socio-economic status) were onaverage twice as likely as the average OECD student to end up in the lowestquartile for reading and science performance at age 15, and three times aslikely to end up in the lowest quartile for math performance (OECD, 2001;
NO MORE FAILURES: TEN STEPS TO EQUITY IN EDUCATION – ISBN 978-92-64-03259-0 – © OECD 200742

2. A LOOK AT INEQUITIES IN EDUCATION
OECD, 2004b). At the two extremes, someone from the lowest quartile of socio-economic status in Switzerland is 2.7 times more likely to end up in the lowestquartile for reading, while in Finland the comparable figure is 1.5.
Figure 2.4. Attainment and the social mix in schoolsVariance (spread) in student performance in mathematics between schools
and within schools expressed as a percentage of the average variance1
in student performance in OECD countries (100) and the impact of socio-economicstatus of students and schools on the variance in student performance2 (2003)
1. Average variance in student performance (100) is composed of the average variance betweenschools (33.6, attributable to the difference in student results attained by students in differentschools) and the average variance within schools (67, attributable to the range of student resultswithin schools).
2. Variance in student performance, explained by the index of economic, social and cultural status ofstudents and schools, indicates how much of the variance is attributable to the SES of students,either between or within schools.
3. For example, between-school variance is similar in Italy and the Netherlands, but the amount ofthis variance that is explained by the socio-economic background of the students is greater in theNetherlands than in Italy.
4. Response rate too low to ensure comparability.
Source: OECD (2004b), Learning for Tomorrow’s World: First Results from PISA 2003, OECD, Paris.
��� >� 7� 5� �� � �� 5� 7� >� ���
3��)��%��� ��2 � �
!�����"� ���
���" ��'�����
������� ���� ,��#*���+��
0��� ���( )#*���+��
���������,��� ��.�/�"+����
������ �*���� �#����� ����
1�/��&�����#�� ���
'���� �� ���#$� � ��
�� �� � � ��� ��
-��" �)��� ������������ ����� ���� ��
&�����#0�����"5
E�����������#( �� ��#�/�� ����#+�#���#����/#�6#����"�F#��� �# ��#����� �#�� ����6#��������# ��#������
3�� �#������������#( �� ��
!������������#( �� ��#�/�� ����#+�#���#����/#�6#����"�F#��� �# ��#����� �#�� ����6#��������# ��#������
3�� �#+������������#( �� ��
!������������( �� ��
E�����������( �� ��
NO MORE FAILURES: TEN STEPS TO EQUITY IN EDUCATION – ISBN 978-92-64-03259-0 – © OECD 2007 43
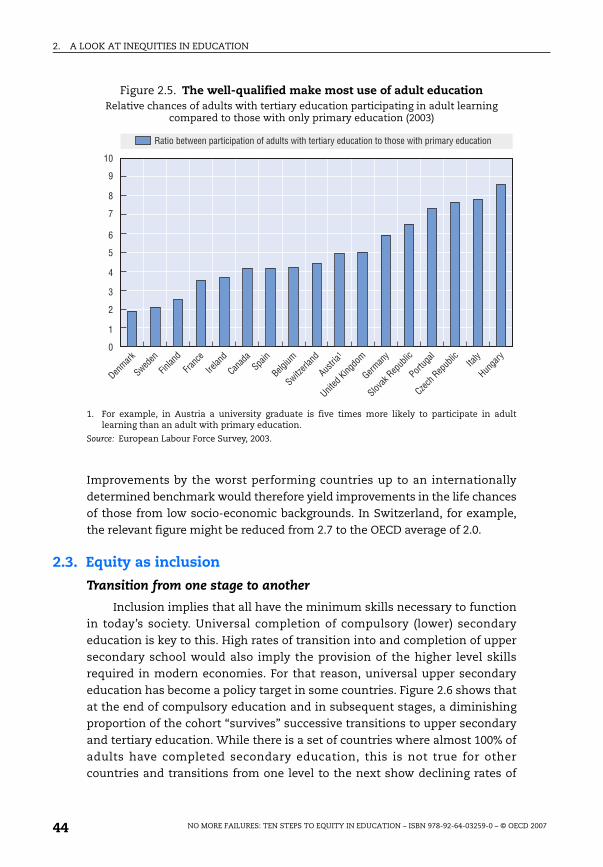
2. A LOOK AT INEQUITIES IN EDUCATION
Improvements by the worst performing countries up to an internationallydetermined benchmark would therefore yield improvements in the life chancesof those from low socio-economic backgrounds. In Switzerland, for example,the relevant figure might be reduced from 2.7 to the OECD average of 2.0.
2.3. Equity as inclusion
Transition from one stage to another
Inclusion implies that all have the minimum skills necessary to functionin today’s society. Universal completion of compulsory (lower) secondaryeducation is key to this. High rates of transition into and completion of uppersecondary school would also imply the provision of the higher level skillsrequired in modern economies. For that reason, universal upper secondaryeducation has become a policy target in some countries. Figure 2.6 shows thatat the end of compulsory education and in subsequent stages, a diminishingproportion of the cohort “survives” successive transitions to upper secondaryand tertiary education. While there is a set of countries where almost 100% ofadults have completed secondary education, this is not true for othercountries and transitions from one level to the next show declining rates of
Figure 2.5. The well-qualified make most use of adult educationRelative chances of adults with tertiary education participating in adult learning
compared to those with only primary education (2003)
1. For example, in Austria a university graduate is five times more likely to participate in adultlearning than an adult with primary education.
Source: European Labour Force Survey, 2003.
��
?
>
=
�
�
�
�
7
�
5
-��" �)
* ���#+������#� ����� ����#�6# �����#����#����� ��#��� ����#��#�����#����#���" ��#��� ����
������
���� ��
�� ��
,��#*���+��
� ��
����,��� ��
'����� �
���( )#*���+��
������ �
��� ��
� �
&�����#0�����"
���" ��
�� ��
!�����"
%��� ��
NO MORE FAILURES: TEN STEPS TO EQUITY IN EDUCATION – ISBN 978-92-64-03259-0 – © OECD 200744
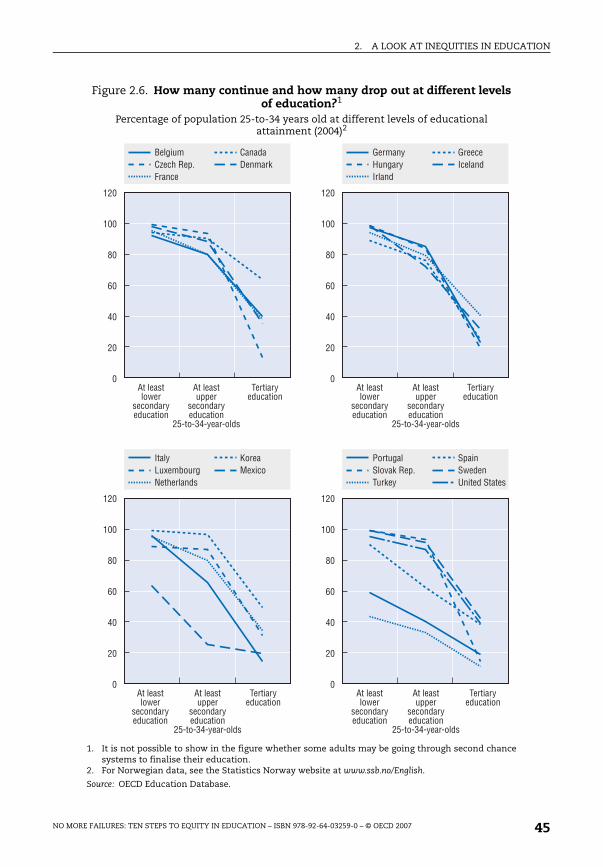
2. A LOOK AT INEQUITIES IN EDUCATION
Figure 2.6. How many continue and how many drop out at different levelsof education?1
Percentage of population 25-to-34 years old at different levels of educational attainment (2004)2
1. It is not possible to show in the figure whether some adults may be going through second chancesystems to finalise their education.
2. For Norwegian data, see the Statistics Norway website at www.ssb.no/English.
Source: OECD Education Database.
���
���
>�
7�
5�
��
�
���
���
>�
7�
5�
��
�
���
���
>�
7�
5�
��
�
���
���
>�
7�
5�
��
�
�� �� ,��#*���!�����"
-��" �) � �
'�#�� �������
����� ����� ����
'�#�� �������
����� ����� ����
�������5��� ������
3���� ����� ����
'�#�� �������
����� ����� ����
'�#�� �������
����� ����� ����
�������5��� ������
3���� ����� ����
�� ��%��� �����" ��
�� �������
������� ���.�/�"+����� ��
1�/��0���
'�#�� �������
����� ����� ����
'�#�� �������
����� ����� ����
�������5��� ������
3���� ����� ����
'�#�� �������
����� ����� ����
'�#�� �������
����� ����� ����
�������5��� ������
3���� ����� ����
3��)�����( )#*��������� �
�������� ��
&�����#�� ���
NO MORE FAILURES: TEN STEPS TO EQUITY IN EDUCATION – ISBN 978-92-64-03259-0 – © OECD 2007 45

2. A LOOK AT INEQUITIES IN EDUCATION
participation. But these transition pictures do not show which groups have ahigher propensity to continue at the two key transition points (from lowersecondary into upper secondary and from upper secondary into tertiary) andthe impact of socio-economic background on these transitions.
Differences in attainment first emerge in children of preschool age,reflecting both personal characteristics and environmental influences.Different mechanisms can then widen or narrow these differences over time.Under some circumstances school systems may reinforce initial inequalities(through lowered expectations, less demanding tracks, or simply losingconnection with those who start to fall behind). Alternatively school systemscan overcome initial inequalities by helping those who fall behind. But inpractice initial differences often widen over time. Farkas (2003) estimated thatinitial differences may be roughly doubled by the end of the twelfth grade in theUnited States (see also Shavit and Blossfeld, 1993; Grubb, 2006). Heckman (2000)argues that education is a dynamic process, such that initial learning includingboth cognitive skills and learning how to learn are preconditions for futurelearning. The implication is that it is much easier to get a student on a goodeducational trajectory at the outset than to rectify weaknesses at a later stage.
Participation in early childhood education and care (ECEC)
Enrolment of young children (3-to-6-year-olds) in early childhoodeducation and care is increasingly becoming the norm (Figure 2.7), and somecountries offer all children at least three years of free publicly funded provisionor access as a statutory right from the age of three (OECD, 2006d). Participationincreases sharply with age over the 3-to-6 age span (see Figure 2.7). These rawfigures for participation require cautious interpretation: ECEC is highlyvariable in terms of hours per week, and quality is also sometimes uncertain.
Figure 2.7 also shows that in some countries participation of 3-year-oldsin any form of ECEC is weak. In the many countries where early childhoodeducation and care is not free, participation in ECEC is closely related to familyincome (Chiswick and DebBurnam, 2004; Bainbridge et al., 2005) anddisadvantaged children frequently participate less in ECEC, despite evidencethat they benefit most (Leseman, 2002; Machin, 2006; OECD, 2006d). Wediscuss policy measures to increase participation in early childhood educationand care in Chapter 5.
Basic skills for all in compulsory education
Many children fail to acquire basic skills at school. On average across theOECD, nearly 22% of 15-year-olds score at and below PISA Level 1 in reading,and 25% score at and below PISA Level 1 in mathematics (OECD 2004b, Tables2.5a and 6.1). Boys and those who speak a different language at home have
NO MORE FAILURES: TEN STEPS TO EQUITY IN EDUCATION – ISBN 978-92-64-03259-0 – © OECD 200746
2. A LOOK AT INEQUITIES IN EDUCATION
particular problems with reading skills (OECD 2004b, Tables 6.3 and 4.2g). Theimpact on those involved is very large, because literacy provides an essentialtool for working and living and because it is an essential foundation for nearlyall higher level skills. But some countries are extremely effective at minimisingfailure. Only 6% of Finnish, 7% of Korean and 10% of Canadian 15-year-olds areat and below Level 1 in reading. Only 7% of students in Finland, and 10% inKorea and Canada were at or below Level 1 in mathematics. But in five countries– Greece, Italy, Mexico, Portugal and Turkey – more than 30% of students are atand below Level 1 in mathematics (OECD 2004b, Table 2.5a).
Dropping out
In many OECD countries, upper secondary attainment is considered theeducational minimum necessary to participate fully in the labour market andin social life. Those without this level of education are particularly at risk ofmarginalisation. Figure 2.9 shows that in at least 17 OECD countries, one inten 20-to-24-year-olds have not completed upper secondary education andwere outside of the education system. In some of these countries, includingSweden and the United States, a good proportion of dropouts “drop back in”,as there are strong adult learning systems that allow for later completion.
Figure 2.7. Getting a good start in lifeParticipation in ECEC (ISCED 0 and 1), by age (2004)
Source: Eurostat.
���
?�
>�
=�
��
��
��
�
5�
��
7�
:
G
��� ��
����,��� ��
������� ���
3��)��
.�/�"+����
��� ��
���� ��
���( )#*���+��
������ �
'�����
&�����#0�����"
,��#*���+��
���" ��
���(��� 2 � �
-��" �)
������
%��� ��
���� � �
��
!�����"
�� ���� ��
�� ��
�����
�������# �# ��#� �������# �# ��#�
�������# �# ��#7 �������# �# ��#5
NO MORE FAILURES: TEN STEPS TO EQUITY IN EDUCATION – ISBN 978-92-64-03259-0 – © OECD 2007 47
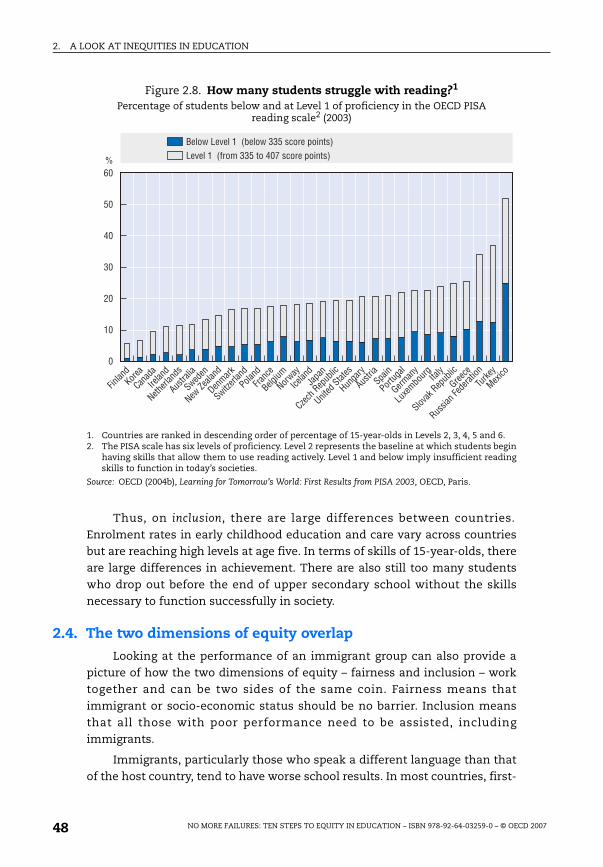
2. A LOOK AT INEQUITIES IN EDUCATION
Thus, on inclusion, there are large differences between countries.Enrolment rates in early childhood education and care vary across countriesbut are reaching high levels at age five. In terms of skills of 15-year-olds, thereare large differences in achievement. There are also still too many studentswho drop out before the end of upper secondary school without the skillsnecessary to function successfully in society.
2.4. The two dimensions of equity overlap
Looking at the performance of an immigrant group can also provide apicture of how the two dimensions of equity – fairness and inclusion – worktogether and can be two sides of the same coin. Fairness means thatimmigrant or socio-economic status should be no barrier. Inclusion meansthat all those with poor performance need to be assisted, includingimmigrants.
Immigrants, particularly those who speak a different language than thatof the host country, tend to have worse school results. In most countries, first-
Figure 2.8. How many students struggle with reading?1
Percentage of students below and at Level 1 of proficiency in the OECD PISA reading scale2 (2003)
1. Countries are ranked in descending order of percentage of 15-year-olds in Levels 2, 3, 4, 5 and 6. 2. The PISA scale has six levels of proficiency. Level 2 represents the baseline at which students begin
having skills that allow them to use reading actively. Level 1 and below imply insufficient readingskills to function in today’s societies.
Source: OECD (2004b), Learning for Tomorrow’s World: First Results from PISA 2003, OECD, Paris.
:7�
��
5�
��
��
��
�
���� ��0���
� �
��� ��
������� ���
'���� ��
������
���#$� � ��
-��" �)
����,��� ��
��� ���� ��
!�����"
���� �
�� ��2 � �
,��#*���+��
&�����#�� ���
%��� ��
'����� �� ��
������ �
���" ��
.�/�"+���� �
��
���( )#*���+��
�����
*���� �#����� ����
3��)��
1�/��
!����#.�(��#�##;+����#���#����#������<
.�(��#�##;6��"#���#��#5�=#����#������<
NO MORE FAILURES: TEN STEPS TO EQUITY IN EDUCATION – ISBN 978-92-64-03259-0 – © OECD 200748
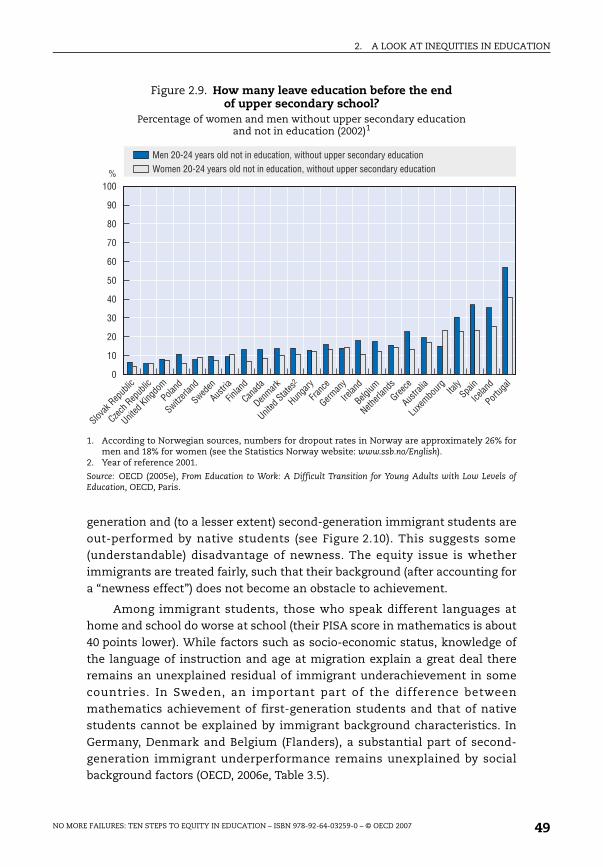
2. A LOOK AT INEQUITIES IN EDUCATION
generation and (to a lesser extent) second-generation immigrant students areout-performed by native students (see Figure 2.10). This suggests some(understandable) disadvantage of newness. The equity issue is whetherimmigrants are treated fairly, such that their background (after accounting fora “newness effect”) does not become an obstacle to achievement.
Among immigrant students, those who speak different languages athome and school do worse at school (their PISA score in mathematics is about40 points lower). While factors such as socio-economic status, knowledge ofthe language of instruction and age at migration explain a great deal thereremains an unexplained residual of immigrant underachievement in somecountries. In Sweden, an important part of the difference betweenmathematics achievement of first-generation students and that of nativestudents cannot be explained by immigrant background characteristics. InGermany, Denmark and Belgium (Flanders), a substantial part of second-generation immigrant underperformance remains unexplained by socialbackground factors (OECD, 2006e, Table 3.5).
Figure 2.9. How many leave education before the end of upper secondary school?
Percentage of women and men without upper secondary education and not in education (2002)1
1. According to Norwegian sources, numbers for dropout rates in Norway are approximately 26% formen and 18% for women (see the Statistics Norway website: www.ssb.no/English).
2. Year of reference 2001.
Source: OECD (2005e), From Education to Work: A Difficult Transition for Young Adults with Low Levels ofEducation, OECD, Paris.
:���
��
5�
��
��
��
�
?�
>�
=�
7�
1��#����5#�� ��#���#���#��#��� ����F#�������#�����#����� ��#��� ����
E�"��#����5#�� ��#���#���#��#��� ����F#�������#�����#����� ��#��� ����
� �
��� ��
������� ���
'���� ��
������
-��" �)
����,��� ��
��� ��
�� ��
!�����"
�� ��
,��#*���+��
&�����#�� ����
%��� ��
'�����
�� ��
������ �
���" ��
.�/�"+���� �
��
���( )#*���+��
�����
&�����#0�����"
���� ��
NO MORE FAILURES: TEN STEPS TO EQUITY IN EDUCATION – ISBN 978-92-64-03259-0 – © OECD 2007 49
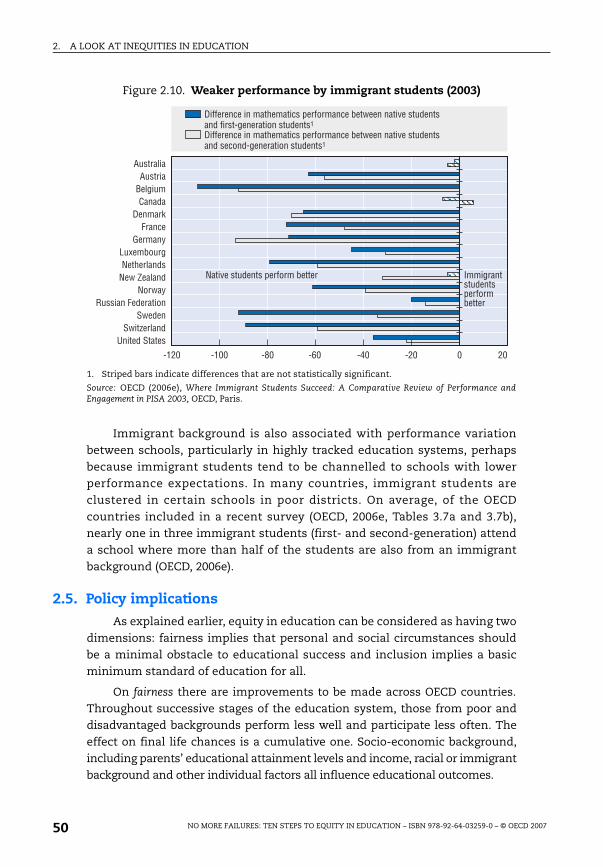
2. A LOOK AT INEQUITIES IN EDUCATION
Immigrant background is also associated with performance variationbetween schools, particularly in highly tracked education systems, perhapsbecause immigrant students tend to be channelled to schools with lowerperformance expectations. In many countries, immigrant students areclustered in certain schools in poor districts. On average, of the OECDcountries included in a recent survey (OECD, 2006e, Tables 3.7a and 3.7b),nearly one in three immigrant students (first- and second-generation) attenda school where more than half of the students are also from an immigrantbackground (OECD, 2006e).
2.5. Policy implications
As explained earlier, equity in education can be considered as having twodimensions: fairness implies that personal and social circumstances shouldbe a minimal obstacle to educational success and inclusion implies a basicminimum standard of education for all.
On fairness there are improvements to be made across OECD countries.Throughout successive stages of the education system, those from poor anddisadvantaged backgrounds perform less well and participate less often. Theeffect on final life chances is a cumulative one. Socio-economic background,including parents’ educational attainment levels and income, racial or immigrantbackground and other individual factors all influence educational outcomes.
Figure 2.10. Weaker performance by immigrant students (2003)
1. Striped bars indicate differences that are not statistically significant.
Source: OECD (2006e), Where Immigrant Students Succeed: A Comparative Review of Performance andEngagement in PISA 2003, OECD, Paris.
���� ���� �>� �7� �5� ��� � ��
'���� �� '����� !�����" � �
-��" �)�� ��
���" ��.�/�"+����������� ������#$� � ��
���� �*���� �#����� ����
����������,��� ��
&�����#�� ���
� ��(�#��������#���6��"#+����� ""��� �������������6��"+�����
-�66�����#��#" ���" ���#���6��" ��#+������#� ��(�#�������� ��#6���������� ����#���������-�66�����#��#" ���" ���#���6��" ��#+������#� ��(�#�������� ��#����������� ����#���������
NO MORE FAILURES: TEN STEPS TO EQUITY IN EDUCATION – ISBN 978-92-64-03259-0 – © OECD 200750

2. A LOOK AT INEQUITIES IN EDUCATION
On inclusion, ensuring that all have a minimum level of skills, there arelarge differences between countries. Consider for example the group of peoplewho are unable to show basic functional reading skills (at or below Level 1 inthe PISA score). Large gains could be realised if countries with weakperformance were able to raise their performance levels and ensure that alarge proportion of children have minimum skills to finish school. Reducingdropout rates would also diminish the proportion of young people who do notreach a minimum level of education.
But there are other factors which also strongly impact on the existence ofinequities across countries. These include the structure of the educationsystem and the opportunities it provides, from early childhood educationthrough different pathways in secondary education all the way to adulteducation. Other factors include the ways in which teaching is organised anddelivered in classes, the human and financial resources available in schoolsand system-level factors such as curricular differences and organisationalpolicies and practices. These issues are covered in the chapters that follow.
Both aspects of equity covered here can be amenable to policy. Within ageneral framework of policies to promote and commit to success of allstudents, some strategies may need to focus on compensating for students’low socio-economic background, while others may focus on analysing andmodifying education system mechanisms that generate and perpetuateinequalities and discrimination.
The following chapters will analyse different strategies to promotegreater equity in education and propose a set of complementary approacheswhich can be useful to attain both higher performance and reduce the impactof socio-economic background. This set of policy levers (corresponding toChapters 3, 4 and 5) has been defined to provide a clear framework to bettertarget and deliver equity in education:
● Design: Conducive structures and pathways through the education system.
● Practices: Inclusive in-school and out-of-school practices.
● Resourcing: Equity priorities, resources and targets.
The final chapter, which looks at the special case of migrants andminorities, also contains policy recommendations for practices.
References
Bainbridge, J., M. Meyers, S. Tanaka and J. Waldfogel (2005), “Who Gets an EarlyEducation? Family Income and Enrolment of Three- to Five-Year-Olds from 1968 to2000”, Social Science Quarterly, Vol. 86, No. 3, September 2005, Southwestern SocialScience Association.
NO MORE FAILURES: TEN STEPS TO EQUITY IN EDUCATION – ISBN 978-92-64-03259-0 – © OECD 2007 51
2. A LOOK AT INEQUITIES IN EDUCATION
Blanden, J., P. Gregg and S. Machin (2005), Intergenerational Mobility in Europe and NorthAmerica, Centre for Economic Performance, London.
Breen, R. and R. Luijkx (2004), “Social Mobility in Europe between 1970 and 2000” inR. Breen (ed.), Social Mobility in Europe, Oxford University Press, Oxford, pp. 37-75.
Chiswick, B. and N. DebBurnam (2004), “Pre-School Enrollment: An Analysis byImmigrant Generation”, Centre for Research and Analysis of Migration DiscussionPaper, No. 04/04.
Erikson, R. and J. Jonsson (eds.) (1996), Can Education be Equalized: The Swedish Case inComparative Perspective, Westview Press, Boulder, Colorado.
Farkas, G. (2003), “Racial Disparities and Discrimination in Education: What Do Weknow, How Do We Know It, and What Do We Need to Know?”, Teachers CollegeRecord 105(6).
Heckman, J. (2000), “Policies to Foster Human Capital”, Research in Economics, Vol. 54,No. 1, pp. 3-56.
Hiroshi, I., W. Muller and J. Ridges (1995), “Class Origin, Class Destination, andEducation: A Cross-National Study of Ten Industrial Nations”, American Journal ofSociology, 101(1), pp. 145-93.
Leseman, P. (2002), Early Childhood and Care for Children from Low-Income or MinorityBackgrounds, Discussion Paper at the OECD Oslo Workshop, 6-7 June 2002, OECD,Paris.
Machin, S. (2006), “Social Disadvantage and Education Experiences”, OECD Social,Employment and Migration Working Papers, No. 32, Directorate for Employment,Labour and Social Affairs, OECD, Paris.
Marks, G., J. Cresswell and J. Ainley (2006), “Explaining Socioeconomic Inequalities inStudent Achievement: The Role of Home and School Factors, ”Educational Researchand Evaluation, Vol. 12, No. 2, April, pp. 105-128.
OECD (2001), Knowledge and Skills for Life: First Results from PISA 2000, OECD, Paris.
OECD (2004b), Learning for Tomorrow’s World: First Results from PISA 2003, OECD, Paris.
OECD (2005a), Society at a Glance, OECD, Paris.
OECD (2005b), Extending Opportunities: How Active Social Policy Can Benefit Us All, OECD,Paris.
OECD (2005c), Education at a Glance: OECD Indicators 2005, OECD, Paris.
OECD (2005d), Promoting Adult Learning, OECD, Paris.
OECD (2005e), From Education to Work: A Difficult Transition for Young Adults with LowLevels of Education, OECD, Paris.
OECD (2006b), “Publicly Provided Goods and the Distribution of Resources”, Directoratefor Employment, Labour and Social Affairs, OECD, Paris.
OECD (2006c), Education at a Glance: OECD Indicators 2006, OECD, Paris.
OECD (2006d), Starting Strong II: Early Childhood Education and Care, OECD, Paris.
OECD (2006e), Where Immigrant Students Succeed: A Comparative Review of Performanceand Engagement in PISA 2003, OECD, Paris.
OECD (2007c), Education at a Glance: OECD Indicators 2007, OECD, Paris.
NO MORE FAILURES: TEN STEPS TO EQUITY IN EDUCATION – ISBN 978-92-64-03259-0 – © OECD 200752
2. A LOOK AT INEQUITIES IN EDUCATION
Pekkarinen, T., S. Pekkala and R. Uusitalo (2006), "Education Policy and IntergenerationalIncome Mobility: Evidence from the Finnish Comprehensive School Reform", IZADiscussion Paper, No. 2204.
Shavit and Blossfeld (1993), Persistent Inequality: Changing Educational Attainment inThirteen Countries, Westview Press, Boulder, Colorado.
NO MORE FAILURES: TEN STEPS TO EQUITY IN EDUCATION – ISBN 978-92-64-03259-0 – © OECD 2007 53

ISBN 978-92-64-03259-0
No More Failures: Ten Steps to Equity in Education
© OECD 2007
Chapter 3
Structures and Pathways
This chapter looks at the design of education systems – how theyare put together and the routes through them – to analyse theirimpact on equity. It examines selection and choice in basiceducation, the different pathways in secondary and post-secondaryeducation and explores evidence on how conducive these featuresmay be to equity. Wherever these processes direct students toseparate pathways (a process known as differentiation) andstudents in the separated pathways have different experiences,initial inequalities may be lessened or increased. The chapterargues that selection and choice create risks for equity which haveto be managed, for example by using random lotteries rather thanacademic selection to choose successful applicants for schools inhigh demand. In addition, attractive secondary educationstructures and pathways without dead ends contribute to equity,as do effective systems of second chance education for those whodid not finish when young.
55
3. STRUCTURES AND PATHWAYS
Navigating a pathway through an education system is a challenge foranyone. Often it may seem like an obstacle course or a maze with fewsignposts and many dead ends. Some students get better guidance thanothers, from parents or other adults who can point the way and help avoidtraps and pitfalls. Others have to find their own way. Some have to pay to passby favoured routes while those who cannot pay follow slower and congestedroutes. It is hardly surprising that some give up the struggle, fall by thewayside or end up somewhere they never expected or wanted to be. Thischapter looks at why education systems often appear to have this character,and what can be done to improve them.
3.1. Differentiation in schooling structures and the risks to equity
As discussed in Chapter 2, initial inequalities often increase with age andthe education system can either reinforce or help to overcome that tendency.This section looks at how academic selection and school choice can help toincrease or reduce these initial differences. As a convention we refer todecisions made by the education system as selection of students and decisionsmade by students (and sometimes their parents) as choice.
Differentiation, spread throughout the education system, can have anadditive effect. The student composition of any given classroom can dependon a number of preceding filters. For example, a highly selective educationalsystem, with selective secondary schools, streaming within schools andseparate schools for most students with special needs, may yield, through aprocess of successive distillation, classrooms which are extremelyhomogeneous in terms of attainment.
Any given pathway (for example an academic track in secondary school)affects learning in two ways. First, the teaching environment may bedistinctive, because of the curriculum, teacher quality, pedagogic approach orteaching resources. Second, students may be affected by the studentsalongside them – the peer-group effect. PISA evidence shows that the socialcomposition of the school is strongly related to individual outcomes,independently of the social background of the individual student (see OECD,2004d, Figure 4.11). Previous research has reached the same conclusion.Hanushek et al. (2001), for example, showed that in Texas schools, a 0.1standard deviation increase in peer average achievement leads to a roughly0.02 standard deviation increase in achievement of the student.
NO MORE FAILURES: TEN STEPS TO EQUITY IN EDUCATION – ISBN 978-92-64-03259-0 – © OECD 200756
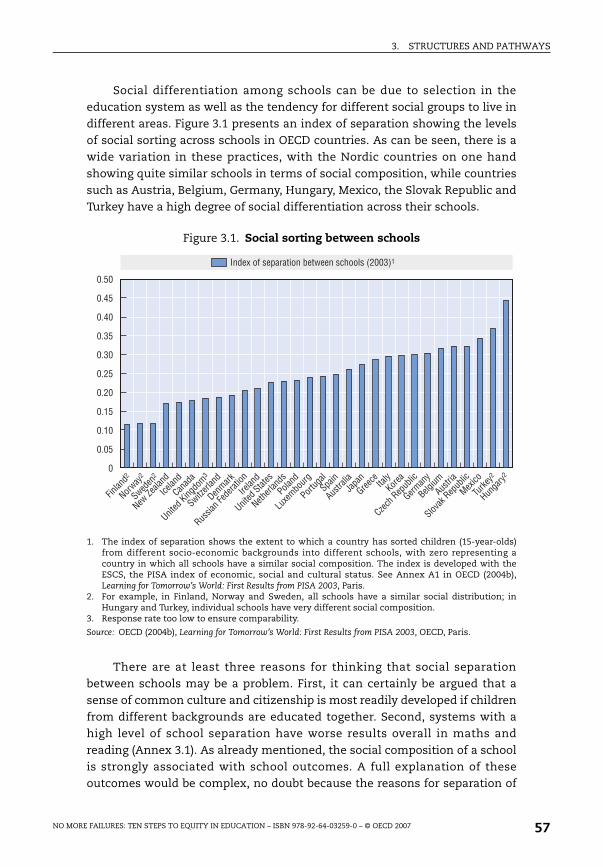
3. STRUCTURES AND PATHWAYS
Social differentiation among schools can be due to selection in theeducation system as well as the tendency for different social groups to live indifferent areas. Figure 3.1 presents an index of separation showing the levelsof social sorting across schools in OECD countries. As can be seen, there is awide variation in these practices, with the Nordic countries on one handshowing quite similar schools in terms of social composition, while countriessuch as Austria, Belgium, Germany, Hungary, Mexico, the Slovak Republic andTurkey have a high degree of social differentiation across their schools.
There are at least three reasons for thinking that social separationbetween schools may be a problem. First, it can certainly be argued that asense of common culture and citizenship is most readily developed if childrenfrom different backgrounds are educated together. Second, systems with ahigh level of school separation have worse results overall in maths andreading (Annex 3.1). As already mentioned, the social composition of a schoolis strongly associated with school outcomes. A full explanation of theseoutcomes would be complex, no doubt because the reasons for separation of
Figure 3.1. Social sorting between schools
1. The index of separation shows the extent to which a country has sorted children (15-year-olds)from different socio-economic backgrounds into different schools, with zero representing acountry in which all schools have a similar social composition. The index is developed with theESCS, the PISA index of economic, social and cultural status. See Annex A1 in OECD (2004b),Learning for Tomorrow’s World: First Results from PISA 2003, Paris.
2. For example, in Finland, Norway and Sweden, all schools have a similar social distribution; inHungary and Turkey, individual schools have very different social composition.
3. Response rate too low to ensure comparability.
Source: OECD (2004b), Learning for Tomorrow’s World: First Results from PISA 2003, OECD, Paris.
����
��5�
��5�
����
����
����
����
����
����
����
�
���� ���
���� ��
�������
���#$� � ��
�� ��
� �
&�����#0�����"�
����,��� ��
-��" �)
*���� �#����� ����
��� ��
&�����#�� ���
������� ���
��� ��
�� ��
'���� ��
���/#�6#��� � ����#+������#������#;����<�
2 � �
����� �
��0���
,��#*���+��
���" ��
!�����"'�����
���( )#*���+��
1�/��
3��)���
%��� ���
������ �
.�/�"+����
NO MORE FAILURES: TEN STEPS TO EQUITY IN EDUCATION – ISBN 978-92-64-03259-0 – © OECD 2007 57

3. STRUCTURES AND PATHWAYS
schools are themselves quite diverse. Third, the concentration ofdisadvantaged children in certain schools undoubtedly increases thechallenge of working in those schools. Depending on how teachers’ careers aremanaged and on financial incentives, more able teachers often choose toavoid teaching in those schools, adding to the obstacles facing disadvantagedchildren. Chapter 5 examines evidence for this phenomenon.
Academic selection: the risks to equity
Often, students are sorted into different pathways according to theiracademic performance. This may involve a paper and pencil test, an informalassessment of attainment or a formal qualification. Academic selection is verycommon in entry to upper secondary education, for example in France forentry to lycées or in Finland for determining who enters the academic ratherthan vocational track. In almost all countries, academic selection determinesentry to institutions at tertiary level, particularly to elite institutions. Figure 3.2shows the extent of reported academic selection in lower and uppersecondary schools. This may cover selection into individual schools as well asselection into, for example, an academic rather than a vocational track.
Figure 3.2. Where attainment determines the school attended
1. This category – “admittance by attainment” – does not apply to Norway and Iceland.2. Response rate too low to ensure comparability.
Source: OECD (2004b), Learning for Tomorrow’s World: First Results from PISA 2003, OECD, Paris.
���:
?�
>�
=�
7�
��
5�
��
��
��
�
������ ��#�6#����� ������#��#������#;�����# ��#�����#����� ��<#�����#���#������ ���������#��������H# ��"�#������# �# #@�����A������B#��# #@����#��������B#6��# �"��� �� �#�����#;����<�
������ �
������� ��
���� ��
-��" �)
��� ��
������ �
��
'���� ��
&�����#0�����"�
3��)��
���#$� � ��
� �
*���� �#����� ����
&�����#�� ���
���" ��
��� ��
!�����"1�/��
.�/�"+����
���( )#*���+��
,��#*���+��
'�����
����,��� ��0���
������� ���
%��� ��2 � �
NO MORE FAILURES: TEN STEPS TO EQUITY IN EDUCATION – ISBN 978-92-64-03259-0 – © OECD 200758
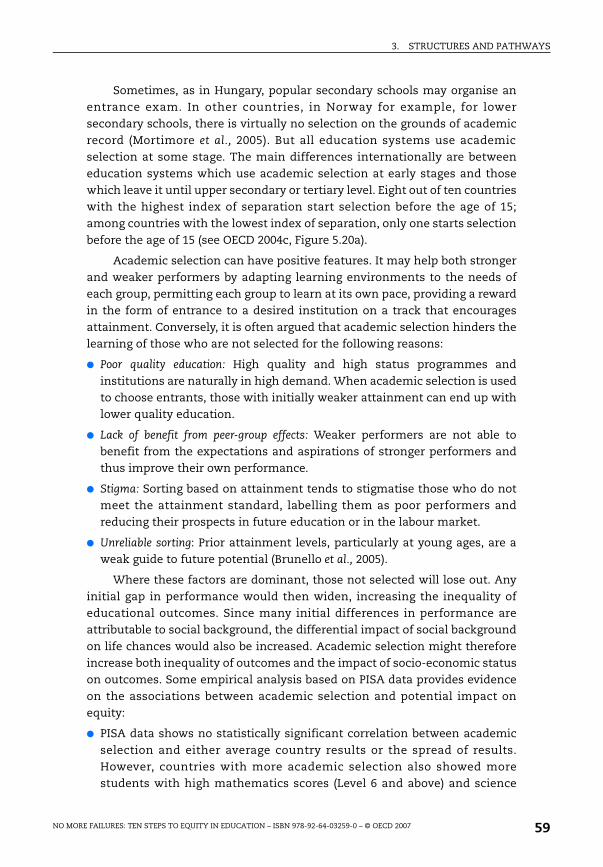
3. STRUCTURES AND PATHWAYS
Sometimes, as in Hungary, popular secondary schools may organise anentrance exam. In other countries, in Norway for example, for lowersecondary schools, there is virtually no selection on the grounds of academicrecord (Mortimore et al., 2005). But all education systems use academicselection at some stage. The main differences internationally are betweeneducation systems which use academic selection at early stages and thosewhich leave it until upper secondary or tertiary level. Eight out of ten countrieswith the highest index of separation start selection before the age of 15;among countries with the lowest index of separation, only one starts selectionbefore the age of 15 (see OECD 2004c, Figure 5.20a).
Academic selection can have positive features. It may help both strongerand weaker performers by adapting learning environments to the needs ofeach group, permitting each group to learn at its own pace, providing a rewardin the form of entrance to a desired institution on a track that encouragesattainment. Conversely, it is often argued that academic selection hinders thelearning of those who are not selected for the following reasons:
● Poor quality education: High quality and high status programmes andinstitutions are naturally in high demand. When academic selection is usedto choose entrants, those with initially weaker attainment can end up withlower quality education.
● Lack of benefit from peer-group effects: Weaker performers are not able tobenefit from the expectations and aspirations of stronger performers andthus improve their own performance.
● Stigma: Sorting based on attainment tends to stigmatise those who do notmeet the attainment standard, labelling them as poor performers andreducing their prospects in future education or in the labour market.
● Unreliable sorting: Prior attainment levels, particularly at young ages, are aweak guide to future potential (Brunello et al., 2005).
Where these factors are dominant, those not selected will lose out. Anyinitial gap in performance would then widen, increasing the inequality ofeducational outcomes. Since many initial differences in performance areattributable to social background, the differential impact of social backgroundon life chances would also be increased. Academic selection might thereforeincrease both inequality of outcomes and the impact of socio-economic statuson outcomes. Some empirical analysis based on PISA data provides evidenceon the associations between academic selection and potential impact onequity:
● PISA data shows no statistically significant correlation between academicselection and either average country results or the spread of results.However, countries with more academic selection also showed morestudents with high mathematics scores (Level 6 and above) and science
NO MORE FAILURES: TEN STEPS TO EQUITY IN EDUCATION – ISBN 978-92-64-03259-0 – © OECD 2007 59
3. STRUCTURES AND PATHWAYS
scores (more than 600 points) – but not more with strong reading skills (seeAnnex 3.2.1). There was no association with the proportion of low-levelperformers.
● On the other hand, PISA evidence shows that countries using moreacademic selection tend also to show a stronger effect of social backgroundon individual performance (see Annex 3.2.2).
● Academic selection by schools is also often associated with more socialseparation between schools (see Annex 3.2.3), but in fact the relationship isstrongly mediated by school choice (see Annex 3.2.4). Bjorklund et al. (2004)looked at the effect of a Swedish school reform which allowed independentschools in Stockholm to select by ability. Following the reform, segregationacross schools (in respect of factors like immigrant status, and parentalincome) increased markedly, suggesting that in this case the associationbetween selection and segregation was causal. Similar results are reportedin England by Fitz et al. (2001).
Sometimes, given school choice, academic selection may be used by over-subscribed schools to select students. Individual schools have incentives touse academic selection, since children who already have good results may beeasier to teach and have fewer disadvantages of social background to affecttheir performance and behaviour at school. Table 3.1 shows that a number ofOECD countries allow over-subscribed schools to use academic selection tochoose students but many other criteria are also used to select students. InSpain, for example, selection reflects factors such as family income,enrolment of siblings, as well as proximity of home to school.
One potential solution is to require oversubscribed schools to use alottery to select successful applicants. Here are two examples:
● In Minato City, Tokyo, Japan, successful applicants to elementary and lowersecondary schools from outside the district are selected by lottery.
● In Milwaukee, United States, which has an extensive system of schoolchoice, a lottery is used alongside criteria like local residence and having asibling at the school to choose successful applicants.
Alternatively, as discussed in Chapter 5, if school funding is weightedaccording to the social circumstances of the school population, popular schoolsmay be offered a financial incentive to preserve an even social mix in the school.
In summary, the evidence points to the fact that early academic selectionposes risks to equity, especially in the context of school choice (discussedbelow). School popularity may reflect quality teaching or strong peer groupsupport for learning or both. The combined effect will be to accelerate thelearning of the stronger performers and could create a gap in overalloutcomes.
NO MORE FAILURES: TEN STEPS TO EQUITY IN EDUCATION – ISBN 978-92-64-03259-0 – © OECD 200760

3. STRUCTURES AND PATHWAYS
Table 3.1. Selection and school choice practices
CountryDo parents have free school choice?
Financial instruments and fees
Selection at school level
Belgium (Flanders) • Parents may request a school of their preference for their children.
• Grant-aid from the state. • No fees. • In secondary schools,
parents may contribute towards the costs of certain school activities and teaching aids.
• First-come first-served basis.
Finland • Admission primarily according to residence in catchment area but exceptions possible.
• Private schools are financed by the state.
• No fees.
• Criteria determined by the Ministry of Education.
France • Admission primarily according to residencein catchment area but exceptions possible.
• Private schools receive public funding covering part of expenses.
• At upper secondary level: opinion of the class council, family opinion, residencein catchment area.
Hungary • Admission primarily according to residence in catchment area but exceptions possible.
• Per capita state grant for each student (about 60%to 80%), the reminder covered by the maintainer of school.
• Church schools receive 100% per student capita grant funding.
• When demand exceeds supply, selection by ability is possible.
Norway • At primary and lower secondary level, admission according to residential area.
• At upper secondary level school choice within the closest municipalities.
• Private schools usually receive 85% of total expenses.
• No admission requirement in basic school.
• At upper secondary level: applicant's grades and the county's course provision.
• More than 90% of students are admitted to courses of their first choice.
Slovenia • Admission primarily according to residencein catchment area but exceptions possible.
• Private preschool institutions and schools receive 85% of funds provided by the state or by the municipality.
• When demand exceeds supply, selection by ability is possible.
Spain • Parents may request a school of their preference for their children.
• Private schools (centros concertados) receive grants from National Budget.
• No fees.
• Annual family income, proximity of the parents’ home, prior enrolment of other siblings in the school, size of the family, handicap and previous attendance of children in non-compulsory preschool of the same institution.
NO MORE FAILURES: TEN STEPS TO EQUITY IN EDUCATION – ISBN 978-92-64-03259-0 – © OECD 2007 61
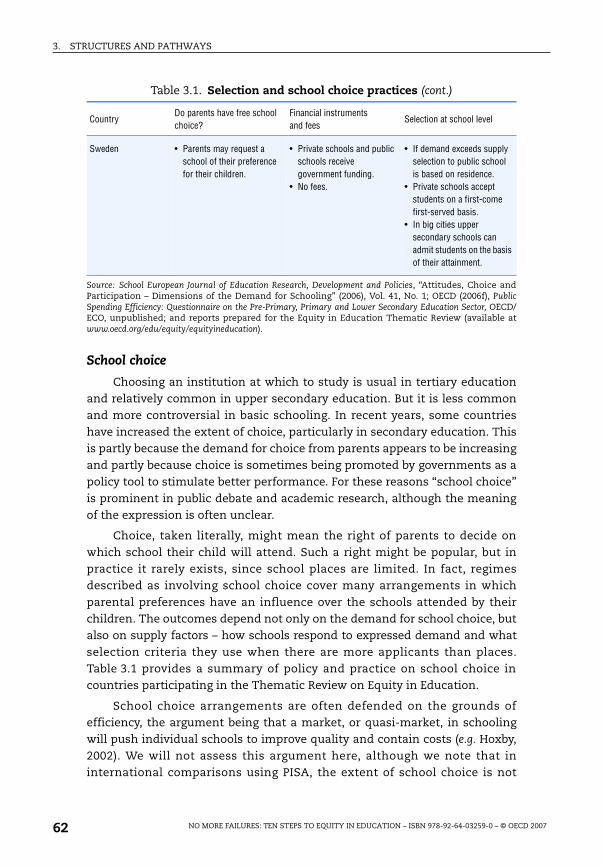
3. STRUCTURES AND PATHWAYS
School choice
Choosing an institution at which to study is usual in tertiary educationand relatively common in upper secondary education. But it is less commonand more controversial in basic schooling. In recent years, some countrieshave increased the extent of choice, particularly in secondary education. Thisis partly because the demand for choice from parents appears to be increasingand partly because choice is sometimes being promoted by governments as apolicy tool to stimulate better performance. For these reasons “school choice”is prominent in public debate and academic research, although the meaningof the expression is often unclear.
Choice, taken literally, might mean the right of parents to decide onwhich school their child will attend. Such a right might be popular, but inpractice it rarely exists, since school places are limited. In fact, regimesdescribed as involving school choice cover many arrangements in whichparental preferences have an influence over the schools attended by theirchildren. The outcomes depend not only on the demand for school choice, butalso on supply factors – how schools respond to expressed demand and whatselection criteria they use when there are more applicants than places.Table 3.1 provides a summary of policy and practice on school choice incountries participating in the Thematic Review on Equity in Education.
School choice arrangements are often defended on the grounds ofefficiency, the argument being that a market, or quasi-market, in schoolingwill push individual schools to improve quality and contain costs (e.g. Hoxby,2002). We will not assess this argument here, although we note that ininternational comparisons using PISA, the extent of school choice is not
Table 3.1. Selection and school choice practices (cont.)
CountryDo parents have free school choice?
Financial instrumentsand fees
Selection at school level
Sweden • Parents may request a school of their preference for their children.
• Private schools and public schools receive government funding.
• No fees.
• If demand exceeds supply selection to public schoolis based on residence.
• Private schools accept students on a first-come first-served basis.
• In big cities upper secondary schools can admit students on the basis of their attainment.
Source: School European Journal of Education Research, Development and Policies, “Attitudes, Choice andParticipation – Dimensions of the Demand for Schooling” (2006), Vol. 41, No. 1; OECD (2006f), PublicSpending Efficiency: Questionnaire on the Pre-Primary, Primary and Lower Secondary Education Sector, OECD/ECO, unpublished; and reports prepared for the Equity in Education Thematic Review (available atwww.oecd.org/edu/equity/equityineducation).
NO MORE FAILURES: TEN STEPS TO EQUITY IN EDUCATION – ISBN 978-92-64-03259-0 – © OECD 200762
3. STRUCTURES AND PATHWAYS
associated with either average mathematics results or their spread. Insteadwe look at some of the main potential risks for equity presented by schoolchoice.
Informed Demand
In general, informed demand reflects the education level of parents.There is abundant evidence that the informed engagement of parents ishelpful to the attainment of the child (Bobbitt and Horn, 2000). This meansthat those with weaker parental support will be at a disadvantage, whetherthe issue is supporting homework, or advising on choice of subject of study, orchoice of school. Methods for overcoming the inequities arising from homebackground are discussed in Chapter 4. But risks remain when complexdecisions need to be taken, so that the “winners” are the students with thebest-educated parents. One particular risk is that well-informed parents maychoose schools where the school mix is more affluent. From the point of viewof these parents, this may be desirable given that peer group effects maybenefit their child but it increases inequities between schools.
Costs
Even when there are no fees, there may be other costs, such as textbooks,uniforms, transportation to school or other expectations of voluntary financialcontributions. In the Russian Federation for example, informal costs – such asfor textbooks and extra lessons – have a significant effect on the choice ofschool (Ministry of Education, Russian Federation, 2005).
In the traditional neighbourhood school model, well-off parents canchoose schools for their children by buying or renting accommodation in therelevant catchment area. Often desirable schools tend to be in better off areaswith higher property prices and rents. Sometimes, the defined catchmentareas of good schools increase the price of accommodation in those areas(Gibbons and Machin, 2001). The perverse effect is that although schooling isprovided free, schooling perceived to be of good quality has an implicit price inthe housing market.
Parents may choose private schools, either fully independent schoolswhich charge fees and receive no government funding or those which,although privately managed, receive government subsidies and charge no feesor very low fees. Dronkers and Robert (2003) found that while the subsidisedsector is more effective than the government sector (mainly because of abetter school climate), the fully private sector is less effective, after takingaccount of peer-group effects of the student population. These results mayappear surprising. Private schools are often more costly than state schools. Inaddition, it could be supposed that market pressures in the private sector
NO MORE FAILURES: TEN STEPS TO EQUITY IN EDUCATION – ISBN 978-92-64-03259-0 – © OECD 2007 63

3. STRUCTURES AND PATHWAYS
would encourage efficiencies. Why do they not do so? One answer is that localmonopolies may be involved. Fee-paying private schools only cater to thewealthier sections of society and, given travelling distances, there may belimited local competition. Under these circumstances, a private school mayfind it profitable to provide a learning environment which is of similar qualityto local state schools. Parents will still choose to send their children to theprivate school because its social composition may yield a better learningenvironment overall than public schools – particularly once the school isestablished and has skimmed off the more socially advantaged students inlocal schools.
The effects of school choice on the social mix of schools
In practice, countries with more school choice also tend to have schoolsystems which are more socially separated (see Figure 3.3). (In this analysis,school choice was measured through an inverse PISA proxy – the extent towhich place of residence determines school admission.) When the joint effectof school choice and academic selection was examined, school choiceemerged as the prime driver of separation, while academic selection becamestatistically insignificant (see Annex 3.2.2). Conceivably, more socially
Figure 3.3. Does school choice increase social differences between schools? (2003)
1. The index of separation shows the extent to which a country has sorted children (15-year-olds)from different socio-economic backgrounds into different schools, with zero representing acountry in which all schools have a similar social composition. The index is developed with theESCS, the PISA index of economic, social and cultural status. See Annex A1 in OECD (2004b),Learning for Tomorrow’s World: First Results from PISA 2003, OECD, Paris.
Source: OECD (2004b), Learning for Tomorrow’s World: First Results from PISA 2003, OECD, Paris.
�
����
�� �� �� 5� �� 7� =�
��5�
��5�
����
����
����
����
�
����
����
����
>� ?� ���
*���� �#����� ����&�����#�� ���
3��)��
����,��� ��
������
�� ��
���( )*���+��
������ � ��� ��
���� �
���#$� � ��
������� ���
1�/��
.�/�"+����
0��� 2 � �
� ��
��� ���� ��
%��� ��
��������" ��
���� ��
-��" �)
,��#*���+��
� �
!�����" '�����
'���� ��
���/#�6#�����#��� � �����
:#�6#��������#��#������#�����#���#������ ��#�������#��������� �#�� ����# �# #@�����A������B��# #@����#��������B#6��# �"��� ��# �#�����
NO MORE FAILURES: TEN STEPS TO EQUITY IN EDUCATION – ISBN 978-92-64-03259-0 – © OECD 200764
3. STRUCTURES AND PATHWAYS
separated schools may increase the demand for school choice (as well as beingthe result of school choice) with middle-class parents seeking to escape theperceived risks of schools with many children from deprived backgrounds.Although the causal relationships are uncertain, the risks to equity of schoolchoice – particularly through social polarization of schools – are sufficientlysalient to require careful management, avoiding academic selection as muchas possible and using measures such as lotteries in order to ensure a socialbalance in school intake.
In Spain, concern over the potential weakening of comprehensiveschooling through segregation based on unequal real choice led at least theregional government of Catalunya to develop a policy of co-ordinated, area-based provision, centred on educational zones in Barcelona (Teese et al., 2005).The regional and local governments have jointly formed an EducationConsortium (approved in 2002, but only recently brought into operation) todevelop a strong education network of schools taking into consideration socialcohesion principles.
3.2. Early tracking and comprehensive schooling
Many education systems contain mechanisms for dividing students intoseparate types of education, with different curricula, different qualificationsat the end of the programme and different expectations of transition tofurther education or work, representing different tracks. Commonly, moreacademic tracks offer readier access to tertiary education, and vocationaltracks provide training for particular jobs or trades in the labour market(although these may also provide options for continued education). Thedivision into separate tracks usually takes place at different levels duringsecondary education. In Hungary for example, children aged around 12 (about6% in 2005/06) can apply for admittance to different tracks. Other studentsmove at the age of 14 to one of three different tracks: an academic schoolpotentially leading to tertiary education, a vocational school providingvocational qualifications and giving access to tertiary education, or a shortprogramme of vocational training in another type of school leading to earlydeparture from school and entry into the labour market. In other countries, forexample in Finland, Norway and Sweden, the division between academic andvocational tracks occurs at upper secondary level.
Many OECD countries have introduced comprehensive education up toabout the age of 15, typically abolishing tracked lower secondary education in theprocess. The Nordic countries were among the first to make the change morethan a generation ago, while Spain introduced the reform as recently as the early1990s by adding two more years of comprehensive schooling. A number ofcountries in Central Europe retain systems which divide children between
NO MORE FAILURES: TEN STEPS TO EQUITY IN EDUCATION – ISBN 978-92-64-03259-0 – © OECD 2007 65
3. STRUCTURES AND PATHWAYS
vocational and more academic tracks in early adolescence. In some countries,even though there is no nationwide or regional system of tracking, informaltracking may emerge locally, through selection into different schools or becausedifferent streams within schools offer different curricula. This characterises theposition, for example, in some parts of the United States. Academic selection isnormally important in determining which track students enter. In manycountries, those with higher attainment typically enter academic tracks(although Sweden and Norway represent an important exception, in that theyhave no threshold of academic attainment required for entry into general uppersecondary education). To some extent, all the potential risks to equity associatedwith academic selection also apply to tracked systems. But choice is also a factor,and students aiming for a particular occupation for which vocational education isimportant may opt for that track even when their school results would havepermitted them to follow an academic track.
Effects of early tracking on equity and quality
Countries with early tracking performed less well on average in PISA 2000than countries with more comprehensive education systems (OECD, 2005e). InPISA 2003, neither the number of distinct tracks nor the age at first selectionwere found to have a statistically significant relationship with either averagemathematics performance or the spread of performance (the standarddeviation, see OECD, 2004d, Figure 5.20b, p. 263). However the effect of socialbackground on performance – an indicator of inequity – was clearly strongerin countries with earlier ages of selection and a larger number of separatetracks. Hanushek and Wössmann (2005) take this issue further by looking atthe effects of early tracking by comparing school outcomes at primary school(examined through PIRLS) with outcomes at age 15. They conclude that“Variation in performance, measured in a variety of ways, tends to increaseacross levels of schooling when a country employs early tracking. Althoughthe evidence on the level of performance is more mixed, there is very littleevidence that there are efficiency gains associated with this increasedinequality”. Bauer and Riphahn (2005), analysing data from Switzerland(where the age of first tracking differs across cantons), found that earlytracking reinforces the relative advantage of children of highly educatedparents if compared to children of parents with low level of education.Drawing on this evidence, a Communication of the European Commissionargues that tracking should be postponed to upper secondary level (Council ofthe European Union, 2006; Commission of the European Communities, 2006).
There are also experiences where individual school systems haveabolished early tracking:
● Meghir and Palme (2005) showed that Swedish reform in the 1950s, whichreplaced tracking at age 12 with a comprehensive system, increased
NO MORE FAILURES: TEN STEPS TO EQUITY IN EDUCATION – ISBN 978-92-64-03259-0 – © OECD 200766
3. STRUCTURES AND PATHWAYS
attainment overall and helped equity by generating particularly sharpimprovements for students with unskilled fathers.
● Under a 2002 reform of the Polish education system, selection betweenacademic and vocational tracks was postponed from the age of 14 to 15.When data from PISA 2000 and PISA 2003 are compared, this reformappears to have both increased average performance and reduced inequity.(An alternative hypothesis is that delaying tracking by one year delays, butdoes not remove, a one-off downward impact on performance of a schooltransition.)
● Pekkarinen et al. (2006) showed that Finnish school reform in the 1970s,which postponed tracking from age 11 to age 16 and introduced a uniformcurriculum in lower secondary schools, improved equity by reducing theearnings correlation between fathers and sons.
The existence of early tracks may create other risks for equity. Resourcesare one issue. For example Oakes et al. (1992) showed that in high schools inthe United States, better teachers and more resources are often assigned tomore academic and prestigious tracks. Pedagogy is another issue. In systemsemploying early tracking, students report that their mathematics teachers aregenerally less likely to show interest in individual student learning (OECD,2004d). In comprehensive systems, the heterogeneity of the classroomencourages attention to individual learning needs. Chapter 4 providesexamples of different approaches in this area.
There is much less evidence on the effect of streaming within schools,but PISA 2003 shows that where ability grouping in mathematics classes isavoided, there is better overall performance (OECD, 2004b).
To explore whether the construction of the education system tends toreinforce or weaken the impact of students’ background on achievement,some national systems (France and Australia, for example) monitor the flowthrough various pathways of students from different backgrounds. But inother systems (in Spain, for example) there is limited monitoring. Verylimited monitoring can conceal problems of access and transition, taking thepressure off institutions and transferring the problem to individuals to solveon their own.
3.3. Designing an inclusive upper secondary education system
The design of education systems can either increase or diminish initialinequities. Key factors for success include effective transitions from one levelto the next (points at which students at risk may fall out of the system),attractive alternatives to mainstream upper secondary education, bridgesfrom one educational track to another and second chance education.
NO MORE FAILURES: TEN STEPS TO EQUITY IN EDUCATION – ISBN 978-92-64-03259-0 – © OECD 2007 67
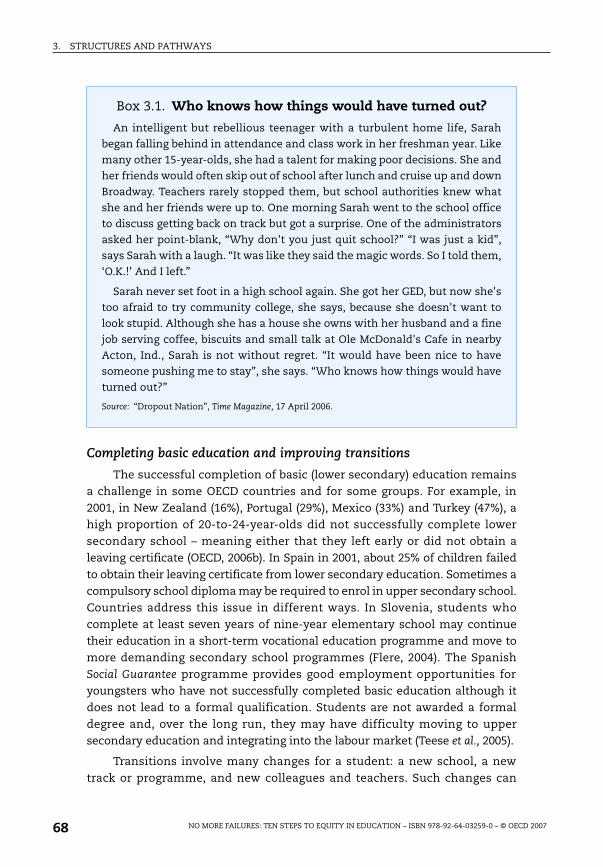
3. STRUCTURES AND PATHWAYS
Completing basic education and improving transitions
The successful completion of basic (lower secondary) education remainsa challenge in some OECD countries and for some groups. For example, in2001, in New Zealand (16%), Portugal (29%), Mexico (33%) and Turkey (47%), ahigh proportion of 20-to-24-year-olds did not successfully complete lowersecondary school – meaning either that they left early or did not obtain aleaving certificate (OECD, 2006b). In Spain in 2001, about 25% of children failedto obtain their leaving certificate from lower secondary education. Sometimes acompulsory school diploma may be required to enrol in upper secondary school.Countries address this issue in different ways. In Slovenia, students whocomplete at least seven years of nine-year elementary school may continuetheir education in a short-term vocational education programme and move tomore demanding secondary school programmes (Flere, 2004). The SpanishSocial Guarantee programme provides good employment opportunities foryoungsters who have not successfully completed basic education although itdoes not lead to a formal qualification. Students are not awarded a formaldegree and, over the long run, they may have difficulty moving to uppersecondary education and integrating into the labour market (Teese et al., 2005).
Transitions involve many changes for a student: a new school, a newtrack or programme, and new colleagues and teachers. Such changes can
Box 3.1. Who knows how things would have turned out?
An intelligent but rebellious teenager with a turbulent home life, Sarah
began falling behind in attendance and class work in her freshman year. Like
many other 15-year-olds, she had a talent for making poor decisions. She and
her friends would often skip out of school after lunch and cruise up and down
Broadway. Teachers rarely stopped them, but school authorities knew what
she and her friends were up to. One morning Sarah went to the school office
to discuss getting back on track but got a surprise. One of the administrators
asked her point-blank, “Why don't you just quit school?” “I was just a kid”,
says Sarah with a laugh. “It was like they said the magic words. So I told them,
‘O.K.!’ And I left.”
Sarah never set foot in a high school again. She got her GED, but now she's
too afraid to try community college, she says, because she doesn't want to
look stupid. Although she has a house she owns with her husband and a fine
job serving coffee, biscuits and small talk at Ole McDonald's Cafe in nearby
Acton, Ind., Sarah is not without regret. “It would have been nice to have
someone pushing me to stay”, she says. “Who knows how things would have
turned out?”
Source: “Dropout Nation”, Time Magazine, 17 April 2006.
NO MORE FAILURES: TEN STEPS TO EQUITY IN EDUCATION – ISBN 978-92-64-03259-0 – © OECD 200768

3. STRUCTURES AND PATHWAYS
precipitate dropout.1 Given academic selection, some youngsters might notmeet the formal requirements to obtain a place in the school of their choice.In Switzerland for example, completing compulsory education is a necessarycondition but not always sufficient to obtain an apprenticeship position.Moreover, some students – many with immigrant backgrounds – are not ableto enrol for any form of education or training after completing lowersecondary education (Coradi Vellacott and Wolter, 2004).
Countries have different strategies to support students at transitionpoints. In Sweden and Finland, students who would like to improve theirgrades and skills are offered special programmes at the end of lowersecondary school (see Box 3.2).
In the United States, Early College High Schools (recently created tocombine upper secondary education with some tertiary education courses)have been successful in reducing dropout. However, it is not clear whether thedecrease has been in response to the combination of upper secondary andtertiary courses or to other important elements of the programme (see Box 3.3).
Box 3.2. Parallel secondary education completion programmes in selected countries
In the Finnish special course of study, students may stay one additional
year in comprehensive school and follow a special course of study. In 2002,
35% of students who chose this option were enrolled in general education,
48% were enrolled in vocational programmes, 3% were working and 2% were
unemployed or in other activities (Grubb et al., 2005).
The individual programme in Sweden is designed for students who lack the
entrance requirements for upper secondary school, and aims to return them
to mainstream education. In 2002, pupils enrolled in individual programmes
represented 7% of all pupils in upper secondary school, with an
overrepresentation of students with immigrant background (about 40%
compared to 15% for all programmes). But the outcomes of the programme
were modest. Four years after graduating from compulsory school, half of
those who received remedial tuition in year 9 had dropped out of their upper
secondary studies (Swedish National Agency for Education, n.d.).
France has a programme (les dispositifs relais) which aims to reintegrate
disaffected students at lower secondary level into either general or vocational
formal education. Of the students attending classes relais in 2000/01, 80%
integrated into mainstream schools or found employment (Ministry of
National Education, Higher Education and Research, France, 2004).
NO MORE FAILURES: TEN STEPS TO EQUITY IN EDUCATION – ISBN 978-92-64-03259-0 – © OECD 2007 69

3. STRUCTURES AND PATHWAYS
Equivalent alternatives: vocational and other pathways
Some people drop out because they find traditional styles of academiclearning unappealing. Attractive and constructive alternatives in secondaryeducation may therefore help provide more opportunities for these studentsand reduce dropout. The principle of equivalence aims to reconcile equalityand diversity: equal levels of education should in principle have equal valueand impact on people’s opportunities (for example, in terms of access tolabour market positions or further and tertiary education). The aim is that all
children complete the equivalent of upper secondary school and that all havethe opportunity to pursue tertiary studies if they so desire (Nicaise et al., 2005).This strategy requires better guidance and counselling for students; improving
Box 3.3. The Early College High School Initiativein the United States
This initiative, supported by the Bill & Melinda Gates Foundation, aims to
improve high school completion rates and increase the number of students
transferring to college, especially for low-income students, black Americans
and those for whom English is not their native language. These schools are
small (maximum 400 students) and aim to help students earn their high
school diploma and obtain two-year college credits allowing access to
university education. Each student has a personalised learning plan and
receives support from advisors and teachers in and out of school through a
longer school day, Saturday school, and summer school. Parents and
community are also involved in the programme.
These institutions have met with some difficulties, including a demanding
curriculum and varying levels of academic and social skills among students
who enrol. The challenge is to provide weaker learners with support while
maintaining standards. In response, some schools in the scheme have
introduced a minimum requirement entry exam – a selection tool which may
pose problems to equity. In addition, teacher turnover has been particularly
important in schools where students’ success depends strongly on student-
teacher relationships.
First evaluation results suggest positive impacts on attendance, academic
engagement and self-esteem, completion rate from high school, and
transition to post-secondary school. At one school in Ferndale, Washington
near an Indian reservation (the Lummi Nation Reservation), dropout rates
decreased after the school joined Early College High School Initiative in 2004
– from 69% in 2002 to 16% in 2004/05. There are plans to establish more than
170 Early College High Schools by 2008.
Source: American Institute for Research, 2006; Hoffman, 2003; Centre for Native Education, n.d.;The Early College High School Initiative, n.d.; Wolk, 2005.
NO MORE FAILURES: TEN STEPS TO EQUITY IN EDUCATION – ISBN 978-92-64-03259-0 – © OECD 200770

3. STRUCTURES AND PATHWAYS
the quality of vocational education and training (VET) and other options; and,as alternatives to more academic pathways, courses which offer easiertransitions to the world of work. Education systems must offer strongincentives for learning and ensure that these incentives are understood by allstudents, including those with the weakest achievement. Without cleardemonstrable benefits, early school leaving and under-achievement willcontinue.
Traditionally, vocational education and training have catered to studentsof lower socio-economic background and/or lower academic achievement,particularly in some countries (Arum and Shavit, 1994). In the period ofeducational expansion, “vocational education enabled the educationalsystems to absorb disadvantaged groups at the secondary level withoutdisturbing the basic social interests of advantaged groups at higher levels inthe school system.” (Blossfeld and Shavit, 1993) In fact, in countries whichparticipated in the Thematic Review on Equity in Education (such as Sweden,Finland, Norway and Hungary), VET students are particularly subject todropout when compared with students in academic tracks. Conversely,because of its practical orientation, VET may help to engage students whodislike more academic learning. Arum and Shavit (1994) argue that vocationaleducation can become a safety net for these students, since VET can providepractical labour market skills to less academically inclined students. Abetween-countries comparison (Figure 3.4) shows that countries with higher
Figure 3.4. Some countries with larger VET systems have lower dropout rates (2001, 2002)
Source: OECD (2005e), From Education to Work: A Difficult Transition for Young Adults with Low Levels ofEducation, OECD, Paris; Eurydice.
�
7�
�� �� �� 5� �� 7� =�
��
5�
��
�
��
��
>� ?� ���
&�����#0�����"������
�� ��
���( )#*���+��
������ �
��� ��
������� ���.�/�"+����
� ��
�� ��
%��� ��
�����
���" ���� ��
���� ��-��" �)
,��#*���+��
!�����"'�����
-������#� ���# "���#�������5��� ������F#����
������ ��#�6#��������#��#I93F#����J����
NO MORE FAILURES: TEN STEPS TO EQUITY IN EDUCATION – ISBN 978-92-64-03259-0 – © OECD 2007 71

3. STRUCTURES AND PATHWAYS
percentages of students in VET tend also to have lower dropout rates(correlation –0.60, significant). However, these results are difficult to interpret.
Many countries are seeking to make VET more attractive in both contentand quality in order to retain students in education and training and improvetheir access to upper secondary academic programmes or tertiary education.A more flexible curriculum may help make VET more attractive and reducedropout rates. In a longitudinal study of 22 non-selective government highschools in New South Wales (Australia), Ainley and Sheret (1992) report that awider curriculum based on alternative programmes improves students’progression. DeLuca et al., (2005) find that among students in vocationaleducation (at the statutory age when entering high school), dropout decreaseswhen students follow both academic and vocational courses. The review teamthat visited Spain points out that “links between academic and vocationalstudies have great pedagogical importance. A rigid separation between
Box 3.4. VET Reforms to improve equity and quality
Sweden and Norway have reformed upper secondary education in an
attempt to improve the quality of VET. Both countries have flexible secondary
systems without dead ends, with all tracks (academic as well as vocational)
allowing access to tertiary education. In Norway, students can choose
between equally respected strands of courses in general academic and
vocational/technical fields. The curriculum followed by all students in upper
secondary school combines theoretical knowledge with vocational training,
although according to recent estimates by Statistics Norway, the dropout rate
in Norway is still high (around 23%).
The Swedish VET system has 17 different equivalent upper secondary
programmes, including 3 academic and 14 vocational. All vocational courses
have been supplemented by theoretical subjects. In Sweden, however, there
are high dropout rates from upper secondary education.1 One possibility is
that the new vocational courses are too difficult and too long for less
academically oriented students. As we know, the impact of VET reform on
dropout rates has not been yet examined.2
In addition, many countries, including Finland, France, Spain and
Switzerland, have created direct pathways from upper secondary vocational
education to vocational tertiary education.
1. In Sweden, the VET system was reformed at the beginning of the 1990s. The duration ofstudies was extended from two to three years, the VET curriculum was completed withtheoretical subjects and assessment methods were changed.
2. Ekstrom (2003) analysed the impact of the third year in vocational upper secondaryeducation on the enrolment in tertiary education and on the employment rate. Sheobserved a positive impact of the new VET on participation in tertiary education and null ornegative impact on employment opportunities.
NO MORE FAILURES: TEN STEPS TO EQUITY IN EDUCATION – ISBN 978-92-64-03259-0 – © OECD 200772

3. STRUCTURES AND PATHWAYS
academic and vocational prevents them from being exploited, and contributesto higher rates of failure.” (Teese et al., 2005)
Some countries are allowing students to transfer between general andvocational courses and to obtain key skills and competences in modular form,regardless of the track or stream. In Flemish Belgium, students can choosebetween vocational and general courses and receive both vocationalqualifications and diplomas of general studies giving access to tertiaryeducation. In the 1990s, Finland piloted an approach in which students weregiven the option of choosing courses at both general and vocational uppersecondary school. The success of this experiment was rather limited; fewstudents earned double qualifications. One limitation of this programme wasthat the students involved received rather weak counselling and guidance inhow to go about developing their own courses of study (Grubb et al., 2005).
Guidance and counselling
Some young people may find themselves in programmes they are notinterested in, either because of inadequate results for their preferred option,insufficient information or because they were not ready to make anoccupational choice at the critical moment.2 In Finland, for example, lack ofinterest in the field of study is one of the factors contributing to early schoolleaving (Grubb et al., 2005).
In principle, guidance and counselling services should help students tomake educational and career choices. But the quality and adequacy ofcounselling varies enormously, and support for potential dropouts from schoolis often inadequate (Mortimore et al., 2005). Career guidance tends to be morefocused on educational decision making than on occupational choice and thisdisadvantages students in VET. An OECD study on career and guidance foundthat in Belgium (Flanders), Finland, Hungary, Norway and Switzerland, studentsin vocational upper secondary school received less individual career counsellingthan those pursuing academic studies (OECD, 2004c).
Guidance and counselling services need to engage more fully with theworld of work in order to provide students with the opportunity to try out futureprofessions. Practical options include visits and meetings with representativesof local industries, community agencies, work simulation or work placements(OECD, 2004c). In Norway, for example, guidance and counselling are a part ofthe curriculum from the primary education stage onward. At lower secondarylevel, pupils may spend at least one week at a workplace.
Better links to the world of work
Strong links with employers help to ensure that the skills acquiredthrough VET correspond to labour market requirements, most directly
NO MORE FAILURES: TEN STEPS TO EQUITY IN EDUCATION – ISBN 978-92-64-03259-0 – © OECD 2007 73
3. STRUCTURES AND PATHWAYS
through the involvement of employers in the design of occupationalqualifications (OECD, 2000). In Ireland, through the School CompletionProgramme, the government has launched a schools-business partnership tosupport educational inclusion, which has apparently reduced dropout(National Economic and Social Forum, 2002).
Good quality apprenticeship training may reduce early school leaving andassist integration into the labour force (OECD, 2000). In France, the particularlydisadvantaged students who tend to opt for apprenticeships are more likely tofind a job than those with school-based vocational education (Schütz andWössmann, 2006). Apprenticeship is also considered a valuable option fordisadvantaged students in Norway (Leney, 2005).
In German-speaking countries (such as Austria, Germany andSwitzerland) and in Denmark, there is a dual system which combines practicaltraining obtained through workplace apprenticeships with more academiceducation in school. Students are trained in state-recognised occupations. Inthese countries, a higher proportion of the cohort enters VET. For example, inthe German-speaking part of Switzerland, 80% of students are enrolled invocational education (OECD, 2005f). But changes in the labour market drivenby technological innovation have also affected countries with the dual system.Some traditional trades and crafts are threatened, either by relocation of thework outside OECD countries, or simply because the work can now beperformed by a machine.
3.4.Removing dead ends and providing second chances
Young people mature at different rates, both intellectually and emotionally,sometimes in stops and starts. This means that it is extremely important toprovide a second chance for those who want to return to education later in life.For the same reason, it is important to eliminate dead ends in the educationsystem – pathways which lock people out of further learning options. A flexibleadult learning system can be a strong alternative. It should take intoconsideration working and family life, previous (sometimes negative) educationalexperience and recognise that adults may have skills and knowledge gainedoutside formal education processes. In Sweden, where the effect of parentalsocial origin on educational attainment has weakened significantly (Shavit andBlossfeld, 1993; Breen et al., 2005), Erikson and Jonsson (1996) argue that, alongwith low poverty rates and comprehensive schools, well-developed secondchances in the Swedish education system help to yield this outcome.
Adult learning institutions and practices
Adult learning takes place in a diversity of institutions: institutionsdesigned specifically for adults, folk high schools, community colleges, one-stop
NO MORE FAILURES: TEN STEPS TO EQUITY IN EDUCATION – ISBN 978-92-64-03259-0 – © OECD 200774
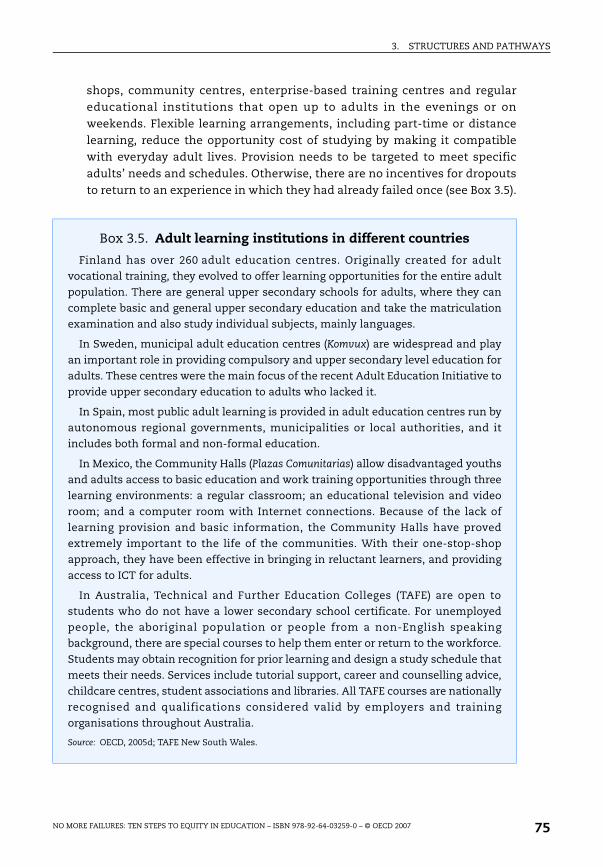
3. STRUCTURES AND PATHWAYS
shops, community centres, enterprise-based training centres and regulareducational institutions that open up to adults in the evenings or onweekends. Flexible learning arrangements, including part-time or distancelearning, reduce the opportunity cost of studying by making it compatiblewith everyday adult lives. Provision needs to be targeted to meet specificadults’ needs and schedules. Otherwise, there are no incentives for dropoutsto return to an experience in which they had already failed once (see Box 3.5).
Box 3.5. Adult learning institutions in different countries
Finland has over 260 adult education centres. Originally created for adult
vocational training, they evolved to offer learning opportunities for the entire adult
population. There are general upper secondary schools for adults, where they can
complete basic and general upper secondary education and take the matriculation
examination and also study individual subjects, mainly languages.
In Sweden, municipal adult education centres (Komvux) are widespread and play
an important role in providing compulsory and upper secondary level education for
adults. These centres were the main focus of the recent Adult Education Initiative to
provide upper secondary education to adults who lacked it.
In Spain, most public adult learning is provided in adult education centres run by
autonomous regional governments, municipalities or local authorities, and it
includes both formal and non-formal education.
In Mexico, the Community Halls (Plazas Comunitarias) allow disadvantaged youths
and adults access to basic education and work training opportunities through three
learning environments: a regular classroom; an educational television and video
room; and a computer room with Internet connections. Because of the lack of
learning provision and basic information, the Community Halls have proved
extremely important to the life of the communities. With their one-stop-shop
approach, they have been effective in bringing in reluctant learners, and providing
access to ICT for adults.
In Australia, Technical and Further Education Colleges (TAFE) are open to
students who do not have a lower secondary school certificate. For unemployed
people, the aboriginal population or people from a non-English speaking
background, there are special courses to help them enter or return to the workforce.
Students may obtain recognition for prior learning and design a study schedule that
meets their needs. Services include tutorial support, career and counselling advice,
childcare centres, student associations and libraries. All TAFE courses are nationally
recognised and qualifications considered valid by employers and training
organisations throughout Australia.
Source: OECD, 2005d; TAFE New South Wales.
NO MORE FAILURES: TEN STEPS TO EQUITY IN EDUCATION – ISBN 978-92-64-03259-0 – © OECD 2007 75

3. STRUCTURES AND PATHWAYS
For basic educational attainment, most OECD countries have institutionsthat cater to adults by providing literacy training, and primary and secondaryeducation. The recognition of prior learning (RPL) can stimulate those whodropped out to obtain recognition for some of their skills and knowledgegained outside formal education (for example in the workplace) and use thatrecognition to support completion of their studies. The workplace can also bea venue for basic education credentials and skill development (OECD, 2005d).Adults make use of these opportunities in countries where they are available.In Sweden for example, at least 28% of all young people admitted into tertiaryeducation had passed through Komvux (municipal adult education) or Liberaladult education (Nicaise et al., 2005).
Potentially, a second chance system can encourage dropout in initialupper secondary education, by reducing the costs and risks to the studentsinvolved. This may represent flexibility in lifelong learning, but it could alsogenerate some inefficiencies. In Sweden, some students drop out ofmainstream schools into second chance institutions (where grades areapparently easier) in order to increase their chances of access to tertiaryeducation.
Box 3.6. Work-based learning initiatives for the employedand the unemployed
Some work-based initiatives are aimed at young unemployed dropouts. A French
programme (Mission générale d’insertion de l’éducation nationale), helps students to
obtain basic skills.
In Finland, students disaffected from conventional upper secondary education
can enrol in workshop programmes that can lead to vocational qualifications.
In Slovenia, young unemployed dropouts may participate in a project entitled
Learning for Young Adults, designed to motivate them to resume their interrupted
schooling and to offer them individual support in acquiring basic skills while they
compensate for prior knowledge gaps.
In the United Kingdom, the Employer Training Pilots (ETPs) encourage employees
to obtain basic and higher skills by offering paid time off to employees and wage
subsidies to employers. ETPs typically provide free information and advice and free
learning for employees who do not have higher skills. For courses on literacy and
numeracy, all employees can participate. Over 80 000 trainees and 11 000 employers
are currently engaged in the programme. Three-quarters of these trainees left
school at or before age 16 and most had no recognised qualifications.
Source: Ministry of National Education, Higher Education and Research, France, 2004; Grubb et al., 2005;Flere, 2004; Department for Work and Pensions, UK, 2004.
NO MORE FAILURES: TEN STEPS TO EQUITY IN EDUCATION – ISBN 978-92-64-03259-0 – © OECD 200776
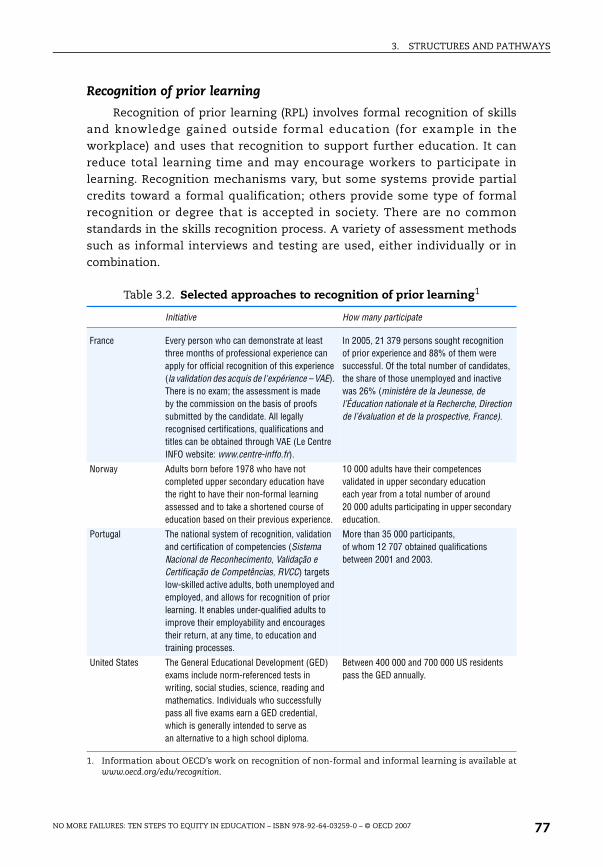
3. STRUCTURES AND PATHWAYS
Recognition of prior learning
Recognition of prior learning (RPL) involves formal recognition of skillsand knowledge gained outside formal education (for example in theworkplace) and uses that recognition to support further education. It canreduce total learning time and may encourage workers to participate inlearning. Recognition mechanisms vary, but some systems provide partialcredits toward a formal qualification; others provide some type of formalrecognition or degree that is accepted in society. There are no commonstandards in the skills recognition process. A variety of assessment methodssuch as informal interviews and testing are used, either individually or incombination.
Table 3.2. Selected approaches to recognition of prior learning1
Initiative How many participate
France Every person who can demonstrate at least three months of professional experience can apply for official recognition of this experience (la validation des acquis de l'expérience – VAE). There is no exam; the assessment is made by the commission on the basis of proofs submitted by the candidate. All legally recognised certifications, qualifications and titles can be obtained through VAE (Le Centre INFO website: www.centre-inffo.fr).
In 2005, 21 379 persons sought recognition of prior experience and 88% of them were successful. Of the total number of candidates, the share of those unemployed and inactive was 26% (ministère de la Jeunesse, de l’Éducation nationale et la Recherche, Direction de l’évaluation et de la prospective, France).
Norway Adults born before 1978 who have not completed upper secondary education havethe right to have their non-formal learning assessed and to take a shortened course of education based on their previous experience.
10 000 adults have their competences validated in upper secondary educationeach year from a total number of around 20 000 adults participating in upper secondary education.
Portugal The national system of recognition, validation and certification of competencies (Sistema Nacional de Reconhecimento, Validação e Certificação de Competências, RVCC) targets low-skilled active adults, both unemployed and employed, and allows for recognition of prior learning. It enables under-qualified adults to improve their employability and encourages their return, at any time, to education and training processes.
More than 35 000 participants, of whom 12 707 obtained qualifications between 2001 and 2003.
United States The General Educational Development (GED) exams include norm-referenced tests in writing, social studies, science, reading and mathematics. Individuals who successfully pass all five exams earn a GED credential, which is generally intended to serve as an alternative to a high school diploma.
Between 400 000 and 700 000 US residents pass the GED annually.
1. Information about OECD’s work on recognition of non-formal and informal learning is available atwww.oecd.org/edu/recognition.
NO MORE FAILURES: TEN STEPS TO EQUITY IN EDUCATION – ISBN 978-92-64-03259-0 – © OECD 2007 77
3. STRUCTURES AND PATHWAYS
3.5. Summary conclusions and recommendations
The design of education systems and the pathways through thosesystems can help or hinder equity. A fair and inclusive system needs tomanage the extent of differentiation, by postponing tracking to at least thelater teenage years and seeking to avoid social separation between differenttypes of schools. It must remove dead ends, offer second chances, and provideguidance throughout the transitions involved.
Step 1: Limit early tracking and streaming and postpone academic selection
Evidence
● Secondary school systems with large social differences between schoolstend on average to have worse results in mathematics and reading and agreater spread of reading outcomes. Social background is more of anobstacle to educational success than in systems where there are not largesocio-economic differences between schools.
● Academic selection by school systems is associated with great socialdifferences between schools and a stronger effect of socio-economic statuson performance, but also with a stronger performance at the top end of thescale in mathematics and science.
● Evidence on secondary students from PISA (OECD’s Programme forInternational Student Assessment) compared to evidence at primary levelfrom PIRLS (Progress in International Reading Literacy Study) and evidencefrom countries which have introduced comprehensive schooling suggestthat early tracking is associated with reduced equity in outcomes andsometimes weakens results overall.
Policy recommendations
● Early tracking and streaming need to be justified in terms of proven benefitsas they very often pose risks to equity.
● School systems using early tracking should consider raising the age of firsttracking to reduce inequities and improve outcomes.
● Academic selection needs to be used with caution since it too poses risks toequity.
Step 2: Manage school choice so as to contain the risks to equity
Evidence
● School choice may pose risks to equity since well-educated parents maymake shrewder choices. Better-off parents have the resources to exploitchoice, and academic selection tends to accelerate the progress of thosewho have already gained the best start in life from their parents.
NO MORE FAILURES: TEN STEPS TO EQUITY IN EDUCATION – ISBN 978-92-64-03259-0 – © OECD 200778
3. STRUCTURES AND PATHWAYS
● Across countries, greater choice in school systems is associated with largerdifferences in the social composition of different schools (see Figure 3.3).
Policy recommendations
● School choice poses risks to equity and requires careful management, inparticular to ensure that it does not result in increased differences in thesocial composition of different schools.
● Given school choice, oversubscribed schools need ways to ensure an evensocial mix in schools – for example selection methods such as lotteryarrangements. Financial premiums to schools attracting disadvantagedpupils may also help.
Step 3: In upper secondary education, provide attractive alternatives, remove dead ends and prevent drop out
Evidence
● Between 5% and 40% of students drop out of school in OECD countries(measured by the proportion of 20-to-24-year-olds not in education andwithout upper secondary education). They go on to have low skills andsuffer high rates of unemployment.
● Among other factors, dropout stems from disenchantment with school, lackof support at home, negative learning experiences and repeating years.
● Early identification of students at risk helps to improve outcomes andprevent dropout.
● Good career guidance and counselling combined with a more flexible anddiverse (and therefore attractive) curriculum help to reduce dropout rates.
Policy recommendations
● Early prevention of dropout is the best cure. Basic schooling should supportand engage those who struggle at school as well as those who excel.
● Monitoring of those at risk (using information on attendance, performanceand involvement in school activities) should be linked to interventions toimprove outcomes and prevent dropout.
● Upper secondary education needs to be attractive not just to an academicallyinclined elite, offering good quality pathways without dead ends andeffective links to the world of work.
● Smooth transitions prevent school failure and dropout. Additional learningsupport at the end of secondary school may help to encourage students tostay in school.
NO MORE FAILURES: TEN STEPS TO EQUITY IN EDUCATION – ISBN 978-92-64-03259-0 – © OECD 2007 79

3. STRUCTURES AND PATHWAYS
● Good quality vocational tracks are essential. Removing an academic hurdlefrom entrance to general upper secondary education and allowing access totertiary education from vocational programmes, as Sweden and Norwayhave done, can increase the status of the vocational track.
Step 4: Offer second chances to gain from education
Evidence
● Those who fail at school often find it difficult to recover later on. In all OECDcountries, those with weak basic qualifications are much less likely tocontinue learning in adult life (see Figure 2.5). Significantly, this figure alsoshows that there are big differences between countries.
● Across OECD countries, many adults and young dropouts without basiceducation obtain school qualifications through second chanceprogrammes. In the United States, almost 60% of dropouts eventually earna high school credential (GED certificate).
Policy recommendations
● Second chances are necessary for those who lack basic education and skills.These include programmes that provide literacy training, primary andsecondary education, work-based programmes and arrangements torecognise informal learning.
NO MORE FAILURES: TEN STEPS TO EQUITY IN EDUCATION – ISBN 978-92-64-03259-0 – © OECD 200780

3. STRUCTURES AND PATHWAYS
ANNEX 3.A
Annex 3.A1. Correlation coefficients between separation index and PISA outcomes
Maths Science Reading
Mean score –0.40 * –0.30 NS –0.48**
Top achievers % –0.17 NS –0.2 NS –0.43*
Low achievers % 0.45* 0.3 NS 0.47**
Standard deviation 0.35 NS –0.07 NS 0.18 NS
Annex 3.A2. Regression analysis: Effects of selection by ability on different measures
Dependent variable ObservationsMultiple
R-squaredEstimated coefficient
t Statistic
3.2.1 Percentage of top achievers (Level 6) on PISA mathematics scale
27 OECD countries + Russia
0.40 Intercept X variable: Selection by ability
2.880.04*
4.372.26
Percentage of top achievers (above 600 points) on PISA science scale
27 OECD countries + Russia
0.38 Intercept X variable: Selection by ability
14.40.11*
7.672.11
Percentage of top achievers (above 625 points) on PISA reading scale
27 OECD countries + Russia
0.10 Intercept X variable: Selection by ability
8.52 –0.02 NS
7.50 –0.54
3.2.2 Impact of SES on academic performance
27 OECD countries
0.47 InterceptX variable: Selection by ability
38.610.13*
20.922.65
3.3.3 Index of separation 28 OECDcountries + Russia
0.48 Intercept X variable: Selection by ability
0.210.001*
11.642.88
3.3.4 Index of separation 28 OECD countries + Russia
0.48 Intercept X variable: Selection by ability X variable: Selection by ability
0.210.001*
0.001 NS
11.642.88
1.12
Note: * significant at 5% level, ** significant at 1% level, NS not significant.Source: OECD (2004b), Learning for Tomorrow’s World: First Results from PISA 2003, Paris.
NO MORE FAILURES: TEN STEPS TO EQUITY IN EDUCATION – ISBN 978-92-64-03259-0 – © OECD 2007 81
3. STRUCTURES AND PATHWAYS
Notes
1. In an Irish report on dropouts, transfer from primary to secondary level wasdescribed as a key concern with regard to early school leaving (National Economicand Social Forum, 2002).
2. See Figure 5.20 on the first age of selection in education systems in OECD (2004b),Learning for Tomorrow’s World: First Results from PISA 2003, OECD, Paris.
References
Ainley, J. and M. Sheret (1992) “Progress through High School: A Study of SeniorSecondary Schooling in New South Wales”, ACER Research Monograph, No. 43. ACER,Hawthorn, Victoria, Australia.
American Institute for Research, SRI International (2006), Early College High SchoolInitiative. 2003-2005 Evaluation Report, prepared for the Bill & Melinda GatesFoundation, American Institute for Research, 2006.
Arum, R. and Y. Shavit (1994), “Another Look at Tracking, Vocational Education andSocial Reproduction”, European University Institute Working Paper, No. 94/1, EuropeanUniversity Institute, Florence.
Bauer, P. and R. Riphahn (2005), “Timing of School Tracking as a Determinant ofIntergenerational Transmission of Education”, Economics Letters 91 (2006), Elsevier,pp. 90-97.
Bjorklund, A., P.A. Edin, P. Fredriksson and A. Krueger (2004), Education, Equality, andEfficiency: An Analysis of Swedish School Reforms during the 1990s, Institute for LabourMarket Policy Evaluation, Uppsala.
Blossfeld H. and Y. Shavit (eds.) (1993), Persistent Inequalities: A Comparative Study ofEducational Attainment in Thirteen Countries, Westview Press, Boulder Colorado.
Bobbitt, L. and L. Horn (2000), “Mapping the Road to College: First-Generation Students’Math Track, Planning Strategies, and Context of Support”, Statistical Analysis Report,March 2000, National Centre for Education Statistics, US Department of Education,Office of Educational Research and Improvement.
Breen, R., R. Luijk, W. Muller and R. Pollak (2005), “Non-Persistent Inequality inEducational Attainment: Evidence from Eight European Countries”, Paperpresented for the meeting of Research Committee 28 (ISA) Inequality and Mobility inFamily, School, and Work, Los Angeles, August 18-21, 2005.
Brunello, G., M. Gianni and K. Ariga (2004), “The Optimal Timing of School Tracking”,Institute for the Study of Labor (IZA) Discussion Paper, No. 995.
Centre for Native Education (n.d.), Antioch University, Seattle, www.antiochsea.edu/about/cne.
Commission of the European Communities (2006), Communication from theCommission to the Council and to the European Parliament, Efficiency and Equity inEuropean Education and Training Systems, SEC(2006)1096.
Council of the European Union (2006), Conclusions of the Council and the Representativesof the Governments of the Member States, Meeting within the Council on Efficiencyand Equity in Education and Training, 15 November 2006.
Coradi Vellacott, M. and S.Wolter (2004), Equity in the Swiss Education System:Dimensions, Causes and Policy Responses, National Report from Switzerland contributing
NO MORE FAILURES: TEN STEPS TO EQUITY IN EDUCATION – ISBN 978-92-64-03259-0 – © OECD 200782

3. STRUCTURES AND PATHWAYS
to the OECD’s Review of Equity in Education, Swiss Coordination Center for Researchin Education.
DeLuca, S., A. Estacion and S. Plank (2005), Dropping Out of High School and the Place ofCareer and Technical Education: A Survival Analysis of Surviving High School, NationalDissemination Center for Career and Technical Education, Columbus, Ohio.
Department for Work and Pensions, UK (2004), OECD Thematic Review of Adult Learningin the United Kingdom – Background Report.
Dronkers, J. and P. Robert (2003), “Effectiveness of Public and Private Schools in aComparative Perspective”, Paper for the Sociology of Education Regular Session:International Perspectives on the Sociology of Education at the Annual Meeting ofthe American Sociological Association in San Francisco, 14-17 August 2004,European University Institute, Department of Political Sciences.
Ekström, E. (2003), “Earning Effects of Adult Secondary Education in Sweden”, Institutefor Labour Market Policy Evaluation (IFAU), Working Paper, 2003:16, Uppsala.
Erikson, R. and J. Jonsson (eds.) (1996), Can Education be Equalized: The Swedish Case inComparative Perspective, Westview Press, Boulder, Colorado.
European Journal of Education Research, Development and Policies, “Attitudes, Choice andParticipation – Dimensions of the Demand for Schooling” (2006), Vol. 41, No. 1.
Eurydice (1994), Measures to Combat Failure at School: A Challenge for the Construction ofEurope, www.eurydice.org.
Eurydice (1997), Measures Taken in the Member States of the European Union to Assist YoungPeople who Have Left the Education Without Qualification, www.eurydice.org.
Eurydice, The Information Network on Education in Europe, www.eurydice.org.
Fitz, J., S. Gorard and C. Taylor (2001), “Explaining School Segregation”, Paper presentedto British Educational Research Association (BERA) Annual Conference, Universityof Leeds, 13-15 September 2001, Cardiff University School of Social Sciences.
Flere, S. (2004), Educational Equity and Inequity in Slovenia: Country Analytical Report.
Gibbons, S. and S. Machin (2001), “Valuing Primary Schools”, Centre for the Economics ofEducation (CEE), Discussion Papers, No. 0015, London School of Economics andPolitical Science.
Grubb N., S. Field, H. Marit Jahr and J. Neumüller (2005), Equity in Education ThematicReview: Finland Country Note, OECD, Paris, www.oecd.org/dataoecd/49/40/36376641.pdf.
Hanushek, E.A. and L. Wössmann (2005), “Does Educational Tracking AffectPerformance and Inequality? Differences-in-Differences Evidence AcrossCountries”, Working Paper No. 1415, Center for Economic Studies and Institute forEconomic Research (CESifo), University of Munich.
Hanushek, E.A., J.F. Kain, J.M. Markman and S.G. Rivkin (2001), “Does Peer Ability AffectStudent Achievement?”, Working Paper 8502, National Bureau of EconomicResearch, Cambridge, MA.
Hoffman, N. (2003), “College Credit in High School: Increasing PostsecondaryCredential Rates of Underrepresented Students”, Change, July/August 2003,www.earlycolleges.org/Downloads/collegecredit.pdf.
Hoffman, N., M.L. Ferreira, S. Field and B. Levin (2005), Equity in Education ThematicReview: Hungary Country Note, OECD, Paris.
NO MORE FAILURES: TEN STEPS TO EQUITY IN EDUCATION – ISBN 978-92-64-03259-0 – © OECD 2007 83

3. STRUCTURES AND PATHWAYS
Hoxby, C.M., (2002), “The Power of Peers”, Education Next, No. 2, Summer 2002, HooverInstitution.
Istance, D. and A. Sliwka, (2006), “Choice, Diversity and ‘Exit’ in Schooling – A MixedPicture”, European Journal of Education, Vol. 41, No. 1, pp. 45-58.
Jenkins, S., J. Miclewright and S. Schnepf (2006), “Social Segregation in SecondarySchools: How Does England Compare with Other Countries?”, Institute for Social andEconomic Research Working Paper 2006-02.
Kim, T. and K. Pelleriaux (2004), Equity in the Flemish Educational System: CountryAnalytical Report, University of Antwerp.
Leney, T. (2005), Achieving the Lisbon Goal: The Contribution of VET, EuropeanCommission.
Meghir, C. and M. Palme (2005), “Educational Reform, Ability and Family Background”,American Economic Review, Vol. 95, No. 1, pp. 414-424(11).
Ministry of Education, Russian Federation (2005), Equity in Education: Country AnalyticalReport – Russia.
Ministry of National Education, Higher Education and Research, France (2004), L'équitédans l'éducation en France: Rapport de base national présenté dans le cadre de l'activité del'OCDE, Paris.
Mortimore, P., S. Field and B. Pont (2005), Equity in Education Thematic Review: NorwayCountry Note, OECD, Paris, www.oecd.org/dataoecd/10/6/35892523.pdf.
National Economic and Social Forum (2002), “Early School Leavers, Forum Report No. 24”,The National Economic and Social Forum, Dublin.
Nicaise, I., G. Esping-Andersen, B. Pont and P. Tunstall (2005), Equity in Education ThematicReview: Sweden Country Note, OECD, Paris, www.oecd.org/dataoecd/10/5/35892546.pdf.
Oakes, J., M. Selvin, L.A. Karoly and G. Guiton (1992), Educational Matchmaking: Academicand Vocational Tracking in Comprehensive High Schools, Rand Report, Rand Corporation.
OECD (1994), School: A Matter of Choice, OECD, Paris.
OECD (2000), From Initial Education to Working Life: Making Transition Work, OECD, Paris.
OECD (2004b), Learning for Tomorrow’s World: First Results from PISA 2003, OECD, Paris.
OECD (2004c), Career Guidance and Public Policy: Bridging the Gap, OECD, Paris.
OECD (2004d), Completing the Foundation for Lifelong Learning: An OECD Survey of UpperSecondary Schools, OECD, Paris.
OECD (2005c), Education at a Glance: OECD Indicators 2005, OECD, Paris.
OECD (2005d), Promoting Adult Learning, OECD, Paris.
OECD (2005e), From Education to Work: A Difficult Transition for Young Adults with LowLevels of Education, OECD, Paris.
OECD (2005f), Country Report on National System Policies and Practices Concerning Childrenand Youth at Risk, Promoting Partnership for Inclusion – Switzerland, OECD, CERI, Paris.
OECD (2005g), School Factors Related to Quality and Equity: Results from PISA 2000, OECD, Paris.
OECD (2006b), Publicly Provided Goods and the Distribution of Resources, OECD, Directoratefor Employment, Labour and Social Affairs, OECD, Paris.
NO MORE FAILURES: TEN STEPS TO EQUITY IN EDUCATION – ISBN 978-92-64-03259-0 – © OECD 200784

3. STRUCTURES AND PATHWAYS
OECD (2006f), Public Spending Efficiency: Questionnaire on the Pre-Primary, Primary andLower Secondary Education Sector, OECD/ECO, unpublished.
Pekkarinen, T., S. Pekkala and R. Uusitalo (2006), “Education Policy and IntergenerationalIncome Mobility: Evidence from the Finnish Comprehensive School Reform”, IZADiscussion Paper, No. 2204
Schütz, G. and L. Wössmann (2006), Efficiency and Equity in European Education andTraining Systems prepared by the European Expert Network in Economics in Education toaccompany the Communication and Staff Working Paper by the European Commissionunder the same title, http://ec.europa.eu/education/policies/2010/doc/eenee.pdf.
Swedish National Agency for Education (n.d.), Official statistics of Sweden, Stockholm,www.skolverket.se/sb/d/356.
Swiss Contribution to Eurybase – the Information Database on Education Systems in Europe(2001), Information Documentation Education Suisse, Berne, www.edk.ch/PDF_Downloads/Bildungswesen_CH/Eurydice_00e.pdf.
TAFE (Technical and Further Education) New South Wales, www.tafensw.edu.au.
Teese, R., P. Aasen, S. Field and B. Pont (2005), Equity in Education Thematic Review: SpainCountry Note, OECD, Paris, www.oecd.org/dataoecd/41/39/36361409.pdf.
The Early College High School Initiative, www.earlycolleges.org.
Wolk, R. (2005), “It's Kind of Different”: Student Experience in Two Early College High Schools,www.earlycolleges.org/Downloads/KindOfDifferent.pdf#search=%22wolk%20%22it's%20kind%20 of%20different%22%22.
NO MORE FAILURES: TEN STEPS TO EQUITY IN EDUCATION – ISBN 978-92-64-03259-0 – © OECD 2007 85


ISBN 978-92-64-03259-0
No More Failures: Ten Steps to Equity in Education
© OECD 2007
Chapter 4
School and Out-of-school Practices
This chapter looks at classroom practices that affect equity alongwith out-of-school practices, particularly relationships betweenschools, parents and communities. Among different approaches,we highlight the need to reduce grade repetition in some countries,to develop approaches designed for the individual learner(including mixed ability teaching), and effective interventionstrategies to support underperforming students or classrooms.Schools also need to reach out to homes of disadvantaged children,using strategies such as homework clubs and improvedcommunication with parents to improve the out-of-school learningenvironment.
87

4. SCHOOL AND OUT-OF-SCHOOL PRACTICES
All children can point to what matters to them most about their school andtheir school work. They will tell you about their school, their class, theircourses, their teachers, whether the teacher explains things well, whetherthey get help when they don’t understand things. They will tell you how muchhomework they get, whether they get help from their parents, how theirparents react when they do well or badly at school – whether they talk to theteacher for example. This chapter looks at this core business of learning bothin the classroom and at home. It examines the challenges and explores howpolicy and practice in this area can be made fairer and more inclusive.
4.1. Equity in the classroom: interventions for those in need
When learning difficulties emerge in the classroom, the response can beof two quite distinct types. First, the children affected can be moved to adifferent learning environment, preserving the relative homogeneity ofperformance within the original classroom. Measures of this type includespecial education and tracking and streaming, discussed in Chapter 3.Another way of preserving an even level of attainment within each classroomis to require those who have fallen behind to repeat a year. Although this is, ina sense, another means of differentiation, similar to those discussed in theprevious chapter, it is also a means of handling individual learning difficultiesat classroom level and for that reason is discussed here. Other options implydifferent teaching and intervention approaches to tackle varying levels ofattainment within the classroom. To underpin all these approaches, acommitment to equity needs to be built into the culture of the system, so thatstakeholders think of every policy or practice in terms of what it can achievefor those who need most help, as well as for the stronger performers.
Repeating years
The requirement to repeat a year typically follows a formal or informalassessment of the student by the teacher towards the end of the school year,which suggests that the student has not adequately understood the materialtaught or reached the expected level of competence (although sometimesrepetition reflects failure in only some subjects). Subsequently, either theschool or the school, parents and student together agree that the studentshould repeat the year of study, with a view to the student catching up duringthe repeated year. Table 4.1 sets out the mechanisms involved in selectedcountries.
NO MORE FAILURES: TEN STEPS TO EQUITY IN EDUCATION – ISBN 978-92-64-03259-0 – © OECD 200788
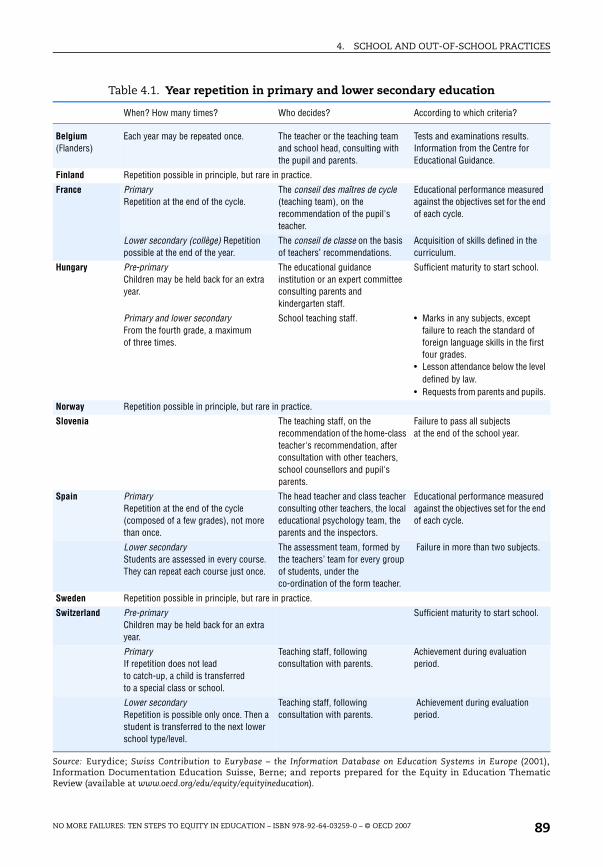
4. SCHOOL AND OUT-OF-SCHOOL PRACTICES
red end
he
ol.
f
first
level
pils.
red end
ts.
ol.
001),atic
Table 4.1. Year repetition in primary and lower secondary education
When? How many times? Who decides? According to which criteria?
Belgium (Flanders)
Each year may be repeated once. The teacher or the teaching team and school head, consulting with the pupil and parents.
Tests and examinations results.Information from the Centre forEducational Guidance.
Finland Repetition possible in principle, but rare in practice.
France Primary Repetition at the end of the cycle.
The conseil des maîtres de cycle (teaching team), on the recommendation of the pupil's teacher.
Educational performance measuagainst the objectives set for theof each cycle.
Lower secondary (collège) Repetition possible at the end of the year.
The conseil de classe on the basis of teachers’ recommendations.
Acquisition of skills defined in tcurriculum.
Hungary Pre-primary Children may be held back for an extra year.
The educational guidance institution or an expert committee consulting parents and kindergarten staff.
Sufficient maturity to start scho
Primary and lower secondary From the fourth grade, a maximum of three times.
School teaching staff. • Marks in any subjects, exceptfailure to reach the standard oforeign language skills in the four grades.
• Lesson attendance below the defined by law.
• Requests from parents and pu
Norway Repetition possible in principle, but rare in practice.
Slovenia The teaching staff, on the recommendation of the home-class teacher's recommendation, after consultation with other teachers, school counsellors and pupil's parents.
Failure to pass all subjectsat the end of the school year.
Spain Primary Repetition at the end of the cycle (composed of a few grades), not more than once.
The head teacher and class teacher consulting other teachers, the local educational psychology team, the parents and the inspectors.
Educational performance measuagainst the objectives set for theof each cycle.
Lower secondary Students are assessed in every course. They can repeat each course just once.
The assessment team, formed by the teachers’ team for every group of students, under the co-ordination of the form teacher.
Failure in more than two subjec
Sweden Repetition possible in principle, but rare in practice.
Switzerland Pre-primary Children may be held back for an extra year.
Sufficient maturity to start scho
PrimaryIf repetition does not lead to catch-up, a child is transferred to a special class or school.
Teaching staff, following consultation with parents.
Achievement during evaluation period.
Lower secondary Repetition is possible only once. Then a student is transferred to the next lower school type/level.
Teaching staff, following consultation with parents.
Achievement during evaluationperiod.
Source: Eurydice; Swiss Contribution to Eurybase – the Information Database on Education Systems in Europe (2Information Documentation Education Suisse, Berne; and reports prepared for the Equity in Education ThemReview (available at www.oecd.org/edu/equity/equityineducation).
NO MORE FAILURES: TEN STEPS TO EQUITY IN EDUCATION – ISBN 978-92-64-03259-0 – © OECD 2007 89

4. SCHOOL AND OUT-OF-SCHOOL PRACTICES
In some countries, such as France, Luxembourg, Mexico and Spain, morethan 20% of students have to repeat a grade in either primary or secondaryeducation (see Figure 4.1). In these countries, year repetition is one of the maintools used to respond to individual weak performance. In other countries,such as Japan, Korea and the Nordic countries, repetition is very uncommonand may reflect illness or absence during one year.
Effectiveness and selection
Does repeating years help students to catch up? Unsurprisingly, thosewho repeat years tend to do badly at school. For example, they have muchworse PISA results at age 15. In France, Paul and Troncin (2004) report that halfof the pupils who repeat their first year at primary school go on to leave schoolwith either no qualification or just a lower secondary qualification. Studies inQuébec, Canada and the United States showed that those repeating years aremuch more likely to drop out of school later on. But these poor outcomes mayreflect the fact that failing students are selected for repetition. How wouldthey have performed had they been treated differently? In the absence of any
Figure 4.1. How many students repeat years in primary and lower secondary school?1
Percentage of 15-year-olds who say they have repeated once or more (2003)
1. Data for Norway are missing. Year repetition is very rare in Norway.
Source: OECD, PISA 2003 Database.
:
��
�
�
��
��
��
��
3��)��
%��� ��
���#$� � ��
'�����
-��" �)
������
���� ��
��� ��
*���� �#����� ����
&�����#0�����"
���( )#*���+��
,��#*���+�� �
��
�����0���
������� ���
������ �
!�����"�� ��
.�/�"+����
����,��� ��
��� ��
���" ��
'���� ��
&�����#�� ����� ��
� �
1�/��
:#�6#��������#���#���� ���#���#��#"���#��#�����#����� ��#�����:#�6#��������#���#���� ���#���#��#"���#��#���" ��#�����
NO MORE FAILURES: TEN STEPS TO EQUITY IN EDUCATION – ISBN 978-92-64-03259-0 – © OECD 200790
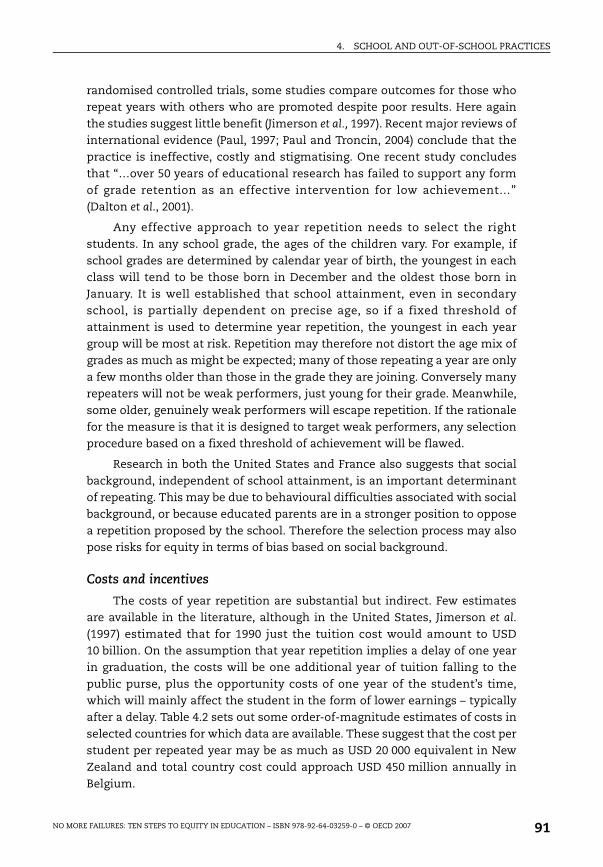
4. SCHOOL AND OUT-OF-SCHOOL PRACTICES
randomised controlled trials, some studies compare outcomes for those whorepeat years with others who are promoted despite poor results. Here againthe studies suggest little benefit (Jimerson et al., 1997). Recent major reviews ofinternational evidence (Paul, 1997; Paul and Troncin, 2004) conclude that thepractice is ineffective, costly and stigmatising. One recent study concludesthat “…over 50 years of educational research has failed to support any formof grade retention as an effective intervention for low achievement…”(Dalton et al., 2001).
Any effective approach to year repetition needs to select the rightstudents. In any school grade, the ages of the children vary. For example, ifschool grades are determined by calendar year of birth, the youngest in eachclass will tend to be those born in December and the oldest those born inJanuary. It is well established that school attainment, even in secondaryschool, is partially dependent on precise age, so if a fixed threshold ofattainment is used to determine year repetition, the youngest in each yeargroup will be most at risk. Repetition may therefore not distort the age mix ofgrades as much as might be expected; many of those repeating a year are onlya few months older than those in the grade they are joining. Conversely manyrepeaters will not be weak performers, just young for their grade. Meanwhile,some older, genuinely weak performers will escape repetition. If the rationalefor the measure is that it is designed to target weak performers, any selectionprocedure based on a fixed threshold of achievement will be flawed.
Research in both the United States and France also suggests that socialbackground, independent of school attainment, is an important determinantof repeating. This may be due to behavioural difficulties associated with socialbackground, or because educated parents are in a stronger position to opposea repetition proposed by the school. Therefore the selection process may alsopose risks for equity in terms of bias based on social background.
Costs and incentives
The costs of year repetition are substantial but indirect. Few estimatesare available in the literature, although in the United States, Jimerson et al.
(1997) estimated that for 1990 just the tuition cost would amount to USD10 billion. On the assumption that year repetition implies a delay of one yearin graduation, the costs will be one additional year of tuition falling to thepublic purse, plus the opportunity costs of one year of the student’s time,which will mainly affect the student in the form of lower earnings – typicallyafter a delay. Table 4.2 sets out some order-of-magnitude estimates of costs inselected countries for which data are available. These suggest that the cost perstudent per repeated year may be as much as USD 20 000 equivalent in NewZealand and total country cost could approach USD 450 million annually inBelgium.
NO MORE FAILURES: TEN STEPS TO EQUITY IN EDUCATION – ISBN 978-92-64-03259-0 – © OECD 2007 91

4. SCHOOL AND OUT-OF-SCHOOL PRACTICES
Schools have very few incentives to take these large costs into account.Typically, extending students’ time in education imposes additional tuitioncosts on the system as a whole by increasing the enrolled student population.But individual schools commonly receive their funding per student enrolled,so they will not have to absorb those increased costs or bear the opportunitycosts of lost output. This is particularly important because alternativeinterventions to tackle learning difficulties, such as intensive help in smallgroups, very often have direct costs for schools.
Reducing repetition
In summary, year repetition tends to be relatively ineffective and costly,and schools have few incentives to take account of the costs. Repetition issometimes defended on the grounds that it is necessary to maintainstandards. Standards are important, but the standards that truly matter areconcrete outcomes for students – not theoretical expectations for the level ofstudents in particular classrooms. Some of the countries making little or nouse of repetition have exceptionally high standards. Of course there may beindividual cases where repeating a year may be helpful, but such cases arelikely to be the exceptions. Countries are starting to change their practice.Luxembourg has recently introduced a reform to reduce the use of year
Table 4.2. Estimated costs of year repetition in selected countries1
Total country costCost per student repeating one year
Thousands USD at purchasing power parity
Primary and lower secondary school
Millions USD at purchasing power parity
Primary school Lower secondary school
Belgium 440 16 18
Denmark 30 14 14
Finland 10 8 11
Hungary 80 9 9
New Zealand 50 20 19
Sweden 40 10 10
United States 5 270 13 14
1. The cost of repetition is estimated as the sum of two components: the additional cost of tuition andthe value of lost output. It is estimated separately for primary and lower secondary education. Thisassumes that repeating a year implies one more year in school than would otherwise have been thecase. The year of reference is 2003. Tuition cost: Annual cost per student expressed in USD atpurchasing power parity (PPP). Lost output: Estimated as the gross earnings of 15-to-24-year-olds,taking account of unemployment rates, expressed in USD at purchasing power parity. Total countrycosts are estimated by multiplying estimated costs per repeated year by the total number ofrepeaters.
Source: OECD (2005c), Education at a Glance: OECD Indicators 2005, OECD, Paris; OECD Education Database(2004).
NO MORE FAILURES: TEN STEPS TO EQUITY IN EDUCATION – ISBN 978-92-64-03259-0 – © OECD 200792
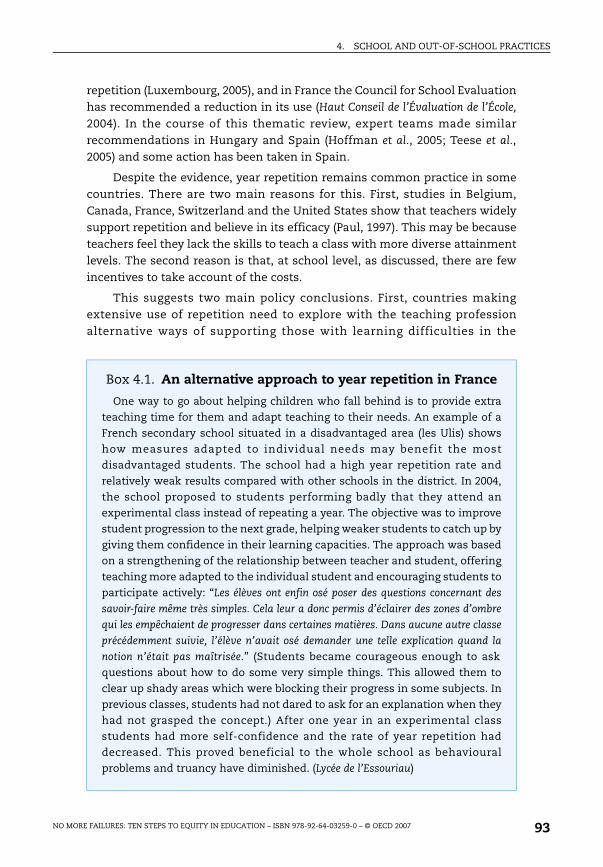
4. SCHOOL AND OUT-OF-SCHOOL PRACTICES
repetition (Luxembourg, 2005), and in France the Council for School Evaluationhas recommended a reduction in its use (Haut Conseil de l’Évaluation de l’École,
2004). In the course of this thematic review, expert teams made similarrecommendations in Hungary and Spain (Hoffman et al., 2005; Teese et al.,2005) and some action has been taken in Spain.
Despite the evidence, year repetition remains common practice in somecountries. There are two main reasons for this. First, studies in Belgium,Canada, France, Switzerland and the United States show that teachers widelysupport repetition and believe in its efficacy (Paul, 1997). This may be becauseteachers feel they lack the skills to teach a class with more diverse attainmentlevels. The second reason is that, at school level, as discussed, there are fewincentives to take account of the costs.
This suggests two main policy conclusions. First, countries makingextensive use of repetition need to explore with the teaching professionalternative ways of supporting those with learning difficulties in the
Box 4.1. An alternative approach to year repetition in France
One way to go about helping children who fall behind is to provide extra
teaching time for them and adapt teaching to their needs. An example of a
French secondary school situated in a disadvantaged area (les Ulis) shows
how measures adapted to individual needs may benefit the most
disadvantaged students. The school had a high year repetition rate and
relatively weak results compared with other schools in the district. In 2004,
the school proposed to students performing badly that they attend an
experimental class instead of repeating a year. The objective was to improve
student progression to the next grade, helping weaker students to catch up by
giving them confidence in their learning capacities. The approach was based
on a strengthening of the relationship between teacher and student, offering
teaching more adapted to the individual student and encouraging students to
participate actively: “Les élèves ont enfin osé poser des questions concernant des
savoir-faire même très simples. Cela leur a donc permis d’éclairer des zones d’ombre
qui les empêchaient de progresser dans certaines matières. Dans aucune autre classe
précédemment suivie, l’élève n’avait osé demander une telle explication quand la
notion n’était pas maîtrisée.” (Students became courageous enough to ask
questions about how to do some very simple things. This allowed them to
clear up shady areas which were blocking their progress in some subjects. In
previous classes, students had not dared to ask for an explanation when they
had not grasped the concept.) After one year in an experimental class
students had more self-confidence and the rate of year repetition had
decreased. This proved beneficial to the whole school as behavioural
problems and truancy have diminished. (Lycée de l’Essouriau)
NO MORE FAILURES: TEN STEPS TO EQUITY IN EDUCATION – ISBN 978-92-64-03259-0 – © OECD 2007 93

4. SCHOOL AND OUT-OF-SCHOOL PRACTICES
classroom. Alongside evidence that year repetition is ineffective, teachersneed to be offered concrete alternatives. As discussed below, internationalexperience suggests that such alternatives exist and that they can be veryeffective. Box 4.1 describes one successful initiative in France.
Second, school finance arrangements could usefully be adjusted, so thatthe real costs are more fully taken into account. One option would be to allowschools to retain any savings made from reductions in year repetition so thatthose savings could be used for other purposes. For example, schools could befunded according to the annual flow of students through from year of entry toyear of graduation rather than based on enrolled school population.Reductions in year repetition would then yield lower class sizes or free upresources for other uses.
Measures within the classroom
Schools deal in many different ways with varying levels within aclassroom or with students who are, or might be, falling behind. Overall, thereneeds to be a commitment to success for all students, reflected in highexpectations and the organisation of programmes and approaches that allowfor these expectations to be realised. It implies adapting teaching approachesto variations in attainment and providing additional support to those whomight be underperforming. The classroom is the first place where learningdifficulties can be detected and efficiently tackled. Flexible instruction,adapted to different levels of attainment is more challenging for teachers andit therefore needs to be underpinned by strong teacher preparation.
Most education systems have different methods of providing special helpto those with learning difficulties, although they are not always well-evaluated. Here we will highlight a number of approaches for which there issome solid evidence of success. We will then give other examples whereoutcomes are less certain.
Within the classroom, there is good evidence that a family of techniquesknown as formative assessment leads to successful outcomes, particularlywith underachieving students. Formative assessment is integrated into theteaching and learning process, so that information on student progress is usedto identify gaps in understanding, and to shape teaching. It is therefore“formative” rather than “summative” assessment. Formative assessment alsoinvolves a change in the relationship between teacher and learner, ensuringthat learners feel safe to reveal what they don't understand. In a review ofresearch, Black and William (1998) conclude that the gains in achievementassociated with formative assessment were “…among the largest everreported for educational interventions”. Several studies cited in the reviewalso show that formative methods may be especially effective in helping
NO MORE FAILURES: TEN STEPS TO EQUITY IN EDUCATION – ISBN 978-92-64-03259-0 – © OECD 200794

4. SCHOOL AND OUT-OF-SCHOOL PRACTICES
underachieving students to succeed. In an OECD review of formativeassessment in secondary classrooms (OECD, 2005h), describes several casestudy schools where large percentages of disadvantaged students had movedfrom failing to exemplary status over recent years. Programmes targeted atthe needs of underachieving students also yielded positive results.
Teachers using formative assessment concentrate their attention onprogress toward learning goals, rather than on the student’s absolute level ofattainment. Several studies show the value of this approach, noting that lowachievers tend to attribute failure to low ability rather than lack of effort, andchildren develop ideas about their abilities and possibilities early in life (Blackand William, 1998). Teachers using formative assessment can help studentsdevelop a collection of skills and strategies for learning that they can masterover time, building their skills for learning to learn. For example, in one schoolin Newfoundland, Canada, ninth grade students read each other’s researchpieces in turn, using a scoring method to assess and improve the quality ofwritten texts with regards to expression, structure, grammar and spelling.Students like the structured approach. One commented, “You can see whatyou did wrong and how you can fix it. It also makes it a lot easier to set aimsfor yourself.” (OECD, 2005h)
The key elements in formative assessment are:
● a classroom culture that encourages interaction and the use of assessmenttools;
● establishment of learning goals, and tracking of individual student progresstoward those goals;
● use of varied instruction methods to meet diverse student needs;
● use of varied approaches to the assessment of student understanding;
● feedback on student performance and adaptation of instruction to meetidentified needs;
● active involvement of students in the learning process.
Teachers’ personalities and characteristics, or their varying expectations ofdifferent students, may also influence student performance. To avoid suchbiases, teachers at one school in Bari, Italy, discuss the interpretation of studentresults in teams. These teachers noted that the quality of their assessments hasimproved and they are able to bring potential biases to light (OECD, 2005h).
Reading Recovery programmes have also been effective. ReadingRecovery is a short-term, intensive intervention of one-on-one lessons forlow-achieving first graders. The intervention is used as a supplement to goodclassroom teaching. Individual students receive a half-hour lesson eachschool day for 12 to 20 weeks with a specially trained Reading Recoveryteacher. As soon as students reach grade-level literacy expectations and
NO MORE FAILURES: TEN STEPS TO EQUITY IN EDUCATION – ISBN 978-92-64-03259-0 – © OECD 2007 95

4. SCHOOL AND OUT-OF-SCHOOL PRACTICES
demonstrate that they can continue to learn through their own efforts, theirlessons are discontinued, and new students begin individual instruction. Theobjective of Reading Recovery lessons is to promote accelerated learning so thatstudents catch up to their peers, close the achievement gap as quickly as possible,and continue to learn independently. During each lesson a child reads familiarstories, reads a story that was read for the first time the day before, works withletters and/or words using magnetic letters, writes a story, assembles a cut-upstory and reads a new book. The teacher teaches and demonstrates problem-solving strategies and provides just enough support to help the child developeffective strategies (Reading Recovery Council of North America).
The efficacy of Reading Recovery strategies for lower achievers is well-supported by research. Burroughs-Lange (n.d.) points to the substantial gains inliteracy of children participating in the programme. This study included42 primary schools from disadvantaged areas in London. The report looks at theresults of low-achieving children, controlling for their participation in ReadingRecovery initiatives. These children, who had entry levels similar to comparisonchildren in school without Reading Recovery, had by the end of the year, onaverage, gained 20 months on reading age. The control group, on the contrary,had made very little progress. The intervention is quite expensive (it requiresindividual tuition for children and training for teachers), but as Brooks (2002)argues, when averaged out over a five-year period the cost of reading recoverysupport was only 10% higher than the cost of assistance usually provided byschools.
Other approaches of intervening for those who fall behind that have beenproved particularly successful are based on effective monitoring andinterventions at different levels. In Finland, a multidisciplinary approach isbased on intensification, by providing more time by instructors andalternative approaches to teaching and learning (See Box 4.2). Rather thanproviding a sequence of stages in which students can fail, fall behind or dropout, as so often happens in education systems, it provides a sequence ofintensifying interventions which draw those who fall behind back into themainstream. The outcomes – in terms of the small numbers of Finnish15-year-olds who lack basic skills in reading and maths – are quite remarkable.
Other examples of interventions include:
● In schools examined in a recent OECD study visit to England, there was acareful and collective assessment and evaluation of individual studentperformance every six weeks; data were used to identify and developstrategies for learning with individual students and classrooms; andintervention teams were able to react quickly to help and support studentsor teachers who might be underperforming. Two disadvantaged schoolsimproved their results to become “high value-adding schools” by using a
NO MORE FAILURES: TEN STEPS TO EQUITY IN EDUCATION – ISBN 978-92-64-03259-0 – © OECD 200796

4. SCHOOL AND OUT-OF-SCHOOL PRACTICES
Box 4.2. Tackling learning difficulties in Finland
The first line of attack is the teacher, who is responsible for identifying students
falling behind. The teacher works with such students one-on-one, or sometimes in
groups of two to four, to correct the problem.
The second line of attack is the teacher’s assistant, a person with some limited
training who works under the direction of teachers. Sometimes the assistant sits
beside a student, providing answers to questions and motivation for those whose
attention flags. Sometimes the teacher’s assistant works one-on-one or in small
groups, always under the teacher’s direction, on the material of the regular class
and specific topics on which students need help.
The third line of attack is the qualified special needs teacher. Again, in
consultation with the teacher, the special needs teacher works one-on-one or in
small groups, with students who have not been adequately helped by the first two
lines of attack. The special needs teachers usually concentrate on language (Finnish
or Swedish) and on mathematics. Special education includes about 1.8% of students
with severe disabilities who attend special schools, and another 4.4% with less
serious disabilities who are mainstreamed. Both these groups are specifically
diagnosed. A third group, around 20% of the cohort, are special needs students who
have not been specifically diagnosed but simply need additional help to keep up.
A fourth approach is the multi-disciplinary team, for students whose weak progress
is associated with wider home or social problems. The team consists of the teacher,
the special needs teacher, the school’s counsellor, and several individuals from
outside the school – a psychologist, a social worker from the department of social
services, representatives of the health and mental health systems as necessary, and
individuals from the public housing system if that seems to be part of the problem.
Overall, these approaches to minimizing the number of students falling behind
display two features: intensification (providing more time by more instructors) and
alternative approaches (rather than “more of the same”), particularly through the
efforts of special needs teachers and multi-disciplinary teams. But they do so in
consistent ways, working with the classroom teacher on the specific subjects
students are having trouble with, rather than relying on a grab bag of after-school
programmes and tutoring efforts randomly distributed by grade levels and subjects.
The outcomes of this set of procedures (alongside other positive features of the
Finnish education system) are remarkable. Only 1.1% of Finnish students were
assessed as performing below Level 1 in reading in PISA 2003, compared with an
OECD average of 6.7%. In other words, fully five-sixths of those who, by the
standards of the OECD average, might have been expected to be very poor readers
have achieved higher reading standards. The results for science and mathematics
are nearly as good.
Source: Grubb et al., 2005, abridged quotation.
NO MORE FAILURES: TEN STEPS TO EQUITY IN EDUCATION – ISBN 978-92-64-03259-0 – © OECD 2007 97

4. SCHOOL AND OUT-OF-SCHOOL PRACTICES
model of distributed leadership focusing on individual studentperformance (OECD, forthcoming).
● In Flanders, Belgium, extra teaching is provided to children who experiencelearning difficulties or who are otherwise disadvantaged. To qualify forextra teaching, a secondary school must have 10% target group students inthe first grade of secondary education (age 12 to 14) and 25% in the secondand third grades (age 14 to 18) who are living in economically and culturallyunfavourable circumstances. To obtain the extra teaching support, schoolshave to give attention to five areas: prevention and remediation ofdevelopmental and learning disadvantages, Dutch language proficiency,intercultural education, socio-economic development and parentalinvolvement. Interventions can involve follow up with individual students,differentiation in the learning process and language skills training forforeign children (Kim and Pelleriaux, 2004).
● In French primary schools, when pupils have particular learning difficultiesthey can obtain help through programmes personalisés d’aide et de progrès (PPAP).Such programmes are designed in partnership with the parents to suit thepupil, following a diagnosis of particular difficulties. The programme isimplemented by the ordinary class teacher who in most situations will notrequire additional help. Where additional specialist help is required, it isdelivered through the réseaux d’aides spécialisées pour les élèves en difficulté(RASED) (Ministry of National Education, Higher Education and Research,France, 2004).
There are also interventions designed for those with diagnosed specialneeds. Special needs can be defined narrowly or quite broadly, as the examplefrom Finland demonstrates. While this report will not tackle special education(examined in OECD 2004a), it has been very important in demonstrating thecapacity of school systems to effectively integrate pupils with very diverselearning needs (see also Chapter 6). One report from Austria concludes:
“One of the main reasons for the broad acceptance of integration is thatthe educational concepts and forms of instruction in these classes areseen by the large majority of parents also as a chance for the pupilswithout disabilities. Practical experience revealed that initial fears thatpupils with special needs would disturb work in class and hamper theprogress of the other pupils had been unfounded. Studies proved thatsuccessful integration classes are good practice examples characterisedby features which benefit both the children with and without specialneeds. In such classes the individual needs of all pupils get moreattention and social learning is stressed more than in conventionalclasses. The evaluation of integration trials showed that the pupilswithout special needs assess their relations with the teachers and their
NO MORE FAILURES: TEN STEPS TO EQUITY IN EDUCATION – ISBN 978-92-64-03259-0 – © OECD 200798
4. SCHOOL AND OUT-OF-SCHOOL PRACTICES
personal well-being more positively and that they see better chances ofparticipation in this form of education.” (Pechar et al., 2005)
The teaching profession plays the main role in delivering these classroompractices. Teachers need the skills to handle classrooms which areincreasingly diverse in terms of attainment, social and ethnic background.This increasing diversity in the classroom flows from school reform –comprehensive schooling and reductions in tracking and streaming – andsocial change, including rising rates of international migration. Developingthe skills involved requires professional development. Chapter 5, under theheading of resources, discusses how the key resource of teachers can be usedto help those with the greatest needs, and Chapter 6 examines this issue inrelation to teaching migrants and minorities.
4.2. Schools reaching out to homes
While the effect of social background on education outcomes is well-established, the mechanisms are less well understood. PISA and otherresearch show that few mediating factors stand out, but one of them is havingbooks at home (see Figure 4.2). Most probably, it is not the availability of books
Box 4.3. The teaching profession in Finland
Good teaching is central to the success of Finnish schools. There are
extensive high status programmes for teachers preparing them to work with
children with diverse learning needs in integrated classes.
“Teaching practice is interspersed with classroom practice, in a series of
internships – placements with different pedagogical problems – typically one
period in each of the four years of preparation, in either a local school or a
university-sponsored teacher-training school. One principle of teacher
preparation is that experience in the classroom, guided by a mentor-teacher,
provides new teachers with the ability to cope with a variety of classroom
issues, from students performing at different levels to the special needs of
immigrant children to more difficult cases of foetal alcohol syndrome or
attention deficit hyperactivity disorder requiring evaluation by special
education. Another is that teachers are prepared to become independent
professionals, with judgment and expertise in both subject matter and
pedagogical alternatives, rather than automatons delivering a teacher-
proofed curriculum. As the Ministry of Education explained the purpose of
pedagogical studies, ‘their aim is to produce teaching professionals who are
able to develop their own work and their working community.’”
Source: Grubb et al., 2005.
NO MORE FAILURES: TEN STEPS TO EQUITY IN EDUCATION – ISBN 978-92-64-03259-0 – © OECD 2007 99

4. SCHOOL AND OUT-OF-SCHOOL PRACTICES
per se which is important but books as an indicator of the social and culturalvalue in family life.
In support of this viewpoint, there is good evidence that parents’communication with their children and the encouragement they give theirlearning contribute to learning outcomes. Some disadvantaged children maynot get this home support because of other pressures on parents, poorenvironment for home study, or because some parents may not understand
Figure 4.2. How home circumstances affect school performancePercentage of variance in student performance explained by different factors (2003)
1. Response rate too low to ensure comparability.
Source: OECD (2004b), Learning for Tomorrow's World: First Results from PISA 2003, OECD, Paris.
� � �� �� �� �� ��
1���#�� �#���#�6#���# +�(�#6 ����3��#� ��� ��#���)��# �#��"�""��� ��#+ )�������������� ����#6 "����������������#��� ���#��#@� ��� �B#������
%��� ��!�����"������ ����" ��3��)���� ��
-��" �).�/�"+����
1�/��&�����#�� ���������� ���
���( )#*���+������,��� ��
,��#*���+��������'����� �������� ������ �
���#$� � ����� ���� ��
'���� �� 0��� ���� ��2 � �� ��
� � *���� �#����� ����
�� ��&�����#0�����"�
3��#�������#��(��#�6#��� ����#+������#+���#� �����
3��#�������#������ ���� �#���������"�#����/#�6#��� ���� �#�� ���#;%�9<#+������+���#� �����
������ ��#�6#( �� ��#�/�� ����
NO MORE FAILURES: TEN STEPS TO EQUITY IN EDUCATION – ISBN 978-92-64-03259-0 – © OECD 2007100
4. SCHOOL AND OUT-OF-SCHOOL PRACTICES
the need to support their children’s learning, or lack the ability to engage withthe subject matter. This is a challenge for equity.
4.3. Home influence on school performance
Parental support can improve attainment through:
● help or guidance with homework;
● funding of private tuition outside school;
● informal encouragement of learning;
● advice and support in choice of learning options and institutions of study;
● provision of home learning resources, including books and ICT, supportedby advice on how to use such resources;
● support for participation in extra-curricular activities with educationalbenefits.
Research shows that greater parental involvement in educationencourages more positive attitudes toward school, improves homeworkhabits, reduces absenteeism and dropout, and enhances academicachievement (OECD, 2004b). The more active forms of parental involvementwork best. These include working with children at home, greatercommunication with school, attending and supporting school activities ortutoring children using material provided by teachers (Cotton and ReedWikelund, 1989). The PIRLS study (Mullis et al., 2003, Exhibit 4.1) reveals thatthe parents of children with the best performance in reading (in the fourthgrade) engaged in activities such as reading books, telling stories, singingsongs and playing word and alphabet games prior to their children’s entry toprimary school. On average, higher engagement of parents in early homeliteracy activities improves scores by around 20 points on the PIRLS readingscale. According to Ho and Willms (1996), direct parental involvement inschool such as volunteering and attending parent-teacher associationsmeetings has (unsurprisingly) smaller effects on academic outcomes thanhelping children with their school work and monitoring time spent watchingtelevision or going out on school nights. General support and involvement byparents, such as a display of interest in school programmes and discussing thestudent’s day at school, work best.
Although parents’ social class and levels of education are related toeducational outcomes, the quality of the home learning environment is the keyvariable at work (Effective Provision of Pre-School Education Project). Studentsfrom minority and disadvantaged backgrounds may be disadvantagededucationally because they lack access to networks of well-educated adults –social capital, both inside and outside of school. If, in addition to providingstronger support for learning, wealthier or better-informed parents also have
NO MORE FAILURES: TEN STEPS TO EQUITY IN EDUCATION – ISBN 978-92-64-03259-0 – © OECD 2007 101

4. SCHOOL AND OUT-OF-SCHOOL PRACTICES
the ability to obtain better quality schooling for their children, or simply live inareas where schools are better or the peer environment in the schools is moresupportive – as is so often the case in practice – the inequitable effect ofbackground on outcomes will be compounded.
Policy measures to link schools with homes
Studies have shown that successful schools foster greater communicationwith parents, encourage parents to assist their children with school work athome, and recruit parents to work as volunteers or participate in schoolgovernance (Epstein, 1995). While this may improve school outcomes, it alsopresents a dilemma in respect of equity. Untargeted blanket measures toencourage parent-school partnerships will almost inevitably come to fruitionmore readily in schools where parents are better educated and have moreresources. The perverse effect might be to improve outcomes but only inschools in better-off areas – thereby increasing inequity. For that reason,initiatives need to reach out to the most disadvantaged parts of society.Relevant measures include supporting homework (either at home or atschool), strengthening communication channels between parents and schoolsand helping to develop learning communities.
Supporting homework
On average across the OECD, time spent out of school either doinghomework, working with a tutor or other types of courses of out-of-schoolstudy makes up more than 20% of total learning time, but in some countriesthe figure is as much as 40% (See Figure 4.3).
There has been a growing debate over the length of homeworkassignments (see, for example, Brown Center Report on American Education,2003). Proponents argue that homework supports school learning, creates alink between parents and school, and encourages and develops habits ofindependent study. Betts (1997), looking at US students in grades 7 to 12, foundtime spent on mathematics homework to be a stronger driver of achievementthan any of the standard measures of school quality, such as teachereducation and experience or class size. Critics argue that too much homeworkcreates inequity, displaces other valuable activities such as sport, music, playand social interaction and causes conflict between parents and children.
Many immigrant and disadvantaged parents are not able to help theirchildren with their homework, either because of weak skills in the relevantlanguage or lack of time. Nor can they afford to pay someone to help theirchildren keep up with their classmates. In response, one approach is to reachout to parents to inform them of the importance of homework, strengthencommunication (using interpreters in immigrant communities) and provideassistance to parents so that they can help their children. Schools can also
NO MORE FAILURES: TEN STEPS TO EQUITY IN EDUCATION – ISBN 978-92-64-03259-0 – © OECD 2007102

4. SCHOOL AND OUT-OF-SCHOOL PRACTICES
provide additional time for children who need homework support on schoolpremises.
In Ireland, a school completion programme to help youth at risk includesa strategy of before-school and after-school support, delivered outside schoolhours. These services, delivered in partnership with other agencies, assist the
Figure 4.3. Learning time in and out of school (2003)In number of hours
1. Response rate too low to ensure comparability.
Source: OECD (2004b), Learning for Tomorrow's World: First Results from PISA 2003, OECD, Paris.
�� �� �� � �� �� �� 5�
0��� 1�/����� ��� ��
3��)��'����� !�����"�� ��
*���� �#����� ������ �������
������ �2 � ��� �� � �
'���� �� ���#$� � ��&�����#�� ���������� ���
%��� ��.�/�"+����
��� ������ ��
����,��� �����( )#*���+�� ,��#*���+��
���" ������������ �-��" �)
&�����#0�����"�
�#�����8��#�6#�����'��#��+K���
8����#�����'��������#�����6������#� ����E��)���#����# #�����%�"����)#��#�����#�����#���#+�#�����#�� ����
��������H#�������#�6#���# (�� ��#��"+��#�6#����������#��#���#6��������#@�����6������B# ��(�����������#� �#�����#���)L
9����"���#� ����*�"��� �#� ������������� �#��"�
��������H#�������#�6#���# (�� ��#��"+��#�6#����������#��#���#6��������#@��������B# ��(�����#������� �#�����#���)L
��"+��#�6#�����#���#���)
NO MORE FAILURES: TEN STEPS TO EQUITY IN EDUCATION – ISBN 978-92-64-03259-0 – © OECD 2007 103

4. SCHOOL AND OUT-OF-SCHOOL PRACTICES
personal and social development of young people and also support parents.Activities include:
● Clubs: Homework clubs (with food), computer and music clubs.
● Programmes and Projects: Drugs education, family therapy, mentoringprogrammes, community development.
● Parental support: Parenting courses, ICT skills, providing support forchildren’s homework (Exchange House Travellers Service).
Strengthening communication with parents
While some countries have formal arrangements to link parents andschools, these may not work for disadvantaged groups, because of linguisticobstacles, lack of time, conflicting work schedules, lack of confidence, or becausethe parents involved see education as either the school’s exclusive job or simplyunimportant. PIRLS (Mullis et al., 2003, p.238) shows that in the majority ofcountries, better cooperation between the school and home is associated withhigher attainment. In Canada, France, the Netherlands, New Zealand and theUnited States, contacts between parents and school are frequent according toschool heads. More than 50% of schools say that they maintain closerelationships with the majority of parents. These contacts are less common in theCzech Republic, Hungary, Norway, the Slovak Republic, Slovenia, Sweden andTurkey, where less than 35% of schools say that they are often in touch withparents. According to PISA data, the influence of parent groups on decisionmaking at school tends to be strongest in the areas of instructional content andassessment practices, weaker in budgeting and weakest in the area of staffing.
In most education systems, communication arrangements are locallydetermined. In Norway, recent government initiatives (Report No. 30 to theStorting [2003-2004]) recognised the importance of family-school relationshipsand sought to clarify the division of responsibility between homes, schoolsand teachers. But it also underlined that all three groups share theresponsibility of communicating regarding the education of each child(Ministry of Education and Research, Norway).
Setting national priorities is vital, but it has to be followed up by effectivepractices. Different communication channels can be used. In addition to thetraditional report card and newsletters, tools such as DVDs, which show theschool at work, can be effective. For children of parents who are less familiarwith the working of schools, the achievements of children need to be relayedto parents and communication needs to be balanced. If the only informationto reach home is bad news, there is little chance of winning support from thefamily for the efforts being made at school. The communication style alsoneeds to be suited to the nature of the community. Telephone calls to workers
NO MORE FAILURES: TEN STEPS TO EQUITY IN EDUCATION – ISBN 978-92-64-03259-0 – © OECD 2007104

4. SCHOOL AND OUT-OF-SCHOOL PRACTICES
during normal business hours might not be answered; letters sent home maynot be read or understood.
In Sweden for example, in a school where there was a high concentrationof immigrant students, the school Sunnadals Hela Världans Skolan collaboratedwith local organisations (such as the National Naval Museum, the music club,the athletics club) to create links with the local community. A cafe andmeeting centre have been set up in the main hall of the school, which can beused by the neighbourhood for their activities, and where study circles foradults are organised in the evenings, with support from the municipality
Box 4.4. Developing learning communities
● In Ireland, the Schools’ Business Partnership (SBP) matches up individual
schools participating in the School Completion Programme with a local
company. A teacher seconded through the Department of Education and
Science acts as Education Programme Executive with the SBP. Programmes
include the Student Mentoring Programme, a two-year programme for
16-to-18-year-olds where employees from the company mentor students. To
date, 500 corporate volunteers from 16 companies and their partnering
schools have participated. It is claimed that this programme has resulted in
a number of additional students continuing on to third level (OECD, 2005i).
● In Barcelona, the City Educational Project (PEC) brings together
representatives of civil society and public institutions to promote an
integrated education network. Projects range from renovating school
gardens to the establishment of an education and immigration forum. The
Barcelona Educational Coordination Board (1991) brings together
organisations that offer educational activities for schoolchildren. Activities
include music, museums, films and art, public transport, and science and
technology (Institut d’Educació, Ayuntament de Barcelona, 2004).
● Fryshuset, a Swedish youth centre created in 1984 by the YMCA, is now
“owned” by young people and the local community. The centre runs
cultural and sports activities and innovative social projects to prevent
violence and promote social (re-)integration in a multicultural urban
environment. These include the Shadaf Heroes, a movement of Muslim boys
opposing violence to girls in their community; Exit, assisting youngsters to
leave the neo-nazi movement; and Calm Street, a group of unemployed
young people hired to patrol and prevent violence in the public transport
sector. Calm Street also offers training in conflict resolution, first aid, law
and ethics etc. to juniors. The Knowledge Centre, an upper secondary school
combining sports and cultural education with the core curriculum of the
gymnasium, is the educational pillar of Fryshuset. The school has
850 students (Nicaise et al., 2005).
NO MORE FAILURES: TEN STEPS TO EQUITY IN EDUCATION – ISBN 978-92-64-03259-0 – © OECD 2007 105
4. SCHOOL AND OUT-OF-SCHOOL PRACTICES
(parenting courses, intercultural evenings, meetings with employers and theunemployment office etc.). One other school organised informal meetingswith tutors or community mediators who could speak the language of thecommunity in which the school was located. Free coffee and small gatheringstook place once a week for those who wanted to approach the schools.Additionally, a local person was hired to approach families, help them withtheir questions and try to bring the school closer to their families. Anotherschool hired interpreters for parent meetings (Nicaise et al., 2005).
Creating learning communities
One view of education is that learning depends heavily on a range ofactors in a “learning community” and not just on the teacher and the school. Inthis model, parents are indispensable partners in the education of theirchildren, rather than customers in a competitive market. Parents can helpteachers understand the behaviour and needs of their children and maketeaching more effective. They can also contribute with their own diverse skills,which are often valuable complements to those of teachers. In exchange, therole of the school is defined as a resource centre for the development of the localcommunity, which means that it gives all stakeholders, including parents, asense of ownership and aims to respond in a flexible way to their needs.
Employers also play an important role, for example by permitting theirworkers to visit their children’s school when necessary during working hours.Education authorities could encourage employer support for working parentsthrough awards for community development or possibly through tax relief forfirms which provide verified employer support over a designated period of time.
4.4. Summary conclusions and recommendations
Step 5: Identify and provide systematic help to those who fall behind at school and reduce high rates of school-year repetition
Evidence
● In some school systems, up to one-quarter of students repeat a year at somepoint. In others it is rare. Some countries, such as Luxembourg, are takingsteps to reduce the extent of repetition.
● Although year repetition is often popular with teachers, there is littleevidence that children gain benefit from it. Repetition is expensive – the fulleconomic cost is up to USD 20 000 equivalent for each student who repeatsa year – but schools have few incentives to take into account the costsinvolved.
● The classroom is the first level of intervention for equity. Evidence showsthat it is possible to improve classroom attainment with methods such as
NO MORE FAILURES: TEN STEPS TO EQUITY IN EDUCATION – ISBN 978-92-64-03259-0 – © OECD 2007106

4. SCHOOL AND OUT-OF-SCHOOL PRACTICES
formative assessment – a process of feeding back information aboutperformance to student and teacher and adapting and improving teachingand learning in response, particularly with students at risk.
● “Reading Recovery” strategies – short-term, intensive interventions of one-on-one lessons – can help many poor readers to catch up.
● Finland uses a hierarchy of successive formal and informal interventions toassist those falling behind at school. This approach appears to besuccessful: only 1% of 15-year-olds are unable to demonstrate basicfunctional reading skills, while the OECD average is 7%.
Policy recommendations
● High rates of year repetition in some countries need to be reduced by changingincentives for schools and encouraging alternative approaches.
● Interventions in the classroom can be very effective in tacklingunderachievement. Among the approaches available, we can highlightformative assessment, reading recovery strategies and careful monitoring.
● Many countries could usefully follow the successful Finnish approach tolearning difficulties, offering a sequence of intensifying interventions whichdraw back into the mainstream those who fall behind.
● Teaching professionals should receive support to develop their in-classroomtechniques to help those in the class who are falling behind.
Step 6: Strengthen the links between school and home to help disadvantaged parents help their children to learn
Student learning benefits from an effective school-home relationship, butchildren from deprived backgrounds may not benefit from this advantagebecause of weak support at home.
Evidence
● On average, children in OECD countries spend more than 20% of their totallearning time out of school – doing homework, working with a tutor or onother activities.
● Home factors, including parental support for education, engagement withchildren's learning and cultural assets (like books), are associated withstronger school performance.
● Homework can improve school outcomes, but reliance on homework mayalso threaten equity, since some children lack the home support necessaryto realise its benefits.
● Parental involvement – working with children at home and activelyparticipating in school activities – does improve results. All other things
NO MORE FAILURES: TEN STEPS TO EQUITY IN EDUCATION – ISBN 978-92-64-03259-0 – © OECD 2007 107
4. SCHOOL AND OUT-OF-SCHOOL PRACTICES
being equal, schools that foster communication and participation byparents, and encourage and assist parents to support their children withtheir school work tend to have better outcomes.
Policy recommendations
● To support learning among disadvantaged children, schools need to targettheir efforts to improve communication with parents in the most disadvantagedhomes and help develop environments conducive to learning.
● After-school homework clubs at school may also provide an environment thatsupports homework for those with weak home support.
References
Betts, J. (1997), “The Two-Legged Stool: The Neglected Role of Educational Standards inImproving America's Public Schools”, Working Paper 97-32, University of California,Department of Economics, San Diego.
Black, P. and D. William (1998), “Assessment and Classroom Learning”, in Assessmentin Education, Vol. 5, No. 1, March 1998, p. 140.
Brooks, G. (2002), “What Works for Children with Literacy Difficulties: The Effectivenessof Intervention Schemes”, Department for Education and Skills (DfES) report380.31, DfES, London.
Brown Center Report on American Education (2003), “How Well Are American StudentsLearning? With Special Section on Homework, Charter Schools, and Rural SchoolAchievement”, Vol. 1, No. 4, Brookings Institution, Washington, DC.
Burroughs-Lange, S. (n.d.), Evaluation of Reading Recovery in London Schools: Every Child AReader 2005-2006, Institute of Education, University of London, London.
Coradi Vellacott, M. and S. Wolter (2004), Equity in the Swiss Education System:Dimensions, Causes and Policy Responses. National Report from Switzerland contributingto the OECD’s Review of Equity in Education, Swiss Coordination Center for Researchin Education.
Cotton, K. and K. Reed Wikelund (1989), Student and Parent Involvement in Education,retrieved March, 2006, School Improvement Research Series, Northwest RegionalEducational Laboratory, www.nwrel.org/scpd/sirs/3/cu6.html.
Dalton, M., P. Ferguson and S. Jimerson (2001), “Sorting out of Successful Failures:Exploratory Analyses of Factors Associated with Academic and BehaviouralOutcomes of Retained Students”, Psychology in the Schools, Vol. 38(4), John Wileyand Sons, Inc.
Effective Provision of Pre-School Education project, www.ioe.ac.uk/schools/ecpe/eppe/index.htm.
Epstein, J. (1995), “School/family/community Partnerships: Caring for the Children weShare”, Phi Delta Kappa, 76(9), pp. 701-712.
Eurydice, The Information Network on Education in Europe, www.eurydice.org/Eurybase/frameset_eurybase.html.
Exchange House Travellers Service, www.exchangehouse.ie/afterschools.htm.
NO MORE FAILURES: TEN STEPS TO EQUITY IN EDUCATION – ISBN 978-92-64-03259-0 – © OECD 2007108

4. SCHOOL AND OUT-OF-SCHOOL PRACTICES
Flere, S. (2004), Educational Equity and Inequity in Slovenia: Country Analytical Report.
Grubb N., S. Field, H. Marit Jahr and J. Neumüller (2005), Equity in Education ThematicReview: Finland Country Note, OECD, Paris, www.oecd.org/dataoecd/49/40/36376641.pdf.
Haut Conseil de l’Évaluation de l’École (2004), Avis 14.
Ho Sui-Chu, E. and J. Willms (1996), “Effects of Parental Iinvolvement on Eighth-GradeAchievement”, Sociology of Education, 69(2), pp. 126-141.
Hoffman, N., M.L. Ferreira, S. Field and B. Levin (2005), Equity in Education ThematicReview: Hungary Country Note, OECD, Paris.
Institut d’Educació, Ayuntament de Barcelona (2004), PEC 2004-2007, BarcelonaEducational Coordination Board (2005), Schools and Civic Entities: NetworkingSchools.
Jimerson, S., E. Carlson, M. Rotert, B. Egeland and L. Sroufe (1997), “A Prospective,Longitudinal Study of the Correlates and Consequences of Early Grade Retention”,Journal of School Psychology, Vol. 35, No. 1, Pergamon/Elsevier, pp. 3-25.
Kim, T. and K. Pelleriaux (2004), Equity in the Flemish Educational System: CountryAnalytical Report, University of Antwerp.
Luxembourg, ministère de l’Éducation nationale et de la Formation professionnelle,2005, Analyse des “Klassenwiderholens” im primaren and postprimaren Bereich,www.gouvernement.lu/salle_presse/actualite/2005/09/28delvaux/etude_redoublement.pdf.
Lycée de l’Essouriau (2005), “La première de détermination S-ES du lycée de l’Essouriau”,Lycée de l’Essouriau, Les Ulis, www.innovation-pedagogique.ac-versailles.fr/IMG/pdf/05-06-lgtl_Essouriau-Les_Ulis.pdf.
Ministry of National Education, Higher Education and Research, France (2004), L’équitédans l’éducation en France: Rapport de base national présenté dans le cadre de l’activité del’OCDE, Paris.
Ministry of Education and Research, Norway, www.odin.dep.no/ufd.
Mortimore, P., S. Field. and B. Pont (2005), Equity in Education Thematic Review: NorwayCountry Note, OECD, Paris, www.oecd.org/dataoecd/10/6/35892523.pdf.
Mullis, I., M. Martin, E. Gonzalez and A. Kennedy (2003), PIRLS 2001 International Report:IEA’s Study of Reading Literacy Achievement in Primary Schools in 35 Countries,International Study Center, Lynch School of Education, Boston College.
Nicaise, I., G. Esping-Andersen, B. Pont and P. Tunstall (2005), Equity in Education ThematicReview: Sweden Country Note, OECD, Paris, www.oecd.org/dataoecd/10/5/35892546.pdf.
OECD (2004a), Equity in Education: Students with Disabilities, Learning Difficulties andDisadvantages, OECD, Paris.
OECD (2004b), Learning for Tomorrow’s World: First Results from PISA 2003, OECD, Paris.
OECD (2005c), Education at a Glance: OECD Indicators 2005, OECD, Paris.
OECD (2005h), Formative Assessment: Improving Learning in Secondary Classrooms, OECD,Paris.
OECD (2005i), Promoting Partnership for Inclusion: Country Report National System Policiesand Practices Concerning Children and Youth at Risk – Ireland, OECD, CERI, Paris.
OECD, “England Case Study Visit, Innovative Approaches to School Leadership”,OECD, Paris, available at www.oecd.org/edu/schoolleadership. Paul, J.-J. (1997), “ Le
NO MORE FAILURES: TEN STEPS TO EQUITY IN EDUCATION – ISBN 978-92-64-03259-0 – © OECD 2007 109

4. SCHOOL AND OUT-OF-SCHOOL PRACTICES
redoublement à l’école : une maladie universelle? ”, International Review ofEducation, 43(5-6), pp. 611-627, forthcoming.
Paul, J.-J. and T. Troncin (2004), “Les apports de la recherche sur l’impact du redoublementcomme moyen de traiter les difficultés scolaires au cours de la scolarité obligatoire”,Haut Conseil de l’Évaluation de l’École, No. 14.
Pechar, H., M. Unger and M. Bonisch (2005), Equity in Education: An Inventory of theSituation in Austria, unpublished, Vienna.
Reading Recovery Council of North America, www.readingrecovery.org.
Swiss Contribution to Eurybase – the Information Database on Education Systems in Europe(2001), Information Documentation Éducation Suisse, Berne, www.edk.ch/PDF_Downloads/Bildungswesen_CH/Eurydice_00e.pdf.
Teese, R., P. Aasen, S. Field and B. Pont (2005), Equity in Education Thematic Review: SpainCountry Note, OECD, Paris, www.oecd.org/dataoecd/41/39/36361409.pdf.
Willms, J.D. (2003), Student Engagement at School: A Sense of Belonging and Participation,Results from PISA 2000, OECD, Paris.
NO MORE FAILURES: TEN STEPS TO EQUITY IN EDUCATION – ISBN 978-92-64-03259-0 – © OECD 2007110
ISBN 978-92-64-03259-0
No More Failures: Ten Steps to Equity in Education
© OECD 2007
Chapter 5
Resources and Outcomes
This chapter looks at the way in which resources are distributed ineducational systems and how outcome measures are used to directthe system; both have profound implications for equity. It examinesthe vertical allocation of resources between different educationallevels, and argues that early childhood education and care andbasic education are equity priorities. It looks at horizontalallocation across institutions and regions, explores the merits ofdifferent approaches to targeting resources for schools andindividuals who need additional help, and examines ways ofcompensating for regional inequalities. The chapter then examinestwo key ways in which outcome measures can be used for policypurposes. It examines the use of numerically defined policy targetsfor equity, discussing their potential pitfalls as well as their merits.It also explores the issue of schools testing, its implications forequity, pros and cons of publication at school level and supportmeasures necessary for schools identified as underperforming.
111

5. RESOURCES AND OUTCOMES
One of the biggest challenges faced by education ministers is how to dealwith competing demands for spending – to renovate schools, expanduniversities for increasing student numbers, find additional funds to payteachers wages or target support to those with learning difficulties.
Frequently, the question of priorities is avoided. This is partly becausebudgets for different sectors are often looked at separately, and it is mucheasier to see that schools need repairs than to fund those repairs by closingkindergartens, or increasing taxes. Sometimes the budget challenge is sharedwith other ministries – budgets for adult learning often fall to employmentministries, while ministries for social affairs sometime take responsibility forearly childhood education and care and ministries of science for parts oftertiary education. Inevitably, competition between ministries for resourcesmakes it harder to agree on any strategic view of priorities. Even whenresponsibilities are clear, it is sometimes easier to avoid the issue. Clear, well-thought-out priorities are the mark of strong education policy. But noteverything can be a priority, and no one wants to give that message to a non-priority sector.
This chapter looks at priorities for equity and links that discussion totargets and outcomes. Policy targets – either national or local – are a concreteway of demonstrating not just that something is desirable, but that steps arebeing taken to realise that end.
5.1. Allocating resources across educational sectors
Priorities and resources
The main criterion of a priority is a willingness to commit valuedresources to the desired objective. That does not just mean money. Politicalcapital – willingness to bear political risks – costs nothing in pure financialterms. No major reform is without determined opponents and sometimes themost sorely needed reforms make the most enemies. In a democracy, someunpopular reforms are possible, but governments seeking re-election willlimit their extent and number. This means being very clear about priorities.
When money is involved, the function of priority setting across sectors isto determine the allocation of resources at the margin. If, for example,primary education is identified as a greater priority than secondary education,it means that any additional resources are directed to primary schools, or, if
NO MORE FAILURES: TEN STEPS TO EQUITY IN EDUCATION – ISBN 978-92-64-03259-0 – © OECD 2007112

5. RESOURCES AND OUTCOMES
there are budgetary cuts, they are concentrated on secondary schools. In thelonger term, year-on-year adjustment of budgets in one direction or anotherrepresents a clear statement of priorities. A great deal of priority setting willremain implicit, not least because of the political difficulty in saying that aparticular sector is not a priority.
Chapter 2 described how the general expansion of education has notdelivered as much equity as some hoped. Further increases in aggregateexpenditure on education may not yield equity benefits. This adds force to theargument that additional education expenditure should be targeted at theeducation sectors which are most conducive to equity.
There are some exceptions. In Russia, general increases in publicspending on education would be very helpful, as they could alleviate some ofthe severe inequities associated with current underfunding. While publiceducation at pre-primary, primary and secondary level is free, public spendingon education was halved between 1991 and 1999. Over this period, spendingper child decreased by 40% in primary and secondary schools and by 70% inhigher education. About a third of schools need urgent major repairs and aquarter of primary and secondary schools have no running water. Only 59%have proper sewage systems. This has led to a parallel system based onwidespread informal payments for education in which parents typically payfor teaching materials, redecoration, guarding of the premises and trips. Thisis also the case for tertiary education, which includes official payments forbooks, entrance and examination fees, and unofficial payments includingtutoring fees, entrance bribes or pseudo tutorship, and payment for coursework. This inevitably discriminates against low income families (Ministry ofEducation, Russian Federation, 2005).
Evidence of sectoral priorities
In most OECD countries, annual tuition expenditure per studentincreases with age, growing gradually from pre-primary to tertiary level. Theincrease is partly attributable to smaller class sizes in secondary school, andpartly to higher salaries for teachers in later stages of the system. The questionthese differences raise is fundamental. Are they justified? Or do they reflecthistorical accident, or the relative bargaining power of high status secondaryand tertiary teaching personnel relative to primary school teachers?
The argument is partly one of efficiency, of deciding how to spread tuitionexpenditure, and therefore one of effort – over the entire period of learning soas to maximise learning outcomes. For example, does one get a better resultfrom putting more resources into primary schools or secondary schools? But itis also partly a question about equity, since not all students obtain the benefitsof early childhood or post-compulsory education. Setting aside longer time
NO MORE FAILURES: TEN STEPS TO EQUITY IN EDUCATION – ISBN 978-92-64-03259-0 – © OECD 2007 113
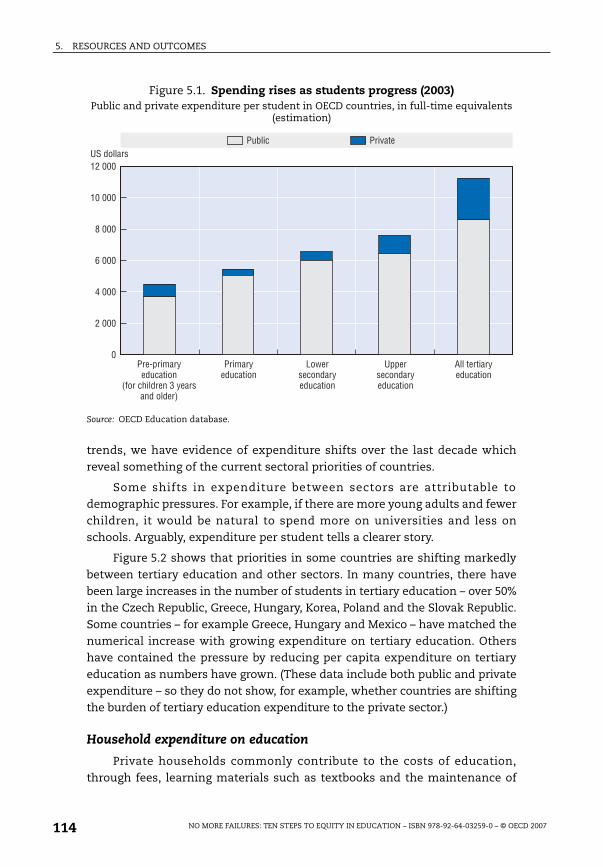
5. RESOURCES AND OUTCOMES
trends, we have evidence of expenditure shifts over the last decade whichreveal something of the current sectoral priorities of countries.
Some shifts in expenditure between sectors are attributable todemographic pressures. For example, if there are more young adults and fewerchildren, it would be natural to spend more on universities and less onschools. Arguably, expenditure per student tells a clearer story.
Figure 5.2 shows that priorities in some countries are shifting markedlybetween tertiary education and other sectors. In many countries, there havebeen large increases in the number of students in tertiary education – over 50%in the Czech Republic, Greece, Hungary, Korea, Poland and the Slovak Republic.Some countries – for example Greece, Hungary and Mexico – have matched thenumerical increase with growing expenditure on tertiary education. Othershave contained the pressure by reducing per capita expenditure on tertiaryeducation as numbers have grown. (These data include both public and privateexpenditure – so they do not show, for example, whether countries are shiftingthe burden of tertiary education expenditure to the private sector.)
Household expenditure on education
Private households commonly contribute to the costs of education,through fees, learning materials such as textbooks and the maintenance of
Figure 5.1. Spending rises as students progress (2003)Public and private expenditure per student in OECD countries, in full-time equivalents
(estimation)
Source: OECD Education database.
��#���
��#���
>#���
7#���
5#���
�#���
��������" ����� ����
;6��#�������#�#�� �� ��#�����<
&�#���� ����+��
���" ����� ����
.��������� ����� ����
&��������� ����� ����
'��#����� ����� ����
���( ��
NO MORE FAILURES: TEN STEPS TO EQUITY IN EDUCATION – ISBN 978-92-64-03259-0 – © OECD 2007114
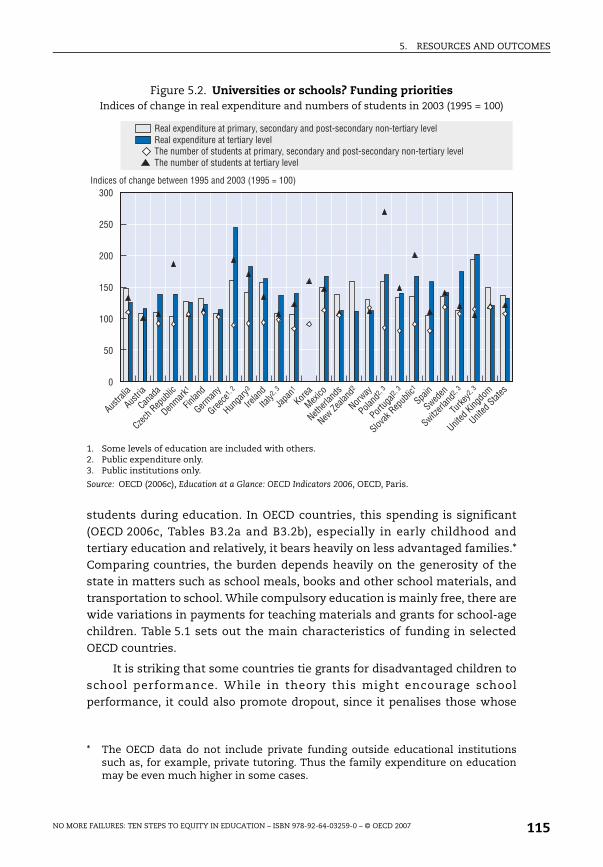
5. RESOURCES AND OUTCOMES
students during education. In OECD countries, this spending is significant(OECD 2006c, Tables B3.2a and B3.2b), especially in early childhood andtertiary education and relatively, it bears heavily on less advantaged families.*Comparing countries, the burden depends heavily on the generosity of thestate in matters such as school meals, books and other school materials, andtransportation to school. While compulsory education is mainly free, there arewide variations in payments for teaching materials and grants for school-agechildren. Table 5.1 sets out the main characteristics of funding in selectedOECD countries.
It is striking that some countries tie grants for disadvantaged children toschool performance. While in theory this might encourage schoolperformance, it could also promote dropout, since it penalises those whose
Figure 5.2. Universities or schools? Funding priorities Indices of change in real expenditure and numbers of students in 2003 (1995 = 100)
1. Some levels of education are included with others.2. Public expenditure only.3. Public institutions only.
Source: OECD (2006c), Education at a Glance: OECD Indicators 2006, OECD, Paris.
* The OECD data do not include private funding outside educational institutionssuch as, for example, private tutoring. Thus the family expenditure on educationmay be even much higher in some cases.
���
���
���
���
���
��
�
'���� ��
�����#�6#� ���#+������#�??�# ��#����#;�??�#M#���<
3��#��"+��#�6#��������# �#����� ��#��(��3��#��"+��#�6#��������# �#���" ��F#����� ��# ��#���������� ��#��������� ��#��(��*� �#�/���������# �#����� ��#��(��*� �#�/���������# �#���" ��F#����� ��# ��#���������� ��#��������� ��#��(��
'�����
� �
,��#*���+��
-��" �)�
���� ��
���" ��
������F#�
%��� ���
��� ��
� ���F#�
2 � ��
0���
1�/��
������� ���
���#$� � ���
���� �
��� ���F#�
������ ��F#�
���( )#*���+���
�� ��
������
����,��� ���F#�
3��)���F#�
&�����#0�����"
&�����#�� ���
NO MORE FAILURES: TEN STEPS TO EQUITY IN EDUCATION – ISBN 978-92-64-03259-0 – © OECD 2007 115
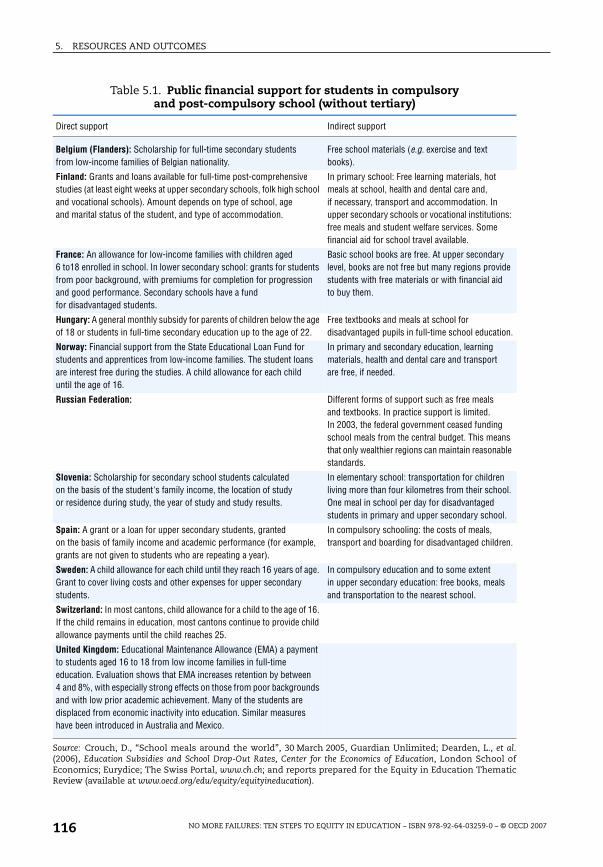
5. RESOURCES AND OUTCOMES
Table 5.1. Public financial support for students in compulsoryand post-compulsory school (without tertiary)
Direct support Indirect support
Belgium (Flanders): Scholarship for full-time secondary studentsfrom low-income families of Belgian nationality.
Free school materials (e.g. exercise and text books).
Finland: Grants and loans available for full-time post-comprehensive studies (at least eight weeks at upper secondary schools, folk high school and vocational schools). Amount depends on type of school, ageand marital status of the student, and type of accommodation.
In primary school: Free learning materials, hot meals at school, health and dental care and, if necessary, transport and accommodation. In upper secondary schools or vocational institutions: free meals and student welfare services. Some financial aid for school travel available.
France: An allowance for low-income families with children aged 6 to18 enrolled in school. In lower secondary school: grants for students from poor background, with premiums for completion for progression and good performance. Secondary schools have a fundfor disadvantaged students.
Basic school books are free. At upper secondary level, books are not free but many regions provide students with free materials or with financial aidto buy them.
Hungary: A general monthly subsidy for parents of children below the age of 18 or students in full-time secondary education up to the age of 22.
Free textbooks and meals at school for disadvantaged pupils in full-time school education.
Norway: Financial support from the State Educational Loan Fund for students and apprentices from low-income families. The student loans are interest free during the studies. A child allowance for each child until the age of 16.
In primary and secondary education, learning materials, health and dental care and transportare free, if needed.
Russian Federation: Different forms of support such as free meals and textbooks. In practice support is limited. In 2003, the federal government ceased funding school meals from the central budget. This means that only wealthier regions can maintain reasonable standards.
Slovenia: Scholarship for secondary school students calculated on the basis of the student's family income, the location of study or residence during study, the year of study and study results.
In elementary school: transportation for children living more than four kilometres from their school. One meal in school per day for disadvantaged students in primary and upper secondary school.
Spain: A grant or a loan for upper secondary students, grantedon the basis of family income and academic performance (for example, grants are not given to students who are repeating a year).
In compulsory schooling: the costs of meals, transport and boarding for disadvantaged children.
Sweden: A child allowance for each child until they reach 16 years of age. Grant to cover living costs and other expenses for upper secondary students.
In compulsory education and to some extentin upper secondary education: free books, meals and transportation to the nearest school.
Switzerland: In most cantons, child allowance for a child to the age of 16. If the child remains in education, most cantons continue to provide child allowance payments until the child reaches 25.
United Kingdom: Educational Maintenance Allowance (EMA) a payment to students aged 16 to 18 from low income families in full-time education. Evaluation shows that EMA increases retention by between 4 and 8%, with especially strong effects on those from poor backgrounds and with low prior academic achievement. Many of the students are displaced from economic inactivity into education. Similar measures have been introduced in Australia and Mexico.
Source: Crouch, D., “School meals around the world”, 30 March 2005, Guardian Unlimited; Dearden, L., et al.(2006), Education Subsidies and School Drop-Out Rates, Center for the Economics of Education, London School ofEconomics; Eurydice; The Swiss Portal, www.ch.ch; and reports prepared for the Equity in Education ThematicReview (available at www.oecd.org/edu/equity/equityineducation).
NO MORE FAILURES: TEN STEPS TO EQUITY IN EDUCATION – ISBN 978-92-64-03259-0 – © OECD 2007116

5. RESOURCES AND OUTCOMES
commitment to school is most questionable. There is evidence, for examplefrom the UK educational maintenance allowance scheme, that grants mayimprove retention among disadvantaged students (Dearden et al., 2006). It istherefore potentially damaging to equity to withdraw them for children atrisk. But some basic conditions do make sense. In Mexico, Oportunidades grantstargeted to poor families are conditional. Transfer of cash grants depends onchildren staying at school and undertaking regular health checks (OECD,2005b).
The claims of each sector
Spending money on one part of the education system has implicationsfor other parts, since individual students move from one stage to the next.Younger people staying on at school implies more applicants at tertiary level.One difficult challenge for any educational system is to develop a systemicviewpoint and link it to decisions about sectoral priorities. For example itmakes little sense to have an exceptional primary school system if the outcomesare wasted in weak secondary schools (see also Cunha et al., 2005). As well asjust planning numbers and forecasting their flow through the system, thisrequires some attention to the quality of outcomes and consistency acrosssuccessive stages of the educational system.
Early childhood education and care
There is extensive evidence that an environment which is healthy, caring,and educative for very young children yields large positive returns over alifetime, particularly for the most disadvantaged (McCabe and Smyth, 2000;Carneiro and Heckman, 2003; Heckman, 1999; Leseman, 2002; OECD, 2006d). Inthe United States, for example, the Perry Preschool experiment, theAbecedarian Project and the Chicago Child-Parent Center Program haveshown that children from disadvantaged backgrounds who receive goodquality early childhood education and care (ECEC) have better schooloutcomes and are less likely to become involved in crime. In France, Swedenand the United Kingdom, additional studies show that participation in highquality early childhood education and care is positively associated with long-term cognitive, social and emotional development of children, with schoolreadiness and school performance, and has especially strong associations forthose with disadvantaged backgrounds (Goodman and Sianesi, 2005). Sylva et
al. (2003) found that the more extensive systems of preschool education interms of enrolment and duration significantly increase equality ofopportunity, as measured by a lower dependence of eighth-grade students’test scores on their family background.
Figure 5.3 shows the long-term outcomes from the US Perry Program,directed at extremely disadvantaged American children. It compares
NO MORE FAILURES: TEN STEPS TO EQUITY IN EDUCATION – ISBN 978-92-64-03259-0 – © OECD 2007 117
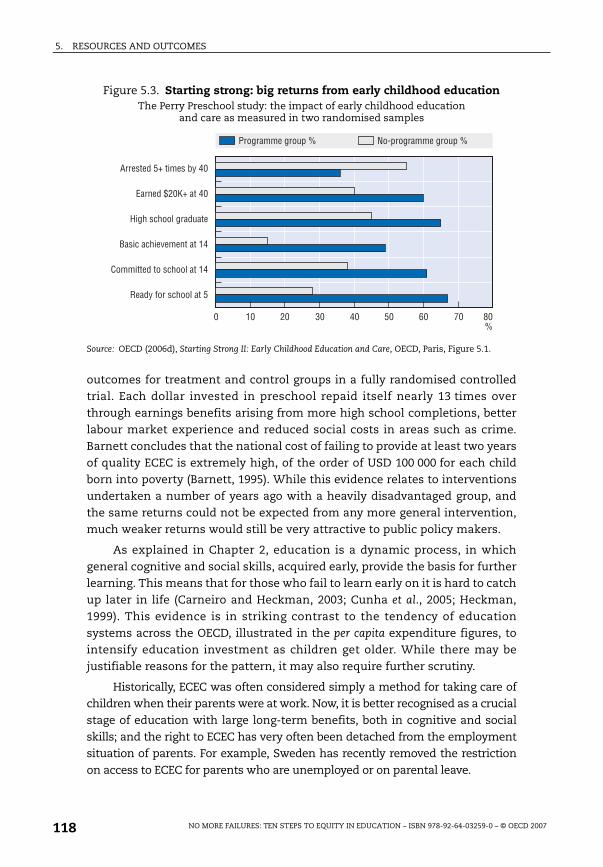
5. RESOURCES AND OUTCOMES
outcomes for treatment and control groups in a fully randomised controlledtrial. Each dollar invested in preschool repaid itself nearly 13 times overthrough earnings benefits arising from more high school completions, betterlabour market experience and reduced social costs in areas such as crime.Barnett concludes that the national cost of failing to provide at least two yearsof quality ECEC is extremely high, of the order of USD 100 000 for each childborn into poverty (Barnett, 1995). While this evidence relates to interventionsundertaken a number of years ago with a heavily disadvantaged group, andthe same returns could not be expected from any more general intervention,much weaker returns would still be very attractive to public policy makers.
As explained in Chapter 2, education is a dynamic process, in whichgeneral cognitive and social skills, acquired early, provide the basis for furtherlearning. This means that for those who fail to learn early on it is hard to catchup later in life (Carneiro and Heckman, 2003; Cunha et al., 2005; Heckman,1999). This evidence is in striking contrast to the tendency of educationsystems across the OECD, illustrated in the per capita expenditure figures, tointensify education investment as children get older. While there may bejustifiable reasons for the pattern, it may also require further scrutiny.
Historically, ECEC was often considered simply a method for taking care ofchildren when their parents were at work. Now, it is better recognised as a crucialstage of education with large long-term benefits, both in cognitive and socialskills; and the right to ECEC has very often been detached from the employmentsituation of parents. For example, Sweden has recently removed the restrictionon access to ECEC for parents who are unemployed or on parental leave.
Figure 5.3. Starting strong: big returns from early childhood educationThe Perry Preschool study: the impact of early childhood education
and care as measured in two randomised samples
Source: OECD (2006d), Starting Strong II: Early Childhood Education and Care, OECD, Paris, Figure 5.1.
� �� �� �� 5� �� 7� =�:>�
'�������#�C#��"��#+�#5�
9 ����#D��0C# �#5�
%���#�����#�� �� ��
! ��# ���(�"���# �#�5
�""�����#��#�����# �#�5
*� ��#6��#�����# �#�
����� ""�#�����#: �������� ""�#�����#:
NO MORE FAILURES: TEN STEPS TO EQUITY IN EDUCATION – ISBN 978-92-64-03259-0 – © OECD 2007118

5. RESOURCES AND OUTCOMES
There are large variations between countries in government support forand participation in ECEC. Many OECD countries have already introduced free-of-charge ECEC at least for all disadvantaged children. For example, inBelgium, all children from the age of two-and-a-half and in France all childrenfrom the age of three have a right to free ECEC. Sweden, where free ECEC isprovided to all four-year-old and five-year-old children, has introduced freehalf-day provision for bilingual children from the age of three. In systemswhere ECEC is not free of charge, research suggests that family income is oneof the predictors of enrolment in early education and care programmes, whichmay be particularly relevant to immigrants and minorities (Chiswick andDebBurnam, 2004; Bainbridge et al., 2005). But badly designed public support tofamilies may provide parents with more financial incentives to keep theirchildren at home than to send them to ECEC. In Norway, parents of youngchildren who make very limited or no use of pre-primary provision andsubsidised day care have received a cash transfer (the cash benefit scheme).The aim of this initiative was to provide parents with a wider range of choiceof care for their children and to distribute public transfers equally amongfamilies regardless of the childcare arrangement made by parents. One ofeffects of the cash benefit scheme might be the lower participation rate ofchildren of immigrant background in ECEC as this financial incentive hasmore weight (relative to other sources of income) in poorer households(Mortimore et al., 2005). Parents of young children (1-to-2 years) still receive acash transfer.
Compulsory education
By definition, compulsory education is for all, including weak performers,those who come from disadvantaged social backgrounds or are otherwise atrisk. By contrast, even when valiant efforts are made to enhance access, mostnon-compulsory sectors of education tend to leave out disadvantaged groups.In many OECD countries there is a renewed emphasis on the compulsoryphase of education, linked to concerns about standards and quality. Resourcepressures may be substantial, particularly in the context of the need to attractand retain good teachers. While there is little evidence that smaller classes orhigher teacher pay improves outcomes overall, research shows that welltargeted efforts to help struggling learners can help (Rouse, 2000; Hanusheket al., 1998; Hanushek et al., 2001; Levacic and Vignoles, 2000). For thesereasons, the compulsory phase of education has a strong prior claim as anequity priority. This is a simple point, but it is nevertheless compelling.Despite this, across OECD countries less than half of all public educationalexpenditure goes to primary and lower secondary education (approximatingto the compulsory phase). One reason for this is that per capita expenditure ishigher at upper secondary and tertiary levels (see Figure 5.4).
NO MORE FAILURES: TEN STEPS TO EQUITY IN EDUCATION – ISBN 978-92-64-03259-0 – © OECD 2007 119

5. RESOURCES AND OUTCOMES
Post-compulsory education and adult learning
Outside compulsory education, additional resources are often sought toincrease participation – an investment whose outcomes depend on the targetgroup of additional participants. In many OECD countries, upper secondaryparticipation rates have reached 70-80%. At this point, strong equityarguments emerge for increasing participation rates towards 100%, since theremaining 20-30% of the cohort will, almost by definition, be those most likelyto be at risk in the labour market.
Adult learning is in a different category, in the face of extensive evidencethat those with existing qualifications tend to make the most use ofopportunities provided. The challenge in adult learning is to target publicinvestment at those most in need. This is a particular challenge, given thattake-up among this group is particularly low. For others, it may be moreappropriate to share the costs of adult learning – in line with the benefits –between students, government and employers.
While it may be more cost-effective to give priority to early learning, anadditional argument supports the provision of adult learning – that ofintergenerational equity. Educational expectations have increased so thatolder cohorts will not have had the same opportunities as younger cohorts, forexample to obtain post-compulsory qualifications. Fairness betweengenerations means that adults who have missed out on initial formaleducation deserve a reasonable second chance.
Tertiary education
As indicated earlier, substantial increases in overall participation intertiary education have not generally equalised life chances for those from
Figure 5.4. Where education spending goes (2003)Distribution of total public expenditure on education in OECD countries (estimation)
Source: OECD Education database.
�������" ��#��� ����;6��#�������#�#�� ��# ��#�����<>:
���" ��# ��#�����#����� ����� ����5?:
3���� ��#��� ������:
&����#����� ����� ����
��#���������� ����������� ��#��� ����
��:
NO MORE FAILURES: TEN STEPS TO EQUITY IN EDUCATION – ISBN 978-92-64-03259-0 – © OECD 2007120
5. RESOURCES AND OUTCOMES
different backgrounds. On average in OECD countries, around a third of youngpeople (aged 25 to 34) now have tertiary qualifications, but in only twocountries (Canada and Japan) does the figure exceed one-half by a smallmargin. In most OECD countries, tertiary education has not yet reached thepoint of targeting 100% of the population. Additional participation in tertiaryeducation will therefore in most cases benefit an intermediate group in termsof prior qualifications and attainment. In equity terms, the case for spendingpublic money simply to increase participation is therefore weak. But thisshould not preclude rethinking priorities in tertiary education. In France forexample, 30% of the total budget for tertiary education is spent on the grandesécoles and their classes préparatoires, a sector which accommodates only about3% of all tertiary students (Renaut, 2002).
At the same time, an intensive debate has emerged about fees andtertiary education. The equity argument for fees is that subsidies to tertiarytuition go towards those who typically come from well-off families and willthemselves be well-off. There are also well-established mechanisms, such asincome-contingent loans and grants for target groups, to reduce the risk thatfees will deter students from poor families from entering tertiary education.These arguments are weakened, but not eliminated, in the presence of highermarginal income taxes because such taxes act as a graduate tax. Moreoverresearch suggests that in most OECD countries, current levels of publicspending on education provide sufficient financial incentives for individualsto seek post-compulsory qualifications (de la Fuente, 2003; Carneiro andHeckman, 2002; Cameron and Heckman, 1999).
In terms of efficiency, there is no aggregate evidence that tertiaryexpenditure contributes more to economic growth than other parts ofeducation (de la Fuente, 2003) and, given the option of continued tertiaryexpansion through increased contributions by students, it is difficult to arguethat public expenditure is necessary to sustain a tertiary sector of adequatesize. In summary therefore, given the strongly competing demands of othersectors, the claims of tertiary education on public education expenditure areweak on both equity and efficiency grounds.
5.2. Allocating resources across individuals, institutionsand regions
The previous section looked at the allocation of resources vertically,across different sectors of education. This section looks at allocationhorizontally, between different individuals, institutions and regions. Equityrequires that different resources be devoted to different students because
NO MORE FAILURES: TEN STEPS TO EQUITY IN EDUCATION – ISBN 978-92-64-03259-0 – © OECD 2007 121

5. RESOURCES AND OUTCOMES
some students have greater needs than others. The two main dimensions ofequity – fairness and inclusion – imply two approaches:
● directing more resources to students according to indicators ofdisadvantage or social need, for example family poverty or immigrantstatus, addressing fairness; and
● giving additional resources to students displaying learning weaknesses,addressing inclusion.
These approaches overlap in the sense that help given to those withlearning difficulties tends also to reduce the impact of social background onoutcomes. These two approaches can be pursued at different levels – at thelevel of the individual, the school and the area.
Compensating for regional economic inequities
In many countries, resourcing decisions are taken locally and someregions have fewer resources or give less priority to education than others.This may result in regional inequities and unevenness in provision. In Spain,for example, Andalusia spends more than twice as much on education (as apercentage of Andalusian GDP) than Spain as a whole (as a percentage ofnational GDP). But spending per student remains much lower in Andalusiathan average expenditure per student in Spain (Figure 5.5).
One other indicator of the extent to which regional economic inequalitiescan create inequities comes from the United States, in spending on schoolbuilding and construction. Figure 5.6 shows that public spending on schoolconstruction tends to be higher in areas where the population is better off.Higher costs in affluent areas may be part of the explanation, but inequitiesare also a potential issue.
Later sections will discuss measures designed to direct more resources toschools in disadvantaged areas, but these data are a reminder that manydecentralised education systems direct fewer resources to disadvantagedareas because they have a weaker tax base. Many countries redistributeresources to poor areas, on the grounds of their weaker tax base and greatersocial need. For example, in England, the central government distributesresources from a deprivation fund to local authorities, taking account of theirlevel of disadvantage. In Sweden, the national government redistributesresources from wealthy to poorer municipalities through a grant. (Thediscretion of local authorities to use these grants as they wish may leadto inequities. The expert team visiting Sweden recommended there-introduction of earmarked grants, for example to improve the access ofminority children to pre-primary education [Nicaise et al., 2005]). In Norway,earmarked grants targeted at disadvantaged populations cover issues such as
NO MORE FAILURES: TEN STEPS TO EQUITY IN EDUCATION – ISBN 978-92-64-03259-0 – © OECD 2007122
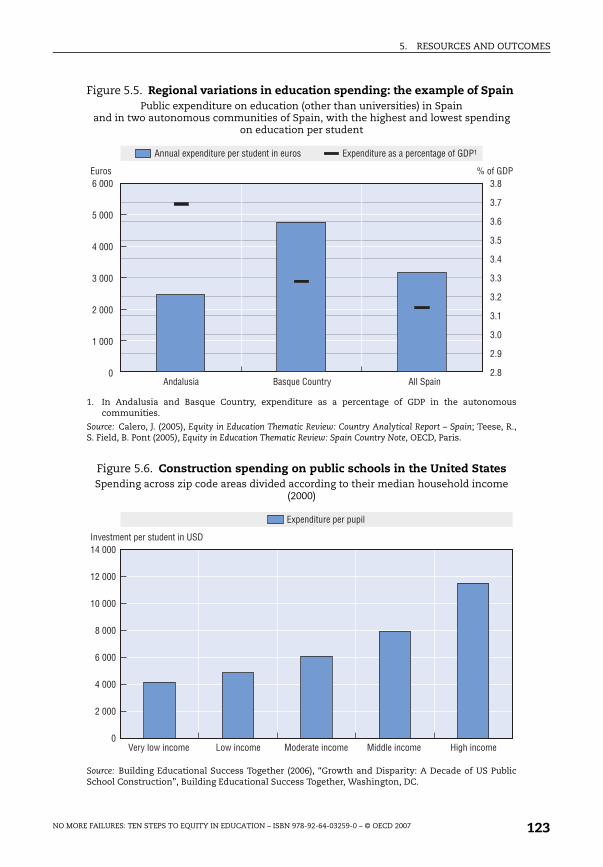
5. RESOURCES AND OUTCOMES
Figure 5.5. Regional variations in education spending: the example of Spain Public expenditure on education (other than universities) in Spain
and in two autonomous communities of Spain, with the highest and lowest spending on education per student
1. In Andalusia and Basque Country, expenditure as a percentage of GDP in the autonomouscommunities.
Source: Calero, J. (2005), Equity in Education Thematic Review: Country Analytical Report – Spain; Teese, R.,S. Field, B. Pont (2005), Equity in Education Thematic Review: Spain Country Note, OECD, Paris.
Figure 5.6. Construction spending on public schools in the United StatesSpending across zip code areas divided according to their median household income
(2000)
Source: Building Educational Success Together (2006), “Growth and Disparity: A Decade of US PublicSchool Construction”, Building Educational Success Together, Washington, DC.
7#��� ��>
��=
��7
���
���
���
��?
��>
��5
���
���
�#���
5#���
�#���
�#���
�#���
�
9����
'��� �#�/���������#���#�������#��#����� 9/���������# �# #������ ��#�6#�-��
'�� ����
:#�6#�-�
! �A��# ������ '��#�� ��
�5#���
��#���
��#���
>#���
7#���
5#���
�#���
�I���#���#���"�
�(���"���#���#�������#��#&�-
9/���������#���#�����
.��#���"� 1���� ��#���"� 1�����#���"� %���#���"�
NO MORE FAILURES: TEN STEPS TO EQUITY IN EDUCATION – ISBN 978-92-64-03259-0 – © OECD 2007 123
5. RESOURCES AND OUTCOMES
minority languages, special education, Saami education, socio-educationalservices (Eurydice).
Resources for individual learning weaknesses and disadvantaged areas
Chapter 4 described some ways of tackling individual learningdifficulties, including formative assessment, Reading Recovery and theFinnish approach to learning difficulties. In principle, extra resources tosupport such approaches might be directed to schools where attainment isweak. One rationale is that peer-group effects are important, so that the wholeschool requires extra help in the face of such clustering. But this approach hasa serious downside: poor schools will be rewarded with extra resources whileimproving schools will be punished by their removal (Demeuse, 2003).
Alternatively, resources can be directed to schools which draw pupilsfrom disadvantaged backgrounds or where the pupils speak a differentlanguage at home. There are three potential merits in this approach:
● it avoids the disincentive effect which would flow from giving moreresources to schools with poor results;
● it addresses the fairness dimension of equity – seeking to overcome thesocial background obstacles to educational success;
● it reduces the tendency of school choice regimes to concentrate studentsfrom poor social backgrounds in particular schools, since popular schoolswill be rewarded financially by accepting disadvantaged students.
Recent research reviews show that while effective teaching is particularlyhelpful for lower performers, they are often least likely to receive it (OECD,2005j; Darling-Hammond, 2000). In France and the United States, betterqualified teachers are less likely to teach in schools containing minority anddisadvantaged children (OECD, 2005j; Haycock and Peske, 2004; Hanusheket al., 2001). As mentioned in Chapter 3, social polarisation of schools creates arisk that teacher preferences may direct better teachers to middle classschools. This has been the experience with the French zones d’éducation
prioritaire (ZEP) (OECD, 2005j; Haycock and Peske, 2006; see also Chapter 4).
In some countries, this problem has been avoided simply becausedifferences between schools are small. In France, attempts are made to attractteachers to schools with disadvantaged intakes through special payments, butHanushek et al. (2001) estimate on the basis of Texas data that schools withdisadvantaged, Black or Hispanic students may need to pay 20% or even 50%more in salary than schools with white and Asian children to prevent teachersfrom leaving. This is obviously much more than any financial incentivesactually in place. The effect of class size reduction is also undermined ifteachers are not well prepared to work with more demanding students (Paul
NO MORE FAILURES: TEN STEPS TO EQUITY IN EDUCATION – ISBN 978-92-64-03259-0 – © OECD 2007124

5. RESOURCES AND OUTCOMES
Box 5.1. Directing resources to disadvantaged schoolsin France, Ireland and Belgium
In France, zones d'éducation prioritaire: Schools are given éducation prioritaire
status on the basis of the socio-economic characteristics of students and
learning outcomes. Mainly urban schools are involved. In 2005, 14% of all
primary schools, 21% of lower secondary and 11% of vocational upper
secondary institutions were so designated. An evaluation found that the zones
d'éducation prioritaire had not had a significant effect on school outcomes in
terms of transition, attainment and performance of students, and that
attending a disadvantaged school may be stigmatising for children, parents
and teachers. The student population in éducation prioritaire schools has also
become more socially homogenous over time because of an outflow of middle
class children. Teachers working in these schools are younger and less
experienced than those in other schools, and salaries and bonuses for teachers
absorb a big part of the extra funding allocated for disadvantaged schools.
In the light of these problems, reforms were adopted in 2006 by the
Ministry of Education with the creation of networks called “ambition réussite”.
Under these reforms, institutions will be screened and evaluated more
systematically, so that schools will more easily obtain or lose éducation
prioritaire status. There will be three levels of éducation prioritaire status
according to the level of school disadvantage. The teaching approach will be
more individualised, avoiding year repetition and offering more counselling
and guidance, especially at the end of compulsory school. Better progression
to higher stages of education will be encouraged through higher scholarships
for éducation prioritaire students with good results, and through better
connections with upper secondary and tertiary institutions. Links with
parents and the community will be reinforced. Éducation prioritaire students
will get help to find a job as they are more likely to face discrimination in the
labour market. Finally, teachers will be better-trained for work with these
students (through initial education and professional development) and
incentives will be put in place to attract them to éducation prioritaire
institutions (Bénabou, Kramarz and Prost, 2004; Ministry of National
Education, Higher Education and Research, France, 2004).
In Ireland, all schools seeking extra resources through the programme
Giving Children an Even Break are required to respect a set of principles:
preparation of a three-year development plan covering school policies to
encourage the continued enrolment of pupils most at risk of educational
disadvantage and support their retention within the school; collaborative
planning with local statutory and voluntary agencies to deliver services to young
people and their families; provision of suitable in-school and out-of-school
supports for pupils; better deployment of existing resources; new maximum
NO MORE FAILURES: TEN STEPS TO EQUITY IN EDUCATION – ISBN 978-92-64-03259-0 – © OECD 2007 125

5. RESOURCES AND OUTCOMES
and Troncin, 2004). Some countries encourage teachers to upgrade theirpractices through special funds for teacher professional development. Asobserved in Spain, schools rather than teachers may need to have the maininfluence over how funds for teacher professional development are spent(Teese et al., 2005). To tackle problems like these, in Belgium the achievementof goals by schools receiving extra resources is evaluated every three years byan independent body. If a school is evaluated negatively, it loses the additionalresources.
The formal designation of a school as deprived may cause a flight both ofteachers and pupils from that school. To avoid this outcome, one alternative isto tie funding in all schools to the population mix. This allows for a spectrumof schools and avoids labelling.
5.3. Defining outcomes to take account of equity
Policy targets for equity
Proponents of policy targets set in numerical terms argue that numericaltargets provide a powerful means of concentrating policy efforts on outcomes,particularly where national governments lack direct intervention powers andimplementation is decentralised or involves many actors and stakeholders.The announcement of a target sets a framework, gives precision to a policyobjective, and sets out clear expectations of what should be achieved. Suchtargets open leave the means of delivery. They are therefore very differentfrom policies articulated in terms of the means of delivery such as newinstitutions, practices, procedures or legal arrangements intended to achievesome objective.
Box 5.1. Directing resources to disadvantaged schoolsin France, Ireland and Belgium (cont.)
class sizes; the identification of learning, social and personal needs and
strategies to meet those needs; better involvement of parents in children's
education; and reporting, evaluation and accounting requirements
(Department of Education and Science, Ireland, n.d.).
In Belgium, two schemes provide additional resources to needy schools. At
primary and lower secondary level, schools receive extra funding if the school
population includes at least 10% of disadvantaged students identified by
socio-economic indicators. Upper secondary schools receive extra resources
if more than 25% of the enrolled population is doing badly according to
various criteria (Kim and Pelleriaux, 2004).
NO MORE FAILURES: TEN STEPS TO EQUITY IN EDUCATION – ISBN 978-92-64-03259-0 – © OECD 2007126

5. RESOURCES AND OUTCOMES
A number of OECD countries have adopted such targets for education. Ina recent OECD survey, Australia, Belgium (the Flemish and German-speakingparts), Finland, Germany, Greece, Mexico, Portugal, Slovakia, Sweden, and theUnited States reported that they had adopted results targets for primary andlower secondary schools (OECD, 2006f).
Targets give emphasis to implementation on the ground as well as formalpolicy and are sometimes combined with measures to increase local or schoolautonomy. The idea is that schools should have flexibility over the measuresthey employ and adapt them to local circumstances, but should remainaccountable for delivering certain outcomes. Some examples of equityeducation targets are given in Box 5.2.
Target-setting has been criticised on the grounds that it distorts practiceaway from broad but desirable objectives toward more limited measurablegoals. Gorard et al. (2002) argue that the targets for lifelong learning in theUnited Kingdom (defined in terms of the proportion of the adult populationwithout qualifications), were met through a redefinition of the adultpopulation denominator. However, for the goal of inclusion is particularlysuitable to target-setting: while overall objectives of education are debatable,the need for minimum standards – for example in numeracy and literacy –tend to be uncontroversial.
Box 5.2. Targets for equity in education
● UN millennium development goal: Eliminate gender disparity in primary and
secondary education by 2005 and at all levels by 2015.
● EU Lisbon targets for 2010: Not more than 10% of early school leavers in any
member state; less than 15.5% of 15-year-olds in the EU should be poor
readers.
● Government of Scotland: Halve the proportion of 16-to-19-year-olds who are
not in education, training or employment.
● French- and German-speaking Belgium: Every 14-year-old student should
obtain a certificate of basic education.
● French-speaking Belgium: 85% of 20-year-olds should have either a
vocational qualification or an upper secondary diploma.
● United States: Nearly double the number of minority (Hispanic, black, native
American) students taking a rigorous curriculum (Advanced Placement)
in 2012 when compared to the baseline of 2005.
Source: Eurydice, 2005; US Department of Education, 2007.
NO MORE FAILURES: TEN STEPS TO EQUITY IN EDUCATION – ISBN 978-92-64-03259-0 – © OECD 2007 127

5. RESOURCES AND OUTCOMES
Only a limited number of equity targets can reasonably be set; otherwisethey will tend to lose impact. While such targets need to reflect particularnational requirements and circumstances, international comparisons suggesttwo areas – both discussed earlier in this chapter – where countries mightusefully consider equity targets:
● First, there are huge disparities between countries in basic reading skills atage 15 and good evidence that school interventions, taking advantage ofinternational best practice, can make a large difference to outcomes. Thissuggests that countries might adopt challenging but reachable national targetsfor those skills, measured through PISA results. This is consistent with theoverall EU target that by 2010 there be fewer than 200 000 15-year-olds who arepoor readers.
● Second, dropout in the late teenage years is a serious challenge to equity.Again, dropout rates vary substantially from country to country, suggestingthat some countries may realistically aim for substantial improvements.The EU target is phrased in terms of early school leavers. An alternative wayof framing the target, as the government of Scotland has done, would aimto reduce the proportion of young people who are not in education, trainingor employment.
Targets for fairness are also important, but these may often reflectnational concerns, such as the need to improve the position of a particulardisadvantaged minority group or redress a gender imbalance.
Schools testing
Some targets and policy objectives can be expressed in terms ofadministrative data, such as participation and graduation rates. But one keyoutcome of educational systems is basic skills, typically measured throughschool tests – typically paper and pencil tests of skills like literacy andnumeracy. Such tests can be used for different purposes, including:
● at individual level, to aid the learning of students or to determine selectioninto tracks and streams; and
● at school or system level, to assess learning outcomes and teachingperformance.
If some of these purposes can be realised, the potential benefits of testingare very large. At the same time, the limitations and drawbacks of such testsare widely discussed. They only test a limited range of cognitive skills, andthey are a limited guide to school quality given that outcomes also dependheavily on variable school intakes. When the results of tests are given weightin administrative decisions – so-called high stakes testing – they can distortand damage schools’ policies. Pressure on schools and teachers to improveperformance may also distort and narrow teaching, what some describe as
NO MORE FAILURES: TEN STEPS TO EQUITY IN EDUCATION – ISBN 978-92-64-03259-0 – © OECD 2007128
5. RESOURCES AND OUTCOMES
“teaching to the tests”, or even encourage fraudulent marking or reportingresults (see Box 5.3).
One possible improvement to raw test scores as a measure of schoolquality is to allow for the social background of students and so assess theadded value of the school in terms of results taking account of thecharacteristics of the student population. This approach is being pursued inNorway (Hægeland et al., 2004). Sweden has a similar approach but only forcomparing grades, not test scores. The grades of 15-year-old pupils arecompared by taking account of the composition of pupils in the municipalitiesand schools regarding gender, foreign background, and education of the
Box 5.3. The impact of high stakes schools testingin the United States
In Texas (USA), since the introduction of tests at the beginning of the
nineties, the number of students passing has increased by 25% in a six-year
period, especially among disadvantaged students. But there is also evidence
of perverse incentives. Haney (2001) argues that the improvement in test
scores in Texas was made possible by increasing the retention rate of weaker
students – a form of student selection for testing. The rate of failure in ninth
grade completion for black students and Latinos was three times higher in
the late 1990s than in the late 1970s, while for whites the completion rate was
roughly the same.
Figlio and Getzler (2002) found that following the introduction of the
Assessment Test in Florida, low-performing students and students with low
SES were more likely to be classified as disabled (category exempted from
testing); poor performing students from high-poverty schools were more
likely to be reclassified into disabled categories than students with
comparable achievement from affluent schools. Poor schools with lower
performance face a higher risk of being sanctioned and therefore tend to be
more aggressive in getting rid of lower performers.
To reduce any perverse impact of testing the No Child Left Behind Act
foresees that for each measure of school performance, states must include
absolute targets that must be met by key subgroups of students (major racial/
ethnic groups, low-income students, students with disabilities and limited
English proficiency). Schools and districts must meet annual targets for each
student subgroup in the school, and must test 95% of students in each
subgroup, in order to make “adequate yearly progress”, and obtain federal
funding.
Source: Carnoy et al., 2001; Figlio and Getzler, 2002; Haney, 2001; Skrla et al., 2001.
NO MORE FAILURES: TEN STEPS TO EQUITY IN EDUCATION – ISBN 978-92-64-03259-0 – © OECD 2007 129

5. RESOURCES AND OUTCOMES
parents. England is moving to more complex value-added indicators, whichadjust for other pupil and year-group characteristics that have beenassociated with outcome differences (such as gender, ethnicity, deprivation,mobility between schools, special educational needs, and average priorattainment of year group), comparing individual students with others likethem. These indicators have been included in the published schoolperformance tables from 2006 (OECD, 2006g). The main drawback of suchvalue-added measures is that they can be difficult to interpret. This is partlybecause they are technically complex and partly because they remove effectsfrom the picture which might be challenged rather than taken for granted –such as the effect of poverty on school outcomes.
While standardised tests are a limited measure of pupil and schoolperformance, without them it could be more difficult to compare theperformance of boys and girls, poor and better-off children, urban and ruralpupils, or different countries and regions – or simply to identify slowerlearners requiring extra support in tuition. Test results are also an importantsource of information for school improvement, as teachers and schoolmanagers can establish whether standards are being reached and react todifferent results. In short, such tests are often the “least bad” option availablefor assessment.
In recognition of the value of testing, in a 2006 survey (OECD, 2006f), mostOECD countries reported the use of standardised tests, including Australia, theFrench-speaking part of Belgium, Denmark, Greece, Hungary, Iceland, Italy,Luxembourg, Mexico, the Netherlands, Norway, Portugal, the Slovak Republic,Sweden, Turkey and the United States. PISA, PIRLS and TIMSS provide keybenchmark data on the performance of countries.
Publication of school test results
If the general merits of testing are widely accepted, there is one issuewhich remains very controversial: whether test data for individual schoolsshould be used privately by teachers and educational administrators or shouldbe published. Only a minority of countries report that they regularly publishtest data at school level. These include Greece, Iceland, Italy, Mexico, theNetherlands and the United States. Box 5.4 gives information about practicesin some countries.
In favour of publication, it can be argued that pupils, parents and othercitizens have a legitimate interest in school performance and in the necessarydialogue on school improvement. Well-informed and open debate on schoolquality may drive innovation and improvement. Conversely, secrecy can hideweaknesses and remove the pressure on poorly performing schools toimprove. In addition, where school choice is seen as desirable, data can guide
NO MORE FAILURES: TEN STEPS TO EQUITY IN EDUCATION – ISBN 978-92-64-03259-0 – © OECD 2007130

5. RESOURCES AND OUTCOMES
parents in choosing schools for their children, either by choosing where theylive in relation to a school’s catchment area, or more directly by seeking aplace for their child in the school of their choice. Competition to attractchildren, it is argued, will drive improvements in school quality.
Conversely, publication can damage equity if the media transforms evena sophisticated range of data about schools into crude league tables of so-called “good schools” and “bad schools”. Public labelling as a bad school candamage morale among teachers, and sap the confidence of pupils andparents, making bad schools worse. In addition, some good schools will haveweak results simply because their pupils are disadvantaged. Educated andwell-off parents actively seeking good schools for their children and shunningbad schools may reinforce a polarization into good and bad schools, increasinginequity. The evidence in Chapter 3 showing how school choice is linked toincreased social separation between schools is relevant.
Box 5.4. Different approaches to reporting of school-level tests across OECD countries
Finland: School evaluation information is used mainly to help schools to
improve. Evaluation is carried out in a sample of schools. A municipality may
pay to have its schools tested. Schools and municipalities participating in
evaluation receive their own results alongside information about the national
average. The information is not published at school-level.
Denmark: Tests are used to support learning of individual students, but
data remain confidential at school level. Each year a national performance
profile will be published at national level, so that the teacher will be able to
compare the results of a given class with the general achievement level for
Denmark.
Norway: The Norwegian national tests are currently being revised. The
new system includes tests in reading literacy (Norwegian and English) and
numeracy, in grades 5 and 8. Access to school-level results requires a
password (available for the respective schools, municipalities etc.).
Sweden: Information has been publicly available since 2001. It includes
data on school performance, basic system statistics (number of pupils and
teachers, costs, etc.), quality inspection reports, municipality and schools’
own quality reports, information on special state grants to particular
municipalities and finally added value.
Belgium (French-speaking): National test results are used to improve
school quality and equity between schools. Access to information is given to
a restricted number of institutions and persons.
Source: Haarder, 2006; Mortimore et al., 2005; Nicaise et al., 2005; OECD, 2006f.
NO MORE FAILURES: TEN STEPS TO EQUITY IN EDUCATION – ISBN 978-92-64-03259-0 – © OECD 2007 131

5. RESOURCES AND OUTCOMES
There are powerful arguments on both sides of this debate, bearingdifferently in different countries and circumstances (see, for example,Visscher et al., 2000). However, once data are collected and available at schoollevel, it may be difficult to avoid publication. Publication of school-level resultsmay pose risks to equity for the reasons set out above. But modern democraticsocieties have tended to be sceptical of the idea that government or itsappointed experts can be entrusted with information while the general publiccannot be so trusted. So the idea that test data should be used by educationauthorities and school heads and teachers, but not made generally available,becomes hard to defend at a political level. In some countries, including someNordic countries, freedom of information legislation may make it unlawful tokeep such information secret from the public (Mortimore et al., 2005).
While there are arguments for and against publication of school testresults, the important issue is how to respond to the test results, as they canprovide clear information about equities and inequities throughout thesystem. Education systems need to plan carefully how to manage and respondto the public debate which will follow publication. But most importantly,education systems need to be ready to give energetic support to those schoolswith weak results – using the data to enhance equity by bringing all schools upto a level, rather than allowing the pressures of league tables to damage equityby polarising school quality.
In many countries, aggregate increases in educational expenditure will behard to justify in terms of their contribution to equity although they maycontribute to economic growth. This highlights the importance of targetingeducation expenditure – both across education sectors and across regions andinstitutions – to ensure that it contributes to equity. National targets for equityoutcomes can help.
5.4. Summary conclusions and recommendations
Step 8: Provide strong education for all, giving priority to early childhood provision and basic schooling
Evidence
● Public provision of education can foster equity when it counterbalancespoor home circumstances at the outset of children's lives. But it mayincrease inequity when it provides a common resource harvested by thosewho are best prepared for it.
● Education expenditure is shifting between sectors in many countries; insome the expansion of tertiary education is a large expenditure pressure.While countries need a high quality well-resourced tertiary educationsystem, public expenditure on tertiary education tends to be regressive;private sources can be tapped to fund this sector.
NO MORE FAILURES: TEN STEPS TO EQUITY IN EDUCATION – ISBN 978-92-64-03259-0 – © OECD 2007132
5. RESOURCES AND OUTCOMES
● Good quality affordable early childhood education and care has large long-term benefits, particularly for disadvantaged children.
● Grants to poor families for school-age children may reduce dropout at uppersecondary level.
Policy recommendations
● There is strong evidence that early childhood education and care, alongsidepublic policy measures to improve the lives of young children, is the highestequity priority. If fees for early childhood education and care are applied atall, they should be moderate and remitted for those too poor to pay.
● Basic education remains an equity priority because it includes the entirecohort. Within this sector, particular attention should be given to efforts tosustain the performance of those with learning difficulties.
● When budgets are limited, public expenditure on tertiary education will rarelybe an equity priority. Countries charging fees for early childhood educationand care but not for tertiary education need to review their policies.
● Countries where grants to families for school age children are tied to schoolperformance need to review their policies, since this may in fact encouragedropout.
Step 9: Direct resources to students and regions with the greatest needs
Evidence
● Within countries, regional autonomy in spending may cause disparities inthe level of provision, unless it is balanced by mechanisms to redistributeresources to poorer regions.
● Many countries have special schemes to direct additional resources toschools or school areas serving disadvantaged pupils. Such schemes needto ensure that the extra resources are used to assist those most in need andavoid labelling certain schools as disadvantaged, which may discouragestudents, teachers and parents.
● In many countries, less experienced teachers are working in “difficult”schools.
Policy recommendations
● Countries need adequate mechanisms to redistribute resources and minimiseregional inequities of provision, so that minimum standards are met everywhere;
● Extra resources need to be channelled through schools to help disadvantagedstudents. This should help overcome the disadvantaging effect of socialbackground, help to tackle poor performance without rewarding it anddiscourage schools from “selecting out” children from disadvantaged
NO MORE FAILURES: TEN STEPS TO EQUITY IN EDUCATION – ISBN 978-92-64-03259-0 – © OECD 2007 133
5. RESOURCES AND OUTCOMES
backgrounds. The stigma arising from labelling of particular schools as “fordisadvantaged children” should be avoided.
● Experienced teachers are an important resource for disadvantaged schools.There should be incentives for them to work in these schools.
Step 10: Set concrete targets for more equity – particularly related to low school attainment and dropout
Evidence
● Numerical targets can be a useful policy lever for equity in education, byarticulating policy in terms of what is to be achieved rather than in terms offormal processes or laws. A number of countries have adopted targets forequity in education.
● International comparisons with the best performing countries suggest thatsome countries could significantly reduce the number of dropouts andstudents failing to acquire basic skills.
● National testing of individual student performance on basic skills is afundamental tool to measure both individual performance and theperformance of elements of the education system. But test results arelimited in what they measure, and results for schools depend on schoolintake as well as school quality.
● Many countries believe that the publication of results at school level isdesirable or politically and/or legally inevitable. A minority of countries aretesting but seeking to avoid publication. Some countries are pursuing“value-added” measures of school quality which take account of schoolintake.
Policy recommendations
● Countries should consider adopting a small number of numerical targets forequity, particularly for reducing the number of school-leavers with poorbasic skills and the number of early school dropouts.
● Education systems need to plan carefully how to manage and respond tothe public debate which follows publication of school-level test results andgive strong support to those schools with weak results – using the data to bringall schools up to a level, rather than allowing the pressures of league tablesto polarise school quality.
References
Bainbridge, J., M. Meyers, S. Tanaka and J. Waldfogel (2005), “Who Gets an EarlyEducation? Family Income and the Enrollment of Three-to-Five-Year-Olds from1968 to 2000”, Social Science Quarterly, Vol. 86, No. 3.
NO MORE FAILURES: TEN STEPS TO EQUITY IN EDUCATION – ISBN 978-92-64-03259-0 – © OECD 2007134
5. RESOURCES AND OUTCOMES
Barnett, W. (1995), “Long-Term Effects of Early Childhood Programs on Cognitive andSchool Outcomes”, The Future of Children, Long-term Outcomes of Early ChildhoodPrograms, Vol. 5, No. 3, Princeton Brookings, pp. 25-50.
Bénabou, R., F. Kramarz and C. Prost (2004), “Zone d’éducation prioritaire: quels moyens pourquels résultats?”, Économie et statistique, No. 380, 2004, http://media.education.gouv.fr/file/35/4/2354.pdf.
Building Educational Success Together (2006), “Growth and Disparity: A Decade ofUS Public School Construction”, Building Educational Success Together,Washington, DC, www.edfacilities.org/pubs/GrowthandDisparity.pdf.
Calero, J. (2005), Thematic Review of Equity in Education: Country Analytical Report –Spain.
Cameron, S. and J. Heckman (1999), “The Dynamics of Educational Attainment forBlacks, Hispanics and Whites”, Working Paper 7294, National Bureau of EconomicResearch, Cambridge, MA.
Carneiro, P. and J. Heckman (2002), “The Evidence on Credit Constraints in Post-Secondary Schooling”, Institute for the Study of Labor (IZA) Discussion Paper, No. 518.
Carneiro, P. and J. Heckman (2003), “Human Capital Policy”, Working Paper 9495,National Bureau of Economic Research, Cambridge, MA.
Carnoy, M., S. Loeb and T. Smith (2001), “Do High State Test Scores in Texas Make forBetter High School Outcomes?”, Research Report RR-047, Consortium for PolicyResearch in Education, University of Pennsylvania.
Chiswick, B. and N. DebBurnam (2004), “Pre-School Enrollment: An Analysis byImmigrant Generation”, Centre for Research and Analysis of Migration DiscussionPaper, No. 04/04.
Commission of the European Communities (2006), Communication from theCommission to the Council and to the European Parliament, Efficiency and Equity inEuropean Education and Training Systems, SEC(2006)1096.
Council of the European Union (2006), Conclusions of the Council and the Representativesof the Governments of the Member States, Meeting within the Council, on Efficiency andEquity in Education and Training, 15 November 2006.
Crouch, D., “School Meals Around the World”, 30 March 2005, Guardian Unlimited.
Cunha, F., J. Heckman, L. Lochner and D. Masterov (2005), “Interpreting the Evidenceon Life Cycle Skill Formation”, Working Paper 11331, National Bureau of EconomicResearch, Cambridge MA.
Darling-Hammond, L. (2000), “Teacher Quality and Student Achievement: A Review ofState Policy and Evidence”, Education Policy Analysis Archives, Vol. 8, No. 1, http://epaa.asu.edu/epaa/v8n1/.
Dearden, L., C. Emmerson, C. Frayne and C. Meghir (2006), Education Subsidies and SchoolDrop-Out Rates, Center for the Economics of Education, London School of Economics.
De la Fuente, A. (2003), Human Capital in a Global and Knowledge-Based Economy,Part II: Assessment at the EU Country Level, Employment and European SocialFund, European Commission.
Demeuse, M. (2003), “Réduire les différences : oui mais lesquelles?”, in La Discriminationpositive en France et dans le monde, Actes du colloque internationale organisé les 5 et6 mars à Paris, CNDP éditeur, pp. 87-102.
NO MORE FAILURES: TEN STEPS TO EQUITY IN EDUCATION – ISBN 978-92-64-03259-0 – © OECD 2007 135
5. RESOURCES AND OUTCOMES
Department of Education and Science, Ireland (n.d.), Giving Children an Even Break,www.education.ie, accessed 2 March 2007.
Dickens, W., I. Sawhill and J. Tebbs (2006), "The Effects of Investing in Early Educationon Economic Growth", Policy Brief 153, The Brookings Institution, Washington.
Eurydice (2005), Key Data on Education in Europe 2005, www.eurydice.org/portal/page/portal/Eurydice/showPresentation?pubid=052EN.
Eurydice, The information Network on Education in Europe, www.eurydice.org.
Figlio, D. and L. Getzler (2002), “Accountability, Ability and Disability: Gaming theSystem”, Working Paper 9307, National Bureau of Economic Research, Cambridge,MA.
Goodman, A. and B. Sianesi (2005), “Early Education and Children's Outcomes: HowLong Do the Impacts Last?”, Fiscal Studies Journal Articles, Vol. 26, No. 4, pp. 513-548.
Gorard, S., G. Rees and N. Selwyn (2002), “The ‘Conveyor Belt Effect’: A Re-assessmentof the Impact of National Targets for Lifelong Learning”, Oxford Review of Education,Vol. 28, No. 1, Carfax Publishing.
Grubb, N., S. Field, H. Marit Jahr and J. Neumüller (2005), Equity in Education ThematicReview: Finland Country Note, OECD, Paris, www.oecd.org/dataoecd/49/40/36376641.pdf.
Haarder, B. (2006), “A Culture of Evaluation in Danish Schools”, http://eng.uvm.dk/evaluation.htm?menuid=15.
Hægeland, T., L. Kirkebøen, O. Raaum and K. Salvanes (2004), “Marks Across LowerSecondary Schools in Norway”, Report 2004/11, Statistics Norway.
Haney, W. (2001), “Commentary. Response to Skrla et al., The Illusion of EducationalEquity in Texas: a Commentary on ‘Accountability for Equity’”, International Journalof Leadership in Education, Vol. 4, No. 3, Taylor and Francis, pp. 267-275.
Hanushek, E., J. Kain and S. Rivkin (1998), “Teachers, Schools and AcademicAchievement”, Working Paper, 6691, National Bureau of Economic Research,Cambridge, MA.
Hanushek, E., J. Kain and S. Rivkin (2001), “Why Public Schools Lose Teachers”,Working Paper 8599, National Bureau of Economic Research, Cambridge, MA.
Haycock, K. and H. Peske (2006), “Teaching Inequality: How Poor and MinorityStudents Are Shortchanged on Teacher Quality”, A Report and Recommendationsby the Education Trust.
Heckman, J. (1999), “Policies to Foster Human Capital”, Working Paper 7288, NationalBureau of Economic Research, Cambridge, MA.
Hoffman, N., M.L. Ferreira, S. Field and B. Levin (2005), Equity in Education ThematicReview: Hungary Country Note, OECD, Paris.
Jacob, B. (2002), “Accountability, Incentives and Behavior: The Impact of High-StakesTesting in the Chicago Public Schools”, Working Paper 8968, National Bureau ofEconomic Research, Cambridge, MA.
Kim, T. and K. Pelleriaux (2004), Equity in the Flemish Educational System: CountryAnalytical Report, University of Antwerp.
Koertz, D. (2006), “Limitations in the Use of Achievement Tests as Measures ofEducators’ Productivity”, The Journal of Human Resources, Vol. 37, No. 4, JSTOR,University of Wisconsin Press, pp. 752-777.
NO MORE FAILURES: TEN STEPS TO EQUITY IN EDUCATION – ISBN 978-92-64-03259-0 – © OECD 2007136
5. RESOURCES AND OUTCOMES
Leseman, P. (2002), Early Childhood and Care for Children from Low-income or MinorityBackgrounds, OECD, Paris.
Levacic, R. and A. Vignoles (2000), “Researching the Links between School Resourcesand Student Outcomes in the UK: A Review of Issues and Evidence”, EducationEconomics, Vol. 10, No. 3, Routledge.
McCabe, B.. and E. Smyth (2000), “The Educational Situation of DisadvantagedChildren” in I. Nicaise (ed.) The Right to Learn: Educational Strategies for SociallyExcluded Youth in Europe, The Policy Press, Bristol, p. 19.
Ministry of Education, Finland (2004), Equity in Education: Country Analytical Report –Finland.
Ministry of Education, Russian Federation (2005), Equity in Education: Country AnalyticalReport – Russia.
Ministry of National Education, Higher Education and Research (2004), France, L’équitédans l’éducation en France: Rapport de base national présenté dans le cadre de l’activité del’OCDE, Paris.
Mortimore, P., S. Field and B. Pont (2005), Equity in Education Thematic Review: NorwayCountry Note, OECD, Paris, www.oecd.org/dataoecd/10/6/35892523.pdf.
Nicaise, I., G. Esping-Andersen, B. Pont and P. Tunstall (2005), Equity in EducationThematic Review: Sweden Country Note, OECD, Paris, www.oecd.org/dataoecd/10/5/35892546.pdf.
OECD (2005b), Extending Opportunities: How Active Social Policy Can Benefit Us All, OECD,Paris.
OECD (2005j), Teachers Matter: Attracting, Developing and Retaining Effective Teachers,OECD, Paris.
OECD (2006c), Education at a Glance: OECD Indicators 2006, OECD, Paris.
OECD (2006d), Starting Strong II: Early Childhood Education and Care, OECD, Paris.
OECD (2006f), Public Spending Efficiency: Questionnaire on the Pre-Primary, Primary andLower-Secondary Education Sector, OECD/ECO, unpublished.
OECD (2006g), Proposal for an OECD Project on the Development of Value-AddedModels in Education Systems, OECD, available on OLIS (EDU/EC/CERI[2006]14).
Opheim, V. (2004), Equity in Education, Country Analytical Report – Norway, EconomicResearch in Norway (NIFU).
Paul, J.-J. and T. Troncin (2004), “Les apports de la recherche sur l’impact du redoublementcomme moyen de traiter les difficultés scolaires au cours de la scolarité obligatoire”,Haut Conseil de l’Évaluation de l’École, No. 14.
Renaut, A. (2002), Que faire des universités, Bayard, Paris.
Rothstein, R. (2005), “The Limits of Testing”, American School Board Journal,February 2005.
Rouse, C. (2000), “School Reform in the 21st Century: A Look as the Effect of Class Sizeand School Vouchers and the Academic Achievement on Minority Students”,Working Paper 440, Princeton University.
Skrla, L., J. Scheurich, J. Johnson and J. Koschoreck (2001), “Accountability for Equity:Can State Policy Leverage Social Justice”, International Journal of Leadership inEducation, Vol. 4, No. 3, Taylor and Francis, pp. 237-260.
NO MORE FAILURES: TEN STEPS TO EQUITY IN EDUCATION – ISBN 978-92-64-03259-0 – © OECD 2007 137

5. RESOURCES AND OUTCOMES
Sylva, K., E. Melhuish, P. Sammons, I. Siraj-Blatchford, B. Taggart and K. Elliot (2003)The Effective Provision of Pre-School Education (EPPE) Project: Findings from the Pre-schoolPeriod, Summary of Findings. Institute of Education/Surestart, www.ioe.ac.uk/cdl/eppe/pdfs/eppe_brief2503.pdf.
Teese, R., P. Aasen, S. Field and B. Pont (2005), Equity in Education Thematic Review: SpainCountry Note, OECD, Paris, www.oecd.org/dataoecd/41/39/36361409.pdf.
US Department of Education (2007), Strategic Plan for Fiscal Years 2007-2012, USDepartment of Education, Washington, DC.
Visscher A., S. Karsten, T. de Jong and R. Bosker (2000), “Evidence on the Intended andUnintended Effects of Publishing School Performance Indicators”, Evaluation andResearch in Education, Vol. 14, No. 3 and 4, Multilingual Matters and Channel ViewPublications.
NO MORE FAILURES: TEN STEPS TO EQUITY IN EDUCATION – ISBN 978-92-64-03259-0 – © OECD 2007138

ISBN 978-92-64-03259-0
No More Failures: Ten Steps to Equity in Education
© OECD 2007
Chapter 6
Groups at Risk: The Special Case of Migrants and Minorities
This chapter concentrates on the difficult educational pathways ofmigrants and minorities. These pathways often reflect how the twodimensions of equity overlap: many immigrant groups tend to havelower performance compounded by low socio-economicbackground. Approaches to overcoming these hurdles includestrengthening early childhood education and care for these groups,avoiding streaming immigrants into special education, improvinglanguage training and strengthening teacher professionaldevelopment to deal with multiculturalism. Measures to reducediscrimination in the labour market can also increase incentives forimmigrants to obtain a good education.
139

6. GROUPS AT RISK: THE SPECIAL CASE OF MIGRANTS AND MINORITIES
6.1. The migration context
Migration is increasing. World wide, between 1990 and 2000, the numberof people living outside their country of birth grew by nearly half to 175 million(OECD, 2006e). Given global economic inequalities and diminishing costs oftransport and information, this growth is likely to continue. Although animportant subgroup of migrants is highly skilled, many have low skills and aresocially disadvantaged. Such disadvantage, along with cultural and ethnicdifferences, can create many potential divisions and inequities between thehost society and newcomers. This chapter looks mainly at migrants, but alsodeals with one minority group, the Roma, whose position was important insome of the countries participating in the review.
Immigration policy and immigrant experience varies significantly acrosscountries:
● Australia, Canada, New Zealand and the United States are countries ofimmigration (Figure 6.1), with immigration policies favouring the betterqualified (OECD, 2005k, Table II A2.4).
● In the 1960s and 1970s, European countries such as Austria, Denmark,Germany, Luxembourg, Norway, Sweden and Switzerland recruitedtemporary immigrant workers, who then settled permanently. Immigrationhas increased again over the last ten years, except in Denmark andGermany. In Austria, Germany and Switzerland, and to a lesser extent inSweden, immigrants are less likely to have an upper secondary educationbut more likely to have a tertiary diploma. (OECD, 2005k, Table II A2.4). Thisreflects two very different types of migrants – the low-skilled and the highlyqualified.
● Moreover in Belgium, France, the Netherlands and the United Kingdom,many immigrants come from former colonies and already know thelanguage of the host country.
● Countries such as Finland, Greece, Ireland, Italy, Portugal, the RussianFederation and Spain have recently experienced a sharp growth inmigration inflows. In Spain, the pace of immigration increased more thantenfold between 1998 and 2004 (OECD 2006h, Table A.1.1; OECD, 2005c,Table II A2.4).
In most countries, immigrants tend to have lower educational attainmentthan native populations. However in Australia, Canada, Ireland, Korea,
NO MORE FAILURES: TEN STEPS TO EQUITY IN EDUCATION – ISBN 978-92-64-03259-0 – © OECD 2007140

6. GROUPS AT RISK: THE SPECIAL CASE OF MIGRANTS AND MINORITIES
Mexico, New Zealand and Norway, those born abroad tend to be bettereducated. This may be a result of different migration patterns as well asvarying educational opportunities.1
Discussion of policy towards migrants often contrasts a multiculturalapproach, which builds on recognition and sometimes celebration of culturaland ethnic diversity, with an assimilationist view encouraging immigrants tomerge into a common host society culture. In reality, any clear-cutcategorisation of country policies is difficult. For example, France, whichformulated its migration policy on an assimilationist approach, has recentlygiven more recognition to cultural diversity.2
Immigrants and minorities can face discrimination in their hostcountries. In many OECD countries, immigrants are more at risk ofunemployment and are more often in low-skilled and low-paid positions
Figure 6.1. Immigrant populations and their educational attainment (2002, 2004)
All those over 15
1. 2003 – year of reference for the indicator “Foreign born population as a % of total population”.2. 2002 – year of reference for the indicator “Foreign born population as a % of total population”.3. 2001 – year of reference for the indicator “Foreign born population as a % of total population”.4. 2000 – year of reference for the indicator “Foreign born population as a % of total population”.5. 1999 – year of reference for the indicator “Foreign born population as a % of total population”.6. Less than upper secondary includes “unspecified educational attainment”.7. Educational levels are for people aged 16 to 74.
Source: OECD (2005k), Trends in International Migration: Annual Report 2004, OECD, Paris; OECD (2006h),International Migration Outlook: Annual Report 2006, OECD, Paris.
:7�
��
5�
��
��
��
�
.�/�"+����
'���� ��
����,��� ���
���#$� � ��
� �
'�����
���" ��
&�����#�� ����
�������
!�����"�
��� ��
������� ���
������
�� ��
&�����#)�����"=
���� �5
������ �
-��" �)�� ��
,��#*���+���
���( )#*���+��
���� ��7
%��� ���
� ��3��)��
��� ��5
1�/��0���
������ ��#�6#6�������+���#����#����#�� �#�����#����� ��#��� ���������� ��#�6#6�������+���#����#����� ��#��� �����������#+���#����� ����# �# #:#�6# #��� �#����� ����F#���5
NO MORE FAILURES: TEN STEPS TO EQUITY IN EDUCATION – ISBN 978-92-64-03259-0 – © OECD 2007 141

6. GROUPS AT RISK: THE SPECIAL CASE OF MIGRANTS AND MINORITIES
(Carneiro et al., 2005; Garner-Moyer (n.d.); ILO, 2005; OECD, 2005e; OECD, 2006i).In France, research has shown that those of North African origin are much lesslikely to be invited for an interview even when they have better qualificationsand stronger professional experience (Amadieu, 2005). Newcomers who arevisibly foreign tend to be less welcomed than those whose appearance allowsthem to blend in (Cutler et al., 2005a; Cutler et al., 2005b; Pitkanen et al., 2002;Alesina et al., 2001). The historical context of migration also makes adifference. According to Schmid (2001), in the United States politicalimmigrants such as Cubans and Vietnamese have been better received thanimmigrants escaping poverty – for instance Haitians and Mexicans. Oneimplication is that alongside education measures, policies are needed totackle high levels of labour market discrimination to improve opportunitiesand increase the incentives to obtain a good education.
In many countries, a broad legal and policy framework designed to tacklediscrimination and racism supports efforts to deliver equity in education.In 2004, Finland adopted anti-discrimination legislation that applies todiscrimination in employment, education and training. Norway has set up thePlan of Action to Combat Racism and Discrimination, including a requirementfor public enterprises to interview at least one applicant of immigrantbackground in recruitment exercises. France has reinforced its anti-discrimination policy focusing particularly on institutional discrimination(OECD, 2006h).
Box 6.1. Should data be collected on ethnic minorities?
Different approaches to ethnic minorities affect data collection:
● Countries more multicultural in approach, such as Canada, routinely ask
citizens to identify their ethnic origin, while others, such as France and
Hungary, avoid enquiring about ethnic origin as a matter of principle.
Proponents of data collection argue that good ethnic data provide solid
evidence on which to base policy. Opponents argue that classifying by
ethnicity damages human dignity and may lead to discrimination.
● In Hungary, the expert visiting team recommended collecting data on
Roma people but on a basis agreed with Roma communities. The team
argued that, in the absence of such data, it would be very difficult to help
Roma people and to evaluate the results of interventions. In Sweden, the
visiting team recommended collection of data broken down by ethnicity,
language and religion in order to increase awareness of the needs of
disadvantaged groups. In fact, collection of these data is currently illegal in
Sweden.
Source: Garner-Moyer, n.d.; Hoffman et al., 2005; Nicaise et al., 2005.
NO MORE FAILURES: TEN STEPS TO EQUITY IN EDUCATION – ISBN 978-92-64-03259-0 – © OECD 2007142

6. GROUPS AT RISK: THE SPECIAL CASE OF MIGRANTS AND MINORITIES
6.2. Immigrant disadvantage in education
Migration pathways
The immigrant experience is highly variable. In the United States forexample, while most immigrant groups improve their position with time,some less fortunate groups experience declining health, worse schoolachievement and declining aspirations (Suarez-Orozco, 2000; Schmid, 2001). Inthe United Kingdom, education has been a social elevator for immigrantgroups, but progress is slower for Pakistanis and Bangladeshis, whileimmigrants from India equalise their occupational chances with their nativecounterparts in just one generation (Platt, 2006). Performance can dependmore on socio-economic factors than on immigrant background. The Economist(28 October 2006) observes that poor, British-born whites are among theweakest learners. In some disadvantaged districts (Barking and Dagenham),the percentage of white children getting good exam results at the end ofcompulsory school (“five good GCES”) is only 32%, lower than that of blacks(39%) and Asians (52%). In addition, immigrants expecting to return to theircountry of origin can be less likely to invest in new skills which would only berelevant in the host country (Chiswick and Miller, 1994; van Tubergen and vande Werfhorst, 2006; Crul and Vermeulen, 2005).
Participation of migrants and minorities in early childhood education
As discussed in Chapter 5, participation in early childhood education andcare (ECEC) is particularly helpful for disadvantaged children. It also providesan environment in which oral skills can be acquired in a second languagebefore learning to read and write. Despite this, in many countries, immigrantsand other minorities are less likely to participate in ECEC. In Norway in 2004,72% of all children aged 1 to 5 participated in ECEC, but among those withimmigrant background only 58% did so (Mortimore et al., 2005). Culturalbarriers are sometimes involved. Turkish and Moroccan immigrants in theNetherlands tend to prefer to have young children (under 3) at home(Leseman, 2002). Immigrants from Vantaa (near Helsinki in Finland) look atschool favourably, but care for young children is considered as a responsibilityof the mother (OECD, 2006d).
Performance at school
PISA 2003 provides information on 15-year-old first-generationimmigrants (those who were born abroad) and second-generation immigrantstudents (those whose parents were born abroad). The limitation of these data
NO MORE FAILURES: TEN STEPS TO EQUITY IN EDUCATION – ISBN 978-92-64-03259-0 – © OECD 2007 143
6. GROUPS AT RISK: THE SPECIAL CASE OF MIGRANTS AND MINORITIES
is that they do not distinguish between different immigrant groups’ outcomes.The main findings are:
● First-generation and second-generation immigrant students perform lesswell in mathematics, science and reading than their native counterparts,except in Canada.
● In most countries, students who use at home a language different from thelanguage of instruction perform less well at school.
● In general, second-generation students tend to outperform first-generationstudents, but in Belgium (Flanders), Denmark, Germany and New Zealand,second-generation students lag behind native and first-generationstudents. This might imply a worrying entrenchment of educationweaknesses, but it could also simply indicate that more recent immigrantsarrived with a better education, perhaps because of selective immigrationpolicies (OECD, 2006e, Tables 3.1 and 3.2).
● Factors such as socio-economic status, knowledge of the language ofinstruction and the age at migration explain some part of immigrantstudents’ outcomes from education in most OECD countries, but in somecountries an unexplained difference in achievement between immigrantand native students persists. As noted earlier, in Sweden immigrantbackground characteristics do not fully explain the difference betweenmathematics achievement of first-generation students and that of nativestudents, and in Belgium (Flanders), Denmark and Germany, a substantialpart of second-generation underperformance remains unexplained byfactors linked to social background. (OECD, 2006e, Table 3.5).
● First-generation and second-generation students generally have higherlevels of interest and motivation in mathematics than native students andreport more positive attitudes towards schooling, especially afteraccounting for students’ background and performance. However both first-and second-generation students have less confidence in their capacity todeal with mathematics tasks (OECD, 2006d).
This leaves some puzzling questions. Community characteristics,including the cultural value placed on education, are often used to explaindifferences in educational attainment between immigrant groups – forinstance the high levels of educational attainment in some Asiancommunities in the United States and elsewhere (Zhou, 2005). In othercontexts, poorly understood differences in schooling and its response todiversity may be a factor. This merits further research.
Segregation in special education
Some migrant and minority groups are more likely to be diagnosed withspecial needs and placed in special institutions catering for those children. For
NO MORE FAILURES: TEN STEPS TO EQUITY IN EDUCATION – ISBN 978-92-64-03259-0 – © OECD 2007144

6. GROUPS AT RISK: THE SPECIAL CASE OF MIGRANTS AND MINORITIES
example, in the United States, black students are nearly 2.5 times more likelythan whites to be identified as mentally retarded and more likely to beidentified as emotionally disturbed (Donovan and Cross, 2002; Losen andOrfield, 2002), although Hispanic students are not overrepresented in specialeducation. In some cantons of Switzerland, children with immigrantbackgrounds are overrepresented in special education; more than half thechildren in special classes and schools are not of Swiss nationality (CoradiVellacott and Wolter, 2004). In Belgium (Flanders), children with foreignnationality are transferred to special education faster than their Flemishcolleagues (Kim and Pelleriaux, 2004). In Hungary, about 40% of Roma childrenhave been labelled as “mildly mentally disabled” compared with 9% of allHungarian children under the age of 14 (Hoffman et al., 2005).3 However,decisions taken in 2007 identifying individual children as “mildly mentallydisabled” are to be reviewed.
Typically, an assessment of a child’s ability and behavior determineseligibility for special education. While this may reflect a problem with anorganic origin, it may also be strongly affected by the child’s environment(Cunha et al., 2005, Leseman, 2002) and disadvantaged children may catch upif they are provided with good quality learning.4 Potential explanations foroverrepresentation of minorities in special education include weakerschooling, lack of knowledge of the language and the school system, culturallydifferent behavior and negative stereotyping (Donovan and Cross, 2002).
Separate streams and institutions for migrant and minority children canbe counter-productive. There is evidence that well designed interventions forchildren with learning and behavior problems, provided in mainstreamclassrooms, improve outcomes for all students (Donovan and Cross, 2002).Hanushek et al. (1998), in a study of the special education programme in Texas,argued that provision of regular classroom instruction alongside specialisedindividualised support for students with special needs boosts achievement ofstudents with learning and behavioral troubles and does not detract from therest of students. Immigrant children with weak achievement sometimes learnfaster in normal classes than in special education (Coradi Vellacott andWolter, 2004). US research suggests that certain minority groups are morelikely to receive inadequate services in special institutions and the benefitsthey reap from special education are smaller than that of their whitecounterparts (National Center for Learning Disabilities, n.d.). The expert teamvisiting Hungary recommended abandoning using the catch-all category “milddegree of mental disability” and placing all children in mainstream classesand schools except those who are severely mentally and physicallyhandicapped (Hoffman et al., 2005). In Finland, Norway, Spain and Sweden,special education institutions are reserved for children with serious organic ormental disorders – about 2% of a population (Leseman, 2002). Other children
NO MORE FAILURES: TEN STEPS TO EQUITY IN EDUCATION – ISBN 978-92-64-03259-0 – © OECD 2007 145

6. GROUPS AT RISK: THE SPECIAL CASE OF MIGRANTS AND MINORITIES
with different needs attend normal schools that provide them with specificaid within mainstream education.
Concentration at school level
Sometimes the concentration of migrants and minorities in particularschools mirrors residential patterns, but it may also reflect the outcomes ofselection and choice in school systems. Such concentration appears todamage attainment in some contexts but not in others (OECD, 2006e,Figure 3.7). In Sweden, students in classes and schools with many migrantstudents tend to have weaker performance and poor knowledge of Swedish.Without special measures to assist learning, a high concentration of studentswith poor knowledge of the language of instruction may disturb learning.
In most countries, schools attended by immigrant students tend to be inpoorer communities. However in Australia and Canada, the schools attendedby immigrant students tend to be in better-off communities, and theconcentration of immigrant students in these schools does not appear todamage their (very good) performance (Dornkers and Levels, 2006).
The geographical segregation of some minority groups is linked topoverty. In the United States, black and Hispanic students are more than threetimes as likely as whites to be in high-poverty schools and twelve times aslikely to be in schools where nearly all students are poor (90-100%). Suchschools may also have fewer resources (NAACP Legal Defense and EducationalFund, Inc. et al., 2005).
Transition in education and labour market discrimination
Students from many minority groups are more likely to end up in lowstatus tracks and streams, be more at risk of dropout, and be under-represented among students in tertiary education. Often social backgroundexplains much of this. For example, it largely explains why immigrants inSweden and Denmark are less likely to stay in school for upper secondaryeducation. Conversely, poor home environment cannot entirely explain thehigh dropout rate of second generation students at vocational uppersecondary schools in Denmark, where 60% of immigrant children fail tocomplete vocational education compared to 32% of native children (Szulkinand Jonsson, 2002; Colding, 2005). In Norway, transition to higher education ishigher for minority students who have managed to complete upper secondaryeducation than for majority students with the same socio-economicbackground (Støren, 2005). This finding has been corroborated by a study byFekjaer and Birkelund (2006) that shows that there is a strong polarization ineducational attainment among immigrants. Among students of immigrantbackground, the majority complete only compulsory and/or vocational
NO MORE FAILURES: TEN STEPS TO EQUITY IN EDUCATION – ISBN 978-92-64-03259-0 – © OECD 2007146
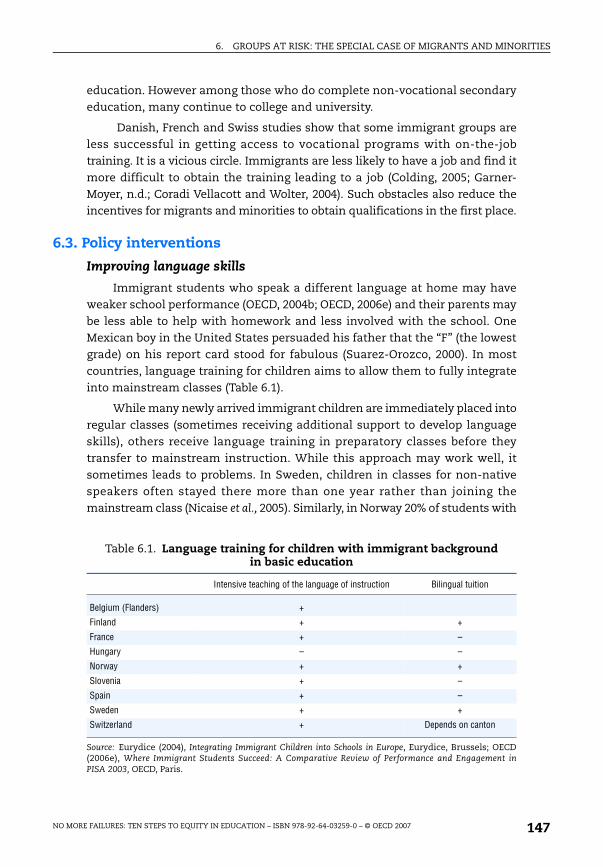
6. GROUPS AT RISK: THE SPECIAL CASE OF MIGRANTS AND MINORITIES
education. However among those who do complete non-vocational secondaryeducation, many continue to college and university.
Danish, French and Swiss studies show that some immigrant groups areless successful in getting access to vocational programs with on-the-jobtraining. It is a vicious circle. Immigrants are less likely to have a job and find itmore difficult to obtain the training leading to a job (Colding, 2005; Garner-Moyer, n.d.; Coradi Vellacott and Wolter, 2004). Such obstacles also reduce theincentives for migrants and minorities to obtain qualifications in the first place.
6.3. Policy interventions
Improving language skills
Immigrant students who speak a different language at home may haveweaker school performance (OECD, 2004b; OECD, 2006e) and their parents maybe less able to help with homework and less involved with the school. OneMexican boy in the United States persuaded his father that the “F” (the lowestgrade) on his report card stood for fabulous (Suarez-Orozco, 2000). In mostcountries, language training for children aims to allow them to fully integrateinto mainstream classes (Table 6.1).
While many newly arrived immigrant children are immediately placed intoregular classes (sometimes receiving additional support to develop languageskills), others receive language training in preparatory classes before theytransfer to mainstream instruction. While this approach may work well, itsometimes leads to problems. In Sweden, children in classes for non-nativespeakers often stayed there more than one year rather than joining themainstream class (Nicaise et al., 2005). Similarly, in Norway 20% of students with
Table 6.1. Language training for children with immigrant backgroundin basic education
Intensive teaching of the language of instruction Bilingual tuition
Belgium (Flanders) +
Finland + +
France + –
Hungary – –
Norway + +
Slovenia + –
Spain + –
Sweden + +
Switzerland + Depends on canton
Source: Eurydice (2004), Integrating Immigrant Children into Schools in Europe, Eurydice, Brussels; OECD(2006e), Where Immigrant Students Succeed: A Comparative Review of Performance and Engagement inPISA 2003, OECD, Paris.
NO MORE FAILURES: TEN STEPS TO EQUITY IN EDUCATION – ISBN 978-92-64-03259-0 – © OECD 2007 147
6. GROUPS AT RISK: THE SPECIAL CASE OF MIGRANTS AND MINORITIES
immigrant background never leave the special language training class. Tofacilitate the transition into ordinary classes of immigrant children receivingspecial training in Norwegian, Norway has developed a new level-differentiatedcurriculum and standardised tools for charting language proficiency. The use ofthe new curriculum is optional for municipalities. In Switzerland, even after twoyears in special beginners’ classes, most children with migration backgroundare still not deemed capable of integrating into normal school classes; they havea lower than average level of cognitive development and knowledge of theofficial language. Extra funding for separate classes sometimes distortslearning, encouraging schools to retain pupils in these classes beyond the pointwhere it is helpful to them (Mortimore et al., 2005; Coradi Vellacott and Wolter,2004). By contrast, in Spain newly arrived migrant children who don’t speakSpanish typically only spend a few months in separate “welcome classes”before integrating into mainstream classes – apparently without great difficulty.
A few countries pursue a bilingual approach, teaching both in themajority language and in the mother tongue.5 In Sweden, mother-tongueassistance and instruction in preschool is legally guaranteed, followingSwedish research suggesting that mother-tongue teaching improvesperformance and outcomes, especially in early childhood (Nicaise et al., 2005).However, while 10 years ago, 60% of all multilingual children at preschoolreceived mother tongue assistance, now only 13% do so.
Regardless of the approach, many countries struggle to meet risingdemand for language training, in the face of a shortage of qualified teachersspecialised in teaching the official language as a second language and a lack ofappropriate teaching materials.
Training measures for adult immigrants
Most countries provide language training for adult immigrants (Table 6.2). Insome countries, knowledge of the national language and/or participation inlanguage courses has become a condition for state aid and support. Some
Box 6.2. Swedish programme for Roma children
In Sweden, through the Nytorpsskolan programme, links have been forged
between Roma families and the local school through the recruitment of Roma
teachers and staff. A special Roma class offers Swedish in the afternoon.
Course content is adapted to Roma culture: examples relating to horse-
raising are used in mathematics classes and traditional embroidery
handicrafts are taught to girls. By liaising with parents, the Roma teachers
have reduced dropout to zero (Nicaise et al., 2005, p. 47).
NO MORE FAILURES: TEN STEPS TO EQUITY IN EDUCATION – ISBN 978-92-64-03259-0 – © OECD 2007148
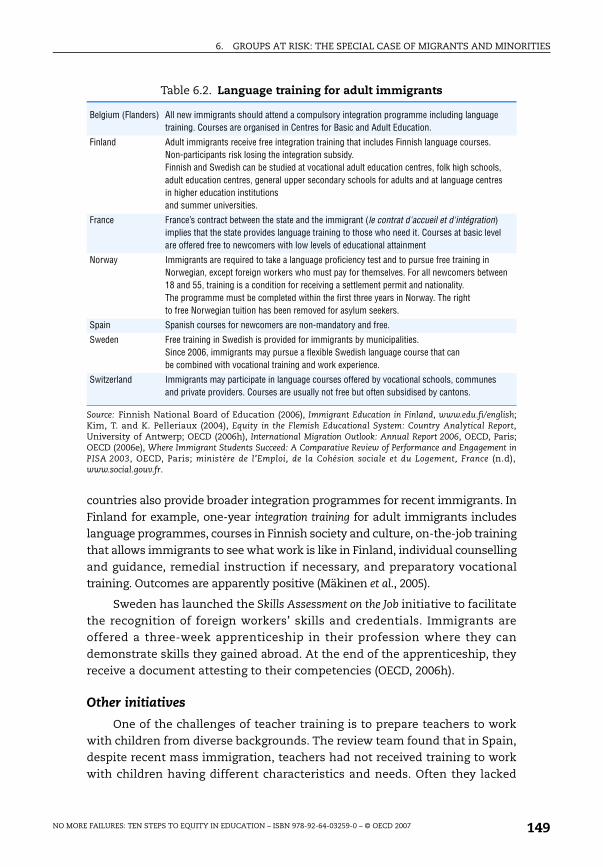
6. GROUPS AT RISK: THE SPECIAL CASE OF MIGRANTS AND MINORITIES
countries also provide broader integration programmes for recent immigrants. InFinland for example, one-year integration training for adult immigrants includeslanguage programmes, courses in Finnish society and culture, on-the-job trainingthat allows immigrants to see what work is like in Finland, individual counsellingand guidance, remedial instruction if necessary, and preparatory vocationaltraining. Outcomes are apparently positive (Mäkinen et al., 2005).
Sweden has launched the Skills Assessment on the Job initiative to facilitatethe recognition of foreign workers’ skills and credentials. Immigrants areoffered a three-week apprenticeship in their profession where they candemonstrate skills they gained abroad. At the end of the apprenticeship, theyreceive a document attesting to their competencies (OECD, 2006h).
Other initiatives
One of the challenges of teacher training is to prepare teachers to workwith children from diverse backgrounds. The review team found that in Spain,despite recent mass immigration, teachers had not received training to workwith children having different characteristics and needs. Often they lacked
Table 6.2. Language training for adult immigrants
Belgium (Flanders) All new immigrants should attend a compulsory integration programme including language training. Courses are organised in Centres for Basic and Adult Education.
Finland Adult immigrants receive free integration training that includes Finnish language courses. Non-participants risk losing the integration subsidy. Finnish and Swedish can be studied at vocational adult education centres, folk high schools, adult education centres, general upper secondary schools for adults and at language centresin higher education institutionsand summer universities.
France France’s contract between the state and the immigrant (le contrat d'accueil et d'intégration) implies that the state provides language training to those who need it. Courses at basic levelare offered free to newcomers with low levels of educational attainment
Norway Immigrants are required to take a language proficiency test and to pursue free training in Norwegian, except foreign workers who must pay for themselves. For all newcomers between 18 and 55, training is a condition for receiving a settlement permit and nationality.The programme must be completed within the first three years in Norway. The right to free Norwegian tuition has been removed for asylum seekers.
Spain Spanish courses for newcomers are non-mandatory and free.
Sweden Free training in Swedish is provided for immigrants by municipalities. Since 2006, immigrants may pursue a flexible Swedish language course that can be combined with vocational training and work experience.
Switzerland Immigrants may participate in language courses offered by vocational schools, communes and private providers. Courses are usually not free but often subsidised by cantons.
Source: Finnish National Board of Education (2006), Immigrant Education in Finland, www.edu.fi/english;Kim, T. and K. Pelleriaux (2004), Equity in the Flemish Educational System: Country Analytical Report,University of Antwerp; OECD (2006h), International Migration Outlook: Annual Report 2006, OECD, Paris;OECD (2006e), Where Immigrant Students Succeed: A Comparative Review of Performance and Engagement inPISA 2003, OECD, Paris; ministère de l’Emploi, de la Cohésion sociale et du Logement, France (n.d),www.social.gouv.fr.
NO MORE FAILURES: TEN STEPS TO EQUITY IN EDUCATION – ISBN 978-92-64-03259-0 – © OECD 2007 149

6. GROUPS AT RISK: THE SPECIAL CASE OF MIGRANTS AND MINORITIES
practical experience, and being good subject specialists did not necessarilymake them effective teachers. “In schools whose pupils are drawn from25 different nationalities and where 8 to 10 languages can be heard in thecorridors, the question is not the academic standards of a new secondaryteacher (for this should be a given), but whether that teacher is able to packagehis or her knowledge into flexible programmes that recognise diversity ofstudents.” (Teese et al., 2005, p. 38)
Particularly where large scale immigration is a recent phenomenon,teachers need professional development to address the issue of culturaldiversity (OECD, 2005j). Participation in professional development variessubstantially across countries, with high rates in the Nordic countries andrather low rates among upper secondary teachers in Belgium (Flanders),France and Spain (OECD, 2004d, Table 3.11b). Yet students whose teachersparticipated in professional development on working with students withdifferent cultural and linguistic background obtain better results. A minimumrequirement for continuous professional development, linking participationto promotion or recertification and also to school development prioritiesmight be helpful (OECD, 2005j).
While many countries teach civic values and respect for differentcultures, it is often unclear how best to encourage these forms of behaviour.Sweden has developed a website, Swedkid, a project funded by the EuropeanUnion and involving many countries. It links anti-racism, technology andeducation. Swedkid seeks to characterise and exemplify the process ofeveryday racism in society. Minority children also receive gender education.Separate groups of boys and girls are accompanied by a counsellor with theobjective of encouraging mutual respect and a sense of gender equality(Nicaise et al., 2005).
6.4. Summary conclusions and recommendations
Step 7: Respond to diversity and provide for the successful inclusion of migrants and minorities within mainstream education6
Evidence
● Success in both education and employment varies widely betweenimmigrant and minority groups and between different countries.
● Minority groups are, in many cases, less likely than others to participate inearly childhood education and care, more likely to be in special educationand more likely to drop out or end up in low status tracks and streams.
● For some “visible minority” groups, labour market discrimination issometimes extensive. This limits employment prospects and reduces theincentives to obtain qualifications.
NO MORE FAILURES: TEN STEPS TO EQUITY IN EDUCATION – ISBN 978-92-64-03259-0 – © OECD 2007150
6. GROUPS AT RISK: THE SPECIAL CASE OF MIGRANTS AND MINORITIES
● In most countries, immigrant students of first and second generation tendto perform less well than their native counterparts in the PISA assessmentsof mathematics, science and reading, while second-generation studentstend to outperform first-generation students. Analysis suggests that muchbut not all of this is explained by social background factors.
Policy recommendations
● Early childhood education and care is helpful for disadvantaged children andprovides a strong environment in which to learn a second language. Specialmeasures may encourage participation by the children of immigrants.
● Where immigrant and minority groups are disproportionately streamed intospecial education institutions attention needs to be given to a) the risk ofcultural bias in the diagnosis and b) whether separate schooling is in thebest interests of the students involved.
● Newly arrived immigrant children often need special language training, butfunding mechanisms and the approach selected to deliver this trainingshould not encourage the isolation of such children from mainstreamclasses after an initial period of at most one year.
● Particularly in countries where immigration has risen sharply, teachersneed professional development to deal with new demands on matters such assecond language learning, a multicultural curriculum and teaching fortolerance and anti-racism.
Notes
1. Comparison of educational attainment among immigrants between countriesmay be affected by different definitions of immigrant population and differentmethods of sampling used by countries. For example, data for Norway does notaccount for immigrants with Norwegian citizenship. According to StatisticsNorway, “western immigrants usually hold a high educational level, but onlyrarely change their citizenship. For non-western immigrants, it is opposite – theeducational attainment is lower and they become Norwegian citizens more often”.(Statistics Norway)
2. For more information, see FASILD, “Plan stratégique 2004-2006”, www.fasild.fr/ressources/files/plan_strategique/Plan_strategique_2004-2005-2006.pdf.
3. Numbers for Hungary are approximate, as no official data by ethnic origin areavailable.
4. According to Leseman (2002), around 10-20% of all young children in OECDcountries show learning problems that are rooted in their background.
5. The research does not provide clear evidence whether bilingual teaching has apositive or negative impact on immigrants’ outcomes (Leseman, 2002).
6. Step 7: “Respond to diversity and provide for the successful inclusion of migrantsand minorities within mainstream education” is included in the Policy
NO MORE FAILURES: TEN STEPS TO EQUITY IN EDUCATION – ISBN 978-92-64-03259-0 – © OECD 2007 151

6. GROUPS AT RISK: THE SPECIAL CASE OF MIGRANTS AND MINORITIES
Recommendations and the Executive Summary under the heading “Fair andinclusive practices” (see pp. 9 and 19).
References
Alesina, A., E. Glaeser and B. Sacerdote (2001), “Why Doesn’t The US Have a European-Style Welfare State?”, Discussion Paper, No. 1933, Harvard Institute of EconomicResearch.
Amadieu, J.-F. (2005), “Discriminations à l’embauche – De l’envoi du CV à l’entretien”, Étuderéalisée par Adia/Paris I, Observatoire des Discriminations, April 2005.
Borjas, G. (2006), “Making it in America: Social Mobility in the Immigrant Population”,Working Paper 12088, National Bureau of Economic Research, Cambridge, MA.
Calero, J. (2005), Thematic Review. Equity in Education: Country Analytical Report – Spain.
Carneiro, P., J. Heckman and D. Masterov (2005), “Labour Market Discrimination andRacial Differences in Premarket Factors”, Institute for Labour Market Policy EvaluationWorking Paper No. 2005:3, , Uppsala, Sweden.
Chiswick, B. and P. Miller (1994), “The Determinants of Post-Immigration Investmentsin Education”, Economics of Education Review, Vol. 13, No. 2, Elsevier, pp. 163-177.
Chiswick, B. and N. DebBurman (2003), “Educational Attainment: Analysis byImmigrant Generation”, Institute for the Study of Labor Discussion Paper No. 731,Bonn.
Colding, B. (2005), “A Dynamic Analysis of Educational Progression: ComparingChildren of Immigrants and Native Danes”, Academy for Migration Studies inDenmark Working Paper Series 37/2005, Aalborg University.
Coradi Vellacott, M. and S. Wolter (2004), Equity in the Swiss Education System:Dimensions, Causes and Policy Responses. National Report from Switzerland contributingto the OECD’s Review of Equity in Education, Swiss Coordination Center for Researchin Education.
Crul, M. and H. Vermeulen, “Immigration and Education: The Second Generation inEurope”, paper presented at the conference Immigration in a Cross National Context,Bourglister, Luxembourg, 21-22 June 2005, www2.fmg.uva.nl/imes/books/CrulVermeulen2004.pdf.
Cunha, F., J. Heckman, L. Lochner and D. Masterov (2005), “Interpreting the Evidenceon Life Cycle Skill Formation”, Working Paper 11331, National Bureau of EconomicResearch, Cambridge MA.
Cutler, D., E. Glaeser and J. Vigdor (2005a), “Ghettos and the Transmission of EthnicCapital” in G. Loury, T. Modood and S. Teles (eds.), Ethnicity and Social Mobility in theUnited States and Great Britain, Cambridge University Press, Cambridge.
Cutler, D., E. Glaeser and J. Vigdor (2005b), “Is the Melting Pot Still Hot? Explaining theResurgences of Immigrant Segregation”, Working Paper 11295, National Bureau ofEconomic Research, Cambridge MA.
Donovan, M.S. and C. Cross (eds.) (2002), Minority Students in Special and Gifted Education,National Research Council, National Academies Press, Washington.
Eurydice (2004), Integrating Immigrant Children into Schools in Europe, Eurydice, Brussels.
NO MORE FAILURES: TEN STEPS TO EQUITY IN EDUCATION – ISBN 978-92-64-03259-0 – © OECD 2007152
6. GROUPS AT RISK: THE SPECIAL CASE OF MIGRANTS AND MINORITIES
FASILD (Fonds d'action et de soutien pour l'intégration et la lutte contre lesdiscriminations) (2004), Plan stratégique 2004-2006, Conseil d’administration du19 janvier 2004, FASILD, Paris, www.fasild.fr/ressources/files/plan_strategique/Plan_strategique_2004-2005-2006.pdf.
Fekjaer, S. and G. Birkelund (2006), “Immigration and Education in Welfare State: AMultilevel Analysis of the Influence of the Ethnic Composition of Upper SecondarySchools on Norwegian Students’ Educational Achievement and EducationalAttainment”, Sociology Working Paper, No. 2006-04, Department of Sociology,University of Oxford, Oxford.
Finnish National Board of Education (2006), Immigrant Education in Finland, www.edu.fi/english.
Garner-Moyer, H. (n.d.), Discrimination et emploi : revue de la littérature, DARES, Paris.
Grubb, N., S. Field, H. Marit Jahr and J. Neumüller (2005), Equity in Education ThematicReview: Finland Country Note, OECD, Paris, www.oecd.org/dataoecd/49/40/36376641.pdf.
Hanushek, E., J. Kain and S. Rivkin (1998), “Does Special Education Raise AcademicAchievement for Students with Disabilities?”, Research Working Paper 6690, NationalBureau of Economic Research, Cambridge MA.
Hoffman, N., M.L. Ferreira, S. Field and B. Levin (2005), Equity in Education ThematicReview: Hungary Country Note, OECD, Paris.
International Labour Organization (ILO) (2005), Discrimination Testing Based on ILOMethodology, ILO, Geneva.
Kim, T. and K. Pelleriaux (2004), Equity in the Flemish Educational System: CountryAnalytical Report, University of Antwerp.
Leseman, P. (2002), Early Childhood and Care for Children from Low-income or MinorityBackgrounds, OECD, Paris.
Losen, D. and G. Orfield (2002), “Racial Inequity in Special Education” in D. Losen andG. Orfield (eds.), Racial Inequity in Special Education, Harvard Education Press,Cambridge MA, p. 336.
Mäkinen, A.-K., N. Niklas, A. Tuominen and P. Ussikylä (2005), “Is Integration TrainingWorthwhile? A Study of Integration Training Programmes for Immigrants”, LabourPolicy Studies 267.
Ministère de l’Emploi, de la Cohésion sociale et du Logement, France (n.d.),www.social.gouv.fr.
Mortimore, P., S. Field and B. Pont (2005), Equity in Education Thematic Review: NorwayCountry Note, OECD, Paris, www.oecd.org/dataoecd/10/6/35892523.pdf.
NAACP Legal Defense and Educational Fund, Inc., Civil Rights Project at HarvardUniversity, Center for the Study of Race and Law at the University of VirginiaSchool of Law (2005), “Looking to the Future: Voluntary K-12 School Integration”,www.naacpldf.org/content/pdf/voluntary/Voluntary_K-12_School_Integration_ Manual.pdf.
National Center for Learning Disabilities (n.d.), Minority Students in Special Education,National Center for Learning Disabilities, New York, www.ncld.org/index.php?option=content&task=view&id=272.
Nicaise, I., G. Esping-Andersen, B. Pont and P. Tunstall (2005), Equity in EducationThematic Review: Sweden Country Note, OECD, Paris, www.oecd.org/dataoecd/10/5/35892546.pdf.
NO MORE FAILURES: TEN STEPS TO EQUITY IN EDUCATION – ISBN 978-92-64-03259-0 – © OECD 2007 153
6. GROUPS AT RISK: THE SPECIAL CASE OF MIGRANTS AND MINORITIES
OECD (2004b), Learning for Tomorrow’s World: First Results from PISA 2003, OECD, Paris.
OECD (2004d), Completing the Foundation for Lifelong Learning: An OECD Survey of UpperSecondary Schools, OECD, Paris.
OECD (2005e), From Education to Work: A Difficult Transition for Young Adults with LowLevels of Education, OECD, Paris
OECD (2005j), Teachers Matter: Attracting, Developing and Retaining Effective Teachers,OECD, Paris.
OECD (2005k), Trends in International Migration: Annual Report 2004, OECD, Paris.
OECD (2006d), Starting Strong II: Early Childhood Education and Care, OECD, Paris.
OECD (2006e), Where Immigrant Students Succeed: A Comparative Review of Performanceand Engagement in PISA 2003, OECD, Paris.
OECD (2006h), International Migration Outlook: Annual Report 2006, OECD, Paris
OECD (2006i), Migration in OECD Countries: Labour Market Impact and Integration Issues,Working Party No. 1 on Macroeconomic and Structural Policy Analysis, OECD, Paris.
Opheim, V. (2004), Equity in Education, Country Analytical Report – Norway, EconomicResearch in Norway (NIFU).
Pitkanen, P., D. Kalekin-Fishman and G. Verma (eds.) (2002), Education and Immigration:Settlement Policies and Current Challenges, RoutledgeFalmer, London and New York.
Schmid, C. (2001), “Educational Achievement, Language-Minority Students, and theNew Second Generation”, Sociology of Education, Extra Issue: Current of Thought:Sociology of Education at the Dawn of the 21st Century, Vol. 74, AmericanSociological Association, Washington, pp. 71-87.
Statistics Norway (n.d.), www.ssb.no/english.
Støren, L.A. (2005), “Ungdom med innvandrerbakgrunn i norsk utdanning – ser vi enfremtidig suksesshistorie” in Utdanning 2005 – deltakelse og kompetanse.
Platt, L., (2006), “Moving up? Intergenerational Social Class Mobility in England andWales and the Impact of Ethnicity, Migration and Religious Affiliation”, papersubmitted for the Conference on Immigration: Impacts, integration andintergenerational issues to be held at UCL, 29-31 March 2006.
Suarez-Orozco, C. (2000), “Identities Under Siege: Immigration Stress and Social Mirroringamong the Children of Immigrants”, in M. Suarez-Orozco and A. Robben (eds.), Cultureunder Siege, Collective Violence and Trauma, Cambridge University Press, Cambridge.
Szulkin, R. and J.O. Jonsson, “Ethnic Segregation and Educational Outcomes in SwedishComprehensive Schools: A Multilevel Analysis”, Stockholm University, Stockholm.
Teese, R., P. Aasen, S. Field and B. Pont (2005), Equity in Education Thematic Review: SpainCountry Note, OECD, Paris, www.oecd.org/dataoecd/41/39/36361409.pdf.
Van Tubergen, F. and H. van de Werfhorst (2006), “Post-Immigration Investments inEducation Working papers”, paper prepared for the meeting of the ResearchCommittee on Social Stratification and Mobility of the International SociologicalAssociation in Nijmegen, Netherlands, 11-14 May 2006, http://users.fmg.uva.nl/hvandewerfhorst/PostimmSchoolingRC28.pdf.
Zhou, M. and S. Kim (2006), “Community Forces, Social Capital, and EducationalAchievement: The Case of Supplementary Education in the Chinese and KoreanImmigrant Communities”, Harvard Educational Review, Vol. 76, No. 1, pp. 1-26.
NO MORE FAILURES: TEN STEPS TO EQUITY IN EDUCATION – ISBN 978-92-64-03259-0 – © OECD 2007154

6. GROUPS AT RISK: THE SPECIAL CASE OF MIGRANTS AND MINORITIES
Biographical Information
The authors are analysts in the Education and Training Policy Division of OECD'sDirectorate for Education.
Simon Field has a Ph.D. in philosophy and social policy from the University ofCambridge and an M.Sc. in Economics from Birkbeck College London. With the OECDsince 2001, he has worked on issues including equity in education and human capitaland is currently leading the activity on vocational education and training. He is fromNorthern Ireland. ([email protected])
Ma gorzata Kuczera has a M.Sc. in political science from Jagellonian University,Poland and a Masters in International Administration from the University Paris I,Sorbonne-Panthéon. With the OECD since 2006, she has worked on issues of equity ineducation and vocational education and training. She is from Poland.([email protected])
Beatriz Pont has a B.A in political science from Pitzer College, Claremont,California and an M.Sc. of International Affairs from Columbia University and was aresearch fellow at the Institute of Social Science in Tokyo University. With the OECDsince 1999, she has worked on issues including equity in education, adult learning andadult skills, and ICT in education and is currently leading the activity on improvingschool leadership. She is from Spain. ([email protected])
For more information on equity in education, www.oecd.org/edu/equity/equityineducation.
ł
NO MORE FAILURES: TEN STEPS TO EQUITY IN EDUCATION – ISBN 978-92-64-03259-0 – © OECD 2007 155

OECD PUBLICATIONS, 2, rue André-Pascal, 75775 PARIS CEDEX 16
PRINTED IN FRANCE
(91 2007 04 1 P) ISBN 978-92-64-03259-0 – No. 55657 2007

�����������������������-:HSTCQE=UXWZ^U:
The full text of this book is available on line via this link: www.sourceoecd.org/education/9789264032590
Those with access to all OECD books on line should use this link: www.sourceoecd.org/9789264032590
SourceOECD is the OECD’s online library of books, periodicals and statistical databases. For more information about this award-winning service and free trials, ask your librarian, or write to us at [email protected].
ISBN 978-92-64-03259-0 91 2007 04 1 P
Education and Training Policy
No More Failures TEN STEPS TO EQUITY IN EDUCATIONNo More Failures challenges the assumption that there will always be failures and dropouts, those who can’t or won’t make it in school. In fact, initiatives in many countries demonstrate that it is possible to successfully tackle school failure and dropout rates – and to reduce the huge social cost of adults without basic skills. This book offers a valuable comparative perspective on how different countries have handled equity in education. Among the issues it explores:
• tracking, streaming and academic selection;
• school choice;
• secondary education structures and second chance programmes;
• grade repetition;
• links between school and home;
• early childhood education;
• resource allocation;
• targets for equity;
• the special needs of migrants and minorities.
The book identifies three key areas for delivering equity in education: the design of education systems, classroom practices and resourcing. It proposes ten concrete policy measures, backed by evidence, on how to reduce school failure and dropout rates. It will be of special interest to policy makers, school leaders, teachers and parents.
Ed
ucation and
Training P
olicy
No
Mo
re Failures
Education and Training Policy
No More Failures TEN STEPS TO EQUITY IN EDUCATION
By Simon Field, Małgorzata Kuczera, Beatriz Pont