No - spincotech.com · Gel permeation chromatography (GPC) for the analysis of hydrophobic polymers...
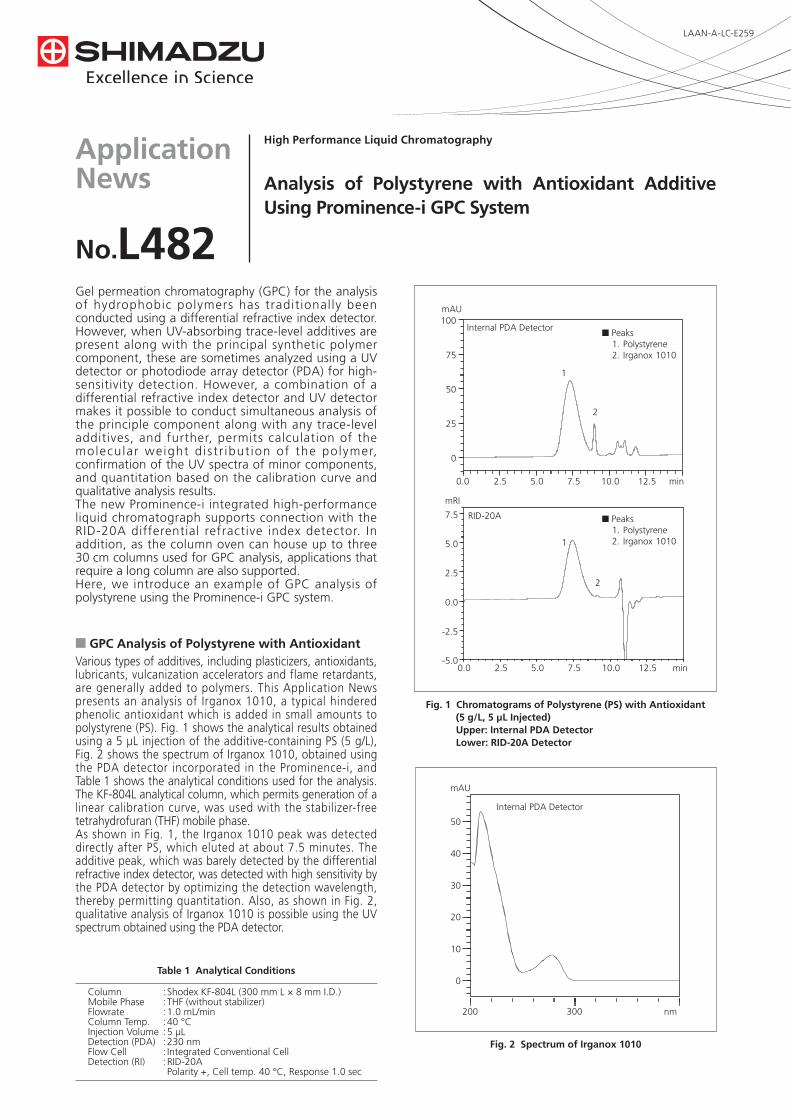
Application News No. L482 High Performance Liquid Chromatography Analysis of Polystyrene with Antioxidant Additive Using Prominence-i GPC System LAAN-A-LC-E259 Gel permeation chromatography (GPC) for the analysis of hydrophobic polymers has traditionally been conducted using a differential refractive index detector. However, when UV-absorbing trace-level additives are present along with the principal synthetic polymer component, these are sometimes analyzed using a UV detector or photodiode array detector (PDA) for high- sensitivity detection. However, a combination of a differential refractive index detector and UV detector makes it possible to conduct simultaneous analysis of the principle component along with any trace-level additives, and further, permits calculation of the molecular weight distribution of the polymer, confirmation of the UV spectra of minor components, and quantitation based on the calibration curve and qualitative analysis results. The new Prominence-i integrated high-performance liquid chromatograph supports connection with the RID-20A differential refractive index detector. In addition, as the column oven can house up to three 30 cm columns used for GPC analysis, applications that require a long column are also supported. Here, we introduce an example of GPC analysis of polystyrene using the Prominence-i GPC system. n GPC Analysis of Polystyrene with Antioxidant Various types of additives, including plasticizers, antioxidants, lubricants, vulcanization accelerators and flame retardants, are generally added to polymers. This Application News presents an analysis of Irganox 1010, a typical hindered phenolic antioxidant which is added in small amounts to polystyrene (PS). Fig. 1 shows the analytical results obtained using a 5 µL injection of the additive-containing PS (5 g/L), Fig. 2 shows the spectrum of Irganox 1010, obtained using the PDA detector incorporated in the Prominence-i, and Table 1 shows the analytical conditions used for the analysis. The KF-804L analytical column, which permits generation of a linear calibration curve, was used with the stabilizer-free tetrahydrofuran (THF) mobile phase. As shown in Fig. 1, the Irganox 1010 peak was detected directly after PS, which eluted at about 7.5 minutes. The additive peak, which was barely detected by the differential refractive index detector, was detected with high sensitivity by the PDA detector by optimizing the detection wavelength, thereby permitting quantitation. Also, as shown in Fig. 2, qualitative analysis of Irganox 1010 is possible using the UV spectrum obtained using the PDA detector. Column : Shodex KF-804L (300 mm L × 8 mm I.D.) Mobile Phase : THF (without stabilizer) Flowrate : 1.0 mL/min Column Temp. : 40 °C Injection Volume : 5 µL Detection (PDA) : 230 nm Flow Cell : Integrated Conventional Cell Detection (RI) : RID-20A Polarity +, Cell temp. 40 °C, Response 1.0 sec Table 1 Analytical Conditions Fig. 1 Chromatograms of Polystyrene (PS) with Antioxidant (5 g/L, 5 µL Injected) Upper: Internal PDA Detector Lower: RID-20A Detector Fig. 2 Spectrum of Irganox 1010 0.0 2.5 5.0 7.5 10.0 12.5 min 0 25 50 75 100 mAU 2 1 0.0 2.5 5.0 7.5 10.0 12.5 min -5.0 -2.5 0.0 2.5 5.0 7.5 mRI 2 1 ■ Peaks 1. Polystyrene 2. Irganox 1010 ■ Peaks 1. Polystyrene 2. Irganox 1010 Internal PDA Detector RID-20A 200 300 nm 0 10 20 30 40 50 mAU Internal PDA Detector
-
Upload
nguyenthuy -
Category
Documents
-
view
224 -
download
0
Transcript of No - spincotech.com · Gel permeation chromatography (GPC) for the analysis of hydrophobic polymers...
ApplicationNews
No.L482
High Performance Liquid Chromatography
Analysis of Polystyrene with Antioxidant Additive Using Prominence-i GPC System
LAAN-A-LC-E259
Gel permeation chromatography (GPC) for the analysis of hydrophobic polymers has traditionally been conducted using a differential refractive index detector. However, when UV-absorbing trace-level additives are present along with the principal synthetic polymer component, these are sometimes analyzed using a UV detector or photodiode array detector (PDA) for high-sensitivity detection. However, a combination of a differential refractive index detector and UV detector makes it possible to conduct simultaneous analysis of the principle component along with any trace-level additives, and further, permits calculation of the molecular weight d istr ibut ion of the polymer, confirmation of the UV spectra of minor components, and quantitation based on the calibration curve and qualitative analysis results.The new Prominence-i integrated high-performance liquid chromatograph supports connection with the RID-20A differential refractive index detector. In addition, as the column oven can house up to three 30 cm columns used for GPC analysis, applications that require a long column are also supported.Here, we introduce an example of GPC analysis of polystyrene using the Prominence-i GPC system.
n GPC Analysis of Polystyrene with AntioxidantVarious types of additives, including plasticizers, antioxidants, lubricants, vulcanization accelerators and flame retardants, are generally added to polymers. This Application News presents an analysis of Irganox 1010, a typical hindered phenolic antioxidant which is added in small amounts to polystyrene (PS). Fig. 1 shows the analytical results obtained using a 5 µL injection of the additive-containing PS (5 g/L), Fig. 2 shows the spectrum of Irganox 1010, obtained using the PDA detector incorporated in the Prominence-i, and Table 1 shows the analytical conditions used for the analysis. The KF-804L analytical column, which permits generation of a linear calibration curve, was used with the stabilizer-free tetrahydrofuran (THF) mobile phase.As shown in Fig. 1, the Irganox 1010 peak was detected directly after PS, which eluted at about 7.5 minutes. The additive peak, which was barely detected by the differential refractive index detector, was detected with high sensitivity by the PDA detector by optimizing the detection wavelength, thereby permitting quantitation. Also, as shown in Fig. 2, qualitative analysis of Irganox 1010 is possible using the UV spectrum obtained using the PDA detector.
Column : Shodex KF-804L (300 mm L × 8 mm I.D.)Mobile Phase : THF (without stabilizer)Flowrate : 1.0 mL/minColumn Temp. : 40 °CInjection Volume : 5 µLDetection (PDA) : 230 nmFlow Cell : Integrated Conventional Cell Detection (RI) : RID-20A Polarity +, Cell temp. 40 °C, Response 1.0 sec
Table 1 Analytical Conditions
Fig. 1 Chromatograms of Polystyrene (PS) with Antioxidant (5 g/L, 5 µL Injected) Upper: Internal PDA Detector Lower: RID-20A Detector
Fig. 2 Spectrum of Irganox 1010
0.0 2.5 5.0 7.5 10.0 12.5 min
0
25
50
75
100mAU
2
1
0.0 2.5 5.0 7.5 10.0 12.5 min-5.0
-2.5
0.0
2.5
5.0
7.5
mRI
2
1
■ Peaks1. Polystyrene2. Irganox 1010
■ Peaks1. Polystyrene2. Irganox 1010
Internal PDA Detector
RID-20A
200 300 nm
0
10
20
30
40
50
mAU
Internal PDA Detector
ApplicationNews
No.
For Research Use Only. Not for use in diagnostic procedures.The content of this publication shall not be reproduced, altered or sold for any commercial purpose without the written approval of Shimadzu. The information contained herein is provided to you "as is" without warranty of any kind including without limitation warranties as to its accuracy or completeness. Shimadzu does not assume any responsibility or liability for any damage, whether direct or indirect, relating to the use of this publication. This publication is based upon the information available to Shimadzu on or before the date of publication, and subject to change without notice.
© Shimadzu Corporation, 2015www.shimadzu.com/an/
L482
First Edition: Jan. 2015
6.0 6.5 7.0 7.5 8.0 min
3.75
4.00
4.25
4.50
4.75
5.00
5.25
log (M.W.)
5
4
3
2
1
R2 =0.9995
1. PS (M.W. 197,000)2. PS (M.W. 55,100)3. PS (M.W. 28,500)4. PS (M.W. 9,920)5. PS (M.W. 3,950)
RID-20A
3.5 4.0 4.5 log (M.W.)
0
25
50
75
100
%
RID-20A
R2 =0.9998
0 25 50 75
0
1
2
3
4
5
100
Area (×105)
Concentration (mg/L)
Internal PDA Detector
n Calibration Curve n Linearity and Quantitation
n Distribution of Molecular Weight
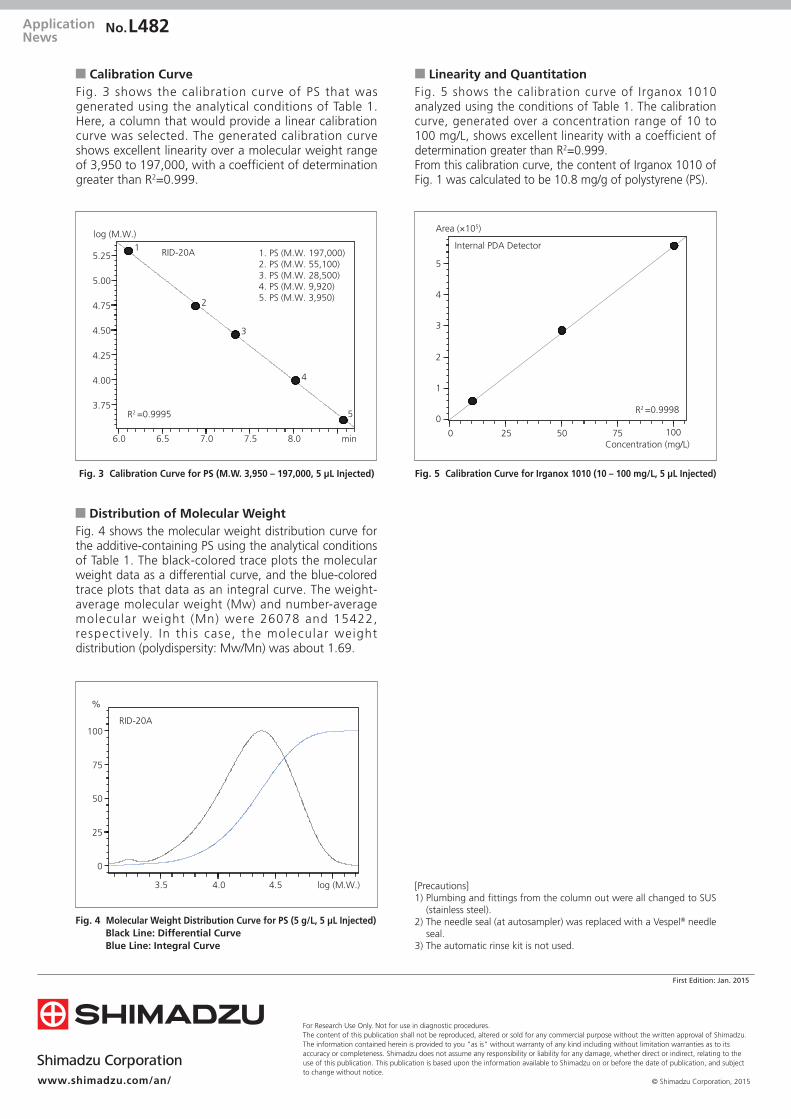
Fig. 3 Calibration Curve for PS (M.W. 3,950 – 197,000, 5 µL Injected) Fig. 5 Calibration Curve for Irganox 1010 (10 – 100 mg/L, 5 µL Injected)
Fig. 3 shows the calibration curve of PS that was generated using the analytical conditions of Table 1. Here, a column that would provide a linear calibration curve was selected. The generated calibration curve shows excellent linearity over a molecular weight range of 3,950 to 197,000, with a coefficient of determination greater than R2=0.999.
Fig. 5 shows the calibration curve of Irganox 1010 analyzed using the conditions of Table 1. The calibration curve, generated over a concentration range of 10 to 100 mg/L, shows excellent linearity with a coefficient of determination greater than R2=0.999.From this calibration curve, the content of Irganox 1010 of Fig. 1 was calculated to be 10.8 mg/g of polystyrene (PS).
Fig. 4 shows the molecular weight distribution curve for the additive-containing PS using the analytical conditions of Table 1. The black-colored trace plots the molecular weight data as a differential curve, and the blue-colored trace plots that data as an integral curve. The weight-average molecular weight (Mw) and number-average molecular weight (Mn) were 26078 and 15422, respect ively. In this case, the molecular weight distribution (polydispersity: Mw/Mn) was about 1.69.
Fig. 4 Molecular Weight Distribution Curve for PS (5 g/L, 5 µL Injected) Black Line: Differential Curve Blue Line: Integral Curve
[Precautions]1) Plumbing and fittings from the column out were all changed to SUS
(stainless steel).2) The needle seal (at autosampler) was replaced with a Vespel® needle
seal.3) The automatic rinse kit is not used.