
NO CHOICES LEFT BEHIND: - Reason Foundation
40
By Lisa Snell December 2006 NO CHOICES LEFT BEHIND: COMPETITIVE MODELS TO RESTRUCTURE CALIFORNIA’S LOWEST PERFORMING SCHOOLS 354 POLICY STUDY
Transcript of NO CHOICES LEFT BEHIND: - Reason Foundation

By Lisa Snell
December 2006
No ChoiCes Left BehiNd: Competitive modeLs to RestRuCtuRe CaLifoRNia’s Lowest peRfoRmiNg sChooLs
354POLICYSTUDY
Reason Foundation
Reason Foundation’s mission is to advance a free society by develop-ing, applying, and promoting libertarian principles, including indi-vidual liberty, free markets, and the rule of law. We use journalism and public policy research to influence the frameworks and actions of poli-cymakers, journalists, and opinion leaders.
Reason Foundation’s nonpartisan public policy research promotes choice, competition, and a dynamic market economy as the founda-tion for human dignity and progress. Reason produces rigorous, peer-reviewed research and directly engages the policy process, seeking strategies that emphasize cooperation, flexibility, local knowledge, and results. Through practical and innovative approaches to complex prob-lems, Reason seeks to change the way people think about issues, and promote policies that allow and encourage individuals and voluntary institutions to flourish.
Reason Foundation is a tax-exempt research and education organiza-tion as defined under IRS code 501(c)(3). Reason Foundation is sup-ported by voluntary contributions from individuals, foundations, and corporations. The views are those of the author, not necessarily those of Reason Foundation or its trustees.
Copyright © 2006 Reason Foundation. Photos used in this publication are copyright © 1996 Photodisc, Inc. All rights reserved.

R e a s o n F o u n d a t i o n
No Choices Left Behind: Competitive Models to Restructure California’s Lowest-Performing Schools
By Lisa Snell Executive Summary
he federal No Child Left Behind Act (NCLB) requires states to show that students in every subgroup, including minorities, low-income, and special education students are proficient in
reading and math. In 2005, each subgroup in elementary and middle school had to have at least 24.4 percent of students proficient in reading and 26.5 percent proficient in math. In high school each subgroup needs 22.3 percent of students proficient in reading and 20.9 percent of students proficient in math. A total of 2,215 schools are listed as “needs improvement” under NCLB and have entered program improvement status in California. Of these, 355 have been chronically low-performing for more than five years. Process improvements such as class size reductions, bigger budgets, or threatened sanctions have failed to address the problem.
California needs school improvement legislation requiring schools with five or more years of failure to choose a competitive model that offers students meaningful alternatives to the current low-performing public school including:
1. offering opportunity scholarships to students in failing schools;
2. competitively bidding out low-performing schools to outside operators;
3. restructuring the district to a weighted student formula system where a student could choose any school in the district, or
T

4. converting the low-performing school to a charter school.
Students need the right of exit from these low-performing schools. School funding needs to be put into the backpacks of children and follow them into the school of their choice. Offering parents and students “buying power” will help inspire excellence in low-performing schools if they have to compete for students in order to receive funding. The weighted student formula is a simple and equitable per-pupil funding system that allows money to follow each child. This reform wins out over other competitive reforms because it allows California to develop a stable school funding stream and would put every school provider—whether public, charter, or private—on a level playing field in California.

R e a s o n F o u n d a t i o n
Table of Contents
Introduction...............................................................................................................1
Low-Performing Schools in California .........................................................................3 A. No Choices Left Behind ..................................................................................................... 5 B. State Policies for Low-Performing Schools .......................................................................... 6 C. Federal Requirements ........................................................................................................ 7 D. The Ongoing Folly of the Class Size Reduction Silver Bullet ............................................. 10
Competitive Models to Restructure California’s Lowest-Performing Schools ..............12 A. The Money Should Follow the Child ................................................................................ 12 B. Opportunity Scholarships ................................................................................................. 17 C. The Diverse Provider Model ............................................................................................ 20 D. An Increase in Charter School Market Share .................................................................... 23
Recommendations ...................................................................................................27 A. Implement weighted student formula at the state level. .................................................... 27 B. Initiate opportunity scholarships. ...................................................................................... 27 C. Competitively bid for education providers to run schools in failing districts....................... 28 D. Increase charter school capacity. ..................................................................................... 28 E. Dismantle multiple accountability schemes....................................................................... 28 F. Mandate meaningful school restructuring reform. ............................................................. 28
Conclusion...............................................................................................................29
About the Author .....................................................................................................30
Related Reason Foundation Studies..........................................................................31
Endnotes..................................................................................................................32

NO CHOICES LEFT BEHIND 1
P a r t 1
Introduction
n California in the last decade we have developed world class standards for reading, math, science, and history. In the State of State Standards 2006, the Thomas B. Fordham Institute gives
California an A in all four categories. This is in contrast to the rest of nation that receives an average of a C- in state standards and curriculum. For example, the Fordham Institute writes about California’s math standards, “the Golden State's standards avoid almost all the pitfalls of other states: they call for the use of calculators at the right time and in the right way [the standards do not allow the use of calculators all through Kindergarten to grade eleven] and build students' skills in a logical progression that emphasizes computation, problem solving, and mathematical reasoning all the way through.”1 California’s standards and curriculum are slowly paying off. We have seen steady increases in student achievement in math and reading for the majority of schools. In 2006 in California 42 percent of students scored proficient or above in English (up from 40 percent last year) and 40 percent of kids are at grade level or above in math (up from 38 percent last year). Unfortunately, not every school is improving. California’s gradual improvement in performance is shadowed by the more than 2,200 schools that have been labeled as “needs improvement” under the federal No Child Left Behind Act, which means that at least one subgroup of students at each school is not meeting minimal proficiency standards. The national and local media have paid scant attention to the low-performing schools issue in California. The new list of low-performing schools was released in California on August 31, 2006 with little media speculation about what should be done with these 2,200 schools. Of these 2,200 schools, 355 have been chronically low-performing for more than five years. Rather than focusing specifically on low-performing schools, the California legislature has increased school funding for all schools since 2005. In 2006-2007 California’s schools will receive the largest education funding increase in the history of the state. The California state budget for 2006-2007 provides Proposition 98 education funding of $55.1 billion for K-12 schools and community colleges. This is an increase of $5.1 billion above the 2005-2006 Budget Act and represents the single largest year-to-year increase in education funding in California’s history. Proposition 98 raises per-pupil funding to $8,288 for 2006-07—an increase of $886 or 12 percent.
I

2 Reason Foundation
Total funding for California’s K-12 education system rises to $67.1 billion, for total per pupil funding from all sources of $11,264. As for academically weak schools, the current solution appears to be a new class size reduction policy approved in the fiscal 2006-2007 budget, aimed at improving the 500 lowest performing schools. Yet class size reduction has not led to significant increases in student achievement in California. While California has a variety of improvement programs designed to aid low-performing schools, the legislature has not passed state-level policies or recommendations to restructure chronically failing public schools and offer California’s students a meaningful alternative to academically struggling schools. California does have a complex school improvement process for low-performing schools. This process can subject individual schools to up to four different school accountability schemes with different rules, deadlines, and sanctions. Yet these programs are long on process and short on outcomes. Students can languish in failing schools for years with no reasonable hope they will ever attend a higher-performing school during the student’s school career. Obviously creating high standards alone is not enough. Individual low-performing schools may need competition from higher-performing schools to give them a financial incentive to either perform better or let the children go. In the very specific case of chronically low-performing schools, students need more than high standards—they need access to higher-performing schools and a right of exit out of their inadequate schools. Additionally, California needs an accountability system that is responsive to the individual child, not the failing institution. The cornerstone of California’s school accountability system should be decentralized school funding where the money follows the child into the public, charter, or private school of his parent’s choice. This report considers the problem of low-performing schools in California and examines viable alternatives from competitive school improvement models to help restructure these schools in California in ways that are responsive to students and families.

NO CHOICES LEFT BEHIND 3
P a r t 2
Low-Performing Schools in California
hile perhaps not the worst performing school in California, Centennial High School in Compton, California is representative of a worst case scenario for a low-performing school
in California. In 2006, Centennial scored 540 on the state’s Academic Performance Index (API).2 The API is the cornerstone of California’s accountability system. It is a numeric index that ranges from a low of 200 to a high of 1000 based on student test scores. The API performance target for all schools is 800. To make adequate yearly progress under the federal No Child Left Behind Act, schools must have a score of 560 or higher. In addition, in 2004 Centennial High lost its accreditation from the Western Association of Schools and Colleges (WASC). Of the roughly 3,200 schools in the region covered by the Western Association of Schools and Colleges (WASC), which evaluated Centennial, only two lost accreditation in the 2002-2003 school year. In the case of Centennial, accreditation was revoked only after the school repeatedly failed to act on recommendations made during previous inspections. Looking at the performance of actual students at Centennial High School paints an even bleaker picture. For example, in 2006 only 1 percent of males in 10th grade were proficient in English/language arts. For all students in 10th grade, English proficiency fell from 9 percent proficient in 2005 to 7 percent proficient in 2006. The state average for 10th grade English proficiency was 37 percent in 2006. In 2005 only 4 percent of African-American and 5 percent of Hispanic students at Centennial High School were proficient in math on the 2005 general mathematics exam, which is based on grades 6 and 7 standards.3 Centennial High School mirrors the problems in its school district and other low-performing districts across the state. Compton Unified School District currently has 27 schools classified as “needs improvement” under NCLB, or 68 percent of all schools in the district. Compton Unified, a school district with 32,550 students, has 16.8 percent of its students district-wide proficient in English/language arts and 20.8 percent proficient in math in 2004-2005. This compares with 40.3 percent proficient in English and 43.9 percent proficient in math statewide.4 Compton is the poster child for low-performing school districts in California. The school system is notorious for its financial and academic bankruptcy. The district had a $ 20 million budget shortfall
W

4 Reason Foundation
that led to a 10-year takeover by the California Department of Education. But the state did little better by Compton kids, going through five different superintendents and eventually returning some financial control to the district, without ever improving academic performance. One in three Compton students drops out of middle or high school—three times the state average. Only one in five completes the courses required to enter a four-year college.5 Centennial High School has been in “program improvement” status for more than six years, yet there have been no specific sanctions or real options for the students who attend this low-performing high school. The two schools listed as transfer options under the public school choice provision of NCLB are two continuation high schools (one with 39 students and one with 28 students) with no standardized test scores for parents to evaluate student achievement. Centennial students have no real public school choice options. Unfortunately, Centennial High School does not stand alone in California. California had 162 school districts and 2,215 schools listed as failing under No Child Left Behind that have entered “program improvement” status in the state of California. The federal NCLB requires states to show that students in every subgroup including minorities, low-income, and special education students are proficient in reading/English language arts and math. In 2005, each subgroup in elementary and middle school had to have at least 24.4 percent of students proficient in reading and 26.5 percent proficient in math. In high school each subgroup needs 22.3 percent of students proficient in reading and 20.9 percent of students proficient in math. The bottom line for California is that more than one-third of schools cannot get one-fourth of their students in every subgroup proficient in reading and math. In addition to meeting proficiency rates for each subgroup under the No Child Left Behind, California also measures schools based on the Academic Performance Index. The purpose of the API is to measure the academic performance and growth of schools. It is a numeric index (or scale) that ranges from a low of 200 to a high of 1000. A school's score on the API is an indicator of a school's performance level. The statewide API performance target for all schools is 800. A school’s API is based on the students’ test scores on California standardized tests including English/language arts in grades two through eleven, a writing assessment at grades four and seven, mathematics in grades two through eleven, history in grades eight, ten, and eleven, and science in grades five and nine through eleven. In the 2005-2006 school year exactly 30 percent of California's public schools met the state's long-term target score of 800 on the API.6 California’s overall low performance has been verified by the federal National Assessment of Educational Progress (NAEP), also known as the “nation’s report card.” The newly released 2005 NAEP scores, which report on reading and math achievement scores in every state, shows California fourth graders scored an average of just 207 out of 500 in reading, with eighth graders scoring 250 out of 500.7 As the report stated, “of the 52 state and other jurisdictions that participated in the 2005 fourth grade assessment, students in California were higher than those in 1 jurisdiction.”8
NO CHOICES LEFT BEHIND 5
California students also turned in low scores on the 2006 SAT. They performed even more poorly than their counterparts around the country, scoring below the national average on the reading section and at the national average in math. On the 2006 test, average reading scores in California dropped from 504 to 501 and from 522 to 518 on the math section.9
A. No Choices Left Behind For the thousands of students in school districts like Compton, there is no other public school option available. San Bernardino City Unified provides a case in point. The San Bernardino school district has 45 schools in program improvement or 67 percent of the schools in the district. The designated school of choice for high school students in failing schools was Arroyo Valley High School, which had lower test scores than the schools that were officially designated as failing. How could that happen? Federal standards did not designate Arroyo as underperforming only because until 2003-04 it was not considered “fully functional.” (That was the first year it served all four grade levels.) District officials acknowledge that Arroyo isn’t necessarily any better than the rest, but it is the only high school option available, since four out of the five high schools are underperforming and in “program improvement.”10 This phenomenon of children stuck in failing schools with no transfer options is played out across the state. In March 2006, The Alliance for School Choice and the Los Angeles-based Coalition on Urban Renewal and Education filed a lawsuit against the Los Angeles Unified School District and Compton Unified, which both have high concentrations of low-performing schools, because they have not complied with the core provision of the No Child Left Behind Act: that no child should be forced to attend a failing school. The complaints charge that the two districts failed to provide meaningful notice or transfer options for thousands of eligible students. Federal law requires the school districts to make findings within 60 days, and authorizes the Secretary of Education to cut off federal Title I funds for failure to provide transfer options. NCLB requires school districts with schools that have failed to make “adequate yearly progress” for two years under state standards to offer children the option to transfer to better-performing public schools within the district. Lack of capacity is not a basis to fail to provide transfer opportunities under the law. A 2004 report by the General Accounting Office found that more than 3 million schoolchildren—overwhelmingly low-income and minority children—were entitled to transfer, but only 1 percent of those eligible actually transferred.11 The complaints filed against the school districts charge that of at least 250,000 schoolchildren eligible for transfer in Los Angeles, only 527 (.2 percent) received transfers to better-performing schools, while in Compton, zero students have received transfers despite appalling educational

6 Reason Foundation
conditions. The complaints charge that the districts have failed to make information available to parents or to provide sufficient options. Clint Bolick describes the conditions for students in low-performing schools in Los Angeles and Compton in a September 7, 2006 piece in The Wall Street Journal:
In LAUSD, there are over 300,000 children in schools the state has declared failing under NCLB's requirements for adequate yearly progress. Under the law, such children must be provided opportunities to transfer to better-performing schools within the district. To date, fewer than two out of every 1,000 eligible children have transferred—much lower even than the paltry 1 percent transfer figure nationwide. In neighboring Compton, whose schools are a disaster, the number of families transferring their children to better schools is a whopping zero.12
In addition, The Alliance for School Choice commissioned the Polling Company to survey Los Angeles and Compton parents whose children are eligible to transfer their children out of failing schools. Only 11 percent knew their school was rated as failing, and fewer than one-fifth of those parents (just nine out of 409 surveyed) recalled receiving notice to that effect from the districts—a key NCLB requirement. Once informed of their schools' status and their transfer rights, 82 percent expressed a desire to move their children to better schools.13 U.S. Secretary of Education Margaret Spellings gave California until August 15, 2006 to come up with a plan that would allow students in the state’s failing schools to transfer to a better school or she would withhold part of the $700 million due this fall in federal Title I funds. The deadline has now passed with no word on any specific consequences for California.
B. State Policies for Low-Performing Schools California has a complex and bureaucratic accountability system for low-performing schools. There are two state-funded programs (II/USP and HPSGP) and two federal programs (CSR and program improvement, or PI, under NCLB) currently in existence in the state. All of them have requirements that are similar but slightly different. All of them have different timelines and slightly different consequences for schools that consistently fail to meet their growth targets. State programs judge schools by their performance on the Academic Performance Index (API) and federal programs judge schools by their percentages of students reaching "Proficient" or better (AYP) on the testing benchmarks. Both systems are based on state content standards tests. The state system judges schools by the growth of all the students in the school, and the federal system judges individual student progress. Some schools are funded by all four programs and are constantly trying to meet deadlines for different programs, and satisfy four different sets of program requirements.

NO CHOICES LEFT BEHIND 7
According to work by education scholars Williamson M. Evers and Lance T. Izumi, California created a series of intervention programs for low-performing schools beginning in 1999. As Evers and Izumi explain:
First there was the Immediate Intervention/Underperforming School program (II/USP); then, High Priority Schools Grant Program (HPSGP). Participation by low-performing schools in both the II/USP and the HPSGP was voluntary. Now there is the School Assistance and Intervention Team (SAIT) approach, which is compulsory after two years of poor performance. As these programs have come into existence the older ones have continued to run, while the new ones have influenced the practices undertaken in the continuing programs.14
These programs resemble the first set of corrective actions under NCLB. From 1999 to 2003, failing California schools went through the first two phases (11/USP and HPSGP), but studies of the programs found that the process had a negligible effect on student performance. The recommendations usually emphasized classroom processes and school operations rather than what teachers are teaching and how effectively.15 Table 1 illustrates the multiple accountability programs and the number of schools identified under each program.
Table 1: School Participation in Accountability Programs
Program(s) Schools HP 120 II/USP 524 CSR 72 PI 588 HP II/USP 42 HP CSR 2 HP PI 230 II/USP PI 355 II/USP CSR 47 CSR PI 102 HP II/USP CSR 13 HP II/USP PI 191 HP CSR PI 16 II/USP CSR PI 46 HP II/USP` CSR PI 34
Source: California Department of Education
C. Federal Requirements The No Child Left Behind Act of 2001 creates another set of accountability requirements that takes precedent over state requirements. In order to make adequate yearly progress (AYP) schools are
8 Reason Foundation
required to have a minimum number of students that are proficient in reading and math—with data by subgroups including low-income, minority, and special education. Title I schools that do not make AYP two years in a row are placed in the “program improvement” category, which requires them to:
Prepare two-year improvement plans;
Use 10 percent or more of Title I funds for professional development;
Provide public school choice and pay transportation costs for students to attend schools of their choice within the same district;
Use Title I funds to pay for supplemental tutoring services, which may include private companies, nonprofit agencies or faith-based or religious organizations.
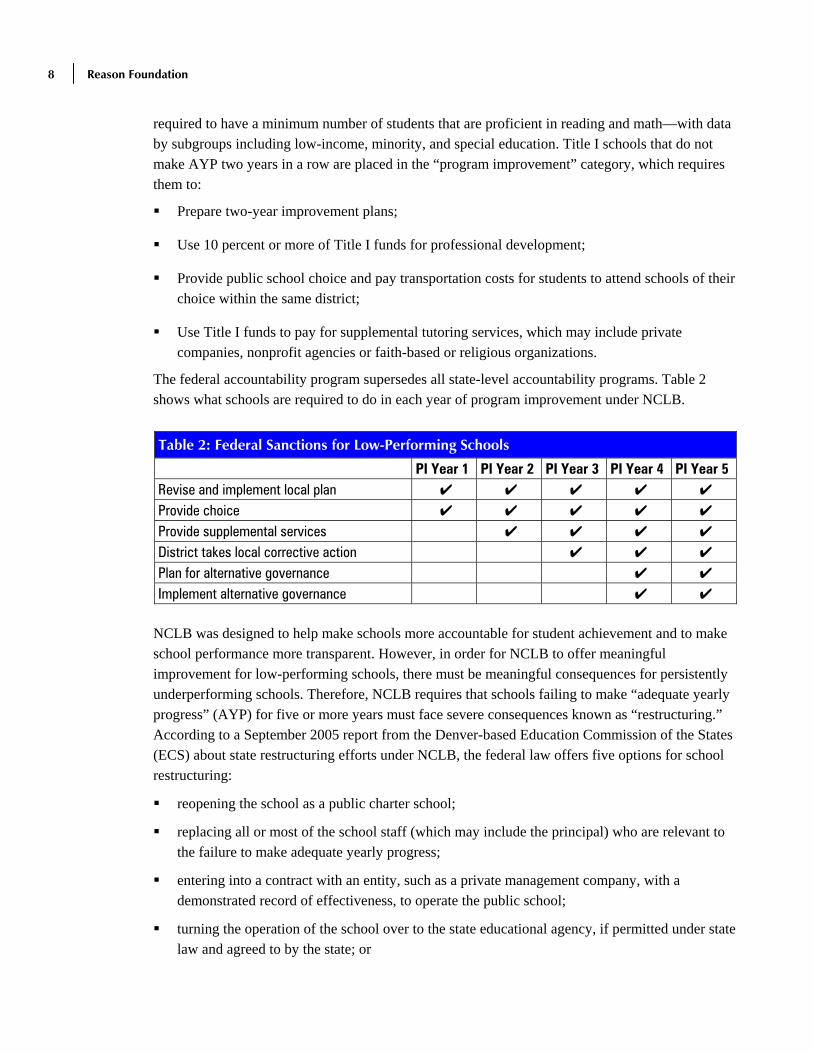
The federal accountability program supersedes all state-level accountability programs. Table 2 shows what schools are required to do in each year of program improvement under NCLB.
Table 2: Federal Sanctions for Low-Performing Schools PI Year 1 PI Year 2 PI Year 3 PI Year 4 PI Year 5Revise and implement local plan ✔ ✔ ✔ ✔ ✔ Provide choice ✔ ✔ ✔ ✔ ✔ Provide supplemental services ✔ ✔ ✔ ✔ District takes local corrective action ✔ ✔ ✔ Plan for alternative governance ✔ ✔ Implement alternative governance ✔ ✔
NCLB was designed to help make schools more accountable for student achievement and to make school performance more transparent. However, in order for NCLB to offer meaningful improvement for low-performing schools, there must be meaningful consequences for persistently underperforming schools. Therefore, NCLB requires that schools failing to make “adequate yearly progress” (AYP) for five or more years must face severe consequences known as “restructuring.” According to a September 2005 report from the Denver-based Education Commission of the States (ECS) about state restructuring efforts under NCLB, the federal law offers five options for school restructuring:
reopening the school as a public charter school;
replacing all or most of the school staff (which may include the principal) who are relevant to the failure to make adequate yearly progress;
entering into a contract with an entity, such as a private management company, with a demonstrated record of effectiveness, to operate the public school;
turning the operation of the school over to the state educational agency, if permitted under state law and agreed to by the state; or

NO CHOICES LEFT BEHIND 9
any other major restructuring of the school's governance arrangement that makes fundamental reforms, such as significant changes in the school's staffing and governance.16
According to the ECS report, so far restructuring efforts have been slow and weak at best. The federal government has offered states little detailed guidance on restructuring, states have mostly left it up to local school districts to decide how to restructure low-performing schools, and the districts have chosen mild school interventions that mostly fall into the vague fifth option of “other” major restructuring efforts. Although the federal No Child Left Behind Act (NCLB) calls for severe sanctions against schools that chronically fail to meet certain performance benchmarks—including remedies such as state takeover and restructuring—the reality is that over the last five years, few schools have been forced to face sanctions more severe than the ones they dole out to themselves, according to the ECS report.17 “School district administrators most often choose mild interventions, such as changing the curriculum or offering technical assistance,” said author Rebecca Wolfe DiBiase, a charter school expert, “rather than strong interventions such as converting low-performing schools into charter schools or using outside management companies to operate low-performing schools.” 18 California offers a case in point. The federal law allows schools to get by with the vaguely worded option of "any other major restructuring." In California the majority of fifth-year failing schools have taken the “other major restructuring option.” As Los Angeles Unified spokeswoman Barbara Mecka told the Sacramento Bee on September 29th, “at Los Angeles Unified, where nine schools entered the fifth-year phase last year, “other restructuring” included extensive staff changes, bringing in outside consultants, creating small learning communities, or a combination of the above.”19 The Sacramento Bee feature reported that 249 California schools reached federal limits for failure—after more than five consecutive years of missing federal test-score benchmarks. The report concluded that these schools will probably get by without much legitimate reform as the state of California has been slow to enforce restructuring options in the federal law.20
Table 3: Options Chosen by California Schools in Restructuring
California’s Restructuring Options Percentage of Schools Using This Option*
Undertaking any other major restructuring of the school’s governance that produces fundamental reform
76%
Replacing all or most of the school staff who are relevant to the failure to make AYP
28%
Entering into a contract to have an outside organization with a record of effectiveness operate the school
14%
No plan 13% Reopening the school as a charter school 2%
* Percentages total more than 100% because many schools choose more than one restructuring option.
Source: California Department of Education.

10 Reason Foundation
The ECS report argues that the prevailing trend of accepting mild and moderate, rather than strong, improvement strategies from districts will be the norm in the future. Such a trend may occur in part because districts are threatened by some of the more significant reforms that diminish their control, such as state takeover, reopening as a charter, or private management. The bottom line is that thus far, NCLB’s restructuring sanctions have had little success at providing better schooling options for California students attending low-performing schools.
D. The Ongoing Folly of the Class Size Reduction Silver Bullet Rather than sanction low-performing schools, the California legislature has agreed to fund a class size reduction program in an effort to raise student achievement in low-performing schools. About 500 of California's lowest-performing schools would share $2.9 billion to reduce class sizes over the next seven years under an agreement approved in 2006 in the legislature. The deal is part of a lawsuit settlement Gov. Arnold Schwarzenegger reached this spring with the California Teachers Association, which sued the state, contending that schools were shortchanged in recent budgets. Schools would be eligible to apply for the funds if their students averaged in the lowest 20 percent statewide on the 2005 Academic Performance Index, the state test measuring achievement. Since there are about 1,600 schools in that category, but only enough funding to cover class size reduction in about 500, not every low-performing school could receive the extra funding. The state already provides funds for class size reduction through the third grade. The new funds would be used to reduce class sizes for grades 4 through 8 to no more than 25 students per teacher. Through the 12th grade, English, social studies, math, and science classes would also be limited to no more than 25 students. Participating high schools would be required to have no more than 300 students for each school counselor. Even Secretary of Education, Alan Bersin, admitted that class size reduction has not been a silver bullet. He said in the August 31st Sacramento Bee that ''The research is clear that class size reduction, in and of itself, does not improve student achievement,'' Bersin said. ''But that, coupled with improved teaching, can be decisive.”21 However, this $2.9 billion does not specifically tackle improved teaching. In fact, class size reduction in California has been one factor in the demand for more teachers that has forced some schools to rely on less-qualified teachers to meet class size reduction mandates. Nationwide class size reduction has had little effect on student performance. Between 1960 and 1995, average student-teacher ratios in U.S. schools fell by one-third. Yet student achievement trends on both the SAT and the National Assessment of Educational Progress (NAEP) showed a general decline in test scores and achievement even as class size fell during that period. More specifically, California has received little improvement for its multi-billion dollar investment in class size reduction. Mike Antonucci of the Education Intelligence Agency argues that California’s class size reduction program has had little impact on California’s students’
NO CHOICES LEFT BEHIND 11
performance on the National Assessment of Education Progress—the federal government’s national benchmark for student achievement.
In 1998, before 4th-graders had the benefit of smaller classes, California's 4th-graders ranked ahead of only those in Hawaii and Louisiana in reading (NAEP test). The benchmark for math is 1996, where California's 4th-graders finished ahead of those in Mississippi and tied with those in Louisiana.
In 2005, California's 4th-graders beat out Mississippi in reading. Hawaii and Louisiana passed us. The brightest picture is 4th-grade math. California finished ahead of Alabama, Mississippi and New Mexico, and tied with Louisiana and Nevada.
What's worse is that we have had class size reduction for so long, we can now compare the NAEP scores of 8th-graders under the old class sizes with 8th-graders who experienced four years of 20-student classes. They are virtually indistinguishable.22
A 2004 RAND study confirms that California’s large-scale class size reduction program has had little effect on student achievement.23 In 1996, California enacted SB 1777, which provided a substantial incentive for school districts to reduce their class sizes from an average of roughly 30 students per class to 20 or fewer. As a result of SB 1777, nearly $1 billion in education funds was provided to districts in 1996-97 to reduce class size in grades K-3. The program currently provides more than $1.7 billion a year to schools for class size reduction. RAND researchers examined the standardized test scores over five years for pupils in 2,892 schools across the state. Some children had spent only their second- and third-grade years in smaller classes. Others had been in small classes for the first, second, and third grades. All other factors being equal, the researchers found getting the extra year of small classes in first grade did not result in significant test-score gains. Nevertheless, California’s class size reduction program did have consequences—unintended ones. Qualified teachers in urban areas fled to higher-performing schools in the suburbs, where class size reduction meant new teaching positions opened up. Urban schools were faced with huge shortages of classroom space and qualified teachers. As a result, many less-experienced teachers were hired. Since student achievement tends to be more strongly correlated with teacher quality than with small class size, many urban students were actually worse off after the class size reduction program took effect. Like its predecessor, this new initiative directs huge resources to an unproven and well-funded categorical program: class size reduction, without any regard for the program’s impact on student achievement. These resources will have little impact on students stuck in low-performing schools in California.

12 Reason Foundation
P a r t 3
Competitive Models to Restructure California’s Lowest-Performing Schools
urrent efforts are underway in California to pass legislation to streamline the multiple state intervention programs and align state and federal accountability requirements. Yet, even the
best case scenarios focus on the process of fixing struggling schools rather than the choice provision of No Child Left Behind or a specific escape mechanism to allow students to attend higher quality schools. Students attending low-performing schools need an immediate exit to better schools.
A. The Money Should Follow the Child In order for real reform to take place in California’s failing schools, students need the right of exit from low-performing schools. Therefore, school funding needs to be attached to the backs of children and follow them into the public, charter, or even private school of their choice. The weighted student formula is a school financing mechanism that cuts across all the failing school reforms whether charter, contract schools, or opportunity scholarships and offers children buying power in terms of their per-pupil funding. Therefore, the most fundamental school reform that is needed in California is a simple and equitable per-pupil funding system that allows money to follow each child. This reform should supercede other competitive reforms because it allows California to develop a stable school funding stream and would put every school provider—whether public, charter, or private—on a level playing field when it comes to serving the individual needs of students in California.24
1. Closing Salary Gaps with the Weighted Student Formula California has one of the most centralized public school systems in the United States. In California, local property taxes are aggregated in Sacramento and then re-allocated to school districts on a per-capita basis. These reallocated funds—both general revenue and categorical funds—do not flow directly to schools, but to school district central offices. The central offices then allocate personnel to schools rather than money. For example, a school district would determine the number of teachers and other kinds of personnel each school receives based on the district’s student
C

NO CHOICES LEFT BEHIND 13
population and characteristics. If a school principal wanted to invest resources in an additional reading instructor to raise reading scores at the school, the school principal would not have the budgetary discretion to hire the reading teacher because employees are assigned at the district level based on the average characteristics of schools in the district. In a February 2005 study by the Education Trust West, California’s Hidden Teacher Spending Gap: How State and District Budgeting Practices Shortchange Poor and Minority Students and Their Schools, found that state education dollars are not distributed equally within school districts. The report found that the money spent on teachers’ salaries in California, which makes up the majority of education funding in California, varies widely from school to school within the same school district. For example, all 10 of California’s largest school districts post a spending gap on teachers’ salaries between high and low minority high schools. These gaps range from $64,291 to $522,459.25 The Education Trust-West study found dramatic spending gaps in teachers’ salaries within districts, with more highly paid teachers and more experienced teachers concentrated in more affluent schools. State funding accounts only report average teachers’ salaries for entire districts instead of calculating the actual salaries of teachers assigned to any particular school. These district averages are even reported on the school-level report cards. These averages mask teacher salary differences between schools within the same district. The Education Trust-West study uses this analogy:
It’s as if we had two pots of water, one ice cold and the other boiling hot, and concluded that the average water temperature is warm: True, but not very informative about the conditions in each pot.26
The Education Trust-West study recommends reporting transparent school salary and budget information at the school level, changing the funding system to allow money to follow the child rather than districts allocating funds based on teaching positions in an individual school, and changing the lock-step salary schedule to allow higher salaries for more challenging school assignments. In fact, the change to a weighted student formula system in some school districts in California and the nation has already resulted in a more equitable funding system and has raised student achievement significantly.
2. The Weighted Student Formula A number of school districts across the country and abroad have adopted a funding mechanism for schools that gives local schools more control over resources and leads to increases in student achievement.27 Pioneered in Canada’s Edmonton school district in Alberta in the 1980s, the “weighted student formula” has been imported to Seattle, Cincinnati, San Francisco, and Houston. The funding structure allows individual schools to compete for students and allows principals to control their budgets and tailor their schools to the needs of their specific school populations.

14 Reason Foundation
School districts use student characteristics to determine per-pupil funding levels and better match costs with actual student needs. In each case, schools are given responsibility for managing their own budgets in key areas such as personnel, school maintenance or learning materials. In addition, the funding follows the child to each school and is based on the characteristics of the individual child. Therefore, schools have an incentive to improve academic programs and help at-risk and low-income students. San Francisco is one of a handful of public school districts across the nation allowing education funding to follow students.28 Former Superintendent of Schools Arlene Ackerman introduced the city to the weighted student formula, which requires money to follow students to the schools they choose while guaranteeing that schools with harder-to-educate kids (low-income students, English learners, low achievers) get more funds. Ackerman also introduced site-based budgeting, so that school communities—not the central office—determine how to spend their money. Finally, she created a true open-enrollment student assignment system that gives parents the right to choose their children's schools. And parents are taking advantage of the system; more than 40 percent of the city's children now attend schools outside their neighborhoods. With students having the freedom to move, the city's public schools now have incentives to differentiate themselves. Once cookie-cutter public schools now include Chinese, Spanish and Tagalog language immersion schools; college preparatory schools; performing-arts schools that collaborate with an urban ballet and symphony; schools specializing in math and technology; traditional neighborhood schools; and a year-round school based on multiple-intelligence theory. Each San Francisco public school is unique. And the number of students, school hours, teaching styles and program choices vary from site to site. San Francisco, with 116 schools and 60,000 students, is now entering its sixth year of weighted student formula reforms, and its test scores now top all the state's urban districts. In 2006 standardized test results, nearly half of San Francisco Unified's students—48 percent—scored at or above proficient in both reading and math. Those scores are far above the state average and the LAUSD's results of 31 percent at or above grade level in math and 30 percent in English. In 2005, San Francisco's students posted the highest test scores of any urban district on the Academic Performance Index. The state has set 800 as excellent. San Francisco scored 745; San Jose 737; San Diego 728; Sacramento 700; Los Angeles 645; and Oakland 634. Even San Francisco's low-income students outscored L.A. and other urban districts, achieving 706 on the API. San Francisco also does a better job of serving low-income students and high school students. In language arts in 2006, for example, San Francisco’s low-income high school students outscore students in Los Angeles Unified by twenty points in 9th grade, fifteen points in 10th, and fifteen points in 11th grade. These gains in San Francisco have been made with more and more students who used to be excluded now being tested. In the last year of Bill Rojas’ administration (1998-’99), only 77 percent of SFUSD students (in tested grades, 2-11) were included, with kids who were deemed

NO CHOICES LEFT BEHIND 15
likely to bring scores down excluded wherever possible. By 2003-’04, 98 percent of SFUSD students (in tested grades) were included in testing. San Francisco is not alone. Professor William Ouchi of the UCLA Anderson School of Management has done extensive research on the effects of school district decentralization throughout the United States. Ouchi and his team of 12 researchers studied three very centralized public school districts: New York City, Los Angeles, and Chicago; three very decentralized public school districts that used the weighted student formula: Seattle, Houston, and Edmonton, Canada; and, three very decentralized Catholic school districts: Chicago, New York City, and Los Angeles. In his book Making Schools Work (Simon & Schuster, 2003), Ouchi reports that decentralization works. Schools perform better on fiscal and academic outcomes when there is both local control of school budgets by principals and public school choice. Ouchi’s team conducted interviews with 185 principals in the six public districts and found, on average, that principals in the WSF districts have discretion over 77 percent of their school budgets. By contrast, principals in New York and Los Angeles report discretion over only 6 percent of their budgets. In Edmonton, principals have control over 92 percent of their budgets. A central point made in Making Schools Work is that most school districts merely give word play to local control and site-based management. Their kind of “local control” is nominal. The only true local control occurs when the school principal controls the school budget. Overall, Ouchi found that the truly decentralized public school districts and private Catholic schools had significantly less fraud, less centralized bureaucracy and staff, more money at the classroom level, and higher student achievement. According to Ouchi, the bottom line is that the money must follow the child. School closure is also a prominent feature of the weighted student formula model. In Edmonton, if a school declines to the point that it can’t cover its expenses with the per-student money, the principal is removed and the remaining teachers and facilities are assigned to a strong principal—or the school is closed, and the staff are moved to other more successful schools. The San Francisco school district has closed 5 schools in 2005 because of under-enrollment. School choice is a crucial component of the WSF program. Public school choice complements a weighted system by creating a financial incentive for schools to improve their educational programs, thereby attracting more students (and more dollars). Importantly, weightings ensure that schools have an incentive to recruit and serve students with special needs, limited English proficiency and other difficulties. Edmonton’s public school choice system is particularly robust, allowing students to apply directly to any school in the system. Similarly, Cincinnati’s high school open enrollment system allows students to apply directly to 26 different high school programs on a first-come first-served basis. San Francisco and Seattle use complex formulas to assign students to their school of choice with some consideration given to factors such as socioeconomic background and residential address, yet more than 80 percent of students enroll in a school of their choice.
16 Reason Foundation
Decentralized school districts in the United States, with real public school choice options, offer students more robust choices than the public school choice under the federal No Child Left Behind Act. Under federal law students in failing schools are guaranteed the right to transfer to a school that isn't failing. However, districts have not made a good-faith effort to implement public school choice. Since the No Child Left Behind Act was passed, less than 2 percent of parents nationwide have transferred their children to other public schools. For example, in New York City for the 2005-2006 school year, 11,000 kids applied to leave failing city schools, but only 2,250 city kids received one of their choices. Decentralized districts demonstrate that it is possible to allow parents to choose any school in a district and that the resulting competition and need to attract parents can help improve even the lowest-performing schools and encourage them to adopt best practices and unique programs that will benefit the children in their schools. Several other weighted student formula programs have resulted in positive outcomes in terms of choice and student achievement for students:
In 2004 the Oakland Unified School District transformed its budgeting formula from a centralized process to “results-based budgeting.” As reported in a new Education Trust West report, “California’s Hidden Teacher Spending Gap,” the Oakland District allocates funding to its schools based on the number and type of students at each school. Oakland gives each school administrator the flexibility to allocate this funding in whatever way fits the school’s instructional needs. Oakland allocates funds to the school in the same way it receives revenue from the state: unrestricted Average Daily Attendance (ADA) funding is allocated to the schools based on their current year enrollment. According to Education Week, Oakland is the only district in the nation that gives principals direct control of their ADA funding. In Oakland, which has just completed the first year of implementing student-based budgeting, in what is probably a first in recent district history, a majority of Oakland's African-American students met basic reading standards at their grade levels in 2005. In addition, every grade level in Oakland saw increases in the number of students who were proficient in reading and math.
In Boston, pilot schools were opened in 1995 as a result of a unique partnership among the Boston mayor, school committee, superintendent and teachers union. According to the Boston teachers union contract, Pilot schools were created to be models of educational excellence and reform within the district. Pilot schools are part of the Boston Public School system (BPS), but have autonomy over five key areas: budget, staffing, governance, schedule and curriculum and assessment. While overall Boston school enrollment has been declining, Pilot school enrollment has increased over the last decade from serving 1.5 percent of enrollment in five schools to serving 10 percent or 5,900 students, in 19 schools. The new report, "Progress and Promise: Results from the Boston Pilot Schools," in January 2006 by the Center for Collaborative Education in Boston, shows that Pilot school students are performing significantly better than BPS averages across every indicator of student performance and engagement. Pilot school students score substantially higher than the district average on the

NO CHOICES LEFT BEHIND 17
state standardized test, the Massachusetts Comprehensive Assessment System, and have higher college matriculation rates. According to the study, 80 percent of students in pilot schools passed the MCAS, in contrast to 59 percent of non-pilot students, excluding the city's exam schools. Attendance at pilot schools averaged 95 percent, compared to 89 percent at other schools.
In 2005 Cincinnati Public Schools, where 70 percent of students are African-American, improved from "Academic Watch" to "Continuous Improvement,” and test scores were up for most students in most grade levels.
Seattle also continues to see increases in student achievement and in 2005 reduced the number of failing schools under No Child Left Behind from 20 to 18, even as the state raised the bar for proficiency.
In 2006 the New York City public school system expanded the Empowerment Schools experiment; 321 principals, more than a fifth of those in the system, will no longer answer to a superintendent and will have greater authority over their budgets, staff and instruction. In exchange, they have agreed to meet performance targets and could face dismissal in two years if they fail. 29 In order to direct more resources to the autonomous schools, the city has cut the number of jobs in the school bureaucracy by 328, worth $87.5 million in savings.
In California, Los Angeles school and union officials have agreed in concept to develop a group of independent small schools in the Pico-Union area, allowing students to choose a campus that best fits their interests. The Belmont Pilot Schools Network would consist of five to ten fully autonomous high schools launched over the next five years, with a maximum of 400 students each. Principals and teachers at those schools would work under a separate contract that would free them to determine school calendars, curricula, budgets and administrative structures.30
California should follow Oakland, San Francisco and Belmont’s lead. California should create one simple funding mechanism that distributes both categorical and revenue-limit funding based on a weighted student formula that would include one base allocation equalized across the state and additional weighted funds for students with additional needs, including special education, poverty, and English learners. This process would make school finance in California simpler and more equitable, and bring significant cost savings by reducing categorical administration costs and central office costs and redirecting some of this savings to increase classroom-level spending.
B. Opportunity Scholarships California should follow Florida and Ohio and adopt opportunity scholarships. California should consider the model that gives children in low-performing schools a state scholarship to choose the private or public school of their choice.

18 Reason Foundation
1. Florida Florida is the first state to offer opportunity scholarships. Under Florida’s “A-plus” program, each public school is assigned a grade of “A” through “F,” based on the proportion of its students earning a passing grade on the Florida Comprehensive Assessment Test (FCAT). Students attending schools that receive two “F” grades in four years are eligible to attend a private school or to transfer to another public school. By offering vouchers to students as an opportunity to leave failing schools, the Florida plan is intended to motivate those schools to improve their academic performance. Extensive research in Florida demonstrates that the school voucher provision motivated the public schools to improve. In 1998–1999, the first school year of the program, a total of 53 students statewide received private education vouchers. In 1999–2000, there were 78 public schools that received a failing grade based on their cumulative test scores on the FCAT and would have been sanctioned with vouchers in 2000–2001. However, by the second year of the “A-plus” program, every school in Florida (including the 78 schools that had a failing grade the year before) managed to pull test scores up enough to avoid the voucher sanction.31 Fessenden Elementary School in Marion County, Florida, for example, is a high-poverty school (81 percent of the 560 students qualify for the federal free-lunch program), with a 41 percent student turnover from year to year. It is also one of only two Florida schools that made the leap from an “F” in 1999 to an “A” in 2000 under Florida’s grading system. After learning of the “F” designation in 1999, Fessenden principal Loretta Jenkins worked over the summer to devise a plan to boost the school’s grade. The new plan changed reading instruction from a whole-language program to a phonics-based program. The new math curriculum allowed teachers to actually finish the math book for the first time before the end of the year, as well as review the concepts. Students were tested often to identify their strengths and weaknesses, and to track their individual progress. After-school tutoring was provided for children who were reading below grade level. Jenkins also hired five new teachers to reduce the student-teacher ratio to 18-1 in first through third grade. Teachers were carefully monitored to ensure that the state’s academic standards were emphasized in lesson plans. Fessenden teachers began spending 90 percent of class time on direct instruction. The fact that students’ scores could be tracked to individual classrooms also helped to motivate teachers. The results exceeded everyone’s expectations. The school district had encouraged the school to raise their grade to a “D;” Jenkins was hoping for an improvement to a “C.” Fessenden students posted double-digit improvements in reading, writing, and math, exceeding higher performance standards needed to earn an “A.” Additionally, the number of students earning the lowest test scores decreased by 14 percent. 32

NO CHOICES LEFT BEHIND 19
Jay P. Greene, an education researcher at the Manhattan Institute, analyzed FCAT test scores for the initial two years of the “A-plus” program. He found that “schools that received ‘F’ grades in 1998–1999 experienced increases in test scores that were more than twice as large as those experienced by schools with higher state grades.”33 Dr. Greene’s analysis of individual schools’ FCAT reading scores showed that schools originally receiving a failing grade showed an average gain of almost 18 points. Comparatively, schools receiving an “A” grade in 1999 improved by an average of only 1.9 points. Schools rating a “B” or “C” grade showed almost identical improvement in student reading: 4.85 points and 4.6 points, respectively (see Table 4).
Table 4: Florida A-Plus Voucher Program Comparing Test Score Gains by School Grade
School Grade Given by State in 1999 Change in FCAT Scores from 1999 to 2000 Reading Math Writing A 1.90 (202) 11.02 (202) .36 (202) B 4.85 (308) 9.30 (308) .39(308) C 4.60 (1223) 11.81 (1223) .45 (1223) D 10.02 (583) 16.06 (583) .52 (583) F 17.59 (76) 25.66 (76) .87 (76)
The change for F schools compared to schools with higher grades is statistically significant at p < .01. Math and reading scales are from 100 to 500. The writing scale is from 0 to 6. Number of schools is in the parenthesis.
Source. Jay P. Green, “An Evaluation of the Florida A-Plus Accountability and Choice Program,” The Manhattan Institute, February 2001, p. 6
In an independent analysis employing different techniques that allowed her to track trends over time, Cornell University's Rajashri Chakrabarti examined the performance of schools facing the threat of vouchers during the three years after Florida introduced its A+ program. Her findings, reported below, mirror those of Jay Greene and Marcus Winters, who analyzed the effect of the voucher threat for the 2002–03 school year. Public schools that received an F grade during the 1998–99 school year were directly exposed to the threat of vouchers if they did not improve their test scores. Schools that received a D grade that same year faced no such direct threat. To analyze the effect of the voucher threat, she compared changes in the performance of F schools with the change among D schools from the 1998–99 school year through the 2001–02 school year. Schools that were originally given a grade of F in 1999 made greater performance gains than the D schools on each of the Florida Comprehensive Assessment Tests (in math, reading, and writing) and in each of the three school years. 34 In a recent Alliance for School Choice report, education researcher Scott Jensen summarizes the impact of the A+ Opportunity Scholarship Program. Three major studies have demonstrated that “despite the relatively small number of students who received these scholarships, the A+ Opportunity Scholarship program produced significant academic improvements for both the students receiving scholarships and the students remaining in the failing schools.”35

20 Reason Foundation
In 2006 the Florida Supreme Court ruled that the opportunity scholarship program violated the uniformity clause of the Florida state constitution despite rulings in two other states that found similar programs did not violate similar clauses. For now the opportunity scholarship program is defunct in Florida. School choice proponents are working to reinstate this program by changing Florida’s state constitution. California’s state constitution does not have a specific “uniformity clause” that would prevent the implementation of opportunity scholarships.
2. Ohio More recently, Ohio has adopted a failing schools scholarship program called EDChoice Ohio that allows students attending schools on the state’s academic watch list for the last three years to receive a scholarship to attend the public or private school of their choice. The program provides for up to 14,000 students to receive scholarships of $4,250 to attend a private elementary or $5,000 to attend a private high school. Students were eligible to apply for vouchers this academic year if they attended a public school building that was in either of the state's two lowest academic ranks—academic watch or academic emergency—for the past three school years. Statewide, more than 46,000 students in nearly 100 school buildings were eligible to apply for the program's 14,000 slots. Nearly 3,600 students signed up, but it's not known yet how many were accepted and enrolled in a private school.36 In addition, in 2006 two states considered legislation that would provide a scholarship to any individual student who was failing academically based on state test scores. Governor Jeb Bush of Florida proposed legislation that would provide scholarships for students who had failed the state’s reading test three years in a row. The Florida plan failed in the Senate. In Arizona, both houses passed bills providing scholarships to students who failed the state’s AIMS test. The proposals did not become law. California needs a scholarship program for students languishing in the state’s worst-performing schools. These students should receive immediate relief through an opportunity scholarship program. In California any student attending a school that has been designated as failing under NCLB for more than three years should have the opportunity to enroll in the public or private school of her parent’s choice.
C. The Diverse Provider Model California currently has 162 failing school districts. An alternate competitive model for California districts with large numbers of low-performing schools is for a school district to host a competitive bidding process for outside organizations to run low-performing schools in the district.

NO CHOICES LEFT BEHIND 21
1. Philadelphia In 2002, the state of Pennsylvania took over the School District of Philadelphia and appointed the School Reform Commission, who hired Paul Vallas as the District's CEO. The commission's most controversial reform targeted 64 of Philadelphia's lowest-performing schools for special intervention. Forty-five of those schools were partnered with a for-profit or nonprofit education provider. Edison Schools was assigned 20 of those 45 schools, making it the district's single largest partner with more than 12,000 students. The other 19 schools were partnered with the school district and received extra resources and special interventions. Competition between public and privately managed schools in Philadelphia has allowed all public school students to benefit from best practices and has led to overall achievement gains for Philadelphia students that are dramatically above the state average. The average test-score gain in Pennsylvania on the 2004 Pennsylvania System of Schools Assessment (PSSA) was five points in reading and six points in math, according to data released by the state Department of Education. The School District of Philadelphia exceeded those rates, posting average gains of 10 in reading and 10 in math. The gains achieved in Philadelphia are among the highest of any of the nation's largest school districts, according to the Council of Great City Schools. Moreover, the gains in student achievement occurred in contracted "partner" schools as well as traditional public schools, providing the first substantial evidence that the city's public-private school management experiment, aimed at turning around the district's lowest-performing schools, was working. Paul Vallas gave considerable credit to Philadelphia's education partners for the district's success, saying they were "a key part of the school district's dramatic turnaround." Besides Edison Schools, the district's partners are Foundations Inc., Victory Schools, Universal Companies, Temple University, and the University of Pennsylvania. Data from Edison Schools demonstrates the usefulness of analyzing gains made by low-performing students, rather than just measuring absolute student proficiency rates. Twelve of Edison's 20 schools made AYP on this year's report, up from just one school last year. However, on the 2004 PSSA tests, Edison's Philadelphia schools posted an average annual gain of approximately 10.2 percentage points in fifth- and eighth-grade students scoring at proficient or above in reading, with a corresponding gain of approximately 9.6 percentage points in math. In the years prior to the Edison-District partnership, those same 20 schools had averaged annual gains of less than one-half of 1 percentage point. Edison helped raise student achievement for the entire School District of Philadelphia by prompting the district to adopt Edison's comprehensive benchmarking system for increasing student achievement. Edison's benchmark testing program, aligned with the state's assessment system, has an instant feedback loop that allows teachers to immediately know their students'

22 Reason Foundation
academic weaknesses and tailor their lesson plans to meet student needs. The program assesses student achievement every six weeks to monitor progress toward state grade-level standards. In Philadelphia test score data does not necessarily show privately managed schools outperforming district-managed schools. Instead, there have been generally positive test score results across both district-managed and provider-managed schools. In 2006 student achievement gains continued in Philadelphia, 41.8 percent of students in all four grades scored at the advanced or proficient levels in math, a 4.4 percent improvement over 2004-05 and a 22.3 percent improvement from 2001-02.37 In reading, 38 percent of students reached advanced or proficient, a 2.5 percent growth rate from last year and 14.1 percent higher than the benchmark year. In addition, more schools have met federal standards for adequate yearly progress. In 2002, only 22 out of 258 schools districtwide met AYP. In early 2006, 132 schools out of 268 did.38 In 2006 the use of the private sector to manage schools in Philadelphia continued to expand. Edison began managing two new schools. In addition, Microsoft Inc., The Franklin Institute, and the National Constitution Center began work with the district to develop new high schools.39
2. Chicago Chicago is another example of a diverse provider model where outside organizations run low-performing schools. Chicago’s Mayor Richard Daley instituted “Renaissance 2010”—a plan to shut down Chicago’s failing public schools and open 100 new schools by 2010. The plan will allow 30 new charter schools and 30 new contract schools created by private groups that sign five-year performance contracts with the district. All of the new schools will get more freedom from district regulations than regular Chicago schools. The plan will also allow 60 of the 100 schools to operate outside the Chicago Teachers Union contract. Chicago opened twelve Renaissance 2010 Schools for the 2006/2007 school year in addition to the eleven that were opened in 2005.40 To date, 38 new schools have opened in Chicago. The Chicago School District has also seen student achievement gains since implementing Renaissance 2010. In 2006 the Chicago Public Schools reached all-time highs on the elementary school-level Illinois Standards Achievement Test (ISAT), with students in most cases making double-digit gains in all grades over all subjects. The results show the district's systemwide composite for reading, math and science rose to a new high of 62.5 percent of all students meeting or exceeding state standards. That is up 15.2 percentage points from the previous all-time high of 47.3 percent of all students meeting or exceeding state standards reached in 2005, and represents the largest one-year jump in test scores since Daley assumed responsibility for the schools in 1995.
NO CHOICES LEFT BEHIND 23
Since 2000 alone, the first year ISATs were administered, CPS's system-wide composite score has increased 26.5 percentage points. In 2000, only 36 percent of all students met or exceeded state standards. The gains were reflected across the entire 600-plus school system, with 96 percent of schools improving in math, and 92 percent improving in reading and science. The effort to create new schools under Renaissance 2010 is also succeeding, with an average gain in composite score of 27 percentage points in new schools created since 2001.41 The bottom line in Chicago and Philadelphia is that competition and cooperation between public and private providers has led to increased student achievement for all students. In districts like Compton, San Bernardino, and Santa Ana among the 162 districts with high concentrations of failing schools and students, the state should create enabling legislation to allow those districts to immediately bid out all the failing schools in the district.
D. An Increase in Charter School Market Share The number of charters in 40 states and the District of Columbia rose 11 percent from 3,600 to 3,977 nationwide.42 There are now approximately 1.15 million students attending charter schools across the country. In 2006 California opened 60 new charter schools and currently has 625 charter schools with 220,000 students.43 Charter schools are working in California. A new report by the California Charter Schools Association summarizes 12 studies on student achievement in California charter schools that all found charter schools having a positive impact on the public education system. The studies were commissioned by a variety of different organizations including think tanks, government agencies, universities, and newspapers. For example, a 2005 analysis by the Los Angeles Times found that charter schools showed stronger year-to-year improvement than non-charters, especially in Los Angeles Unified. Overall, California’s charter schools scored an average gain of 28 points on the API over the previous year. Traditional public schools scored an average gain of 20 points over the previous year. In LA Unified, charters outperformed traditional schools in both scores and achievement gains. Charters scored 715 to 677 by non-charters and improved their scores by 30 points while non-charters grew by 20 points.44 With more than one million students enrolled in charter schools nationwide, some individual communities are seeing large numbers of students enrolled in charter schools. When charter schools have a larger percentage of market share in individual communities it strengthens the chances that charters can be a force for broader system change. A new study on charter school market share from the National Alliance for Public Charter Schools examines large market share in individual communities45:
While charter schools enroll a modest percentage of students nationwide, some communities far exceed national and state averages to enroll high percentages of charter school students. In fact, 19 different communities educate over 13% of their public school students in charter schools (and ties account for 19 different communities being represented in our top "ten").
24 Reason Foundation
New Orleans leads the pack with 69% market share, due primarily to the post-Katrina reconstitution of the schools. Ohio has FIVE different communities in the top ten, with Dayton leading the pack at the #2 spot on our countdown with 28%. Alliance home base and our nation's capital, Washington D.C., comes in at #3 with 25%. And the largest community on the list is Detroit, with 18% of its nearly 160,000 students in public charters.46
California should consider following the lead of New Orleans for its lowest-performing school districts. The New Orleans public school system—one of the worst in America before Hurricane Katrina, demonstrates the promise charters can hold for school districts with large numbers of failing schools. When New Orleans public school students went back to school in September, they did so in a system transformed by tragedy. A year after Katrina, the city now has the only public school system in America offering unfettered school choice to parents. The most important change is the lack of residency requirements: any student living anywhere in the city can register at any school on a first-come, first-serve basis. (If individual schools are oversubscribed, a lottery will be used to determine who gets to attend.) This year, students can choose from 31 charters, 17 state-run schools, and five run by the local district. Twenty-five different organizations, such as nonprofits and national charter schools, are running schools, and the options run from comprehensive curriculums to niche schools featuring early college, French immersion, Montessori, the Arts, and architectural design. As the local Times-Picayune told parents, "Think of yourselves as consumers in a brand new marketplace."47 Through local radio and television advertising, school enrollment fairs, visits to local churches and community groups, and roadside signs, schools are aggressively marketing to parents. Critics predicted chaos all summer. In August, the New York Times ran a negative piece headlined “Rough Start for State's Efforts to Remake Faltering Schools in New Orleans."48 Tulane University education Professor Lance Hill told the Times , “We've created the most balkanized school system in North America. The average parent is mystified.”49 But as the Times-Picayune reported a month later, 53 schools opened with 34,000 students to relative calm and few snafus. Parents somehow managed to navigate their choices and enroll their children in charters and other schools.50 Very few failing schools in California have chosen charter schools as a restructuring option. But a few grassroots efforts have resulted in new charter schools for students in failing schools. While the majority of schools in California have not engaged in the most serious restructuring efforts, a few outliers have transformed schools through grassroots efforts of parents and teachers. In 2004, three low-performing schools in San Diego Unified decided to convert to charter schools. The schools had failed to meet their performance targets for six consecutive years and were facing NCLB's highest level of sanctions. In accordance with the law, the school board issued a request for proposals to restructure the schools. Working groups of parents, teachers, administrators and community leaders were formed at each school site to consider various options.

NO CHOICES LEFT BEHIND 25
Reorganized as nonprofit organizations that control their budgets and personnel, the schools are free to carry out changes under the leadership of their executive directors and governing boards comprised of parents, community leaders, university representatives and staff members. The schools have five years to prove they can do a better job than the district, or their charters—contracts for self-management—can be revoked. The charter school parents chose to replicate existing successful charter schools. King/Chavez Academy for Excellence, a charter management organization which is operating (Martin Luther) King Elementary, has had phenomenal success with a K-8 school in the same neighborhood, raising its Academic Performance Index, or API, over 170 points in just two years. The team from UCSD that is proposing to mentor Gompers has a great track record with the Preuss School, a charter middle/high school that consistently ranks among the top schools on API. Last year, 100 percent of Preuss's first graduating class was accepted into college. This is the first time the three schools have hired their own employees. Seventy-five percent of the staffers at Gompers are new to the campus. Half of Keiller's staff is new, and the entire staff at King/Chavez is new. All of the schools are offering teacher pay comparable to or higher than the district's pay scale. According to a new Education Sector report by Joe Williams and Thomas Toch, the three San Diego charter schools made significant academic gains in their first year:51
Keiller’s score on California’s Academic Performance Index, a composite standardized-testing rating that is reported on a scale of 200 to 1,000, climbed 50 points, from 638 to 687 between 2004–05 and 2005–06, compared to an average gain of 7 points in San Diego’s 216 traditional public schools and an 11-point gain statewide. Gompers’ score rose 24 points, from 540 to 564. As one large elementary school, King-Chavez had an API score of 559. The API scores at the three small charter schools formed in its footprint rose dramatically: to 631 at King-Chavez Arts; 683 at King-Chavez Athletics; and 675 at King-Chavez Primary.
Similarly, in Sacramento since fall of 2003, Sacramento High has operated as an independent charter school run by St. HOPE Corp., a nonprofit agency. Sacramento High converted to a charter school after a hard-fought grassroots effort. Sacramento High has seen a 60-point jump in its Academic Performance Index in the two years it's been a charter school. In 2006 in Los Angeles a grassroots effort by parents has resulted in five new Green Dot Public Schools opening around the low-performing Jefferson High School. The majority of Jefferson’s freshman class has now enrolled in charter schools.52 California needs specific legislation to increase charter school market share and give students in failing traditional schools more new school capacity in innovative charter school programs. Charter school conversion should be a more common restructuring tool, rather than an exception.
26 Reason Foundation
California should follow Colorado’s lead and adopt specific legislation that makes it easier for parents to work toward converting failing schools to charters. In Colorado charter school conversion is required by law after a school earns a state rating of "unsatisfactory" for three consecutive years. Those ratings are based on state test scores. In 2005, Cole Middle School in northeast Denver this fall became the first school to face the ultimate sanction under Colorado's education reform law—conversion to a charter.State Board of Education members received proposals from several charter school operators before recommending the Knowledge Is Power Program to the Denver school board, which approved the final contract with the charter schools network. While California does not have to make a charter school conversion mandatory, the law should give parents that option if a majority of parents petition for a charter school conversion. In addition to making it easier for parents to convert failing schools to charters, California should implement a multi-authorizer charter school law that allows other organizations such as universities or the mayor’s office to authorize charters. The competition between charter school authorizers could help set best practices and allow a large increase in the number of charter schools in the state.

NO CHOICES LEFT BEHIND 27
P a r t 4
Recommendations
A. Implement weighted student formula at the state level. California should take advantage of its unique centralized school funding system and implement a state-level weighted student formula that would fund students based on their individual characteristics. The weighted student formula would make other reforms such as opportunity scholarships, charter schools, and contract schools more feasible because it would eliminate arguments about the funding level for each sector. Instead, students would be worth the same amount regardless of the education service provider they chose. The weighted student formula would create an equitable funding stream, give all principals more control over their budgets, and let students choose their schools. If state-level implementation is not feasible, the state should offer districts financial incentives by offering waivers to state-level categorical mandates that limit discretionary funding to those districts willing to implement weighted-student formula financing schemes with principal control and public school choice.
B. Initiate opportunity scholarships. Students in schools designated as failing under the No Child Left Behind Act that cannot be transferred to a higher-performing public school should be immediately eligible for an opportunity scholarship that would allow the child to take his per-pupil funding to any public, private, or charter school that has capacity and is willing to participate. In several urban areas in California, without public school transfer options for students in low-performing schools, there is existing private school capacity. These students should not have to languish for years in low-performing schools but should immediately transfer to any available private, public, or charter school. In addition, any student in a public school that has been deemed failing for more than three years should be eligible for an immediate opportunity scholarship to take his funding to an available school of his choice. Finally, any individual student that scores below basic on the state STAR test for two consecutive years should be eligible for an opportunity scholarship. These scholarships would be funded based on a student’s per-pupil allocation as determined through the weighted student formula funding mechanism.

28 Reason Foundation
C. Competitively bid for education providers to run schools in failing districts. In school districts with large concentrations of failing schools, districts should invite outside organizations to immediately takeover failing schools and run the schools on performance-based contracts that require improvements in student achievement over time. California should let organizations bid to run failing schools similar to the Philadelphia approach that has universities, nonprofits, and for-profit companies managing the city’s worst-performing schools. More specifically, competitive bids could be tied to school performance. School districts with schools with a “Similar Schools” ranking of 1 or 2 for three consecutive years should be required to allow charter schools to competitively bid to operate the school.
D. Increase charter school capacity. Parents and teachers stuck with low-performing schools should be able to convert to a charter school without the school district’s approval, providing they are held accountable. Enabling legislation should be created that allows parents and other stakeholders to develop and start a charter school when a majority of parents petition to start a new school. In addition, charter school capacity could drastically increase in California by letting local government, universities, and nonprofits authorize and monitor charter schools.
E. Dismantle multiple accountability schemes. In California the state should dismantle the cumbersome school accountability process and redirect resources toward more discretionary funds to be available through the weighted student formula. California does not need years of “process-oriented” interventions that do little to change the bottom line of students stuck in low-performing schools. California should use the New Orleans model for failing schools and allow parents and children to choose the best possible options through a more competitive market of public, private, and charter schools.
F. Mandate meaningful school restructuring reform. Rather than employing state-level intervention programs, the state should mandate that those schools with five or more years of school failure must choose a competitive school restructuring option that offers students meaningful alternatives to the current public school system including:
offering opportunity scholarships to students in failing schools;
competitively bidding out the school to outside operators;
restructuring the district to a weighted student formula system where a student could choose any school in the district, or
converting the school to a charter school.

NO CHOICES LEFT BEHIND 29
P a r t 5
Conclusion
alifornia has a complex school improvement process for low-performing schools that can subject individual schools to up to four different school accountability schemes with different
rules, deadlines, and sanctions. Yet these programs are long on process and short on outcomes. Students can languish in failing schools for years with no reasonable hope they will ever attend a higher-performing school. California needs an accountability system that is responsive to the individual child, not the failing institution. The cornerstone of California’s school accountability system should be decentralized school funding where the money follows the child into the public, charter, or private school of his parent’s choice. Standards are not enough. Competition is an important incentive to help low-performing schools to better serve their students.
C

30 Reason Foundation
About the Author
isa Snell directs the Education Program at Reason Foundation, where she oversees research on education issues.
Ms. Snell has testified before the California state legislature and numerous government agencies, and has recently authored policy studies on universal preschool, school violence, charter schools, and child advocacy centers. Ms. Snell is a frequent contributor to Reason magazine. She regularly contributes to School Reform News and Privatization Watch. Her commentary has also appeared in The Wall Street Journal, USA Today, San Francisco Chronicle, the Orange County Register, Los Angeles Daily News, and numerous other publications. Ms. Snell is also the President of the Board of the California Virtual Academy, which is a K12 virtual charter school. Before joining Reason Foundation, Ms. Snell taught public speaking and argumentation courses at California State University, Fullerton.
L

NO CHOICES LEFT BEHIND 31
Related Reason Foundation Studies
Driving More Money into the Classroom: The Promise of Shared Services October 2005 Policy Study 339 By William D. Eggers, Lisa Snell, Robert Wavra, and Adrian T. Moore
California's K-12 Education Primer May 2005 Policy Brief 40 By Lisa Snell
School Accountability Reforms Only Work With Parental Involvement March 2005 Policy Update 34 By Chuck Poochigian
School Violence and No Child Left Behind: Best Practices to Keep Kids Safe January 2005 Policy Study 330 By Lisa Snell
Addition and Subtraction: State and Local Regulatory Obstacles to Opening a New Private School December 2004 Policy Study 329 By Bahaa Seireg

32 Reason Foundation
Endnotes
1 Chester E. Finn, Jr., Michael J. Petrelli, Liam Julian, The State of State Standards 2006
(Washington D.C.:Thomas B. Fordham Foundation, August 29, 2006). 2 Centennial High API score at Greatschools.net,
http://www.greatschools.net/modperl/achievement/ca/1592. 3 Centennial High 2005 test scores at Greatschools.net, http://www.greatschools.net/cgi-
bin/ca/cat6_bytest/1592/ 4 Centennial High test scores at Greatschools.net,
http://www.greatschools.net/modperl/achievement/ca/1592. 5 Joe Mathews, “Ailing School, Bold Achiever,” Los Angeles Times, June 13, 2001. 6 “State Superintendent Jack O’Connell Releases Accountability Progress Report,” California
Department of Education Press Release, August 31, 2006. http://www.cde.ca.gov/nr/ne/yr06/yr06rel96.asp
7 National Center for Education Statistics, “The Nation’s Report Card, State Reading 2005,” California Snapshot Report, http://nces.ed.gov/nationsreportcard/pdf/stt2005/2006452CA4.pdf.
8 Ibid. 9 Tanya Schevitz, “SAT Scores Decline in Nation and State—Rise in San Francisco, San Jose,”
San Francisco Chronicle, August 30, 2006. 10 Lisa Snell, “No Way Out,” Reason, October 2004. 11 No Child Left Behind: Education Needs to Provide Additional Technical Assistance and
Conduct Implementation Studies for School Choice Provisions, General Accounting Office, December 2004.
12 Clint Bolick, “Four Million Children Left Behind,” The Wall Street Journal, September 7, 2006.
13 National Test Case Against Los Angeles and Compton School Districts Demanding Public School Transfer Options Under No Child Left Behind Act, press release, Alliance for School Choice, March 23, 2006.
14 Williamson M. Evers and Lance T Izumi, “Fixing Failing Schools in California,” in John E. Chubb, Editor, Within Our Reach: How America Can Educate Every Child (New York: Rowman and Littlefield, 2005).
15 Ibid. 16 Wolf DiBiase, State Involvement in School Restructuring.

NO CHOICES LEFT BEHIND 33
17 Ibid. 18 Ibid. 19 “3 Schools May Face Tougher Sanctions,” Sacramento Bee, September 29, 2005. 20 Ibid. 21 Laurel Rosenhall, “Will Bill to Cut Class Size Help?” Sacramento Bee, August 31, 2006. 22 Mike Antonucci, California Redoubles Its Efforts, Education Intelligence Agency,
Communiqué September 5, 2006. 23 Brian M. Stecher, Daniel F. McCaffey, and Debra Bugliari, The Relationship Between
Exposure to Class Size Reduction and Student Achievement in California (Santa Monica, CA: RAND Corporation, November, 2003).
24 An unresolved issue is whether parents are allowed to pay a private school more than the per-pupil allotment or whether a private school might charge less than the per-pupil allotment. Many free-market scholars have argued that kids need more purchasing power in order to improve the types of schools that enter the market.
25 Education Trust West, California’s Hidden Teacher Spending Gap: How State and District Budgeting Practices Shortchange Poor and Minority Students and Their Schools, February 2005. http://www.hiddengap.org/report/
26 Ibid. 27 For a more-detailed discussion of weighted student formula see William G. Ouchi and Lydia
G. Segal, Making Schools Work: A Revolutionary Plan to Get Your Children the Education They Need (New York: Simon & Schuster, 2003).
28 All data for San Francisco Schools adapted from Lisa Snell, “The Agony of American Education,” Reason, April 2006.
29 “Principal Principles,” The New York Post, June 26,2006. 30 Arin Gencer, “Plan Aims to Boost School Choice, New Campuses in the Pico-Union Area
would get Freedoms Similar to those of Charter Sites.” Los Angeles Times, July 25, 2006. 31 Lisa Snell, “School Vouchers as a Legal Sanction,” Howard Law Journal, No. 2, Winter 2002. 32 Karla Scoon Reid, “From Worst to First, 2001” Education Week 32 (Apr. 11). 33 Jay P. Greene, An Evaluation of the Florida A-plus Accountability and School Choice
Program 4 (Harvard Program on Education Policy and Governance, Harvard University, Feb. 2001).
34 Rajashri Chakrabarti is a doctoral candidate in economics at Cornell University. These results are from her paper “Impact of Voucher Design on Public School Performance: Evidence from Florida and Milwaukee Voucher Programs.”
35 Scott Jensen, Choice and Accountability: Using School Choice to Overcome Failing Academic Performance, Alliance for School Choice, August 2006. http://www.allianceforschoolchoice.org/_DOCs/Failing_Schools_Paper.pdf
36 Katie Byard and Stephanie Warsmith, “Vouchers In Session,” The Beacon Journal, September 10, 2006.

34 Reason Foundation
37 Mensah M. Dean, “Read’ Em and Smile: 5th Year of Better School Test Scores,” Philadelphia
Daily News, July 28, 2006. 38 “Upward Bound: The Success of Philadelphia School Reform,” The Philadelphia Inquirer,
July 3, 2006. 39 Jolley Bruce Christman, Eva Gold, and Benjamin Herold, Privatization “Philly Style”: What
Can be Learned From Philadelphia’s Diverse Provider Model for School Management? Research For Action, June 2006. http://www.researchforaction.org/publication/pdf_file/37/Christman_J_Privatization_Philly_Style_2006.pdf
40 “The Renaissance Schools Fund Announces Opening of Twelve New Schools for the 2006-2007 School Year,” Business Wire, September 5, 2006.
41 “Mayor Daley Announces Largest One-Year Jump in Test Scores,” US States News, July 11, 2006.
42 “National Charter School Data, New School Estimates 2006-2007,” The Center for Education Reform, http://www.edreform.com/_upload/CER_charter_numbers.pdf
43 Ibid. 44 “Charter School Success: A Summary of the Current Research in California’s Effectiveness at
Improving Student Achievement,” California Charter Schools Association, August 30, 2006. 45 “Top 10 Charter Communities By Market Share,” National Alliance for Public Charter
Schools, September 7, 2006. http://www.publiccharters.org/content/publication/detail/1420/ 46 Ibid. 47 Steve Ritea, “Public Schools Compete for Kids; New Array of Choices Give Parents Power,”
Times-Picayune, August 12, 2006. 48 Susan Saulny, “Rough Start for State’s Efforts to Remake Faltering Schools in New Orleans,
The New York Times, August 21, 2006. 49 Ibid. 50 Steve Ritea and Rob Nelson, “Schools Open in New Orleans,” The Times-Picayune,
September 7, 2006. 51 Joe Williams and Thomas Toch, Extreme Makeover: Two Failing San Diego Schools Get New
Start as Charters (Washington D.C.: Education Sector) November 28, 2006. http://www.educationsector.org/analysis/analysis_show.htm?doc_id=428171
52 Carla Rivera, “Charter Schools Open Amid Anxiety, Hope,” Los Angeles Times, August 29, 2006.

Reason Foundation3415 S. Sepulveda Blvd., Suite 400
Los Angeles, CA 90034310/391-2245
310/391-4395 (fax)www.reason.org