No Activity Sporadic Local Regional Widespread · No Activity Sporadic Local Regional Widespread...
12
No Activity Sporadic Local Regional Widespread New Jersey Activity Level: HIGH Current week last year: HIGH Regional 4 Data Northwest: HIGH Northeast: HIGH Central West: HIGH Central East: HIGH South: HIGH Current Week Past 3 Weeks Cumulative Total Influenza A H1N1 (2009) 15 85 145 Influenza A H3N2 80 478 957 Influenza B 354 1067 1762 Rapid Influenza Tests 2382 6160 9444 Influenza Activity Level 3 ILI 5 Activity Report also available at http://nj.gov/health/cd/statistics/flu-stats/ Week 40 Week 45 Week 50 Week 3 Week 8 Week 13 Week 18 Week 23 Week 28 Laboratory Testing 8 Respiratory Virus Surveillance Report 1 New Jersey Department of Health Communicable Disease Service Week ending February 10, 2018 (MMWR week 6 2 ) Percent ILI/Absenteeism 5 Baselines Current Week (range by county) Last week Current year Current week Last year Non-season 6 (Seasonal Average– low, high) 7 Long Term Care Facilities 0.72 (0.00, 1.84) 0.70 0.88 0.48 (0.45, 0.76) Schools (absenteeism) 6.25 (3.37, 10.28) 5.46 4.70 3.36 (4.49, 4.86) Emergency Departments 10.71 (0.42, 16.22) 8.59 5.89 2.21 (3.17, 3.92)
Transcript of No Activity Sporadic Local Regional Widespread · No Activity Sporadic Local Regional Widespread...

No Activity Sporadic Local Regional Widespread
New Jersey Activity Level: HIGH
Current week last year: HIGH
Regional4 Data
Northwest: HIGH
Northeast: HIGH
Central West: HIGH
Central East: HIGH
South: HIGH
Current Week Past 3 Weeks Cumulative Total
Influenza A H1N1 (2009) 15 85 145
Influenza A H3N2 80 478 957
Influenza B 354 1067 1762
Rapid Influenza Tests 2382 6160 9444
Influ
enza
Activ
ity L
evel 3
ILI
5 Activ
ity
Report also available at http://nj.gov/health/cd/statistics/flu-stats/
Week 40 Week 45 Week 50 Week 3 Week 8 Week 13 Week 18 Week 23 Week 28
Lab
ora
tory
Testin
g8
Respiratory Virus Surveillance Report1
New Jersey Department of Health
Communicable Disease Service
Week ending February 10, 2018 (MMWR week 62)
Percent ILI/Absenteeism5 Baselines
Current Week
(range by county)
Last week
Current year
Current week
Last year
Non-season6
(Seasonal Average–
low, high)7
Long Term Care
Facilities
0.72
(0.00, 1.84) 0.70 0.88
0.48
(0.45, 0.76)
Schools
(absenteeism)
6.25
(3.37, 10.28) 5.46 4.70
3.36
(4.49, 4.86)
Emergency
Departments
10.71
(0.42, 16.22) 8.59 5.89
2.21
(3.17, 3.92)
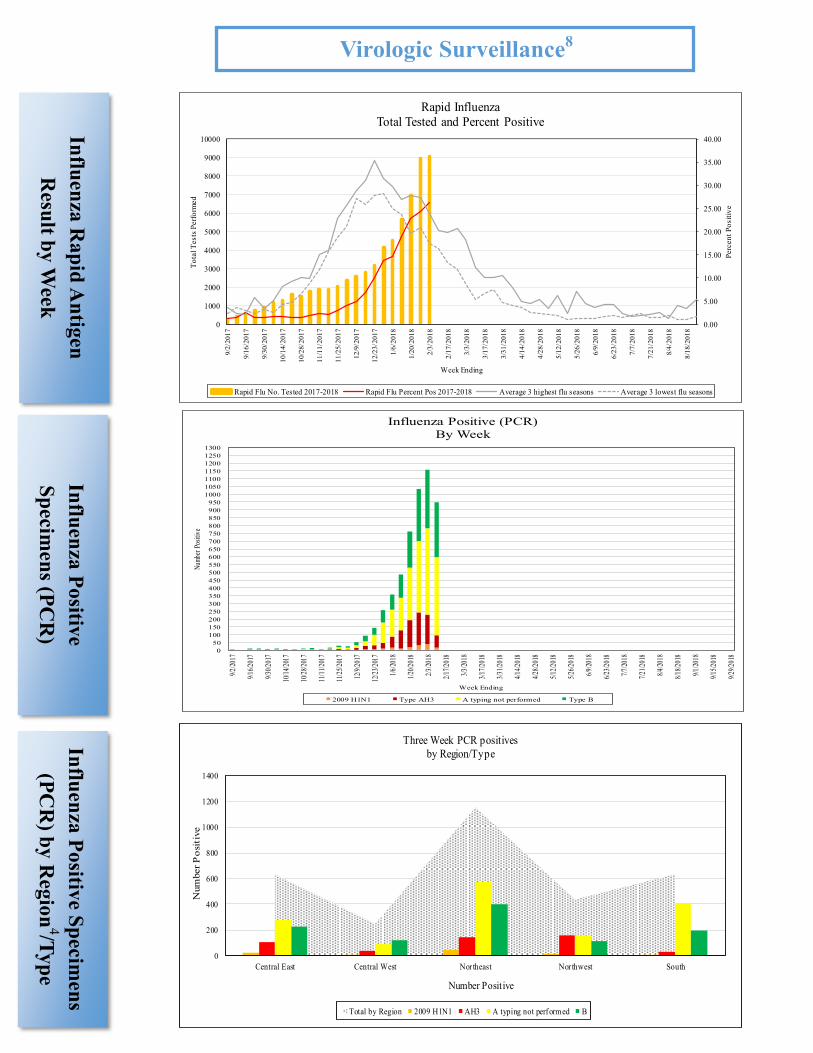
Influ
enza
Po
sitive
Sp
ecimen
s (PC
R)
Influ
enza
Positiv
e S
pecim
ens
(PC
R) b
y R
egio
n4/T
yp
e
Virologic Surveillance8
Influ
enza
Rap
id A
ntig
en
Resu
lt by W
eek
0
200
400
600
800
1000
1200
1400
Central East Central West Nor theast Nor thwest South
Num
ber
Po
siti
ve
Number Positive
Three Week PCR positives
by Region/Type
Total by Region 2009 H1N1 AH3 A typing not performed B
0
50
100
150
200
250
300
350
400
450
500
550
600
650
700
750
800
850
900
950
1000
1050
1100
1150
1200
1250
1300
9/2/
2017
9/16
/201
7
9/30
/201
7
10/1
4/20
17
10/2
8/20
17
11/1
1/20
17
11/2
5/20
17
12/9
/201
7
12/2
3/20
17
1/6/
2018
1/20
/201
8
2/3/
2018
2/17
/201
8
3/3/
2018
3/17
/201
8
3/31
/201
8
4/14
/201
8
4/28
/201
8
5/12
/201
8
5/26
/201
8
6/9/
2018
6/23
/201
8
7/7/
2018
7/21
/201
8
8/4/
2018
8/18
/201
8
9/1/
2018
9/15
/201
8
9/29
/201
8
Num
ber
Posi
tive
Week Ending
Influenza Positive (PCR)
By Week
2009 H1N1 Type AH3 A typing not performed Type B
0.00
5.00
10.00
15.00
20.00
25.00
30.00
35.00
40.00
0
1000
2000
3000
4000
5000
6000
7000
8000
9000
10000
9/2
/2017
9/1
6/2
017
9/3
0/2
017
10/1
4/2
01
7
10/2
8/2
01
7
11
/11
/20
17
11
/25
/20
17
12/9
/2017
12
/23
/20
17
1/6
/2018
1/2
0/2
018
2/3
/2018
2/1
7/2
018
3/3
/2018
3/1
7/2
018
3/3
1/2
018
4/1
4/2
018
4/2
8/2
018
5/1
2/2
018
5/2
6/2
018
6/9
/2018
6/2
3/2
018
7/7
/2018
7/2
1/2
018
8/4
/2018
8/1
8/2
018
Perc
en
t P
osit
ive
To
tal T
ests
Perf
orm
ed
Week Ending
Rapid Influenza
Total Tested and Percent Positive
Rapid Flu No. Tested 2017-2018 Rapid Flu Percent Pos 2017-2018 Average 3 highest flu seasons Average 3 lowest flu seasons

Em
ergen
cy D
epa
rtmen
t9 V
isits
Percen
t du
e to
ILI
Em
ergen
cy D
epa
rtmen
t9
Percen
t of A
dm
ission
s du
e to IL
I
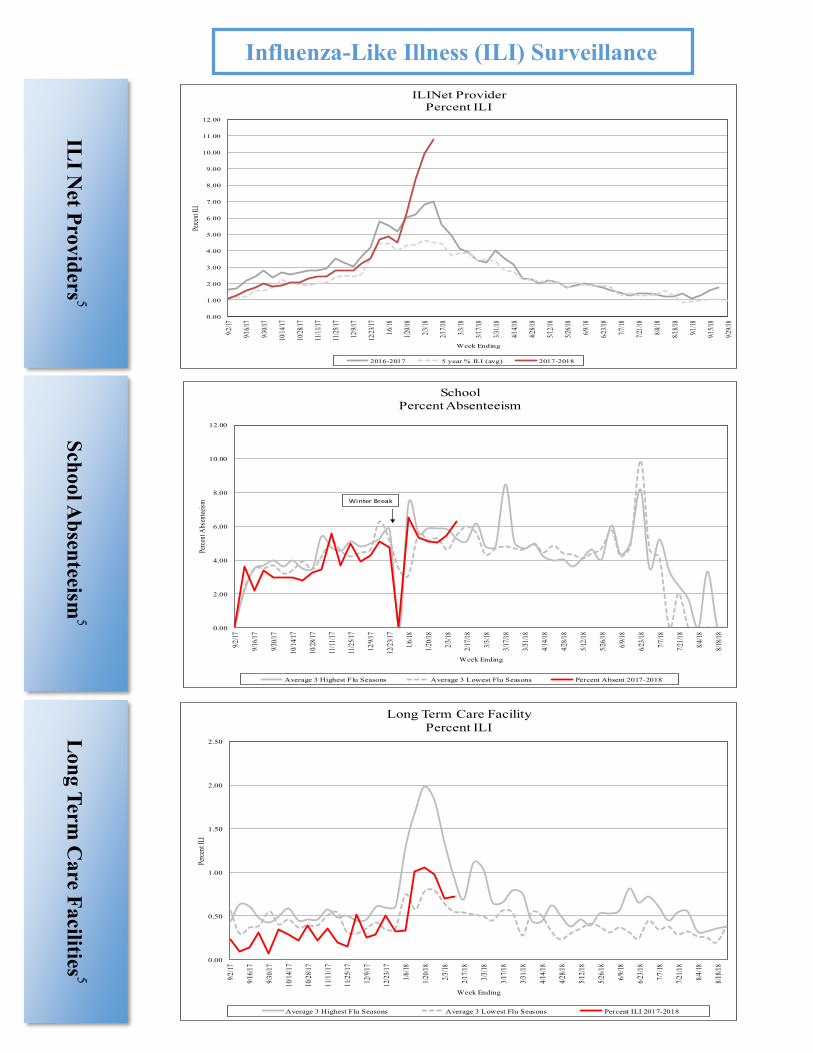
Influenza-Like Illness (ILI) Surveillance
Em
ergen
cy D
epa
rtmen
t9 V
isits
Percen
t of IL
I By
Ag
e Gro
up
Emergency Department Visits - By Age Group
% of Visits Attributed to ILI
Age Group 0-4 yrs Age Group 5-24 yrs Age Group 25-49 yrs Age Group 50-64 yrs Age Group 65+ yrs
0.00
2.00
4.00
6.00
8.00
10.00
12.00
14.00
9/2/
2017
9/16
/201
7
9/30
/201
7
10/1
4/20
17
10/2
8/20
17
11/1
1/20
17
11/2
5/20
17
12/9
/201
7
12/2
3/20
17
1/6/
2018
1/20
/201
8
2/3/
2018
2/17
/201
8
3/3/
2018
3/17
/201
8
3/31
/201
8
4/14
/201
8
4/28
/201
8
5/12
/201
8
5/26
/201
8
6/9/
2018
6/23
/201
8
7/7/
2018
7/21
/201
8
8/4/
2018
8/18
/201
8
Per
cen
t IL
I
Week Ending
Percent of Emergency Department
Visits due to ILI
Percent ILI Visits 2017-2018 Average 3 Highest Flu Seasons Average 3 Lowest Flu Seasons
0.00
1.00
2.00
3.00
4.00
5.00
6.00
7.00
9/2
/2017
9/1
6/2
01
7
9/3
0/2
01
7
10
/14
/20
17
10
/28
/20
17
11/1
1/2
017
11/2
5/2
017
12
/9/2
01
7
12
/23
/20
17
1/6
/2018
1/2
0/2
01
8
2/3
/2018
2/1
7/2
01
8
3/3
/20
18
3/1
7/2
01
8
3/3
1/2
01
8
4/1
4/2
01
8
4/2
8/2
01
8
5/1
2/2
01
8
5/2
6/2
01
8
6/9
/2018
6/2
3/2
01
8
7/7
/20
18
7/2
1/2
01
8
8/4
/2018
8/1
8/2
01
8
Per
cen
t IL
I
Week Ending
Percent of Emergency Department
Admissions due to ILI
Percent ILI Admissions 2017-2018 Average 3 Highest Flu Seasons Average 3 Lowest Flu Seasons
Sch
oo
l Ab
senteeism
5
Lo
ng
Ter
m C
are F
acilities
5
0.00
1.00
2.00
3.00
4.00
5.00
6.00
7.00
8.00
9.00
10.00
11.00
12.00
9/2/
17
9/16
/17
9/30
/17
10/1
4/17
10/2
8/17
11/1
1/17
11/2
5/17
12/9
/17
12/2
3/17
1/6/
18
1/20
/18
2/3/
18
2/17
/18
3/3/
18
3/17
/18
3/31
/18
4/14
/18
4/28
/18
5/12
/18
5/26
/18
6/9/
18
6/23
/18
7/7/
18
7/21
/18
8/4/
18
8/18
/18
9/1/
18
9/15
/18
9/29
/18
Perc
ent I
LI
Week Ending
ILINet Provider
Percent ILI
2016-2017 5 year % ILI (avg) 2017-2018
Influenza-Like Illness (ILI) Surveillance
ILI N
et Pro
vid
ers5
0.00
2.00
4.00
6.00
8.00
10.00
12.00
9/2/
17
9/16
/17
9/30
/17
10/1
4/17
10/2
8/17
11/1
1/17
11/2
5/17
12/9
/17
12/2
3/17
1/6/
18
1/20
/18
2/3/
18
2/17
/18
3/3/
18
3/17
/18
3/31
/18
4/14
/18
4/28
/18
5/12
/18
5/26
/18
6/9/
18
6/23
/18
7/7/
18
7/21
/18
8/4/
18
8/18
/18
Perc
ent A
bsen
teei
sm
Week Ending
School
Percent Absenteeism
Average 3 Highest Flu Seasons Average 3 Lowest Flu Seasons Percent Absent 2017-2018
Winter Break
0.00
0.50
1.00
1.50
2.00
2.50
9/2/
17
9/16
/17
9/30
/17
10/1
4/17
10/2
8/17
11/1
1/17
11/2
5/17
12/9
/17
12/2
3/17
1/6/
18
1/20
/18
2/3/
18
2/17
/18
3/3/
18
3/17
/18
3/31
/18
4/14
/18
4/28
/18
5/12
/18
5/26
/18
6/9/
18
6/23
/18
7/7/
18
7/21
/18
8/4/
18
8/18
/18
Perc
ent I
LI
Week Ending
Long Term Care Facility
Percent ILI
Average 3 Highest Flu Seasons Average 3 Lowest Flu Seasons Percent ILI 2017-2018

Influenza Season US (fatal) NJ (severe) NJ (fatal)
2012-2013 171 89 7
2013-2014 108 54 6
2014-2015 146 33 1
2015-2016 85 47 1
2016-2017 109 39 0
2017-2018 63 37 1
Respiratory Outbreaks in Long Term Care Facilities10
Cumulative Outbreaks 2017-2018 Season 131
No. outbreaks last 3 weeks 49
Regions with recent outbreaks NW, NE, CW, CE, S
Lo
ng
Ter
m C
are
Ou
tbrea
ks
Ped
iatric
Influ
enza
Mo
rtality
11
Influenza-Like Illness (ILI) Surveillance
Viral Respiratory Surveillance
Non-Influenza
0.00
5.00
10.00
15.00
20.00
25.00
30.00
0
500
1000
1500
2000
2500
Per
cent
Pos
itiv
e
Tot
al T
ests
Per
form
ed
Week Ending
RSV Data
Total Tested and Percent
Tests Performed 17-18 % positive 2017-2018 % positive (5 year average)
Resp
irato
ry S
yn
cy
tial V
irus
Percen
t Po
sitive
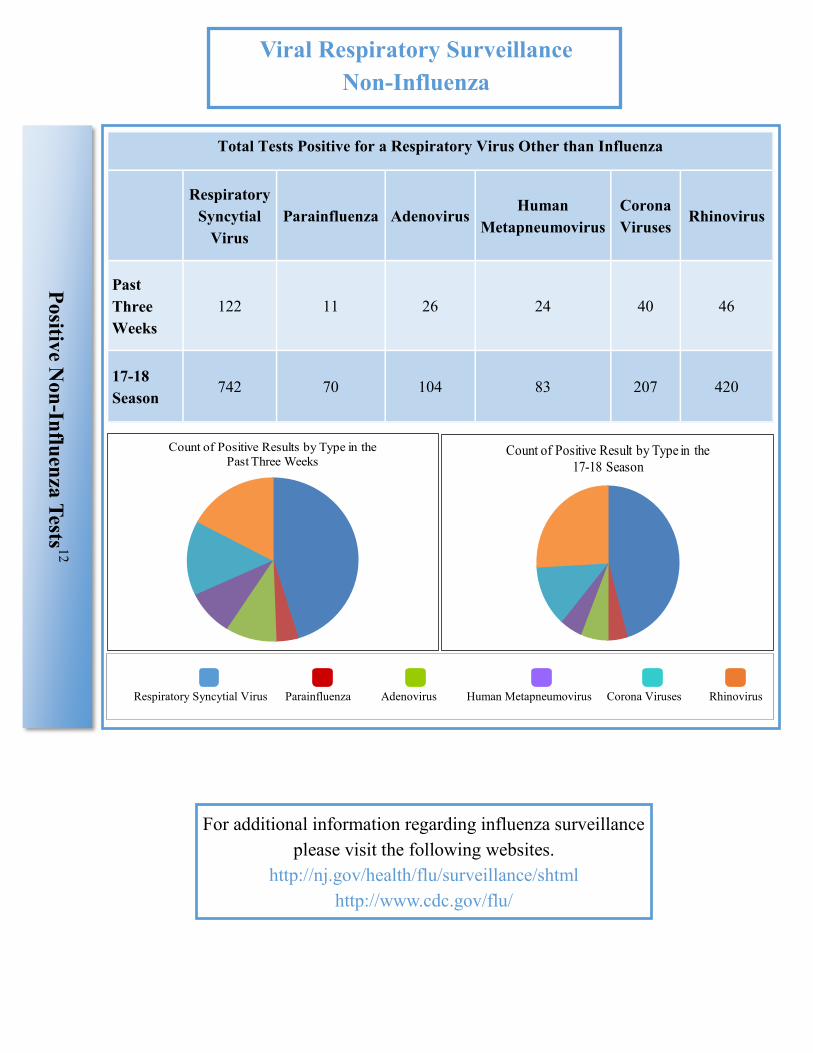
Total Tests Positive for a Respiratory Virus Other than Influenza
Respiratory
Syncytial
Virus
Parainfluenza Adenovirus Human
Metapneumovirus
Corona
Viruses Rhinovirus
Past
Three
Weeks
122 11 26 24 40 46
17-18
Season 742 70 104 83 207 420
Count of Positive Results by Type in the
Past Three Weeks Count of Positive Result by Type in the
17-18 Season
Positiv
e No
n-In
fluen
za T
ests1
2
Respiratory Syncytial Virus Parainfluenza Adenovirus Human Metapneumovirus Corona Viruses Rhinovirus
Viral Respiratory Surveillance
Non-Influenza
For additional information regarding influenza surveillance
please visit the following websites.
http://nj.gov/health/flu/surveillance/shtml
http://www.cdc.gov/flu/
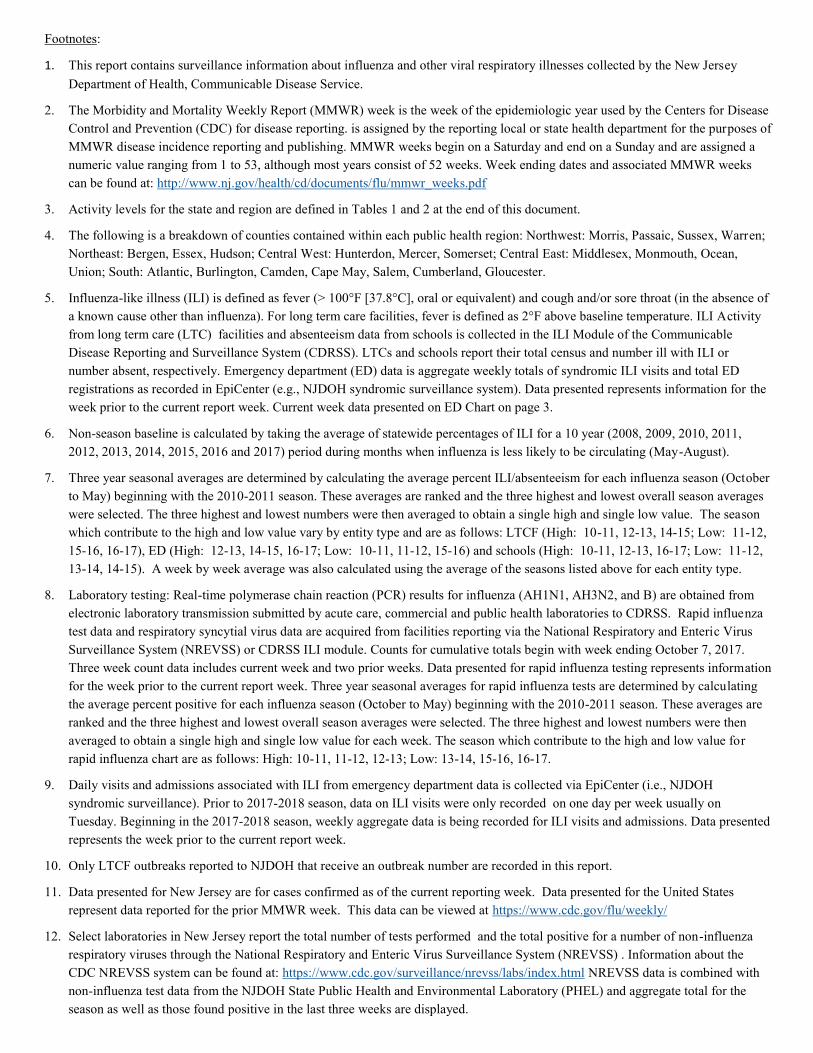
Footnotes:
1. This report contains surveillance information about influenza and other viral respiratory illnesses collected by the New Jersey
Department of Health, Communicable Disease Service.
2. The Morbidity and Mortality Weekly Report (MMWR) week is the week of the epidemiologic year used by the Centers for Disease
Control and Prevention (CDC) for disease reporting. is assigned by the reporting local or state health department for the purposes of
MMWR disease incidence reporting and publishing. MMWR weeks begin on a Saturday and end on a Sunday and are assigned a
numeric value ranging from 1 to 53, although most years consist of 52 weeks. Week ending dates and associated MMWR weeks
can be found at: http://www.nj.gov/health/cd/documents/flu/mmwr_weeks.pdf
3. Activity levels for the state and region are defined in Tables 1 and 2 at the end of this document.
4. The following is a breakdown of counties contained within each public health region: Northwest: Morris, Passaic, Sussex, Warren;
Northeast: Bergen, Essex, Hudson; Central West: Hunterdon, Mercer, Somerset; Central East: Middlesex, Monmouth, Ocean,
Union; South: Atlantic, Burlington, Camden, Cape May, Salem, Cumberland, Gloucester.
5. Influenza-like illness (ILI) is defined as fever (> 100°F [37.8°C], oral or equivalent) and cough and/or sore throat (in the absence of
a known cause other than influenza). For long term care facilities, fever is defined as 2°F above baseline temperature. ILI Activity
from long term care (LTC) facilities and absenteeism data from schools is collected in the ILI Module of the Communicable
Disease Reporting and Surveillance System (CDRSS). LTCs and schools report their total census and number ill with ILI or
number absent, respectively. Emergency department (ED) data is aggregate weekly totals of syndromic ILI visits and total ED
registrations as recorded in EpiCenter (e.g., NJDOH syndromic surveillance system). Data presented represents information for the
week prior to the current report week. Current week data presented on ED Chart on page 3.
6. Non-season baseline is calculated by taking the average of statewide percentages of ILI for a 10 year (2008, 2009, 2010, 2011,
2012, 2013, 2014, 2015, 2016 and 2017) period during months when influenza is less likely to be circulating (May-August).
7. Three year seasonal averages are determined by calculating the average percent ILI/absenteeism for each influenza season (October
to May) beginning with the 2010-2011 season. These averages are ranked and the three highest and lowest overall season averages
were selected. The three highest and lowest numbers were then averaged to obtain a single high and single low value. The season
which contribute to the high and low value vary by entity type and are as follows: LTCF (High: 10-11, 12-13, 14-15; Low: 11-12,
15-16, 16-17), ED (High: 12-13, 14-15, 16-17; Low: 10-11, 11-12, 15-16) and schools (High: 10-11, 12-13, 16-17; Low: 11-12,
13-14, 14-15). A week by week average was also calculated using the average of the seasons listed above for each entity type.
8. Laboratory testing: Real-time polymerase chain reaction (PCR) results for influenza (AH1N1, AH3N2, and B) are obtained from
electronic laboratory transmission submitted by acute care, commercial and public health laboratories to CDRSS. Rapid influenza
test data and respiratory syncytial virus data are acquired from facilities reporting via the National Respiratory and Enteric Virus
Surveillance System (NREVSS) or CDRSS ILI module. Counts for cumulative totals begin with week ending October 7, 2017.
Three week count data includes current week and two prior weeks. Data presented for rapid influenza testing represents information
for the week prior to the current report week. Three year seasonal averages for rapid influenza tests are determined by calculating
the average percent positive for each influenza season (October to May) beginning with the 2010-2011 season. These averages are
ranked and the three highest and lowest overall season averages were selected. The three highest and lowest numbers were then
averaged to obtain a single high and single low value for each week. The season which contribute to the high and low value for
rapid influenza chart are as follows: High: 10-11, 11-12, 12-13; Low: 13-14, 15-16, 16-17.
9. Daily visits and admissions associated with ILI from emergency department data is collected via EpiCenter (i.e., NJDOH
syndromic surveillance). Prior to 2017-2018 season, data on ILI visits were only recorded on one day per week usually on
Tuesday. Beginning in the 2017-2018 season, weekly aggregate data is being recorded for ILI visits and admissions. Data presented
represents the week prior to the current report week.
10. Only LTCF outbreaks reported to NJDOH that receive an outbreak number are recorded in this report.
11. Data presented for New Jersey are for cases confirmed as of the current reporting week. Data presented for the United States
represent data reported for the prior MMWR week. This data can be viewed at https://www.cdc.gov/flu/weekly/
12. Select laboratories in New Jersey report the total number of tests performed and the total positive for a number of non-influenza
respiratory viruses through the National Respiratory and Enteric Virus Surveillance System (NREVSS) . Information about the
CDC NREVSS system can be found at: https://www.cdc.gov/surveillance/nrevss/labs/index.html NREVSS data is combined with
non-influenza test data from the NJDOH State Public Health and Environmental Laboratory (PHEL) and aggregate total for the
season as well as those found positive in the last three weeks are displayed.
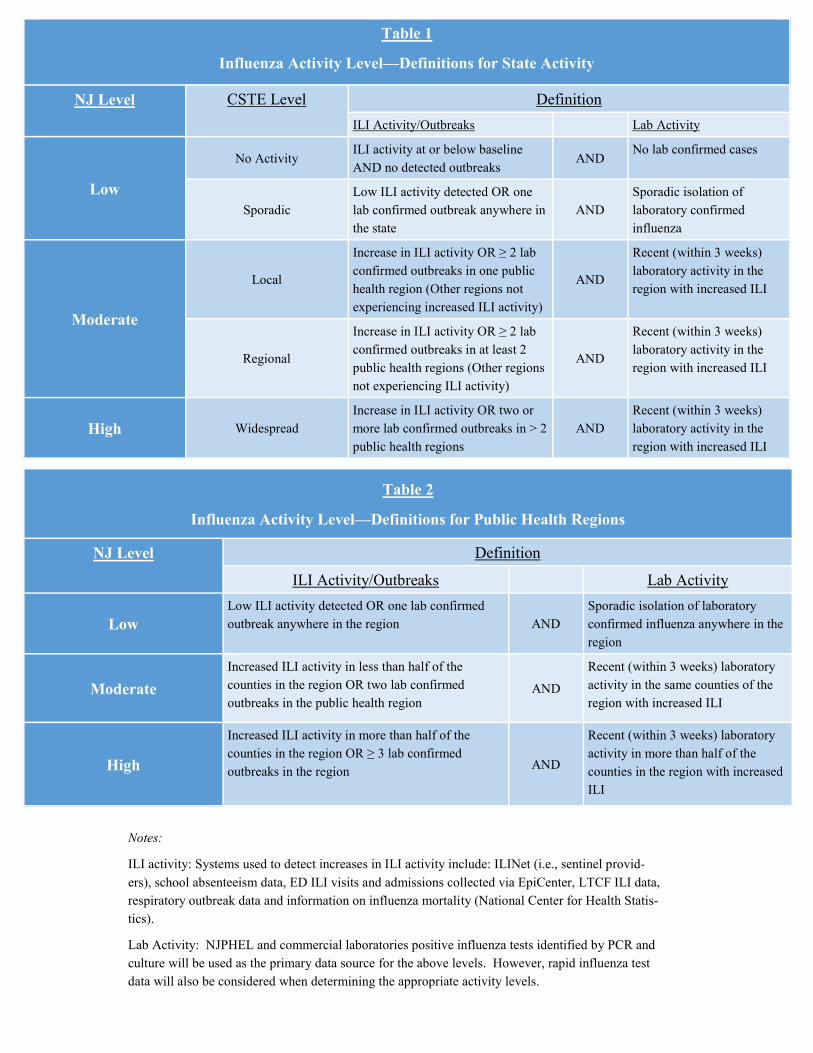
Table 1
Influenza Activity Level—Definitions for State Activity
CSTE Level Definition NJ Level
ILI Activity/Outbreaks Lab Activity
Low
No Activity ILI activity at or below baseline
AND no detected outbreaks AND
No lab confirmed cases
Sporadic
Low ILI activity detected OR one
lab confirmed outbreak anywhere in
the state
AND
Sporadic isolation of
laboratory confirmed
influenza
Moderate
Local
Increase in ILI activity OR ≥ 2 lab
confirmed outbreaks in one public
health region (Other regions not
experiencing increased ILI activity)
AND
Recent (within 3 weeks)
laboratory activity in the
region with increased ILI
Regional
Increase in ILI activity OR ≥ 2 lab
confirmed outbreaks in at least 2
public health regions (Other regions
not experiencing ILI activity)
AND
Recent (within 3 weeks)
laboratory activity in the
region with increased ILI
High Widespread
Increase in ILI activity OR two or
more lab confirmed outbreaks in > 2
public health regions
AND
Recent (within 3 weeks)
laboratory activity in the
region with increased ILI
Table 2
Influenza Activity Level—Definitions for Public Health Regions
Definition NJ Level
ILI Activity/Outbreaks Lab Activity
Low
Low ILI activity detected OR one lab confirmed
outbreak anywhere in the region AND
Sporadic isolation of laboratory
confirmed influenza anywhere in the
region
Moderate
Increased ILI activity in less than half of the
counties in the region OR two lab confirmed
outbreaks in the public health region AND
Recent (within 3 weeks) laboratory
activity in the same counties of the
region with increased ILI
High
Increased ILI activity in more than half of the
counties in the region OR ≥ 3 lab confirmed
outbreaks in the region AND
Recent (within 3 weeks) laboratory
activity in more than half of the
counties in the region with increased
ILI
Notes:
ILI activity: Systems used to detect increases in ILI activity include: ILINet (i.e., sentinel provid-
ers), school absenteeism data, ED ILI visits and admissions collected via EpiCenter, LTCF ILI data,
respiratory outbreak data and information on influenza mortality (National Center for Health Statis-
tics).
Lab Activity: NJPHEL and commercial laboratories positive influenza tests identified by PCR and
culture will be used as the primary data source for the above levels. However, rapid influenza test
data will also be considered when determining the appropriate activity levels.

INFLUENZA LABORATORY REPORTS BY COUNTY
Counts represent total positive specimensfrom week ending October 7, 2017 to current MMWR week
Source: CDRSS
INFLUENZA LABORATORY REPORTS BY COUNTY
Counts represent total positive specimensfrom week ending October 7, 2017 to current MMWR week
Source: CDRSS
Frequency
COUNTY(COUNTY)
RESULT
InfluenzaA - Typing
notperformed
InfluenzaA 2009
H1N1Influenza
AH3Influenza
B Total
ATLANTIC 548 0 11 209 768
BERGEN 1031 26 155 627 1839
BURLINGTON 426 0 3 217 646
CAMDEN 791 0 19 452 1262
CAPE MAY 202 0 0 49 251
CUMBERLAND 18 0 0 19 37
ESSEX 541 23 84 313 961
GLOUCESTER 206 1 19 88 314
HUDSON 900 12 47 326 1285
HUNTERDON 98 0 34 70 202
MERCER 175 4 22 296 497
MIDDLESEX 416 6 34 232 688
MONMOUTH 961 0 13 607 1581
MORRIS 294 12 170 194 670
OCEAN 706 8 14 412 1140
PASSAIC 458 14 53 222 747
SALEM 2 0 1 3 6
SOMERSET 104 3 40 75 222
SUSSEX 41 3 47 51 142
UNION 243 31 192 252 718
WARREN 64 2 9 14 89
Total 8225 145 967 4728 14065
South: Atlantic, Burlington, Camden, Cape May, Salem, Cumberland, GloucesterCentral East: Middlesex, Monmouth, Ocean, Union
Central west: Hunterdon, Mercer, SomersetNorthwest: Morris, Passaic, Sussex, Warren; Northeast: Bergen, Essex, Hudson
The following is a breakdown of counties contained within each public health region:
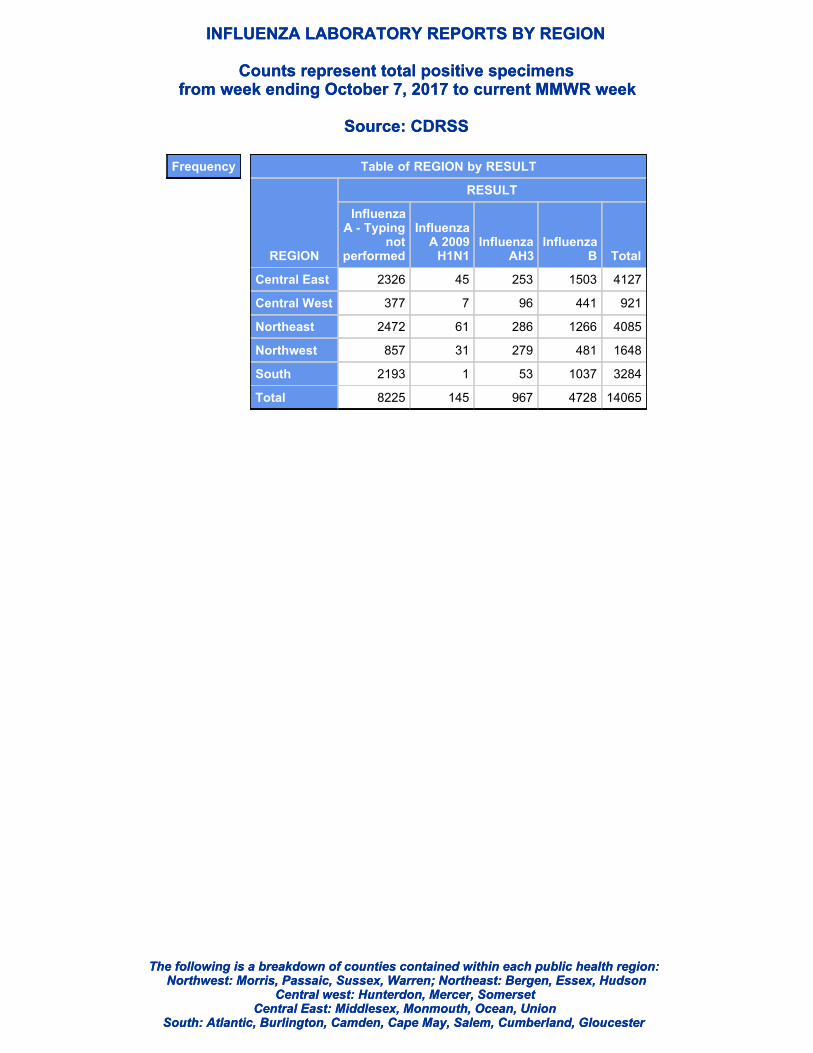
INFLUENZA LABORATORY REPORTS BY REGION
Counts represent total positive specimensfrom week ending October 7, 2017 to current MMWR week
Source: CDRSS
South: Atlantic, Burlington, Camden, Cape May, Salem, Cumberland, GloucesterCentral East: Middlesex, Monmouth, Ocean, Union
Central west: Hunterdon, Mercer, SomersetNorthwest: Morris, Passaic, Sussex, Warren; Northeast: Bergen, Essex, Hudson
The following is a breakdown of counties contained within each public health region:
INFLUENZA LABORATORY REPORTS BY REGION
Counts represent total positive specimensfrom week ending October 7, 2017 to current MMWR week
Source: CDRSS
Frequency Table of REGION by RESULT
REGION
RESULT
InfluenzaA - Typing
notperformed
InfluenzaA 2009
H1N1Influenza
AH3Influenza
B Total
Central East 2326 45 253 1503 4127
Central West 377 7 96 441 921
Northeast 2472 61 286 1266 4085
Northwest 857 31 279 481 1648
South 2193 1 53 1037 3284
Total 8225 145 967 4728 14065

COUNTY
# E
nro
lled
# R
epo
rts
Rec
'd
% IL
I
# E
nro
lled
# R
epo
rts
Rec
'd
% A
bse
nt
# R
epo
rts
Rec
'd
% IL
I
# E
nro
lled
Long Term Care Schools Hospital Emergency Dept
Communicable Disease Reportingand Surveillance System
02/12/2018 8:15 AMNJ ACTIVE INFLUENZA-LIKE ILLNESS SURVEILLANCE STATISTICSSURVEILLANCE DATE: 02/06/2018
February 6, 2018 MMWR WEEK 6
ATLANTIC 2 16360 0.00 8.49 4 9.134BERGEN 11 18326 0.11 4.86 6 8.355BURLINGTON 7 721016 0.47 6.64 4 8.434CAMDEN 1 780 0.00 8.95 8 12.987CAPE MAY 3 8120 0.00 6.58 1 7.251CUMBERLAND 5 10125 0.88 10.28 3 11.673ESSEX 9 142 0.00 5.43 8 12.297GLOUCESTER 3 140 0.00 8.73 2 9.632HUDSON 4 7152 1.23 4.22 6 10.536HUNTERDON 4 10114 0.93 6.05 1 7.541MERCER 1 22301 0.00 3.37 5 16.224MIDDLESEX 13 18217 0.73 4.93 6 10.166MONMOUTH 6 64671 1.02 7.14 5 11.695MORRIS 3 6101 0.00 6.99 4 6.214OCEAN 10 566 1.84 7.32 4 11.314PASSAIC 10 15293 0.00 7.08 3 12.843SALEM 0 440 0.00 8.68 1 13.801SOMERSET 5 19231 0.00 4.62 1 10.751SUSSEX 3 342 0.56 5.79 2 0.422UNION 2 32540 0.00 6.82 5 6.995WARREN 6 12190 0.00 5.42 2 13.862
22 6 0.29 1162 36NW Region
NE Region
CW Region
CE Region
South Region
State Total
9.576.57
24 10 0.42 4.67 10.7351 26 20
11
18
10 6 7 664 510.60 4.16 14.39
31 14 20 20148 1191.33 6.63 10.10
21 11 23 22177 1180.75 7.38 10.84
108 47 81 77502 3500.72 6.25 10.71
User Name: HALDEMAN, ANNMARIE Page 1 of 1

Communicable Disease Reportingand Surveillance System
02/12/2018 9:05 AMNJ ACTIVE INFLUENZA-LIKE ILLNESS SURVEILLANCE STATISTICSSURVEILLANCE DATE: 02/06/2018
County
RSV Tests Rapid Flu Tests
# P
osi
tive
# P
osi
tive
To
tal
Tes
tsP
erfo
rmed
To
tal
Tes
tsP
erfo
rmed
February 6, 2018 MMWR WEEK 6ATLANTIC 310 460127BERGEN 687 1022339BURLINGTON 7415 11321CAMDEN 191 631136CAPE MAY 170 17147CUMBERLAND 124 407101ESSEX 28921 1254157GLOUCESTER 10 28568HUDSON 142 8726HUNTERDON 00 00MERCER 624 765330MIDDLESEX 272 23598MONMOUTH 33740 1877493MORRIS 606 29065OCEAN 797 824189PASSAIC 379 554169SALEM 00 00SOMERSET 00 00SUSSEX 00 00UNION 38818 699WARREN 283 287
18
30
4
67
20
139
125
371
62
831
154
1543
241
522
330
789
500
2382
872
2363
765
3005
2067
9072
NW Region
NE Region
CW Region
CE Region
South Region
State Total
User Name: HALDEMAN, ANNMARIE Page 1 of 1