No. 49 - CORE · · 2017-05-05The times of high inflation and chronic unsustainable external ......
18
No. 49 Vladimír Benáček: Current Account Developments in Central, Baltic and South-Eastern Europe in the Pre-enlargement Period of 2002-2003 2004
Transcript of No. 49 - CORE · · 2017-05-05The times of high inflation and chronic unsustainable external ......

No. 49
Vladimír Benáček: Current Account Developments in Central,Baltic and South-Eastern Europe in the Pre-enlargement
Period of 2002-2003
2004

Current Account Developments in Central, Baltic andSouth-Eastern Europe in the Pre-enlargement Period of 2002-2003
Vladimír BenáčekCESES and IES of Charles University, Faculty of Social Sciences, Prague
A b s t r a c t
The paper assesses the developments in the current accounts of transition countries inCentral, Baltic and South-Eastern Europe. Attention is given to policy issues, such as therelationship between savings, investments and government deficits, reinvested profits, officialtransfers from the European Commission and private transfers.
The overall situation in the sustainability of current account deficits in studied transitioncountries is characterised as steadily improving and the majority of economies reached a stagewhere the current account is not an immanent threat to their growth any longer. However,economic policies in many of the countries need important adjustments in order to keep theeconomies in macroeconomic equilibrium. Particularly the trade deficit has been causingproblems to external equilibrium. It is apparent that fiscal deficits, that have been on a rise inthe last 2-3 years, are becoming the dominant factor behind the current account disequlibria.Reinvested profits of foreign investors and current transfers have been becoming gradually theinstrument for bringing the current account deficits closer to their sustainable levels. Thebalance between the repatriation of profits by foreign investors and the reinvestment of suchprofits in the transition economies will play more important role in the future developments inthe current account deficits or even surpluses.
Caveat for the readers:A part of this analysis was used by United Nations, Economic Commission for Europe, in theirEconomic Survey of Europe, no. 1, 2004. This text therefore differs from the text finallypublished by UNECE both in contents and editing. For the purposes of quoting the officialdocument, please turn at its final version at http://www.unece.org/ead/pub/041/041c3.pdf.

1/ State of Current Accounts in General
The year of 2003 was a sort of a milestone in the developments of the transitioncountries in this part of Europe. The times of high inflation and chronic unsustainable externaldeficits were definitely closed in practically all of these countries and the 14 years oftransformation if finally promising its fruits. The growth rates of the region are markedly fasterthan in the western part of Europe and the scenarios of convergence could finally become moreoptimistic as ever before.
The current account (C/A) balances in most east European countries remained in deficitin 2003, as we can see from Table 1 in the appendix. However recent developments suggestthat, in terms of their external financial positions, several of these economies may beapproaching a post-transition phase. Thus in some of the more advanced economies (especiallyamong the EU acceding countries) seem to be reaching a point when the access to financialcapital is no longer a constraint for their development. In addition, the C/A deficits in themajority of the acceding countries seem to be stabilising; the surpluses on the balances ofservices and transfers largely offset the deficits on the balance of incomes.1 The favourableperformance in the C/A was to a large extent conditioned by highly satisfactory results in thetrade balance in the majority of countries. The growth of merchandise exports retained theirhigh rate of expansion practically for the whole decade (see Table 2). Nine out of twelve centraland Eastern European countries had a growth rate in nominal dollars higher than 10% per yearfor more than a decade. Estonia and Hungary being the champions beating the growth rate of15% p.a. The capacity of transition countries at a higher level of transformation to penetrate onthe world (and especially on the EU markets) is one of the best signals that these countries offerto the analysts of their performance. That was also reflected in high FDI inflows coming tothese countries in recent years.
Table 3 presents a more detailed information about the performance of exports andimports of some central European countries and the regions. Year 2003 was another successfulperiod for the export expansion for many transition countries. The mutual penetration betweenthe EU and CEE markets was the main driver of the trade creation. However, there is a caveat tothe figures used. The US dollar depreciated relative to euro (main trade currency of transitioncountries) by 17% in 2003. Thus the trade figures in real terms (e.g. in constant EUR) is lowerby approximately 19% than what is indicated as a growth in nominal USD for 2003. Themounting problems of the Hungarian economy are apparent from its trade behaviour. Thedevelopments in the Estonian huge and deepening trade deficit is particularly causing concernsabout its sustainability without major policy changes.
The problems leaking to the whole economy from the large and rising trade deficits werefortunately cushioned in nearly all CEE countries by positive balances in the trade with servicesand private remittances. In 2003 there were only few exceptions that would raise worries aboutthe sustainability of the current account deficits. We should mention Estonia that is headingtowards a record deficit of over 14% of GDP due to imports related not only to high
1 Reporting the deficits in US dollars induces a bias in the ratios in periods of increased volatility of thedollar exchange rate (as was the case in 2003, when the dollar deficits are likely overstated). However,taking the deficit as a proportion to GDP eliminates this bias.

investments but also to rising private consumption. Similar concerns about the current accountscould be raised for Latvia, Bosnia and Herzegovina, Serbia and Montenegro and probablyBulgaria (whose deficit rose rapidly in the second half of the year).
Another problem that emerged only recently is the sharp plunge in inward FDIexperienced by some east European countries. While in 2002 the total FDI inflows in EasternEurope could finance more than the region’s aggregate current account deficit, in 2003 theaggregate FDI inflow was only half that size. But growing workers’ remittances from abroadhelped alleviate the pressure on short-term borrowing to finance these deficits.
The new developments mentioned above may in fact indicate a turning point in thedevelopment path of some of these economies, especially the acceding countries, after a decadeand a half of economic transformation. The deepening of economic integration with the moredeveloped EU economies and the emergence of new factors (both in the real economy and inthe financial sphere) may be bringing a gradual reversal in the net balance of FDI, while thenegative balances of trade will decline and the balances of incomes and transfers may keepdiverging. The functioning of this mechanism at the macroeconomic level deserves a specialattention.
2/ Economic Linkages between the Current Account and the Domestic Economy
The current account of the balance of payments of an open economy reflects the sourcesand the uses of national income that are related to exports and imports of goods and services,and to international transfers of income related to factors (capital and labour) or consumerspending. This leads to the so-called fundamental macroeconomic identities of an openeconomy:
(X-M) ≡ If , i.e. the current account is equal to the consolidated capital and financialaccounts of the balance of payments, and
(X-M) ≡ S + (T-G) – I, i.e. the current account is the difference between residents’savings (private and public) and their investments.
Thus external disequilibria (both real and monetary) are closely tied to internaldisequilibria, such as disequilibria in growth, employment or prices. If it is desirable that theexpenditure of country’s residents on consumption, investment, government services andimports (as recorded by the national absorption A) should be higher than the national product Y,then this is possible only if external financing for such additional items of national absorption isfound abroad: A + (X-M) ≡ Y. Such additional resource (If) is equal to the absolute value of thecurrent account deficit, i.e. to (X-M) that is negative. In another words, if private and publicsavings of a country are not sufficient for financing the required investments for restructuring,then foreign funds must be acquired and used on the real side. However, not all countries andtheir economic agents find this kind of policy the most appropriate one.
Current account deficit must be looked upon as on a very sensitive and temptinginvestment where short-term and long-term costs and benefits may diverge significantly. Allsuch deficits are essentially debts that will have to be sooner or later serviced, including theforeign direct investment. According to Woodward, 2001, he implicit real interest is in average

16 per cent p.a.2 Naturally the spread varies by countries, their creditworthiness and theriskiness of investments. There are various additional burdens to be borne by the recipientcountries. Many governments offer the large international investors various incentives. In theCzech case such incentives represent an equivalent of 20% interest premium on the totalamount invested. In addition, many MNC are tempted to use transfer pricing for theoptimisation of their net profits3. Some countries may pay a heavy price for their role as hosts toforeign investors.
A caution must be also raised if the borrowed foreign funds are not associated with thebuild-up of physical capital, human capital and competitiveness, but channelled instead intoimports for consumption or used inefficiently. Unfortunately elasticity of imports to aggregatedomestic demand in economies at a low level of transformation is often significantly aboveunity and the income elasticity of domestic production for import replacements is less thanunity.4 Under such conditions, any growth driven by the expansion on the demand side getsstranded at an unsustainable current account deficit. The danger is even augmented if theparallel fiscal deficit is channelled via non-restructured public sector and/or its beneficiaries actunder soft budget constraint. Such “public dissaving” leads quickly to the accumulation offoreign public indebtedness, crowding out of private investments and even increased privatesavings (in the so-called effect of Ricardian equivalence) that decrease consumption. It alsotends to generate inflationary expectations weakening of the exchange rate. The investors arethen prone to accelerate the problem by capital flight ending in a financial crisis, restrictivefiscal and monetary policies and an economic stagnation.
In the early stages of economic transformation, the scarcity of capital was one of themain constraints to growth because the transition had virtually written-off a large part of thephysical capital endowments. In the later stages of transition, additional capital was needed forthe upgrading of human capital. Raising capital abroad and channelling it to such types ofinvestment was definitely beneficial for the transition economies.5 After 1995, this powerfulinstrument of economic restructuring was actively used by most east European economies.Their current accounts and balances of trade were generally negative throughout the transitionperiod (Table 4). Therefore, the ruling present policy of running current account deficits inEastern Europe can be often viewed in a highly positive manner. Subject to the caveats raisedin the preceding paragraphs, large deficits can often indicate that the country undergoessuccessful restructuring and that investors assess positively its future growth potential. Thus for
2 Woodward, D.: The Next Crisis? Direct and Equity Investment in Developing Countries. London, ZedBooks, 2001.3 Kreinin, M.: International Economics - A Policy Approach. Dryden, Philadelphia, 1998, p. 235.
4 By comparing the growth rates of the aggregate domestic demand with the growth rates of realimports we can see that the index of average demand elasticity of imports in the majority of transitioncountries was between 5 and 9 during the whole 1990s. The elasticity of domestic import replacementsrelative to the aggregate demand was at the same time close to zero or, most probably, even negative.5 According to the growth theory, an additional access to savings (and thus investment) shifts upwardsthe long-term steady state; such economy will enjoy larger capital stock, faster growth and higher finallevel of output than would be otherwise plausible. G. Mankiw, D. Romer and D. N. Weil, “AContribution to the Empirics of Economic Growth”. Quarterly Journal of Economics, 1992, Vol. 107,No.2, pp. 407-437.

the most part of the transition, current account deficits in Eastern Europe were by and largefinanced by net FDI inflows or they can be reduced in the near future because of the expectedrise in domestic profits and savings. The dividends of years of intensive transformation,continuing microeconomic and institutional stabilisation, and the EU accession in 2004 offernow more grounds for sanguinity in this part of Europe as ever before.
3/ Threats of Twin Deficits and the Better Side of the Reinvested Profits
More recent developments, such as the recent financial turmoil in Hungary (UNECE,2004, pp. 76-77), bid for some more caution regarding the future. In Hungary’s case, the rootsof the problem should be traced to high government spending before and after the 2002elections (the government deficit reached 9.2% of the GDP in 2002). The lesson from thisexperience is that extensive and not properly targeted demand-side stimulation can havedestabilising side-effects even in the most advanced east European economies. Poland’sunbalanced growth path prior to the slowdown in 2001 also demonstrates the dangers of anexternal disequilibrium associated with an inconsistent policy mix.6 The policy adjustment in2001 has contributed to the reduction in the current account deficit (Table 1) but at the expenseof a considerable economic slowdown. While Poland does not seem to face balance ofpayments constraints at present, the intended further raising of the budget deficit in 2004 is notwithout its risks.7
Policy makers in Eastern Europe also need to take into account the potential risksassociated with twin deficits, moreover, given the recent deterioration in the public financialbalances in some of these countries.8 Hitting thus an unsustainable knife-edge situation ofrunning the fiscal and C/A deficit in parallel is still dormant in this part of Europe.9 Their re-emergence may loom easily if the sources of generous FDI inflows dwindle (what is a presentproblem of Hungary) or if the net investment income deficit deepens, or if the governments losetheir additional revenues from the privatisation of state-owned property. As Table 1 illustratesin the last three columns, countries like Slovakia, Bulgaria or Czech Republic could finance thecurrent account deficits more than easily from FDI. However, that cannot be said for Bosnia,Estonia, four south Eastern European countries and also partially for Hungary. In addition, withthe privatisation coming to an end in most of Eastern Europe, the financing of the fiscal deficitsis going to be much more difficult to cover from the tax revenues alone.
6 See UNECE, Economic Survey of Europe, 2002, No. 1, pp. 63-69.7 Another example is the Czech financial crisis in 1997 rooted in an unbalanced growth supported byeasy access to state banks’ credits (UNECE, Economic Survey of Europe, 1998, No. 1, pp. 75-82). Thesurfacing of huge accumulated contingent fiscal liabilities still remain a large burden on Czech publicfinances (this step of the Czech fiscal reform is due to be closed in 2006).8 As discussed above, one of the main ingredients of a twin deficit crisis is the failure to channel theadditionally mobilized resources into productive investments and/or into the growth-enhancing publicinvestment.9 While the current account deficits are to large extent objective phenomena, the fiscal deficits arepurely contrived and subject to political cycles. The idea of subjecting the decisions about the size ofdeficits to processes of democratic accountability, instead of leaving them to politicians alone, does not

Another topic that entered the public policy debates in Eastern Europe only recentlyconcerns the flow of earnings by non-resident direct investors. Thus reinvested earnings arerecorded twice: first as debits in the income balance of the current account, similarly likedividends or repatriated profits. Then there is a countervailing credit entry in the financialaccount marking it as an FDI inflow. With the growth in the FDI stock, reinvested earningsbegin to play a much more visible role in influencing the balance of payments and at some pointthey may start to dominate the total FDI inflows. As a result, the current account balances ofsuch countries will be more exposed to the decisions by foreign direct investors: to theirdividend policy and to their investment policy – whether they repatriate or re-invest their profitsin the host country.
For example, foreign direct investors in Hungary reinvest at present a little more than 50per cent of their local profits and only the rest is repatriated.10 Similarly, reinvested earnings inthe Czech Republic amounted to $2.7 billion in 2002 and $3.4 billion in 2003. In the caseswhen large current account deficit merely reflects the large amounts of reinvested earnings byforeign direct investors, these deficits need not be a source of policy concern. On the contrary,such an outcome indicates not only that the local FDI ventures are highly profitable but also thatinvestors consider them as worth expanding even further. In addition, there is no need to financesuch “debts” through the foreign exchange market.11
From among the accession countries only Estonia had in 2003 a current account deficitabove 10 per cent of GDP (for a second consecutive year) and it is financed mainly throughshort-term foreign borrowing by commercial banks. Although the confidence in the currencyboard, backed by Estonia’s upgraded credit rating of A1, remains high at the beginning of 2004,the economy remains exposed to the risk of a sudden reversal in these flows, which may cause asqueeze on the foreign exchange market.
4/ Official and Private Transfers of the Current Account
EU enlargement is going to have some important implications for the balance of currenttransfers of the acceding countries concerning both the official and the private transfers. Thetotal amount of the official EU transfers for the eight acceding east European countries in theperiod 2004-2006 was set at the Copenhagen meeting in December 2002 at €40.852 billion (at1999 prices), defined as structured ceilings to the EU commitments.12 In addition, there was
apply to emerging market countries only. See C. Wyplosz, Fiscal Discipline in Emerging MarketCountries: How to go about It?, 2002, paper available at http://heiwww.unige.ch/~wyplosz/.10 Until now, the Hungarian balance of payments statistics, counter to the internationally acceptedstandards, omits the item of reinvested profits. If a corresponding adjustment is made to the Hungarianbalance of payments, the Hungarian current account deficit would increase from 4.1 to 6.1 per cent in2002 and from 6.4 to 8.6 per cent in 2003, respectively. Estimates published in Hungarian NationalBank, Quarterly Report on Inflation (Budapest), November 2003, pp. 51-53.11 J. Brada and V. Tomšík, Reinvested Earnings Bias, The “Five Percent” Rule and the Interpretationof the Balance of Payments – With an Application to Transition Economies. WDI Working Paper no.543, February 2003, available at http://eres.bus.umich.edu/docs/workpap-dav/wp543.pdf.12 See The Adjustment of the Financial Perspective for Enlargement, European Commission,11.2.2003,http://europa.eu.int/comm/budget/pdf/financialfrwk/enlarg/COM_2003_0070_F_EN_ACTE.pdf.

created an emergency supplement to the budget of €10.2 billion (at maximum) for 2004. Table5 shows in detail the structure of such commitments.
After deducting the membership contributions of the eight countries estimated totally forall three years at €14 billion, the net enlargement transfers for 2004-2006 could be as high as€26 billion. In terms of annual costs for the population of the current 15 EU members, thisamounts to approximately €26 per capita per annum, at maximum. The envisaged grosstransfers amount to 3.6 per cent of the combined GDP of the acceding countries, varied from2.2 per cent for Slovenia up to 7.1 per cent for Lithuania, as the upper limits of the plannedgross transfers for these countries. The planned allocations to structural and cohesion funds areapproximately 1.9 per cent of the countries’ GDP. This is close to what the four poorest“cohesion” EU countries were concretely receiving during the 1994-1999 period - i.e. some 2.2per cent of their aggregate GDP. However, the planned budget figures represent only the EUcommitment funds, conditioned by a set of criteria and domestic co-financing. The effectivefinancing in absolute amounts may thus turn out to be much less generous than what the limitsfor commitment seem to offer. The enlargement thus triggered a series of demands for revisionsand belt tightening. That is not a bad signal for those who believe that the Commission shouldbe always kept under a pressure for adjustments, otherwise it would become an institutionlosing the contact with reality.
The overall real impact of the net EU transfers on the future current account balances ofthe new members is therefore difficult to estimate. Some studies, like those by C. Viprey and C.Moquet 13, speak about realistic 62% of the potential appropriations. This implies that newmembers, but especially those less prepared for fund-seeking activities, might eventuallybecome net contributors to the EU budget in the first years. Thus the effective realappropriations can vary from zero per cent up to 4 per cent of GDP in 2005, with estimatedaverage of 1.6% for the whole group of acceding countries. Although the last EU enlargementwas the biggest in the EU history, the burden it explicitly brought on the Commission’s budgetis one of the lowest. The question is whether the present budget economising strategy wouldsustainable also in the long run. If the lagging East European economies and the dissatisfiedpopulation of new members would become a cause of discord even among the past incumbents,bringing the cohesion of EU’s decision-making to a halt, it would be advisable to revise thepresent budget tightening policies and re-install the more generous structural policies thatexisted prior to enlargement.
The appropriations by individual countries are not allocated identically among them,neither in the proportion to the GDP nor proportionally per capita, as can be seen from Table 6.For example, if the average of agricultural transfers per capita for all accession countries isnormalised to unity (1.00), then Czech agricultural appropriation would be 0.84 - that meansonly 84% of the average amount per capita - while Lithuania would get 159% of the averagequota.
One may wonder what were the guidelines for such asymmetric decision making at theEuropean Commission? On what grounds did the EC decide about the maximal limits ofstructural and agricultural transfers for seven countries poorer than Greece or Portugal, whichunder the rules valid since 1989 should receive funds up to 4% of their GDP, instead of the
13 Available at http://www.dree.org/elargissement/_private/abs_ged.cfm? IDDocument=47779.

expected 1.6%. A simple regression might offer some clues. For example, the average maximallimit of 1.82% of the GDP, as a promise for potential structural payments, is less than 3.5% and3.7% what Greece and Portugal actually received in 1994-99. It is clear that the present eightpoorest EU members will receive less than what Portugal or Greece received per capita or perGDP, both in structural and agricultural interventions.
We have tested regressions where the rates of EU structural transfers to ten new entrants(i.e. annual interventions per recipient country's GDP taken as the endogenous variable) were afunction of their nominal GDP per capita (at EUR at current exchange rate). The followingstatistical characteristics were received by estimating our hypothesis as a power function, aftertaking its natural logarithms. The rate of structural transfers (RST/2004-06), defined as apercentage share of EU transfers on nominal GDP 14, was “explained” by the function:
Ln (RST) = 15.7 -1.75 * Ln (GDP per capita) + Ln (ε)R-squared adj.: 0.968 (!)Durbin-Watson test: 1.58P-significance of both coefficients: 0.000.
By generalising the economic meaning of the estimated coefficients, each increase ofGDP per capita by 1% implies a decrease in the rate of structural transfers per GDP by 1.75%.All that should be taken relative to Latvia - the poorest country that received the highest offer(4,14% of GDP annually) for structural funding. It implies that, if the error term ε isdisregarded, a country with the GDP per capita higher than 7863 EUR should receive a tokenstructural transfer of 1% only. If this logic would be applied for all EU countries, the poorerregions of Greece, Portugal, Spain or Germany would get an amount much lower than what theywere accustomed to until now. Doubtless that would be a move difficult to accept withoutconcessions elsewhere.
Similarly, the logic behind the rate of agricultural transfers (RAT/2004-06, defined as apercentage of nominal GDP) depends implicitly on the following parameters:Ln (RAT) = 10.1 -1.19 * Ln (GDP per capita) + Ln (ε) .R-squared: 0.733D-W: 1.61P-significance of both coeff.: 0.001.It is worth mentioning that until 2003 the logic of GDP per capita was not used so aggressivelyas an instrument for the allocation of both the CAP and the structural funds. The regressionsreveal that the Commission changed its strategy quite significantly with the comingenlargement.
What concerns the private transfers, it can be expected that the EU enlargement willraise substantially the importance of workers’ remittances to home countries. Slovenia andLatvia were the only EU acceding and candidate countries, where in 2002 the net privatetransfers were higher (by a small margin) than $100 per capita. The amounts for the rest of thecountries were even lower: $35 in Slovakia, around $44 in Hungary, Lithuania and $55 inBulgaria, Czech Republic, Poland and Romania. For a comparison, the workers’ remittances inPortugal were $286 for 2002.
14 These are the figures in Table 5 in the third line from the bottom.

Recently the net private transfers have been growing rapidly in some acceding countries:thus in Latvia, Estonia or the Czech Republic the surplus more than doubled in a year. Thisgrowth may accelerate after May 2004 when employment of their nationals in some EUcountries or in some professions will becomes legal. However, according to most estimates, theEU enlargement is not expected to result in high labour migration from the new EU members,even after the labour market of the enlarged EU is fully deregulated after 2010. As it wasestimated by Boeri and Brücker, 2001, and later updated in a report for the EuropeanCommission, 15 such migration in the first years can be expected to add annually a mere 0.2%to the labour supply in the current 15 EU members, subject to a declining trend. The labourmobility in the new EU member countries can be expected to be even lower than it was amongthe old EU members.
The Southeast European countries have traditionally reported higher net private transfersthan the central European economies. Thus in Albania, The former Yugoslav Republic ofMacedonia, Serbia and Montenegro and Croatia the net private transfers per capita in 2002 werebetween $168 and $238. The net position of the 15 east European countries on the account ofcurrent transfers for 2003 is estimated at $13 billion, of which $7 billion pertains to the sevenSoutheast European economies. For these economies net private transfers are an extremelyimportant source of financing the deficit in other current transactions: thus in 2002, the surpluson the balance of transfers covered 39 per cent of their total trade deficit.
5. Conclusion
The overall situation in the sustainability of current account deficits in studied transitioncountries of Central, Baltic and South-Eastern Europe can be characterised generally as steadilyimproving. The majority of its economies reached a stage where the current account is not animmanent threat to their growth any longer. Even though the vast majority of transitioncountries are not fundamentally constrained in their development by the lack of funds forinvestment and restructuring, and therefore by the need to import the capital from abroad, theircurrent accounts will remain in deficit for long time.
What matters at this stage is not so much the fine-tuning of the current accountstructures, as it is the need for adjustments in fiscal policies. It is apparent that governmentdeficits, that have been on a rise in the last 2-3 years, are becoming the dominant factors behindthe current account disequlibria. Therefore economic policies in many countries will needimportant adjustments in order to keep the economies in macroeconomic equilibrium. Thetendencies to building-up the welfare state, postponed reforms in the pension and the healthsystems will have to be fundamentally reformed also due to their negative impacts on theexternal equilibrium. At the same time it is evident that reinvested profits of foreign investorsand current transfers are taking over gradually the role of bringing the current account deficitscloser (but not fully) to their sustainable levels.
15 T. Boeri and H. Brücker, “Eastern Enlargement and EU Labour Markets”, World Economics, Vol. 2,No. 1, 2001, pp. 49-68 and H. Brücker et. Al., Potential Migration from Central and Eastern Europeinto the EU-15 – An Update. Report for the European Commission, DIW Berlin, March, 2003.
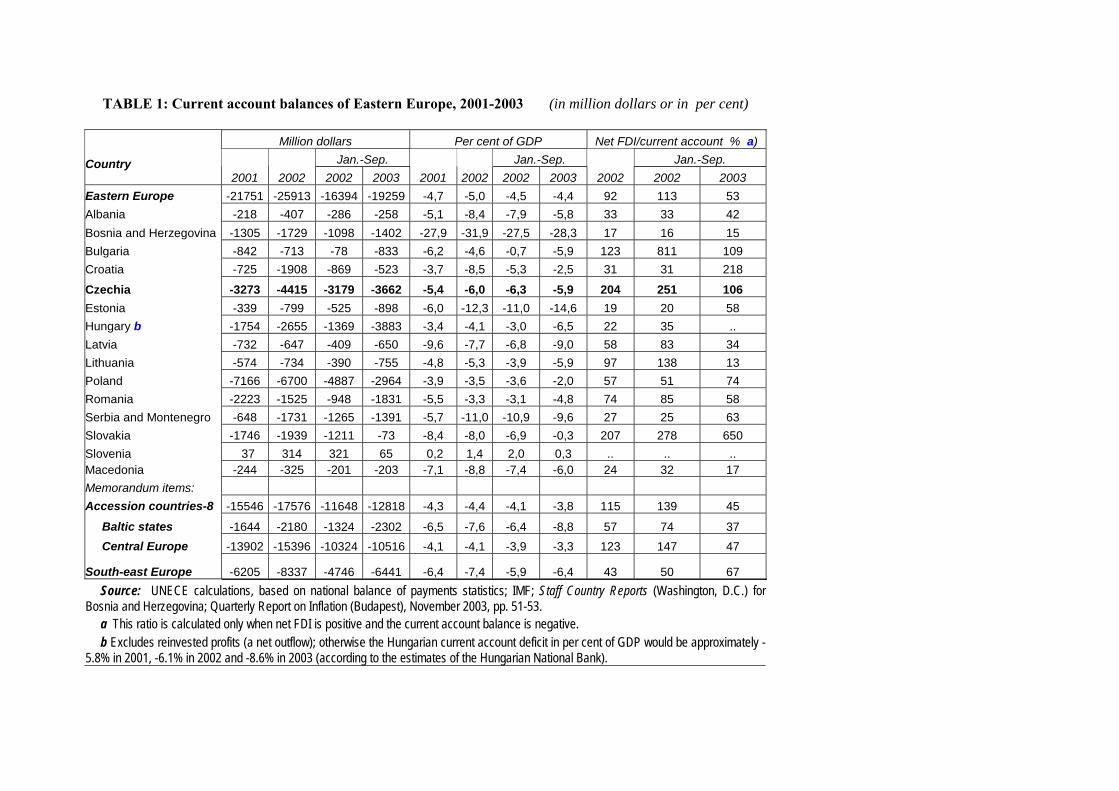
TABLE 1: Current account balances of Eastern Europe, 2001-2003 (in million dollars or in per cent)
Million dollars Per cent of GDP Net FDI/current account % a)Jan.-Sep. Jan.-Sep. Jan.-Sep.Country
2001 2002 2002 2003 2001 2002 2002 2003 2002 2002 2003Eastern Europe -21751 -25913 -16394 -19259 -4,7 -5,0 -4,5 -4,4 92 113 53Albania -218 -407 -286 -258 -5,1 -8,4 -7,9 -5,8 33 33 42Bosnia and Herzegovina -1305 -1729 -1098 -1402 -27,9 -31,9 -27,5 -28,3 17 16 15Bulgaria -842 -713 -78 -833 -6,2 -4,6 -0,7 -5,9 123 811 109Croatia -725 -1908 -869 -523 -3,7 -8,5 -5,3 -2,5 31 31 218Czechia -3273 -4415 -3179 -3662 -5,4 -6,0 -6,3 -5,9 204 251 106Estonia -339 -799 -525 -898 -6,0 -12,3 -11,0 -14,6 19 20 58Hungary b -1754 -2655 -1369 -3883 -3,4 -4,1 -3,0 -6,5 22 35 ..Latvia -732 -647 -409 -650 -9,6 -7,7 -6,8 -9,0 58 83 34Lithuania -574 -734 -390 -755 -4,8 -5,3 -3,9 -5,9 97 138 13Poland -7166 -6700 -4887 -2964 -3,9 -3,5 -3,6 -2,0 57 51 74Romania -2223 -1525 -948 -1831 -5,5 -3,3 -3,1 -4,8 74 85 58Serbia and Montenegro -648 -1731 -1265 -1391 -5,7 -11,0 -10,9 -9,6 27 25 63Slovakia -1746 -1939 -1211 -73 -8,4 -8,0 -6,9 -0,3 207 278 650Slovenia 37 314 321 65 0,2 1,4 2,0 0,3 .. .. ..Macedonia -244 -325 -201 -203 -7,1 -8,8 -7,4 -6,0 24 32 17Memorandum items:Accession countries-8 -15546 -17576 -11648 -12818 -4,3 -4,4 -4,1 -3,8 115 139 45
Baltic states -1644 -2180 -1324 -2302 -6,5 -7,6 -6,4 -8,8 57 74 37 Central Europe -13902 -15396 -10324 -10516 -4,1 -4,1 -3,9 -3,3 123 147 47
South-east Europe -6205 -8337 -4746 -6441 -6,4 -7,4 -5,9 -6,4 43 50 67 Source: UNECE calculations, based on national balance of payments statistics; IMF; Staff Country Reports (Washington, D.C.) forBosnia and Herzegovina; Quarterly Report on Inflation (Budapest), November 2003, pp. 51-53. a This ratio is calculated only when net FDI is positive and the current account balance is negative. b Excludes reinvested profits (a net outflow); otherwise the Hungarian current account deficit in per cent of GDP would be approximately -5.8% in 2001, -6.1% in 2002 and -8.6% in 2003 (according to the estimates of the Hungarian National Bank).

TABLE 2: Visible exports of central/Eastern Europe, Russia and Ukraine, 1993-2002 (in Billion dollars)
1993 1994 1995 1996 1997 1998 1999 2000 2001 20022002/1993
Annualgrowth
CEECs-12 66,9 77,3 100,6 107,1 115,9 127,9 125,5 141,9 157,3 178,8 267,4% 10,9%Albania 0,1 0,1 0,2 0,2 0,1 0,2 0,4 0,3 0,3 0,3 268,3% 11,0%Bulgaria 3,8 3,9 5,4 4,9 4,9 4,2 4,0 4,8 5,1 5,7 150,9% 4,6%Croatia 3,7 4,3 4,6 4,5 4,2 4,5 4,3 4,4 4,7 4,9 132,1% 3,1%Czechia 14,5 15,9 21,3 22,2 22,8 26,4 26,3 29,1 33,4 38,4 265,5% 10,9%Estonia 0,8 1,3 1,8 2,1 2,9 3,2 2,9 3,2 3,3 3,4 426,8% 16,1%Hungary 8,9 10,7 12,9 15,7 19,1 23,0 25,0 28,1 30,5 34,3 384,9% 15,0%Latvia 1,4 1,0 1,3 1,4 1,7 1,8 1,7 1,9 2,0 2,3 162,7% 5,4%Lithuania 2,0 2,0 2,7 3,4 3,9 3,7 3,0 3,8 4,6 5,5 276,7% 11,3%Poland 14,2 17,2 22,9 24,4 25,8 28,2 27,4 31,7 36,1 41,0 288,8% 11,8%Romania 4,9 6,2 7,9 8,1 8,4 8,3 8,5 10,4 11,4 13,9 283,5% 11,6%Slovakia 5,5 6,7 8,6 8,8 9,6 10,8 10,3 11,9 12,7 14,5 266,3% 10,9%Slovenia 6,1 6,8 8,3 8,3 8,4 9,1 8,6 8,7 9,3 10,4 170,3% 5,9%Russia 67,3 67,8 82,4 90,6 86,9 74,4 75,6 105,0 101,6 106,9 158,8% 5,1%Ukraine 7,8 10,3 13,1 14,4 14,2 12,6 11,6 14,6 16,3 18,0 229,7% 9,2%
Source: UN and WTO World Trade Statistics, 2003

TABLE 3: International Trade in Merchanise of Some Transition Countries (in USD billions or percentages)
EXPORTS (X) IMPORTS (M) (X-M)/GDPCountry/ Region Forecast Growth Growth X/GDP Forecast Growth Growth M/GDP 2001 2002 2003 2003/2002 2003/2002 2003 2001 2002 2003 2003/2002 2003/2002 2003 2002 2003 $ $ $ % nomin. % real * % $ $ $ % nomin. % real * % % %Czechia 33,4 38,4 48,5 126,4 106,2 56,0 36,5 40,8 51,1 125,2 105,2 58,9 -3,3 -2,9Estonia 3,3 3,4 4,5 131,1 110,2 54,3 4,3 4,8 6,5 135,5 113,9 79,2 -21,5 -24,9Hungary 30,5 34,4 41,1 119,4 100,3 51,2 33,7 37,6 47,2 125,6 105,5 58,9 -4,9 -7,7Poland 36,1 41,0 52,1 127,1 106,8 26,2 50,3 55,1 66,7 121,1 101,8 33,5 -7,5 -7,3Slovakia 12,7 14,5 20,3 140,0 117,6 64,8 14,7 16,5 22,7 137,4 115,5 72,4 -8,3 -7,6Eastern Europe-15 157,3 178,8 225,8 126,3 106,1 38,3 202,1 226,3 285,8 126,3 106,1 48,5 -9,2 -10,2Central Eur.-5 121,9 138,6 176,2 127,1 106,8 41,9 145,3 161,0 201,6 125,2 105,2 48,0 -6,0 -6,0South-East Eur.-7 25,4 29,0 37,0 127,6 107,2 27,6 42,7 48,7 62,7 128,7 108,2 46,8 -17,4 -19,2Baltic states-3 9,9 11,2 14,9 132,8 111,6 42,4 14,2 16,6 21,6 130,3 109,5 61,7 -18,8 -19,3Russian Federation 101,6 106,9 134,7 126,0 105,9 32,2 53,8 60,5 74,2 122,6 103,0 17,7 13,4 14,5
Sources: National statistics; UN ECE statistical report, 2004, and own estimation from October 2003 statistics..* Remark: US $ depreciated relative to euro (main trade currency of these countries) by 17% in 2003.Thus the real growth in trade in constant euros (e.g. free of 2% inflation) is signirficantly lower than what the nominal USD indicate for 2003.
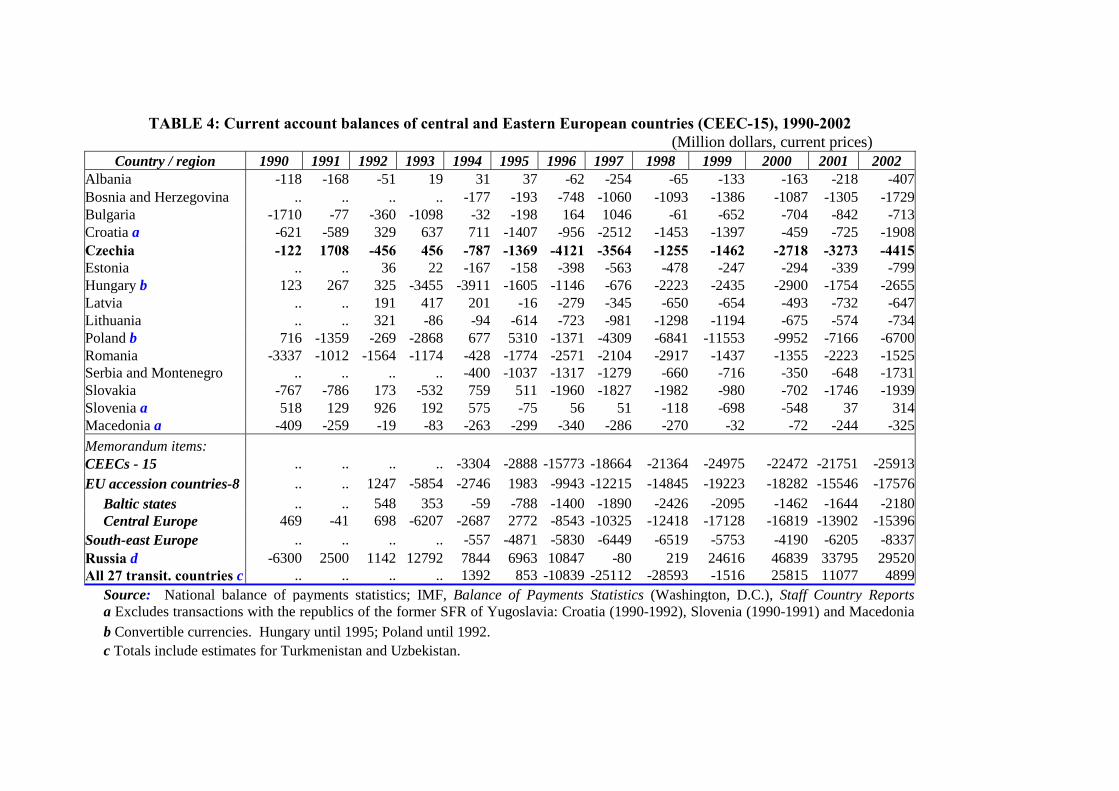
TABLE 4: Current account balances of central and Eastern European countries (CEEC-15), 1990-2002 (Million dollars, current prices)
Country / region 1990 1991 1992 1993 1994 1995 1996 1997 1998 1999 2000 2001 2002Albania -118 -168 -51 19 31 37 -62 -254 -65 -133 -163 -218 -407Bosnia and Herzegovina .. .. .. .. -177 -193 -748 -1060 -1093 -1386 -1087 -1305 -1729Bulgaria -1710 -77 -360 -1098 -32 -198 164 1046 -61 -652 -704 -842 -713Croatia a -621 -589 329 637 711 -1407 -956 -2512 -1453 -1397 -459 -725 -1908Czechia -122 1708 -456 456 -787 -1369 -4121 -3564 -1255 -1462 -2718 -3273 -4415Estonia .. .. 36 22 -167 -158 -398 -563 -478 -247 -294 -339 -799Hungary b 123 267 325 -3455 -3911 -1605 -1146 -676 -2223 -2435 -2900 -1754 -2655Latvia .. .. 191 417 201 -16 -279 -345 -650 -654 -493 -732 -647Lithuania .. .. 321 -86 -94 -614 -723 -981 -1298 -1194 -675 -574 -734Poland b 716 -1359 -269 -2868 677 5310 -1371 -4309 -6841 -11553 -9952 -7166 -6700Romania -3337 -1012 -1564 -1174 -428 -1774 -2571 -2104 -2917 -1437 -1355 -2223 -1525Serbia and Montenegro .. .. .. .. -400 -1037 -1317 -1279 -660 -716 -350 -648 -1731Slovakia -767 -786 173 -532 759 511 -1960 -1827 -1982 -980 -702 -1746 -1939Slovenia a 518 129 926 192 575 -75 56 51 -118 -698 -548 37 314Macedonia a -409 -259 -19 -83 -263 -299 -340 -286 -270 -32 -72 -244 -325Memorandum items:CEECs - 15 .. .. .. .. -3304 -2888 -15773 -18664 -21364 -24975 -22472 -21751 -25913EU accession countries-8 .. .. 1247 -5854 -2746 1983 -9943 -12215 -14845 -19223 -18282 -15546 -17576 Baltic states .. .. 548 353 -59 -788 -1400 -1890 -2426 -2095 -1462 -1644 -2180 Central Europe 469 -41 698 -6207 -2687 2772 -8543 -10325 -12418 -17128 -16819 -13902 -15396South-east Europe .. .. .. .. -557 -4871 -5830 -6449 -6519 -5753 -4190 -6205 -8337Russia d -6300 2500 1142 12792 7844 6963 10847 -80 219 24616 46839 33795 29520All 27 transit. countries c .. .. .. .. 1392 853 -10839 -25112 -28593 -1516 25815 11077 4899 Source: National balance of payments statistics; IMF, Balance of Payments Statistics (Washington, D.C.), Staff Country Reports a Excludes transactions with the republics of the former SFR of Yugoslavia: Croatia (1990-1992), Slovenia (1990-1991) and Macedonia b Convertible currencies. Hungary until 1995; Poland until 1992. c Totals include estimates for Turkmenistan and Uzbekistan.

TABLE 5: Appropriations of accession countries from the European Commission cummulated for 2004-2006 (In mil. EUR, 1999 prices)
Payments from EC Czech. Poland Hung. Slovak. Sloven. Eston. Latvia Lith. Cyprus Malta TOTAL RemarkAgriculture 1120 4636 1483 628 401 254 401 725 115 28 9791Structural policy 2328 11369 2847 1560 405 618 1036 1366 101 79 21709Internal policy 419 1817 559 329 222 127 175 539 48 20 4255Cash 747 1443 211 86 233 22 26 48 338 232 3386Administ. and tech. support - - - - - - - - - - 1711 /*1TOTAL (mil. Eur) 4614 19265 5100 2603 1261 1021 1638 2678 602 359 40852Number of inhabitants 10,2 38,7 10,2 5,4 2 1,4 2,4 3,5 0,76 0,39 74,95GDP in 2001 (in bn EUR) 63,3 196,6 58,0 22,8 20,9 6,2 8,5 13,4 10,2 4,1 404 /*2GDP per capita 6206 5080 5686 4222 10450 4429 3542 3829 13421 10513 5390Total receipts / per capita 452 498 500 482 631 729 683 765 792 921 545Agriculture/ per capita 110 120 145 116 201 181 167 207 151 72 131Structural funds./ per capita 228 294 279 289 203 441 432 390 133 203 290Internal policy / per capita 41 47 55 61 111 91 73 154 63 51 57Cash/ per capita 73 37 21 16 117 16 11 14 445 595 45Total receipts/GDP (p.a. in %) 2,47 3,33 2,98 3,87 2,05 5,59 6,54 6,78 2,00 2,97 3,43 /*3Agric./GDP (annually in %) 0,60 0,80 0,87 0,93 0,65 1,39 1,60 1,84 0,38 0,23 0,82 /*3Struct./GDP (annually in %) 1,25 1,96 1,67 2,32 0,66 3,38 4,14 3,46 0,34 0,65 1,82 /*3Internal/GDP (annually in %) 0,22 0,31 0,33 0,49 0,36 0,70 0,70 1,37 0,16 0,17 0,36 /*3Cash/GDP (annually in %) 0,40 0,25 0,12 0,13 0,38 0,12 0,10 0,12 1,12 1,92 0,28 /*3Source: Statistics of the European Commission on Enlargement, December, 2003 /*1 Including structural funds of 38 mil. EUR non-allocated by countries/*2 Based on current exchange rate/*3 The transfers for 2004 (since 1 May) were taken for 2/3 of a year.In addition, the following assumptions were taken for estimating the GDP growth in nominal prices in 2005:
• the inflation of euro from 1999 was 1.5% per year;• the growth of GDP in accession countries (for 2002-2005) was 3.4% p.a.;• the real appreciation of domestic currencies to euro was 1.4% p.a. (according to Balassa-Samuelson effect).
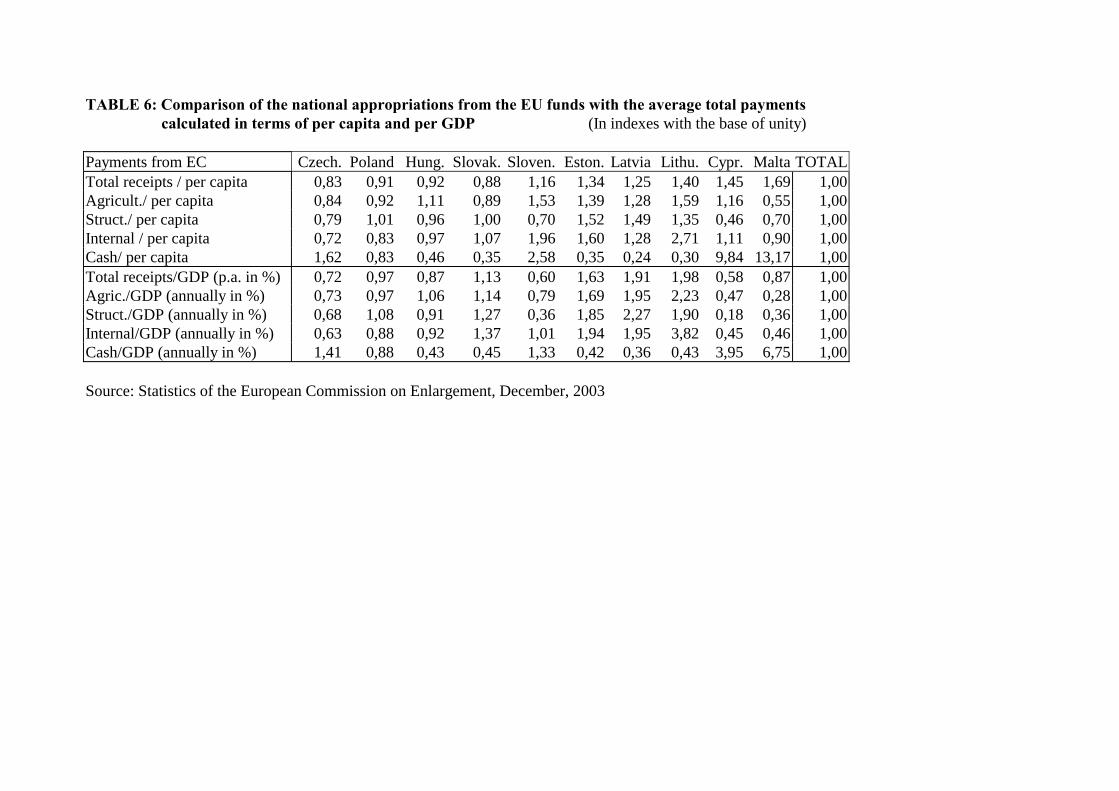
TABLE 6: Comparison of the national appropriations from the EU funds with the average total payments calculated in terms of per capita and per GDP (In indexes with the base of unity)
Payments from EC Czech. Poland Hung. Slovak. Sloven. Eston. Latvia Lithu. Cypr. Malta TOTALTotal receipts / per capita 0,83 0,91 0,92 0,88 1,16 1,34 1,25 1,40 1,45 1,69 1,00Agricult./ per capita 0,84 0,92 1,11 0,89 1,53 1,39 1,28 1,59 1,16 0,55 1,00Struct./ per capita 0,79 1,01 0,96 1,00 0,70 1,52 1,49 1,35 0,46 0,70 1,00Internal / per capita 0,72 0,83 0,97 1,07 1,96 1,60 1,28 2,71 1,11 0,90 1,00Cash/ per capita 1,62 0,83 0,46 0,35 2,58 0,35 0,24 0,30 9,84 13,17 1,00Total receipts/GDP (p.a. in %) 0,72 0,97 0,87 1,13 0,60 1,63 1,91 1,98 0,58 0,87 1,00Agric./GDP (annually in %) 0,73 0,97 1,06 1,14 0,79 1,69 1,95 2,23 0,47 0,28 1,00Struct./GDP (annually in %) 0,68 1,08 0,91 1,27 0,36 1,85 2,27 1,90 0,18 0,36 1,00Internal/GDP (annually in %) 0,63 0,88 0,92 1,37 1,01 1,94 1,95 3,82 0,45 0,46 1,00Cash/GDP (annually in %) 1,41 0,88 0,43 0,45 1,33 0,42 0,36 0,43 3,95 6,75 1,00
Source: Statistics of the European Commission on Enlargement, December, 2003
Dosud vyšlo :1. Michal Hlaváček : Modely difuze technologií2. Tomáš Cahlík : Analýza ekonomického výzkumu3. Vladimír Benáček: : Autentický soukromý sektor v transitivní ekonomice: příspěvek ke hledání kořenů a
alternativ českého kapitalismu4. Milan Sojka : Alternativní scénáře transformační strategie československé ekonomiky na počátku 90. let a
jejich teoretická východiska5. Jiří Hlaváček, Michal Hlaváček : Optimum výrobce v odvětví s nikdy neklesajícími výnosy z rozsahu6. František Turnovec : The Czech Republic on its Way to the European Union7. Lubomír Mlčoch : Ekonomie důvěry8. Luděk Urban : Zásady společné obchodní politiky a důsledky jejich přijetí pro českou ekonomiku9. Jan Ámos Víšek : Export z ČR do EU a mimo EU10. Miloslav S. Vošvrda : On Martingale Diffusions in Financial Markets11. František Turnovec :Flexible Integration and the Excessive Deficit Procedure in the EMU12. Jiří Hlaváček, Michal Hlaváček : Byl proces eliminace podniků ozdravnou procedurou pro české
hospodářství konce 90. let?13. Karel Půlpán: Hospodářský vývoj Španělska jako inspirace pro Českou republiku.14. Jiří Hlaváček, Michal Hlaváček : Ekonomicky racionální altruismus15. Jiří Kameníček : Nástroje pro popis nestandardního ekonomického chování, aplikace teorie lidského
kapitálu16. Jiří Hlaváček : Redistribuce : projev lidských preferencí a společenských potřeb17. Silvester van Koten: Transaction Cost Economics: Basic Concepts and Extensions18. Hlaváček J., Hlaváček M.: Ekonomická racionalita donátora a důvěra k příjemci dotace19. Vladimír Benáček , Víšek Jan Ámos: Determining Factors of Competitiveness of Trade and Specialization of
Czech Industrial Sector before the EU Accession20. Milan Sojka, Postkeynesovská teorie peněz, peněžní a úvěrová politika a postavení centrální banky21. Milan Sojka, Alternativní scénáře transformační strategie československé ekonomiky na počátku 90. let a
jejich teoretická východiska22. František Turnovec, Economic Research and Education in the Czech Republic 1989-200023. Jiří Hlaváček , Michal Hlaváček : Petrohradský paradox24. František Turnovec : Evaluation of National, Political and Institutional Influence in Consultation,
Cooperation and Co-decision Procedures of the EU Decision Making25. Karel Půlpán: Rakouský poválečný vývoj26. Ondřej Schneider : European Pension Systems and the EU Enlargement27. Martin Gregor: Mancur Olson redivivus, „Vzestup a pád národů“ a současné společenské vědy”28. Martin Gregor: Mancur Olson’s Addendum to New Keynesianism: Wage Stickiness Explained29. Patrik Nový : Olsonova teorie hospodářského cyklu ve světle empirie: návrh alternativního
metodologického přístupu30. Ondřej Schneider: Veřejné rozpočty v ČR v 90. letech 20. století – kořeny krize31. Michal Ježek: Mikroanalýza reformy českého důchodového systému32. Michal Hlaváček: Efektivnost pořízení a předávání informace mezi privátními subjekty s pozitivně-
extenalitní vazbou33. Tomáš Richter: Zástavní právo k podniku z pohledu teorie a praxe dluhového financování34. Vladimír Benáček: Rise of an Authentic Private Sector in an Economy of Transition: De Novo Enterprises
and their Impact on the Czech Economy35. Tomáš Cahlík, Soňa Pokutová, Ctirad Slavík: Human Capital Mobility36. Tomáš Cahlík, Jakub Sovina: Konvergence a soutěžní výhody ČR37. Ondřej Schneider, Petr Hedbávný: Fiscal Policy: Too Political?38. Jiří Havel: Akcionářská demokracie „Czech made“39. Jiří Hlaváček, Michal Hlaváček: K mikroekonomickému klimatu v ČR na začátku 21.století: kartel prodejců
pohonných hmot? (případová studie)40. Karel Janda: Credit Guarantees in a Credit Market with Adverse Selection41. Lubomír Mlčoch: Společné dobro pro ekonomiku: národní, evropské, globální42. Karel Půlpán: Hospodářský vývoj Německa jako inspirace pro Česko

43. Milan Sojka: Czech Transformation Strategy and its Economic Consequences: A Case of an InstitutionalFailure
44. Luděk Urban: Lisabonská strategie, její hlavní směry a nástroje.45. Jiří Hlaváček, Michal Hlaváček: Models of Economically Rational Donators46. Karel Kouba, Ondřej Vychodil, Jitka Roberts: Privatizace bez kapitálu.47. František Turnovec: Economic Research in the Czech Republic: Entering International Academic Marke.t48. František Turnovec, Jacek W. Mercik, Mariusz Mazurkiewicz: Power Indices: Shapley-Shubik or Penrose-
Banzhaf?
Univerzita Karlova v Praze, Fakulta sociálních věd,
Institut ekonomických studií [UK FSV – IES] Praha 1, Opletalova 26.E-mail : [email protected] http://ies.fsv.cuni.cz