NMR f ree ligand conformation s and atomic resolution dynamics
16
1 NMR free ligand conformations and atomic resolution dynamics Amber Y.S. Balazs 1 , Nichola L. Davies 2 , David Longmire 2 , Martin J. Packer 2 , Elisabetta Chiarparin 2 1 Chemistry, Oncology R&D, AstraZeneca, Waltham, Massachusetts 02451, United States 2 Chemistry, Oncology R&D, AstraZeneca, Cambridge CB4 0QA, United Kingdom Correspondence to: Amber Y.S. Balazs ([email protected]) 5 Abstract. Knowledge of free ligand conformational preferences (energy minima) and conformational dynamics (rotational energy barriers) of small molecules in solution can guide drug design hypotheses and help rank ideas to bias syntheses towards more active compounds. Visualization of conformational exchange dynamics around torsion angles, by replica- exchange with solute tempering molecular dynamics (REST-MD), gives results in agreement with high resolution 1 H NMR spectra and complements free ligand conformational analyses. Rotational energy barriers around individual bonds are 10 comparable between calculated and experimental values, making the in silico method relevant to ranking prospective design ideas in drug discovery programs, particularly across a series of analogues. Prioritizing design ideas, based on calculations and analysis of measurements across a series, efficiently guides rational discovery towards the 'right molecules' for effective medicines. 1 Introduction 15 NMR signal line shapes inherently provide atomic-level, site-specific insights into structural dynamics. High resolution 1 H NMR signals broaden when small molecules in solution undergo exchange dynamics on a millisecond timescale. In contrast, sharp NMR resonance signals may indicate either a dominant pre-organized conformation or an ensemble of flexible molecules undergoing fast equilibrium exchange between rotational isomers. Comparisons between experimental and computed NMR parameter values (shifts, NOEs, J-couplings) can identify relative populations of conformers, such as a 20 singular, highly populated conformation, with well defined internuclear distances and torsion angles or an averaged solution structure, composed of multiple conformations, each at a low molar fraction of the total, resulting from low barriers to rotation around bonds. NMR analysis of molecular flexibility in solution (NAMFIS; Cicero et al., 1995) takes the approach of systematically varying percent contributions from sets of conformers generated in silico, together with the corresponding calculated NMR parameter values, compared against the experimental data. The sum of square differences determines the 25 goodness-of-fit between experimental and calculated values to select a best-fit population weighted model. The fundamental concept of filtering theoretical conformations through experimental data to derive the best fit has become well established over the decades, together with variations in details of implementation, to determine the conformational preference(s) of a small molecule in solution (Cicero et al., 1995; Nevins et al, 1999; Slabber et al., 2016; Wu et al., 2017; Balazs et al., 2019; Farès et al., 2019; Atilaw et al., 2021). 30 https://doi.org/10.5194/mr-2021-27 Discussions Open Access Preprint. Discussion started: 12 March 2021 c Author(s) 2021. CC BY 4.0 License.
Transcript of NMR f ree ligand conformation s and atomic resolution dynamics

1
NMR free ligand conformations and atomic resolution dynamics
Amber Y.S. Balazs1, Nichola L. Davies2, David Longmire2, Martin J. Packer2, Elisabetta Chiarparin2
1Chemistry, Oncology R&D, AstraZeneca, Waltham, Massachusetts 02451, United States 2Chemistry, Oncology R&D, AstraZeneca, Cambridge CB4 0QA, United Kingdom
Correspondence to: Amber Y.S. Balazs ([email protected]) 5
Abstract. Knowledge of free ligand conformational preferences (energy minima) and conformational dynamics (rotational
energy barriers) of small molecules in solution can guide drug design hypotheses and help rank ideas to bias syntheses
towards more active compounds. Visualization of conformational exchange dynamics around torsion angles, by replica-
exchange with solute tempering molecular dynamics (REST-MD), gives results in agreement with high resolution 1H NMR
spectra and complements free ligand conformational analyses. Rotational energy barriers around individual bonds are 10
comparable between calculated and experimental values, making the in silico method relevant to ranking prospective design
ideas in drug discovery programs, particularly across a series of analogues. Prioritizing design ideas, based on calculations
and analysis of measurements across a series, efficiently guides rational discovery towards the 'right molecules' for effective
medicines.
1 Introduction 15
NMR signal line shapes inherently provide atomic-level, site-specific insights into structural dynamics. High resolution 1H
NMR signals broaden when small molecules in solution undergo exchange dynamics on a millisecond timescale. In contrast,
sharp NMR resonance signals may indicate either a dominant pre-organized conformation or an ensemble of flexible
molecules undergoing fast equilibrium exchange between rotational isomers. Comparisons between experimental and
computed NMR parameter values (shifts, NOEs, J-couplings) can identify relative populations of conformers, such as a 20
singular, highly populated conformation, with well defined internuclear distances and torsion angles or an averaged solution
structure, composed of multiple conformations, each at a low molar fraction of the total, resulting from low barriers to
rotation around bonds. NMR analysis of molecular flexibility in solution (NAMFIS; Cicero et al., 1995) takes the approach
of systematically varying percent contributions from sets of conformers generated in silico, together with the corresponding
calculated NMR parameter values, compared against the experimental data. The sum of square differences determines the 25
goodness-of-fit between experimental and calculated values to select a best-fit population weighted model. The fundamental
concept of filtering theoretical conformations through experimental data to derive the best fit has become well established
over the decades, together with variations in details of implementation, to determine the conformational preference(s) of a
small molecule in solution (Cicero et al., 1995; Nevins et al, 1999; Slabber et al., 2016; Wu et al., 2017; Balazs et al., 2019;
Farès et al., 2019; Atilaw et al., 2021). 30
https://doi.org/10.5194/mr-2021-27
DiscussionsOpe
n Acc
ess
Preprint. Discussion started: 12 March 2021c© Author(s) 2021. CC BY 4.0 License.

2
Determining the conformational profile of a free ligand in solution enhances early drug discovery programs (LaPlante et al.,
2014; Blundell et al., 2016; Foloppe and Chen, 2016; Chiarparin et al., 2019). A general overview of how NMR fits into
Medicinal Chemistry design cycles is illustrated in Fig. 1. An efficacious pharmaceutical that positively impacts patients'
lives starts with Medicinal Chemistry teams designing the right molecule. Design teams need to understand whether a
molecule readily adopts its "bioactive" conformation in solution to optimize the binding on-rate through reduced 35
conformational entropy and energetic penalty paid on conformational rearrangement to the proper binding mode. In addition,
pre-organization of the free ligand in solution would indicate minimized conformational strain energy in the bound molecule.
If not, the challenge is to conceive of ideas to modify the molecule to favor this conformation. Towards this aim of
optimizing the free energy of binding, it is desirable for ligands in solution to preferentially pre-organize into the bioactive
binding mode (Blundell et al., 2013; Balazs et al., 2019). Molecular rigidification strategies (Fang et al., 2014; de Sena M 40
Pinheiro et al., 2019) increase pre-organization and NMR conformational analysis can deconvolute and report on the molar
fraction adopting the bioactive conformation. Structure based drug design (SBDD) can be enhanced by ready access to 3D
free ligand average solution conformations to complement X-ray crystallographic models of the bound ligand and protein-
ligand interactions (Blundell et al., 2013; Chiarparin et al., 2019; Balazs et al., 2019). Faster design cycles require quick
turnover times in analyzing solution conformations of synthesized compounds. Design cycles can be accelerated through 45
faster computational schemes, efficient automation to obtain NMR spectral parameters, and recognition of conformational
signatures from 1D NMR spectra (Balazs et al., 2019), also named, “SAR by 1D NMR” (Zondlo, 2019).
https://doi.org/10.5194/mr-2021-27
DiscussionsOpe
n Acc
ess
Preprint. Discussion started: 12 March 2021c© Author(s) 2021. CC BY 4.0 License.

3
Figure 1. An illustrative Medicinal Chemistry design cycle for drug discovery. NMR plays a key role in synthesis support for
structural identification and analysis of compound purity. NMR also can be used to enhance structure based drug design through 50 NMR free ligand conformational analysis. This provides the relative population of the bioactive conformation in solution by
determining the percentages of the minimal energy conformers. Structure based drug design is enhanced through measured extent
of free-ligand pre-organization into the bioactive conformation, which lends itself to rigidification design hypotheses aimed at
optimized binding to the protein target.
Herein, we demonstrate incorporation of molecular dynamics, specifically an efficient version using replica-exchange with 55
solute tempering (REST-MD) (Liu et al., 2005; Huang et al., 2007; Wang et al., 2011), into an NMR based semi-automatic
drug discovery platform, to visualize rotational barriers around molecular bonds. Good agreement is demonstrated between
REST-MD calculated energy barriers and NMR measurements, using a small molecule selective estrogen-receptor degrader
(SERD) example from a recent Oncology R&D project (Scott et al., 2016; Scott et al., 2019; Scott et al., 2020). The
theoretical and experimental data complement each other: REST-MD simplifies the interpretation of NMR conformational 60
dynamics, while the experimental NMR results can inform calculations by defining site-specific preferred torsions of the
dominant conformer and experimental conformer distributions, which may influence the initial REST-MD 3D geometry and
the sampling ergodicity achieved, as reflected in the resultant histograms.
2 Results and Discussion
2.1 NAMFIS plus NMR line shape analysis 65
The ability of NMR to provide information on conformational dynamics, in addition to giving information on
conformational preference, is useful in small molecule drug discovery. In Fig. 2a, each peak is doubled for compound 2 (1:1
ratio), instantly recognizable to NMR users as slow exchange of rotamers due to hindered bond rotation (measured half-life ~
0.5 sec). As a guide to the eye, the signal(s) for the benzylic CH proton at ~ 5 ppm is/are highlighted in Fig. 2. The NMR
spectrum reports two dominant conformers, equally populated, for the free ligand in solution for compound 2. The bioactive 70
conformation is one of a family of conformers (shown in green) with some flexibility around the pendant base. The
alternative conformation (shown in orange) is the other, giving ~ 50% of the compound locked in a non-bioactive
conformation. In contrast, Fig. 2b shows that compound 3 has a single set of sharp signals due to fast exchange (corresponds
to a typical half-life of ~ nanoseconds, Δv½ = 2.8 Hz). The 1H NMR spectrum has a single isotropic chemical shift for both of
the protons within one CH2 functional group (these are not diastereotopic), an indication of local flexibility quickly picked 75
up by an edited 13C HSQC spectrum. Appreciation of the temporal dependence of free ligand exchange dynamics on NMR
spectra can quickly inform medicinal chemists on local flexibility around bonds of newly synthesized molecules. This
analysis, combined with potency data and matched molecular pair analysis, or a full comparison across a congeneric series,
can provide critical insights into structure-activity relationships (Balazs et al., 2019).
Together with information regarding relative populations of conformations in solution, information about the magnitude of 80
the rotational energy barrier between conformations, i.e. between one rotational isomer and another, is relevant information.
https://doi.org/10.5194/mr-2021-27
DiscussionsOpe
n Acc
ess
Preprint. Discussion started: 12 March 2021c© Author(s) 2021. CC BY 4.0 License.

4
The challenge has been to get quick, easy, and comprehensive, yet accurate torsional profiles. Building a practicable and
prospective visualization of conformational exchange dynamics around torsion angles into an NMR conformational analysis
platform increases the potential to impact design, by highlighting the potential energy penalty of restricting torsions. To
evaluate the dynamics, incorporating REST-MD into the workflow met the goal of expanding the current free ligand 85
conformational analysis platform to make use of kinetic parameters from NMR spectra, e.g. signal line widths, while
keeping within practical time limit constraints for Medicinal Chemistry design cycles.
Figure 2 . NMR spectra inherently capture kinetic information from conformational dynamics (rotational energy barriers) in the
signal line widths. The benzylic CH is highlighted to exemplify the spectral changes between the dimethyl and des-methyl analogs. 90 (a) The 1H NMR spectrum shows rotamers with equal populations undergoing slow exchange on the NMR timescale. Profiling of 2
gave pIC50 8.9 and logD 4.8, with 50% bioactive conformation of the free ligand in DMSO-d6 solution. (b) A spectrum with
population weighted conformational averaging due to low barriers to rotation around bonds and fast exchange on the NMR
timescale. Profiling of 3 resulted in pIC50 8.8, logD 4.1, 50% free ligand solution bioactive conformation. For this molecular
matched pair we see similarities in the percent bioactive conformation in solution and the potency, regardless of the increased 95 logD.
REST-MD predicts a comprehensive torsional profile in silico for rotatable bonds represented in a 2D molecular structure,
while keeping computational speed and accuracy high. GPUs make REST-MD calculations feasible within drug discovery
design cycle times. Ligand-based REST-MD simulates a ligand in explicit solvent at room temperature, allowing for
conformational effects often neglected due to computational expense. The ligand conformers are sampled according to their 100
Boltzmann populations and resultant reports visualize rotational torsion energies (Fig. 3). High accuracy fragment based
https://doi.org/10.5194/mr-2021-27
DiscussionsOpe
n Acc
ess
Preprint. Discussion started: 12 March 2021c© Author(s) 2021. CC BY 4.0 License.
5
calculations of rotational energy barriers (kcal/mol) are plotted as a function of bond torsion angle (solid lines). A
superimposition of histograms counting the number of times the particular bond was observed at any particular angle is
plotted onto the rotational energy barrier plot showing the torsion potential at each dihedral angle, summarizing the
conformational space sampled during the REST-MD simulation. Such reports augment the 1H NMR spectral interpretation, 105
providing quantitative energy minima and theoretical distributions of conformers.
Figure 3. REST-MD visualizations, implemented in Maestro (Schrödinger, 2020b) complement atomic resolution NMR
interpretations of structural dynamics across all bonds. (a) Simulation interaction diagrams report the rotational energy barrier
(kcal/mol) as a function of the bond rotation angle. The conformational space sampled during the simulation is reported either as a 110 function of the simulation time (radial plots, from the center at the start and spiraling outward) or as histograms superimposed on
the torsion energy profiles (kcal/mol vs bond angle across each color coded bond in the molecule). Profiles are readily compared
between molecular bonds that are pre-organized (light blue with y-axis maximum in the plot at 25 kcal/mol, with a bimodal radial
plot and two energy minima), and flexible (pink with 3 kcal/mol maximum y-axis value, three energy minima, equally populated,
and a randomly populated radial plot). (b) The barrier to rotation of the dimethyl is calculated to be, based on the lower of the two 115 barriers, ~20 kcal/mol. Whereas experimentally both energy minima are equally populated as seen by the 1:1 ratio by NMR, the
sampling conditions of the rigid “blue” bond were insufficient in the simulation to equally populate both wells. The NMR data in
such cases clearly informs on the calculated predictions. A separate REST-MD simulation for the des-methyl compound, 3, was < 6
kcal/mol calculated rotational energy barrier for the same “blue” bond, consistent with sharp lines and ready conversions between
the two conformers, with a broadened range of torsions, albeit still bimodal. 120
2.2 NMR measured rotational energy barrier
Methylation is a familiar and fundamental structural rigidification tool in a Medicinal Chemist's toolbox. In Fig. 2
methylation of the D ring demonstrates restricted bond rotation by the presence of rotameric signals in the 1H NMR
spectrum. Such restricted bond rotations, on millisecond timescales, occur when barriers to rotation about a bond are high
(>~15 kcal/mol under ambient conditions). In contrast, a structural analog without methyl groups on the D ring displays free 125
https://doi.org/10.5194/mr-2021-27
DiscussionsOpe
n Acc
ess
Preprint. Discussion started: 12 March 2021c© Author(s) 2021. CC BY 4.0 License.
6
bond rotation on the NMR timescale (~ nanoseconds). Typically such barriers to rotation at room temperature correspond to
~ 5 kcal/mol (LaPlante et al., 2011a; LaPlante et al., 2011b; Wipf et al., 2015). The NMR spectrum of the ensemble of
rapidly exchanging conformations reflects the Boltzmann weighted average of the chemical shifts, J-couplings, and
interproton distances, with a single set of sharp peaks.
To locate the bond with the hindered rotation, chemical intuition is often sufficient. Using variable temperature NMR and/or 130
exchange spectroscopy, the rotational energy barrier and the torsional rotation half-life of exchange can be determined. Fig.
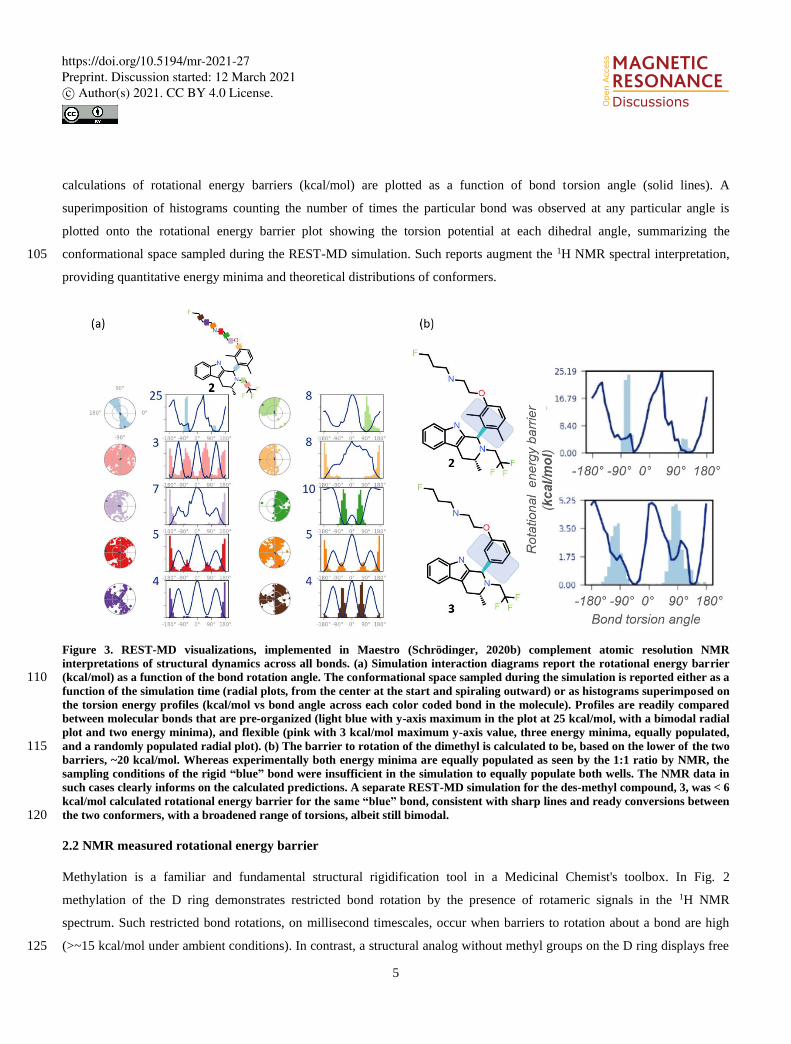
4 shows 1H NMR spectra as a function of eight different temperatures. The spectrum near room temperature has two equal
rotameric populations undergoing slow exchange on the NMR timescale, and highlighted in the figure. With increasing
temperature the peaks coalesce and then begin to narrow. Increasing the temperature not only increases the rotation rate of
the aromatic ring, it also increases the rate of fluctuations in the pendant base and the CH2CF3 groups and between axial vs. 135
equatorial methyl orientation in ring C. Overall, this drives a shift to higher ppm for the exchange averaged signal with
increasing temperature (Fig. 4).
Figure 4. VT NMR stacked plots for the dimethyl compound undergoing slow to fast exchange with increasing temperature. To
measure the energy barrier to rotation of the D-ring, three temperatures and a 1D selective EXSY at different mixing times was 140 used to estimate the exchange rates and half-life. An Arrhenius plot gives the barrier to rotation at 19.9 kcal/mol and the 300 K
half-life is ~ 0.5 sec.
In order to determine the barrier to rotation around the aromatic ring, it was important to collect data within a temperature
range where exchange rates were dominated by the dynamics of interest in order to follow a simple two-state model for
https://doi.org/10.5194/mr-2021-27
DiscussionsOpe
n Acc
ess
Preprint. Discussion started: 12 March 2021c© Author(s) 2021. CC BY 4.0 License.

7
analysis. Therefore, three temperatures at 300, 305, and 310 K were chosen and exchange spectroscopy was performed with 145
selective inversion on the peak near 5.3 ppm. At each of the three temperatures 8 mixing times (100, 200, 300, 400, 500,
700, 1000, and 2000 milliseconds) were used to determine the first order rate kinetics, with the fitted value for k given in
tabular form in Fig. 4. The half-life was derived from ln(2)/k. The fitted plot of ln(k) vs. 1/RT is shown, revealing a value of
19.9 kcal/mol for the barrier to rotation.
2.3 NMR informs calculations 150
REST-MD generates a large ensemble of (~1000) conformations, in explicit solvent. REST-MD was run with Desmond
(Schrödinger, 2020a) with the pendant base initially oriented either forward or backward relative to the tricyclic core for 1.
The resultant calculated energy barrier of ~ 20 kcal/mol (Fig. 3b) is in agreement with the NMR determined value of 19.9
kcal/mol. The REST-MD visualization confirmed chemical intuition that the source of the rotameric species is the bond
between the tricyclic core and the aromatic ring. Advantageously, the full torsional profile report from the REST-MD 155
simulation can be run prospectively to rank design ideas, for instance to test a hypothesis around rigidification and the degree
of bioactive pre-organization induced. The ability of REST-MD to evaluate torsion angles prior to synthesis can also flag
chemists to check the NMR for site-specific dynamics information at the time of structural verification. Such information
could alert the team to add a diagnostic selective-NOE measurement to the standard acquisition suite, to test a free ligand
conformational hypothesis post synthesis, while the solution sample is in the spectrometer for structural identification. 160
Conversely, the NMR can supply experimental details inaccessible to the calculations, particularly helpful within a chemical
series, as the lessons are generally translatable across the structural analogs. For instance, the 1H NMR spectrum of the
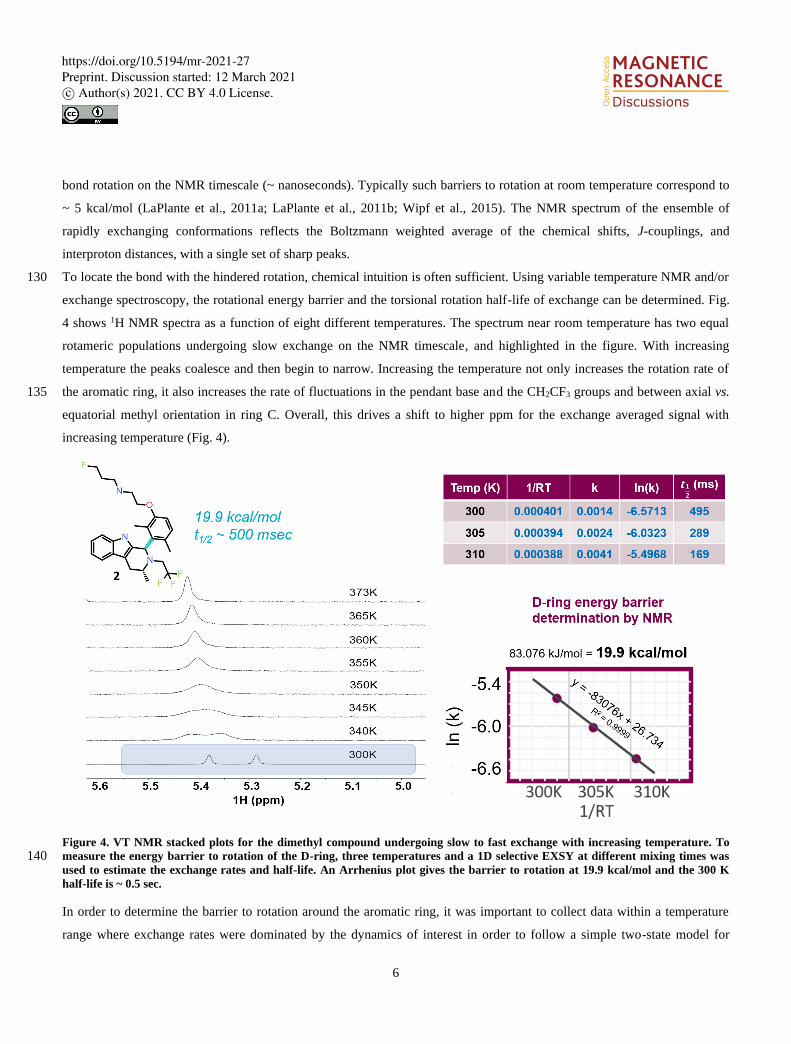
dimethyl compound 2 showed a 1:1 ratio between the two exchanging conformations (Fig. 2). Whereas REST-MD
conformational sampling shows only one of the two minima populated (Fig. 5). The fragment based energy calculation,
shown as a solid line in the REST-MD torsional profiles, is consistently the same, even using a very short simulation time 165
(e.g. picoseconds). The histograms vary based on initial conformation and number of replicates run. Starting with an initial
conformation with the pendant base facing "forward" relative to the tricyclic core, the radial plot of torsion angle
representation as a function of time starting at the center and spiraling outward, only populates the ~ +90º bond torsion angle
during the 50 ns simulation that has a temperature range of 300 - 1263 K (12 replicates, 50 nanoseconds). Analogously, the
histogram has one energy minimum populated and the number of times the ~ +90º torsion was observed is fairly narrowly 170
distributed (Fig. 5, top). With the same initial conformation, increasing the temperature range to a high of 3302 K (20
replicates, 50 nanoseconds), showed some evidence of sampling of the opposite conformation in the radial plot (Fig. 5,
middle). Starting the simulation with the 3D conformation switched to put the pendant base towards the back instead and
running 20 replicates for a higher sampling temperature shows both minima were sampled (Fig. 5, bottom). Once this
compound has been synthesized, it then becomes experimentally apparent from the 1H NMR spectrum at 300 K in DMSO-d6 175
that both minima are equally populated (Fig. 2a). In this manner the experimental results can be fed-back to the calculations
to refine details and gauge areas of caution during interpretation.
https://doi.org/10.5194/mr-2021-27
DiscussionsOpe
n Acc
ess
Preprint. Discussion started: 12 March 2021c© Author(s) 2021. CC BY 4.0 License.
8
Figure 5. The REST-MD simulation of the dimethyl compound 2 predicts a preference to populate only one energy minimum,
correlated with the initial dihedral angle starting condition in the simulation. Shown are results from calculations for 180 conformations sampled as a function of bond rotation angle for the bond between the tricyclic core and the aromatic ring, bolded
in the molecular structure. The three different simulation conditions are, from top to bottom: starting with the pendant base
facing forward (~ +90º) with a temperature range of 300 - 1263 K (12 replicates); same initial conformation, with a temperature
range of 300 - 3302 K (20 replicates); and the opposite initial conformation, with the pendant base facing backward, run with 20
replicates (300 - 3302 K). All REST-MD simulations ran for 50 nanoseconds. 185
2.4 REST-MD/NMR synergy in drug discovery
What REST-MD adds to the existing NMR platform is visualization of conformational dynamics, by providing calculated
rotational energy barriers across all bonds. This complements NMR spectral data to give insight into flexibility / rigidity at
atomic resolution. Together, REST-MD and NMR conformational analysis allows us to utilize all the spectral information,
thermodynamic and kinetic, gathered from 1H NMR spectra: chemical shifts, J-couplings, NOEs and linewidths, to 190
maximize characterization of free ligands in solution.
Without REST-MD, NMR alone can provide valuable information on the experimental conformational preference of the free
ligand in solution. From the NMR alone, the relative populations of each conformer in solution can be deduced. And it can
be determined if the dominant conformer in solution is pre-organized into the bioactive conformation, which is of practical
value for drug discovery. However, adding REST-MD provides an easy and practical way to visualize the magnitude of the 195
https://doi.org/10.5194/mr-2021-27
DiscussionsOpe
n Acc
ess
Preprint. Discussion started: 12 March 2021c© Author(s) 2021. CC BY 4.0 License.
9
energy penalty paid if the bioactive conformation is not highly populated in solution. This can help rationalize the cost to
benefit ratio of effort invested in designing an increase in the percent bioactive conformation by restricting rotation. As drug
discovery requires optimization of several parameters, knowing when binding has been optimized can shift design focus and
resources towards improving physicochemical properties.
The added benefit of REST-MD is its ability to deliver prospective information regarding structural ideas of compounds, not 200
yet synthesized. Accurate predictions of free ligand solution conformational dynamics can help rank compounds to focus
synthesis prioritization and flag supplemental experiments, such as selective NOEs on atom pairs to quickly ascertain
expected conformations.
While the full torsional profile is powerful on its own, the REST-MD results also provide an extensively sampled
conformational ensemble in explicit solvent that can be clustered and fed forward for use in NMR conformational analysis. 205
Taking the selected conformer set forward for QM geometry refinements and calculations of NMR chemical shift and
coupling constants provides the modeled parameter set used for further NAMFIS based analysis. Using the conformer set
generated by REST-MD is particularly helpful for higher molecular weight small molecules which begin to self-associated
during low mode MD conformational searches using a polarizable continuum model to emulate solvent, resulting in a set
highly biased towards collapsed conformations. 210
3 Methods
3.1 NMR Spectroscopy
1H NMR spectra were recorded at 300 K on a 500 MHz NEO or a 600 MHz AVIII Bruker spectrometer with TCI
cryoprobes. Solutions were made from 1-4 mg solid freshly dissolved in DMSO-d6. Spectra were acquired with a 30 degree
hard pulse, a 1 sec delay, 2 dummy shots, and signal averaged over 16 transients. A spectral width of ~ 20 ppm with 64k 215
points was used. Spectral analysis was performed using Advanced Chemistry Development, Inc. (ACD/Labs) Spectrus
Processor (ACD/Labs, Version 2020.1.2). 2D ROESY was run with the Bruker standard pulse program roesyadjsphpr with
ns 4, TD (1024, 256), and a 200 ms spin-lock.
3.1.1 Compound 1
1H NMR (500 MHz, DMSO-d6) Shift 10.54 (s, 1H), 7.44 (d, J = 7.7 Hz, 1H), 7.23 (d, J = 8.0 Hz, 1H), 7.03 (td, J = 7.9, 1.2 220
Hz, 1H), 6.99 (t, J = 8.2 Hz, 1H), 6.97 (td, J = 8.0, 1.2 Hz, 1H), 6.89 (d, J = 7.9 Hz, 1H), 6.28 (br d, J = 8.2 Hz, 1H), 5.14 (s,
1H), 4.51 (dt, J = 47.5, 6.1 Hz, 2H), 4.00 (t, J = 5.6 Hz, 2H), 3.46 (dq, J = 16.0, 10.6 Hz, 1H), 3.37 – 3.33 (m, 1H), 2.99 (dq,
J = 16.0, 10.0 Hz, 1H), 2.90 (t, J = 5.7 Hz, 2H), 2.78 (dd, J = 16.0, 4.5 Hz, 1H), 2.69 (t, J = 6.9 Hz, 2H), 2.62 (dd, J = 16 .0,
7.7 Hz, 1H), 2.53 – 2.51 (m, 1H), 2.28 (s, 3H), 1.85 – 1.74 (m, 2H), 1.06 (d, J = 6.7 Hz, 3H)
https://doi.org/10.5194/mr-2021-27
DiscussionsOpe
n Acc
ess
Preprint. Discussion started: 12 March 2021c© Author(s) 2021. CC BY 4.0 License.

10
3.1.2 Compound 2 225
1H NMR (500 MHz, DMSO-d6) Shift 10.18 (s, 0.5H, isomer1), 10.14 (s, 0.5H, isomer2), 7.39 (d, J = 7.6 Hz, 1H,
isomer1+isomer2), 7.18 (t, J = 7.2 Hz, 1H, isomer1+isomer2), 7.09 (d, J = 8.5 Hz, 0.5H, isomer2), 6.99 – 6.95 (m, 1H,
isomer1+isomer2), 6.95 – 6.90 (m, 1H, isomer1+isomer2), 6.88 (d, J = 8.4 Hz, 0.5H, isomer2), 6.84 (s, 1H, isomer1), 5.38
(s, 0.5H, isomer1), 5.29 (s, 0.5H, isomer2), 4.54 (dt, J = 47.5, 6.0 Hz, 1H, isomer1), 4.44 (dt, J = 47.5, 6.0 Hz, 1H, isomer2),
4.07 – 3.95 (m, 1H, isomer1), 3.95 – 3.85 (m, 1H, isomer2), 3.67 – 3.56 (m, 1H, isomer1+isomer2), 3.39 (s, 1H, 230
isomer1+isomer2), 3.14 – 3.04 (m, 1H, isomer1+isomer2), 2.94 (br t, J = 5.4 Hz, 1H, isomer1), 2.80 (br t, J = 5.6 Hz, 1H,
isomer2), 2.77 (br d, J = 4.5 Hz, 1H, isomer1+isomer2), 2.72 (t, J = 7.0 Hz, 1H, isomer1), 2.69 (br d, J = 15.0 Hz, 1H,
isomer1+isomer2), 2.60 (t, J = 6.9 Hz, 1H, isomer1+isomer2), 2.44 (s, 1.5H, isomer2), 2.39 (s, 1.5H, isomer2), 1.83 (br
dquin, J = 26.2, 6.6 Hz, 1H, isomer1), 1.82 (s, 1.5H, isomer2), 1.80 (s, 1.5H, isomer1), 1.72 (dquin, J = 26.2, 6.4 Hz, 1H,
isomer2), 1.14 (d, J = 6.5 Hz, 3H, isomer1+isomer2) 235
3.1.3 Compound 3
1H NMR (600 MHz, DMSO-d6) Shift 10.86 (s, 1H), 7.45 (d, J = 7.8 Hz, 1H), 7.31 (d, J = 8.0 Hz, 1H), 7.26 (t, J = 7.8 Hz,
1H), 7.08 (dd, J = 8.0, 7.5 Hz, 1H), 7.00 (dd, J = 7.8, 7.5 Hz, 1H), 6.86 (dd, J = 8.2, 2.4 Hz, 1H), 6.84 (d, J = 7.8 Hz, 1H) ,
6.75 (br d, J = 2.3 Hz, 1H), 4.98 (s, 1H), 4.48 (dt, J = 47.5, 6.6 Hz, 2H), 3.95 (t, J = 5.6 Hz, 2H), 3.57 (qd, J = 13.0, 9.3 Hz,
1H), 3.12 (dqd, J = 11.0, 6.8, 5.0 Hz, 1H), 3.01 (qd, J = 18.0, 9.3 Hz, 1H), 2.83 (t, J = 5.7 Hz, 2H), 2.64 (dd, J = 15.8, 5.0 Hz, 240
1H), 2.57 (dd, J = 15.8, 11.0 Hz, 1H), 2.62 (t, J = 6.6 Hz, 2H), 1.76 (dquin, J = 26.1, 6.6 Hz, 2H), 1.11 (d, J = 6.8 Hz, 3H)
3.2 Exchange Spectroscopy
1H NMR spectra were recorded on a 500 MHz NEO at 300, 305, 310, 340, 345, 350, 355, 360, 365, and 373 K. For the 1D
selective exchange spectroscopy at 300, 300, and 310 K, the mixing times used were 100, 200, 300, 400, 500, 700, 1000, and
2000 milliseconds. The spectra were integrated with consistent integral ranges and calibrating the integral of the inverted 245
peak to 100 to consistently normalize the data (Hu and Krishnamurthy, 2006). An excel spreadsheet was used to calculate
the fractional intensity increase as a function of mixing time to fit exchange rate and half-life (Bovey, 1988; Li, et al., 2007).
3.3 REST-MD
Two different initial molecular conformations were run where the variation was place on the relative position of the pendant
base to the tricyclic ring: (i) "forward" or (ii) "backward", using the same atom numbering for all conformations sampled for 250
the same compound, to simplify later steps in the workflow. Molecular protonation states at pH 7.0 ± 0.0 were used for the
MD simulations. The force field builder in Maestro (Schrödinger, 2020b) was used to customize the OPLS3e force field for
the system builder where a NaCl salt concentration of 0.15 M was used and the base was neutralized by addition of 1 Na+
ion during creation of the explicit water shell for solvation using the predefined SPC model and an orthorhombic box shape
https://doi.org/10.5194/mr-2021-27
DiscussionsOpe
n Acc
ess
Preprint. Discussion started: 12 March 2021c© Author(s) 2021. CC BY 4.0 License.

11
of 10 Å x 10 Å x 10 Å using the "buffer" box size calculation method. Desmond (Schrödinger, 2020a) replica exchange with 255
solute tempering molecular dynamics was run with 12 replicas giving a temperature range of 300 K to typically ~1300 K, for
a total of 50 ns for extensive sampling of conformational space during the simulation.
3.4 Simulation Interaction Diagram
The plots automatically generated in Maestro (Schrödinger, 2020b) provide solid lines tracing out the barrier to rotation in
kcal/mol as a function of the torsion angle. The histograms provide the resulting distribution of 1002 conformers under our 260
routine sampling conditions. Radial plots show the evolution of the simulation time from the start, at the center.
3.5 Clustering of Conformers
Ligands, without the solvent shell, were extracted from the REST-MD trajectories for both sets of initial conformers
(forward and backward). To aid a quick visual inspection of the results, conformers was superimposed using the SMARTS
method and the substructure smiles string of c12c(C)c(CN)[nH]c1cccc2 to align the conformers relative to the rigid tricyclic 265
ring. Conformers were clustered in Maestro (Schrödinger, 2020b) by atomic RMSD, discarding mirror-image conformers,
selecting the option of one structure (nearest to centroid) per cluster, thus reducing the full set down to representative diverse
conformers, typically 15 - 40.
3.6 QM Calculations
Chemical Computing Group’s (Molecular Operating Environment (MOE), 2019.01) conformational search GUI was 270
employed to generate input files for Gaussian 16 (Revision C.01) after importing conformers into a molecular database and
using the wash function to neutralize charged species not observed by NMR in DMSO-d6 solutions. QM geometry
refinement, chemical shift calculations and coupling constant calculations were carried out with the GIAO DFT method at
the B3LYP/6-31G* level with PCM solvent modeling using a dielectric constant of 78.4. Geometry optimization keywords
were set with opt=(tight,RecalcFC=5,MaxCycles=5000) and Int=SuperFineGrid. 275
3.7 Conformer Distribution
MOE's Spectral Analysis GUI was employed for least squares fits of chemical shifts to determine conformer distributions;
the option for couplings and NOE's was used selectively.
4 Conclusions
The REST-MD protocols described above provide rapid and prospective access to torsional energy barriers and 280
conformational states for drug-like molecules. The REST-MD calculations accurately reproduce and visualize NMR
dynamics which synergistically work with experimental conformational exchange dynamics obtained from 1D 1H NMR
https://doi.org/10.5194/mr-2021-27
DiscussionsOpe
n Acc
ess
Preprint. Discussion started: 12 March 2021c© Author(s) 2021. CC BY 4.0 License.

12
spectra. Integration of REST-MD into our NMR conformational analysis platform has enabled visualization of atomic level
information by all medicinal chemists and can be readily used to guide design hypotheses toward molecules with improved
potency and or physicochemical properties. 285
This new methodology has been applied across more than 10 early oncology projects in 2020, both small molecules and
PROTACs, to answer questions around conformational preference (populations) and dynamics (rotational barriers).
In addition, NMR provides design teams with information on the presence of intramolecular hydrogen bonds (IMHB), and
the combined influences on properties such as potency, permeability and oral bioavailability. Diverse applications have
enabled refinement of the approach, and represents a step towards the goal of routine use for prospective design and 290
determination of experimentally based conformation-activity relationships.
Author contribution
AB and EC drove the earliest drafts of this manuscript, to which all authors have contributed. MP developed and optimized
computational workflows. DL and ND determined the energy barrier to rotation by NMR. AB ran REST-MD simulations in
Schrödinger and NAMFIS-based analyses in MOE. All authors contributed valuable discussions to the preparation of this 295
manuscript.
Competing interests
All authors are shareholders in AstraZeneca PLC.
Acknowledgements
The entire SERD team, including the analytical, computational, synthetic, and lead chemists, from the extended Oncology 300
R&D group are gratefully acknowledged for chemical designs, syntheses, purifications and compound profiling. We thank
Jason Breed for the crystallography providing protein-ligand and bound conformations shown in Figure 1. An excel
spreadsheet with detailed methodology for the 1D selective EXSY was kindly provided by David Whittaker. We thank Jamie
Scott and Michelle Lamb for valuable feedback on the manuscript.
References 305
ACD/ChemSketch, version 2020.1.2, Advanced Chemistry Development, Inc., Toronto, ON, Canada,
http://www.acdlabs.com, 2021.
https://doi.org/10.5194/mr-2021-27
DiscussionsOpe
n Acc
ess
Preprint. Discussion started: 12 March 2021c© Author(s) 2021. CC BY 4.0 License.

13
Atilaw, Y., Poongavanam, V., Nilsson, C. S., Nguyen, D., Giese, A., Meibom, D., Erdelyi, M., and Kihlberg, J.: Solution
Conformations Shed Light on PROTAC Cell Permeability, ACS Med. Chem. Lett., 12, 107-114, 310
https://doi.org/10.1021/acsmedchemlett.0c00556, 2021.
Balazs, A. Y. S., Carbajo, R. J., Davies, N. L., Dong, Y., Hird, A. W., Johannes, J. W., Lamb, M. L., McCoull, W., Raubo,
P., Robb, G. R., Packer, M. J., and Chiarparin, E.: Free Ligand 1D NMR Conformational Signatures To Enhance Structure
Based Drug Design of a Mcl-1 Inhibitor (AZD5991) and Other Synthetic Macrocycles, Journal of medicinal chemistry, 62, 315
9418-9437, doi:10.1021/acs.jmedchem.9b00716, 2019.
Blundell, C. D., Nowak, T., and Watson, M. J.: Measurement, Interpretation and Use of Free Ligand Solution Conformations
in Drug Discovery, Progr. Med. Chem., 55, 45-147, https://doi.org/10.1016/bs.pmch.2015.10.003, 2016.
320
Blundell, C., Packer, M., and Almond, A.: Quantification of free ligand conformational preferences by NMR and their
relationship to the bioactive conformation, Bioorganic & medicinal chemistry, 21, 4976-4987,
doi:10.1016/j.bmc.2013.06.056, 2013.
Bovey, F. A.: Nuclear Magnetic Resonance Spectroscopy, Second Edition, Academic Press, Inc., San Diego, California, pp. 325
291-299, https://doi.org/10.1016/B978-0-08-091699-6.50010-6, 1988.
Chiarparin, E., Packer, M. J., and Wilson, D. M.: Experimental free ligand conformations: a missing link in structure-based
drug discovery, Future Med. Chem., 11, 79-82, https://doi.org/10.4155/fmc-2018-0339, 2019.
330
Cicero, D., Barbato, G., and Bazzo, R.: NMR Analysis of Molecular Flexibility in Solution: A New Method for the Study of
Complex Distributions of Rapidly Exchanging Conformations. Application to a 13-Residue Peptide with an 8-Residue Loop,
J. Am. Chem. Soc., 117, 1027-1033, https://doi.org/10.1021/ja00108a019, 1995.
de Sena M Pinheiro, P., Rodrigues, D. A., do Couto Maia, R., Thota, S., and Fraga, C.: The Use of Conformational 335
Restriction in Medicinal Chemistry, Curr. Top. Med. Chem., 19, 1712-1733,
https://doi.org/10.2174/1568026619666190712205025, 2019.
Fang, Z., Song, Y., Zhan, P., Zhang, Q., and Liu, X.: Conformational restriction: an effective tactic in 'follow-on'-based drug
discovery, Future Med. Chem., 6, 885-901, https://doi.org/10.4155/fmc.14.50, 2014. 340
https://doi.org/10.5194/mr-2021-27
DiscussionsOpe
n Acc
ess
Preprint. Discussion started: 12 March 2021c© Author(s) 2021. CC BY 4.0 License.

14
Farès, C., Lingnau, J. B., Wirtz, C., and Sternberg, U., Conformational Investigations in Flexible Molecules Using
Orientational NMR Constraints in Combination with 3J-Couplings and NOE Distances. Molecules, 24, 4417-4441.
https://doi.org/10.3390/molecules24234417, 2019.
345
Foloppe, N. and Chen, I.-J.: Towards understanding the unbound state of drug compounds: Implications for the
intramolecular reorganization energy upon binding, Bioorgan. Med. Chem., 24, 2159-2189,
https://doi.org/10.1016/j.bmc.2016.03.022, 2016.
Gaussian 16, Revision C.01, Frisch, M. J., Trucks, G. W., Schlegel, H. B., Scuseria, G. E., Robb, M. A., Cheeseman, J. R., 350
Scalmani, G., Barone, V., Petersson, G. A., Nakatsuji, H., Li, X., Caricato, M., Marenich, A. V., Bloino, J., Janesko, B. G.,
Gomperts, R., Mennucci, B., Hratchian, H. P., Ortiz, J. V., Izmaylov, A. F., Sonnenberg, J. L., Williams-Young, D., Ding,
F., Lipparini, F., Egidi, F., Goings, J., Peng, B., Petrone, A., Henderson, T., Ranasinghe, D., Zakrzewski, V. G., Gao, J.,
Rega, N., Zheng, G., Liang, W., Hada, M., Ehara, M., Toyota, K., Fukuda, R., Hasegawa, J., Ishida, M., Nakajima, T.,
Honda, Y., Kitao, O., Nakai, H., Vreven, T., Throssell, K., Montgomery, J. A., Jr., Peralta, J. E., Ogliaro, F., Bearpark, M. J., 355
Heyd, J. J., Brothers, E. N., Kudin, K. N., Staroverov, V. N., Keith, T. A., Kobayashi, R., Normand, J., Raghavachari, K.,
Rendell, A. P., Burant, J. C., Iyengar, S. S., Tomasi, J., Cossi, M., Millam, J. M., Klene, M., Adamo, C., Cammi, R.,
Ochterski, J. W., Martin, R. L., Morokuma, K., Farkas, O., Foresman, J. B., Fox, D. J. Gaussian, Inc., Wallingford CT, 2016
Hu, H. and Krishnamurthy, K.: Revisiting the initial rate approximation in kinetic NOE measurements, J. Magn. Reson., 360
182, 173-177, https://doi.org/10.1016/j.jmr.2006.06.009, 2006.
Huang, X., Hagen, M., Kim, B., Friesner, R. A., Zhou, R., and Berne, B. J.: Replica exchange with solute tempering:
efficiency in large scale systems, J. Phys. Chem. B, 111, 5405-5410, https://doi.org/10.1021/jp068826w, 2007.
365
LaPlante, S. R., Edwards, P. J., Fader, L., Jakalian, A., and Hucke, O.: Revealing atropisomer axial chirality in drug
discovery, ChemMedChem, 6, 505-513 https://doi.org/10.1002/cmdc.201000485, 2011a.
LaPlante, S. R., Fader, L. D., Fandrick, K. R., Fandrick, D. R., Hucke, O., Kemper, R., Miller, S. P. F., and Edwards, P. J.:
Assessing atropisomer axial chirality in drug discovery and development, J. Med. Chem., 54, 7005-7022, 370
https://doi.org/10.1021/jm200584g, 2011b.
LaPlante, S. R., Nar, H., Lemke, C. T., Jakalian, A., Aubry, N., and Kawai, S. H.: Ligand bioactive conformation plays a
critical role in the design of drugs that target the hepatitis C virus NS3 protease, J. Med. Chem., 57, 1777-1789,
https://doi.org/10.1021/jm401338c, 2014. 375
https://doi.org/10.5194/mr-2021-27
DiscussionsOpe
n Acc
ess
Preprint. Discussion started: 12 March 2021c© Author(s) 2021. CC BY 4.0 License.

15
Li, F., Zhang, H., Jiang, L., Zhang, W., Nie, J., Feng, Y., Yang, M., and Liu, M.: Dynamic NMR study and theoretical
calculations on the conformational exchange of valsartan and related compounds, Magn. Reson. Chem., 45, 929-936,
https://doi.org/10.1002/mrc.2072, 2007.
380
Liu, P., Kim, B., Friesner, R A.., and Berne, B. J.: Replica exchange with solute tempering: a method for sampling biological
systems in explicit water, P. Natl. Acad. Sci. USA, 102, 13749-13754, https://doi.org/10.1073/pnas.0506346102, 2005.
Molecular Operating Environment (MOE), 2019.01, Chemical Computing Group ULC, 1010 Sherbooke St. West, Suite
#910, Montreal, QC, Canada, H3A 2R7, 2021. 385
Nevins, N., Cicero, D., and Snyder, J. P.: A Test of the Single-Conformation Hypothesis in the Analysis of NMR Data for
Small Polar Molecules: A Force Field Comparison, J. Org. Chem., 64, 3979-3986, https://doi.org/10.1021/jo9824450, 1999.
Schrödinger Release 2020-3: Desmond Molecular Dynamics System, D. E. Shaw Research, New York, NY, 2020. Maestro-390
Desmond Interoperability Tools, Schrödinger, New York, NY, https://www.schrodinger.com/products/desmond, 2020a.
Schrödinger Release 2020-3: Maestro, Schrödinger, LLC, New York, NY, https://www.schrodinger.com/products/maestro,
2020b.
395
Scott, J. S., Bailey, A., Davies, R. D., Degorce, S. L., MacFaul, P. A., Gingell, H., Moss, T., Norman, R. A., Pink, J. H.,
Rabow, A. A., Roberts, B., and Smith, P. D.: Tetrahydroisoquinoline Phenols: Selective Estrogen Receptor Downregulator
Antagonists with Oral Bioavailability in Rat, ACS Med. Chem. Lett., 7, 94-99,
https://doi.org/10.1021/acsmedchemlett.5b00413, 2016.
400
Scott, J. S., Bailey, A., Buttar, D., Carbajo, R. J., Curwen, J., Davey, P. R. J., Davies, R. D. M., Degorce, S. L., Donald, C.,
Gangl, E., Greenwood, R., Groombridge, S. D., Johnson, T., Lamont, S., Lawson, M., Lister, A., Morrow, C. J., Moss, T. A.,
Pink, J. H., and Polanski, R.: Tricyclic Indazoles-A Novel Class of Selective Estrogen Receptor Degrader Antagonists, J.
Med. Chem., 62, 1593-1608, https://doi.org/10.1021/acs.jmedchem.8b01837, 2019.
405
Scott, J. S., Moss, T. A., Balazs, A, Barlaam, B, Breed, J, Carbajo, R. J., Chiarparin, E., Davey, P. R. J., Delpuech, O.,
Fawell, S., Fisher, D. I., Gagrica, S., Gangl, E. T., Grebe, T., Greenwood, R. D,. Hande, S., Hatoum-Mokdad, H., Herlihy,
K., Hughes, S., Hunt, T. A., Huynh, H., Janbon, S. L. M., Johnson, T., Kavanagh, S., Klinowska, T., Lawson, M., Lister, A.
S., Marden, S., McGinnity, D. F,. Morrow, C. J., Nissink J. W. M., O'Donovan, D. H., Peng, B., Polanski, R., Stead, D. S.,
https://doi.org/10.5194/mr-2021-27
DiscussionsOpe
n Acc
ess
Preprint. Discussion started: 12 March 2021c© Author(s) 2021. CC BY 4.0 License.

16
Stokes, S, Thakur, K., Throner, S.R., Tucker, M. J., Varnes, J., Wang, H., Wilson, D. M., Wu, D., Wu, Y., Yang, B., and 410
Yang, W.: Discovery of AZD9833, a Potent and Orally Bioavailable Selective Estrogen Receptor Degrader and Antagonist,
63, 14530-14559, J. Med. Chem., https://doi.org/10.1021/acs.jmedchem.0c01163, 2020.
Slabber, C. A., Grimmer, C. D., and Robinson, R. S.: Solution Conformations of Curcumin in DMSO, J. Nat. Prod., 79,
2726-2730, https://doi.org/10.1021/acs.jnatprod.6b00726, 2016. 415
Wang, L., Friesner, R. A., and Berne, B. J.: Replica exchange with solute scaling: a more efficient version of replica
exchange with solute tempering (REST2), J. Phys. Chem. B, 115, 9431-9438, https://doi.org/10.1021/jp204407d, 2011.
Wipf, P., Skoda, E. M., and Mann, A.: Conformational Restriction and Steric Hindrance in Medicinal Chemistry, in: The 420
Practice of Medicinal Chemistry, Fourth edition, edited by: Wermuth, C. G., Aldous, D., Raboisson, P., and Rognan, D.,
Academic Press, San Diego, 279 - 299, https://doi.org/10.1016/B978-0-12-417205-0.00011-0, 2015.
Wu, J., Lorenzo, P., Zhong, S., Ali, M., Butts, C. P., Myers, E. L., and Aggarwal, V. K.: Synergy of synthesis, computation
and NMR reveals correct baulamycin structures, Nature, 547, https://doi.org/10.1038/nature23265, 2017. 425
Zondlo, N. J.: SAR by 1D NMR, J. Med. Chem., 62, 9415-9417, https://doi.org/10.1021/acs.jmedchem.9b01688, 2019.
https://doi.org/10.5194/mr-2021-27
DiscussionsOpe
n Acc
ess
Preprint. Discussion started: 12 March 2021c© Author(s) 2021. CC BY 4.0 License.