Pore-Scale Simulation of NMR Response in Porous Media Olumide Talabi

NMR detection of liquid dynamics in porous
matrices
Payam Pourmand
Master of Science Thesis Department of Applied Physical Chemistry
Royal institute of Technology (KTH)
Stockholm, Sweden
Supervisor: Prof. István Furó
August 10, 2012

i
Abstract
Porous materials or a porous media can be encountered in our everyday life, both in industrial and
household systems and in the nature. Generally speaking all solid and semisolid materials are porous
to some degree e.g. different dense rock types, plastics etc. Porous materials are constantly finding
more and more applications, both in industry and research. Many commercially important process in
the industry utilize porous media e.g. flow of fluids through porous media for separation process and
porous catalyst supports. This has strongly contributed to the development of porous media with
controlled properties, which can be utilized for understanding the behavior of liquids confined in the
material, and the morphology of these synthetic materials.
This thesis work brings some insight and understanding of porous materials i.e. Controlled Pore Glass
(CPG). Report also contains a brief explanation of Nuclear Magnetic Resonance (NMR) spectroscopy,
diffusion NMR and other techniques such as Mercury porosimetry.
The first part of the thesis is focused on determining the required amount of liquid i.e. octanol needed
to achieve full pore saturation for different CPGs with varying pore sizes. This was achieved by taking
into account that the transverse relaxation time T2 is sensitive in the ms-ns of motional correlation
times, and that there are physical factors in porous material which affect the T2. Second part, diffusion
NMR is used to study self-diffusion of octanol confined in CPG, thus bringing some insight on mass
transfer limitations within porous systems. The report present results obtained from experiments with
NMR and Diffusion NMR, discusses the issues that can arise when investigating porous materials and
suggest solutions.
Key words Porous material, Controlled Pore Glass, NMR, Diffusion NMR

Contents Abstract .................................................................................................................................................... i
Key words ............................................................................................................................................ i
1. Introduction ..................................................................................................................................... 1
2. Background ..................................................................................................................................... 2
2.1 Porous systems .............................................................................................................................. 2
2.2 The principles of NMR .................................................................................................................. 5
2.3 Diffusion ...................................................................................................................................... 10
3. Experimental ................................................................................................................................. 13
3.1 General ........................................................................................................................................ 13
3.2 Test experiments .......................................................................................................................... 16
4. Results and Discussion .................................................................................................................. 18
5. Conclusions ................................................................................................................................... 23
6. Acknowledgments ......................................................................................................................... 24
7. Appendix ....................................................................................................................................... 25
7.1 List of symbols & abbreviations.................................................................................................. 25
7.2 List of figures .............................................................................................................................. 26
8. Bibliography .................................................................................................................................. 27

1
1. Introduction Nuclear magnetic resonance spectroscopy (NMR) is a very powerful and versatile spectroscopic
technique which can be utilized in several areas e.g. investigating the structure and dynamics of
molecules. Since the first observation in 1938 by Isidor Rabi (Rabi, et al., 1938), NMR has
experienced advancements parallel to other technological developments in the last century, thus this
has favored its adaptations and expansion to many application areas.
Developments in resolution, sensitivity and methodology has made it possible to use NMR for
studying systems of high structural and dynamic complexity e.g. synthetic polymers or biological
molecules. The introduction of magnetic field gradients has expanded the areas of applications for
NMR, from a spectroscopic to a diagnostic imaging tool or to a combination of those two modalities.
Nonetheless, two major areas of applications dominate the use of NMR. The first is high-resolution
spectroscopy and interpretation of chemical structures present in solutions. The second area is referred
to Magnetic resonance imaging (MRI) which is utilized in the field of medicine for in-vivo diagnostics.
Furthermore NMR techniques cover a comprehensive series of length and time scales (i.e. spin
relaxation times) on dynamic properties present in complex systems e.g. liquids confined into porous
media. Previous observations made by Veith, et al (2004, pages 216-228) describe that NMR
properties of fluids in the vicinity of solids can be quite different from those in the bulk. Hence, those
features are relevant to the general behavior of pore fluids and fluid distribution can therefore provide
information about the porous material under investigation.
The main goal of this project has been to develop and increase our knowledge of using NMR for
understanding porous systems. In this thesis all experiments have been performed on Controlled pore
glass (CPG), due to the well-defined structure of the material. The matrix system has roughly circular
pore cross sections. (Vargas-Florencia, 2006), and their morphology is a network of interconnected
tubular pores. By taking into account that the transverse relaxation time is sensitive in the ms-ns of
motional correlation times i.e. the transverse relaxation times (T2) time becomes shorter if the
molecular motions are slower. Since there are physical factors in porous material which affect the T2,
interactions with the wall or geometric confinements make molecular motions slower and
consequently T2 shorter. This know-how makes it possible to determine the required amount of liquid
(in this case octanol) needed to achieve full pore saturation for different CPGs with varying pore sizes.
Diffusion NMR allows the study of self-diffusion for different compounds with high degree of
accuracy, and can therefore be a suitable tool for understanding mass transfer limitations within
porous systems. Consequently Diffusion NMR can works as a complement in deriving more accurate
models of porous systems together with methods such as mercury porosimetry.

2
2. Background
2.1 Porous systems
Porous materials or a porous media can be encountered in our everyday life, both in industrial and
household systems and in the nature. Generally speaking all solid and semisolid materials are porous
to some degree e.g. different dense rock types, plastics etc. A porous media is a material which
contains voids free of solids. The pores are embedded in the solid structure of the material which is
called matrix, see Figure 2.1.
Porous materials are permeated by interconnected or non-interconnected pores of diverse types, for
instance; channels, cavities and interstices. These materials can be divided in to numerous classes,
according to the International Union of Pure Applied Chemistry (IUPAC) , (Sing, et al., 1985); The
classification is in part based on their pore diameter (D), microporous (D<2nm), mesoporous (D=2-
50nm) or macroporous (D<50nm).
Pores can occur in several different ways, some can arise as isolated, although the majority of porous
media consist of interconnected three-dimensional network of channels of non-uniform sizes and
shapes (Hussami, 2010), see Figure 2.1. Depending on the pore permeability and application, cavities
and pores can contain gases or fluids. Consequently the internal structural architecture of the voids in
porous materials influences both the physical and chemical properties of the material, e.g. chemical
reactivity, thermal conductivity and kinetics of transport processes (Barrie, 2000).
Figure 2.1– An Illustration of possible networks and shapes present in
porous material. Accessibility: a: closed pores, b,c,d,e,f: open pores, f:
blind pores (dead-end or saccate) e: through pores Shape:c: Cylindrical
open f: Cylindrical blind b: ink-bottle-shaped d: funnel shaped g:
roughness. (University of Oslo, 2012)

3
There are a number of structural parameters for porous materials e.g. porosity, permeability, pore size,
pore size distribution (PSD), specific surface area etc. These macroscopic parameters signify a general
behavior of a sample which contains many pores. Porosity is defined as the portion of the bulk
volume that is occupied by pores or voids of empty space. Specific surface is another well-defined
average quantity, which describes the interstitial surface area of the pores (empty spaces) per unit mass,
S, or per unit bulk volume ,Sv, of the porous material. Another common parameter is permeability,
which is employed to signify the conductivity of the porous medium with respect to permeation by a
Newtonian fluid (Vargas-Florencia, 2006).
The determination of macroscopic parameters is rather straight-forward and direct, while the
microscopic ones are more difficult to describe because of the tremendous irregularities in the pore
geometry. Due to these dissimilarities of the capillary shapes and regardless of the concepts of pore
diameter or pore size that may be an instinctive simplification of reality, these terms are useful to
describe and too correlate various phenomena in porous media. Pore size is commonly used in
combination with experimentally determined pore size distribution (PSD), this last term is defined as
the density distribution of pore volume by some length scale assigned to it. Examples of techniques for
measuring PSD are NMR Cryoporometry, DSC (Differential Scanning Calorimetry), mercury
intrusion & nitrogen adsorption.
The characterization of porous materials has been of great practical interest in numerous areas
including catalysis, adsorption, purification & separation (Guliants, et al., 2012). Essential physical
aspects for these applications are; pore accessibility, narrow pore size distribution (PSD), relatively
high specific surface area and easily tunable pore sizes (Hussami, 2010).The development of porous
media with controlled properties has made it possible to investigate the performance of confined
liquids and the morphology of the man-made porous materials, thus increasing our knowledge about
porous media and therefore helping in the process of developing new materials e.g. permeable
composite monolith (PCM), (Khassin, et al., 2003). Controlled porous materials are also used as
models to explain more complex porous structures which are found in the nature, such as soils and
different rock types. Some examples of porous materials are given in Table 2.1, together with their
approximate pore shapes and sizes.
Table 2.1: Physical properties of common porous
materials.
Source: (Vargas-Florencia, 2006)

4
All experiments were performed with Controlled Pore Glass (CPG), see Figure 2.2. In CPG the porous
matrix system has pore cross sections of roughly circular geometry (Vargas-Florencia, 2006). Their
morphology is a network of interconnected tubular pores. The material is very useful in the sense that
it is available in numerous pore diameters, the PSD is rather narrow compared to other porous
materials e.g. silica gels, which simplifies the interpretation of the experimental data. The surface of
CPG can also be modified through derivatizations e.g. CPG with initially hydrophilic surface can be
derivatized to hydrophobic. CPG has widely been used for studies of liquids confined in porous
systems and are extensively characterized by diverse techniques e.g. NMR and SANS (Vyalikh, et al.,
2005). Various applications exist for Controlled pore glass, mainly due to the high mechanical,
thermal and chemical stability of the material.
Figure 2.2- Scanning electron micrograph of a
CPG. Source: (Millipore Corp., 2012)

5
2.2 The principles of NMR
2.2.1 General principles
Nuclear magnetic resonance spectroscopy (NMR) is a very powerful and sensitive technique which
can be utilized in several areas e.g. molecular structure determination and investigation of molecular
dynamics. The high selectivity of NMR allows quantitative and qualitative measurements on a
molecular basis (Keeler, 2006). Nuclear magnetic resonance in molecular beams was initially
described and measured by Isidor Rabi in 1938 (Rabi, et al., 1938). In the following years extensive
research was made in the area of NMR and Felix Bloch and Edward Mills Purcell were able to expand
the technique for use in liquids and solids (Purcell, et al., 1946), they were both awarded the Nobel
Prize in physics 1946. Bloch et al and Purcell et al approached the problem differently, Purcell et al.
measured the magnetic resonance absorption of protons in solid paraffin (Purcell, et al., 1946), while
Bloch et al investigated the nuclear induction from an aqueous water sample (Bloch, et al., 1946).
Despite the diverging approaches both teams used techniques based on sweeping slowly radio
frequencies (r.f field) or a magnetic field. Hence, Purcell et al. and Bloch et al were using a method
which today is known as a continuous wave (cw) NMR.
In 1950 the American physicist Erwin Hahn introduced a different methodology. Instead of applying a
continuous rf-excitation, Hahn used short pulses at discreet frequencies and measured the precession
of the induced magnetic moment after the pulses had been turned off, which is known as pulsed NMR.
In 1966 Ernst and Anderson were able to enhance NMR spectra, through Fourier transformation of the
Free induction decay, FID, (Ernst & Anderson, 1966). The Fourier transform made it possible for the
pulse NMR to provide the spectra faster and more efficiently. Today various pulse methods and
Fourier transformation of the resulting FID is the standard procedure when using NMR.
2.2.2 Nuclear magnetic resonance spectroscopy
In NMR spectroscopy a nuclear property, the nuclear spin is used for getting information about the
system under investigation (Hore, 1995). In 1924 Pauli suggested the existence of nuclear-spins,
which are quantized and can have the following magnitudes:
(1)
If a nucleus is present in a magnetic field it can adopt (2I+1) orientations, the different orientations
indexed by the so-called magnetic quantum number, m. Protons and neutrons with I=1/2 posses two
spin states, which are in a magnetic field separated from each other by an energy difference ∆E. The
nuclei can jump between the two states by absorbing or emitting electromagnetic energy at a
frequency that satisfies the resonance conditions
(2)
where h is the Planck constant. The nuclear spin manifests itself also as a magnetic moment that is
proportional to the gyro magnetic ratio, γ, of a nucleus and the nuclear -spin I
µ=γ I (3)
The magnitude of spin angular momentum is
√ (4)
In the absence of a magnetic field, spin alignments are randomly scattered, this is because their energy
is the same for all directions. The energy of a magnetic moment in an external magnetic field is
defined as

6
E= -µ*B (5)
When a strong magnetic field is present the quantization will lie in the same direction as the direction
of the magnetic field. If one assumes that the magnetic field is present in z-direction, equation (5) can
be rearranged to
E= -µz*B (6)
Inserting µz= γIz and Iz= mħ provides
E= -mħγB (7)
Since only transitions between neighboring energy levels are allowed, according to Δm=±1
ΔE= ħγB (8)
If equation (8) is inserted in (2), where ħ=h/2π, one obtains
=γ
(9)
The quantity defined in equation (9) is called the Larmor frequency.
v is proportional to the size of the nuclear magnetic moment and strength of the magnetic field. In a
magnetic field, the surrounding of a nucleus affects the local magnetic field. Hence, the resonance
frequency is not the same for all nuclei, since the electron density nearby the nucleus is different for
different species. This dissimilarity in frequency is called the chemical shift. Because of the chemical
shift, the frequencies of two atoms are not the same, despite being within the same compound.
Therefore NMR enables identification of chemical structures and compounds.
In a static magnetic field (B0) the energy of m = +1/2 states are lower than their counterpart m = -1/2
state, assuming positive gyromagnetic ratio. Because of the energy difference between the two states, a
slight difference between the populations of nuclei in those two states will occur. Since the energy
difference is small there will be a slight surplus of that orientation that has lower energy. With each
spin contributing to the total magnetization by ±mħγ and with population difference Δn, the sample
has net nuclear magnetization along the positive direction of the z-axis.
=
2ħγΔn (10)
For sample in equilibrium, the phases of the magnetic moments are randomly distributed in the xy-
plane. Since the distribution is random, they cancel each other, which results in a zero equilibrium
magnetization vector in the xy plane.
The total magnetization can be denoted by a vector M. While in equilibrium the magnetization is
constant, and is difficult to detect. On the other hand, one can apply a small radio frequency field B1
with frequency ωrf, which can rotate M away from the z-axis with the angular frequency ω1= γB1. If
this is done so that M finishes up in the xy-plane, M will then precesses around B0 with the frequency
ω0.
ω0 =γ 0 (11)
There is another way of observing the system, by seeing the system through the rotating frame, which
means that the observer is also rotating with the radio frequency. Hence, everything which rotates with
ωrf, is static. As previously mentioned, in the B0 field M would process around B0 according to (11), In
the rotating frame the precession frequency is reduced to
Ω= ω0- ωrf (12)
In the rotating frame its easier to calculate how B1 can rotate M away from its equilibrium value. The
rest of the theory discussion is based on the rotating frame unless stated otherwise.

7
2.2.3 Pulses
As long as the nuclei are in equilibrium, no radiation will be emitted. In order to generate a signal,
radiofrequency pulses are applied to kick the system out from its equilibrium state. Pulses used in
NMR typically consist of short, intense monochromatic radiofrequency radiation. By choosing the
transmitter frequency ωrf close to the resonance frequency ω0, the nuclei will only sense a magnetic
field B1 that is, in the rotating frame , perpendicular to the z-direction. In the rotating frame,
magnetization will then process around B1. Hence, the pulse changes the direction of the
magnetization; if the procession frequency is ω1, and RF field is applied during a time tp, the angle (β)
by which the magnetization has been rotated is
β=ωt or β=γ 1tp (13)
where β is called the flip angle of the pulse; the most common pulses are the 9 ° (π/2) and the 8 ° (π)
pulses which turn the magnetization by the angle indicated by the name. A 180° pulse inverts
magnetization opposite to its equilibrium state. Following the 180° pulse the magnetization will return
to its equilibrium position by a process called longitudinal relaxation.
In modern spectrometers, the detection of the NMR signal is based on detecting the voltage generated
over the receiver coil, in which the magnetization precesses; the time-dependent signal is called Free
induction decay (FID). With the help of Fourier transformation, this is transformed into a frequency
spectrum, where the offset of the resonance frequency relative to ωf and the amplitude of each
frequency component in the FID can be easily revealed.
2.2.4 Relaxation
Spin relaxation is the process by which the bulk magnetization returns to its equilibrium position. As
previously mentioned a 90° pulse turns the magnetization to the xy-plane. Despite this (recall the
original Boltzmann distribution), all spins are not pointing in the direction of the y-axis, the spins are
instead almost evenly distributed in the xy plane. A small majority of the spins possess a positive y-
component of magnetization, while a smaller portion the negative y-component, and this correlation of
phases is called coherence. After the applied 90° pulse, the evolution of M can be divided into two
separate processes, magnetization will in part strive to return to the positive z-axis and at the same
time M is also processing around the z axis in the xy plane. With time the coherence will decrease
since the spins process with different frequencies, and this causes M to decrease in magnitude and
finally to reach zero in the xy plane. Therefore two different types of relaxations exist, the longitudinal
relaxation along the z axis and the transverse relaxation in the xy plane (Harris, 1986). Often, both
relaxations processes are exponential, and are described by the parameters T1 and T2, where T1 refers
to the longitudinal (or spin-lattice) relaxation and T2 to the transverse (or spin-spin relaxation)
relaxation time. The inverse of the relaxation times are the relaxation rates:
(14)
where x is either 1 or 2.

8
2.2.5 Measuring T1
T1 is a measure of how fast Mz reaches the equilibrium position M0 (Grant & Harris, 1996).For a
nuclear spin system which has been displaced from its equilibrium, the evolution can be described by
the following differential equation:
=- - (15)
dMz/dt is the rate of change of Mz, and M0-Mz is the displacement from equilibrium, where M0 is the
equilibrium position and Mz the present magnetization. The indefinite integral yields
where R1=1/T1
(
⁄ ) (16)
From equation (16) one can realize that Mz M0, when t∞.
T1 can be measured by applying a 180° pulse followed by a 90° pulse which is repeated several times
over. This is called the inversion recovery experiment. The pulse sequence is illustrated in Figure 2.3,
The 180° pulse inverts the magnetization. During the delay time τ, the magnetization in part returns to
its initial state. After the delay time, a 90° pulse is applied which turns the magnetization from the z-
axis to the y axis, hence making it possible to detect the signal. This procedure is repeated with
different delay times. The spectral intensity is proportional to Mz before the 90° pulse. By analyzing
the τ-dependence of the intensities, an estimate of T1 can be achieved:
(17)
Figure 2.3-The pulse sequence for the inversion
recovery experiment. Source: (Keeler, 2006)
1
0( ) (1 2 )
TM M e

9
2.2.6 Measuring T2
Usually spins process at different frequencies mainly due to two reasons, the effects of the local
electronic environment on one hand and the spatial inhomogeneity of the static magnetic field on the
other hand. The first effect is very advantageous since it provides NMR with chemical selectivity.
While the inhomogeneity of the magnetic field causes line broadening and loss of spectral resolution,
this can be counter-acted by the spin-echo pulse sequence, which cancels the dephasing caused by
inhomogeneity of the static field. The spin-echo experiment consists of a 90°x pulse, delay time (τ),
180°x, delay time (τ), as illustrated by Figure 2.4.
Initially, the 90°x pulse turns the magnetization to the xy-plane (see Figure 2.5, A & B). After the 90°x
pulse the spins process with different speeds in the xy-plane (C) , which will ultimately cause the net
transverse magnetization to go to zero. By applying the 180° the magnetization components are turned
180° around the x-axis to the symmetrical position of the xy-plane (D). After the delay time, τ, the
spins are refocused and generate a spin-echo.
Figure 2.5- The evolution of magnetization components during a spin echo experiment. Source:
(Morley, 2012)
Figure 2.4-Illustration of the spin echo
experiment. Source: (Keeler, 2006)

10
In order to measure T2 , several values for τ are chosen to map the decay of the signal
(18)
For measuring T2 the CPMG method can also be utilized (James, 1998). The CPMG sequence consist
of a spin-echo sequence followed by a series of 180 ° pulses, 90°x-τ-180°y-2τ-180°y-2τ… The first
part of the experiment behaves as explained above. The delay time 2τ after the 8 °y can be split in
two parts, during the first τ period a spin echo is created, and during the second τ period the spins are
dephased. This is repeated many times and every 180°y creates a spin-echo that will appear at half time
between the 180°y pulses.
2.3 Diffusion
Self diffusion is the translational motion of a molecule in a solution, which is central for most
chemical reactions and their kinetics. The diffusion constant, D, expresses the rate of this motion, and
can be acquired by the Stokes-Einstein equation:
(19)
where k is the Boltzmann constant, T the temperature and f the so-called friction coefficient. The
Stokes-Einstein equation relates the diffusion coefficient of a molecule to the friction factor that
depends on the size and the shape of the molecule.
Fick’s second law of diffusion states that change of concentration under a certain time in a solution, is
given by the difference between the influx and efflux from a point located at r (Price, 1998)
2 (20)
where D (in units of m-2
s-1
) is the diffusion coefficient for isotropic diffusion and 2 is the second
derivative operator. In the case of self-diffusion no net concentration gradient is present, thus equation
(19) can be arranged to (Price, 1998):
, ,
2 , , (21)
This results in for , , in as Gaussian probability distribution, for a spin which has started from
r0 and moved to r1 during a time t. The initial condition for equation (20) can be described with the
Dirac delta function.
- (22)
The solution of equations (20) and (21) for isotropic diffusion is
- t (23)

11
The diffusion coefficient provides an estimate of the rate of displacement of a particle in a solution and
many engineers and scientist use NMR for diffusion measurements and diffusion related observations
(Price, 1998). Diffusion measurements in NMR are achieved by using pulsed magnetic field gradients;
by passing a current through a pair of separate coils which generate a separate magnetic field gradient
(Breitmaier, 1973). If assumed that the positive z-axis of the magnetic field is aligned along the height
of the sample, when magnetic field has a linear gradient in the z-direction, two molecules present at
different locations along the z-axis reside at different magnetic field strengths.
2.3.1 Pulsed field gradient spin echo (PGSE)
The simplest pulse sequence used for diffusion measurements is the Stejskal-Tanner sequence or
Pulsed field gradient spin echo (PGSE). PGSE NMR utilizes the fact that diffusion affects the intensity
of the spin echo signal. PGSE is based on a Hahn spin-echo sequence, which incorporates two
rectangular gradient pulses of duration, δ ,and magnitude, g, in each delay time, τ, as also illustrated in
Figure 2.6
Figure 2.6- PGSE Sequence for diffusion measurements, source: (Price, 1998)
The radio frequency pulses applied during PGSE are similar to that in spin-echo (see section 2.2.6).
The 90° radio-frequency pulse will rotate the magnetization of the sample into the x-y plane, and
during the first delay τ the spins are dephased, because of the large static magnetization inhomogeneity
that appears due to the applied magnetic field gradients. The applied gradient pulse will give each spin
a phase shift φ(z). The phase angle every spins acquires depends on the location of that spins. The 180°
pulse reverses the sign of the phase angle acquired during the first delay time τ. Second gradient pulse
has the purpose to cancel the effects of the first gradient pulse, thus refocusing the spins. This
refocusing is perfect for those spins that have not changed their location in the z-direction, while the
spins that are displaced will contribute with less intensity to the echo signal, hence the spin-echo
signal depends on the diffusion coefficient. The resulting signal intensity (E), depends on the applied
gradient, g (T/m), the duration the pulse is applied (δ), evolution time between the gradient pulses, Δ, γ
and the constant R (R=2τ/T2)
(24)
2 2 2( ( ) )
3
( ) ( )2 0
D g R
t tE E e

12
2.3.2 Pulsed-field gradient stimulated Echo (PGSTE)
In most diffusion experiments it is desirable to keep the Δ delay long in order for the molecules to be
able to move a longer distance and thereby exhibit to a stronger signal decay. In the PGSE sequence
the signal can, however, be lost during the echo time 2τ, because of the transverse spin relaxation and
this limits the maximum value of Δ. This limitation can be overcome in PGSTE, where two 90° pulses
which are separated by delay time, τ2, replace the 180° pulse in the PGSE sequence (see Figure 2.7).
By implementing this change, the relaxation of the magnetization is mainly governed by T1, which is
very useful in those cases where, as often, the T1 is larger than T2. The first 90° pulse in the pair turns
the transverse magnetization in the direction along the z-axis,and throughout the delay time, τ2, the
spins thereafter evolve by the longitudinal relaxation. The purpose of the final 90° pulse is to transfer
the magnetization back to the xy-plane, hence signal can be detected. The intensity in the PGSTE is
given by:
(25)
where
2 1
2 1
2R
T T
Figure 2.7-The PGSTE pulse sequence for diffusion measurements.
source: (Valiullin, 2012)
τ1 τ2
τ1
2 2 2( ( ) )
3
( 2 ) ( 0)
1
2
D g R
t tE E e

13
3. Experimental
3.1 General
Porous materials have several important applications such as heterogeneous catalysis, separation and
purification of substances by adsorption (Aksnes, et al., 2004). In general, these materials constitute
of interconnected three-dimensional systems of channels with inhomogeneous size and shape.
Properties of porous media can widely differ as concerning porosity and the dimensions of the pores.
There has been a substantial interest in studying the behavior of fluids in porous materials e.g. silica
gels, glasses and sandstones (Karger & Ruthven, 1992). NMR is a well-established technique which
can be utilized for understanding the phase behavior as well as dynamics of fluids and adsorbents
within pores (Barrie, 2000). The transverse relaxation time, T2 is sensitive to molecular motions in the
ms-ns interval of motional correlation times, and the T2 time becomes shorter if the molecular motions
are lower. In porous materials there are also other physical factors that will affect the T2 i.e.
interactions with the wall or geometric confinements which restrict molecular motions. In addition, the
magnetic susceptibility can be different for the pore-filling material and the pore matrix, and for this
reason the magnetic field can be randomly inhomogeneous throughout the sample. Such susceptibility
differences may give rise to line broadening and short spin–spin relaxation time T2 (Aksnes, et al.,
2004). Hence, in general one obtains, 1/T2=1/T2dyn+1/T2susc, where 1/T2dyn is the transverse relaxation
that would be measured if there was no susceptibility effects present.
The transverse magnetization and its decay are affected by numerous factors, and in order to suppress
some artifacts which can arise in transverse relaxation experiments a suitable pulse sequence is
needed .An appropriate pulse sequence for this project was the Carr-Parcel-Meiboom-Gill (CPMG)
experiment, see section 2.2.6.
CPMG consists of a train of spin echoes created by a train of radiofrequency pulses. Consequently,
one detects the decay of the echo-top intensity for a one-component system, which then directly
provides the transverse relaxation time. As with any methodology, there are disadvantages and
advantages with the chosen approach. In the CPMG method one measures the total decay of a signal
which arises from a single nuclear species e.g. 1H, and therefore the method is not suitable for two-
component systems such as consisting of water and oil. Our CMPG experiments were conducted with
several different pulse spacings, and in all experiments we used the pulse spacing below which gave
no prolongation of the signal decay and no noteworthy artifacts were detected.
Different CPGs with varying pore sizes were investigated in this project, and we illustrate the behavior
(similar for different CPGs) with data obtained in a controlled pore glass with pore size 237 Å. All
transverse relaxation experiments were performed by Bruker Avance 500 NMR spectrometer with a
resonance frequency of 500.13MHz.
14
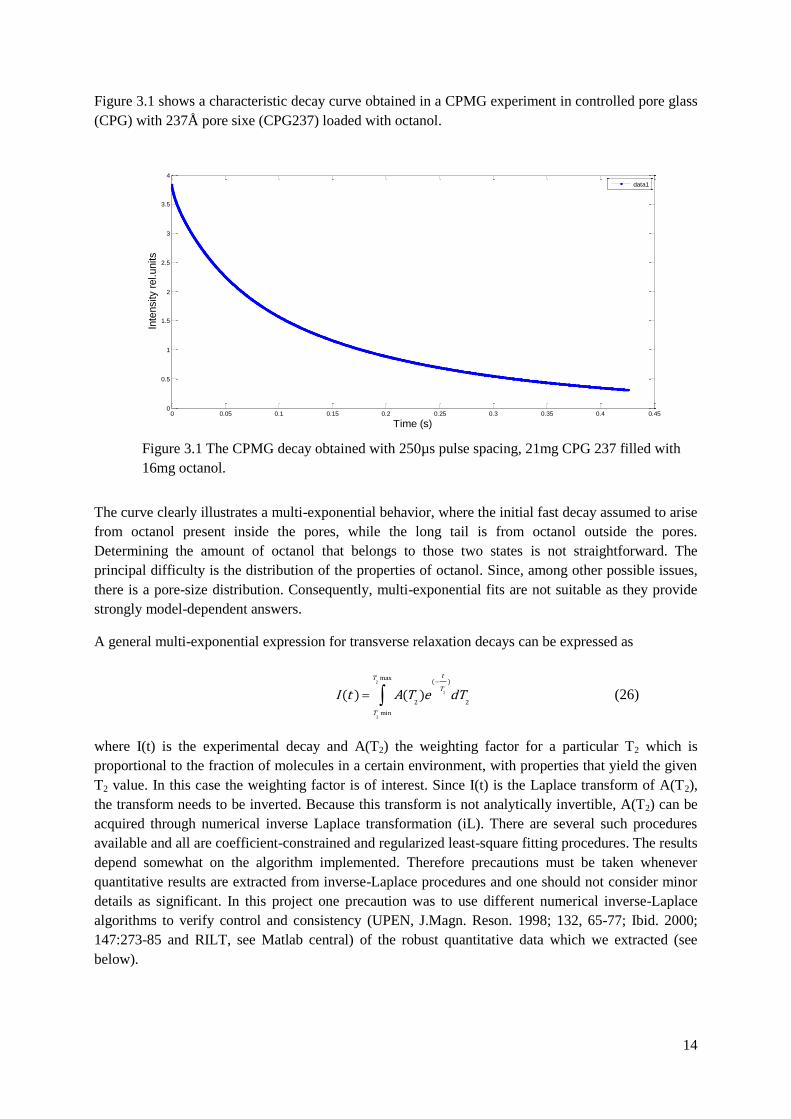
Figure 3.1 shows a characteristic decay curve obtained in a CPMG experiment in controlled pore glass
(CPG) with 237Å pore sixe (CPG237) loaded with octanol.
The curve clearly illustrates a multi-exponential behavior, where the initial fast decay assumed to arise
from octanol present inside the pores, while the long tail is from octanol outside the pores.
Determining the amount of octanol that belongs to those two states is not straightforward. The
principal difficulty is the distribution of the properties of octanol. Since, among other possible issues,
there is a pore-size distribution. Consequently, multi-exponential fits are not suitable as they provide
strongly model-dependent answers.
A general multi-exponential expression for transverse relaxation decays can be expressed as
2
2
2
max( )
2 2
min
( ) ( )
tT
T
T
I t A T e dT
(26)
where I(t) is the experimental decay and A(T2) the weighting factor for a particular T2 which is
proportional to the fraction of molecules in a certain environment, with properties that yield the given
T2 value. In this case the weighting factor is of interest. Since I(t) is the Laplace transform of A(T2),
the transform needs to be inverted. Because this transform is not analytically invertible, A(T2) can be
acquired through numerical inverse Laplace transformation (iL). There are several such procedures
available and all are coefficient-constrained and regularized least-square fitting procedures. The results
depend somewhat on the algorithm implemented. Therefore precautions must be taken whenever
quantitative results are extracted from inverse-Laplace procedures and one should not consider minor
details as significant. In this project one precaution was to use different numerical inverse-Laplace
algorithms to verify control and consistency (UPEN, J.Magn. Reson. 1998; 132, 65-77; Ibid. 2000;
147:273-85 and RILT, see Matlab central) of the robust quantitative data which we extracted (see
below).
Figure 3.1 The CPMG decay obtained with 250µs pulse spacing, 21mg CPG 237 filled with
16mg octanol.
0 0.05 0.1 0.15 0.2 0.25 0.3 0.35 0.4 0.450
0.5
1
1.5
2
2.5
3
3.5
4
Time (s)
Inte
nsity r
el.units
data1

15
To provide a robust analysis, the resulting A(T2) weighting factor was re -expressed as
∫
(27)
where the integral In (T2) is normalized to 100% of the signal. A typical result obtained from iL
transform is illustrated in Figure 3.2.
Figure 3.2- Illustration of the result of the inverse-Laplace transform of the CPMG decay in 21mg
CPG-237, filled with 16mg octanol.
In this project, we assumed that the interim plateau (blue line) separates the in-pore and out-of-pore
octanol components from each other. This can also be realized when observing the red weighting
factor line. Two peaks can be seen, octanol present inside the pores give rise to the first peak (T2<10-1
)
and the second peak is because of the octanol present outside (the valley between the peaks can be
correlated with the interim plateau separating the inpore and out-of-pore, blue line).
10-5
10-4
10-3
10-2
10-1
100
101
0
10
20
30
40
50
60
70
80
90
100
T2 Relaxation time (s)
Rela
tive u
nits (
%)
In (T2)
A(T2)

16
3.2 Test experiments
Measurements were performed in six different controlled pore glasses (CPG, Millipore) with different
pore sizes. CPGs were supplied as 120-150 µm porous grains with nominal pore diameters of 7.5, 11.5,
15.6, 23.7, 50.7 and 72.9nm. The pore diameters were according, to the supplier determined by
mercury porosimetry (Petrov & Furó, 2010). The materials where filled with octanol-1 (Fischer).
Petrov & Furó (2010, pp. 83-91) had in a previous work investigated the specific surface area of the
batches of CPGs used in this project. The specific surface areas was determined by a Flowsorb III
apparatus with the flowing gas technique, which utilizes nitrogen and helium mixture (30% vol.%
nitrogen). The quantity of gas adsorbed is determined through concentration measurements of a
continuous flow at the boiling point of the gas and atmospheric pressure. Thereafter, Brunauer-
Emmet-Teller (BET) equation is employed for determining the amount of a gas in a monomolecular
layer, thus the specific surface area of the sample can be calculated (Nelsen & Eggertsen, 1958). Some
properties of CPGs used for this project are shown in Table 3.1.
Table 3.1- Properties of the investigated CPG. source: (Petrov & Furó, 2010)
In the first part of our study, the objective was to identify the “amount of octanol required to achieve
% pore saturation”. In other words, we sought a method that determines the specific pore volume.
Six CPG samples, with respective mass of ca. 21 mg and different pore sizes, were prepared. Before
saturating the samples with octanol, they were first dried for approximately 24hrs at 100-120°C,
inorder to remove possible water residing inside the CPGs .Thereafter, octanol was added in different
steps; hence, in the first stage 4 mg of octanol was added and CPMG experiments were performed
with different pulse spacing times, in the next stage more octanol was added (8 mg total) and another
CPMG experiment was implemented, and this continued up to typically 40 mg octanol were added.
All CPMG experiments were performed on a Bruker Avance 500 NMR spectrometer with a resonance
frequency of 500.13MHz. The NMR data was processed with the iL-method as previously described
(see section 3.1). Figure 3.3 illustrates how the in-pore and out-of-pore fractions of octanol correlates
with the amount of octanol added. As can be seen, the in-pore plateau decreases as the amount of
octanol increases and out-of-pore fraction increases (i.e. more octanol is outside the pores).

17
Figure 3.3- Comparison of iL transformations, increasing the amount of octanol.
When small volumes of octanol are added to the porous system, the quantity outside the pores is
negligible; there is a threshold point above which the amount outside the pores increases as more
octanol is supplied. The threshold “point” can be interpreted as the point where the voids in the system
are completely saturated. M0 is denoted as the amount inside the pores and M the total amount added.
M0 can be determined by plotting M-M0 against the total amount of octanol added M, and by
extrapolating to the threshold point.
Diffusion experiments where performed on a Bruker Avance 300 NMR spectrometer with a resonance
frequency of 300MHz. Pulsed-field gradient stimulated echo (PGSTE) NMR measurements where
performed with a probe producing field gradients up to 9.7 T/m. In order to suppress the effects of
magnetic field inhomogeneity in the samples, a 24 interval PGSTE pulse sequence with two gradient
pulses of the opposite sign was used. Common values for the gradient pulse duration δ and the delay
time (τ1) between the applied 90° radiofrequency pulses were 2 ms and 1900 ms (T1=640 ms for CPG
237Å).The quantity measured in PGSTE experiments is the incoherent scattering function S(b), in
which b=γ2δ
2g
2td, where b is depends on the magnitude of the field gradient pulses, g, the
gyromagnetic ratio of the concerned nucleus, γ, and the effective diffusion time td. Throughout the
experiments b was scaled by varying the scale of the field gradient strength, g, and keeping δ constant.
The diffusion damping of the normalized stimulated-echo amplitude S(b) for a pure liquid with the
self-diffusion coefficient D0 can be expressed as (Valiullin & Furo, 2002)
= exp(-bD0) (28)
where I(b) is the intensity when magnetic field gradient is applied and I(0) is that without applied
gradient.
10-5
10-4
10-3
10-2
10-1
100
101
-20
0
20
40
60
80
100
T2 Relaxation time (s)
Rela
tive u
nits (
%)
34.5mg
40mg
44mg

18
4. Results and Discussion As previously mentioned (section 3.2, Test experiments) the initial part of the project was focused on
determining the specific pore volume of the different CPGs.
Figure 4.1 shows the result of CPMG experiments which have been processed with inverse-Laplace
transformation performed by UPEN. When 5-10 mg of octanol is added there is no significant amount
of octanol outside the pores. As the amount of added octanol is increased, the relative weight of the
interim plateau decreases, which we assign to more octanol residing outside the pores. The addition of
octanol to the porous grains already filled with octanol did not increase the intensity of the in-pore part
of the iL spectrum (part A), while the out-pore part increased (Part B). Interesting point to note is the
apparent plateau in the 10-2
s range which could arise from hydroxyl protons from some artifacts (see *
in figure). This effect is usually present when no or small amounts of octanol is added. One should
also note that numerical errors and iL “disctretization” are suppressed in the integral representations
above, and have therefore small impact on the interim plateau value.
10-5
10-4
10-3
10-2
10-1
100
101
-20
0
20
40
60
80
100
Rela
tive u
nits (
%)
T2 Relaxation time (s)
5mg
10mg
20mg
27mg
34.5mg
40 mg
44mg
32mg
Part A
Part B
*
Figure 4.1- Results of iL with different amounts of octanol added to
CPG237.

19
As previously mentioned, M0 is denoted as the amount inside the pores and M the total amount added.
M0 can be determined by plotting M-M0 against the total amount of octanol added M which
extrapolates the threshold point, see Figure 4.2.
Figure 4.2- Illustration of how the amount of “outer-pore” octanol (M-M0) increases, when more
octanol is added to the CPG.
In the plot above the experimental data has been fitted to a linear function yielding the parameters
y=0.9318x-12.239. Since the amount of octanol required for filling the voids is of interest, the linear
equation can be rearranged to 0=0.9318x-12.239, which provides for CPG237 x=13,13mg. In Table
4.1 all results obtained in the different investigated CPGs are given
Table 4.1 Specific volumes obtained in different CPGs by the present method and by mercury
porosimetry.
y = 0,9318x - 12,239
0
5
10
15
20
25
30
35
0 10 20 30 40 50
M-M0
M
Label Volume of octanol
(mg)
By NMR (CPMG
decay)
Volume of octanol
(mg)
By mercury
porosimetry
(Millipore)
Specific
volumes (cm3/g)
by NMR
Specific volume
(cm3/g) by
mercury
porosimetry
CPG75 9.61 8.13 0.56 0.47
CPG115 9.18 8.48 0.53 0.49
CPG156 11.55 14.01 0.67 0.81
CPG237 13.13 19.95 0.76 1.15
CPG507 16.42 21.01 0.95 1.21
CPG729 10.42 12.97 0.60 0.75

20
The NMR results in Table 4.1 are based on the methodology previously described. Mercury intrusion-
extrusion and nitrogen adsorption/desorption manometry are among the most widespread commercial
techniques for acquiring quantitative information about porous materials such as pore size, pore size
distribution and total pore volume. In both techniques porosity is determined by deriving surface
tension, capillary force, and pressure data. For nitrogen adsorption it is usually the smallest pores that
will be filled first when increasing the applied pressure. On other hand, in mercury intrusion the
largest pores are filled first as mercury is added to an evacuated cell and forced into pores by external
pressure (Vargas-Florencia, 2006). There are some perquisites when using mercury porosimetry, such
as that the sample should be dry (because the mercury will not displace any liquid residing already in
the pores), that is a disadvantage when measuring hydrophilic samples. The applied high pressure
mercury can also deformed the pores. The principal shortcoming with mercury porosimetry is that it
measures pore access dimensions instead of pore volume dimensions. As previously mentioned NMR
is a non-invasive and non-destructive technique, which enables us to study different fluids and their
properties within porous media. In addition, with NMR there is a small risk for pores to get crushed
(no pressure is applied) and hydrophilic samples can also be measured.
Yet, there are some disadvantages with the procedure used in this study. Since, the used amount of
CPG was rather small (21 mg), the amount of octanol added was also small which lead to a relatively
large volume error of ±1µl, mainly due to the inadequacy of the filling equipment. However, this error
could be accounted and compensated by comparing the octanol spectral integrals in the spectrum of
the different samples. Another obstacle was the numerical inverse Laplace transformation which could
strongly affect the final iL results. The numerical transformation is dependent on the pulse spacing
time, and in UPEN (the software used for iL) data points often are disregarded if the pulse spacing
time is to large. As a result, when choosing pulse spacing time one must consider this.
Diffusion experiments were run in the final stage of the project in those smaples where the amount of
octanol added was exactly the amount that was required to achieve complete pore saturation. The
results are presented in Table 4.2. Since all liquids confined in a porous media behaved differently the
bulk, the interpretation of the measured self-diffusion coefficients can provide information about the
material e.g. pore dimensions and pore permeability.
Label Diffusion coeff ( x 10-11
m2/s)
CPG75 2.47
CPG115 3.15
CPG156 3.33
CPG237 3.81
CPG507 4.04
CPG729 4.16
Pure octanol (bulk) 9.70
Table 4.2 Octanol self-diffusion coefficients obtained in CPGs completely saturated.

21
0 0.2 0.4 0.6 0.8 1 1.2 1.4-2.5
-2
-1.5
-1
-0.5
0
Figure 4.3 shows a one component exponential fit to the decay curve obtained for CPG237. As is
clear also from Figure 4.4 that presents the decay on a logarithmic scale, the diffusional decay is not
perfectly single component as defined.
For a pure liquid with the self-diffusion coefficient D0 can be expressed as equation (29) (Valiullin &
Furo, 2002).
0( )
( )exp( )
(0)S b
I bbD
I (29)
We have at this moment no clear explanation for this behavior. However, since the devaiation from the
single component behavior was rather small, we proceeded with single component fits that provided
the data in Table 4.2, displayed also in Figure 4.5
B s/m2 x 10
-16
Figure 4.4 The diffusional decay data of octanol in CPG237, presented on a logarothmic scale.
Figure 4.3-Single component fit to the diffusional decay of octanol in CPG 237.
Log (I/I0)

22
The CPGs used for this study have a pore system with roughly circular pore cross sections of circular
geometry and a morphology of interconnected tubular pores (Vargas-Florencia, 2006). Besides the
obstruction caused by the pores, other physical factors such as interactions with the walls can also
affect the transport. In Figure 4.5, the diffusion coefficients of CPGs studied (normalized to the bulk
diffusion coefficients of octanol) have been plotted against the pore size. The dashed line in the figure
can be considered as the “morphology line”. Since all CPGs used are assumed to have the same
morphology, but with varying pore size, and since the displacement of molecules in a diffusion
experiment is much larger than the size of the characteristic features in the CPGs this reduction of
diffusion can be considered as the pure effect of pore obstruction. The shape of the curve clearly
indicates that, as the pore diameter decreases, physical factors other than pore obstruction become
significant. The most important effect could be slowing down of diffusion in the first-second
molecular layer adjacent to the pore wall because of the strong interactions of octanol with the pore
wall. At pore sizes 729Å till 273Å this effect has rather small influences, as the diameter octanol is
6.15Å .Hence, the curves at high pore sizes shows a asymptotic behavior. At the other end, the pore
size eventually becomes sufficiently small to completely hinder diffusion of octanol molecules.
0,00E+00
5,00E-02
1,00E-01
1,50E-01
2,00E-01
2,50E-01
3,00E-01
3,50E-01
4,00E-01
4,50E-01
0 200 400 600 800
D/D
0
Pore size (Å)
diff1
Figure 4.5- As the pore size becomes smaller this affects the transport properties of octanol through
the internal spaces and channels. Eventually the pore size will become suffienctly small to
completely hinder the diffusion process of the octanol molecules.

23
5. Conclusions NMR is a technique which has tremendous areas of applications, and more to be found. This thesis
reveals how Nuclear Magnetic Resonance could be an optional tool for development and research of
porous materials. The technique also introduces ways of investigating the diffusion properties of
liquids confined within porous matter.
NMR is a suitable tool for determining the specific volume of a porous material e.g. CPG. Compared
to commercially available techniques for acquiring quantitative information about porous materials,
NMR is non-invasive and non-destructive .Yet, there are some disadvantages with the procedure used
in this study. Since, the used amount of CPG was rather small (21 mg), the amount of octanol added
was also small which lead to a relatively large volume error of ±1µl, mainly due to the inadequacy of
the filling equipment. Therefore, for future investigations and studies it is recommended to use larger
amounts of material, to reduce the volume error. Table 4.1 provides a comparison of NMR and
mercury porosimetry, results obtained clearly indicate that the two data sets (NMR & mercury
porosimetry) are in rough agreement. The dissimilarity between the two columns can be in part
attributed to the small amount of CPG used, which relates to the volume errors previously mentioned.
Results obtained from diffusion experiments clearly show that, as the pore diameter decreases,
physical factors other than pore obstruction become significant. The most important effect could be
slowing down of diffusion in the first-second molecular layer adjacent to the pore wall because of the
strong interactions of octanol with the pore wall. This behavior was expected based on our hypothesis,
and the diffusion data acquired with NMR therefore confirm this theory of physical hindrance. At
pore sizes 729Å till 273Å these effect have rather small influences on the diffusion of octanol, as its
molecular diameter is 6.15Å. Hence, on the other hand, the pore size eventually becomes sufficiently
small to completely hinder the diffusion of octanol molecules.

24
6. Acknowledgments First of all I would like to thank my friend & supervisor Prof. István Furó for giving me the
opportunity to do my diploma work at the institution of applied physical chemistry, and for his inputs
and outputs throughout the project. I would also like to thank Ass. Prof. Sergey Dvinskikh for his help
with practical and theoretical problems.
спасибо Pavel Yushmanov! Without your help this project wouldn't be successful , thank you for all
the hours you spent teaching me NMR and technical aspects of the project. I would also like to thank
my “office neighbor” Dr. Camilla Terenzi, for all the hints & suggestions which have strongly helped
my work. Finally I would like to thank everybody else at Physical chemistry, KTH.
I am very grateful to my parents Aghdas & Hedayat, for all your efforts and sacrificing yourselves
over and over for your children. You left your country, your home, your family & friends just so we
could have a better future. There are no ways that I can pay you back, but with these words I want to
express my appreciation! My brother and closest friend Pejhman, thank you very much for always
being there for me, this Thesis is dedicated to you!
My girlfriend Mahsa , thank you for all love, laughs and understanding!

25
7. Appendix
7.1 List of symbols & abbreviations
Abbreviation Description Definition
S Specific surface area (per unit
mass)
5
Sv Specific surface area (Bulk
volume)
5
v NMR resonance frequency 9
B0 NMR magnetic field 9
ΔE Energy difference between
parallel & anti-parallel spin
8
h Planck constant 8
D Diffusion coefficient 13
T Temperature 13
k Boltzmann constant 13
γ Gyro magnetic ratio 14
g Magnetic gradient field strength 14
δ Magnetic gradient field pulse
length
14
Δ Free diffusion time 14
PGSE Pulsed field gradient spin echo 14
PGSTE Pulsed field gradient stimulated
echo
15
CPG Controlled pore glass 7
m Magnetic quantum number 8
Δn Population difference 9
f Friction coefficient 13

26
7.2 List of figures Figure 2.1 – An Illustration of possible networks and shapes present in porous material. Accessibility: a: closed
pores, b,c,d,e,f: open pores, f: blind pores (dead-end or saccate) e: through pores Shape:c: Cylindrical open f:
Cylindrical blind b: ink-bottle-shaped d: funnel shaped g: roughness. (University of Oslo, 2012) ............................. 2
Figure 2.2- Scanning electron micrograph of a CPG. Source: (Millipore Corp., 2012) ............................................. 4
Figure 2.3-The pulse sequence for the inversion recovery experiment. Source: (Keeler, 2006) .................................. 8
Figure 2.4-Illustration of the spin echo experiment. Source: (Keeler, 2006) ............................................................... 9
Figure 2.5- The evolution of magnetization components during a spin echo experiment. Source: (Morley, 2012)...... 9
Figure 2.6- PGSE Sequence for diffusion measurements, source: (Price, 1998) ....................................................... 11
Figure 2.7-The PGSTE pulse sequence for diffusion measurements. source: (Valiullin, 2012) ................................. 12
Figure 3.1 The CPMG decay obtained with 250µs pulse spacing, 21mg CPG 237 filled with 16mg octanol. ........... 14 Figure 3.2- Illustration of the result of the inverse-Laplace transform of the CPMG decay in 21mg CPG-237,
filled with 16mg octanol. ............................................................................................................................................. 15
Figure 3.3- Comparison of iL transformations, increasing the amount of octanol. .................................................... 17
Figure 4.1- Results of iL with different amounts of octanol added to CPG237. ......................................................... 18 Figure 4.2- Illustration of how the amount of “outer-pore” octanol (M-M0) increases, when more octanol is
added to the CPG. ....................................................................................................................................................... 19
Figure 4.3-Single component fit to the diffusional decay of octanol in CPG 237. ..................................................... 21
Figure 4.4 The diffusional decay data of octanol in CPG237, presented on a logarothmic scale. ............................. 21 Figure 4.5- As the pore size becomes smaller this affects the transport properties of octanol through the internal
spaces and channels. Eventually the pore size will become suffienctly small to completely hinder the diffusion
process of the octanol molecules. ................................................................................................................................ 22

27
8. Bibliography Aksnes, D., Førland, K. & Kimtys, L., 2004. 1H and 2H NMR studies of cyclohexane nanocrystals in
controlled pore glasses. Journal of Molecular Structure, 708(1-3), pp. 23-31.
Antalek, B., 2002. Concepts in magnetic resonance. Wiley, 14(4), pp. 225-258.
Barrie, P. J., 2000. Characterization of porous media using NMR methods. Annual reports on NMR
spectroscopy, Volym 41, pp. 265-316.
Bernhem, K., 2011. How ionic are ionic liquids, Stockholm: KTH, Royal Inst. of Technology.
Bloch, F., Hansen, W. W. & Packard, M., 1946. Nuclear induction. Phys. Rev, 70(7-8), pp. 474-485.
Breitmaier, E., 1973. Introduction to theory and methods. Von T. C. Farrar und E. D. Becker.
Angewandte Chemie, 85(2).
Dullien, F., 1992. Porous media. fluid transport and pore structure. 2 red. San Diego: Oxford
university press.
Ernst, R. R. & Anderson, W. A., 1966. Application of fourier transform spectroscopy to magnetic
resonance. 37(1), p. 10.
Grant, D. M. & Harris, R. K., 1996. Encyklopedia of NMR. u.o.:John Wiley & Sons.
Guliants, V. V., Huth, A. J. & Stueve, J. M., 2012. A molecular dynamics and grand canonical Monte
Carlo study of silicalite-1 as a membrane material for energy-related gas separations. Journal of
porous materials, Volym 19, pp. 1-13.
Hahn, E. L., 1950. Spin echoes. Phys. rev., Nov, 80(4), pp. 580--594.
Harris, R. K., 1986. Nuclear Magnetic Resonance Spectroscopy. London: Longman.
Hore, P. J., 1995. Nuclear magnetic resonance. oxford: oxford university press.
Hussami, L., 2010. Synthesis, characterization and application of multiscale porous materials,
Stockholm: KTH.
James, T. L., 1998. Indian academy of science. [Online]
Available at: http://www.ias.ac.in/initiat/sci_ed/resources/chemistry/James.T.pdf
Karger, J. & Ruthven, D. M., 1992. Diffusion in zeolites and other microporous solids. New York:
Wiley.
Keeler, J., 2006. Understanding NMR spectroscopy. Camebridge: Wiley.
Khassin, A. A. o.a., 2003. Fischer–Tropsch synthesis using a porous catalyst packing: experimental
evidence of an efficient use of permeable composite monoliths as a novel type of the Fischer–Tropsch
synthesis catalyst. Catalysis today, 79-80(0), pp. 465-470.
Millipore Corp., 2012. Millipore. [Online]
Available at: http://www.millipore.com/catalogue/module/c10076

28
Morley, G. W., 2012. Wikipedia. [Online]
Available at: http://en.wikipedia.org/wiki/File:SpinEcho_GWM_stills.jpg
Nelsen, F. M. & Eggertsen, F. T., 1958. Determination of surface area. adsorption measurements by
continuous flow method. Analytical Chemistry, 30(8), pp. 1387-1390.
Petrov, O. V. & Furó, I., 2010. A joint use of melting and freezing data in NMR cryoporometry.
Microporous and mesoporous materials, 136(1-3), pp. 83-91.
Price, W. S., 1998. Pulsed-field gradient nuclear magnetic resonance as a tool for studying
translational diffusion. Magnetic resonance, 10(4), pp. 300-302.
Price, W. S., 1998. Pulsed-field gradient nuclear magnetic resonance as a tool for studying
translational diffusion: Part II. Experimental aspects. Concepts magnetic reson., 10(4), p. 197–237.
Purcell, E., Torrey, H. & Pound, R., 1946. Resonance absorption by nuclear magnetic moments in a
solid. Phys.rev., 69(1-2), pp. 69:37-38.
Rabi, I. I., Zacharias, J. R., Millman, S. & Kusch, P., 1938. A new method of measuring nuclear
nagnetic moment. Phys. Rev., 53(4), pp. 318--318.
Sing, K. o.a., 1985. Reporting physisorption data for gas/solid systems — with special reference to the
determination of surface area and porosity. Pure & applied chemistry, 57(4), pp. 603-619.
University of Oslo, 2012. University of Oslo Chemistry. [Online]
Available at:
http://www.uio.no/studier/emner/matnat/kjemi/KJM5100/h08/undervisningsmateriale/16KJM5100_20
08_porous_a.pdf
Valiullin, D. R., 2012. University of Leipzig. [Online]
Available at: http://www.uni-
leipzig.de/~valiu/index.php?option=com_content&view=article&id=36&Itemid=40
Valiullin, R. & Furo, I., 2002. Low-temperature phase separation of a binary liquid mixture in porous
materials studied by cryoporometry and pulsed-field-gradient NMR. Phys. rev. , 66(3), p. 031508.
Vargas-Florencia, D., 2006. Phase transitions in porous media studied by NMR spectroscopy,
Stockholm: KTH.
Veith, S. R., Hughes, E., Vuataz, G. & Pratsinis, S. E., 2004. Restricted diffusion in silica particles
measured by pulsed field gradient NMR. Journal of colloid and interface science, 274(1), pp. 216-228.
Vyalikh, A. o.a., 2005. Evidence of microphase separation in controlled pore glasses. Solid State
Nuclear Magnetic Resonance, 28(2-4), pp. 117-124.
Xie, K., Li, W. & Zhao, W., 2010. Coal chemical industry and its sustainable. Energy, 35(11), pp.
4349 - 4355.


![NMR imaging of moisture inside heated porous building ... · neutron-beam attenuation [11{15], and Nuclear Magnetic Resonance imaging (NMR) [6, 16, 17] are examples of these methods.](https://static.fdocuments.in/doc/165x107/5fa056d7c4ecc408e7045662/nmr-imaging-of-moisture-inside-heated-porous-building-neutron-beam-attenuation.jpg)