

NMIT COUNCIL MEETING OPEN AGENDA · 5/11/2017 · x Chartered Member, New Zealand Institute of...
116
NMIT COUNCIL MEETING OPEN AGENDA THURSDAY, 11 MAY 2017 Time: 10.30am – 12.30pm Venue: NMIT Nelson Campus, Room M306 ITEM TOPIC Administrative 1. Apologies 2. Register of Interests and Conflicts of Interests 3. Confirmation of Minutes of meeting held 22 March 2017 4. Action items Safety, Health & Wellbeing 5. Safety, Health & Wellbeing Dashboard 6. Safety, Health & Wellbeing Leadership Group minutes – 28 March 2017 7. Health and safety site visit brief 8. Recommendation: Disestablishment of Safety, Health & Wellbeing Working Group 9. Feedback from WSMP Audit Report & update on progress with Assura Strategic 10. Development of future Power BI dashboards Performance Reporting 11. CEO Report 12. EFTS and Financial Report as at 23 April 2017 13. Verbal update from Sara Williams (NMIT’s TEC Investment Manager) For Information 14. SANITI Report 15. Learner Voice – First Impressions 2017 16. Insights and challenges: My vision for the public sector – Controller & Auditor- General Council Open Agenda - 11 May 2017 - Open Agenda 1
Transcript of NMIT COUNCIL MEETING OPEN AGENDA · 5/11/2017 · x Chartered Member, New Zealand Institute of...
NMIT COUNCIL MEETING OPEN AGENDA
THURSDAY, 11 MAY 2017
Time: 10.30am – 12.30pmVenue: NMIT Nelson Campus, Room M306
ITEM TOPIC
Administrative
1. Apologies
2. Register of Interests and Conflicts of Interests
3. Confirmation of Minutes of meeting held 22 March 2017
4. Action items
Safety, Health & Wellbeing
5. Safety, Health & Wellbeing Dashboard
6. Safety, Health & Wellbeing Leadership Group minutes – 28 March 2017
7. Health and safety site visit brief
8. Recommendation: Disestablishment of Safety, Health & Wellbeing Working Group
9. Feedback from WSMP Audit Report & update on progress with Assura
Strategic
10. Development of future Power BI dashboards
Performance Reporting
11. CEO Report
12. EFTS and Financial Report as at 23 April 2017
13. Verbal update from Sara Williams (NMIT’s TEC Investment Manager)
For Information
14. SANITI Report
15. Learner Voice – First Impressions 2017
16. Insights and challenges: My vision for the public sector – Controller & Auditor-General
Council Open Agenda - 11 May 2017 - Open Agenda
1

NMIT COUNCIL MEETING OPEN AGENDA | 11 MAY 2017
ITEM TOPIC
17. TEC Investment Approach – Overview
18. Academic Board Minutes from the meetings held 15 March and 10 April 2017
19. Ageing population puts pressure on Nelson – Nelson Mail article
20. Income and Expenditure Report – The cost of being a student in New Zealand
21. Glossary
PART II: IN COMMITTEE
To consider and if thought fit, to pass the following resolution:That members of the public and the press be excluded from the following part of the proceedings of this meeting namely:
∑ In Committee Minutes & Matters Arising∑ Capital Asset Management Plan update (Jane Hill from Chow:Hill in attendance)∑ Strategic Development – ‘Assess and Optimise’ project ∑ Strategic Objectives Update∑ 2017 Graduation Ceremonies∑ CEO Report∑ TANZ eCampus update∑ NMIT Risk Register∑ Complaints & Misconduct Report ∑ Group & Service Team Reports∑ NPES 2016 Audit Documents
The general subject of each matter to be considered while the public is excluded, the reason for passing this resolution in relation to each matter, and the specific grounds under section 48(I) of the Government Official Information and Meetings Act 1987 for the passing of this resolution are as follows:
General subject Reason for passing Grounds under sectioneach matter to be this resolution in resolution (sec 48(1) of considered relation to each the Local Government
matter Official Information And Meetings Act 1987)
Sector IssuesFinancial Matters Commercial sensitivity
Council Open Agenda - 11 May 2017 - Open Agenda
2
NMIT COUNCIL MEETING OPEN AGENDA | 11 MAY 2017
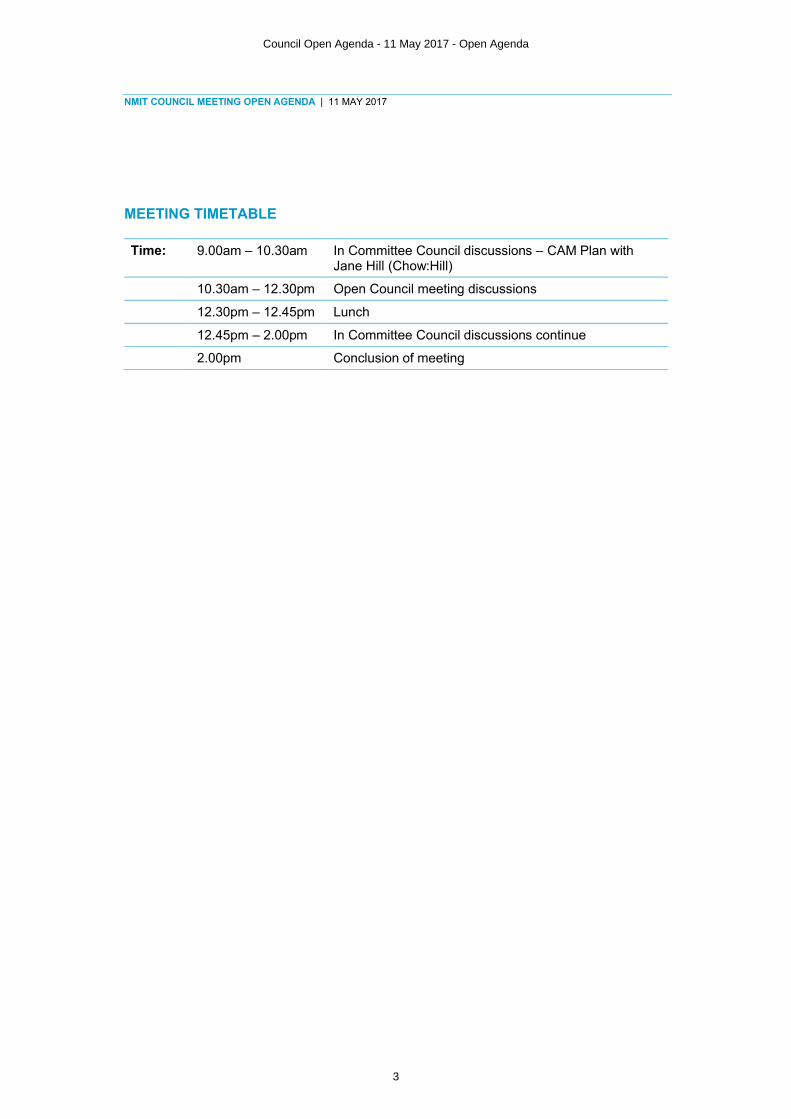
MEETING TIMETABLE
Time: 9.00am – 10.30am In Committee Council discussions – CAM Plan with Jane Hill (Chow:Hill)
10.30am – 12.30pm Open Council meeting discussions
12.30pm – 12.45pm Lunch
12.45pm – 2.00pm In Committee Council discussions continue
2.00pm Conclusion of meeting
Council Open Agenda - 11 May 2017 - Open Agenda
3

Updated 15 March 2017
COUNCIL MEMBER REGISTER OF INTERESTS
Daryl Wehner ∑ Port Nelson Ltd: Chief Financial Officer∑ Chartered Accountants Australia and New Zealand:
Member∑ Tasman Bay Stevedoring Co. Ltd, Director
Andrew Rowe ∑ CEO Cuddon Limited – engineering firm which may from time to time be involved in tender processes with NMIT which would be declared at the time;
∑ Cuddon Limited has some contracts with a Crown research body – AgResearch which is unrelated to education sector
∑ Board Member for Hockey New Zealand∑ Offers accommodation to NMIT nursing students during
placements in Marlborough
Paul Steere ∑ Nelson Airport Ltd: Chair & Director∑ The NZ King Salmon Group: Director∑ Clean Seas Tuna Ltd: Director∑ Kaynemaile Ltd: Director∑ Alan Scott Wines, Board Member∑ Seafood Research Strategic Advisory Committee
(advising the Board of Seafood Innovations Ltd): Member
Gabrielle Hervey ∑ Suter Art Gallery Trust Board Deputy Chair∑ Chair of the Wine Nelson Marketing Group∑ Time and Tide Ltd: Director∑ Hervey Motors Ltd: Director∑ Cecil Woods Nominees Ltd
Possible Conflicts of Interest:∑ Suter Art Gallery – Some NMIT art students work on
projects and exhibitions ∑ Wine Nelson has some contact with NMIT hospitality
students
Charles Newton ∑ Education consultant
Possible Conflict of Interest:∑ A family member on Staff at NMIT
Karen Stewart ∑ Principal Marlborough Girls’ College∑ Blenheim Communities of Schools Lead Team ∑ Lake Rotoiti Outdoor Education Centre – Trustee
Possible Conflicts of Interest:∑ MGC uses NMIT services ∑ TOSTA uses NMIT services
Council Open Agenda - 11 May 2017 - Administrative
4
Updated 15 March 2017
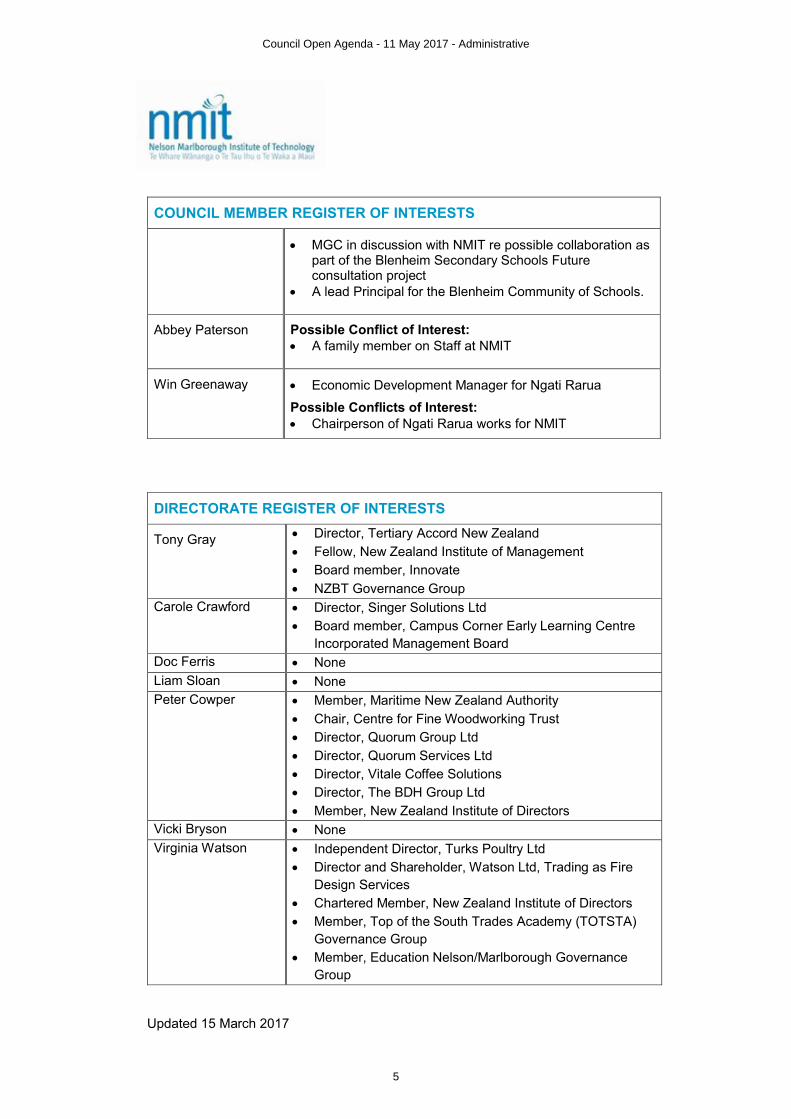
COUNCIL MEMBER REGISTER OF INTERESTS
∑ MGC in discussion with NMIT re possible collaboration as part of the Blenheim Secondary Schools Future consultation project
∑ A lead Principal for the Blenheim Community of Schools.
Abbey Paterson Possible Conflict of Interest:∑ A family member on Staff at NMIT
Win Greenaway ∑ Economic Development Manager for Ngati Rarua
Possible Conflicts of Interest:∑ Chairperson of Ngati Rarua works for NMIT
DIRECTORATE REGISTER OF INTERESTS
Tony Gray ∑ Director, Tertiary Accord New Zealand∑ Fellow, New Zealand Institute of Management∑ Board member, Innovate
∑ NZBT Governance GroupCarole Crawford ∑ Director, Singer Solutions Ltd
∑ Board member, Campus Corner Early Learning Centre Incorporated Management Board
Doc Ferris ∑ NoneLiam Sloan ∑ NonePeter Cowper ∑ Member, Maritime New Zealand Authority
∑ Chair, Centre for Fine Woodworking Trust∑ Director, Quorum Group Ltd∑ Director, Quorum Services Ltd∑ Director, Vitale Coffee Solutions∑ Director, The BDH Group Ltd∑ Member, New Zealand Institute of Directors
Vicki Bryson ∑ None Virginia Watson ∑ Independent Director, Turks Poultry Ltd
∑ Director and Shareholder, Watson Ltd, Trading as Fire Design Services
∑ Chartered Member, New Zealand Institute of Directors∑ Member, Top of the South Trades Academy (TOTSTA)
Governance Group∑ Member, Education Nelson/Marlborough Governance
Group
Council Open Agenda - 11 May 2017 - Administrative
5

UNCONFIRMED MINUTES OF NELSON MARLBOROUGH INSTITUTE OF TECHNOLOGY COUNCIL MEETING HELD AT NMIT NELSON CAMPUS ON 22 MARCH 2017, COMMENCING AT 10.23AM.
PRESENTD Wehner (Chair), G Hervey, A Paterson, C Newton, K Stewart, W Greenaway – apologies for late arrival, 10.54am
IN ATTENDANCET Gray (Chief Executive), V Bryson (Director, Finance and Business Improvement), A Cooke(Minute Taker)
1. APOLOGIES
A Rowe, P Steere
2. REGISTER OF INTERESTS AND CONFLICTS OF INTERESTS
There were no updates to the Register of Interests or Conflicts of Interest.
3. CONFIRMATION OF MINUTES OF MEETING HELD ON 23 FEBRUARY 2017
Council requested regular training on Power BI with the opportunity for Council toprovide input into the future development of dashboards. C Newton to draft a paper for the next Council meeting identifying areas of interest, in regards to reporting, using Power BI.
Resolved: That the Minutes of the meeting held on 23 February 2017, as circulated and read by members, be confirmed.
4. ACTION ITEMS
There were no action items to discuss.
5. SAFETY, HEALTH & WELLBEING DASHBOARD
Council noted the increased number of incident and near miss reporting since Assura’s introduction, Council commended colleagues on this activity. Council discussed ‘lag’ and ‘lead in’ indicators; lag indicators referring to lost time from injury, lead indicators referring to preventative measures being put in place. It was noted this type of reporting is absent from the current health and safety reports provided to Council. The Council Chair to follow this up with the Chief Executive.
6. ACC WORKPLACE SAFETY MANAGEMENT PRACTICES AUDIT REPORT
Council congratulated the NMIT team on the good outcome from the audit. Council were interested in finding out what is being undertaken to address the recommendations made in the report. Feedback on the actions being taken will be provided to Council at its May meeting.
Council Open Agenda - 11 May 2017 - Administrative
6
UNCONFIRMED NMIT COUNCIL MEETING MINUTES | 22 MARCH 2017 PAGE 2 OF 4
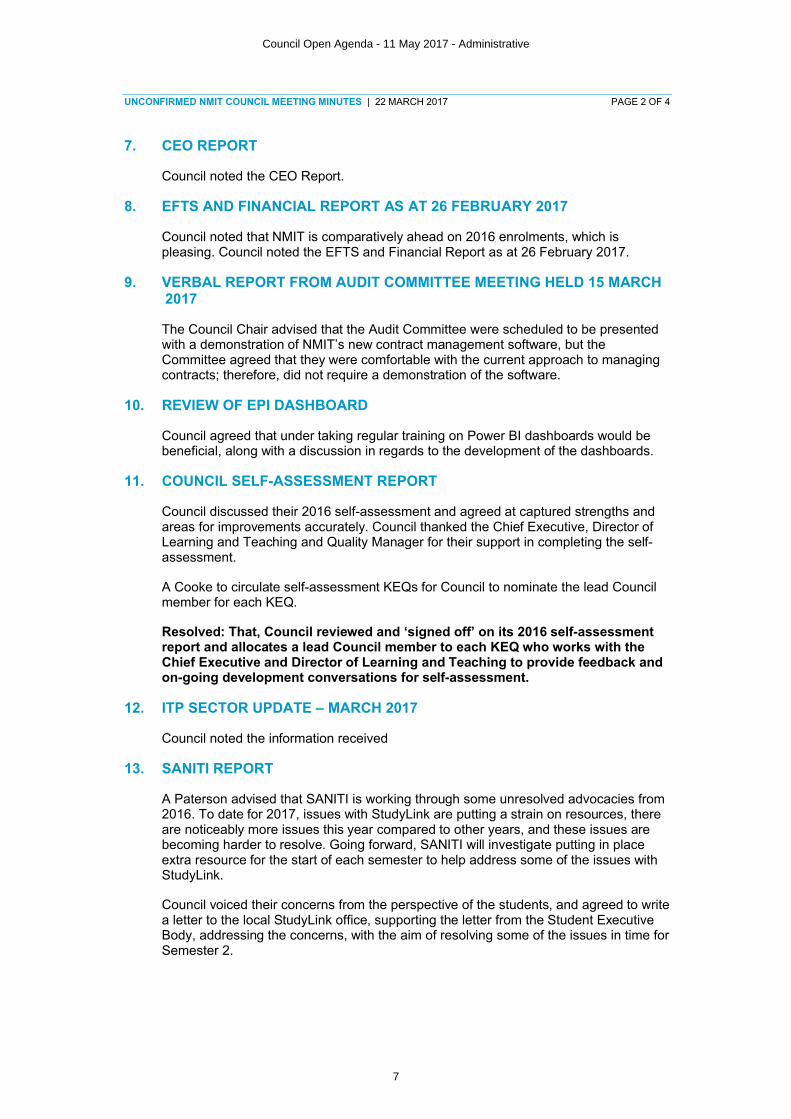
7. CEO REPORT
Council noted the CEO Report.
8. EFTS AND FINANCIAL REPORT AS AT 26 FEBRUARY 2017
Council noted that NMIT is comparatively ahead on 2016 enrolments, which is pleasing. Council noted the EFTS and Financial Report as at 26 February 2017.
9. VERBAL REPORT FROM AUDIT COMMITTEE MEETING HELD 15 MARCH 2017
The Council Chair advised that the Audit Committee were scheduled to be presented with a demonstration of NMIT’s new contract management software, but the Committee agreed that they were comfortable with the current approach to managing contracts; therefore, did not require a demonstration of the software.
10. REVIEW OF EPI DASHBOARD
Council agreed that under taking regular training on Power BI dashboards would be beneficial, along with a discussion in regards to the development of the dashboards.
11. COUNCIL SELF-ASSESSMENT REPORT
Council discussed their 2016 self-assessment and agreed at captured strengths and areas for improvements accurately. Council thanked the Chief Executive, Director of Learning and Teaching and Quality Manager for their support in completing the self-assessment.
A Cooke to circulate self-assessment KEQs for Council to nominate the lead Council member for each KEQ.
Resolved: That, Council reviewed and ‘signed off’ on its 2016 self-assessment report and allocates a lead Council member to each KEQ who works with the Chief Executive and Director of Learning and Teaching to provide feedback and on-going development conversations for self-assessment.
12. ITP SECTOR UPDATE – MARCH 2017
Council noted the information received
13. SANITI REPORT
A Paterson advised that SANITI is working through some unresolved advocacies from 2016. To date for 2017, issues with StudyLink are putting a strain on resources, there are noticeably more issues this year compared to other years, and these issues are becoming harder to resolve. Going forward, SANITI will investigate putting in place extra resource for the start of each semester to help address some of the issues with StudyLink.
Council voiced their concerns from the perspective of the students, and agreed to write a letter to the local StudyLink office, supporting the letter from the Student Executive Body, addressing the concerns, with the aim of resolving some of the issues in time for Semester 2.
Council Open Agenda - 11 May 2017 - Administrative
7
UNCONFIRMED NMIT COUNCIL MEETING MINUTES | 22 MARCH 2017 PAGE 3 OF 4
14. ACADEMIC BOARD MINUTES FROM THE MEETING HELD 15 FEBRUARY 2017
Council discussed the inclusion of the Te Ara Wai strategy when developing new programmes. The Chief Executive provided examples of how the strategy is imbedded when developing new programmes through the use Māori language, cultural development aspects being built into the programmes and liaising with the Director of Māori and Iwi Engagement through the development process.
Council discussed their desire to see moderation reports as a separate item on the agenda, rather than the minute from Academic Board meetings.
Council received the minutes from the Academic Board meeting, held 15 February 2017.
15. WORKLOAD PLANNER UPDATE
Council noted the information provided in relation to the Workload Planner update.
IN COMMITTEE
Resolved: That members of the public and press be excluded from the following part of the proceedings of this meeting, namely:
In Committee Minutes & Matters ArisingCapital Asset Management Plan update Market Conditions Report Global Campus – Strategy Update2016 Annual Report (final draft) & 2016 year-end financialsDraft NPES 2016 year-end financialsCEO Report2016 Audit Report – Audit New ZealandLegislative ComplianceVerbal report from Audit Committee meeting held 15 March 2017TANZ eCampus updateNMIT Risk Register Complaints & Misconduct Report Group & Service Team ReportsCorrespondenceImmigration New Zealand Visa approval update
The general subject of each matter to be considered while the public be excluded, the reason for passing this resolution in relation to each matter, and the specific grounds under Section 48(1) of the Government Official Information and Meetings Act 1987 for the passing of this resolution are as follows:
General subject matter to be considered
Financial & Sector Matters
Reason for passing this resolution in relation to each other
Commercial sensitivity
Grounds under Section resolution (sec.48(1)) of the Local Government Official Information and Meetings Act 1987
Council Open Agenda - 11 May 2017 - Administrative
8

UNCONFIRMED NMIT COUNCIL MEETING MINUTES | 22 MARCH 2017 PAGE 4 OF 4
Resolved: That Council move out of ‘In Committee’
There being no further business, the meeting closed at 11.00am
Confirmed: _____________________________ Dated: 11 May 2017
Council Open Agenda - 11 May 2017 - Administrative
9
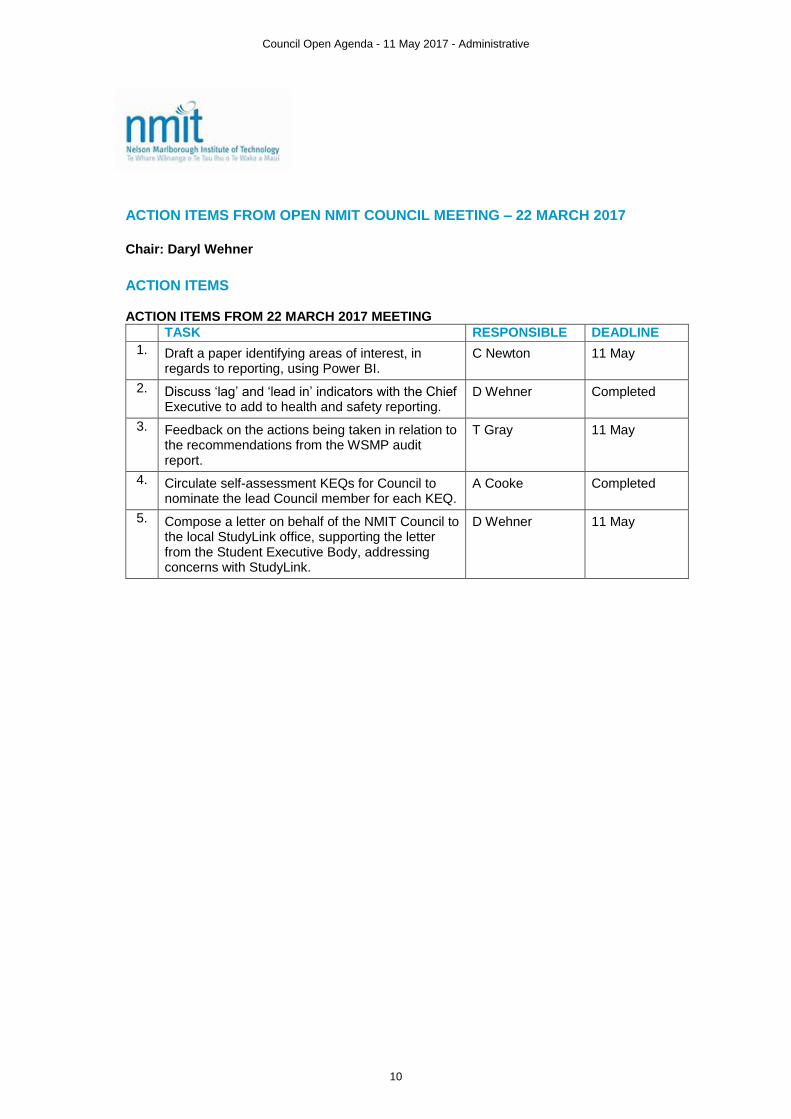
ACTION ITEMS FROM OPEN NMIT COUNCIL MEETING – 22 MARCH 2017
Chair: Daryl Wehner
ACTION ITEMS ACTION ITEMS FROM 22 MARCH 2017 MEETING
TASK RESPONSIBLE DEADLINE
1. Draft a paper identifying areas of interest, in regards to reporting, using Power BI.
C Newton 11 May
2. Discuss ‘lag’ and ‘lead in’ indicators with the Chief Executive to add to health and safety reporting.
D Wehner Completed
3. Feedback on the actions being taken in relation to the recommendations from the WSMP audit report.
T Gray 11 May
4. Circulate self-assessment KEQs for Council to nominate the lead Council member for each KEQ.
A Cooke Completed
5. Compose a letter on behalf of the NMIT Council to the local StudyLink office, supporting the letter from the Student Executive Body, addressing concerns with StudyLink.
D Wehner 11 May
Council Open Agenda - 11 May 2017 - Administrative
10

SAFETY, HEALTH AND WELLBEING WORKFORCE DASHBOARD
No serious injuries have been reported. March had a high number of health and safety events, with 37 reported for a month. This dropped to 11 for April. Last year also showed a decline from March to April, however what is different for 2017 is the high number of Near Miss events reported in March. This may be due to increased team member awareness from communications around the February launch of the Assura H&S portal. An increase in records logged through the portal is already evident after recent communications about the launch of Assura System full application on 1 May. This shows the importance of continuing regular communications to team members to keep Assura in the forefront of their minds.
Nelson Campus,
3, 8% A Block, 1, 3%
E Block, 2, 5%
G Block, 1, 3%
K Block, 1, 3%
T Block, 2, 5%
Marlborough Campus, 1, 3%
Woodbourne Base, 21, 57%
Off Campus, 5, 13%
March 2017 H&S events by LocationNelson Campus
A Block
E Block
G Block
K Block
T Block
Marlborough Campus
Woodbourne Base
Off Campus
Near Miss, 13, 35%
Injured Person, 19, 51%
Pain & Discomfort,
1, 3%
Property Damage, 4, 11%
March 2017 H&S events by Type
Near Miss
Injured Person
Pain & Discomfort
Property Damage
Nelson Campus,
1, 9%
A Block, 1, 9%
E Block, 1, 9%
G Block, 3, 28%M Block,
1, 9%
T Block, 2, 18%
Woodbourne Base, 1, 9%
Off Campus,
1, 9%
April 2017 H&S events by LocationNelson Campus
A Block
E Block
G Block
M Block
T Block
Woodbourne Base
Off Campus
Near Miss, 4, 36%
Injured Person, 7, 64%
April 2017 H&S events by Type
Near Miss
Injured Person
Council Open Agenda - 11 May 2017 - Safety, Health & Wellbeing
11

SAFETY, HEALTH & WELLBEING DASHBOARD | 11 MAY 2017 PAGE 2 OF 6
ACCIDENTS AND NEAR MISSES EVENTS
Due to the increase in reporting, health and safety events where severity of harm is Insignificant (i.e. no injury or no treatment given), are excluded from the listing below unless it had to potential to cause harm requiring medical treatment.
ID Event Date TypeInjured Person
Severity of harm Location Details Action(s) taken
1073 1/03/2017 Injured Person Staff Minor Woodbourne Base
Student pricked finger on staple from paperwork
Told students to ensure all staples have been correctly installed
1092 2/03/2017 Injured Person Staff Minor Woodbourne Base
Staff received small cut to hand from Cessna front wheel
Discussed with TA and he informed student to be careful around aircraft
10
4
10
12
9
5
10
1
4
13
4
17
10
13
7
10
19
15
8
5
3
12
19
7
0 0 0 01
0 0 0 01
21
00 0 0 0 0
3 3
0 01
0
4
00
2
4
6
8
10
12
14
16
18
20
Mar Apr May Jun Jul Aug Sep Oct Nov Jan Feb Mar Apr
2016 2017
Total Health and Safety Events reported by Type
Near Miss Injured Person Pain & Discomfort Property Damage
Council Open Agenda - 11 May 2017 - Safety, Health & Wellbeing
12
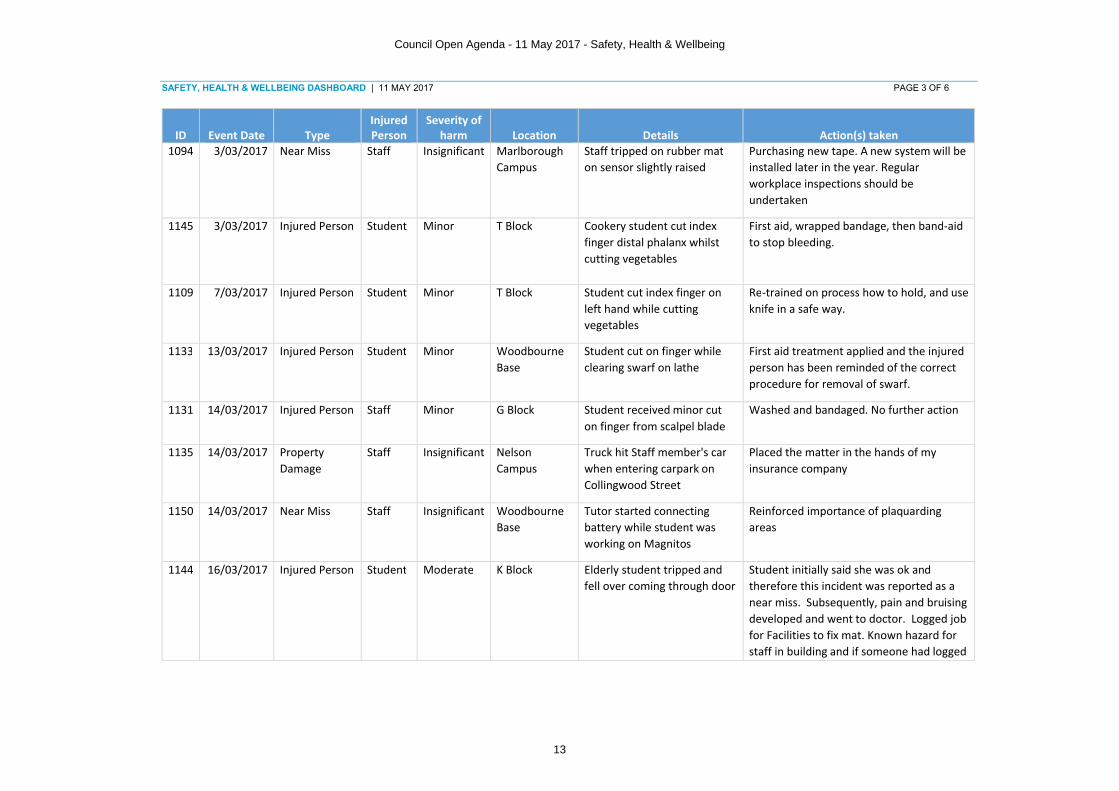
SAFETY, HEALTH & WELLBEING DASHBOARD | 11 MAY 2017 PAGE 3 OF 6
ID Event Date TypeInjured Person
Severity of harm Location Details Action(s) taken
1094 3/03/2017 Near Miss Staff Insignificant Marlborough Campus
Staff tripped on rubber mat on sensor slightly raised
Purchasing new tape. A new system will be installed later in the year. Regular workplace inspections should be undertaken
1145 3/03/2017 Injured Person Student Minor T Block Cookery student cut index finger distal phalanx whilst cutting vegetables
First aid, wrapped bandage, then band-aid to stop bleeding.
1109 7/03/2017 Injured Person Student Minor T Block Student cut index finger on left hand while cutting vegetables
Re-trained on process how to hold, and use knife in a safe way.
1133 13/03/2017 Injured Person Student Minor Woodbourne Base
Student cut on finger while clearing swarf on lathe
First aid treatment applied and the injured person has been reminded of the correct procedure for removal of swarf.
1131 14/03/2017 Injured Person Staff Minor G Block Student received minor cut on finger from scalpel blade
Washed and bandaged. No further action
1135 14/03/2017 Property Damage
Staff Insignificant Nelson Campus
Truck hit Staff member's car when entering carpark on Collingwood Street
Placed the matter in the hands of my insurance company
1150 14/03/2017 Near Miss Staff Insignificant Woodbourne Base
Tutor started connecting battery while student was working on Magnitos
Reinforced importance of plaquarding areas
1144 16/03/2017 Injured Person Student Moderate K Block Elderly student tripped and fell over coming through door
Student initially said she was ok and therefore this incident was reported as a near miss. Subsequently, pain and bruising developed and went to doctor. Logged job for Facilities to fix mat. Known hazard for staff in building and if someone had logged
Council Open Agenda - 11 May 2017 - Safety, Health & Wellbeing
13

SAFETY, HEALTH & WELLBEING DASHBOARD | 11 MAY 2017 PAGE 4 OF 6
ID Event Date TypeInjured Person
Severity of harm Location Details Action(s) taken
job with Facilities earlier it may have prevented student getting hurt.
1148 16/03/2017 Pain & Discomfort
Staff Minor Woodbourne Base
Staff experiencing pain in back and shoulders
Arrange to get workstation assessment
1156 17/03/2017 Near Miss Student Insignificant Woodbourne Base
Student tripped on R22 wheels several times
Tires removed and put on toolboard, so someone has to tag out and put back when finished
1234 17/03/2017 Near Miss Student Insignificant Off Campus Student swam out of kayak above undercut rock
All students made aware of the undercut rock.
1181 24/03/2017 Injured Person Student Minor A Block Student cut finger with Scalpel during dissection practical
Washed and plaster applied
1183 25/03/2017 Property Damage
Staff Insignificant Off Campus Staff rolled flat deck truck while transporting fencing posts
Police, fire brigade and ambulance attended. Checked out by ambulance people and fire brigade made the vehicle safe and helped to recover the vehicle to a safe spot. Vehicle was pink stickered.
1188 27/03/2017 Injured Person Student Minor Nelson Campus
Student was stung by wasp whilst using the sports turf
Attended by first aider. Swelling was starting. Applied Anti-histamine cream to the sting area. Student went home and was instructed to monitor swelling and seek medical advice if it continued.
1227 28/03/2017 Injured Person Student Minor Woodbourne Base
Student cut her finger while filing piece of metal
She was reminded of the requirement to be careful when working with metal
1223 29/03/2017 Near Miss Student Insignificant Woodbourne Base
Student received minor electric shock while using high tension lead tester
Box removed from tool board and decommissioned
Council Open Agenda - 11 May 2017 - Safety, Health & Wellbeing
14
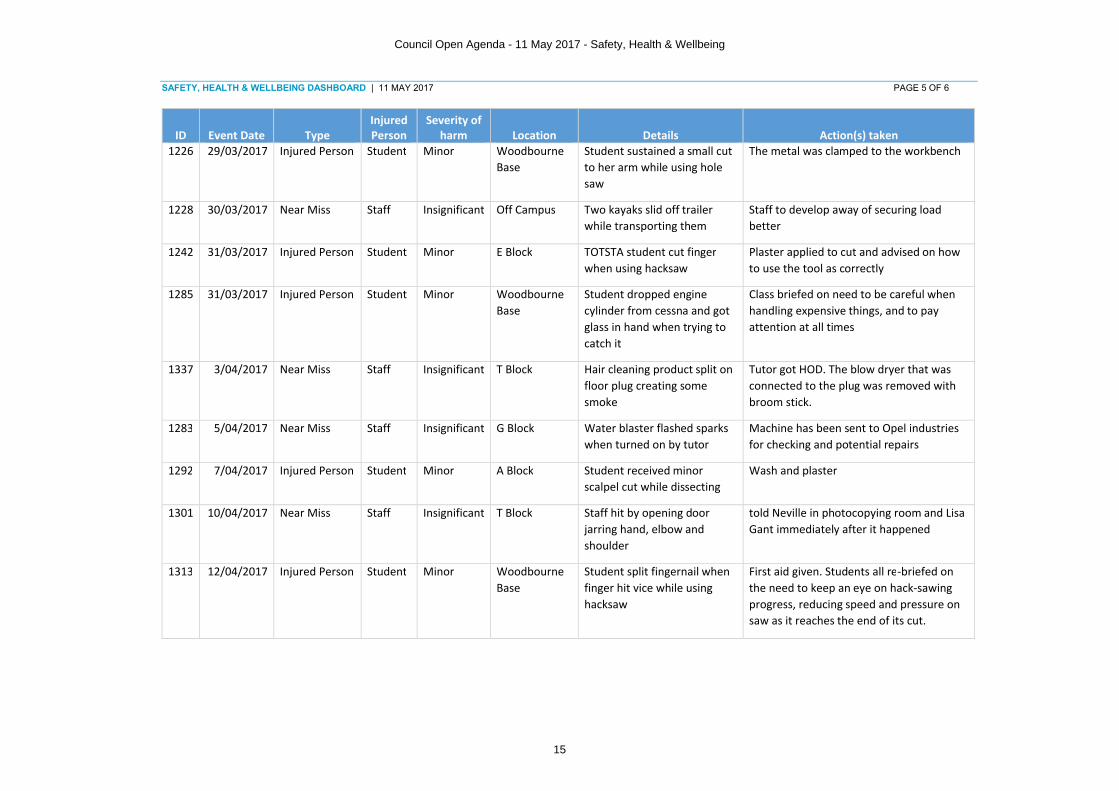
SAFETY, HEALTH & WELLBEING DASHBOARD | 11 MAY 2017 PAGE 5 OF 6
ID Event Date TypeInjured Person
Severity of harm Location Details Action(s) taken
1226 29/03/2017 Injured Person Student Minor Woodbourne Base
Student sustained a small cut to her arm while using hole saw
The metal was clamped to the workbench
1228 30/03/2017 Near Miss Staff Insignificant Off Campus Two kayaks slid off trailer while transporting them
Staff to develop away of securing load better
1242 31/03/2017 Injured Person Student Minor E Block TOTSTA student cut finger when using hacksaw
Plaster applied to cut and advised on how to use the tool as correctly
1285 31/03/2017 Injured Person Student Minor Woodbourne Base
Student dropped engine cylinder from cessna and got glass in hand when trying to catch it
Class briefed on need to be careful when handling expensive things, and to pay attention at all times
1337 3/04/2017 Near Miss Staff Insignificant T Block Hair cleaning product split on floor plug creating some smoke
Tutor got HOD. The blow dryer that was connected to the plug was removed with broom stick.
1283 5/04/2017 Near Miss Staff Insignificant G Block Water blaster flashed sparks when turned on by tutor
Machine has been sent to Opel industries for checking and potential repairs
1292 7/04/2017 Injured Person Student Minor A Block Student received minor scalpel cut while dissecting
Wash and plaster
1301 10/04/2017 Near Miss Staff Insignificant T Block Staff hit by opening door jarring hand, elbow and shoulder
told Neville in photocopying room and Lisa Gant immediately after it happened
1313 12/04/2017 Injured Person Student Minor Woodbourne Base
Student split fingernail when finger hit vice while using hacksaw
First aid given. Students all re-briefed on the need to keep an eye on hack-sawing progress, reducing speed and pressure on saw as it reaches the end of its cut.
Council Open Agenda - 11 May 2017 - Safety, Health & Wellbeing
15

SAFETY, HEALTH & WELLBEING DASHBOARD | 11 MAY 2017 PAGE 6 OF 6
ID Event Date TypeInjured Person
Severity of harm Location Details Action(s) taken
1315 12/04/2017 Injured Person Staff Moderate G Block Staff felt pain injured back while moving small table through doorway
Took Voltarin within 30 minutes and saw a physiotherapist on 12 April. Another appointment has been made for 13 April.
1317 13/04/2017 Injured Person Student Minor G Block Student tripped over and potentially sprained ankle
First aid was given. Applied ice to the foot area, and made the student comfortable and rest the ankle.
1324 27/04/2017 Near Miss Member of public
Insignificant Nelson Campus
Young boy ran into side of slow moving car travelling to carpark
Spoke to boy concerned, who was shaken but unharmed. Spoke to driver of car, drew map of incident and gave to Pam, H&S team. Review of signage to be undertaken.
In addition, one particular student collapsed and/or had seizures on 4 separate occasions. An ambulance was called on one occasion. Due to the nature of his course (construction), the student has been stood down until he seeks medical advice and his condition stabilises.
OTHER HEALTH AND SAFETY ACTIVITY
15 staff attended Fire warden training prior to the Fire Drills on Nelson Campus in March and 10 staff attended first aid training.
Departments have been reviewing their HSNO chemical inventories and ensuring compliant Safety Data Sheets (SDS) are readily available for all hazardous substances.
Several Assura User Guides have been created and made available to NMIT team members to support the launch of the Assura System full application.
The following SHW forum meetings held in March and April:
∑ Health and Safety Committee (2 meetings)∑ Safety, Health and Wellbeing Working Group ∑ Safety, Health and Wellbeing Leadership Group
Proposal prepared to get budget approval for Air quality monitoring on Nelson Campus for Engineering, Carpentry Barn, Automotive and Creative Industriesworkshops. Monitoring will include testing for dust, particulates and noise. Assisting Carpentry investigate options for dust extraction systems and air filters.
Council Open Agenda - 11 May 2017 - Safety, Health & Wellbeing
16

MINUTES
Meeting Purpose: Safety, Health and Wellbeing Leadership Group
Date: 28 March 2017 Location: Tony’s office
Chair: Tony Gray Minutes: Jude Spencer
Start Time: 3.30pm Finish Time: 5.00pm
Attendees: Tony Gray, Andy Rowe, Jackie Britz, Peter Wilcox, Peter CowperApologies: Liam Sloan
Agenda Items Who / WhenPrevious Meeting MinutesSafety, Health and Wellbeing Leadership Group – 30 November 2016∑ Minutes of 30 November meeting approved by committee.∑ PC advised BCM work will be re-visited when new Campus Services Manager is
appointed. ∑ PW advised all health and safety rep positions were filled apart from Global
Campus. ∑ There has been a good uptake on health monitoring which has been very well
received. Looking at proposals for dust extraction. Plan is to carry outmonitoring and based on the results will implement any upgrades to equipment and environment as required.
∑ No feedback from employers following the mail out regarding health and safety. Health and Safety team now reviewing NMIT documentation for work placements.
Safety, Health and Wellbeing Working Group Minutes – 1 Feb 2017∑ Discussed role of SHW Working Group and the reduced rationale for its
continuation against its Terms of Reference and with the creation of the Health and Safety Committee. TG to propose to Directorate that the Working Group be dis-established and then refer to Council for approval at its May meeting.
∑ To recommend a member of the health and safety committee attends the SHW Leadership Group meeting.
∑ PC to discuss with Working Group at next week’s meeting. ∑ ACC awarded secondary accreditation to NMIT following WSMP audit. Noted
thanks to Pam Graham for her work on the project.Health and Safety Committee Minutes∑ Focus on education for new reps with expectation that they will be doing work
within the organisation. Have asked reps for area reports. ∑ Agreed that actions should be recorded at health and safety committee
meetings and passed on to relevant colleagues. TG to also highlight minutes at Directorate.
∑ AR noted that not being available for meetings is a culture issue and areas need to ensure there is adequate cover for colleagues so they can attend meetings.
PC 30 April
PC ongoingApril
TG 30 April
TG 30 April
PC 5 April
TG 11 April
Council Open Agenda - 11 May 2017 - Safety, Health & Wellbeing
17

MINUTESReview of 2016∑ PW noted there was patchy buy-in to health and safety from different areas.
Some areas very enthusiastic and others a bit more reluctant. Woodbourneand the creative industries areas have made significant progress. Plenty of work still to do but working toward goals.
∑ PC reported that the health and safety team would be developed into more of a consultancy role for NMIT rather than doing all the work. Work is being done on future-proofing the team and also recognising PG’s experience and qualifications.
∑ PW to put more time into on-site contractor management and will work with new Campus Services Manager to implement further.
∑ Standard Operating Procedures for machinery – still have some machines that PW is concerned about and will look at those as part of the document review.
Health and Safety Objectives 2017∑ TG noted measurements still needed to be completed for the objectives. ∑ A one-pager on health and safety objectives to be distributed to all colleagues
so that all can be involved in achieving objectives. ∑ Also need to add a well-being objective to the list.
PW/PC PW/TG
Drug and Alcohol Policy
∑ TG reported that Council feedback was to scope all areas of NMIT to determine what was required and why.
∑ AR noted unions had been very supportive of drug and alcohol policies. ∑ Student issues currently dealt with through misconduct process. ∑ Testing in trades industries has become standard practice and should be
expected for students going on work placements.∑ Recommendation to Council:
o To draft drug and alcohol policy for staff and can use Cuddon policy as a starting point.
o Draft student drug and alcohol policy for programme areas where there is an industry norm to align with.
o Manage any other student incidents through misconduct policy and post-incident/accident testing.
∑ Send misconduct policy to AR.
TGJB/PW
JS Done
Other business
∑ Health and safety site tours. Tabled new brief for 2017 which aimed to downplay formality and encourage conversations. To include brief in Directorate and Council papers.
JS/TG 11 April
Next meeting 3.30pm, Wednesday 14 June, 2017
Council Open Agenda - 11 May 2017 - Safety, Health & Wellbeing
18
Health and Safety Site Visits
This year the site visit focus is to keep things informal and engage in conversation with colleaguesand students if the opportunity arises. While this is not an audit, you should keep a look out for anything that might be ‘dodgy, dangerous or different’. If there is anything you wish to report, log on to Assura using your NMIT email and network password.
Here are some ideas for your visit:
Approaching conversation
∑ Practice humble enquiry – the gentle art of asking instead of telling – in order to build relationships of trust and respect
∑ Use the conversation to jointly make sense of what’s going on in the work situation∑ Be curious, responsive and open to different perspectives∑ Listen without judgment∑ Don’t be put off by strong emotions∑ Be clear that everyone can make a difference, and set the expectation that they will do so
Questions to ask
∑ What does your work involve?∑ Is there an optimal or ‘best’ way to carry out this activity? Can you talk me through that?∑ Do you ever have to adjust the way you do the activity to the situation? How?
Council Open Agenda - 11 May 2017 - Safety, Health & Wellbeing
19

REPORT TO NMIT COUNCIL | 11 MAY 2017 ITEM 8 DISESTABLISHMENT OF THE SAFETY, HEALTH & WELLBEING WORKING GROUP PREPARED BY TONY GRAY (CHIEF EXECUTIVE) PURPOSE
To provide Council with decision making information, on the committee and group structure of Safety, Health and Wellbeing management at NMIT. RECOMMENDATION
That Council agrees to the disestablishment of the NMIT Safety, Health and Wellbeing Working Group. This group is to be replaced by the work of the Health and Safety Committee. CONTEXT
NMIT established a committee and group structure to overview the leadership, monitoring and review of safety, health and wellbeing following the introduction in 2016 of new health and safety legislation. The establishment of a Health and Safety Committee is a requirement of the Health and Safety at Work (Worker Engagement, Participation and Representation) Regulations 2016. The Committee is made up of representation of teams across NMIT. Early meetings of the Committee identified duplication and overlap with the Working Group, both in membership and business.
Safety, Health and Wellbeing Leadership Group Terms of Reference
Safety, Health and Wellbeing Working Group Terms of Reference
Health & Safety Committee Terms of Reference
Council Open Agenda - 11 May 2017 - Safety, Health & Wellbeing
20

Controlled Document – Refer to NMIT website or intranet for latest version
SAFETY, HEALTH & WELLBEING LEADERSHIP GROUP TERMS OF REFERENCE
Section Safety, Health and Wellbeing Approval Date 18.02.2016 Approved by Council Next Review 18.02.2018 Responsibility Chief Executive Last Reviewed 18.02.2016 Key Evaluation Question 6
PURPOSE
To be proactive in leading the change and development required for a ‘Just Culture’ and a ‘Zero Harm’ organisation. To provide guidance on key Safety, Health and Wellbeing issues to NMIT Council and the Chief Executive.
RESPONSIBILITIES
The Safety, Health & Wellbeing Leadership Group will:
• Undertake an annual consultative review of the Institute’s conformance to relevant health and safety legislation and ensure the Institute is meeting new health and safety legislation.
• Undertake an annual review to ensure compliance with the institute’s Safety, Health and Wellbeing policies and procedures and maintain Accident Compensation Corporation Workplace Management Practices (ACC WSMP), or other such agreed standards or accredited systems.
• To assist with the development, monitoring and evaluation of the Safety, Health and Wellbeing initiatives, business objectives and practices of the institute.
• To facilitate and monitor the implementation of the Institute’s objectives and plans in the context of Safety, Health and Wellbeing.
• To actively promote a culture with the Institute where management and employees commitment to health and safety is evident.
• To identify priority Safety, Health and Wellbeing issues and deal with them, the same way as other NMIT risks.
• Receive and review the minutes of the Safety, Health and Wellbeing Working Group and identify key issues for planning purposes.
• Provide feedback to the NMIT Council.
MEMBERSHIP
• Council Member • Chief Executive (Chair) • Chair of the Safety, Health and Wellbeing Working Group • Director of Learning • H&S Manager • Director of People & Organisation Development • ILT (Manager)
Council Open Agenda - 11 May 2017 - Safety, Health & Wellbeing
21

2 of 2 8. Safety, Health And Wellbeing Leadership Group Terms Of Reference Controlled Document – Refer to NMIT website or intranet for latest version Printed 5/05/2017 10:37 AM
APPOINTMENT OF MEMBERS
• Membership will be reviewed bi-annually in November initiated by Director of People & Organisation Development.
MEETING PROCEDURES
The Safety, Health and Wellbeing Leadership Group will meet four times, annually.
Four members must be present to make up a quorum for meetings.
Meeting minutes will be sent to Council, Directorate, ILT and the Safety, Health and Wellbeing Working Group.
REFERENCES
INTERNAL Safety, Health and Wellbeing Policy NMIT Health and Safety Manual Safety, Health and Wellbeing Terms of Reference Smokefree Policy
EXTERNAL
Health and Safety at Work Act 2015
RECORDS
Safety, Health and Wellbeing Minutes
Council Open Agenda - 11 May 2017 - Safety, Health & Wellbeing
22
Controlled Document – Refer to NMIT website or intranet for latest version
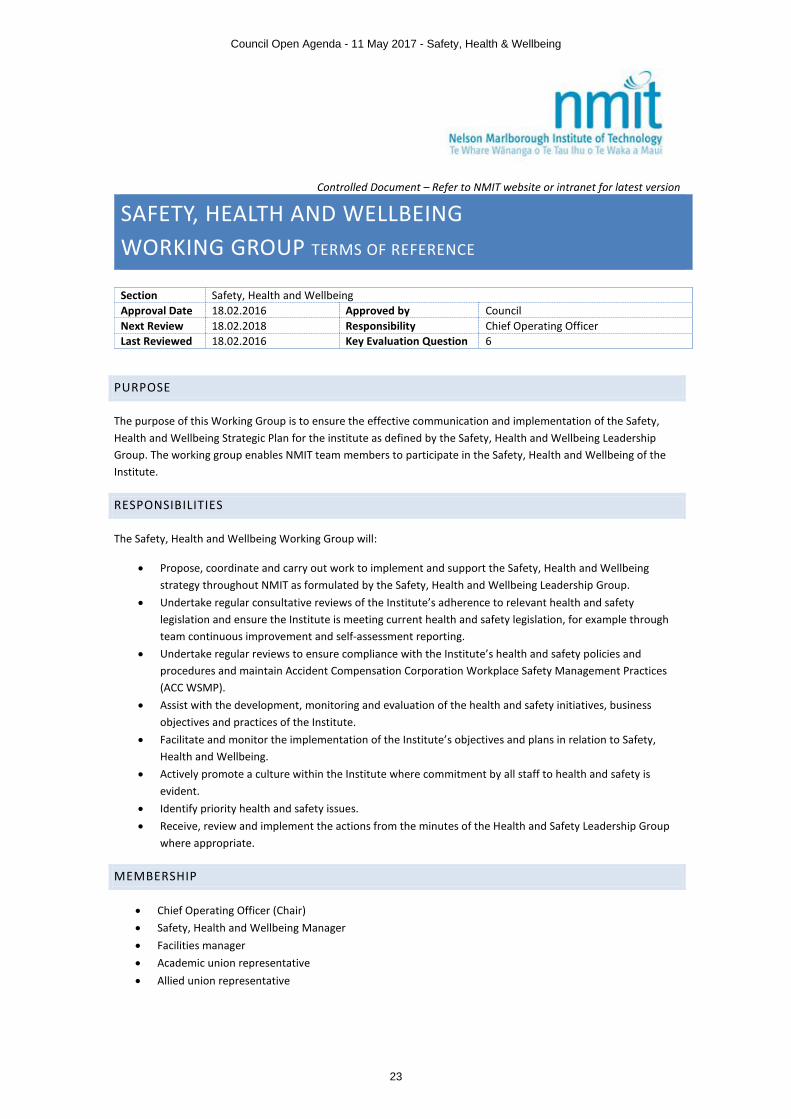
SAFETY, HEALTH AND WELLBEING WORKING GROUP TERMS OF REFERENCE
Section Safety, Health and Wellbeing Approval Date 18.02.2016 Approved by Council Next Review 18.02.2018 Responsibility Chief Operating Officer Last Reviewed 18.02.2016 Key Evaluation Question 6
PURPOSE
The purpose of this Working Group is to ensure the effective communication and implementation of the Safety, Health and Wellbeing Strategic Plan for the institute as defined by the Safety, Health and Wellbeing Leadership Group. The working group enables NMIT team members to participate in the Safety, Health and Wellbeing of the Institute.
RESPONSIBILITIES
The Safety, Health and Wellbeing Working Group will:
• Propose, coordinate and carry out work to implement and support the Safety, Health and Wellbeing strategy throughout NMIT as formulated by the Safety, Health and Wellbeing Leadership Group.
• Undertake regular consultative reviews of the Institute’s adherence to relevant health and safety legislation and ensure the Institute is meeting current health and safety legislation, for example through team continuous improvement and self-assessment reporting.
• Undertake regular reviews to ensure compliance with the Institute’s health and safety policies and procedures and maintain Accident Compensation Corporation Workplace Safety Management Practices (ACC WSMP).
• Assist with the development, monitoring and evaluation of the health and safety initiatives, business objectives and practices of the Institute.
• Facilitate and monitor the implementation of the Institute’s objectives and plans in relation to Safety, Health and Wellbeing.
• Actively promote a culture within the Institute where commitment by all staff to health and safety is evident.
• Identify priority health and safety issues. • Receive, review and implement the actions from the minutes of the Health and Safety Leadership Group
where appropriate.
MEMBERSHIP
• Chief Operating Officer (Chair) • Safety, Health and Wellbeing Manager • Facilities manager • Academic union representative • Allied union representative
Council Open Agenda - 11 May 2017 - Safety, Health & Wellbeing
23
2 of 2 8. Safety, Health and Wellbeing Working Group Terms of Reference Controlled Document – Refer to NMIT website or intranet for latest version Printed 5/05/2017 10:38 AM.
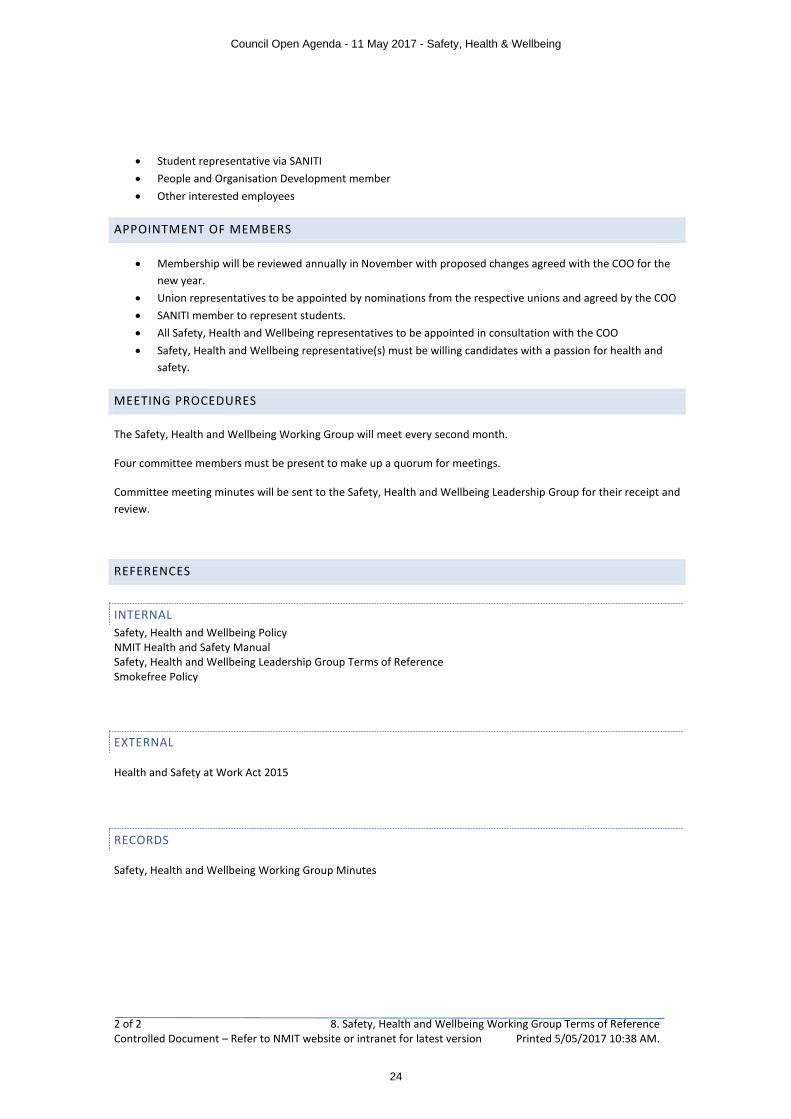
• Student representative via SANITI • People and Organisation Development member • Other interested employees
APPOINTMENT OF MEMBERS
• Membership will be reviewed annually in November with proposed changes agreed with the COO for the new year.
• Union representatives to be appointed by nominations from the respective unions and agreed by the COO • SANITI member to represent students. • All Safety, Health and Wellbeing representatives to be appointed in consultation with the COO • Safety, Health and Wellbeing representative(s) must be willing candidates with a passion for health and
safety.
MEETING PROCEDURES
The Safety, Health and Wellbeing Working Group will meet every second month.
Four committee members must be present to make up a quorum for meetings.
Committee meeting minutes will be sent to the Safety, Health and Wellbeing Leadership Group for their receipt and review.
REFERENCES
INTERNAL Safety, Health and Wellbeing Policy NMIT Health and Safety Manual Safety, Health and Wellbeing Leadership Group Terms of Reference Smokefree Policy
EXTERNAL
Health and Safety at Work Act 2015
RECORDS
Safety, Health and Wellbeing Working Group Minutes
Council Open Agenda - 11 May 2017 - Safety, Health & Wellbeing
24

Controlled Document – Refer to NMIT website or intranet for latest version
HEALTH AND SAFETY COMMITTEE (HSC) TERMS OF
REFERENCE
Section Safety, Health and Wellbeing Approval Date 26.10.2016 Approved by Directorate Next Review 26.10.2018 Responsibility Chief Operating Officer Last Reviewed n/a Key Evaluation Question 6
5 of 5 Health and Safety Committee Terms of Reference Controlled Document – Refer to NMIT website or intranet for latest version Printed 5/05/2017 10:38 AM
PURPOSE
To bring together workers and management in the development and review of health and safety policies and procedures for the workplace. To enable management and worker representatives to meet regularly and work cooperatively to improve health and safety at work.
SCOPE
This terms of reference document applies to all Institute workers from all work sites. There will be one HSC for all work i.e. Nelson, Marlborough, Woodbourne and Global Campus.
DEFINITIONS
Health and Safety at Work Act 2015 (HSWA)
HSWA is the work health and safety legislation in New Zealand. All work and workplaces are covered by HSWA unless specifically excluded. Part 3 of HSWA covers worker engagement, participation and representation.
Health and Safety Representative (HSR)
A Health and Safety Representative (HSR) is a worker elected by the members of their work group to represent them in health and safety matters, in accordance with subpart 2 of Part 3 of HSWA.
RESPONSIBILITY
Chief Executive • Overall responsibility for health and safety within the Institute • Ensure there is appropriate support and resources available for the
implementation and management of health and safety within the Institute.
Institute • Consult with the HSC about health and safety matters
Council Open Agenda - 11 May 2017 - Safety, Health & Wellbeing
25

Page 2 of 5 Health and Safety Committee Terms of Reference Controlled Document – Refer to NMIT website or intranet for latest version Printed 5/05/2017 10:38 AM
• Allow each member of the HSC to spend as much time as necessary to attend meetings or carry out functions as a member of the committee
• Provide the HSC with any necessary information to perform its functions, including information relating to hazards and the health and safety of workers at the workplace
• Allow HSR training to elected representatives to ensure they are knowledgeable about health and safety legislation and aware of rights and responsibilities
• Provide easy access to a list of HSRs
HSC • Assist in developing standards, rules, and policies or procedures for work health and safety
• Facilitate cooperation between the Institute and staff and students in instigating, developing and carrying out measures designed to ensure workers’ health and safety at work.
• Make recommendations relating to work health and safety • Assist with reviews to ensure compliance with the Institute’s health and safety
policies and procedures and Accident Compensation Corporation Workplace Safety Management Practices (ACC WSMP) standards
HSR • Represent workers on health and safety matters • Make recommendations on health and safety • Investigate complaints and risks to worker health and safety • Monitor health and safety measures taken by the Institute • Give feedback to the Institute about the Institute meeting its duty • Give feedback to workers on health and safety activities of the Institute • If requested by a worker, attend interviews concerning work health and safety
matters and assist with arrangements for rehabilitation and return to work • If received appropriate HSR training, and after first consulting with the Institute,
issue Provisional Improvement Notices (PINs) and direct workers to cease unsafe work
MEMBERSHIP
The right mix of members means that the HSC will have the necessary level of decision making, knowledge and expertise about company policy, direction and technical matters. There should be representation for different types of work arrangements, work groups, work sites and work roles.
One of the members of a HSC appointed by the Institute must be authorised to make decisions on behalf of the Institute on health and safety matters.
At least half of the members of a HSC must be elected HSRs and not appointed by the Institute.
Each HSR is eligible to be an HSC member, however numbers in the HSC may be limited so that not all HSRs are members of an HSC.
Worker representatives may come from HSR work groups – see Appendix 1. The work groups will be reviewed annually.
Council Open Agenda - 11 May 2017 - Safety, Health & Wellbeing
26

Page 3 of 5 Health and Safety Committee Terms of Reference Controlled Document – Refer to NMIT website or intranet for latest version Printed 5/05/2017 10:38 AM
Other members may include:
• Health and Safety Manager • Health and Safety Administrator • Representative from each union • Student representative
The HSC may co-opt additional member(s) should a specific need arise or specific skill is required
APPOINTMENT OF MEMBERS
• Membership will be reviewed annually in November with proposed changes agreed with the COO for the new year
• Union representatives to be appointed by the respective unions and agreed by the COO • Student representative to be appointed by SANITI • All HSRs to be appointed through an election process. • Election process for HSRs steps are:
o Calling for nominations within the work group (workers can nominate themselves or others within their work group)
o Candidates must be willing, have a passion for health and safety and work sufficiently regularly and for sufficient duration to enable them to carry out their functions effectively
o If the number of candidates nominated for a work group is equal to or fewer than the number of vacancies the candidates will be elected unopposed
o If the number of candidates nominated for a work group is greater than the number of vacancies, an election is held so that workers can choose who they would like to represent them
o The preferred form of voting for an election is by electronic vote, however other forms of voting are acceptable, (e.g. show of hands, ballot box, secret ballot) and secret ballot must be used if requested by a worker in the work group, or a candidate or the Institute
o Work group members will be notified of the successful candidate(s)
PROCEDURE
The Health and Safety Committee will meet once a month except for January.
Six committee members must be present to make up a quorum for meetings.
Committee meeting minutes will be sent to the Safety, Health and Wellbeing Leadership and Working Groups for their receipt and review and be published on the intranet.
RECORDS
Health and Safety Committee Minutes
Council Open Agenda - 11 May 2017 - Safety, Health & Wellbeing
27
Page 4 of 5 Health and Safety Committee Terms of Reference Controlled Document – Refer to NMIT website or intranet for latest version Printed 5/05/2017 10:38 AM
REFERENCES
INTERNAL Safety, Health and Wellbeing Policy Health and Safety Manual Safety, Health and Wellbeing Leadership Group Terms of Reference Safety, Health and Wellbeing Working Group Terms of Reference Smokefree Policy
EXTERNAL Health and Safety at Work Act 2015 Worker Engagement, Participation and Representation Regulations 2016
APPENDICES
APPENDIX 1: Work groups for HSR elections
Council Open Agenda - 11 May 2017 - Safety, Health & Wellbeing
28
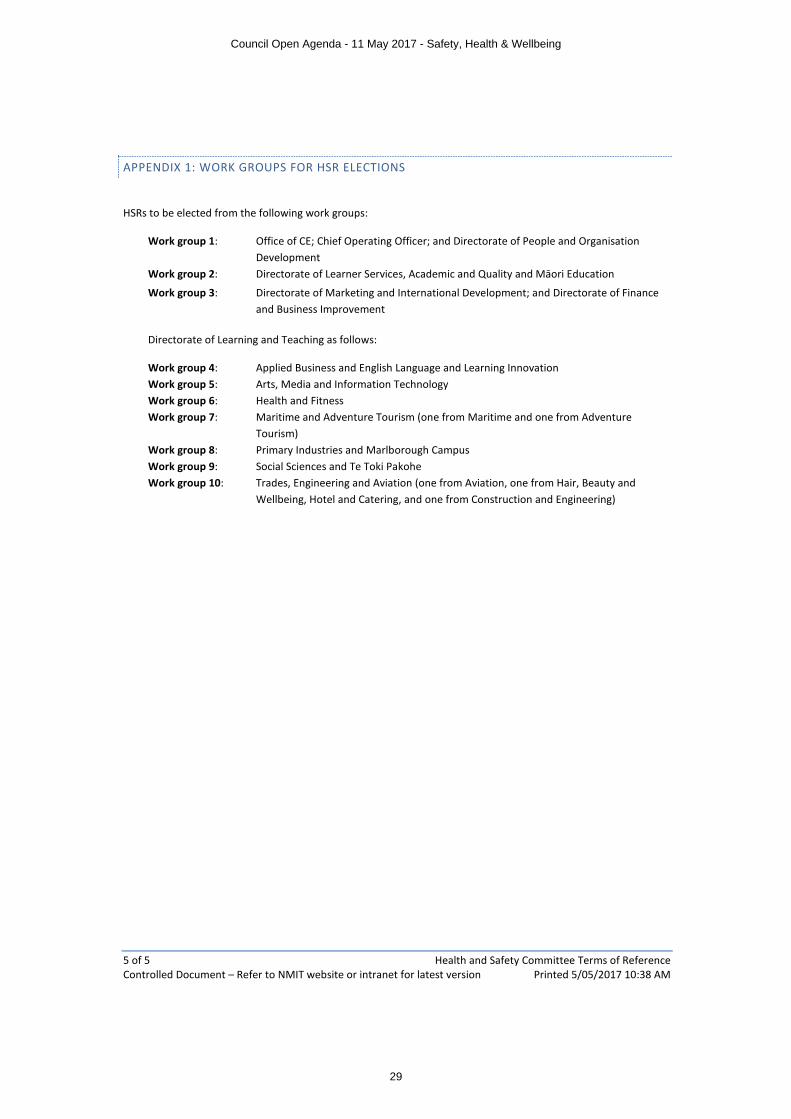
APPENDIX 1: WORK GROUPS FOR HSR ELECTIONS
5 of 5 Health and Safety Committee Terms of Reference Controlled Document – Refer to NMIT website or intranet for latest version Printed 5/05/2017 10:38 AM
HSRs to be elected from the following work groups:
Work group 1: Office of CE; Chief Operating Officer; and Directorate of People and Organisation Development
Work group 2: Directorate of Learner Services, Academic and Quality and Māori Education
Work group 3: Directorate of Marketing and International Development; and Directorate of Finance and Business Improvement
Directorate of Learning and Teaching as follows:
Work group 4: Applied Business and English Language and Learning Innovation Work group 5: Arts, Media and Information Technology Work group 6: Health and Fitness Work group 7: Maritime and Adventure Tourism (one from Maritime and one from Adventure
Tourism) Work group 8: Primary Industries and Marlborough Campus Work group 9: Social Sciences and Te Toki Pakohe Work group 10: Trades, Engineering and Aviation (one from Aviation, one from Hair, Beauty and
Wellbeing, Hotel and Catering, and one from Construction and Engineering)
Council Open Agenda - 11 May 2017 - Safety, Health & Wellbeing
29
NMIT Action Plan following ACC WSMP Audit Page 1 of 3
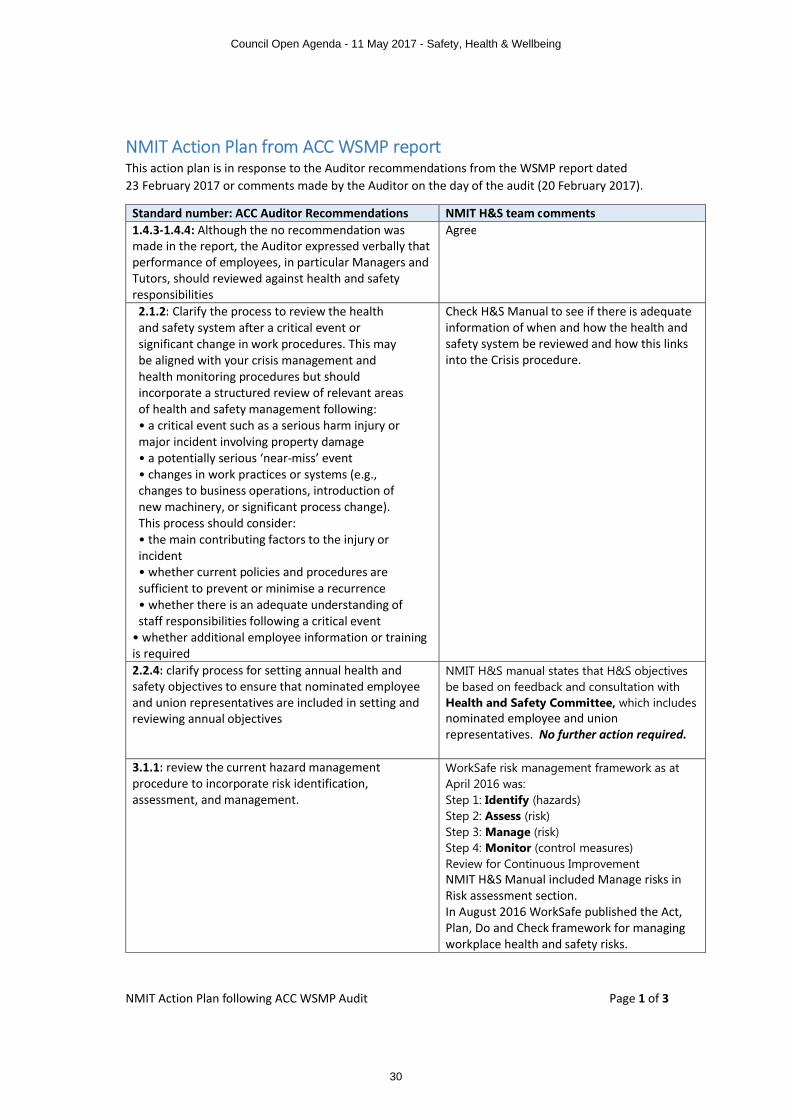
NMIT Action Plan from ACC WSMP reportThis action plan is in response to the Auditor recommendations from the WSMP report dated 23 February 2017 or comments made by the Auditor on the day of the audit (20 February 2017).
Standard number: ACC Auditor Recommendations NMIT H&S team comments1.4.3-1.4.4: Although the no recommendation was made in the report, the Auditor expressed verbally that performance of employees, in particular Managers and Tutors, should reviewed against health and safety responsibilities
Agree
2.1.2: Clarify the process to review the health and safety system after a critical event or significant change in work procedures. This may be aligned with your crisis management and health monitoring procedures but should incorporate a structured review of relevant areas of health and safety management following:• a critical event such as a serious harm injury or major incident involving property damage• a potentially serious ‘near-miss’ event• changes in work practices or systems (e.g., changes to business operations, introduction of new machinery, or significant process change).This process should consider:• the main contributing factors to the injury or incident• whether current policies and procedures are sufficient to prevent or minimise a recurrence• whether there is an adequate understanding of staff responsibilities following a critical event
• whether additional employee information or training is required
Check H&S Manual to see if there is adequate information of when and how the health and safety system be reviewed and how this links into the Crisis procedure.
2.2.4: clarify process for setting annual health and safety objectives to ensure that nominated employee and union representatives are included in setting and reviewing annual objectives
NMIT H&S manual states that H&S objectives be based on feedback and consultation withHealth and Safety Committee, which includes nominated employee and union representatives. No further action required.
3.1.1: review the current hazard management procedure to incorporate risk identification, assessment, and management.
WorkSafe risk management framework as at April 2016 was:Step 1: Identify (hazards)Step 2: Assess (risk)Step 3: Manage (risk)Step 4: Monitor (control measures)Review for Continuous ImprovementNMIT H&S Manual included Manage risks in Risk assessment section.In August 2016 WorkSafe published the Act, Plan, Do and Check framework for managing workplace health and safety risks.
Council Open Agenda - 11 May 2017 - Safety, Health & Wellbeing
30
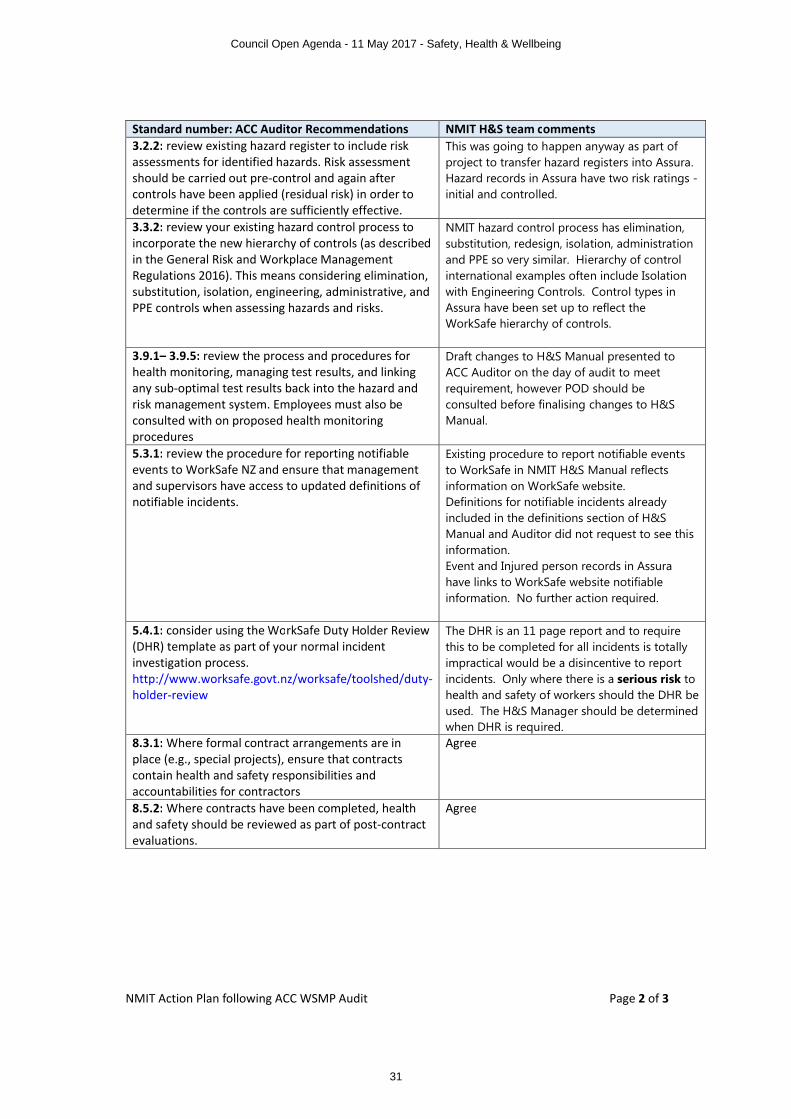
NMIT Action Plan following ACC WSMP Audit Page 2 of 3
Standard number: ACC Auditor Recommendations NMIT H&S team comments3.2.2: review existing hazard register to include risk assessments for identified hazards. Risk assessment should be carried out pre-control and again after controls have been applied (residual risk) in order to determine if the controls are sufficiently effective.
This was going to happen anyway as part of project to transfer hazard registers into Assura. Hazard records in Assura have two risk ratings -initial and controlled.
3.3.2: review your existing hazard control process to incorporate the new hierarchy of controls (as described in the General Risk and Workplace Management Regulations 2016). This means considering elimination, substitution, isolation, engineering, administrative, and PPE controls when assessing hazards and risks.
NMIT hazard control process has elimination, substitution, redesign, isolation, administration and PPE so very similar. Hierarchy of control international examples often include Isolation with Engineering Controls. Control types in Assura have been set up to reflect the WorkSafe hierarchy of controls.
3.9.1– 3.9.5: review the process and procedures for health monitoring, managing test results, and linking any sub-optimal test results back into the hazard and risk management system. Employees must also be consulted with on proposed health monitoring procedures
Draft changes to H&S Manual presented to ACC Auditor on the day of audit to meet requirement, however POD should be consulted before finalising changes to H&S Manual.
5.3.1: review the procedure for reporting notifiable events to WorkSafe NZ and ensure that management and supervisors have access to updated definitions of notifiable incidents.
Existing procedure to report notifiable events to WorkSafe in NMIT H&S Manual reflects information on WorkSafe website. Definitions for notifiable incidents already included in the definitions section of H&S Manual and Auditor did not request to see this information.Event and Injured person records in Assura have links to WorkSafe website notifiable information. No further action required.
5.4.1: consider using the WorkSafe Duty Holder Review (DHR) template as part of your normal incident investigation process.http://www.worksafe.govt.nz/worksafe/toolshed/duty-holder-review
The DHR is an 11 page report and to require this to be completed for all incidents is totally impractical would be a disincentive to report incidents. Only where there is a serious risk to health and safety of workers should the DHR be used. The H&S Manager should be determined when DHR is required.
8.3.1: Where formal contract arrangements are in place (e.g., special projects), ensure that contracts contain health and safety responsibilities and accountabilities for contractors
Agree
8.5.2: Where contracts have been completed, health and safety should be reviewed as part of post-contract evaluations.
Agree
Council Open Agenda - 11 May 2017 - Safety, Health & Wellbeing
31
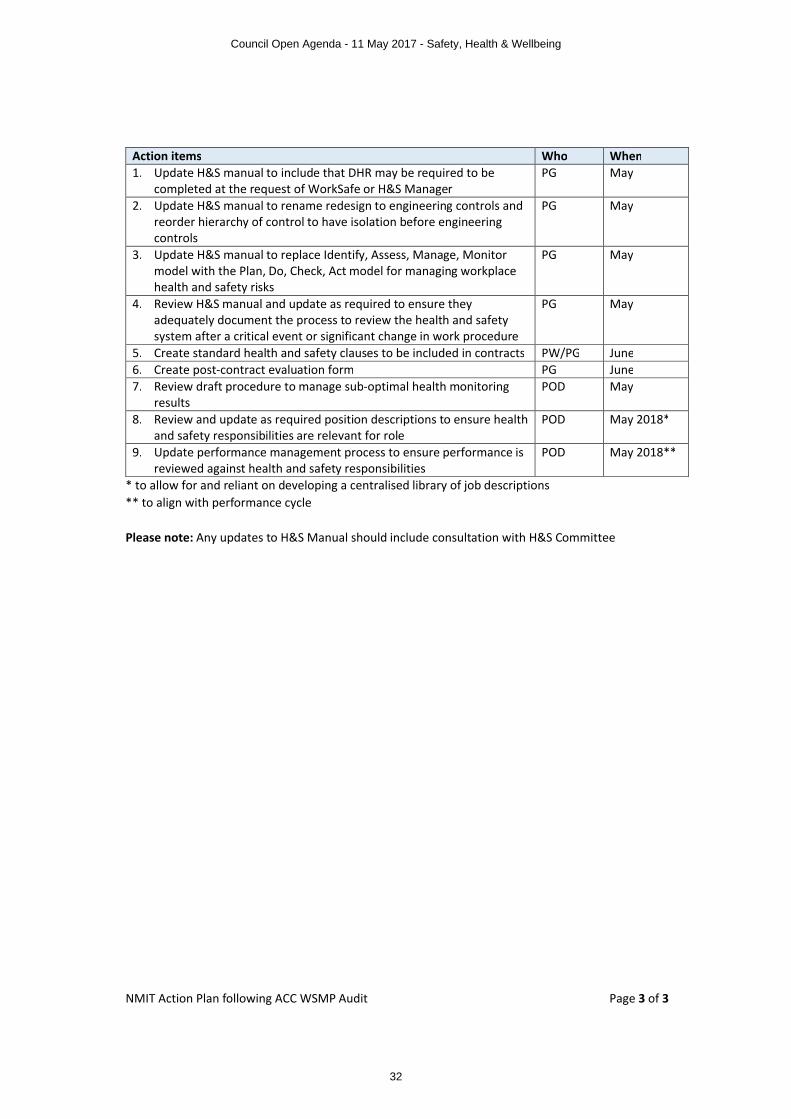
NMIT Action Plan following ACC WSMP Audit Page 3 of 3
Action items Who When1. Update H&S manual to include that DHR may be required to be
completed at the request of WorkSafe or H&S ManagerPG May
2. Update H&S manual to rename redesign to engineering controls and reorder hierarchy of control to have isolation before engineering controls
PG May
3. Update H&S manual to replace Identify, Assess, Manage, Monitor model with the Plan, Do, Check, Act model for managing workplace health and safety risks
PG May
4. Review H&S manual and update as required to ensure they adequately document the process to review the health and safety system after a critical event or significant change in work procedure
PG May
5. Create standard health and safety clauses to be included in contracts PW/PG June6. Create post-contract evaluation form PG June7. Review draft procedure to manage sub-optimal health monitoring
resultsPOD May
8. Review and update as required position descriptions to ensure health and safety responsibilities are relevant for role
POD May 2018*
9. Update performance management process to ensure performance is reviewed against health and safety responsibilities
POD May 2018**
* to allow for and reliant on developing a centralised library of job descriptions** to align with performance cycle
Please note: Any updates to H&S Manual should include consultation with H&S Committee
Council Open Agenda - 11 May 2017 - Safety, Health & Wellbeing
32

REPORT TO NMIT COUNCIL | 11 MAY 2017 ITEM 10 DEVELOPMENT OF FUTURE POWER BI DASHBOARDS PREPARED BY TONY GRAY (CHIEF EXECUTIVE) PURPOSE
To provide Council with an update on the development of NMIT’s dashboard development activity. RECOMMENDATION
Council notes for information the continued development of dashboards as a significant tool in NMIT’s monitoring and reviewing of significant operational and strategic activity. CONTEXT
Colleagues in the Finance and Business Improvement Team have responded to NMIT’s need for an easy to use visual and ‘single version of the truth’ overview of KPI’s and operational delivery at NMIT. Power BI was chosen as the best platform for this development.
Council Open Agenda - 11 May 2017 - Strategic
33
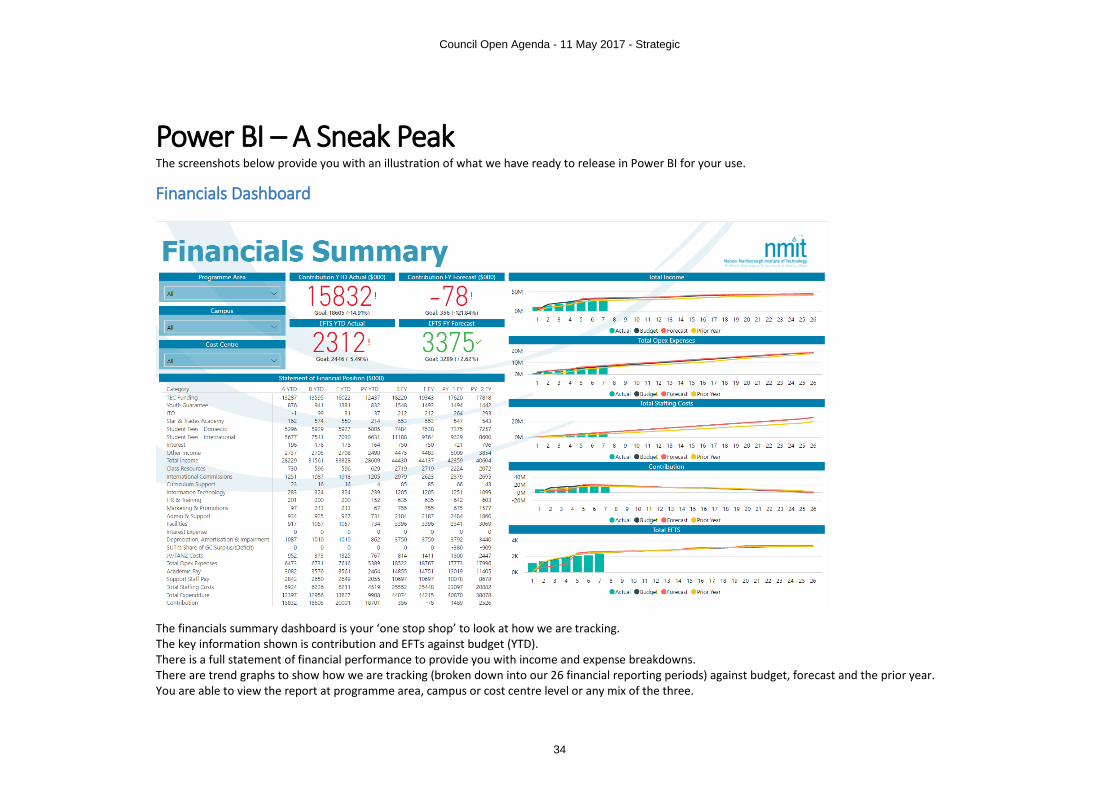
Power BI – A Sneak Peak The screenshots below provide you with an illustration of what we have ready to release in Power BI for your use.
Financials Dashboard
The financials summary dashboard is your ‘one stop shop’ to look at how we are tracking. The key information shown is contribution and EFTs against budget (YTD). There is a full statement of financial performance to provide you with income and expense breakdowns. There are trend graphs to show how we are tracking (broken down into our 26 financial reporting periods) against budget, forecast and the prior year. You are able to view the report at programme area, campus or cost centre level or any mix of the three.
Council Open Agenda - 11 May 2017 - Strategic
34

SARS
The SARS dashboard is your summary of what is happening with your actions and goals. The report shows the total actions and goals currently in progress and lets you know if there are any that do not have KEQ attached. The report provides a summary of the actions and goals showing if they are overdue and what their progress is. There is a summary of which KEQs are covered by your actions and goals and a funnel chart to show you when each of the actions and goals is due, allowing you to see potential workload issues. Finally, the report provides a summary of actions and goals by the SAR owner. The report can be reviewed by programme area and then by organisation within the chosen programme area.
Council Open Agenda - 11 May 2017 - Strategic
35
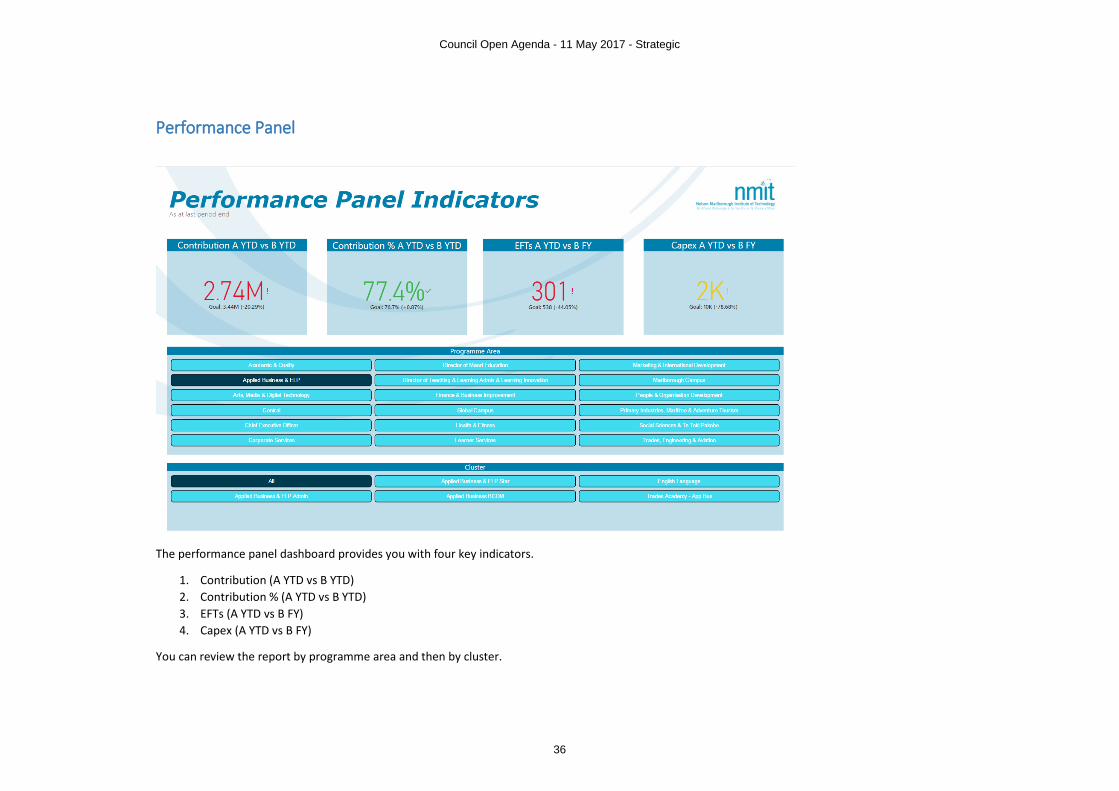
Performance Panel
The performance panel dashboard provides you with four key indicators.
1. Contribution (A YTD vs B YTD) 2. Contribution % (A YTD vs B YTD) 3. EFTs (A YTD vs B FY) 4. Capex (A YTD vs B FY)
You can review the report by programme area and then by cluster.
Council Open Agenda - 11 May 2017 - Strategic
36

Blue Tick
The Blue Tick dashboard provides an overview of what is happening in the programme development space. The report provides visuals showing the programmes being developed and what stage of development these are at, the date the programme is scheduled for delivery and when each of the milestones are due for completion. You can view the report by programme area and then by programme sub area.
Council Open Agenda - 11 May 2017 - Strategic
37
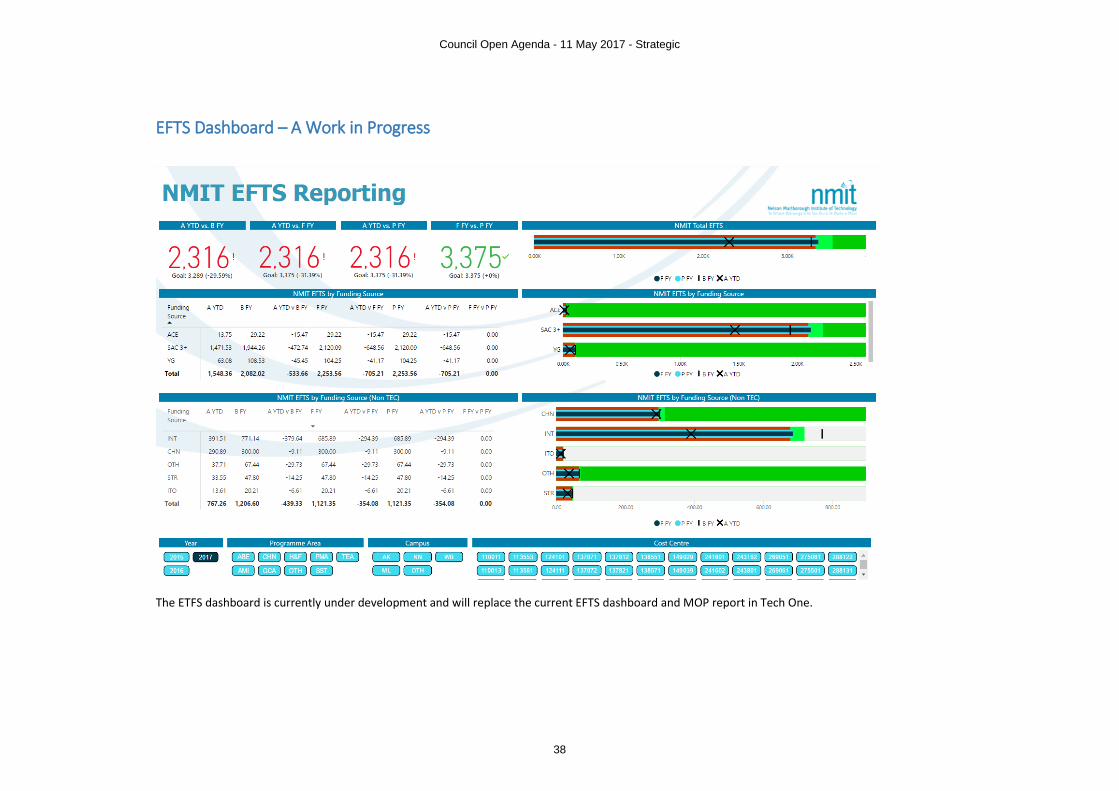
EFTS Dashboard – A Work in Progress
The ETFS dashboard is currently under development and will replace the current EFTS dashboard and MOP report in Tech One.
Council Open Agenda - 11 May 2017 - Strategic
38
CHIEF EXECUTIVE’S REPORT – OPEN
11 May 2017
External Evaluation and Review (EER)
Our NZQA External Evaluation and Review was completed on 5 April 2017; we have continued to provide the Lead Evaluator with additional evidence. Feedback at the end of the evaluation included:
Strengths:
∑ Overall achievement is generally strong
∑ Outcomes are strong particularly strong in some areas
∑ Good employment outcomes across a number of areas
∑ Strong and purposeful industry engagement
∑ Industry Advisory activity is useful and meaningful to curriculum design and planning
∑ LDF and Blue Tick is a real plus
∑ PLATO and Learning Walks have been a welcomed and valuable introduction having a positive impact
∑ Good evidence of theory and practical learning taking place in the classroom
∑ Te Ara Wai is a positive initiative, picked up and supported at management level
∑ Student voice is gathered and listened to; they liked ‘talking walls’
∑ Good strong relationship with Saniti, a strong and articulate Student President
∑ Staff are passionate, well connected, committed and care about their learners and know them
∑ ILPs are consistent and systematic and contribute well to progress learners make
∑ International Code is well managed
∑ Positive to hear about the overall increase of International learner success
∑ Global Campus is clearly a positive extension to International Strategy
∑ Council is well engaged and have a good understanding of Strengths and Areas for Improvement. They receive ever improving information on progress and all seem to be on the same page. We like the Strategy ‘one pager’ approach!
∑ International and central Learner Services appear to be working well
∑ Staff very supportive about the communication and approach of leadership
∑ Compliance is really well managed and monitored – it’s really effective
∑ New initiatives and systems have been really effective∑ Purpose and direction of NMIT is really, really, clear
Potential Areas for Improvement – and so an opportunity for us to provide additional evidence:
∑ Achievement could be better analysed
∑ International achievement lacks some data
∑ Some achievement gaps for Maori in several programme areas
∑ Capturing of graduate destination data and the impact of their learning on their destination
Council Open Agenda - 11 May 2017 - Performance Reporting
39

CHIEF EXECUTIVE’S REPORT - OPEN | 11 MAY 2017 PAGE 2 OF 2
∑ Te Ara Wai in programme areas is variable
∑ Needs of Maori learners are not always well matched with achievement data
∑ Student surveys still work in progress and need to be optimised
∑ Earlier identification of ‘at risk’ learners to ensure directed support is offered soon enough and its tracked well
At the time of writing we have been informed that the draft report will be with us by 30 May 2017, we will then have 10 working days to respond to the draft report.
Employee Engagement Survey
Our NMIT Employee Engagement Survey (delivered via Gallup) was launched on 2 May, with a closing date of 22 May. We are looking to both increase participation in the survey from 74% in 2016 and show progress against the twelve measurement questions.
TEC Investment Approach
The TEC has updated its ‘Investment Approach’ strategy and provided an overview diagram (attached) for discussion. TEC will be holding a series of development sessions with the Tertiary sector (Universities, ITPs, PTEs and ITOs) to consult and further development the ‘Investment Approach’. Key elements look to include the development of a ‘Capability Framework’ to be a major element of any ‘investment’ decision making and the further use of ‘big data’ and ‘single versions of the truth’.
Council Open Agenda - 11 May 2017 - Performance Reporting
40
REPORT TO NMIT COUNCIL | 11 MAY 2017 ITEM 12 EFTS AND FINANCIAL UPDATES AS AT 23 APRIL 2017 PREPARED BY VICKI BRYSON (DIRECTOR FINANCE & BUSINESS IMPROVEMENT) PURPOSE
To provide Council with an EFTS and Financial update as at 23 April 2017. RECOMMENDATION
That the Council receives these reports for information and discussion. CONTEXT
Council receives financial and EFTS reports at each meeting. Reports provide a dashboard and commentary analysis on budget and Mix of Provision status at NMIT.
Council Open Agenda - 11 May 2017 - Performance Reporting
41
Nelson & Marlborough Institute of Technology
EFTS Reporting 23 April 2017
Council Open Agenda - 11 May 2017 - Performance Reporting
42

EFTS Reporting
2
Council Open Agenda - 11 May 2017 - Performance Reporting
43
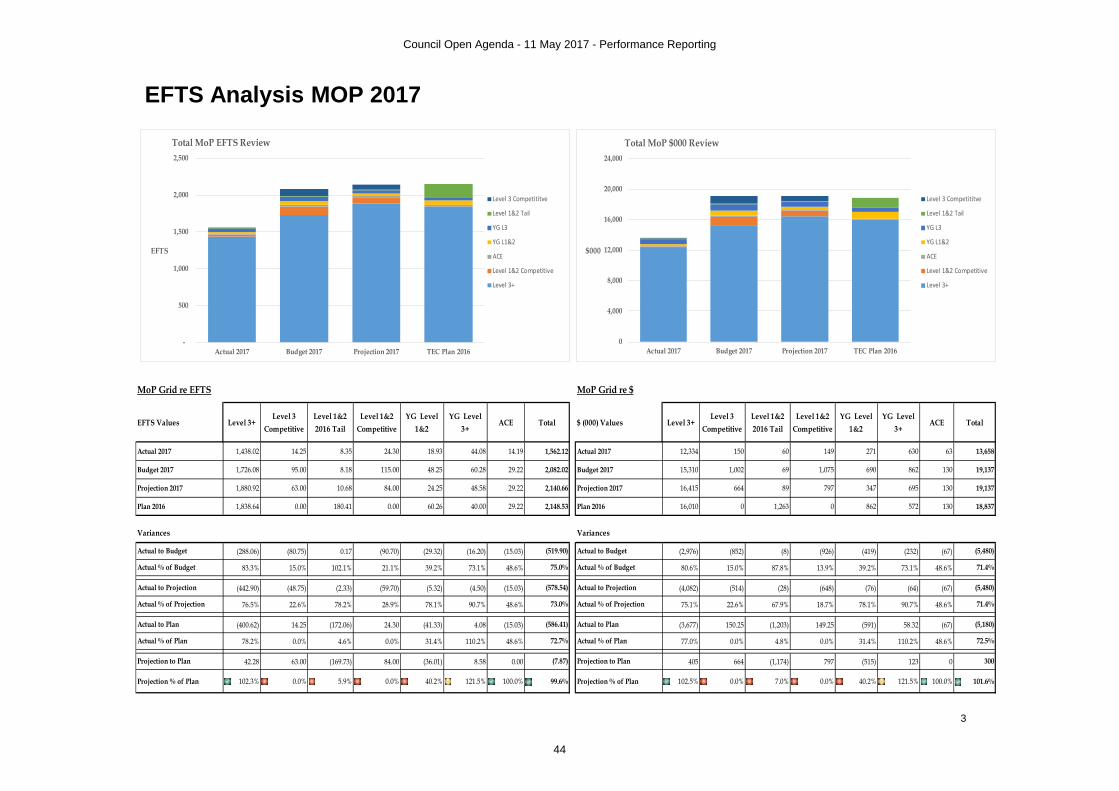
EFTS Analysis MOP 2017
3
MoP Grid re EFTS MoP Grid re $
EFTS Values Level 3+Level 3
CompetitiveLevel 1&2 2016 Tail
Level 1&2 Competitive
YG Level 1&2
YG Level 3+
ACE Total $ (000) Values Level 3+Level 3
CompetitiveLevel 1&2 2016 Tail
Level 1&2 Competitive
YG Level 1&2
YG Level 3+
ACE Total
Actual 2017 1,438.02 14.25 8.35 24.30 18.93 44.08 14.19 1,562.12 Actual 2017 12,334 150 60 149 271 630 63 13,658
Budget 2017 1,726.08 95.00 8.18 115.00 48.25 60.28 29.22 2,082.02 Budget 2017 15,310 1,002 69 1,075 690 862 130 19,137
Projection 2017 1,880.92 63.00 10.68 84.00 24.25 48.58 29.22 2,140.66 Projection 2017 16,415 664 89 797 347 695 130 19,137
Plan 2016 1,838.64 0.00 180.41 0.00 60.26 40.00 29.22 2,148.53 Plan 2016 16,010 0 1,263 0 862 572 130 18,837
Variances Variances
Actual to Budget (288.06) (80.75) 0.17 (90.70) (29.32) (16.20) (15.03) (519.90) Actual to Budget (2,976) (852) (8) (926) (419) (232) (67) (5,480)
Actual % of Budget 83.3% 15.0% 102.1% 21.1% 39.2% 73.1% 48.6% 75.0% Actual % of Budget 80.6% 15.0% 87.8% 13.9% 39.2% 73.1% 48.6% 71.4%
Actual to Projection (442.90) (48.75) (2.33) (59.70) (5.32) (4.50) (15.03) (578.54) Actual to Projection (4,082) (514) (28) (648) (76) (64) (67) (5,480)
Actual % of Projection 76.5% 22.6% 78.2% 28.9% 78.1% 90.7% 48.6% 73.0% Actual % of Projection 75.1% 22.6% 67.9% 18.7% 78.1% 90.7% 48.6% 71.4%
Actual to Plan (400.62) 14.25 (172.06) 24.30 (41.33) 4.08 (15.03) (586.41) Actual to Plan (3,677) 150.25 (1,203) 149.25 (591) 58.32 (67) (5,180)
Actual % of Plan 78.2% 0.0% 4.6% 0.0% 31.4% 110.2% 48.6% 72.7% Actual % of Plan 77.0% 0.0% 4.8% 0.0% 31.4% 110.2% 48.6% 72.5%
Projection to Plan 42.28 63.00 (169.73) 84.00 (36.01) 8.58 0.00 (7.87) Projection to Plan 405 664 (1,174) 797 (515) 123 0 300
Projection % of Plan 102.3% 0.0% 5.9% 0.0% 40.2% 121.5% 100.0% 99.6% Projection % of Plan 102.5% 0.0% 7.0% 0.0% 40.2% 121.5% 100.0% 101.6%
-
500
1,000
1,500
2,000
2,500
Actual 2017 Budget 2017 Projection 2017 TEC Plan 2016
EFTS
Total MoP EFTS Review
Level 3 Competititve
Level 1&2 Tail
YG L3
YG L1&2
ACE
Level 1&2 Competitive
Level 3+
0
4,000
8,000
12,000
16,000
20,000
24,000
Actual 2017 Budget 2017 Projection 2017 TEC Plan 2016
$000
Total MoP $000 Review
Level 3 Competititve
Level 1&2 Tail
YG L3
YG L1&2
ACE
Level 1&2 Competitive
Level 3+
Council Open Agenda - 11 May 2017 - Performance Reporting
44

Nelson & Marlborough Institute of Technology
Financial Reporting & AnalysisFor Period Ending 23 April 2017 (Period 8)
Vicki Bryson : Finance Director
Council Open Agenda - 11 May 2017 - Performance Reporting
45
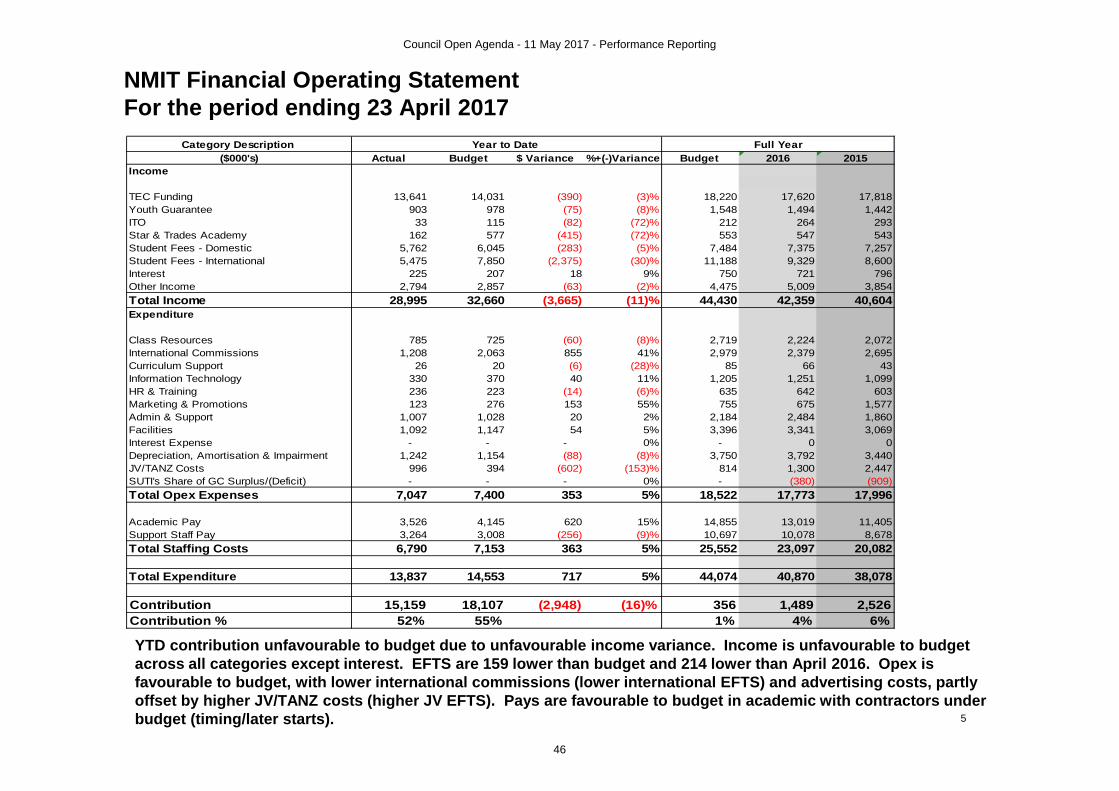
NMIT Financial Operating StatementFor the period ending 23 April 2017
YTD contribution unfavourable to budget due to unfavourable income variance. Income is unfavourable to budget across all categories except interest. EFTS are 159 lower than budget and 214 lower than April 2016. Opex is favourable to budget, with lower international commissions (lower international EFTS) and advertising costs, partly offset by higher JV/TANZ costs (higher JV EFTS). Pays are favourable to budget in academic with contractors under budget (timing/later starts). 5
Category Description Full Year ($000's) Actual Budget $ Variance %+(-)Variance Budget 2016 2015
Income
TEC Funding 13,641 14,031 (390) (3)% 18,220 17,620 17,818Youth Guarantee 903 978 (75) (8)% 1,548 1,494 1,442ITO 33 115 (82) (72)% 212 264 293Star & Trades Academy 162 577 (415) (72)% 553 547 543Student Fees - Domestic 5,762 6,045 (283) (5)% 7,484 7,375 7,257Student Fees - International 5,475 7,850 (2,375) (30)% 11,188 9,329 8,600Interest 225 207 18 9% 750 721 796Other Income 2,794 2,857 (63) (2)% 4,475 5,009 3,854Total Income 28,995 32,660 (3,665) (11)% 44,430 42,359 40,604Expenditure
Class Resources 785 725 (60) (8)% 2,719 2,224 2,072International Commissions 1,208 2,063 855 41% 2,979 2,379 2,695Curriculum Support 26 20 (6) (28)% 85 66 43Information Technology 330 370 40 11% 1,205 1,251 1,099HR & Training 236 223 (14) (6)% 635 642 603Marketing & Promotions 123 276 153 55% 755 675 1,577Admin & Support 1,007 1,028 20 2% 2,184 2,484 1,860Facilities 1,092 1,147 54 5% 3,396 3,341 3,069Interest Expense - - - 0% - 0 0Depreciation, Amortisation & Impairment 1,242 1,154 (88) (8)% 3,750 3,792 3,440JV/TANZ Costs 996 394 (602) (153)% 814 1,300 2,447SUTI's Share of GC Surplus/(Deficit) - - - 0% - (380) (909)Total Opex Expenses 7,047 7,400 353 5% 18,522 17,773 17,996
Academic Pay 3,526 4,145 620 15% 14,855 13,019 11,405Support Staff Pay 3,264 3,008 (256) (9)% 10,697 10,078 8,678Total Staffing Costs 6,790 7,153 363 5% 25,552 23,097 20,082
Total Expenditure 13,837 14,553 717 5% 44,074 40,870 38,078
Contribution 15,159 18,107 (2,948) (16)% 356 1,489 2,526Contribution % 52% 55% 1% 4% 6%
Year to Date
Council Open Agenda - 11 May 2017 - Performance Reporting
46

Global Campus Financial Operating StatementFor the period ending 23 April 2017
Contribution $(0.7)m unfavourable to budget, due to lower EFTS recruitment in 2016 coming through as tail. Unfavourable income variance is partly offset by savings in commission and staffing costs.
6
Category Description Full Year ($000's) Actual Budget $ Variance %+(-)Variance Budget 2016 2015
Income
Student Fees - International 1,384 2,966 (1,582) (53)% 4,838 2,551 825Interest 1 - 1 0% - 14 11Other Income 0 8 (7) (95)% 25 6 4Total Income 1,385 2,974 (1,589) (53)% 4,863 2,571 840Expenditure
Class Resources 3 39 35 92% 159 25 (64)International Commissions 149 715 566 79% 1,169 431 476Curriculum Support - 1 1 100% 3 - - Information Technology 8 9 1 14% 29 63 52HR & Training 7 4 (3) (68)% 13 2 2Marketing & Promotions 2 56 54 97% 67 19 35Admin & Support 28 73 45 61% 230 210 205Facilities 398 391 (6) (2)% 1,190 1,062 976Depreciation, Amortisation & Impairment 41 - (41) 0% - 137 111SUTI's Share of Surplus/(Deficit) - - - 0% - (380) (909)Total Opex Expenses 635 1,287 651 51% 2,858 1,568 885
Academic Pay 215 452 237 52% 1,616 803 220Support Staff Pay 168 151 (17) (11)% 540 580 528Total Staffing Costs 383 603 220 37% 2,157 1,383 748
Total Expenditure 1,018 1,890 872 46% 5,014 2,951 1,633
Contribution 367 1,084 (717) (66)% (151) (380) (793)Contribution % 26% 36% -3% -15% -94%
Year to Date
Council Open Agenda - 11 May 2017 - Performance Reporting
47

NMIT Executive Summary
7
Financials FTE & Pays Programme Areas
$000 A YTD B YTD ApB - Applied Business & ELP
Surplus 15,159 18,107 Trd - Trades, Engineering & Aviation
Surplus % 52% 55% AMI - Arts, Media & IT
NMIT cash & bank 22,281 27,627 SS - Social Sciences
SAC EFTS31,509 1,495 Hea - Health
SAC Funding313,542 13,951 PI - Primary Industries, Maritime & AVT
Pays 6,790 7,153 GC - Global Campus
S/C&C - Sub Contract & China
Contrib'n var $ ApB Trd AMI SS Hea PI GC Team Pays var $ ApB Trd AMI SS Hea PI GC Team
Actual to budget Actual to budget
Var A v B ($000) (1,160) (432) (281) (54) (178) (676) (717) 549 Var A v B ($000) 120 (16) 15 81 21 23 220 (101)
% to prev mnth % var to prev mnth
EFTS (enrolments) Debtors Capex Team Contribution Variance
SAC EFTS - YTD Actuals Int'l EFTS - YTD Actuals Other EFTS - YTD Actuals
DOTL (224)
CEO 120
Corporate Services 115
Central (15)
Marketing 283
DME (2)
Academic & Quality (67)
Learner Services 7
YTD Act 78% YTD Act 51% YTD Act 80% ML Campus (25)
FY B Var 22% FY B Var 49% FY B Var 20% Finance & Bus Proc Impr 42
A YTD B YTD POD (45)
SAC EFTS3,71,509 1,495 Ap Bus & ELP JV -
Int'l EFTS4392 553 Social Sciences JV 227
Other EFTS5460 472 Health JV 75
Total EFTS 2,361 2,520 TEC EPI's (year end position)6Pri Ind, Maritime & AVT JV 57
EFTS YTD ApB Trd AMI SS Hea PI GC S/C&C Ratio Mvmt Mvmt Mvmt Trades, Eng & Avi JV -
Actual to budget Viability Average Arts, Media & IT JV -
Var A v B (108) (6) (42) 5 (7) (24) (103) 125 Sustainability Average
Var to prev mnth
Notes Total 549
1. Reporting against budget 4. Excludes China 7. Includes enrolments with status ER14
2. Joint Venture surplus, pays & EFTS excluded from Programme Areas and included under Team and S/C&C 5. Includes China & ACE
3. Excludes ACE 6. 2016 TEC EPI's to be confirmed
3.9 4.1 4 4
2016A 2015A 2014A
3.5 4 4.7 4.2
2,520 2,529 (159) (159) (168)
2017B
553 531 (161) (161) (139)
472 462 (12) (12) (2)
F YTD P/Y YTD Var A v B Var A v F Var A v P/Y
1,495 1,536 14 14 (27)
7,179 5,849 363 389 (941)
1,717 1,536 14 (208) (27)
15,450 13,028 (409) (1,908) 514
52% 60% (3)% (0)% (8)%
27,627 23,360 (5,346) (5,346) (1,079)
F YTD P/Y YTD Var A v B Var A v F Var A v P/Y
17,110 17,979 (2,948) (1,952) (2,820)
-
1,000
2,000
3,000
4,000
5,000
Support Staff Academic
$000's Pays YTD
Actual YTD Budget YTD
0
500
1000
1500
2000
2500
3000
3500
4000
4500
5000
$000
'sCurrent 30+ days 60+ days 90+ days
$1,346
$2,828
0%
20%
40%
60%
80%
100%
Spent $000
Budget Remaining $000
Council Open Agenda - 11 May 2017 - Performance Reporting
48

8
Income : variance explanation
8
TEC funding – unfavourable to budget× SAC Funding unfavourable to budget with higher EFTS but different EFTS mix than budgeted.× YG Funding unfavourable to budget with lower EFTS than budgeted, particularly in Cert in TPI. Programmes with EFTS higher than budget include BIT $107k, MEC 3 & 4 $114k, Skipper Restricted Limits $404k, Superyacht $25k, JV STS Seafood
Proc $159k, Cert Auto Eng L4 $99k, Nat Cert Carpentry $114k, Cert in TPI (H&B) $24k, Trainee Ranger $25k, Dip Aquaculture Tech $28k, CAME $85k, Dip Aero Cert $25k, Cert AVT $71k, Intl Culinary Arts Dip $24k, Prof Hair NN $146k, Prof Hair ML $20k, Bach Nursing Yr 3 $147k, COP NN $86k, JV SUTI COP $250k, JV SUTI Career Guidance $272k, JV Annesbrook $133k, Te Tuara $34k, Te Haeata $130k, Te Ata Hou L3+ $57k, PG Cert Supervision $20k, Bach Counselling $42k.
ₓ Programmes with EFTS below budget include BCom NN $(127)k, NZ Dip Bus $(34)k, First Line Mgmt $(22)k, Cert Computer Tech NN L3+ $(83)k, Cert Computer Tech L2 $(53)k, Cert Bus Admin NN L3+ $(49)k, Cert Bus Admin ML L3+ $(24)k, Nat Cert Retail L2 $(28)k, Nat Cert Retail L3 $(31)k, NZOW & NZOM $(99)k, CVP $(30)k, Cert Entry Auto Eng NN L3 $(176)k, Cert Entry Auto Eng ML L3 $(55)k, Dip Civil Eng $(81)k, Cert TPI NN $(97)k, Cert Carpentry ML $(81)k, Cert Hort NN $(144)k, Cert Hort ML $(192)k, NZ Cert Hort Prod NN $(37)k, NZ Cert Hort Prod ML $(79)k, BAMC $(129)k, PGDSA $(67)k, Dip AVT $(78)k, NZ Cert in Food & Bev $(22)k, Adv Prof Hair $(61)k, NZ Cert in Hosp $(49)k, Cert Adv Prof Hair $(73)k, Dip Fit Yr 1 $(127)k, Dip Fit Yr 2 $(30)k, Bach Nursing Yr 1 $(20)k, Bach Nursing Yrs 2 $(72)k, BAM $(36)k, Dip Interior Design $(27)k, Training Scheme Cr Ind $(72)k, Dip A&M $(51)k, Cert in Study & Career Prep $(113)k, ELP L2 $(28)k, ELP NZCEL $(80)k, ELP ILN $(183)k, CVS $264)k.
Student Fees (Domestic) – unfavourable to budget Programmes with fees higher than budget include Confucious & China NZ $31k, BIT $29k, MEC 3&4 $38k, Skipper Restricted Limits $38k, Maritime SC
$24k, Cert Auto Eng L4 $35k, CAME $38k, Cert AVT $36k, Prof Hair NN $95k, Bach Nursing Yr 3 $59k, JV Annesbrook Diploma $88k, Bach Counselling $34k.
× Programmes with fees below budget include BCom NN $(79)k, Cert Bus Admin L3 NN $(54)k, Dip FV Ops $(26)k, NZOW & NZOM $(44)k, Cert Entry Auto Eng L3 NN $(93)k, Cert Auto Eng L3 ML $(28)k, Dip Civil Eng $(38)k, Cert Carpentry ML $(39)k, Trainee Ranger $(46)k, BAMC $(29)k, Dip AVT $(49)k, Adv Prof Hair ML $(32)k, Cert Adv Prof Hair NN $(40)k, Dip Fit $(79)k, Bach Nursing Yr 2 $(30)k, BAM $(21)k, Dip A&M $(36)k, Cert in Study & Career Prep $(66)k.
Category Description Full Year ($000's) Actual Budget $ Variance %+(-)Variance Budget 2016 2015
Income
TEC Funding 13,641 14,031 (390) (3)% 18,220 17,620 17,818Youth Guarantee 903 978 (75) (8)% 1,548 1,494 1,442ITO 33 115 (82) (72)% 212 264 293Star & Trades Academy 162 577 (415) (72)% 553 547 543Student Fees - Domestic 5,762 6,045 (283) (5)% 7,484 7,375 7,257Student Fees - International 5,475 7,850 (2,375) (30)% 11,188 9,329 8,600Interest 225 207 18 9% 750 721 796Other Income 2,794 2,857 (63) (2)% 4,475 5,009 3,854Total Income 28,995 32,660 (3,665) (11)% 44,430 42,359 40,604
Year to Date
Council Open Agenda - 11 May 2017 - Performance Reporting
49
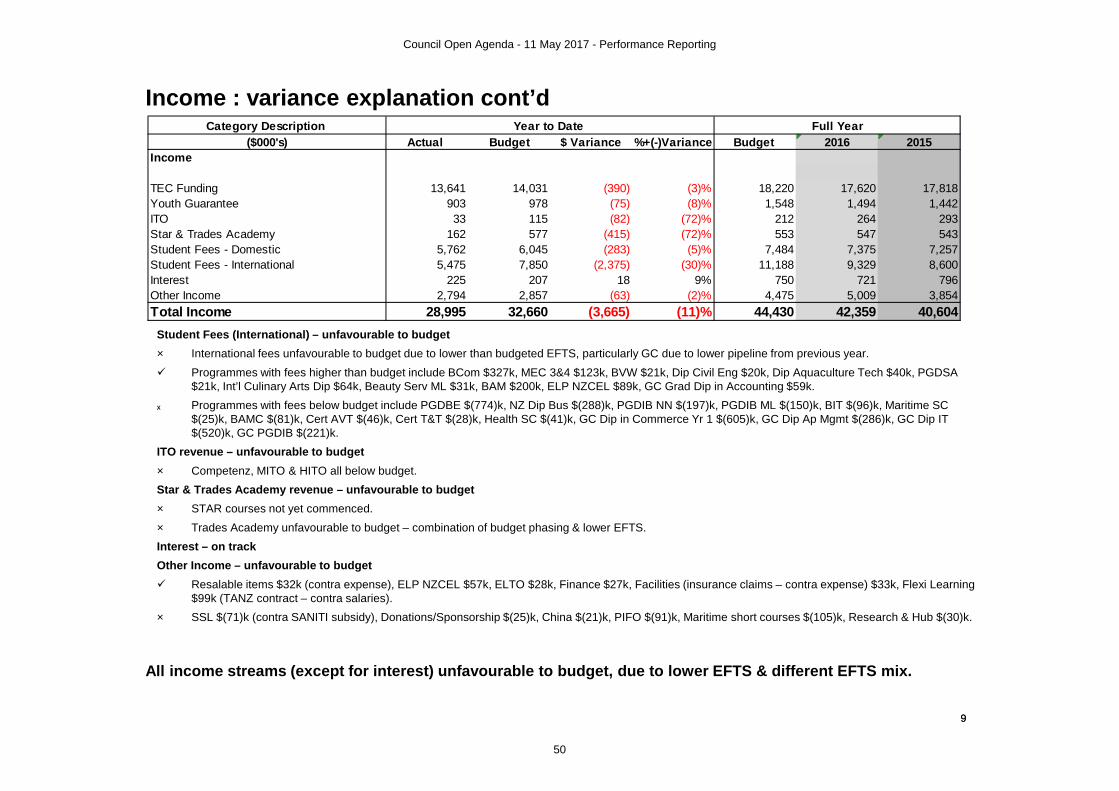
9
Income : variance explanation cont’d
9
Student Fees (International) – unfavourable to budget× International fees unfavourable to budget due to lower than budgeted EFTS, particularly GC due to lower pipeline from previous year. Programmes with fees higher than budget include BCom $327k, MEC 3&4 $123k, BVW $21k, Dip Civil Eng $20k, Dip Aquaculture Tech $40k, PGDSA
$21k, Int’l Culinary Arts Dip $64k, Beauty Serv ML $31k, BAM $200k, ELP NZCEL $89k, GC Grad Dip in Accounting $59k.ₓ Programmes with fees below budget include PGDBE $(774)k, NZ Dip Bus $(288)k, PGDIB NN $(197)k, PGDIB ML $(150)k, BIT $(96)k, Maritime SC
$(25)k, BAMC $(81)k, Cert AVT $(46)k, Cert T&T $(28)k, Health SC $(41)k, GC Dip in Commerce Yr 1 $(605)k, GC Dip Ap Mgmt $(286)k, GC Dip IT $(520)k, GC PGDIB $(221)k.
ITO revenue – unfavourable to budget× Competenz, MITO & HITO all below budget.Star & Trades Academy revenue – unfavourable to budget× STAR courses not yet commenced.× Trades Academy unfavourable to budget – combination of budget phasing & lower EFTS.Interest – on trackOther Income – unfavourable to budget Resalable items $32k (contra expense), ELP NZCEL $57k, ELTO $28k, Finance $27k, Facilities (insurance claims – contra expense) $33k, Flexi Learning
$99k (TANZ contract – contra salaries).× SSL $(71)k (contra SANITI subsidy), Donations/Sponsorship $(25)k, China $(21)k, PIFO $(91)k, Maritime short courses $(105)k, Research & Hub $(30)k.
All income streams (except for interest) unfavourable to budget, due to lower EFTS & different EFTS mix.
Category Description Full Year ($000's) Actual Budget $ Variance %+(-)Variance Budget 2016 2015
Income
TEC Funding 13,641 14,031 (390) (3)% 18,220 17,620 17,818Youth Guarantee 903 978 (75) (8)% 1,548 1,494 1,442ITO 33 115 (82) (72)% 212 264 293Star & Trades Academy 162 577 (415) (72)% 553 547 543Student Fees - Domestic 5,762 6,045 (283) (5)% 7,484 7,375 7,257Student Fees - International 5,475 7,850 (2,375) (30)% 11,188 9,329 8,600Interest 225 207 18 9% 750 721 796Other Income 2,794 2,857 (63) (2)% 4,475 5,009 3,854Total Income 28,995 32,660 (3,665) (11)% 44,430 42,359 40,604
Year to Date
Council Open Agenda - 11 May 2017 - Performance Reporting
50

10
Operating expenditure - variance explanation
10
Class Resources (Items organised by teaching staff for use in class)× Unfavourable overall. Favourable variances in accreditation fees $29k (Blue Tick programme redevelopment).× Unfavourable variances in course purchases $(42)k and photocopying/printing $(54)k.International Commissions (Commissions paid to international agents) Favourable due to lower international revenues.Curriculum Support (Costs to support teaching & curriculum)× Small unfavourable variances in research and books.Information Technology (Costs like telephone, wifi, network & licences) Favourable overall, mainly in licence fees $43k.HR & Training (Costs to support, train or recruit staff) × Unfavourable overall with main unfavourable variance in professional memberships $(15)k.Marketing & Promotions (Costs to promote programmes & facilities excluding agents commissions) Favourable variances in advertising $62k, photocopying/printing – promotion $26k, and international costs $58k.
Category Description Full Year ($000's) Actual Budget $ Variance %+(-)Variance Budget 2016 2015
Expenditure
Class Resources 785 725 (60) (8)% 2,719 2,224 2,072International Commissions 1,208 2,063 855 41% 2,979 2,379 2,695Curriculum Support 26 20 (6) (28)% 85 66 43Information Technology 330 370 40 11% 1,205 1,251 1,099HR & Training 236 223 (14) (6)% 635 642 603Marketing & Promotions 123 276 153 55% 755 675 1,577Admin & Support 1,007 1,028 20 2% 2,184 2,484 1,860Facilities 1,092 1,147 54 5% 3,396 3,341 3,069Interest Expense - - - 0% - 0 0Depreciation, Amortisation & Impairment 1,242 1,154 (88) (8)% 3,750 3,792 3,440JV/TANZ Costs 996 394 (602) (153)% 814 1,300 2,447SUTI's Share of GC Surplus/(Deficit) - - - 0% - (380) (909)Total Opex Expenses 7,047 7,400 353 5% 18,522 17,773 17,996
Year to Date
Council Open Agenda - 11 May 2017 - Performance Reporting
51

11
Operating expenditure - variance explanation cont’d
11
Admin & Support (Costs for back office, printing & equipment) Favourable variance in SANITI subsidy $71k (contra revenue), photocopying/printing – admin $21k.× Unfavourable variance in purchases admin $(100)k (TANZ costs).Facilities (Costs for site, rent, repairs, cleaning etc) Favourable variances in contract maintenance $71k, insurance $43k, energy $32k, cleaning $30k. × Unfavourable variances in security & keys $(58)k, R&M $(37)k, and rent $(25)k.Depreciation, Amortisation & Impairment× Unfavourable to budget.JV/TANZ Costsₓ Unfavourable overall with main unfavourable variances in STS Seafood Processing, SUTI COP, SUTI Career Guidance, and Annesbrook Diploma (offset
against favourable revenue variances).
Opex 5% under budget, with main favourable variance in international commissions (offset lower international revenues), and smaller favourable variances in marketing, and facilities costs. Partly offset by unfavourable variances in class resources, depreciation and JV/TANZ costs (offset revenue)
Category Description Full Year ($000's) Actual Budget $ Variance %+(-)Variance Budget 2016 2015
Expenditure
Class Resources 785 725 (60) (8)% 2,719 2,224 2,072International Commissions 1,208 2,063 855 41% 2,979 2,379 2,695Curriculum Support 26 20 (6) (28)% 85 66 43Information Technology 330 370 40 11% 1,205 1,251 1,099HR & Training 236 223 (14) (6)% 635 642 603Marketing & Promotions 123 276 153 55% 755 675 1,577Admin & Support 1,007 1,028 20 2% 2,184 2,484 1,860Facilities 1,092 1,147 54 5% 3,396 3,341 3,069Interest Expense - - - 0% - 0 0Depreciation, Amortisation & Impairment 1,242 1,154 (88) (8)% 3,750 3,792 3,440JV/TANZ Costs 996 394 (602) (153)% 814 1,300 2,447SUTI's Share of GC Surplus/(Deficit) - - - 0% - (380) (909)Total Opex Expenses 7,047 7,400 353 5% 18,522 17,773 17,996
Year to Date
Council Open Agenda - 11 May 2017 - Performance Reporting
52

12
Pays - variance explanation
12
Academic pays Favourable by $620k. Main favourable variances in GC $237k, Confucious & China NZ $91k, PGDBE NN $85k, Te Haeta $84k, NZ Dip Bus Online $41k, Training Schemes Cr Ind
$37k, Te Ata Hou $29k, Cert in Superyacht Crewing $23k, First Line Mgmt $23k, NZ Cert in Food & Beverage $20k, Central $20k, Bach Nursing Yr 1 $20k. ₓ Main unfavourable variances in ELP NZCEL $(37)k, In China $(35)k, Trades Admin $(35)k, Maritime S/C $(21)k, ELTO $(20)k, Soc Sci Admin $(20)k.
Allied pays× Unfavourable to budget by $(256)k. Favourable variance in International Marketing $54k, Finance & Process Improvement $29k, CEO Admin $28k, Maritime & AVT Admin $23k.ₓ Unfavourable variances in Programme Redevelopment Project $(90)k, Flexi Learning $(69)k (TANZ eCampus) (C), Academic & Quality $(55)k, eCampus
$(44)k, Primary Industries Admin $(33)k, Cert in Carpentry NN $(21)k, Soc Sci Admin $(20)k.
YTD pays $0.4m favourable against budget.
TEU contract expired. Backpay has been accrued.
Category Description Full Year ($000's) Actual Budget $ Variance %+(-)Variance Budget 2016 2015
Academic Pay 3,526 4,145 620 15% 14,855 13,019 11,405Support Staff Pay 3,264 3,008 (256) (9)% 10,697 10,078 8,678Total Staffing Costs 6,790 7,153 363 5% 25,552 23,097 20,082
Year to Date
Council Open Agenda - 11 May 2017 - Performance Reporting
53
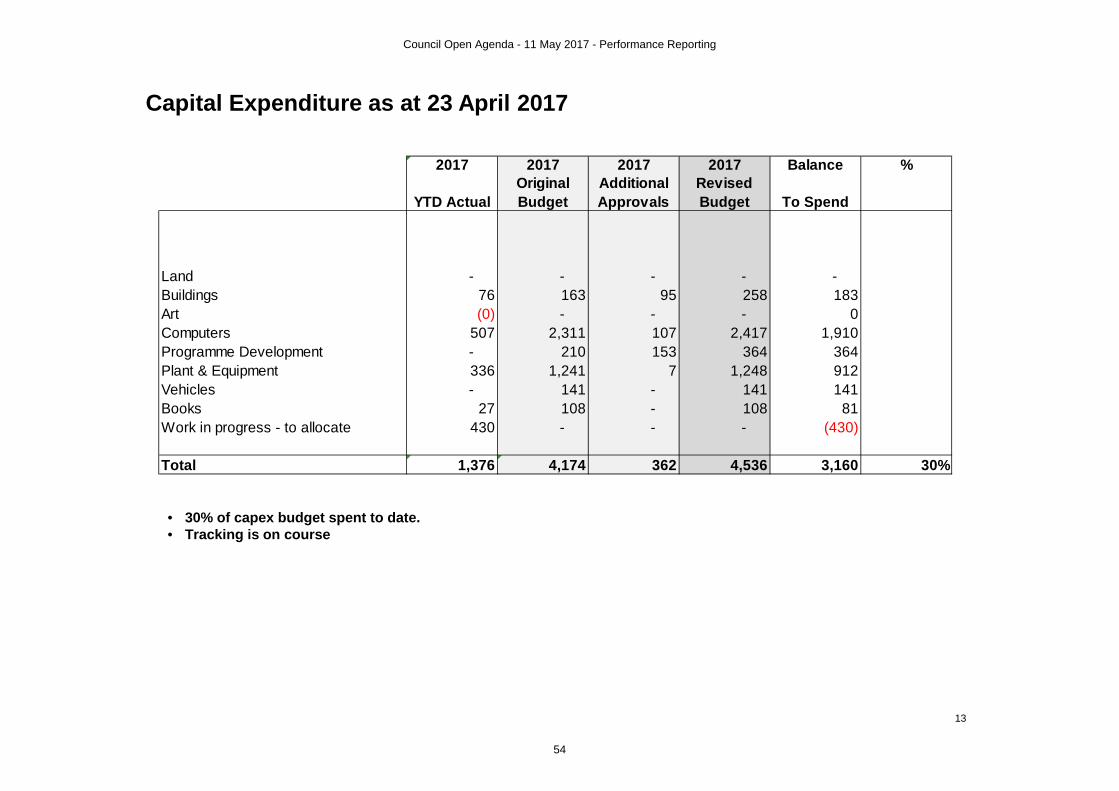
Capital Expenditure as at 23 April 2017
13
• 30% of capex budget spent to date.• Tracking is on course
2017 2017 2017 2017 Balance %
YTD ActualOriginal Budget
Additional Approvals
Revised Budget To Spend
Land - - - - - Buildings 76 163 95 258 183Art (0) - - - 0Computers 507 2,311 107 2,417 1,910Programme Development - 210 153 364 364Plant & Equipment 336 1,241 7 1,248 912Vehicles - 141 - 141 141Books 27 108 - 108 81Work in progress - to allocate 430 - - - (430)
Total 1,376 4,174 362 4,536 3,160 30%
Council Open Agenda - 11 May 2017 - Performance Reporting
54
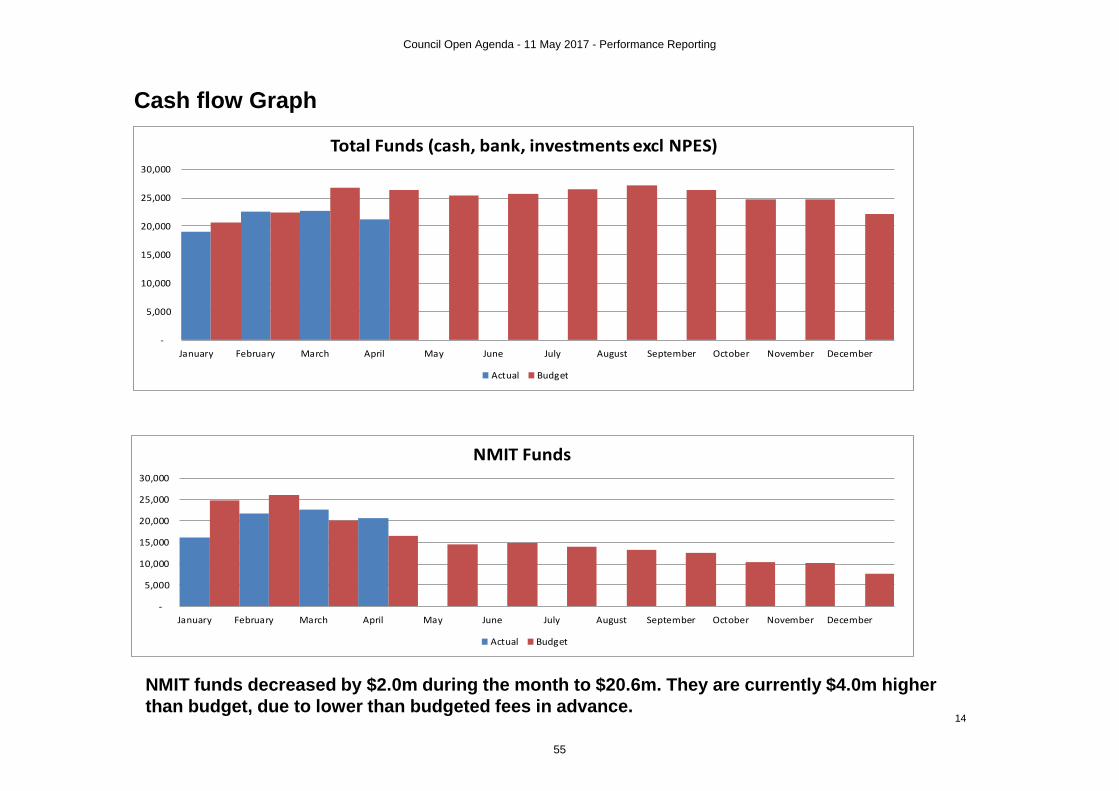
Cash flow Graph
NMIT funds decreased by $2.0m during the month to $20.6m. They are currently $4.0m higher than budget, due to lower than budgeted fees in advance.
14
-
5,000
10,000
15,000
20,000
25,000
30,000
January February March April May June July August September October November December
Total Funds (cash, bank, investments excl NPES)
Actual Budget
-
5,000
10,000
15,000
20,000
25,000
30,000
January February March April May June July August September October November December
NMIT Funds
Actual Budget
Council Open Agenda - 11 May 2017 - Performance Reporting
55

Nelson & Marlborough Institute of Technology
Investments
Council Open Agenda - 11 May 2017 - Performance Reporting
56

Investments as at 23 April 2017
18
a) Summary
Bank Rating AmountAverage
RateAverage
Term AmountAverage
Rate ValueAverage
Rate
ANZ AA- 8,850,000 3.907% 208.25 4,650,000 3.900% 4,200,000 0.01%BNZ AA- 2,475,000 3.461% 216.00 3,975,000 3.393% (1,500,000) 0.07%Westpac AA- - - - 0.00%Rabobank A - - - 0.00%SBS BBB 8,900,000 3.721% 198.19 12,800,000 3.622% (3,900,000) 0.10%
Total $20,225,000 3.636% 212.00 $21,425,000 3.519% ($1,200,000) 0.117%
b) Other Cash not on deposit 2,056,178$ 2,310,748$ (254,570)
c) New Deposits during Month 1,825,000$ 6,600,000$ (4,775,000)
d) Deposits broken in month -$ -$ -
e) Due Repayment coming month 2,150,000$ 2,550,000$ (400,000)
23 April 2017 26 February 2017 Change
Council Open Agenda - 11 May 2017 - Performance Reporting
57
VERBAL REPORT FROM SARA WILLIAMS (TEC INVESTMENT MANAGER)
Sara Williams, Investment Manager and Sue McLeish, Senior Advisor will be attending the May Council meeting to provide Council with a verbal update on the tertiary education sector and an update on TEC’s Investment Approach strategy.
Council Open Agenda - 11 May 2017 - Performance Reporting
58
SANITI Council Report – May 2017
SANITI Report to NMIT Council – Thursday 11 May 2017
Strategic Goal One – Fun social events and strong campus culture
ß Nelson – Association ran an event on Richmond Campus for the Trainee Rangers on 23 March and a soup event on Nelson campus on Tuesday 28 March. We also ran an event on Nelson Campus to promote AGM on Monday 10 April. No events have been run on Nelson campus during the term break 14-30 April. Association had a soup event for Nelson Campus on 3 May to welcome students back.
ß Marlborough/Woodbourne Campuses – The Association ran an event on Marlborough campus on 15 March andan event on Base Woodbourne on 5 April and supported the CAEF Graduation on 19 April.
ß International Event Schedule – Due to adverse weather the Association postponed the Golden Bay Trip scheduled for 25 March. The Association also ran a successful trip to the Brook Sanctuary on 6 April and will be running the postponed Golden Bay trip on Saturday 6 May, which is fully booked.
ß Global Campus - Chel Hernandez started at Global Campus on 11 April. Olivia Moir spent two days with her in Auckland, providing Employment Service training. Chel visited Nelson on 19 and 20 April to meet the rest of the team and receive information and training on the Association’s service provision. The Association has received very positive feedback from GC staff and students in relation to Chel’s appointment and her service delivery at GC after the event run in 24 April.
Strategic Goal Two – Friendly, quality support, advocacy and services for all students
ß Advocacy Association advocacy and support services have been fully stretched during Term 1. It is hoped that the majority of StudyLink issues will be resolved moving into Term 2, allowing time for the database to be updated and reports written. The Term break has given the Advocates an opportunity to receive supervision and have a break. The number of StudyLink issues have reduced, but with new courses starting throughout the year it is an ongoing process.
ß Programme Representatives – Programme Representative meetings was held on Woodbourne/Marlborough campuses on 14 March, which was well supported. A very successful meeting was held on Nelson campus on Wednesday 29 March. Association is following-up on issues raised by the Programme Representatives in Term 1. The Global Campus Programme Representative booklet has been updated in relation to the new SANITI staff member and NMIT staff changes.
ß Employment – Demand for this service on all campuses has been steady, with an increasing number of employers contacting the Association directly. Association is working with the Applied Business Department to develop LinkedIn workshops for students. Employers are continuing to contact the Association directly. Olivia Moir met with student at GC on 11-12 April in conjunction with her new staff training programme. Olivia’s last day with the Association was 28April and we wish her well in her new position. The Association has advertised the position and is currently in the process of short-listing the candidates. As an interim measure Chel Hernandez with be assisting Nelson and Marlborough students with their CV’s and Cover letter by email. The same service that Olivia Moir has been providing to GC students outside of the visits over the last twelve months.
Council Open Agenda - 11 May 2017 - For Information
59

SANITI Council Report – May 2017
Strategic Goal Three – Independent representation of the student voice and student engagement
ß Executive – Executive meetings have been held on 24 February, 16 March and 7 April. Four Executive members went to an ITP Student Leaders Summit on 1 and 2 May with the President. There were 3 new Executive elected at the AGM on 11 April. Training for the Executive will be held week of 7 May.
ß AGM – The Annual General Meeting was held 11 April. All motions were approved including the Annual Accounts, Presidents Report, distribution of the 2016 surplus and appointment of an Auditor for 2017.
Council Open Agenda - 11 May 2017 - For Information
60
REPORT TO NMIT COUNCIL | 11 MAY 2017 ITEM 15 LEARNER VOICE – FIRST IMPRESSIONS 2017 PREPARED BY LIAM SLOAN (DIRECTOR OF LEARNING, TEACHING AND QUALITY) PURPOSE
This paper has been created to provide Council with a summative view of students’ First Impressions of NMIT and compare the results with those captured in 2017. RECOMMENDATION
Council are requested to note:
1. The number of survey respondents, 871, has increased 9.2% in 2017 when compared against 2016
2. The number of learners satisfied with NMIT has increased by 4% when compared against 2016
3. The number of learners satisfied with their programme has increased by 7% when compared against 2016
4. The number of learners satisfied with the teaching on their programme has increased by 3% when compared against 2016
5. The number of learners satisfied with the learning environment has increased by 4% when compared against 2016.
CONTEXT
The Academic and Quality department collaborate with curriculum departments to administer and roll out a First Impressions Survey across NMIT. This survey takes place during Semester 1 of the academic year and results are analysed by department for continuous improvement purposes.
Survey outcomes inform Self-Assessment and are reviewed by Directorate during Performance Panels.
Council Open Agenda - 11 May 2017 - For Information
61

1 of 1 NMIT First Impressions, Semester One Results Oview 2016 - 2017
58.1%
48.9%
871
924
1499
1889
First Impressions, Semester One 2017 (Easter Report) - overall response rate:
First Impressions, Semester One 2016 (Final) - overall response rate:
First Impressions Semester 1, 2016 - 2017 Comparisons:Response Rates:
% Surveyed Elligible respondents
NMIT First Impressions Survey, Semester One Results Overview 2016 - 2017
27.0%
24.4%
55.0%
50.6%
12.6%
17.0%
3.2%
4.4%
2.1%
2.1%
0.1%
1.5%
Strongly agree, 2017
Strongly agree, 2016
Agree, 2017
Agree, 2016
Slightly agree, 2017
Slightly agree, 2016
Slightly disagree, 2017
Slightly disagree, 2016
Disagree, 2017
Disagree, 2016
Strongly disagree, 2017
Strongly disagree, 2016
Q19a. Overall do the students agree they are satisfied with the programme?
2%16%
82%
Favourable/Unfavourable 2017
4%21%
75%
Favourable/Unfavourable 2016
Unfavourable Neutral Favourable
32.3%
29.3%
49.8%
49.2%
12.3%
13.9%
3.9%
4.5%
1.6%
1.4%
0.1%
1.6%
Strongly agree, 2017
Strongly agree, 2016
Agree, 2017
Agree, 2016
Slightly agree, 2017
Slightly agree, 2016
Slightly disagree, 2017
Slightly disagree, 2016
Disagree, 2017
Disagree, 2016
Strongly disagree, 2017
Strongly disagree, 2016
Q19b. Overall do the students agree they are satisfied with the teaching?
2%16%
82%
Favourable/Unfavourable 2017
3%18%
79%
Favourable/Unfavourable 2016
Unfavourable Neutral Favourable
28.4%
26.1%
53.7%
51.4%
13.3%
16.8%
2.9%
2.6%
1.1%
1.5%
0.6%
1.6%
Strongly agree, 2017
Strongly agree, 2016
Agree, 2017
Agree, 2016
Slightly agree, 2017
Slightly agree, 2016
Slightly disagree, 2017
Slightly disagree, 2016
Disagree, 2017
Disagree, 2016
Strongly disagree, 2017
Strongly disagree, 2016
Q19c. Overall do the students agree they are satisfied with the learning environment?
2%16%
82%
Favourable/Unfavourable 2017
3%19%
78%
Favourable/Unfavourable 2016
Unfavourable Neutral Favourable
28.0%
26.6%
54.4%
51.4%
12.9%
14.5%
2.6%
4.4%
1.4%
1.6%
0.7%
1.4%
Strongly agree, 2017
Strongly agree, 2016
Agree, 2017
Agree, 2016
Slightly agree, 2017
Slightly agree, 2016
Slightly disagree, 2017
Slightly disagree, 2016
Disagree, 2017
Disagree, 2016
Strongly disagree, 2017
Strongly disagree, 2016
Q19d. Overall are the students satisfied with NMIT?
2%16%
82%
Favourable/Unfavourable 2017
3%19%
78%
Favourable/Unfavourable 2016
Unfavourable Neutral Favourable
2%16%
82%
Programme, teaching, learning environment & NMIT overall, 2017:
Unfavourable
Neutral
Favourable
3%
20%
77%
Programme, teaching, learning environment & NMIT overall, 2016:
Unfavourable
Neutral
Favourable
Council Open Agenda - 11 May 2017 - For Information
62
Level 2, 100 Molesworth Street, Thorndon 6011 PO Box 3928, Wellington 6140, New Zealand
Email: [email protected]
Telephone: +64 4 917 1500
Website: www.oag.govt.nz www.auditnz.govt.nz
| Martin Matthews
31 March 2017 Tēnā koe
Insights and challenges: My vision for the public sector
I would like to use this letter, my first to you as Controller and Auditor-General, to initiate a discussion
on how we can best ensure that our system of public management and accountability serves us well
now and in the future. I am also sharing some observations from my Office’s work, including our
annual audits for 2015/16 of over 130 central government organisations. Of course, my thoughts are
informed by my recent experience as a chief executive and by the day-to-day challenges in a public
sector environment that is rapidly changing.
A public sector fit for the modern world
I want my Office to play its part in shaping the public sector to operate and be accountable in ways
that are fit for purpose for the future. Our financial management and accountability system was state
of the art in 1989, but that was nearly 30 years ago. I believe we need to start thinking now about
what a 2025 model might need to be like to allow us to deliver the required results for citizens and to
preserve public trust and confidence for the next few decades of the 21st century. This means that we
also need to be open to new and different thinking and approaches.
I want to use the unique and independent perspective my Office has to help shape this future thinking.
As the auditor of the entire public sector, I believe we have a vantage point from which to view and
influence the future to ensure we support a stronger public sector that has the trust and confidence of
citizens. I am looking forward to working with you in this regard, and encourage you to engage with
my Office as we pursue this challenge.
As I meet with you over the next few months, I will be keen to hear your thinking about how we might
respond to the challenges ahead of us. I would also like to hear from you about how we could work
together. I think of my Office as a key partner in improving the public sector management system as
well as individual entities. Our independence allows us to act as a sounding board while carrying out
our statutory role as auditors of the public sector. I expect my staff to join the dots and to share good
practice. This includes helping with suggestions on who you could contact for advice or for sharing
experiences when you encounter particular challenges.
Transparency and accountability are critical for maintaining trust
Protecting our reputation for transparency and accountability is everyone’s responsibility.
New Zealand’s reputation for transparency is hard earned and is one of our greatest assets.
One key to transparency, and to building public trust in government, is to gather and present sound
information. As my predecessor Lyn Provost commented in her report, Inquiry into the Saudi Arabia
Food Security Partnership, “Transparency is the best foil for corruption.”
It is also important that we all maintain the best internal controls for sensitive expenditure and conflicts
of interest, with robust, workable policies and processes for documenting and dealing with conflicts.
Council Open Agenda - 11 May 2017 - For Information
63
2
Understanding and managing risk
Reflecting on my own recent experience, I want to reinforce the importance of understanding and
managing risks to organisational resilience. This includes fraud.
Effective risk management requires analysing, mitigating, monitoring, and reporting. For all of us, it
starts with the basics. For example, lapses in basic “hygiene”, such as weak user access
management and password settings, expose organisations to unnecessary risk.
However, one of the main insights I have gained is the importance of constantly reinforcing the right
culture. A culture of risk awareness, from governance to frontline delivery, is of vital importance to
defend against poor performance, waste, and corrupt behaviour.
All employees have a role in fraud awareness, prevention, and detection as part of their day-to-day
practice, not just staff in finance and procurement. Fraudsters, especially those in trusted, senior
positions, are often sophisticated, skilful, and hard to detect. Strong internal controls are very
important, but even they can be circumvented if someone is determined enough. That is why it is
important to foster a strong culture of vigilance. This is especially true in the current environment of
increasingly sophisticated cyber fraud.
Observations from our 2015/16 central government audits
My auditors are observing that the fundamentals are being done well. Overall, our 2015/16 annual
audits of central government entities indicate that, in the context of the current public financial system,
the right fundamentals appear to be in place. Most agencies have sound management and financial
systems and control environments although, from a Controller perspective, I will continue to watch
how organisations manage their spending against appropriations.
A focus on governance is leading to improvements. In our 2016 report, Reflections from our audits:
Governance and accountability, we outlined some thoughts on good practice. Generally, a focus on
good governance practice is making a difference, evident in appropriate governance structures and
the effective use of audit committees and of external and independent quality assurance.
Significant change projects appear to be generally managed well. Several complex and large-scale
organisational changes and transformation projects were completed or were making substantial
progress at the time of last year’s audits. Change projects that focus on better client management are
important to give effect to a greater citizen focus, but tend to be complex and potentially risk prone,
especially when they affect ICT systems or frontline operations. We can all learn from agencies that
have managed change successfully. They routinely use tools such as external reviews, independent
quality control, and, importantly, regular reviews of the effectiveness of internal controls. It is also
important that we are all prepared for when things go wrong.
Basic procurement and contract management processes are run well but challenges remain around
value for money. Agencies are generally good at running basic procurement processes but are
grappling with the challenge of assessing value for money. The increasing complexity of procurement
and commissioning is one reason why we are intending to focus on this area as part of our work in the
future. Another reason is the importance of third-party services for delivering the best possible
services to New Zealanders. This requires agencies to work with their partners, whether other
agencies or contracted third parties, on co-design, lifting the capability of service providers, or shaping
the market of suppliers. I encourage you to share your thoughts on the challenges you face.
Council Open Agenda - 11 May 2017 - For Information
64

3
Investment and asset management practice would benefit from a greater strategic focus. Essential
practices are sound, but across the public sector we are not giving best effect to stewardship
expectations. Our auditors also noticed that agencies need to improve their approaches to asset
valuations. We are currently preparing this year’s reflections report, which will summarise the findings
and observations from our work under the 2015/16 theme of Investment and asset management. I am
looking forward to engaging with you later this year on our insights from this work.
Telling a performance story relies on sound information. Having the right information is key to our
ability to tell a clear performance story and convey how effectively our organisations are making a
difference. In my view, performance reporting needs to continue to evolve as part of an accountability
system that is fit for purpose.
I want to work with you and your organisations to make sure we all contribute to a resilient public
sector that responds to the needs of New Zealanders now and in the future.
To sum up, here are some initial thoughts on how we can all support a stronger public sector
management system:
Look beyond our own organisations to consider the system.
Embed a staff culture of accountability and risk awareness.
Maintain the public’s trust by being transparent and managing sensitive expenditure and
conflicts of interest.
Support our organisations to be ready for change by being clear upfront about the purpose of,
and expected result of, the change and how we will measure success.
Focus on lifting our relationship management ability to work more smartly with partners.
As the chief executive of an organisation that strives to be a role model for others, I will be
considering these matters in respect of my own Office.
I look forward to meeting you in the near future, and to discussing with you the matters I have covered
in this letter and also my thoughts on how I see my Office contributing to a world-class public sector
management system that is fit for purpose for the next quarter of the 21st century.
Noho ora mai
Martin Matthews
Controller and Auditor-General
Council Open Agenda - 11 May 2017 - For Information
65

Investment Approach -OverviewWorking draft
Council Open Agenda - 11 May 2017 - For Information
66
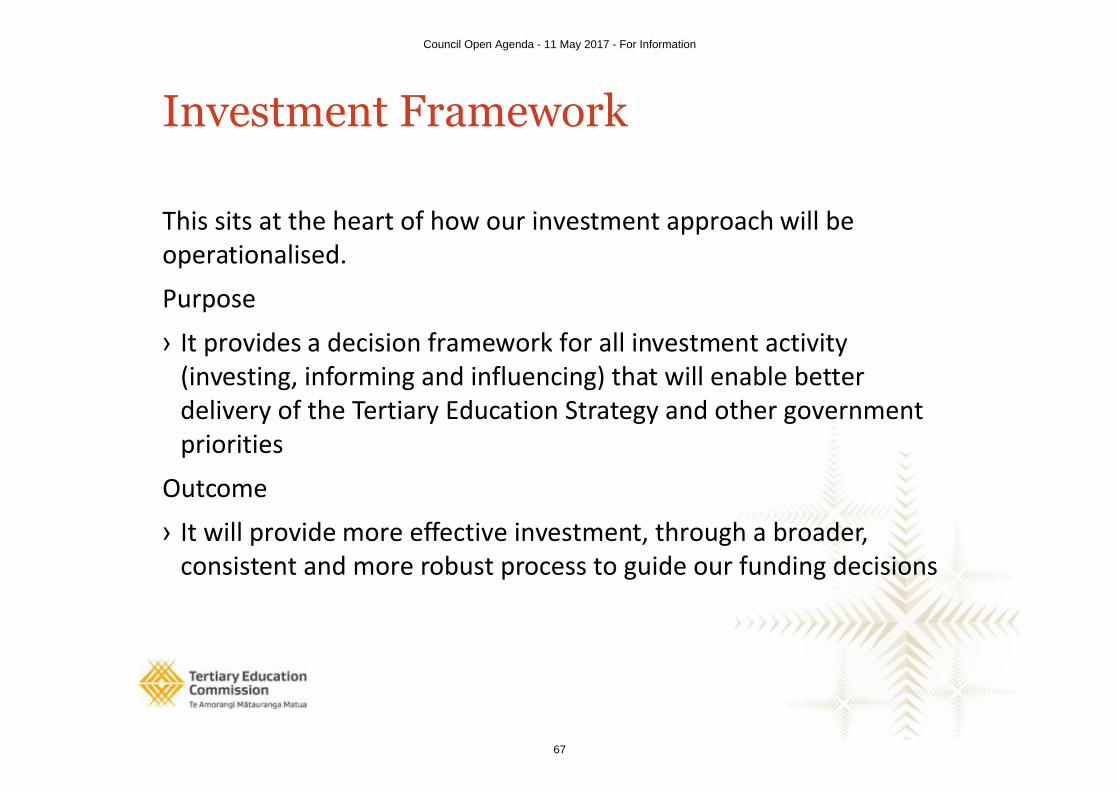
Investment Framework
This sits at the heart of how our investment approach will be operationalised.
Purpose
› It provides a decision framework for all investment activity (investing, informing and influencing) that will enable better delivery of the Tertiary Education Strategy and other government priorities
Outcome
› It will provide more effective investment, through a broader, consistent and more robust process to guide our funding decisions
Council Open Agenda - 11 May 2017 - For Information
67

It’s driven by Government priorities
› Our legislative framework and policy settings guide the way
–Education Act 1989– Tertiary Education Strategy› We take other Government goals and priorities into
account – such as..
– the Business Growth Agenda– Science and Innovation › And signal our intentions and expectations through
– our TEC story–Plan Guidance
Council Open Agenda - 11 May 2017 - For Information
68
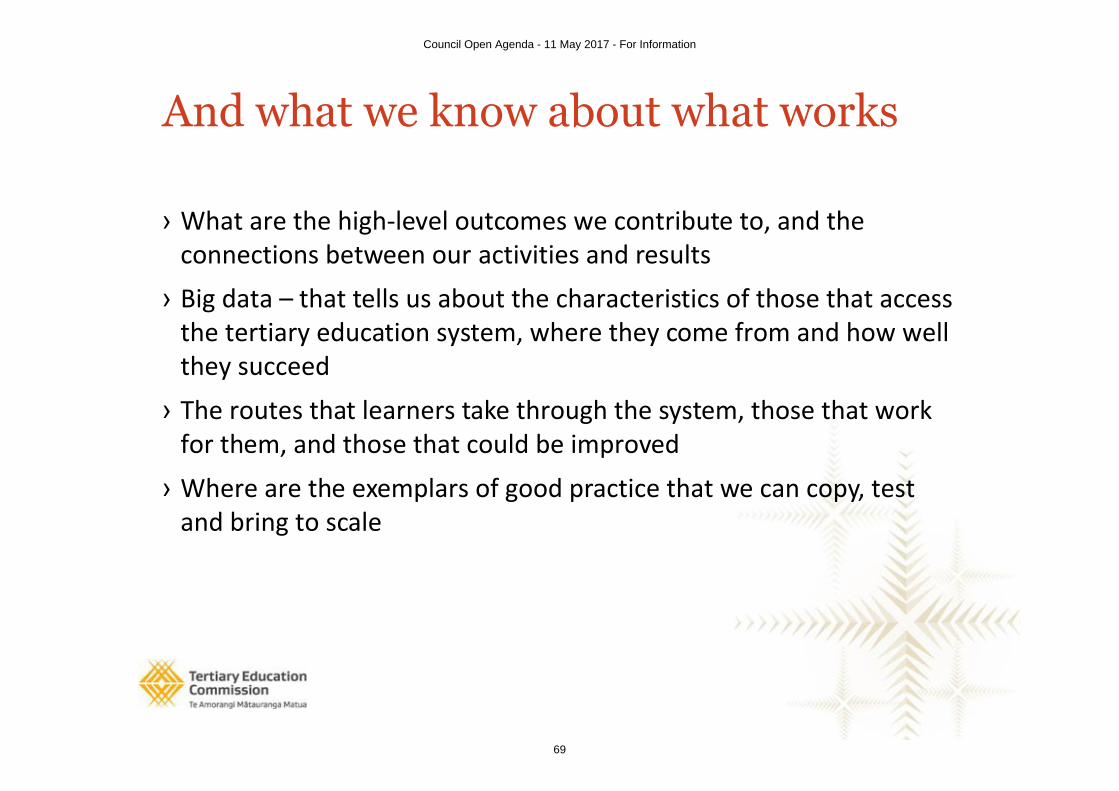
And what we know about what works
› What are the high-level outcomes we contribute to, and the connections between our activities and results
› Big data – that tells us about the characteristics of those that access the tertiary education system, where they come from and how well they succeed
› The routes that learners take through the system, those that work for them, and those that could be improved
› Where are the exemplars of good practice that we can copy, test and bring to scale
Council Open Agenda - 11 May 2017 - For Information
69

Choosing the right lever for the job
› Investment
– where should the funding go to get the best results– what do we need more or less of› Information
– assisting learners to make good decisions– providing data back to the sector to guide improvement› Influence
– gaining leverage through others– encouraging investments to enhance capability
Council Open Agenda - 11 May 2017 - For Information
70
And continually learning
› Where did we start from?
› What difference have we made?
› What worked really well?
› Where are the opportunities to do better?
› How do we take these up?
Council Open Agenda - 11 May 2017 - For Information
71
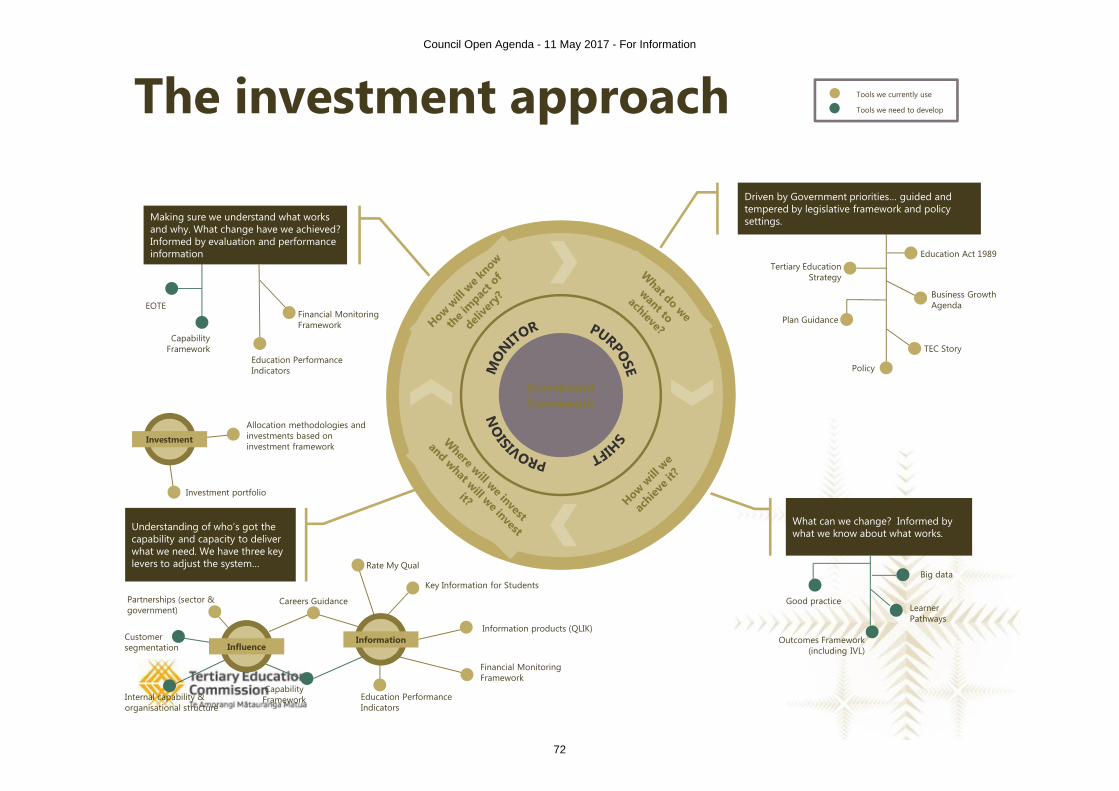
Driven by Government priorities… guided and tempered by legislative framework and policy settings.
What can we change? Informed by what we know about what works.
Making sure we understand what works and why. What change have we achieved? Informed by evaluation and performance information
Understanding of who’s got the capability and capacity to deliver what we need. We have three key levers to adjust the system…
InvestmentAllocation methodologies and investments based on investment framework
Investment portfolio
InfluenceCustomer segmentation
Capability FrameworkInternal capability &
organisational structure
Good practice
Outcomes Framework (including IVL)
Learner Pathways
Capability Framework
Education Performance Indicators
EOTEFinancial Monitoring Framework
The investment approach Tools we need to develop
Tools we currently use
Tertiary Education Strategy
Business Growth Agenda
Education Act 1989
Information
Key Information for Students
Information products (QLIK)
Rate My Qual
Education Performance Indicators
Financial Monitoring Framework
Investment Framework
TEC Story
Policy
Partnerships (sector & government)
Big data
Plan Guidance
Careers Guidance
Council Open Agenda - 11 May 2017 - For Information
72

SUMMARISED Academic Board Minutes, Meeting of 10 April 2017 Page 1
NELSON MARLBOROUGH INSTITUTE OF TECHNOLOGYACADEMIC BOARDMINUTES OF THE MEETING HELD ON 10 APRIL 2017 AT 12.05 P.M.
PRESENT: Tony Gray (Chair), Doc Ferris, Karen Graham, Sarah Thornton (from 12.30 pm), Justin Carter, Mark Burdass, Carole Crawford, Darcy Liddell (until 12.30 pm), Silvia Gassebner,Abbey Paterson, Karina Russ, Suzie Peacock, (non-voting), Shine Kelly (non-voting)
APOLOGIES: Liam Sloan and Stuart WhitehouseDarcy Liddell for early departure; Sarah Thornton for lateness
1. MINUTES OF PREVIOUS MEETINGS
1.1 Minutes of the Meeting of 15 March 201732/17 The minutes of the meeting held on 15 March 2017 were approved as a true and correct record of that
meeting.
2. MATTERS ARISING FROM THE MINUTES
2.1 Action ListAction Item 1: Provide Academic Board with an update on learning conversations early in 2017: This action was deferred to May 2017.Action Item 2: Raise issue around timeframes for expiring and discontinuing qualifications at NZQA ITP Advisory Committee: Next NZQA ITP Advisory Committee meeting scheduled for 12 April 2017.Action Item 3: Raise concerns in relation to potential changes to apprenticeship funding models at ITP CE Forum: Next ITP CE Forum scheduled for 3 May 2017.Action Item 4: Send letter of congratulation from Academic Board to Sarah Fraser on achieving PhD and acknowledged quality of her thesis: This action is complete.
3. CORRESPONDENCE SCHEDULES
33/17 The inward correspondence was received and outward correspondence was approved.
4. ACADEMIC AND QUALITY
4.1 Academic Development ProjectsMembers were referred to the list of current academic development projects.
4.2 Academic Development Proposals
4.2.1 New Zealand Certificate and Diplomas in Art and DesignAn updated Academic Development Proposal (ADP) for the New Zealand Certificate in Arts and Design (Level 4), New Zealand Diploma in Arts and Design (Level 5) and New Zealand Diploma in Arts and Design (Level 6) was tabled. The ADP had previously been approved and had now been updated to include embedded Training Schemes. A 10 credit course model had been adopted for this programme allowing completion of two courses per Training Scheme. Members welcomed the “bite-sized” approach allowing students to complete specific aspects of the programme. It was noted that there was a 5% limit of an institute’s EFTS for which Training Scheme funding could be claimed from the TEC.
34/17 The ADP for the New Zealand Certificate in Arts and Design (Level 4), New Zealand Diploma in Arts and Design (Level 5) and New Zealand Diploma in Arts and Design (Level 6) and embedded Training Schemes was approved in principle to proceed through approval procedure B pending feedback from Academic Board members by end of April 2017.
Council Open Agenda - 11 May 2017 - For Information
74

SUMMARISED Academic Board Minutes, Meeting of 10 April 2017 Page 2
4.2.2 New Zealand Diploma in Aeronautical Maintenance CertificationAn ADP for the New Zealand Diploma in Aeronautical Maintenance Certification with strands in Aeroplane, and Powerplant Turbine was presented. The new programme would be closely based on the existing NMIT programme and be offered online involving CAA exams and enabling graduates to obtain an aircraft maintenance licence. Doc Ferris noted that the statements in the ADP relating to Te Tiriti o Waitangi read well and commented that the ADP for the Art and Design programme was lacking in this respect.Tony Gray suggested that the statements in relation to Te Tiriti o Waitangi used in the ADP for the New Zealand Diploma in Aeronautical Maintenance Certification be considered as a framework and model for future ADPs. Mark Burdass added that such statements needed to be applied to the specific programmes.
35/17 Subject to removing TES statements not relevant to the programme, the ADP for the New Zealand Diploma in Aeronautical Maintenance Certification with strands in Aeroplane and Powerplant Turbine was approved to proceed through approval procedure B.
4.2.3 New Zealand Certificate in Automotive Engineering (Level 3)The above new programme would replace the current pre-trade automotive programme. It was proposed to offer Toi Ohomai Institute of Technology’s new programme, which would also be delivered by a number of other ITPs. The new programme would not be unit standards based.
36/17 Subject to referring to this programme in relation to Te Tiriti o Waitangi, the ADP for the New Zealand Certificate in Automotive Engineering (Level 3) was approved to proceed through approval procedure B.
4.2.4 New Zealand Certificate in Light Automotive Engineering (Level 4)Similar collaboration between ITPs applied to the level 4 light automotive apprentice programme as to the pre-trade programme. Delivery options of the programme on the West Coast would be investigated.
37/17 Subject to removal of references to the NMIT Strategic House, the ADP for the New Zealand Certificate in Light Automotive Engineering (Level 4) was approved to proceed through approval procedure B.
4.3 Academic Approvals
4.3.7 New Zealand Certificate in Horticulture Production (Level 4) with strand in Fruit ProductionThe Academic Board was asked to consider approval of an EIT programme leading to the New Zealand Certificate in Horticulture Production (Level 4) with strand in Fruit Production. This programme would replace the Certificate in Vineyard Practice but was also suitable to be used for other fruit production training.
38/17 The New Zealand Certificate in Horticulture Production (Level 4) with strand in Fruit Production wasapproved.
4.4 NMIT Policies and Procedures
4.4.7 Programme/Course Development and Change PolicyApproval of this policy was deferred to the May Academic Board meeting.
4.5 Self-Assessment and Internal Review
4.5.1 Self-AssessmentThe following items were noted:∑ The main focus since the last Academic Board meeting had been preparing for EER.∑ Draft 2016 SAR status for all programmes was: 77% complete and 23% in progress. All Programme
Coordinators and/or HODs had been in touch regarding EERs in progress.∑ Snapshots would be performed in due course.
Darcy Liddell agreed to investigate options for an Academic Board SAR.
4.5.2 Internal ReviewThe following items were noted:
∑ The Certificate in Community Support Services Internal Review report was endorsed by the Quality Committee and Suzie Peacock and Sandeep Patel had been commended for the report.
Council Open Agenda - 11 May 2017 - For Information
75
SUMMARISED Academic Board Minutes, Meeting of 10 April 2017 Page 3
4.6 Safety, Health and Wellbeing
4.6.1 Safety, Health and Wellbeing Leadership Group Meetings 28 March 2017With the operation of the Safety Health and Wellbeing Committee, it has been recommended to discontinue the Safety, Health and Wellbeing Working Group. This course of action would be proposed at the next NMIT Council meeting.The Committee had discussed the Drug and Alcohol policy and had suggested widening the scope of this policy to include staff.
39/17 The minutes of the Safety, Health and Wellbeing Leadership Group meeting of 28 March 2017 werereceived.
5. SECTOR UPDATES
5.1 Productivity Commission ReportThe New Zealand Productivity Commission’s report on New Models of Tertiary Education had recently been released and was available on the Commission’s website. It was suggested to discuss the report at the May or June 2017 Academic Board meeting and to provide members with the executive summary of the report.
5.2 NZQA Consultation on publishing statutory actionNZQA had developed a set of rules around taking statutory actions against education organisations. Feedback was being sought on NZQA’s intention to publish statutory actions on their website. This consultation was open until 5 May 2017.
5.3 NZQA Review of University Entrance requirementsProposed changes to the University Entry requirements were only of a minor nature. Feedback to the changes was able to be submitted by 28 April 2017.
5.4 NZQA Survey on Recognition of Prior Learning (RPL)NZQA had undertaken a survey of RPL involving six education organisations. The key findings of this survey had now been published on the NZQA website. One of the key findings was that RPL needed to bedone at the right point in time and completed at the stasrt of a learner’s journey. It was suggested to include RPL as a topic of discussion on the agenda for an Academic Board meeting.
6. REPORTS FROM COMMITTEES AND WORKING PARTIES
6.1 Programme Approval Committee, Postgraduate Diploma in Logistics and Supply Chain Management, 20 March 2017
Suzie Peacock reported from a Programme Approval Committee (PAC) for the Postgraduate Diploma in Logistics and Supply Chain Management. This was a new programme to be offered by Applied Business and shared some courses with the Postgraduate Diploma in International Business. Suzie Peacock commended the smooth development process for this programme which was led by Susannah Roddick.Abbey Paterson noted that feedback from SANITI had included some concern about the learning outcomes stated for individual courses as they had felt they did not adequately reflect the level of the programme. Suzie Peacock responded that the PAC had requested a review of the learning outcomes for the same reason. She noted that a response needed to be sent to back to SANITI on their feedback.
40/17 The Postgraduate Diploma in Logistics and Supply Chain Management and an application to NZQA for programme approval and accreditation were approved.
6.2 Quality Committee Meeting of 16 February 201741/17 The minutes of the Quality Committee meeting of 16 February 2017 were received.
6.3 Research and Ethics Committee Meeting of 2 March 2017In Liam Sloan’s absence a report from the 5 April 2017 Research and Ethics Committee meeting was referred to the May Academic Board meeting.
Council Open Agenda - 11 May 2017 - For Information
76
SUMMARISED Academic Board Minutes, Meeting of 10 April 2017 Page 4
6.4 Learning and Teaching Committee of 27 February 201742/17 The minutes of the Learning and Teaching Committee meeting of 27 February 2017 were received.
6.5 Academic Committee MeetingsThere had been a vast amount of business to be dealt with by the Academic Committees, particularly at the end of the year at the time of graduation and at the beginning of the year at the end of the final SDR.
43/17 The minutes of the Red Academic Committee meetings and Blue Academic Committee meetings were received.
44/17 The minutes of the Central Academic Committee meetings were received.
7. GENERAL BUSINESS
7.1 Approval of Course and Programme Changes
45/15 The approval of the new courses and programme changes were endorsed.
MEETING CLOSUREThe meeting closed at 1.05 pm.
NELSON MARLBOROUGH INSTITUTE OF TECHNOLOGY ACADEMIC BOARD MEETING 10 APRIL 2017ACTION LIST
RES NO ACTION WHO WHEN PROGRESSAction items still to be completed:
1 Provide Academic Board with an update on learning conversations early in 2017.
C Crawford May 2017 meeting
2 Raise issue around timeframes for expiring and discontinuing qualifications at NZQA ITP Advisory Committee.
T Gray Next NZQA ITP Advisory Committee meeting
3 Raise concerns in relation to potential changes to apprenticeship funding models at ITP CE Forum
T Gray Next ITP CE Forum meeting
New Action Items:4 Provide feedback to ADP for NZ Certificate and Diploma
in Art and DesignAB Members By end of April 2017
5 Incorporate feedback on ADP for NZ Certificate and Diploma in Art and Design from AB Members; including comments in relation to Te Tiriti o Waitangi statements.
S Peacock By end of April 2017
6 ADP for NZ Certificate in Automotive Engineering (Level 3): Amend statements in relation to Te Tiriti o Waitangi to more specifically refer to the programme.
J Carter By end of April 2017
7 Update ADP for NZ Certificate in Light Automotive Engineering (Level 4) to remove reference to the NMIT Strategic House.
Darcy Liddell For June meeting
8 Investigate options for Academic Board SAR. Darcy Liddell For June meeting9 Discussion on Productivity Commission Report. AB May/ June meeting10 Send Executive Summary of Productivity Report to
Academic Board members.S Gassebner Prior to meeting
11 Discussion on RPL. AB Future meeting12 Send response to SANITI feedback on PGDip Logistics
and Supply Chain Management.S Peacock ASAP
Council Open Agenda - 11 May 2017 - For Information
77
SUMMARISED Academic Board Minutes, Meeting of 15 March 2017 Page 1
NELSON MARLBOROUGH INSTITUTE OF TECHNOLOGYACADEMIC BOARD
MINUTES OF THE MEETING HELD ON 15 MARCH 2017 AT 3.15 P.M.
PRESENT: Tony Gray (Chair), Liam Sloan, Sarah Thornton, Stuart Whitehouse, Justin Carter, Mark Burdass, Carole Crawford, Silvia Gassebner, Abbey Paterson, Suzie Peacock, non-voting) Shine Kelly (non-voting), Kim Davies (non-voting).
APOLOGIES: Karen Graham, Darcy Liddell, Doc Ferris and Karina RussIN ATTENDANCE: Mary Proctor (from 4.00 p.m. to 4.20 p.m.)
1. MINUTES OF PREVIOUS MEETINGS
1.1 Minutes of the Meeting of 15 February 2017 and E-Meetings of 3 to 6 March and 6 to 10 March 201714/17 The minutes of the meeting held on 15 February 2017 and of the e-meetings held from 3 to 6 March and
from 6 to 10 March were approved as true and correct records of those meetings.
2. MATTERS ARISING FROM THE MINUTES
2.1 Action ListAction Item 1: Provide Academic Board with an update on learning conversations early in 2017: This action was deferred to May 2017.Action Item 2: Check with HoDs regarding discontinuation of programmes: This action is complete.
3. CORRESPONDENCE SCHEDULES
15/17 The inward correspondence was received and outward correspondence was approved.Several correspondence items were in relation to seeking approval for corrections of learning hours.
4. ACADEMIC AND QUALITY
4.1 Academic Development ProjectsMembers were referred to the list of current academic development projects.
4.2 Academic Development ProposalsTony Gray noted that due to late programme approvals in 2016 a number of new programmes had to be advertised only as “subject to approval” which may have had an adverse effect on 2017 enrolment numbers. Approvals for new programme delivery for 2018 were now required by the end of Semester One 2017. NZQA was rapidly proceeding with expiring and discontinuing existing provider qualifications. A large number of current programmes needed to be replaced in 2018 as students could no longer enrol in programmes leading to qualifications that were expiring. Once a qualification was expiring students had only two years to complete it. Members urged for a stronger push-back to NZQA about the lifespan of expiring qualifications to allow part-time students sufficient time to complete their qualifications. It was also noted that any existing programmes for which a change to a New Zealand qualification was not achievable within the required timeframe, NZQA should be approached about extending the expiry and discontinuation dates for those NMIT qualifications. Tony Gray agreed to raise this at the next NZQA ITP Advisory Committee meeting. Whilst continuing with an existing programme may pose some market disadvantage it would be the preferred option where insufficient time was available to develop or decide on the appropriate programme of study to replace an existing programme. Communications with NZQA about qualification expiry was inconsistent and that expiry dates were not always communicated to all relevant providers in a timely manner or in some cases not communicated at all.
Council Open Agenda - 11 May 2017 - For Information
78

SUMMARISED Academic Board Minutes, Meeting of 15 March 2017 Page 2
4.2.1 OPP: New Zealand Certificate in Heavy Automotive Engineering with strands in Road Transport, Plant and Equipment, Agricultural Equipment, and Materials Handling
Members were referred to an Opportunity on a Page for the New Zealand Certificate in Heavy Automotive Engineering with strands in Road Transport, Plant and Equipment, Agricultural Equipment, and Materials Handling, for their information. This was a new project for NMIT extending its training provision in the motor industry area to include heavy automotive engineering as an apprenticeship model. The development for this new programme involved a consortium of ten providers which was led by Toi Ohomai with significant input from Barry Paterson providing his experience in this area. The consortium was working very well and a high quality programme was expected as a result from their concerted efforts. Tony Gray urged that strategies be investigated to ensure that the apprenticeship programmes would not be adversely affected by any changes in government funding models. He agreed to take this issue to the ITP CE forum. He commended the successful collaboration on this project but emphasised the need to be vigilant about any funding developments.
4.2.2 New Zealand Certificate and Diploma in Beauty TherapyAn ADP for programmes leading to the New Zealand Certificate and New Zealand Diploma in Beauty Therapy to replace the current Diploma in Beauty and Body Therapy was presented. An ITP partner was still being sought who would also deliver that new programme in 2018.
16/17 The Academic Development Proposal for the New Zealand Certificate in Beauty Therapy (Level 4) and New Zealand Diploma in Beauty Therapy (Level 5) was approved to proceed through approval procedure B.
4.2.3 New Zealand Certificate in CarpentryNMIT had developed a relationship with Ara Institute of Canterbury and was considering to deliver their apprenticeship programme leading to the New Zealand Certificate in Carpentry (Level 4). However, other options were also still being investigated as a number of other institutes were also in the process of developing new programmes leading to this qualification.Members were advised that most ITPs offering motor industry, carpentry and engineering trades training were steering away from incorporating unit standards into their programmes.It was noted that the new qualification was quite large with 320 credits. She expressed concern that with the recent changes to qualification completion EPIs it could be challenging for some students to complete this qualification within the timeframe of 4 years required for non-degree level qualifications at levels 4 7.
17/17 The ADP for the New Zealand Certificate in Carpentry (Level 4) was approved to proceed through approval procedure B.
4.2.4 Introduction to Aeronautical EngineeringAn ADP was presented for a training scheme for delivery of the Aeronautical Engineering Fundamentals programme as there was no 60 credit New Zealand qualification available to replace the current certificate. Justin Carter said that the training scheme was planned to be aligned with a corresponding Trades Academy course in introduction to aeronautical engineering. It was pointed out that Trades Academy courses needed to incorporate unit standards
18/17 The ADP for the Introduction to Aeronautical Engineering was approved to proceed through Approval Procedure B.
4.2.5 Diploma in Nautical ScienceThe Diploma in Nautical Science (Level 6), which would be delivered from August 2017 and would follow a similar model as the Diploma in Marine Engineering Class 3 requiring graduands to have completed 36 months of seatime and targeting mainly experienced seafarers. The qualification covered the Maritime New Zealand requirements for Watchkeeper Deck and provided students with two specialisation options, Officer of the Watch (OOW) and yachting. The delivery of the new programme would need to utilise the new simulator that was scheduled to be installed in September 2017.
19/17 The ADP for the Diploma in Nautical Science was approved to proceed through Approval Procedure B.
4.2.6 New Zealand Diploma in Writing for Creative Industries (Level 5)
Tony Gray welcomed Mary Proctor who joined the meeting to present two ADPs.
Council Open Agenda - 11 May 2017 - For Information
79
SUMMARISED Academic Board Minutes, Meeting of 15 March 2017 Page 3
NMIT would offer the New Zealand Diploma in Writing for Creative Industries (Level 5). The development of the new programme was being led by Toi Ohomai, but was closely based on NMIT’s current Diploma in Writing for Creative Industries, ensuring a smooth transition to the new programme that would be delivered from February 2018. The programme would follow a similar structure as the current programme, but may be split into courses of 10 credits, which would provide a more attractive sizing of components for prospective students. Options for training schemes within the new programme would be explored.20/17 The ADP for the new Zealand Diploma in Writing for Creative Industries was approved to proceed
through Approval Procedure B.
4.2.7 Bachelor of Computer Generated Imagery with Majors in Visual Effects, Real-Time 3D and Research and Development
An ADP was presented for the Bachelor of Computer Generated Imagery with Majors in Visual Effects, Real-Time 3D and Research and Development, which would be developed and delivered in collaboration with Podlance Academy in Auckland. The programme would provide graduates with proficiencies in a range of special effects technologies and applications in a variety of creative industries. In terms of its subject area, the new degree programme would be well placed between the Bachelor of Arts and Media and the Bachelor of Information Technology. The proposal was welcomed but members queried whether NMIT would be able to stay sufficiently ahead of rapid technology developments. Mary Proctor responded that programme delivery would rely on providing guest speakers and contractors to ensure currency of learning and teaching matter. Programme staff would be made up of subject matter specialists and teaching staff. Costings, contractual arrangements and more extensive market research still needed to be finalised. Mary Proctor noted that the addition of this third degree programme may be a step towards developing a common degree programme within the Arts, Media and Digital Technology Department.
21/17 The ADP for the Bachelor of Computer Generated Imagery with Majors in Visual Effects, Real-Time 3D and Research and Development was approved to proceed through Approval Procedure B.
Liam Sloan acknowledged the large number and details of ADPs submitted to this meeting and thanked members for the in-depth and relevant discussions. He noted that considerably more new programmes would need to be initiated for delivery in 2018 as part of the Mandatory Review of Qualifications (MRoQ).
22/17 Resolved that the Academic Board would accept joint ADPs for new programmes replacing programmes leading to expiring qualifications.
4.2.8 New Zealand Certificate in Mechanical Engineering (Level 3)The new programme would replace the currently delivered Toi Ohomai Certificate in Engineering (Level 3) and the Certificate in Basic Mechanical Engineering Trade Skills (BMETS). It was proposed to collaborate with UCOL for the new programme. Members noted that the current programme involved unit standard assessments and that the use of unit standards would need to be carefully considered for any new programme and collaboration partners selected accordingly.
23/17 The ADP for the New Zealand Certificate in Mechanical Engineering (Level 3) was approved to proceed through Approval Procedure B.
4.2.9 New Zealand Certificate in Mechanical Engineering (Trade) Apprenticeship; New Zealand Certificate in Engineering Fabrication (Trade) Apprenticeship and New Zealand Certificate in Construction (Carpentry and Joinery)
Collaboration arrangements were being put in place with UCOL to share their programme and to jointly develop course material for the new engineering apprenticeship programmes. Members noted that a common set of courses that would serve the NMIT as well as Competenz contracted delivery should be considered as part of this programme development.Tony Gray noted that ITOs were likely to be in a strong position through offering apprenticeship training as a fully online model and that ITPs needed to be cautious in order to remain competitive. He noted that he would like this to be discussed at the TANZ ITP CE forum. He emphasised that ITPs needed to articulate more effectively the successful delivery of their apprenticeship models, the positive student and employer feedback and highly ranking qualification completion statistics. He added that ITPs would be adversely affected if the government decided to change apprenticeship funding models. He urged that NMIT needed to be prepared to deal with such changes.
Council Open Agenda - 11 May 2017 - For Information
80
SUMMARISED Academic Board Minutes, Meeting of 15 March 2017 Page 4
24/17 The ADP for the New Zealand Certificate in Mechanical Engineering (Trade) Apprenticeship; New Zealand Certificate in Engineering Fabrication (Trade) Apprenticeship and New Zealand Certificate in Construction (Carpentry and Joinery) was approved to proceed through Approval Procedure B.
4.3 Safety, Health and WellbeingMembers were members to the minutes of the Safety, Health and Wellbeing Working Group Meetings of 23 January and 22 February 2071. Tony Gray advised that the Assura software was now fully implemented and being well used. There had been a considerable increase in reporting of near-miss incidents since the implementation of the new software.
25/17 The minutes of the Safety, Health and Wellbeing Working Group meetings of 23 January 2017 and 22 February 2017 were received.
4.4 Self-Assessment, Internal Review and EER
4.4.1 Self-Assessmentfollowing items were noted:Focus on preparing for EER (compiling programme profiles, communications, stakeholder preparation workshops); 2016 SARs for the programme areas in scope for EER had been reviewed and were in the process of being supplied to the Evaluation Panel; Draft 2016 SAR status for all programmes as of 15 March 2017: 73% were complete and 27% in progress. All Programme Coordinators and/or HODs had been in touch regarding the in-progress ones; HOD/DHOD/Programme Coordinator PD Training on Self-Assessment had occurred.
4.4.2 Internal ReviewThe following items were noted:2 Internal Review reports would be tabled for endorsement at the next Quality Committee meeting: Learner Feedback/ The Student Voice (application of process) and Certificate in Community Support Services (Care of the Older Person); Due to competing priorities four Internal Reviews were yet to be finalised:
4.4.3 External Evaluation and Review (EER) 2017Liam Sloan advised the programmes confirmed for the EER scope as well as the EER dates and panel members.
4.5 Other Academic and Quality Projects
4.5.1 Internal Credit TransferMembers were advised that the Central Academic Committee (CAC) had recommended a simplification of the Internal Credit Transfer process. It was proposed that for Internal Credit Transfer approval would be delegated to the CAC Chair.
26/17 The responsibility for receiving and approving Internal Credit Transfer applications was delegated to the Chair of the Central Academic Committee for such applications to be processed at any point in time.
4.5.2 2016 NMIT Provisional EPIs – TEC ConfirmedTony Gray referred members to the provisional EPIs for NMIT as confirmed by TEC from the December 2016 SDR submitted at the end of January 2017 with final EPI figures determined following the April 2017 SDR. Tony Gray commended the provisional 81% course completion and 70% qualification completion rates, which placed NMIT into the upper quartile of EPI results.Liam Sloan commented on the completion rates for Māori and Pasifika students, which were around 10% below the overall completion rates. He noted that NMIT was aware that it was not significantly narrowing this gap and needed to look at ways of improving them.
5. REPORTS FROM COMMITTEES AND WORKING PARTIES
5.1 Programme Approval Committee, Trainee Ranger Kaitiaki Whenua, 15 February 2017A Programme Approval Committee had met to consider the the Trainee Ranger Kaitiaki Whenua programmewhich would replace the current Trainee Ranger Certificate and lead to the New Zealand Certificate in
Council Open Agenda - 11 May 2017 - For Information
81
SUMMARISED Academic Board Minutes, Meeting of 15 March 2017 Page 5
Conservation (Trainee Ranger). The work gone into this development by Beth Endres in consultation with DOC was commended. Apart from the traditional face-to-face and blended delivery modes the programme would also be provided through a marae-based noho delivery option allowing training to better incorporate aspects of tikanga and whanau. It was noted that NMIT had been closely involved in developing this qualification and was maintaining ongoing close contacts with industries involved in this programme.
27/17 The Traineer Ranger Kaitiaki Whenua programme leading to the New Zealand Certificate in Conservation (Operations) (Level 4), and application to NZQA for programme approval and accreditation were approved.
5.2 Quality Committee Meetings of 19 January and 16 February 2017Quality Committee meetings had featured a remainder of 19 documents requiring to be updated (from a figure of 97 at the end of 2015). Eleanor Upton had created a QMS induction video which provided an overview of NMIT’s QMS and was available through the Academic and Quality Intranet page.Committee had commended the Internal Review report for the cookery programmes.
28/17 The minutes of the Quality Committee meetings of 19 January and 16 February 2017 were received.
5.3 Research and Ethics Committee Meeting of 2 March 2017Staff research plans had progressed in all programme areas and HoDs had been allocating research hours appropriately. 2016 had been a successful year for NMIT in producing quality research outputs. Sarah Fraser was commended on progressing with her PhD and for receiving an acknowledgement from Otago University on the quality of her thesis which was considered to be within the top 10% of the country.
29/17 The minutes of the Research and Ethics Committee meeting of 2 March 2017 were received.
5.4 Learning and Teaching Committee of 27 February 2017Three priorities had identified for the Committee for the 2017 academic year: Assessment practice, including the revision of frequency of employer engagement and spreading of assessment events over the year; Improving professional development for teaching teams, including opportunities to see excellence practice outside of NMIT; and Continuing to build on the work around mentoring
6. GENERAL BUSINESS
6.1 Approval of Course and Programme Changes30/15 The approval of the above course and programme changes was endorsed.
6.2 Approval of Academic Seals31/15 The academic seals issued since 17 November 2016 were approved:
MEETING CLOSURE: The meeting closed at 5.15 pm.
NELSON MARLBOROUGH INSTITUTE OF TECHNOLOGY ACADEMIC BOARD MEETING 15 MARCH 2017ACTION LIST
RES NO ACTION WHO WHEN PROGRESSAction items still to be completed:
1 Provide Academic Board with an update on learning conversations early in 2017.
C Crawford May 2017 meeting
New Action Items:2 Raise issue around timeframes for expiring and
discontinuing qualifications at NZQA ITP Advisory Committee.
T Gray Next NZQA ITPAdvisory Committee meeting
3 Raise concerns in relation to potential changes to apprenticeship funding models at ITP CE Forum
T Gray Next ITP CE Forum meeting
4 Send letter of congratulation from Academic Board to Sarah Fraser on achieving PhD and acknowledged quality of her thesis.
T Gray asap
Council Open Agenda - 11 May 2017 - For Information
82
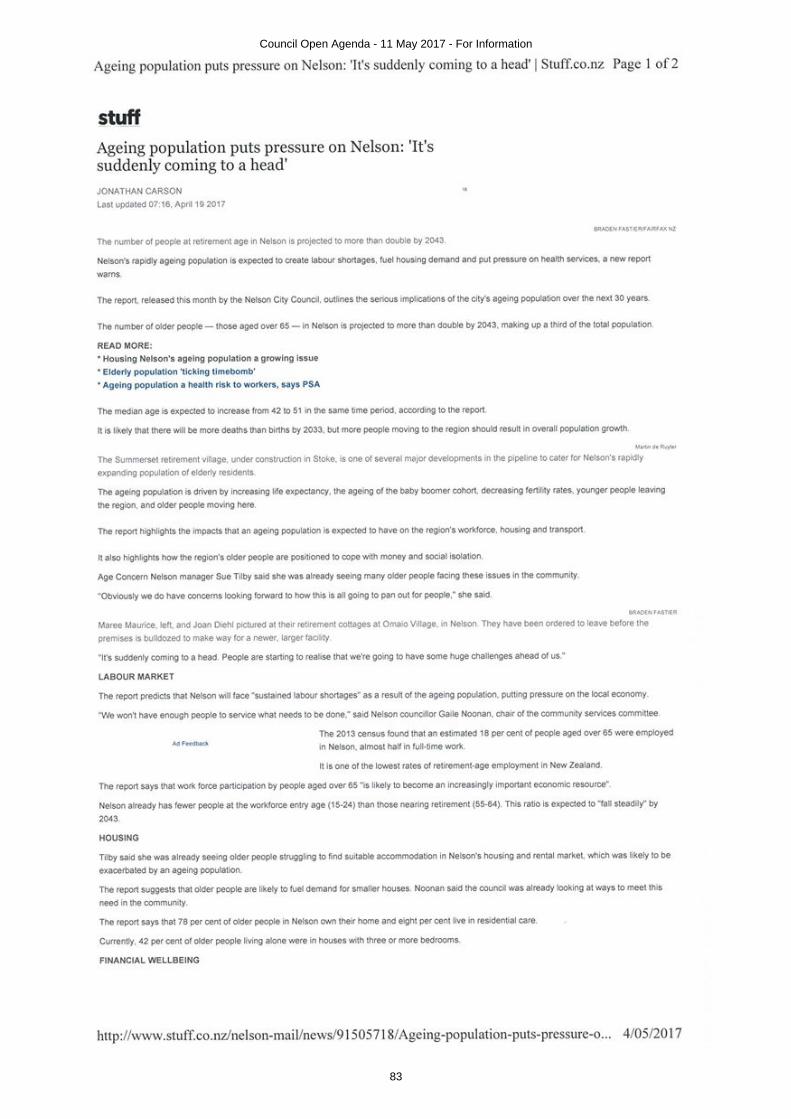
Council Open Agenda - 11 May 2017 - For Information
83
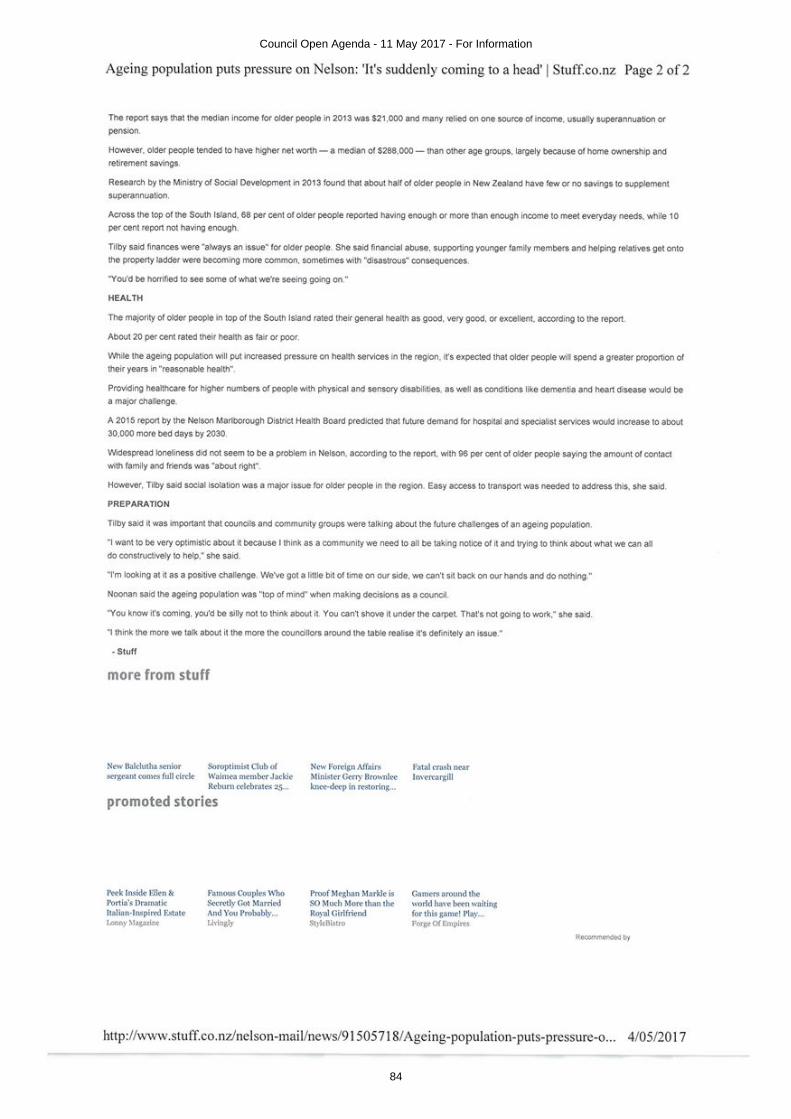
Council Open Agenda - 11 May 2017 - For Information
84
INCOME & EXPENDITURE REPORT 2017
Council Open Agenda - 11 May 2017 - For Information
85
CONTENTSForeword......................................................................................................................................2From the Author........................................................................................................................3Chapter 1: The Typical Student...............................................................................................4 Introduction.....................................................................................................................4 The Typical Student in 2017...........................................................................................6 Parents’ Educational Background.................................................................................6Chapter 2: The Rising Cost......................................................................................................8 Housing............................................................................................................................8 Student Spending..........................................................................................................11 Tuition Fees...................................................................................................................13 SignificantFinancialDistress.............................................................................................14Chapter 3: Making Ends Meet....................................................................................................16 Student Employment..........................................................................................................16 Student Support..................................................................................................................17 Changes to Student Support 2010-2016....................................................................20Chapter 4: The Debt Burden.......................................................................................................21 Student Loans......................................................................................................................21 Repayment Times...............................................................................................................23Chapter 5: Where to From Here................................................................................................25References and Further Reading...............................................................................................26
The New Zealand Union of Students’ Associ-ations (NZUSA) is the national voice of stu-
dents in tertiary education.
Founded in 1929, NZUSA has a leadership role in facilitating pro-student campaigns, undertaking research about the impact of tertiary education policy, monitoring edu-cation quality throughout New Zealand and lobbying policy-makers to create positive
outcomes for students.
www.students.org.nz
We wish to thank all students who completed this important survey, as well as the students who submitted their stories. Thank you for shedding light on the reality of student life in New Zealand. We also extend special thanks to our amazing designer (and
student) Tamatha Paul.
ACKNOWLEDGEMENTS
Council Open Agenda - 11 May 2017 - For Information
86

THE COST OF BEING A STUDENT IN NEW ZEALAND
FOREWORDGetting a tertiary education is one of the most valuable investments we can make in our lives, but for many, the journey is a struggle.
As the average rent for a room in Auckland soars to $250 while the level of student support remains virtually stagnant, it’s no wonder why a third of students say they do not have the income to meet their basic needs. Since 2011, when the parental income threshold for eligibility was frozen, 24,000 fewer students have access to the Student Allowance. Today, only a third of full-time students receive a Student Allowance. The rest borrow week to week in order to live and add to the national student loan balance which now exceeds $15 billion.
When 78% of students feel that their debt will have a significant impact on their ability to save for their retirement, it’s clear that student hardship presents some very real public policy issues.
The Income and Expenditure Report 2017 aims to shine a light on the real cost of being a student in New Zealand. It gives us an insight into the trials, tribulations and anxieties of today’s students, as well as credible, representative data with which to make important decisions regarding tertiary education policy.
After reading this report, I hope you’ll join us in putting things right.
Jonathan GeeNational PresidentNew Zealand Union of Students’ Associations
2
Council Open Agenda - 11 May 2017 - For Information
87
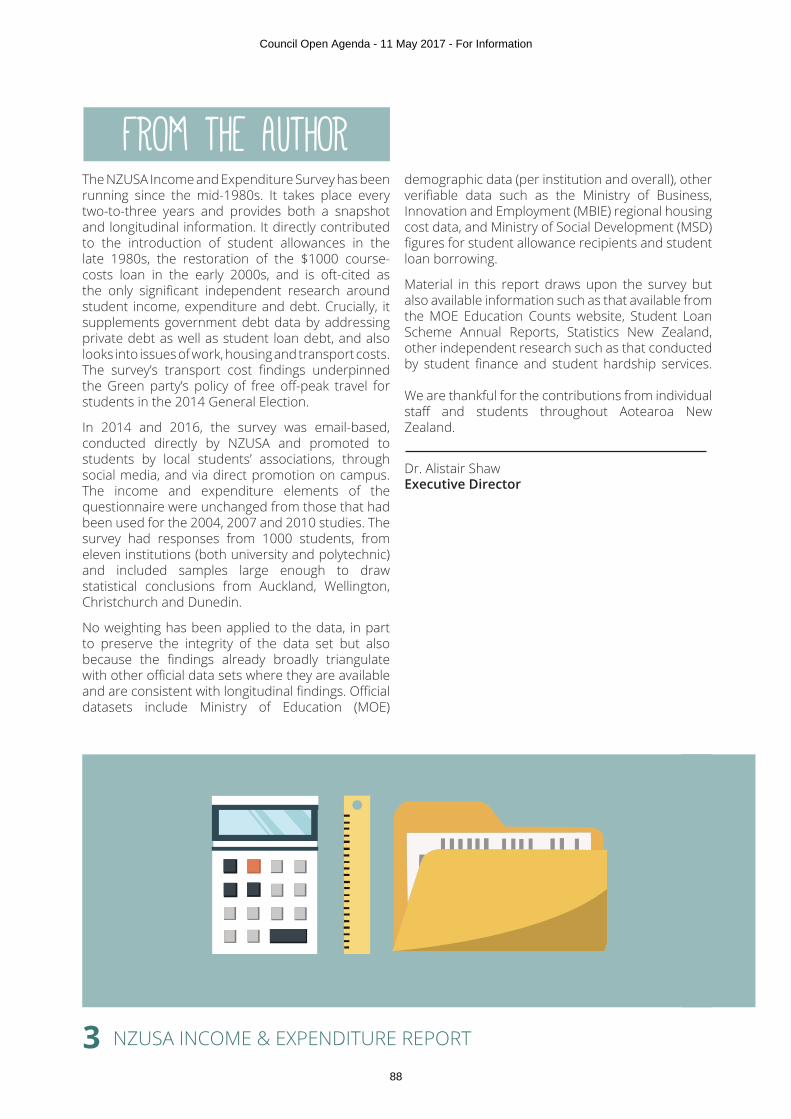
NZUSA INCOME & EXPENDITURE REPORT
The NZUSA Income and Expenditure Survey has been running since the mid-1980s. It takes place every two-to-three years and provides both a snapshot and longitudinal information. It directly contributed to the introduction of student allowances in the late 1980s, the restoration of the $1000 course-costs loan in the early 2000s, and is oft-cited as the only significant independent research around student income, expenditure and debt. Crucially, it supplements government debt data by addressing private debt as well as student loan debt, and also looks into issues of work, housing and transport costs. The survey’s transport cost findings underpinned the Green party’s policy of free off-peak travel for students in the 2014 General Election.
In 2014 and 2016, the survey was email-based, conducted directly by NZUSA and promoted to students by local students’ associations, through social media, and via direct promotion on campus. The income and expenditure elements of the questionnaire were unchanged from those that had been used for the 2004, 2007 and 2010 studies. The survey had responses from 1000 students, from eleven institutions (both university and polytechnic) and included samples large enough to draw statistical conclusions from Auckland, Wellington, Christchurch and Dunedin.
No weighting has been applied to the data, in part to preserve the integrity of the data set but also because the findings already broadly triangulate with other official data sets where they are available and are consistent with longitudinal findings. Official datasets include Ministry of Education (MOE)
demographic data (per institution and overall), other verifiable data such as the Ministry of Business, Innovation and Employment (MBIE) regional housing cost data, and Ministry of Social Development (MSD) figures for student allowance recipients and student loan borrowing.
Material in this report draws upon the survey but also available information such as that available from the MOE Education Counts website, Student Loan Scheme Annual Reports, Statistics New Zealand, other independent research such as that conducted by student finance and student hardship services. We are thankful for the contributions from individual staff and students throughout Aotearoa New Zealand.
Dr. Alistair ShawExecutive Director
FROM THE AUTHOR
3
Council Open Agenda - 11 May 2017 - For Information
88

THE COST OF BEING A STUDENT IN NEW ZEALAND
CHAPTER ONE: THE TYPICAL STUDENTINTRODUCTIONThe amount of money that I am able to get/borrow is barely enough to survive, but the course load is too full on to work a full-time job. The stress is killing me. (Student, Wellington, 19)
The cost of being a student continues to increase, particularly the cost of housing, but the support for it has failed to keep pace. The support available has essentially been pegged at $40 per week via the accommodation benefit, even for the minority of students who have access to student allowances. The loan available to help with the costs related to the direct costs of learning (course costs) was introduced in 1993 at $1000 per year. In 2017 it is still $1000 per year.
Increasingly, students qualify for no government grants since the qualifying parental income threshold for student allowances has been frozen since 2012. It now begins to abate at just 44% of the average income for a two-parent household aged in their late-40s (i.e. the average age of an 18 year-old school leaver’s parents). It is fully abated, meaning the student is entitled to nothing, at 70% of the average two-parent household income.
Although many students bemoan the fact that they are considered to be dependent on parents who cannot afford to support them, respondents report that contribution of parents to the week-
A QUESTION OF ACCESS
WHAT TYPE OF SECONDARY SCHOOL DID YOU GO TO?
0% 20% 40% 60% 80% 100%
15.70%
84.30%KEY:
STATE OR INTEGRATED HIGH SCHOOLPRIVATE SCHOOL
to-week costs of being a student is growing. This raises considerable concerns about access to tertiary education for those whose parents are unable to help at all. Also, the increasingly different circumstances that students from whom the same work in their classes is expected are facing in terms of pressures on their time. Particular symptoms of these pressures are the increase in the number of students living at home, and the pressure that ‘destination’ institutions are under to maintain their student numbers.
In their late-40s, as their children enter tertiary education, parents are increasingly likely to be carrying their own debt as housing and other costs for families are increasing. Although trying, many find themselves unable to support their children in tertiary education to the level that the current regime assumes.
Worryingly, university students are less reflective of the population: three times more likely to have gone to private school, and their parents far more likely to have higher quaifications than the norm.
The combination of reduced government support and unavailable parental support has led to a spiralling of student debt as increasingly students borrow to live, from multiple sources, a consolidation of recent increases in student working hours, a dramatic fall in the numbers of students in tertiary education, and increased student poverty.
RISING DEBT
4
“
Council Open Agenda - 11 May 2017 - For Information
89
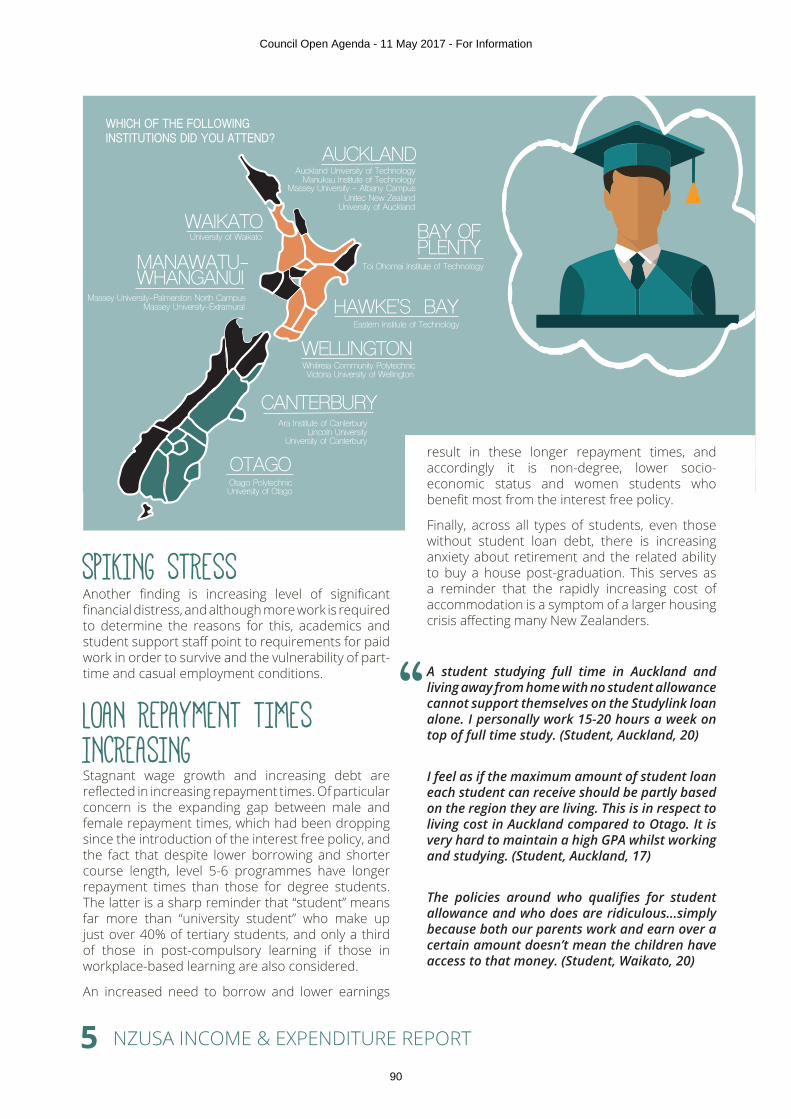
NZUSA INCOME & EXPENDITURE REPORT
SPIKING STRESSAnother finding is increasing level of significant financial distress, and although more work is required to determine the reasons for this, academics and student support staff point to requirements for paid work in order to survive and the vulnerability of part-time and casual employment conditions.
Stagnant wage growth and increasing debt are reflected in increasing repayment times. Of particular concern is the expanding gap between male and female repayment times, which had been dropping since the introduction of the interest free policy, and the fact that despite lower borrowing and shorter course length, level 5-6 programmes have longer repayment times than those for degree students. The latter is a sharp reminder that “student” means far more than “university student” who make up just over 40% of tertiary students, and only a third of those in post-compulsory learning if those in workplace-based learning are also considered.
An increased need to borrow and lower earnings
LOAN REPAYMENT TIMES INCREASING
AUCKLAND
WAIKATO BAY OF PLENTY
MANAWATU-WHANGANUI
WELLINGTON
CANTERBURY
OTAGO
Auckland University of TechnologyManukau Institute of Technology
Unitec New ZealandUniversity of Auckland
University of Waikato
Toi Ohomai Institute of Technology
Whitireia Community PolytechnicVictoria University of Wellington
Massey University-Palmerston North Campus
Ara Institute of Canterbury
University of Canterbury
Otago PolytechnicUniversity of Otago
HAWKE’S BAYEastern Institute of Technology
WHICH OF THE FOLLOWINGINSTITUTIONS DID YOU ATTEND?
Massey University - Albany Campus
Massey University-Extramural
Lincoln University
result in these longer repayment times, and accordingly it is non-degree, lower socio-economic status and women students who benefit most from the interest free policy.
Finally, across all types of students, even those without student loan debt, there is increasing anxiety about retirement and the related ability to buy a house post-graduation. This serves as a reminder that the rapidly increasing cost of accommodation is a symptom of a larger housing crisis affecting many New Zealanders.
A student studying full time in Auckland and living away from home with no student allowance cannot support themselves on the Studylink loan alone. I personally work 15-20 hours a week on top of full time study. (Student, Auckland, 20)
I feel as if the maximum amount of student loan each student can receive should be partly based on the region they are living. This is in respect to living cost in Auckland compared to Otago. It is very hard to maintain a high GPA whilst working and studying. (Student, Auckland, 17)
The policies around who qualifies for student allowance and who does are ridiculous...simply because both our parents work and earn over a certain amount doesn’t mean the children have access to that money. (Student, Waikato, 20)
5
“
Council Open Agenda - 11 May 2017 - For Information
90
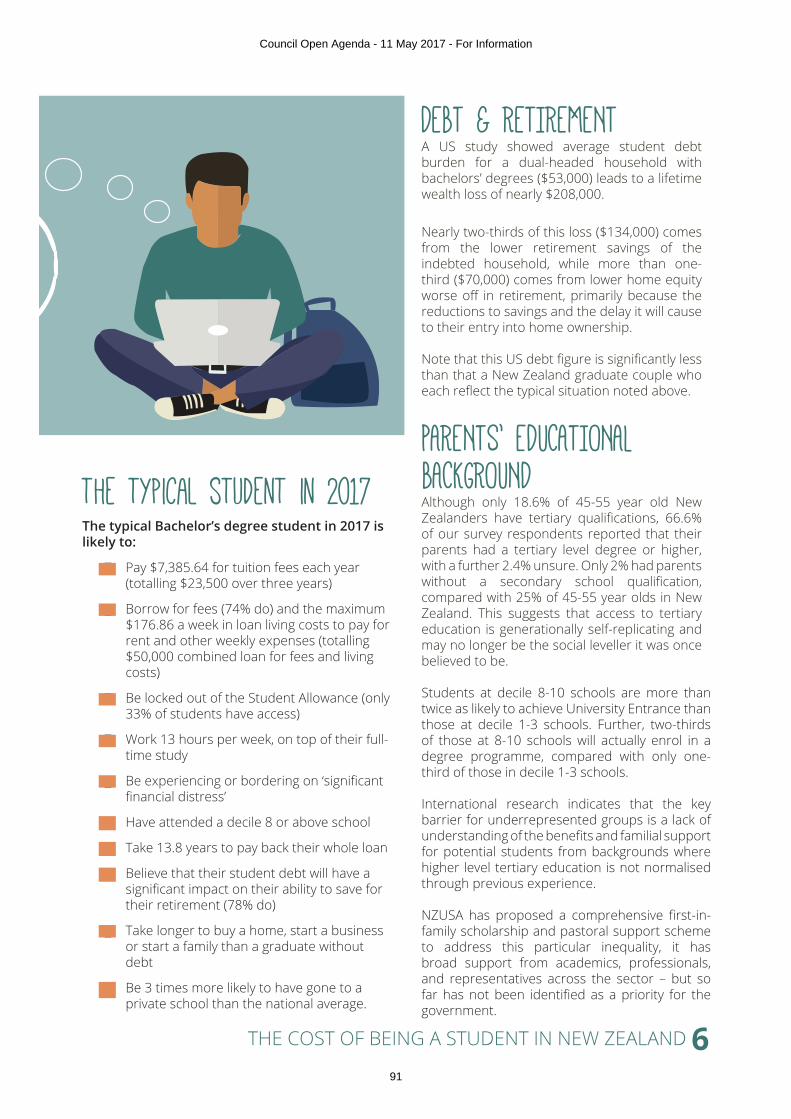
THE COST OF BEING A STUDENT IN NEW ZEALAND
the typical student in 2017The typical Bachelor’s degree student in 2017 is likely to:
· Pay $7,385.64 for tuition fees each year (totalling $23,500 over three years)
· Borrow for fees (74% do) and the maximum $176.86 a week in loan living costs to pay for rent and other weekly expenses (totalling $50,000 combined loan for fees and living costs)
· Be locked out of the Student Allowance (only 33% of students have access)
· Work 13 hours per week, on top of their full-time study
· Be experiencing or bordering on ‘significant financial distress’
· Have attended a decile 8 or above school
· Take 13.8 years to pay back their whole loan
· Believe that their student debt will have a significant impact on their ability to save for their retirement (78% do)
· Take longer to buy a home, start a business or start a family than a graduate without debt
· Be 3 times more likely to have gone to a private school than the national average.
A US study showed average student debt burden for a dual-headed household with bachelors’ degrees ($53,000) leads to a lifetime wealth loss of nearly $208,000.
Nearly two-thirds of this loss ($134,000) comes from the lower retirement savings of the indebted household, while more than one-third ($70,000) comes from lower home equity worse off in retirement, primarily because the reductions to savings and the delay it will cause to their entry into home ownership.
Note that this US debt figure is significantly less than that a New Zealand graduate couple who each reflect the typical situation noted above.
Although only 18.6% of 45-55 year old New Zealanders have tertiary qualifications, 66.6% of our survey respondents reported that their parents had a tertiary level degree or higher, with a further 2.4% unsure. Only 2% had parents without a secondary school qualification, compared with 25% of 45-55 year olds in New Zealand. This suggests that access to tertiary education is generationally self-replicating and may no longer be the social leveller it was once believed to be.
Students at decile 8-10 schools are more than twice as likely to achieve University Entrance than those at decile 1-3 schools. Further, two-thirds of those at 8-10 schools will actually enrol in a degree programme, compared with only one-third of those in decile 1-3 schools.
International research indicates that the key barrier for underrepresented groups is a lack of understanding of the benefits and familial support for potential students from backgrounds where higher level tertiary education is not normalised through previous experience.
NZUSA has proposed a comprehensive first-in-family scholarship and pastoral support scheme to address this particular inequality, it has broad support from academics, professionals, and representatives across the sector – but so far has not been identified as a priority for the government.
PARENTS’ EDUCATIONALBACKGROUND
6
DEBT & RETIREMENT
Council Open Agenda - 11 May 2017 - For Information
91
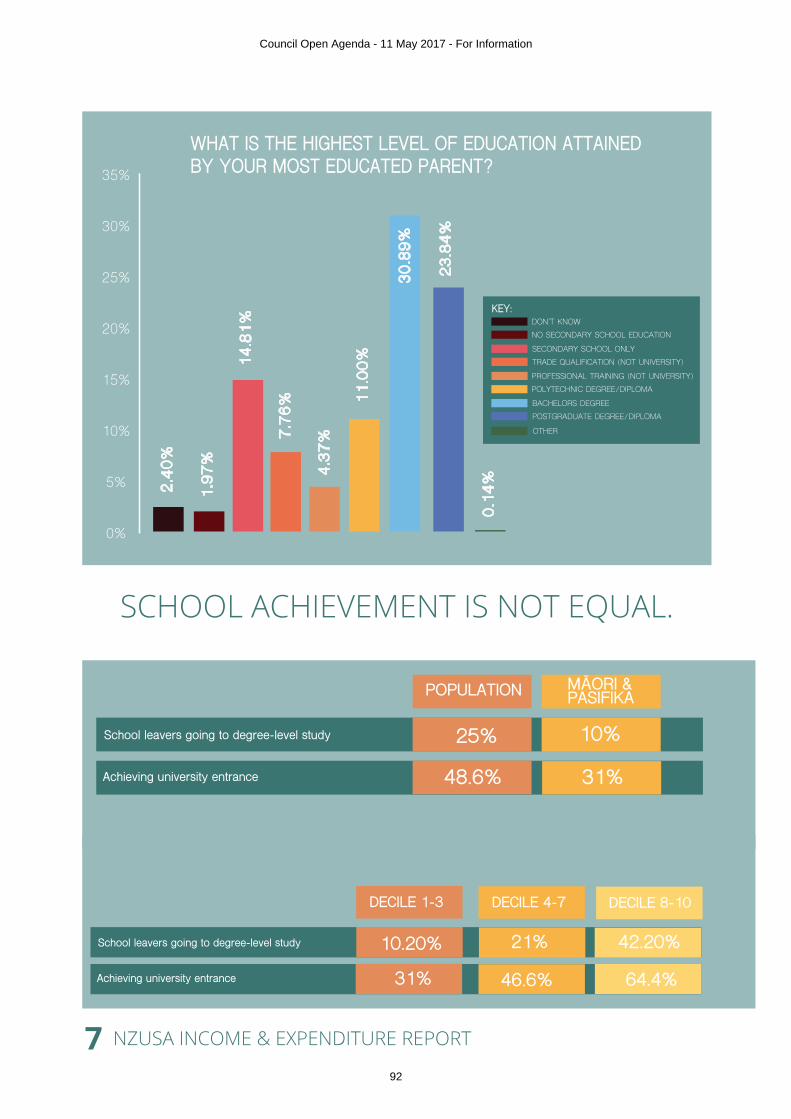
NZUSA INCOME & EXPENDITURE REPORT
WHAT IS THE HIGHEST LEVEL OF EDUCATION ATTAINEDBY YOUR MOST EDUCATED PARENT?
0%
5%
10%
15%
20%
25%
30%
35%2.
40%
1.97
%
14.8
1%
7.76
%
4.37
%
11.0
0%
30.8
9%
23.8
4%
0.14
%
NO SECONDARY SCHOOL EDUCATIONDON’T KNOW
KEY:
TRADE QUALIFICATION (NOT UNIVERSITY)SECONDARY SCHOOL ONLY
POLYTECHNIC DEGREE/DIPLOMAPROFESSIONAL TRAINING (NOT UNIVERSITY)
POSTGRADUATE DEGREE/DIPLOMABACHELORS DEGREE
OTHER
SCHOOL ACHIEVEMENT IS NOT EQUAL.
School leavers going to degree-level study
Achieving university entrance
DECILE 1-3 DECILE 4-7 DECILE 8-10
10.20%
31%
21%
46.6%
42.20%
64.4%
POPULATION MĀORI &PASIFIKA
School leavers going to degree-level study
Achieving university entrance
25% 10%
48.6% 31%
7
Council Open Agenda - 11 May 2017 - For Information
92

THE COST OF BEING A STUDENT IN NEW ZEALAND
CHAPTER TWO: THE RISING COST
Living costs from Studylink should be scaled and based on the city you are studying according to the average cost of rent in that city. $176 is not an adequate amount for someone living in Auckland when the average cost of rent is more than that on its own. (Student, Auckland, 19)
The rapidly increasing cost of housing is the big story in this study. Students are suffering as the support they are entitled to for help with housing costs fails to keep pace with rapidly rising rents.
A student allowance includes an element for help with rent, but on a different basis than all other low income New Zealanders are eligible for. Housing support for students is capped at a maximum of $40 per week, and has been since 2001. In contrast, the Accommodation Supplement – that every low income New Zealander who is not a student is entitled to – provides support of up to $145 per week for a single person living in certain parts of Auckland, and $100 per week if you live in other relatively expensive places such as Wellington or Hamilton.
This means that there is no immediate financial incentive to move from a benefit into study, or from a low-paid job into having a qualification that could potentially move someone out of poverty in the long term. Instead, potential students face the immediate
HOUSING impact of losing up to $105 per week in their available funds, depending upon where they live.
The Accommodation Benefit for students is set at 50% of average rental costs in a particular location above $40 per week, with a maximum payment of $40. Auckland reached this maximum in 2003. Wellington reached it shortly afterwards in 2005, and New Plymouth in 2009. Even in relatively low-cost Dunedin, where rents are below the national average, the cap was reached in 2012. In Christchurch, the cap was hit in 2008, even before the effects of the earthquake sent student rents sky-high, although they have come off their peak more recently.
In Budget 2015, the National-led Government announced an extension of the equivalent of the Accommodation Supplement to be paid to sole parents in conjunction with their student allowance. This is a welcome initiative to make it easier for sole parents to engage in tertiary study, but if the current scheme is recognised as unfair for sole parents it must also be unfair for everyone else seeking a tertiary education with equally impossible living costs. A promise to extend this to other beneficiaries is still outstanding.
The failure to keep pace with rising costs means that students getting allowances, who by definition cannot get support from their parents, simply cannot afford to study.
WHERE HAVE YOU BEEN LIVING DURING THE 2016 ACADEMIC YEAR?
47.52%1.41%
37.77%
1.41%
0% 10% 20% 30% 40% 50%
11.88%
1.41%
YOUR OWN HOME
RENTAL HOME / FLATKEY:
HOSTEL / HALL OF RESIDENCE
PRIVATE BOARD
PARENT’S HOME
8
“
Council Open Agenda - 11 May 2017 - For Information
93
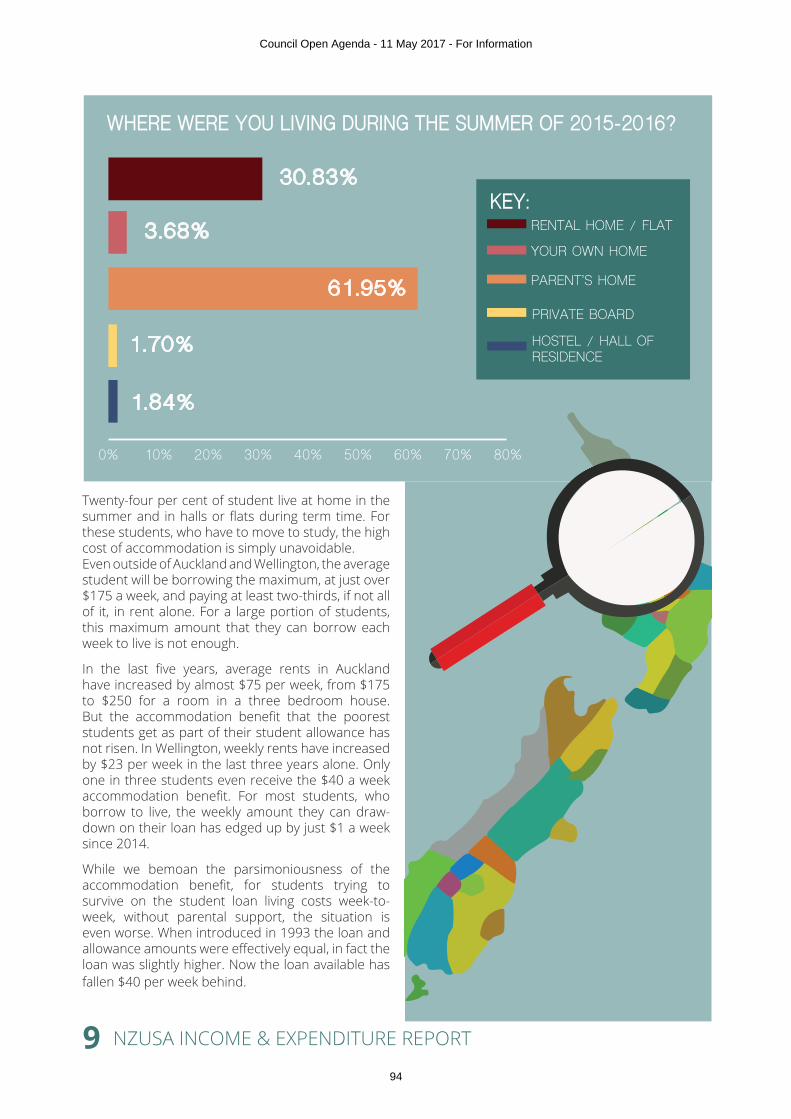
NZUSA INCOME & EXPENDITURE REPORT
Twenty-four per cent of student live at home in the summer and in halls or flats during term time. For these students, who have to move to study, the high cost of accommodation is simply unavoidable.Even outside of Auckland and Wellington, the average student will be borrowing the maximum, at just over $175 a week, and paying at least two-thirds, if not all of it, in rent alone. For a large portion of students, this maximum amount that they can borrow each week to live is not enough.
In the last five years, average rents in Auckland have increased by almost $75 per week, from $175 to $250 for a room in a three bedroom house. But the accommodation benefit that the poorest students get as part of their student allowance has not risen. In Wellington, weekly rents have increased by $23 per week in the last three years alone. Only one in three students even receive the $40 a week accommodation benefit. For most students, who borrow to live, the weekly amount they can draw-down on their loan has edged up by just $1 a week since 2014.
While we bemoan the parsimoniousness of the accommodation benefit, for students trying to survive on the student loan living costs week-to-week, without parental support, the situation is even worse. When introduced in 1993 the loan and allowance amounts were effectively equal, in fact the loan was slightly higher. Now the loan available has fallen $40 per week behind.
WHERE WERE YOU LIVING DURING THE SUMMER OF 2015-2016?
0% 10% 20% 30% 40% 50% 60% 70% 80%
30.83%
3.68%
61.95%
1.70%
1.84%
YOUR OWN HOME
RENTAL HOME / FLATKEY:
HOSTEL / HALL OF RESIDENCE
PRIVATE BOARD
PARENT’S HOME
9
Council Open Agenda - 11 May 2017 - For Information
94
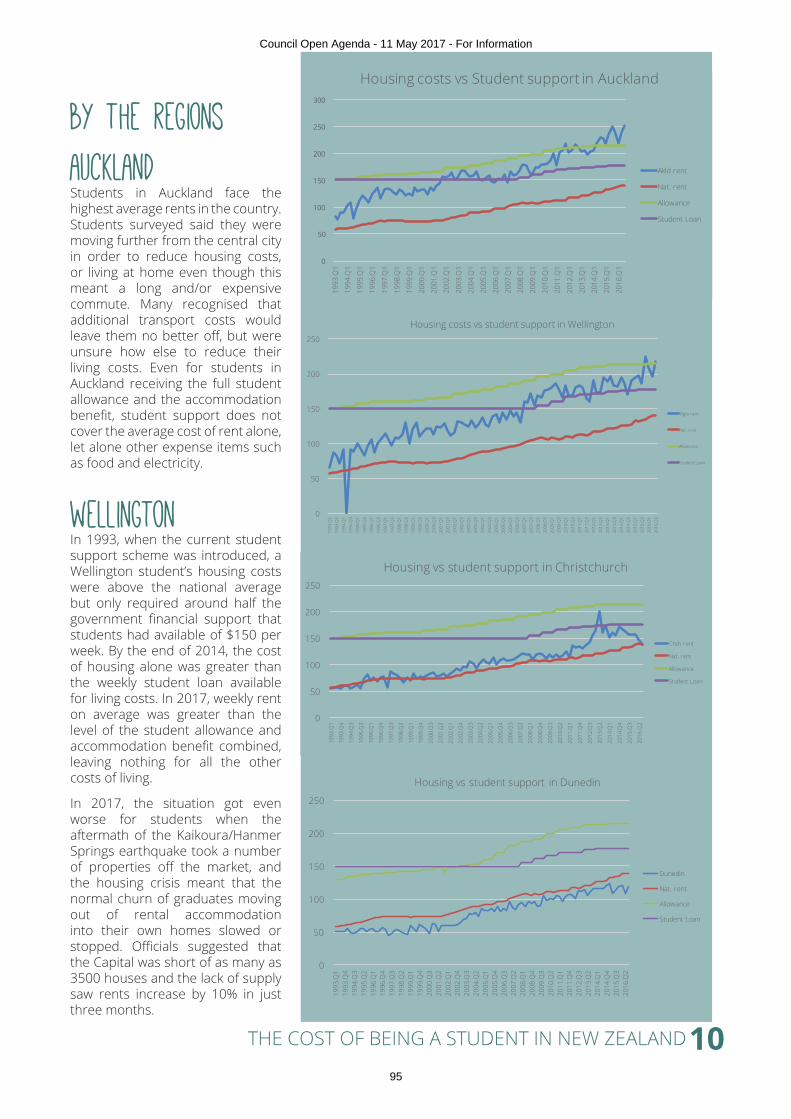
THE COST OF BEING A STUDENT IN NEW ZEALAND
by the regionsaucklandStudents in Auckland face the highest average rents in the country. Students surveyed said they were moving further from the central city in order to reduce housing costs, or living at home even though this meant a long and/or expensive commute. Many recognised that additional transport costs would leave them no better off, but were unsure how else to reduce their living costs. Even for students in Auckland receiving the full student allowance and the accommodation benefit, student support does not cover the average cost of rent alone, let alone other expense items such as food and electricity.
In 1993, when the current student support scheme was introduced, a Wellington student’s housing costs were above the national average but only required around half the government financial support that students had available of $150 per week. By the end of 2014, the cost of housing alone was greater than the weekly student loan available for living costs. In 2017, weekly rent on average was greater than the level of the student allowance and accommodation benefit combined, leaving nothing for all the other costs of living.
In 2017, the situation got even worse for students when the aftermath of the Kaikoura/Hanmer Springs earthquake took a number of properties off the market, and the housing crisis meant that the normal churn of graduates moving out of rental accommodation into their own homes slowed or stopped. Officials suggested that the Capital was short of as many as 3500 houses and the lack of supply saw rents increase by 10% in just three months.
0
50
100
150
200
250
300
1993
.Q1
1994
.Q1
1995
.Q1
1996
.Q1
1997
.Q1
1998
.Q1
1999
.Q1
2000
.Q1
2001
.Q1
2002
.Q1
2003
.Q1
2004
.Q1
2005
.Q1
2006
.Q1
2007
.Q1
2008
.Q1
2009
.Q1
2010
.Q1
2011
.Q1
2012
.Q1
2013
.Q1
2014
.Q1
2015
.Q1
2016
.Q1
Housing costs vs Student support in Auckland
Akld rent
Nat. rent
Allowance
Student Loan
0
50
100
150
200
25019
93.Q
119
93.Q
319
94.Q
119
94.Q
319
95.Q
119
95.Q
319
96.Q
119
96.Q
319
97.Q
119
97.Q
319
98.Q
119
98.Q
319
99.Q
119
99.Q
320
00.Q
120
00.Q
320
01.Q
120
01.Q
320
02.Q
120
02.Q
320
03.Q
120
03.Q
320
04.Q
120
04.Q
320
05.Q
120
05.Q
320
06.Q
120
06.Q
320
07.Q
120
07.Q
320
08.Q
120
08.Q
320
09.Q
120
09.Q
320
10.Q
120
10.Q
320
11.Q
120
11.Q
320
12.Q
120
12.Q
320
13.Q
120
13.Q
320
14.Q
120
14.Q
320
15.Q
120
15.Q
320
16.Q
120
16.Q
3
Housing costs vs student support in Wellington
Wgtn rent
Nat. rent
Allowance
Student Loan
wellington
0
50
100
150
200
250
1993
.Q1
1993
.Q4
1994
.Q3
1995
.Q2
1996
.Q1
1996
.Q4
1997
.Q3
1998
.Q2
1999
.Q1
1999
.Q4
2000
.Q3
2001
.Q2
2002
.Q1
2002
.Q4
2003
.Q3
2004
.Q2
2005
.Q1
2005
.Q4
2006
.Q3
2007
.Q2
2008
.Q1
2008
.Q4
2009
.Q3
2010
.Q2
2011
.Q1
2011
.Q4
2012
.Q3
2013
.Q2
2014
.Q1
2014
.Q4
2015
.Q3
2016
.Q2
Housing vs student support in Christchurch
Chch rent
Nat. rent
Allowance
Student Loan
0
50
100
150
200
250
1993
.Q1
1993
.Q4
1994
.Q3
1995
.Q2
1996
.Q1
1996
.Q4
1997
.Q3
1998
.Q2
1999
.Q1
1999
.Q4
2000
.Q3
2001
.Q2
2002
.Q1
2002
.Q4
2003
.Q3
2004
.Q2
2005
.Q1
2005
.Q4
2006
.Q3
2007
.Q2
2008
.Q1
2008
.Q4
2009
.Q3
2010
.Q2
2011
.Q1
2011
.Q4
2012
.Q3
2013
.Q2
2014
.Q1
2014
.Q4
2015
.Q3
2016
.Q2
Housing vs student support in Dunedin
Dunedin
Nat. rent
Allowance
Student Loan
10
Council Open Agenda - 11 May 2017 - For Information
95

NZUSA INCOME & EXPENDITURE REPORT
CHRISTCHURCHChristchurch students’ housing costs had been tracking at approximately the national average until the earthquakes in 2011/2012. Housing costs then skyrocketed as supply fell and an influx of contractors and families from Christchurch East into the western suburbs saw demand for the sort of housing used by students increase dramatically. Although it has tailed off slightly, it has still not reduced to pre-earthquake levels. Housing now represent 90% of the weekly student loan available for living costs. Over 60 per cent of University of Canterbury and Lincoln University students are now ineligible for student allowance and therefore rely on the $176.86 living costs component of the student loan.
In Dunedin, housing costs have traditionally sat just below the national average. In 1993, housing costs were 50% of the student support available. By 2015, rent prices had increased up to 66% of weekly income, excluding students living in halls of residence. Halls students pay on average $359.37 per week for rent. Although students who are flatting receiving student allowances in Dunedin have $100 per week to spend after rent, this represented just 35% of University of Otago students who were eligible in 2014, down from 44% in 2010, and likely having dropped even more since.
Students have suffered poor accommodation conditions for many years, many living in cold and damp flats that make them sick. These set of circumstances have contributed to government initiatives to improve housing conditions, namely through enhancing the minimum rental standard, and improving compliance measures, an initiative in partnership with students’ associations.
However, the housing shortage has reduced the effectiveness of the initiatives due to increased power imbalance between landlords and desperate students struggling to find a flat. This keeps substandard housing in the market instead of requiring it to be brought up to the required insulation standard.
Why don’t students living in Auckland receive additional accommodation/cost of living supplements? Allowance should be relative to cost of living in the city you reside! (Student, Auckland, 24)
DUNEDIN
IMPLICATIONS
STUDENT SPENDINGThe survey reveals that the increases in student expenditure on housing costs have been accompanied by static spending on almost all other items, suggesting that the rapid increase in housing has been so significant that it has crowded out all other expenditure.
Total average student spending is $17,661 per year (or $339.63 per week) and the median is $15,615 ($300.28 per week). Both are significantly more than the student support that is available of allowances plus accommodation benefit of $11,180 and $9,152 for the living costs loan, if these were available throughout the whole 52 weeks of the year. For those in our sample who were flatting, the average and median costs for the year were $23,167 and $18,780, or $445.52 and $361.15 on a weekly basis respectively. Therefore, on average, a student receiving the student allowance needs $230 per week from family or from work, and a student relying on the living cost loan needs $270 per week from one or both of those sources.
In addition to regular costs, we also asked students to identify the one-off costs that they experienced during the year. They suggest a high degree of frugality.
We buy our own materials, finding storage and transport for our materials and works… it can make things very difficult if you have to work even part-time depending on the types of study you are in, and some of us pay so much more on top of university fees because of material costs. (Female, Auckland, 18)
11
““
Council Open Agenda - 11 May 2017 - For Information
96
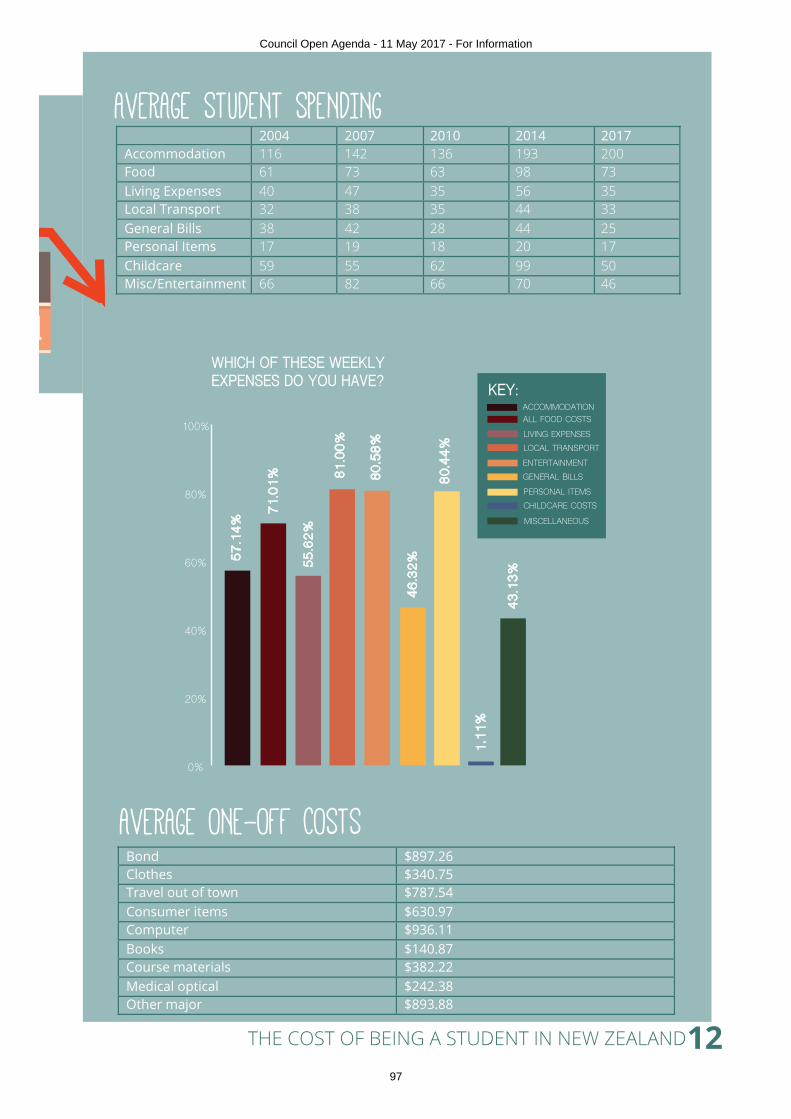
THE COST OF BEING A STUDENT IN NEW ZEALAND
2004 2007 2010 2014 2017 Accommodation 116 142 136 193 200 Food 61 73 63 98 73 Living Expenses 40 47 35 56 35 Local Transport 32 38 35 44 33 General Bills 38 42 28 44 25 Personal Items 17 19 18 20 17 Childcare 59 55 62 99 50 Misc/Entertainment 66 82 66 70 46
Bond $897.26 Clothes $340.75 Travel out of town $787.54 Consumer items $630.97 Computer $936.11 Books $140.87 Course materials $382.22 Medical optical $242.38 Other major $893.88
WHICH OF THESE WEEKLY EXPENSES DO YOU HAVE?
0%
20%
40%
60%
80%
100%
57.1
4%
71.0
1%
55.6
2%
81.0
0%
80.5
8%
46.3
2%
80.4
4%
1.11
%
43.1
3%
ALL FOOD COSTSACCOMMODATION
KEY:
LOCAL TRANSPORTLIVING EXPENSES
GENERAL BILLSENTERTAINMENT
CHILDCARE COSTSPERSONAL ITEMS
MISCELLANEOUS
AVERAGE STUDENT SPENDING
AVERAGE ONE-OFF COSTS
12
Council Open Agenda - 11 May 2017 - For Information
97
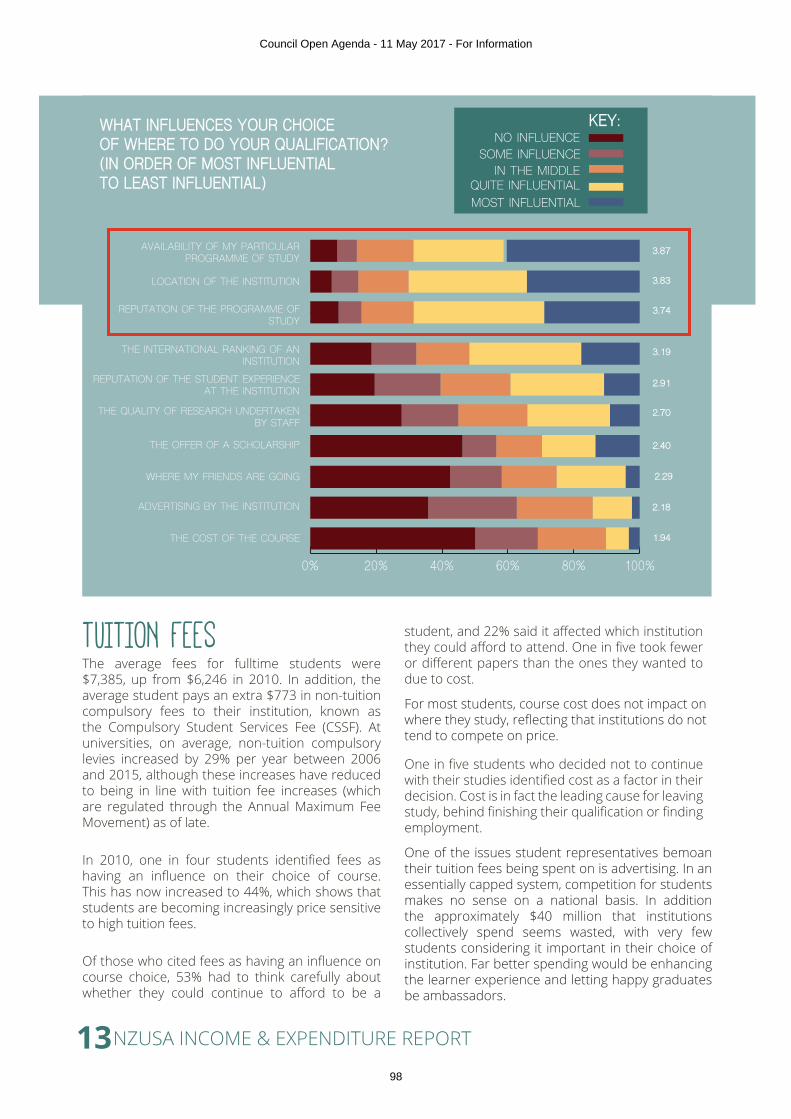
NZUSA INCOME & EXPENDITURE REPORT
The average fees for fulltime students were $7,385, up from $6,246 in 2010. In addition, the average student pays an extra $773 in non-tuition compulsory fees to their institution, known as the Compulsory Student Services Fee (CSSF). At universities, on average, non-tuition compulsory levies increased by 29% per year between 2006 and 2015, although these increases have reduced to being in line with tuition fee increases (which are regulated through the Annual Maximum Fee Movement) as of late.
In 2010, one in four students identified fees as having an influence on their choice of course. This has now increased to 44%, which shows that students are becoming increasingly price sensitive to high tuition fees.
Of those who cited fees as having an influence on course choice, 53% had to think carefully about whether they could continue to afford to be a
TUITION FEES
0% 20% 40% 60% 80% 100%
THE COST OF THE COURSE
ADVERTISING BY THE INSTITUTION
WHERE MY FRIENDS ARE GOING
THE OFFER OF A SCHOLARSHIP
THE QUALITY OF RESEARCH UNDERTAKENBY STAFF
REPUTATION OF THE STUDENT EXPERIENCEAT THE INSTITUTION
THE INTERNATIONAL RANKING OF ANINSTITUTION
REPUTATION OF THE PROGRAMME OFSTUDY
LOCATION OF THE INSTITUTION
AVAILABILITY OF MY PARTICULARPROGRAMME OF STUDY
1.94
2.18
2.29
2.40
2.70
2.91
3.19
3.74
3.83
3.87
WHAT INFLUENCES YOUR CHOICEOF WHERE TO DO YOUR QUALIFICATION?(IN ORDER OF MOST INFLUENTIAL TO LEAST INFLUENTIAL)
NO INFLUENCEKEY:
SOME INFLUENCE
QUITE INFLUENTIALIN THE MIDDLE
MOST INFLUENTIAL
student, and 22% said it affected which institution they could afford to attend. One in five took fewer or different papers than the ones they wanted to due to cost.
For most students, course cost does not impact on where they study, reflecting that institutions do not tend to compete on price.
One in five students who decided not to continue with their studies identified cost as a factor in their decision. Cost is in fact the leading cause for leaving study, behind finishing their qualification or finding employment.
One of the issues student representatives bemoan their tuition fees being spent on is advertising. In an essentially capped system, competition for students makes no sense on a national basis. In addition the approximately $40 million that institutions collectively spend seems wasted, with very few students considering it important in their choice of institution. Far better spending would be enhancing the learner experience and letting happy graduates be ambassadors.
13
Council Open Agenda - 11 May 2017 - For Information
98

THE COST OF BEING A STUDENT IN NEW ZEALAND
HOW DID YOU PAY YOUR TUITION FEES THIS YEAR?
0% 10% 20% 30% 40% 50% 60% 70% 80%
78.78%
9.71%
8.00%
3.47%
SCHOLARSHIPSTUDENT LOAN
KEY:
OWN MONEYPARENTS
$8000$7000$6000$5000$4000$3000$2000$1000
0 2000 2002 2004 2006 2008 2010 2012 2014 2016 2018
TUITON FEES
The most influential factors are location, availability, and what their peers and other trusted advisors tell them about the particular programme they are considering. This suggests that we need policy drivers that promote regional provision, stop the all-too-regular closing of programmes, and enhance the passing of information about quality from current students or recent graduates to intending students.
I’m sick of having hunger impact my studies (Student, Otago, 18)
A third of student respondents identified that they do not have enough income to meet their basic needs, almost twice the percentage identified in a comparable study from 2013.
The questions relating to significant financial distress were introduced for the first time in the 2014 study, and followed methodology of the Universities NZ-funded Baseline Report of the Graduate Longitudinal Study. That study found that 1 in 6 final year students were in significant financial distress, meaning that they strongly disagreed with a statement that they could afford basic items, or strongly agreed that they had had difficulty meeting financial commitments.
Students were asked to consider their responses to the following:
· I have enough money to afford the accommodation I need.
· I have enough money to afford the clothing I need.
· I have enough money to afford the food I need.
· I have enough money to afford the leisure and recreational activities I want.
SIGNIFICANT FINANCIAL DISTRESS
· Over the past 12 months I have had difficulty meeting my financial commitments.
Data was summed and reserve coded (min = 5, max = 25) with higher scores reflect less economic/financial strain.
A score below 15 means that respondents do not have enough money to afford their basic needs, which is understood as being in significant financial distress. The study shows that the average student is extremely close to being in significant financial distress, and that 33% score 14 or below on the scale, meaning that for at least one item they are unable to afford what they need.
By way of comparison, the Graduate Longitudinal Study identified that one in six final year students were living in significant financial distress. Its mean was 18 (compared with 16) and the interquartile range (where the middle 50% of respondents are) was between 15 and 21, so just coping financially. The 2016 findings has that range around the just coping level, with as many students below than above that measure.
The Income and Expenditure Survey findings are even more concerning than what the National Centre for Longitudinal Research researchers found in 2012 because that study only looked at final year students, and only at universities.
The findings are consistent though: the rest of the Income and Expenditure Survey shows that students’ situations have worsened since 2012, but we also know that many students in financial distress withdraw from study before they get to the stage of the final year. In addition, the earlier in the year the survey is taken, the greater the percentage of students in distress will be, since the most financially distressed students are forced to exit, improving the average financial situation of those left behind. The 2016 survey was conducted in December, the 2014 study, which was even
14
“
Council Open Agenda - 11 May 2017 - For Information
99
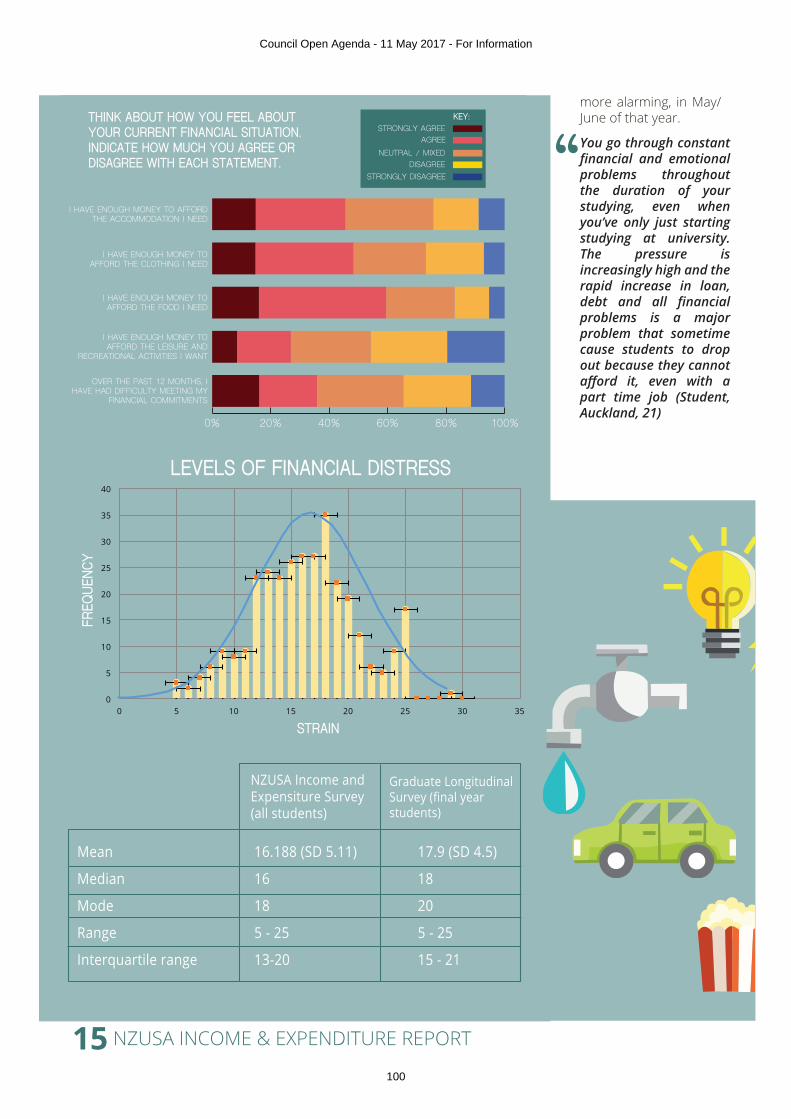
NZUSA INCOME & EXPENDITURE REPORT
0% 20% 40% 60% 80% 100%
OVER THE PAST 12 MONTHS, IHAVE HAD DIFFICULTY MEETING MY
FINANCIAL COMMITMENTS
I HAVE ENOUGH MONEY TOAFFORD THE LEISURE AND
RECREATIONAL ACTIVITIES I WANT
I HAVE ENOUGH MONEY TOAFFORD THE FOOD I NEED
I HAVE ENOUGH MONEY TOAFFORD THE CLOTHING I NEED
I HAVE ENOUGH MONEY TO AFFORDTHE ACCOMMODATION I NEED
THINK ABOUT HOW YOU FEEL ABOUT YOUR CURRENT FINANCIAL SITUATION. INDICATE HOW MUCH YOU AGREE OR DISAGREE WITH EACH STATEMENT.
STRONGLY AGREEKEY:
AGREE
DISAGREENEUTRAL / MIXED
STRONGLY DISAGREE
Mean 16.188 (SD 5.11) 17.9 (SD 4.5)
Median 16 18
Mode 18 20
Range 5 - 25 5 - 25
Interquartile range 13-20 15 - 21
NZUSA Income and Expensiture Survey(all students)
Graduate LongitudinalSurvey (final year students)
more alarming, in May/June of that year.
You go through constant financial and emotional problems throughout the duration of your studying, even when you’ve only just starting studying at university. The pressure is increasingly high and the rapid increase in loan, debt and all financial problems is a major problem that sometime cause students to drop out because they cannot afford it, even with a part time job (Student, Auckland, 21)
15
0
5
10
15
20
25
30
35
40
0 5 10 15 20 25 30 35
STRAIN
LEVELS OF FINANCIAL DISTRESS
FREQ
UENC
Y
“
Council Open Agenda - 11 May 2017 - For Information
100
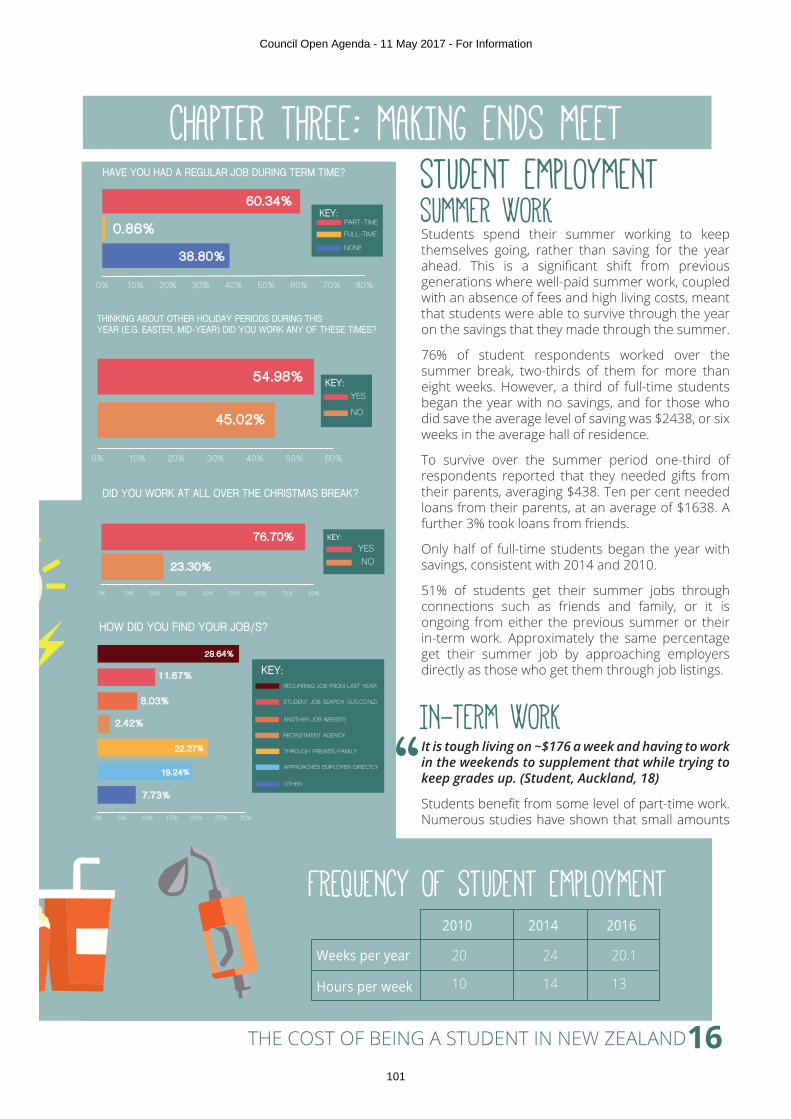
THE COST OF BEING A STUDENT IN NEW ZEALAND
CHAPTER THREE: MAKING ENDS MEETSTUDENT EMPLOYMENTSUMMER WORK
HAVE YOU HAD A REGULAR JOB DURING TERM TIME?
0% 10% 20% 30% 40% 50% 60% 70% 80%
60.34%
38.80%
0.86% FULL-TIME
PART-TIMEKEY:
NONE
HOW DID YOU FIND YOUR JOB/S?
0% 5% 10% 15% 20% 25% 30%
11.67%
28.64%
8.03%
2.42%
22.27%
19.24%
7.73%
STUDENT JOB SEARCH (SJS.CO.NZ)
RECURRING JOB FROM LAST YEAR
KEY:
RECRUITMENT AGENCY
ANOTHER JOB WEBSITE
APPROACHES EMPLOYER DIRECTLY
THROUGH FRIENDS/FAMILY
OTHER
THINKING ABOUT OTHER HOLIDAY PERIODS DURING THIS YEAR (E.G. EASTER, MID-YEAR) DID YOU WORK ANY OF THESE TIMES?
0% 10% 20% 30% 40% 50% 60%
54.98%
45.02% NO
YESKEY:
DID YOU WORK AT ALL OVER THE CHRISTMAS BREAK?
0% 10% 20% 30% 40% 50% 60% 70% 80%
76.70%
23.30% NOYES
KEY:
20 24 20.1
10 14 13
2010 2014 2016
Weeks per year
Hours per week
Students spend their summer working to keep themselves going, rather than saving for the year ahead. This is a significant shift from previous generations where well-paid summer work, coupled with an absence of fees and high living costs, meant that students were able to survive through the year on the savings that they made through the summer.
76% of student respondents worked over the summer break, two-thirds of them for more than eight weeks. However, a third of full-time students began the year with no savings, and for those who did save the average level of saving was $2438, or six weeks in the average hall of residence.
To survive over the summer period one-third of respondents reported that they needed gifts from their parents, averaging $438. Ten per cent needed loans from their parents, at an average of $1638. A further 3% took loans from friends.
Only half of full-time students began the year with savings, consistent with 2014 and 2010.
51% of students get their summer jobs through connections such as friends and family, or it is ongoing from either the previous summer or their in-term work. Approximately the same percentage get their summer job by approaching employers directly as those who get them through job listings.
It is tough living on ~$176 a week and having to work in the weekends to supplement that while trying to keep grades up. (Student, Auckland, 18)
Students benefit from some level of part-time work. Numerous studies have shown that small amounts
IN-TERM WORK
FREQUENCY OF STUDENT EMPLOYMENT
16
“
“
Council Open Agenda - 11 May 2017 - For Information
101
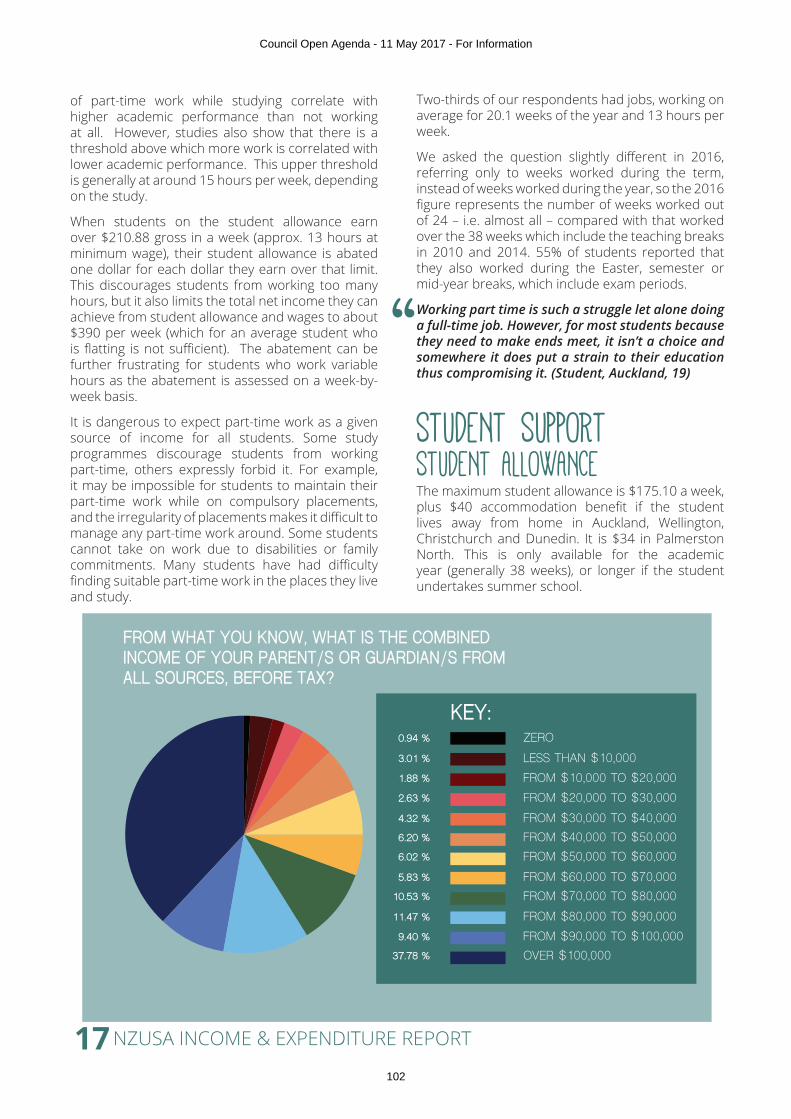
NZUSA INCOME & EXPENDITURE REPORT
of part-time work while studying correlate with higher academic performance than not working at all. However, studies also show that there is a threshold above which more work is correlated with lower academic performance. This upper threshold is generally at around 15 hours per week, depending on the study.
When students on the student allowance earn over $210.88 gross in a week (approx. 13 hours at minimum wage), their student allowance is abated one dollar for each dollar they earn over that limit. This discourages students from working too many hours, but it also limits the total net income they can achieve from student allowance and wages to about $390 per week (which for an average student who is flatting is not sufficient). The abatement can be further frustrating for students who work variable hours as the abatement is assessed on a week-by-week basis.
It is dangerous to expect part-time work as a given source of income for all students. Some study programmes discourage students from working part-time, others expressly forbid it. For example, it may be impossible for students to maintain their part-time work while on compulsory placements, and the irregularity of placements makes it difficult to manage any part-time work around. Some students cannot take on work due to disabilities or family commitments. Many students have had difficulty finding suitable part-time work in the places they live and study.
STUDENT SUPPORTSTUDENT ALLOWANCE
Two-thirds of our respondents had jobs, working on average for 20.1 weeks of the year and 13 hours per week.
We asked the question slightly different in 2016, referring only to weeks worked during the term, instead of weeks worked during the year, so the 2016 figure represents the number of weeks worked out of 24 – i.e. almost all – compared with that worked over the 38 weeks which include the teaching breaks in 2010 and 2014. 55% of students reported that they also worked during the Easter, semester or mid-year breaks, which include exam periods.
Working part time is such a struggle let alone doing a full-time job. However, for most students because they need to make ends meet, it isn’t a choice and somewhere it does put a strain to their education thus compromising it. (Student, Auckland, 19)
The maximum student allowance is $175.10 a week, plus $40 accommodation benefit if the student lives away from home in Auckland, Wellington, Christchurch and Dunedin. It is $34 in Palmerston North. This is only available for the academic year (generally 38 weeks), or longer if the student undertakes summer school.
FROM WHAT YOU KNOW, WHAT IS THE COMBINEDINCOME OF YOUR PARENT/S OR GUARDIAN/S FROM ALL SOURCES, BEFORE TAX?
ZERO
KEY:
FROM $10,000 TO $20,000LESS THAN $10,000
FROM $30,000 TO $40,000FROM $20,000 TO $30,000
FROM $50,000 TO $60,000FROM $40,000 TO $50,000
FROM $60,000 TO $70,000FROM $70,000 TO $80,000
FROM $90,000 TO $100,000FROM $80,000 TO $90,000
OVER $100,000
0.94 %
1.88 %
3.01 %
4.32 %
2.63 %
6.02 %
6.20 %
10.53 %
5.83 %
11.47 %
9.40 %
37.78 %
17
“
Council Open Agenda - 11 May 2017 - For Information
102
THE COST OF BEING A STUDENT IN NEW ZEALAND
For students under 24 years of age, student allowance entitlement depends on parents’ joint income:
• Parents’ income under $55,027.96 means the full entitlement
• Parents’ income between $55,027.96 and $91,448.30 means partial entitlement
• Students with a partial entitlement can claim student loan living costs to top up to approximately the same level as the student allowance maximum and also have access to the accommodation benefit
Many students who are denied an allowance for a reason other than parental means-testing (eg. because they are a postgraduate student or failed to make sufficient academic progress the year before) are entitled to the Accommodation Supplement along with their student loan. However, this is clearly not well known because the take-up is well below the number who would be entitled.
Student allowances are generally adjusted by CPI every year. A student can only receive 200 weeks of allowances. After that point they must borrow to live.
Most students borrow to live (student loan living costs) of 176.86 a week. Like allowances, the maximum amount borrowable per week last rose by CPI, or 0.51% on 1 April 2015. It has not increased since. This represented a $0.90 increase to weekly income available to students since 1 April 2014. By way of comparison, student rents in Wellington went up $20 per room per week from 2016 to 2017 alone.
According to student finance advisors, even for the minority of students who receive a student allowance, the full entitlement is around $10,000 per year less than the amount needed for the year of study.
· Up to $1,000 per year available. It is intended for books, stationery, materials, internet expenses, computer costs, transport, and available spending on housing and childcare.
· Many students use this for accommodation setup because it is available as a lump sum as early as two weeks before their course starts. In a 2011 Victoria University of
STUDENT loan
Wellington Student Finance Service Study, of 374 students who used student loan course related costs in the last 6 months, 158 (42%) used at least some of funds toward accommodation costs (bond, advanced rent, set-up costs, etc.)
· Students report that it is impossible for a fulltime student to have less than $1000 in allowable costs, most have far more specific costs relating to their courses, and that it is insufficient to provide for the start-up costs for someone new to study.
· Art, design, architecture, and courses with placements (nursing, teaching, veterinary science) tend to have course costs at least twice as high as the available loan
Implicit in the parental income assessment for qualifying for a student allowance is the expectation that parents will be supporting the living costs of their children while they study up to the age of 24.
However, some families cannot afford to support a child away from home. In assessing for student allowance, only parental gross income is considered. The family’s assets are not considered and nor are their liabilities or expenses (for example, high expenses due to housing, medical costs, or childcare costs are not considered).
The parental income abatement level of the student allowance has been frozen since 2012, it now begins at just 44% of the average income for a two-parent household aged in their late-40s (ie the average age of an 18 year-old school leaver’s parents). It is fully abated, meaning the student is entitled to nothing, at 77% of the average two-parent household income.
In addition, some families who might be able to afford to support their children do not think it is appropriate.
Of our respondents, around a quarter received allowances with a further third drawing down the student loan living cost each year. Just 22% – given that those borrowing to live are considered to have parents able to support them – did receive regular support from their parents, at an average of $57 per week, although a further 11% were lent money by their parents at an average of around $5000 for the year. Some respondents disclosed that their parents paid their fees for them.
More assistance for students is needed. Some have parents who earn too much for max allowance but not enough to help their kids. It is so difficult to get
COURSE RELATED COSTS
HELP FROM FAMILY
18“
Council Open Agenda - 11 May 2017 - For Information
103
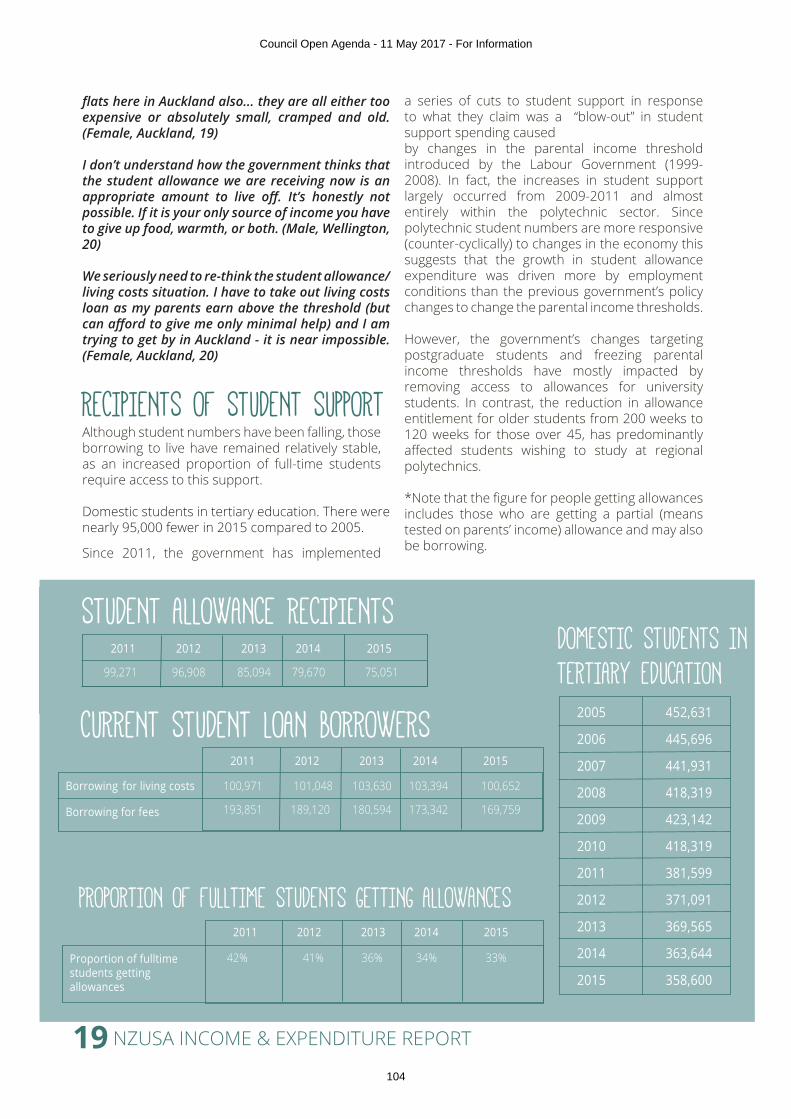
NZUSA INCOME & EXPENDITURE REPORT
flats here in Auckland also... they are all either too expensive or absolutely small, cramped and old. (Female, Auckland, 19)
I don’t understand how the government thinks that the student allowance we are receiving now is an appropriate amount to live off. It’s honestly not possible. If it is your only source of income you have to give up food, warmth, or both. (Male, Wellington, 20)
We seriously need to re-think the student allowance/living costs situation. I have to take out living costs loan as my parents earn above the threshold (but can afford to give me only minimal help) and I am trying to get by in Auckland - it is near impossible. (Female, Auckland, 20)
Although student numbers have been falling, those borrowing to live have remained relatively stable, as an increased proportion of full-time students require access to this support.
Domestic students in tertiary education. There were nearly 95,000 fewer in 2015 compared to 2005.
Since 2011, the government has implemented
RECIPIENTS OF STUDENT SUPPORT
99,271 96,908 85,094 79,670 75,051
2011 2012 2013 2014 2015
Student Allowance recipients
a series of cuts to student support in response to what they claim was a “blow-out” in student support spending caused by changes in the parental income threshold introduced by the Labour Government (1999-2008). In fact, the increases in student support largely occurred from 2009-2011 and almost entirely within the polytechnic sector. Since polytechnic student numbers are more responsive (counter-cyclically) to changes in the economy this suggests that the growth in student allowance expenditure was driven more by employment conditions than the previous government’s policy changes to change the parental income thresholds.
However, the government’s changes targeting postgraduate students and freezing parental income thresholds have mostly impacted by removing access to allowances for university students. In contrast, the reduction in allowance entitlement for older students from 200 weeks to 120 weeks for those over 45, has predominantly affected students wishing to study at regional polytechnics.
*Note that the figure for people getting allowances includes those who are getting a partial (means tested on parents’ income) allowance and may also be borrowing.
2005 452,631
2006 445,696
2007 441,931
2008 418,319
2009 423,142
2010 418,319
2011 381,599
2012 371,091
2013 369,565
2014 363,644
2015 358,600
100,971 101,048 103,630 103,394 100,652
193,851 189,120 180,594 173,342 169,759
2011 2012 2013 2014 2015
Borrowing for living costs
Borrowing for fees
42% 41% 36% 34% 33%
2011 2012 2013 2014 2015
Proportion of fulltimestudents gettingallowances
STUDENT ALLOWANCE RECIPIENTSDOMESTIC STUDENTS IN TERTIARY EDUCATION
CURRENT STUDENT LOAN BORROWERS
PROPORTION OF FULLTIME STUDENTS GETTING ALLOWANCES
19
Council Open Agenda - 11 May 2017 - For Information
104
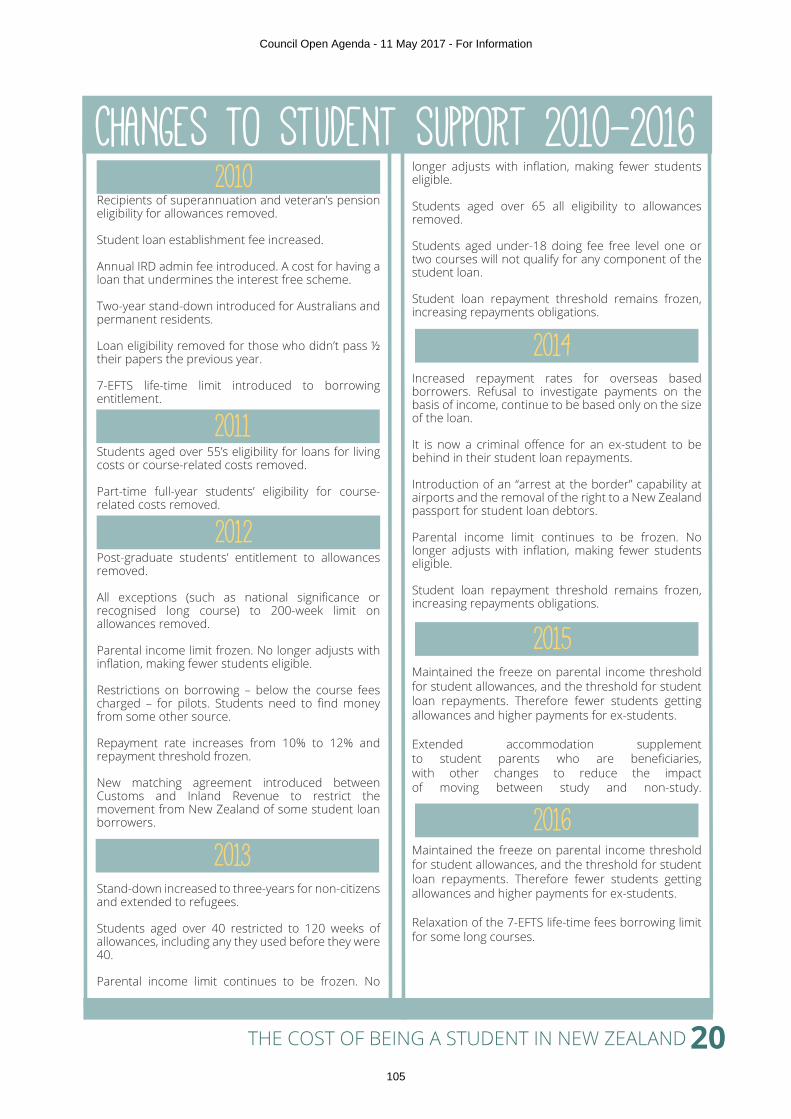
THE COST OF BEING A STUDENT IN NEW ZEALAND
CHANGES TO STUDENT SUPPORT 2010-20162010
Recipients of superannuation and veteran’s pension eligibility for allowances removed. Student loan establishment fee increased. Annual IRD admin fee introduced. A cost for having a loan that undermines the interest free scheme. Two-year stand-down introduced for Australians and permanent residents. Loan eligibility removed for those who didn’t pass ½ their papers the previous year. 7-EFTS life-time limit introduced to borrowing entitlement.
Students aged over 55’s eligibility for loans for living costs or course-related costs removed. Part-time full-year students’ eligibility for course-related costs removed.
Post-graduate students’ entitlement to allowances removed. All exceptions (such as national significance or recognised long course) to 200-week limit on allowances removed. Parental income limit frozen. No longer adjusts with inflation, making fewer students eligible. Restrictions on borrowing – below the course fees charged – for pilots. Students need to find money from some other source. Repayment rate increases from 10% to 12% and repayment threshold frozen. New matching agreement introduced between Customs and Inland Revenue to restrict the movement from New Zealand of some student loan borrowers.
Stand-down increased to three-years for non-citizens and extended to refugees. Students aged over 40 restricted to 120 weeks of allowances, including any they used before they were 40. Parental income limit continues to be frozen. No
longer adjusts with inflation, making fewer students eligible. Students aged over 65 all eligibility to allowances removed. Students aged under-18 doing fee free level one or two courses will not qualify for any component of the student loan. Student loan repayment threshold remains frozen, increasing repayments obligations.
Increased repayment rates for overseas based borrowers. Refusal to investigate payments on the basis of income, continue to be based only on the size of the loan. It is now a criminal offence for an ex-student to be behind in their student loan repayments. Introduction of an “arrest at the border” capability at airports and the removal of the right to a New Zealand passport for student loan debtors. Parental income limit continues to be frozen. No longer adjusts with inflation, making fewer students eligible. Student loan repayment threshold remains frozen, increasing repayments obligations.
Maintained the freeze on parental income threshold for student allowances, and the threshold for student loan repayments. Therefore fewer students getting allowances and higher payments for ex-students. Extended accommodation supplement to student parents who are beneficiaries, with other changes to reduce the impact of moving between study and non-study.
Maintained the freeze on parental income threshold for student allowances, and the threshold for student loan repayments. Therefore fewer students getting allowances and higher payments for ex-students. Relaxation of the 7-EFTS life-time fees borrowing limit for some long courses.
DOMESTIC STUDENTS IN TERTIARY EDUCATION
20
2011
2012
2013
2014
2015
2016
Council Open Agenda - 11 May 2017 - For Information
105
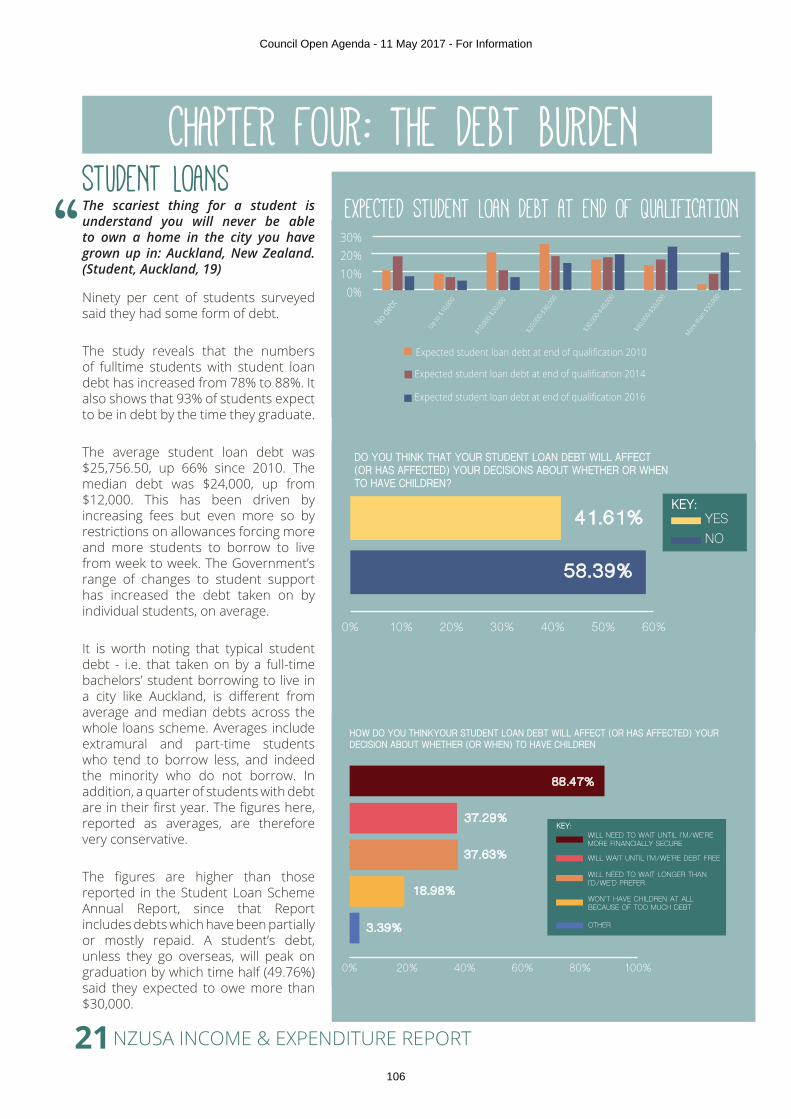
NZUSA INCOME & EXPENDITURE REPORT
CHAPTER FOUR: THE DEBT BURDENSTUDENT LOANSThe scariest thing for a student is understand you will never be able to own a home in the city you have grown up in: Auckland, New Zealand. (Student, Auckland, 19)
Ninety per cent of students surveyed said they had some form of debt.
The study reveals that the numbers of fulltime students with student loan debt has increased from 78% to 88%. It also shows that 93% of students expect to be in debt by the time they graduate.
The average student loan debt was $25,756.50, up 66% since 2010. The median debt was $24,000, up from $12,000. This has been driven by increasing fees but even more so by restrictions on allowances forcing more and more students to borrow to live from week to week. The Government’s range of changes to student support has increased the debt taken on by individual students, on average.
It is worth noting that typical student debt - i.e. that taken on by a full-time bachelors’ student borrowing to live in a city like Auckland, is different from average and median debts across the whole loans scheme. Averages include extramural and part-time students who tend to borrow less, and indeed the minority who do not borrow. In addition, a quarter of students with debt are in their first year. The figures here, reported as averages, are therefore very conservative.
The figures are higher than those reported in the Student Loan Scheme Annual Report, since that Report includes debts which have been partially or mostly repaid. A student’s debt, unless they go overseas, will peak on graduation by which time half (49.76%) said they expected to owe more than $30,000.
DO YOU THINK THAT YOUR STUDENT LOAN DEBT WILL AFFECT (OR HAS AFFECTED) YOUR DECISIONS ABOUT WHETHER OR WHEN TO HAVE CHILDREN?
0% 10% 20% 30% 40% 50% 60%
41.61%
58.39%
KEY:
NOYES
HOW DO YOU THINKYOUR STUDENT LOAN DEBT WILL AFFECT (OR HAS AFFECTED) YOUR DECISION ABOUT WHETHER (OR WHEN) TO HAVE CHILDREN
0% 20% 40% 60% 80% 100%
88.47%
37.29%
37.63%
18.98%
3.39%
WILL WAIT UNTIL I’M/WE’RE DEBT FREE
WILL NEED TO WAIT UNTIL I’M/WE’RE MORE FINANCIALLY SECURE
KEY:
OTHER
WON’T HAVE CHILDREN AT ALLBECAUSE OF TOO MUCH DEBT
WILL NEED TO WAIT LONGER THANI’D/WE’D PREFER
30%20%10%
0%
No deb
t
Up to $
10,00
0
$10,0
00-$2
0,000
$20,0
00-$3
0,000
$30,0
00-$4
0,000
$40,0
00-$5
0,000
More t
han $
50,00
0
Expected student loan debt at end of qualification 2010
Expected student loan debt at end of qualification 2014
Expected student loan debt at end of qualification 2016
EXPECTED STUDENT LOAN DEBT AT END OF QUALIFICATION
21
“
Council Open Agenda - 11 May 2017 - For Information
106
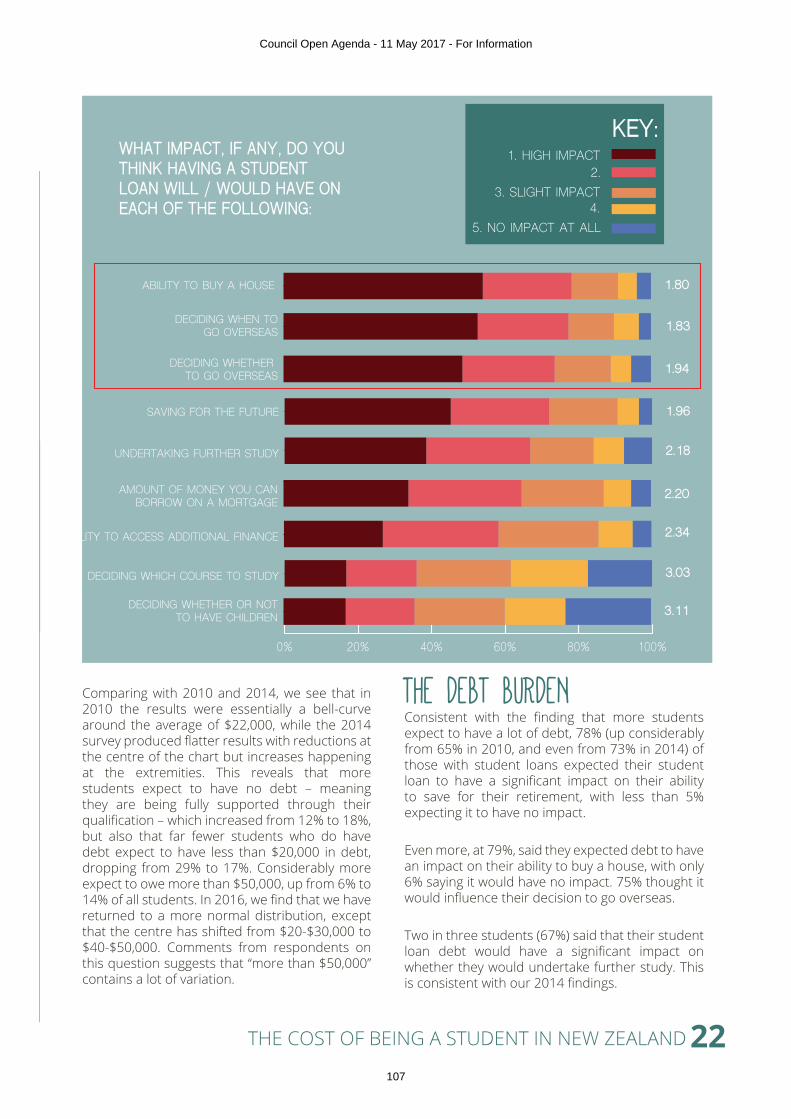
THE COST OF BEING A STUDENT IN NEW ZEALAND
DO YOU THINK THAT YOUR STUDENT LOAN DEBT WILL AFFECT (OR HAS AFFECTED) YOUR DECISIONS ABOUT WHETHER OR WHEN TO HAVE CHILDREN?
0% 10% 20% 30% 40% 50% 60%
41.61%
58.39%
KEY:
NOYES
0% 20% 40% 60% 80% 100%
ABILITY TO BUY A HOUSE 1.80
DECIDING WHEN TO GO OVERSEAS 1.83
DECIDING WHETHER TO GO OVERSEAS 1.94
SAVING FOR THE FUTURE 1.96
UNDERTAKING FURTHER STUDY 2.18
AMOUNT OF MONEY YOU CANBORROW ON A MORTGAGE
2.20
ABILITY TO ACCESS ADDITIONAL FINANCE 2.34
DECIDING WHICH COURSE TO STUDY 3.03
DECIDING WHETHER OR NOTTO HAVE CHILDREN 3.11
WHAT IMPACT, IF ANY, DO YOUTHINK HAVING A STUDENT LOAN WILL / WOULD HAVE ON EACH OF THE FOLLOWING:
1. HIGH IMPACT
KEY:2.
4.3. SLIGHT IMPACT
5. NO IMPACT AT ALL
Comparing with 2010 and 2014, we see that in 2010 the results were essentially a bell-curve around the average of $22,000, while the 2014 survey produced flatter results with reductions at the centre of the chart but increases happening at the extremities. This reveals that more students expect to have no debt – meaning they are being fully supported through their qualification – which increased from 12% to 18%, but also that far fewer students who do have debt expect to have less than $20,000 in debt, dropping from 29% to 17%. Considerably more expect to owe more than $50,000, up from 6% to 14% of all students. In 2016, we find that we have returned to a more normal distribution, except that the centre has shifted from $20-$30,000 to $40-$50,000. Comments from respondents on this question suggests that “more than $50,000” contains a lot of variation.
THE DEBT BURDENConsistent with the finding that more students expect to have a lot of debt, 78% (up considerably from 65% in 2010, and even from 73% in 2014) of those with student loans expected their student loan to have a significant impact on their ability to save for their retirement, with less than 5% expecting it to have no impact.
Even more, at 79%, said they expected debt to have an impact on their ability to buy a house, with only 6% saying it would have no impact. 75% thought it would influence their decision to go overseas.
Two in three students (67%) said that their student loan debt would have a significant impact on whether they would undertake further study. This is consistent with our 2014 findings.
EXPECTED STUDENT LOAN DEBT AT END OF QUALIFICATION
22
Council Open Agenda - 11 May 2017 - For Information
107

NZUSA INCOME & EXPENDITURE REPORT
Thirty-six per cent, consistent with 2010 and 2014, felt their student loan would affect their decision to have children, with 88% of these saying they would seek to wait until they were more financially secure before they considered becoming parents.
Although fewer people are borrowing each year, the number of people with a student loan debt continues to grow. This finding also applies to overseas based borrowers where, despite efforts and considerable expenditure on advertising and compliance activities, the number and proportion of people overseas who are behind in their obligations continues to grow. This suggests an urgent rethink of policies in that area is necessary.
As Uni students are already going to be drowning in debt after graduation, we need as much support as possible with housing/ getting jobs related to our qualification. (Student, Auckland, 21)
Luckily I live at home so I have saved on this, however in some sense it is sad as I would love to go flatting but unsure I will be able to afford this, since I am planning on doing post-graduate studies which is more money. (Student, Auckland, 22)
According to the Student Loan Scheme Annual Report 2016, the median repayment time is 7.9 years for men and 8.8 years for women, a gap that is widening and is up by 0.8 and 1.4 years respectively from when we last reported on it in 2014. Further, 25% of students will have an average repayment time of 16.1 years or longer (up by 3.4 years). Students graduating from level 5-6 (diploma) programmes have an average repayment time of 9.3 years, longer than those with bachelor’s degrees at 8.5 years.
In 2005, prior to the introduction of interest free student loans, the average repayment times were 14 years for men and 28 years for women. This was due to women graduating with higher debt but mostly because women earnt lower wages when they are working post-study and because women are more likely to take unpaid time out of the workforce to care for others. Lower wages and higher debt meant that women were more likely to be “flat-lining” with their repayments – making payments but not even meeting the interest charged so the principal was never reduced. Interest free student loans dramatically improved
GENERATION DEBT
REPAYMENT TIMES
The Size of Student Debt
2005 7.449 b
2009 10.259 b
2013 13.562 b
2014 14.235 b
2016 15.300 b
Total value of the loans scheme
2005 145,000
2009 200,000
2013 200,000
2014 190,000
2016 182,537
Total people borrowing each year
2005 440,000
2009 555,000
2013 710,000
2014 721,500
2016 731,754
Total people with student debt
23
“
Council Open Agenda - 11 May 2017 - For Information
108

THE COST OF BEING A STUDENT IN NEW ZEALAND
repayment times and significantly reduced the gender imbalances inherent in the student loan scheme.
The Labour party’s interest-free student loans policy has been continued by the current Government. However, as tuition fees increase, along with a number of administration charges on loans, the debt continues to grow. These additional administration charges would normally have to be reported as effective interest under the Credit Contracts and Consumer Finance Act, but in this respect it does not appear to bind the Crown. Repayment times are no longer reducing as they were under the previous government, either for loans of the same size nor overall.
The Student Loan Scheme Annual Report 2016 reported that their repayment data reflects shorter times than what most students will face. This is because these average figures include people completing short courses and those whose circumstances mean that they are able to repay their debt immediately on graduating (around 20% of all borrowers).
Note also that the Student Loan Scheme Annual Report reports on higher levels of debt year on year, and that the median and 75th percentiles have increased slightly in the table below since our 2014 report, suggesting lower financial returns for the same levels of debt.
$50,000 - $55,000
$55,000 - $60,000
$60,000-$65,000
$65,000-$70,000
$70,000 >
Median 75th percentile (ie. 25% of people)
13.8 years
14.6 years
16.3 years
16.3 years
19.8 years
21.1 years
22.8 years
25.6 years
25.6 years
37.7 years
786 930 937 720 1255 973
9m 12m 13m 9m 19m 15m
2010/11 2011/12 2012/13 2013/14 2014/15 2015/16
Number
Value
As the loan scheme matures, now in its 24th year, the number of people dying without having paid off their loans is increasing:
REPAYMENT TIMES FOR THOSE OWING DIFFERENT AMOUNTS
PEOPLE DYING WITHOUT PAYING OFF STUDENT LOANS
24
Council Open Agenda - 11 May 2017 - For Information
109

NZUSA INCOME & EXPENDITURE REPORT
CHAPTER FIVE: WHERE TO FROM HERE?Unfreeze the parental income threshold
on student allowance
This has been frozen since 2012. Since the freeze there has been a 27% reduction in the number of students receiving allowances.
Introduce a housing grant for all students
This grant should be variable to target the cities where weekly rent is gobbling up more than 100% of current levels of student support, but designed to reduce the burden that every student faces.
Restore postgraduate allowances
The cut hasn’t saved money, but it has hurt the students who should be supported to research and innovate. The number of postgrad students taking on debt to pay for basics such as rent has shot up by 32.62% since the change.
Restore the national significance exceptions on student allowance
Make an exception to the 200-week limit on student allowances, by restoring a category of qualifications of national significance where students could have access to further years of allowances based on the qualification sought. This includes medicine, optometry, dentistry, and veterinary science.
Scrap the unfair 12c repayment rate on student loans
This kicks in at $19,084, just two-thirds of the minimum wage. Replace it with an Australian-style progressive repayment system so those that can pay, do, and those that can’t can have enough take home pay to survive.
Lift the course related costs loan cap
This has been frozen at $1000 since 1993. Increase it to $3,000 for first-year students and $1,500 for other students. Students are getting into bank and credit card debt just to pay for basics like upfront hall costs and art supplies.
Restore access to loans and allowances for over-40s
Restore full access for over-40s to student allowances, and access to allowances and loans for over-65s. This is age discrimination.
Introduce a national First in Family Scholarship
It will break the cycle of the poverty of opportunity and encourage students from families with no history of degree level study to participate in degree-level tertiary education. It’s the cheapest way of ensuring rising levels of participation in the transformative experience of tertiary education. Good for students, even better for underrepresented communities.
Adequately fund universities and polytechnics
So that they stop passing cost rises onto students.
I’m graduating this year from my certificate before I go into my bachelor level study, and needing to find employment for summer and next year. I desperately want to use my qualification, and there’s a real shortage ... But I won’t actually be able to find work in that field, because there’s not enough funding to pay new staff members (leaving other staff members overworked and underpaid). (M, Palmerston North, 19)
123
4
5
6
7
8
9
25
“
Council Open Agenda - 11 May 2017 - For Information
110
THE COST OF BEING A STUDENT IN NEW ZEALAND
references & further readingDimock, Laura, Living Costs for University Students¸ presentation to the National
Summit on Student Finance, Victoria University of Wellington Institute for Policy
Studies, 2012
Hiltonsmith, Robert, At What Cost? How Student Debt Reduces Lifetime Wealth,
Demos, 2013
Ministry of Business Innovation and Employment, Detailed mean rents Quarter
1, 1993 – Quarter 1, 2015, http://www.building.govt.nz/nz-housing-and-
construction-quarterly-open-data
Ministry of Education, Student Loan Scheme Annual Report 2016, https://www.
educationcounts.govt.nz/publications/80898/2555
Ministry of Education, Student Loan Scheme Annual Report 2014, https://www.
educationcounts.govt.nz/statistics/tertiary_education
New Zealand Parliamentary Library, Students and Depression Ration of
Counselling 2009-2014, (unpublished), 2015
New Zealand Union of Students’ Associations and Colmar Brunton, Student
Income and Expenditure 2010, NZUSA, 2011
New Zealand Union of Students’ Associations, Income and Expenditure Survey
2014, http://www.students.org.nz/studentreport, NZUSA, 2015
Poulten, Ritchie, et al, Graduate Longitudinal Study New Zealand Baseline Report,
https://www.glsnz.org.nz/files/GLSNZ-Baseline-Report.pdf, National Centre for
Lifecourse Research, 2013
Statistics New Zealand, New Zealand Income Survey: June 2014 quarter,
http://www.stats.govt.nz/browse_for_stats/income-and-work/Income/
NZIncomeSurvey_HOTPJun14qtr.aspx
StudyLink, http://www.studylink.govt.nz/about-studylink/statistics/index.html
Victoria University of Wellington, Financial Survival Guide 2015, http://www.
victoria.ac.nz/st_services/finadvice/downloads/SS0118%20-%20Financial%20
Survival%20Guide%202015_v9_web.pdf
26
Council Open Agenda - 11 May 2017 - For Information
111

NZUSA INCOME & EXPENDITURE REPORT
Council Open Agenda - 11 May 2017 - For Information
112

GLOSSARY
ALNAT Adult Literacy and Numeracy Assessment Tool ESOL English for Speakers of Other Languages
ACE Adult and Community Education FCCM Fee/Course Costs Maxima policyAFML Annual Fee Movement Limit FTE Full Time EquivalentAMP Analyse My Performance GLH Guided Learning HoursARA Ara Institute of Canterbury (formally CPIT) GSE Group Study Exchange
ARTENA Student Management Computer System GTW Ground Training Wing (at Woodbourne Air Force Base)
ASM Academic Staff Member HITO Hairdressing Industry Training Organisation
ATEMAssociation of Tertiary Education Management Inc.
HoS Head of School (not in current use)
ATTTOAviation Tourism and Travel Training Organisation
HR Human Resources
AUT Auckland University of Technology HSI Hospitality Standards InstituteBAM Bachelor of Arts and Media IEA Individual Employment Agreement
BAppSocSci Bachelor of Applied Social Science IEC Information and Enrolments CentreBCom Bachelor of Commerce IiP Investors in PeopleBCT Business & Computer Studies ILN Intensive Literacy and NumerancyBIM Briefings to the Incoming Minister INZ Immigration New ZealandBIT Bachelor of Information Technology IPENZ Institute of Professional Engineers New Zealand
BMET Basic Mechanical Engineering Training IPPIndustry Pilot Partner (related to international student visas)
BN Bachelor of Nursing ISCED International Standards Classification of Education
BVA Bachelor of Visual Arts ITABS Industry Training Advisory Bodies
CA and ACAChartered Accountant and Associate Chartered Accountant
ITO Industry Training Organisation
CAA Civil Aviation Authority ITPNZInstitutes of Technology and Polytechnics of New Zealand
CAM Capital Asset Management ITPQ Institutes of Technology and Polytechnics Quality
CAP Certificate of Applied Practice (Nursing) ITPs Institutes of Technology and PolytechnicsCAT Certificate in Adult Training ITR Industry Training RegisterCAU China Agricultural University JFOU J.F. Oberlin University
CCC Community Computing Centres KAREN Kiwi Advanced Research and Education Network
CCSCrippled Children Society - renamed CCS Disability Action
KPI Key Performance Indicator
CEA Collective Employment Agreement LADDS+ Lucid Adult Dyslexia Screening Plus
CITRENZComputing and Information Technology Research and Education New Zealand
LCP Limited Credit Programme
CSS1Community Support and Service Industries Group
LDF Learning Design Framework
CSV Comma-Separated Values LLC Library Learning CentreCTS Certificate in Tertiary Study LLN Literacy, Language and Numeracy
CVP Certificate in Vineyard Practice LNAAT Literacy & Numeracy for Adults Assessment Tool
DA&M Diploma in Arts and Media MACs Modern Apprenticeships Co-ordinator
DAS Directory of Assessment Standards (NZQA) MAF Ministry of Agriculture and Forestry
Directorate Senior Management Team MCA Complex Modern ApprenticeshipDoL Director of Learning MDC Marlborough District Council
DTLT Diploma in Tertiary Learning and Teaching MEC3 Marine Engineer Class 3 (qualification)EAP Employee Assistance Programme MITO Motor Industry Training Organisation
EASA European Aviation Safety Agency ML MarlboroughEDA Economic Development Agency MNZ Maritime New Zealand
EEdO Equal Education Opportunities MoE Ministry of EducationEEO Equal Employment Opportunities MoP Mix of ProvisionEER External Evaluation and Review MoU Memorandum of UnderstandingEFTS Equivalent Full Time Student MRoQ Mandatory Review of Qualifications
EIT Eastern Institute of Technology MSEAA Maritime Seafood Educators Association Aotearoa
ELP English Learning Programme MSEAA Maritime Seafood Educators Association Aotearoa
Council Open Agenda - 11 May 2017 - For Information
113
GLOSSARY
ELTO English Language Training for Officials MTI Mahurangi Technical Institute
EoI Expression of Interest NAMS New Zealand Asset Management Support
EOTE Employment Outcomes of Tertiary Education NBS New Building Standards
EPI Education Performance Indicator NCALNENational Certificate in Adult Literacy & Numeracy Education
NCC Nelson City Council RPL Recognition of Prior Learning
NCEA National Certificate of Educational Achievement SAC Student Achievement Component
NCMN National Council of Māori Nurses SANITIStudents Association of Nelson Marlborough Institute of Technology Inc
NCNZ Nursing Council of New Zealand SAR Self Assessment Reporting
NEET(Youth) Not in Employment, Education, or Training
SASM Senior Academic Staff Member
NETP Nurse Entry to Practice Programme SCP Supplementary Credit ProgrammeNMDHB Nelson Marlborough District Health Board SDL Staff Digital Literacy
NMIT Nelson Marlborough Institute of Technology SDR Single Data Return
NN Nelson SEED Student Counselling service provider
NPESNelson Polytechnic Educational Society Incorporated
SIG Special Interest Group
NQ New Zealand Qualification SILIService Industries and Learning Innovation (NMIT Programme Group)
NQF National Qualifications Framework SIRPA South Island Regional Polytechnics AssociationNSI National Student Index SIT Southern Institute of TechnologyNSN National Student Number SLG Strategic Leadership Group
NSOM Nelson School of Music SMS Student Management SystemNZDB New Zealand Diploma in Business SSC State Services CommissionNZDE New Zealand Diploma in Engineering SSG Special Supplementary Grants
NZICA New Zealand Institute of Chartered Accountants SSP Sub-Sector Provider
NZIM New Zealand Institute of Management STAR Secondary Tertiary Alignment Resource
NZOIA New Zealand Outdoor Instructors Association STCWStandards of Training and Certification of Watchkeepers
NZPPC NZ Polytechnic Programmes Committee STEM Science, Technology, Engineering & Maths
NZQA New Zealand Qualification Authority STEO Services for Tertiary Education Organisations website
NZQF New Zealand Qualifications Framework STIC Secondary Tertiary Industry Collaboration
NZSCEDNew Zealand Standard Classification of Education
STMs Standard Training Measures
NZTE New Zealand Trade and Enterprise SUTI Skills Update Training InstituteOAG Office of the Auditor General TALO Teaching and Learning ObservationOCP Organisational Counselling Programmes TAMU Tertiary Advisory Monitoring Unit
OERu Open Education Resources University TANZ Tertiary Accord of New ZealandOP Otago Polytechnic TDC Tasman District Council
OTEPs Other Tertiary Education Providers TEC Tertiary Education Commission
PAC Programme Approvals Committee TEC/Skill NZTraining Opportunities Programmes Funded by TEC/Skill NZ
PAL Programme Area Leader TEI Tertiary Education InstitutionPASM Principal Academic Staff Member TEIs Tertiary Education InstitutesPBRF Performance-Based Research Fund TEO Tertiary Education Organisation
PD Professional Development TEOC Tertiary Education Organisation Component fund
PDF Portable Document Format TEOs Tertiary Education OrganisationsPESA Performance Excellence Study Award TEPR Tertiary Education Performance Report
PGDBE Post Graduate Diploma in Business Enterprise TES Tertiary Education Strategy
PGDIBPost Graduate Diploma in International Business
TEU Tertiary Education Union
PI Pacific Islands TIASA Tertiary Institutes Allied Staff AssociationPIN Post Secondary International Network TOP Training Opportunities Programme
PINZ Polytechnics International New Zealand TOS Top of the South (Island)PLF Performance Linked Funding TPI Technology & Primary IndustriesPMO Project Management Office (NMIT) TRoQ Tertiary Review of Qualifications
Council Open Agenda - 11 May 2017 - For Information
114

GLOSSARY
POD People and Organisation Development TTH Taught Teaching HoursPPBG Public Provider Base Grant TTM Te Tari Māori/Department of Māori StudiesPTEs Private Training Establishments TTMU Te Tiriti o Waitangi Monitoring UnitQAC Qualification Award Category TTP Te Toki PakoheQMS Quality Management Systems TWoA Te Wānanga o Aotearoa
RCH&S Regulatory Compliance Health & Safety WINTEC Waikato Institute of Technology
REAPs Rural Education Activities Programme Providers WLP Workload Planner
REDRegional Economic Development (NMIT Programme Group)
WPL Workplace Literacy
RFP Request for Proposal YG Youth GuaranteeRNZAF Royal New Zealand Air Force
Council Open Agenda - 11 May 2017 - For Information
115
Council Open Agenda - 11 May 2017 - For Information
116


![Number Home Phone Street City Zone Business Phone PLEASE INDICATE IN PROPER SQUARE WITH X New Member Junior Member Membership Renewal C] Received New Member or Renewal $2.00 before](https://static.fdocuments.in/doc/165x107/5fe981276706ae76877a227c/number-home-phone-street-city-zone-business-phone-please-indicate-in-proper-square.jpg)


