NJ School Performance Reports Reference Guide DOE … · NJ School Performance Reports Reference...
41
NJ School Performance Reports Reference Guide 1 Contents Introduction .................................................................................................................................................. 2 Report Elements ........................................................................................................................................... 2 Overview ................................................................................................................................................... 3 Demographics ........................................................................................................................................... 4 Academic Achievement ............................................................................................................................ 8 PARCC.................................................................................................................................................... 9 NJASK Science ..................................................................................................................................... 13 NJBCT .................................................................................................................................................. 14 NAEP.................................................................................................................................................... 15 Student Growth ...................................................................................................................................... 16 College and Career Readiness ................................................................................................................. 19 College Readiness Exams .................................................................................................................... 20 Advanced Placement/International Baccalaureate ............................................................................ 23 Visual and Performing Arts ................................................................................................................. 26 Career and Technical Education.......................................................................................................... 27 Attendance.......................................................................................................................................... 28 Grad/Postsecondary ............................................................................................................................... 30 Graduation Rate .................................................................................................................................. 31 Dropout Rate....................................................................................................................................... 32 Postsecondary Enrollment .................................................................................................................. 33 School Climate ........................................................................................................................................ 34 Data Investigation Protocol ........................................................................................................................ 38 School Performance Report Resources ...................................................................................................... 40
-
Upload
phungquynh -
Category
Documents
-
view
213 -
download
0
Transcript of NJ School Performance Reports Reference Guide DOE … · NJ School Performance Reports Reference...
NJ School Performance Reports
Reference Guide
1
Contents
Introduction .................................................................................................................................................. 2
Report Elements ........................................................................................................................................... 2
Overview ................................................................................................................................................... 3
Demographics ........................................................................................................................................... 4
Academic Achievement ............................................................................................................................ 8
PARCC .................................................................................................................................................... 9
NJASK Science ..................................................................................................................................... 13
NJBCT .................................................................................................................................................. 14
NAEP .................................................................................................................................................... 15
Student Growth ...................................................................................................................................... 16
College and Career Readiness ................................................................................................................. 19
College Readiness Exams .................................................................................................................... 20
Advanced Placement/International Baccalaureate ............................................................................ 23
Visual and Performing Arts ................................................................................................................. 26
Career and Technical Education.......................................................................................................... 27
Attendance .......................................................................................................................................... 28
Grad/Postsecondary ............................................................................................................................... 30
Graduation Rate .................................................................................................................................. 31
Dropout Rate ....................................................................................................................................... 32
Postsecondary Enrollment .................................................................................................................. 33
School Climate ........................................................................................................................................ 34
Data Investigation Protocol ........................................................................................................................ 38
School Performance Report Resources ...................................................................................................... 40
2
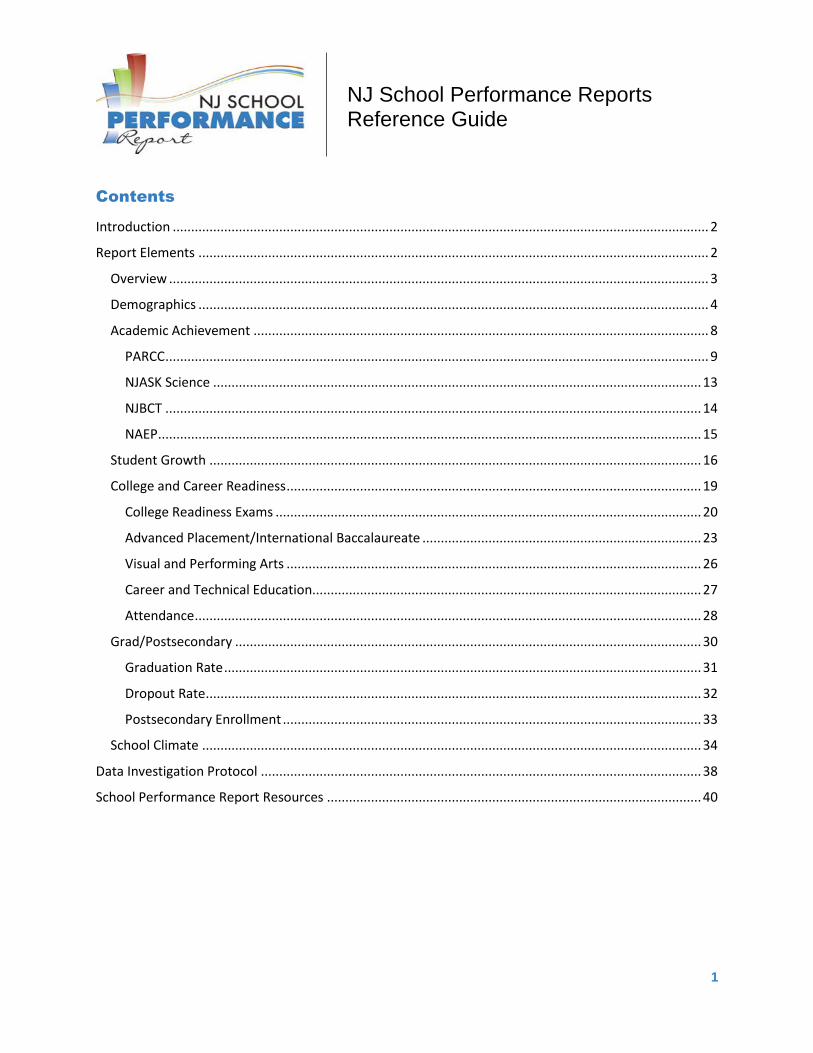
Introduction
As part of New Jersey’s accountability system, the New Jersey Department of Education annually publishes a significant amount of data in school performance reports to present a comprehensive picture of overall school performance. The New Jersey School Performance Reports are designed to present information to parents, educators, and communities about how well a school is performing and preparing its students for college and career. These reports focus attention on metrics that are indicative of college and career readiness, including chronic absenteeism, participation in college readiness tests, and taking rigorous coursework in high school. Education stakeholders can use this information to understand how a school’s performance on these metrics compares to other schools, as well as statewide results, to find a school’s strengths and identify its areas for improvement. This process of continuous improvement is supported through the inclusion of student longitudinal and growth data so that overall progress on these indicators can be measured.
Report Elements
The New Jersey School Performance Report contains seven possible sections: Overview, Demographic, Academic Achievement, Student Growth, College and Career Readiness, Grad/Postsecondary, and School Climate. Performance reports for elementary and middle schools contain the following sections:
Performance reports for schools with grades 9-12 contain the following sections:
Performance reports for non-tested schools contain the following sections:

3
Overview
The Overview page of the report explains how to use the school performance report. These reports provide information that one can use to learn more about school progress and areas for improvement.
Figure 1 - Overview

4
Demographics
The Demographic section of the New Jersey School Performance Reports provides information about the students that are enrolled at a particular school. Note that for all demographics information, 2013-2014 and 2014-2015 enrollment data reflects students who were “on roll” in October of each school year. 2015-2016 enrollment data reflects students who were “on roll” at the end of the school year.
Figure 2 - Demographics
Enrollment by Grade Level
This table presents the number of students enrolled in each grade level for the past three school
years.
Figure 3 - Enrollment by Grade

5
Enrollment by Gender
This bar graph presents the percentage of students by gender who were enrolled in the school for the past three years.
Figure 4 - Enrollment by Gender
Enrollment by Racial Subgroup
This pie chart presents the percentage of students by ethnic or racial subgroup enrolled in the school for the year of the report.
Figure 5 - Enrollment by Racial Subgroup
Enrollment Trends by Special Population
This bar graph presents the percentages of students who have been identified as a Student with a Disability, Economically Disadvantaged, or Limited English Proficiency. In order to be identified as a student with a disability, the student must be receiving special education services

6
and be enrolled in a special education program. Students identified as economically disadvantaged have qualified for the federal free and reduced lunch program. Limited English Proficiency students are those who are participating in an English Language Learner program at the school. Note that these categories are not mutually exclusive - a student may be included in more than one special population.
Figure 6 - Enrollment Trends by Special Population
Language Diversity
This table presents the percentages of students enrolled in the school by the primary language spoken in their homes, or “home language,” including English. The table only identifies the top five home languages in the school. All other home languages are collectively referred to as “Other.”
Figure 7 - Language Diversity
7
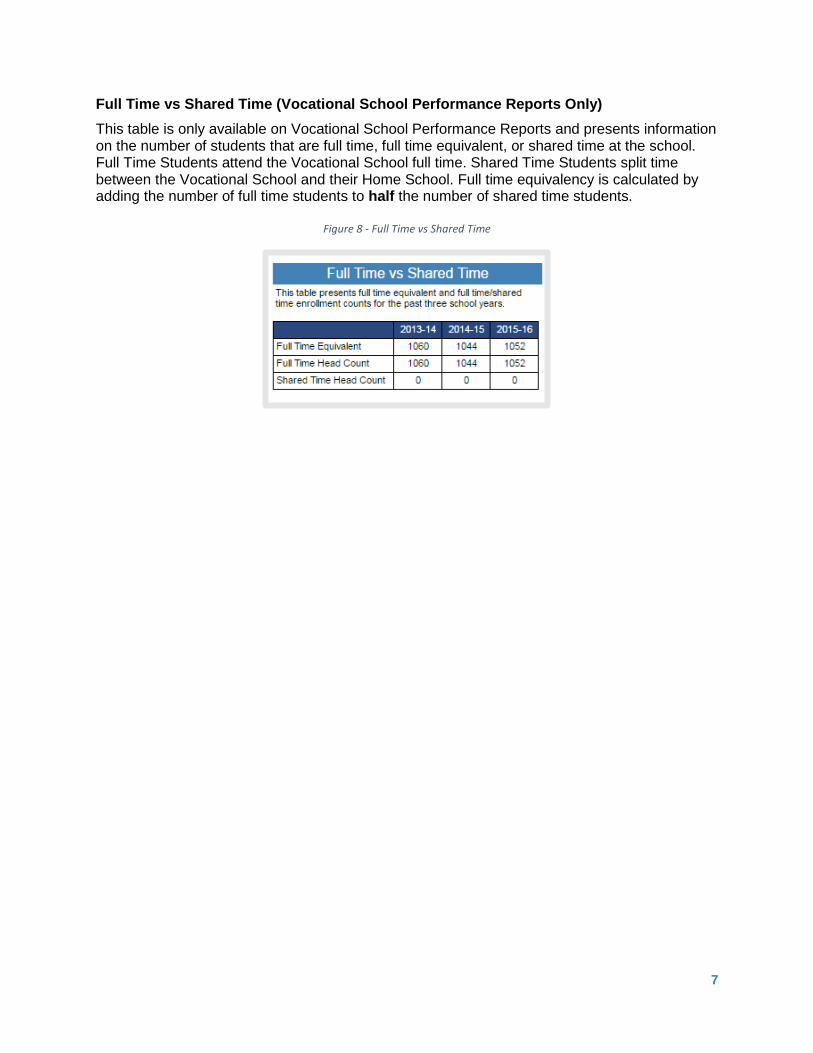
Full Time vs Shared Time (Vocational School Performance Reports Only)
This table is only available on Vocational School Performance Reports and presents information on the number of students that are full time, full time equivalent, or shared time at the school. Full Time Students attend the Vocational School full time. Shared Time Students split time between the Vocational School and their Home School. Full time equivalency is calculated by adding the number of full time students to half the number of shared time students.
Figure 8 - Full Time vs Shared Time

8
Academic Achievement
The Academic Achievement section of the New Jersey School Performance Reports provides information about student performance in English Language Arts/Literacy and Mathematics as measured by the Partnership for Assessment of Readiness for College and Careers assessment, also known as the PARCC test. The data displayed for PARCC results includes specific information about performance distribution and performance trends. Depending on the grade span of the report, this section of the report also presents information about student performance on additional assessments, including the New Jersey Biology Competency Test (NJBCT) and the New Jersey Assessment of Skills and Knowledge (NJASK).
Figure 9 - Academic Achievement

9
PARCC
PARCC exams are scored using a scale score. A scale score is a numerical value that summarizes student performance and for the PARCC exams ranges from 650 to 850. These scale scores are then stratified into performance levels. Information on performance levels can be found in the New Jersey PARCC Score Report Interpretation Guide: http://www.state.nj.us/education/assessment/parcc/scores/ The first table in this section, “Met/Exceeded Expectations,” provides information on the percentage of students in the school who have met or exceeded expectations on the ELA and Math PARCC exams. The middle column of this table describes how the school compares to other similar schools in the district as a percentile. This will only appear, however, if there are at least five schools in the district. Note that all percentiles within the NJ School Performance Reports are calculated based upon comparisons to schools of similar grade spans. To calculate these percentile distributions, PK-8 schools are grouped together; 9-12 and mixed grades schools (i.e.: PK-12) are grouped together; and vocational schools are grouped together. The percentile rank of the school indicates the percentage of scores that are equal to or lower than it. For example, a school that scored in the 50th percentile, performed better than 50% of schools in the district in that measure. The higher this number is, the better the school performed relative to other schools in the district. The final column describes how the school compares to other similar schools in the state as a percentile. Again, the higher this number is, the better the school performed relatives to other schools in the state.
Figure 10 - Met/Exceeded Expectations
The following tables provide information on performance by subgroups. By separating the
performance data into these subgroups, educators and stakeholders can identify gaps in
achievement between the various student populations and work to improve educational
outcomes for all students.
Since student-level data is confidential in accordance with the federal Family Educational Rights and Privacy Act, or FERPA, certain data may have been suppressed due to a small number of students belonging to that grouping. An entry of “S” indicates that the data has been suppressed. An entry of “N” indicates that no data has been reported. The number required to display data vary for different indicators but typically range from 10 to 30 students. Information about suppression rules can be found here: https://rc.doe.state.nj.us/SuppressionRules/SuppressionRules.pdf

10
The table, “Mathematics and English Language Arts/Literacy,” summarizes school performance
by subgroup across all grades in the school on the ELA and Math PARCC exams. This table
lists the total number of valid test scores, the percentage of students who met or exceeded
expectations, the statewide percentile, and the school participation rate. It also identifies if the
school met its participation goal as set by the United States Department of Education at 95% of
students taking the PARCC exam with a checkmark. A checkmark with a plus sign indicates that
participation averaging was applied. Please note the “Met/Exceeded Expectations” and
“Mathematics and English Language Arts/ Literacy” tables do not include students who took a
PARCC exam in grade 11.
Figure 11 - Mathematics and English/Language Arts/Literacy
Additional tables in the performance report, named “PARCC Performance Distribution,” present performance information by subgroup for students who took the PARCC exam for each tested grade and subject area. Note, if a student was enrolled in the school for less than 1 year, they are excluded from these tables. These performance distribution charts are provided for grade-level English Language Arts exams, as well as for the Mathematics end-of-course exams. Note that the report for any school will include tables just for the tested grades and subject areas in that school. Additionally, eleventh grade students who took AP or IB English are exempted from the eleventh grade PARCC ELA exam and their performance may not be reflected in these results.
11
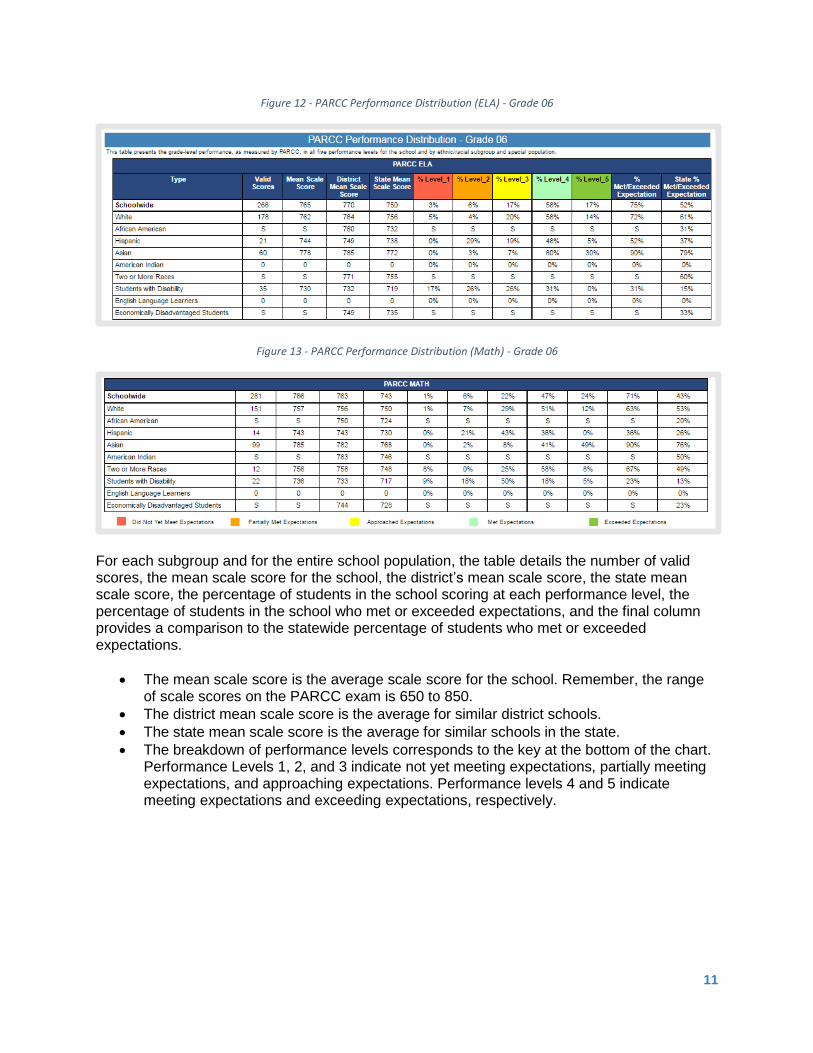
Figure 12 - PARCC Performance Distribution (ELA) - Grade 06
Figure 13 - PARCC Performance Distribution (Math) - Grade 06
For each subgroup and for the entire school population, the table details the number of valid scores, the mean scale score for the school, the district’s mean scale score, the state mean scale score, the percentage of students in the school scoring at each performance level, the percentage of students in the school who met or exceeded expectations, and the final column provides a comparison to the statewide percentage of students who met or exceeded expectations.
The mean scale score is the average scale score for the school. Remember, the range of scale scores on the PARCC exam is 650 to 850.
The district mean scale score is the average for similar district schools.
The state mean scale score is the average for similar schools in the state.
The breakdown of performance levels corresponds to the key at the bottom of the chart. Performance Levels 1, 2, and 3 indicate not yet meeting expectations, partially meeting expectations, and approaching expectations. Performance levels 4 and 5 indicate meeting expectations and exceeding expectations, respectively.

12
The Academic Achievement section also presents information on performance trends for PARCC exams. The “PARCC Performance Trends” graphs are new to the school performance reports this year and display the percentage of students who have met or exceeded expectations on the PARCC ELA and Math exams over the past two school years for all tested grades.
Figure 14 - PARCC ELA Performance Trends
Figure 15 - PARCC Math Performance Trends
There are two ways to look at the data represented by these bar graphs.
First, one could examine the year over year change within the grade level or content area. A change within a subject from year to year potentially indicates a change in the curriculum or teaching practices. However, it is important to note that these are not the same students so a year over year comparison does not compare the progress for the same group of students. The second way to interpret the data displayed in this bar graph is to evaluate the year over year change within the student cohort for both years. For example, in the “PARCC ELA Performance Trends” chart above, 57% of sixth graders in 2014-15 met or exceeded expectations. This increased to 70% of students when this cohort took the seventh grade PARCC assessment. It is important to note, however, that this group of students may have changed due to transfers in and out of this school.
13
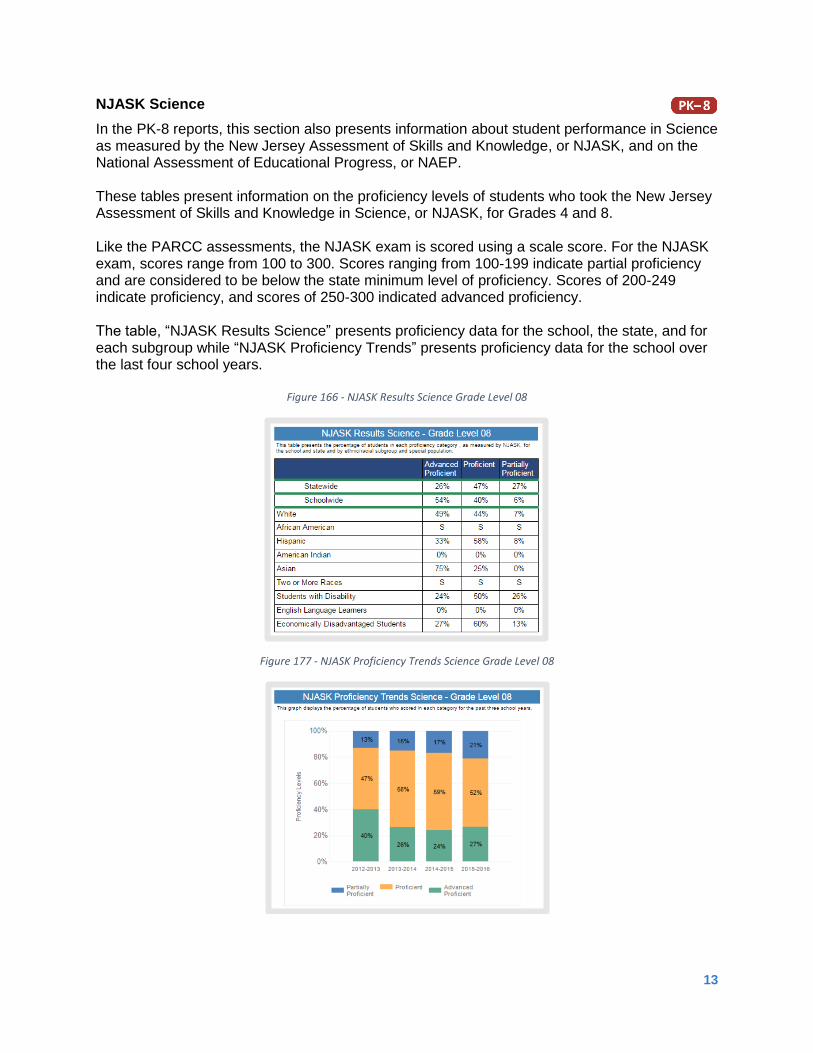
NJASK Science
In the PK-8 reports, this section also presents information about student performance in Science as measured by the New Jersey Assessment of Skills and Knowledge, or NJASK, and on the National Assessment of Educational Progress, or NAEP. These tables present information on the proficiency levels of students who took the New Jersey Assessment of Skills and Knowledge in Science, or NJASK, for Grades 4 and 8. Like the PARCC assessments, the NJASK exam is scored using a scale score. For the NJASK exam, scores range from 100 to 300. Scores ranging from 100-199 indicate partial proficiency and are considered to be below the state minimum level of proficiency. Scores of 200-249 indicate proficiency, and scores of 250-300 indicated advanced proficiency. The table, “NJASK Results Science” presents proficiency data for the school, the state, and for each subgroup while “NJASK Proficiency Trends” presents proficiency data for the school over the last four school years.
Figure 166 - NJASK Results Science Grade Level 08
Figure 177 - NJASK Proficiency Trends Science Grade Level 08

14
NJBCT
The final tables in the performance reports for secondary schools in the Academic Achievement section present proficiency information for students who took the New Jersey Biology Competency Test, or NJBCT. Like the PARCC assessments, the NJBCT exam is scored using a scale score. For the NJBCT exam, scores range from 100 to 300. Scores ranging from 100-199 indicate partial proficiency and are considered to be below the state minimum level of proficiency. Scores of 200-249 indicate proficiency, and scores of 250-300 indicate advanced proficiency. The table, “Proficiency Outcomes” presents proficiency data for the state, the school, and for each subgroup, while “Proficiency Trends” presents proficiency data for the school over the last four school years.
Figure 188 - Proficiency Outcomes Biology
Figure 199 - Proficiency Trends Biology
15
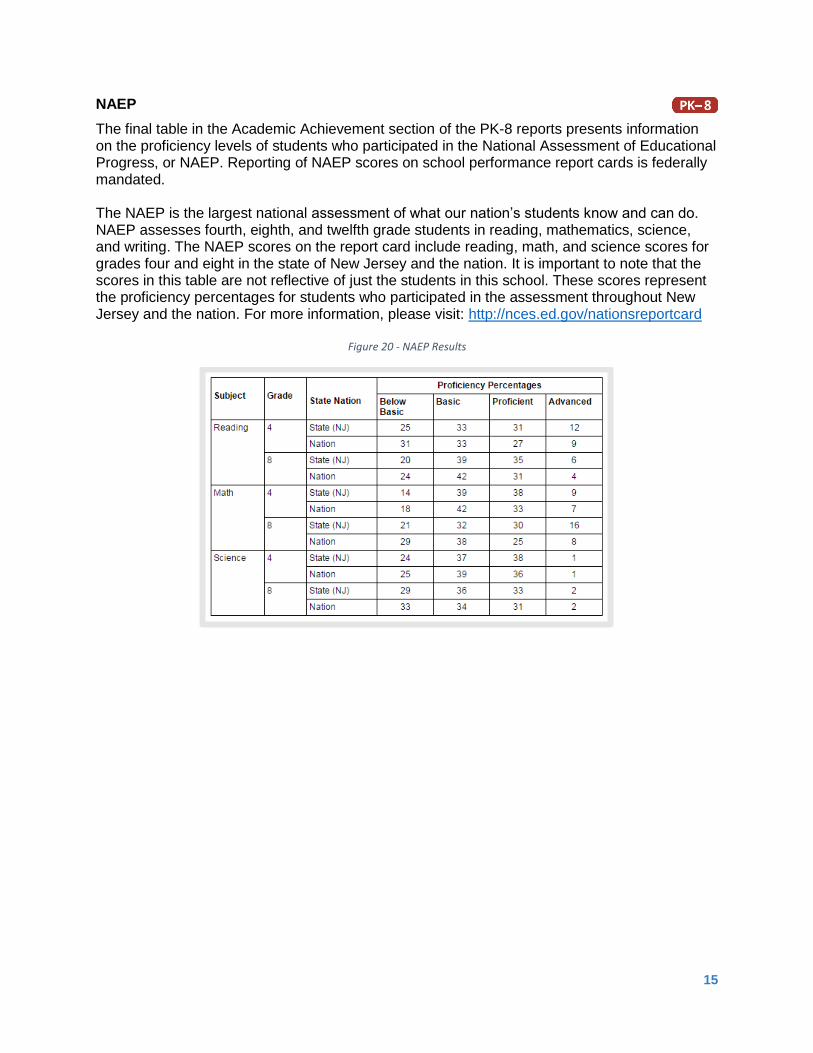
NAEP
The final table in the Academic Achievement section of the PK-8 reports presents information on the proficiency levels of students who participated in the National Assessment of Educational Progress, or NAEP. Reporting of NAEP scores on school performance report cards is federally mandated. The NAEP is the largest national assessment of what our nation’s students know and can do. NAEP assesses fourth, eighth, and twelfth grade students in reading, mathematics, science, and writing. The NAEP scores on the report card include reading, math, and science scores for grades four and eight in the state of New Jersey and the nation. It is important to note that the scores in this table are not reflective of just the students in this school. These scores represent the proficiency percentages for students who participated in the assessment throughout New Jersey and the nation. For more information, please visit: http://nces.ed.gov/nationsreportcard
Figure 20 - NAEP Results

16
Student Growth
The Student Growth section of the New Jersey School Performance Reports appears only in the PK-8 reports and presents information about schoolwide student growth, using the Student Growth Percentile or SGP methodology. SGP measures student growth year over year by comparing a student’s achievement to a group of students that had similar achievement in previous years. SGP makes it possible to measure how much a student has grown relative to his or her academic peers with a similar test score history. The SGP score is a percentile rank that demonstrates the percentage of the peer group the student outperformed.
Figure 21 - Student Growth
To learn more about how SGP is calculated, please visit: http://www.state.nj.us/education/njsmart/performance/
17
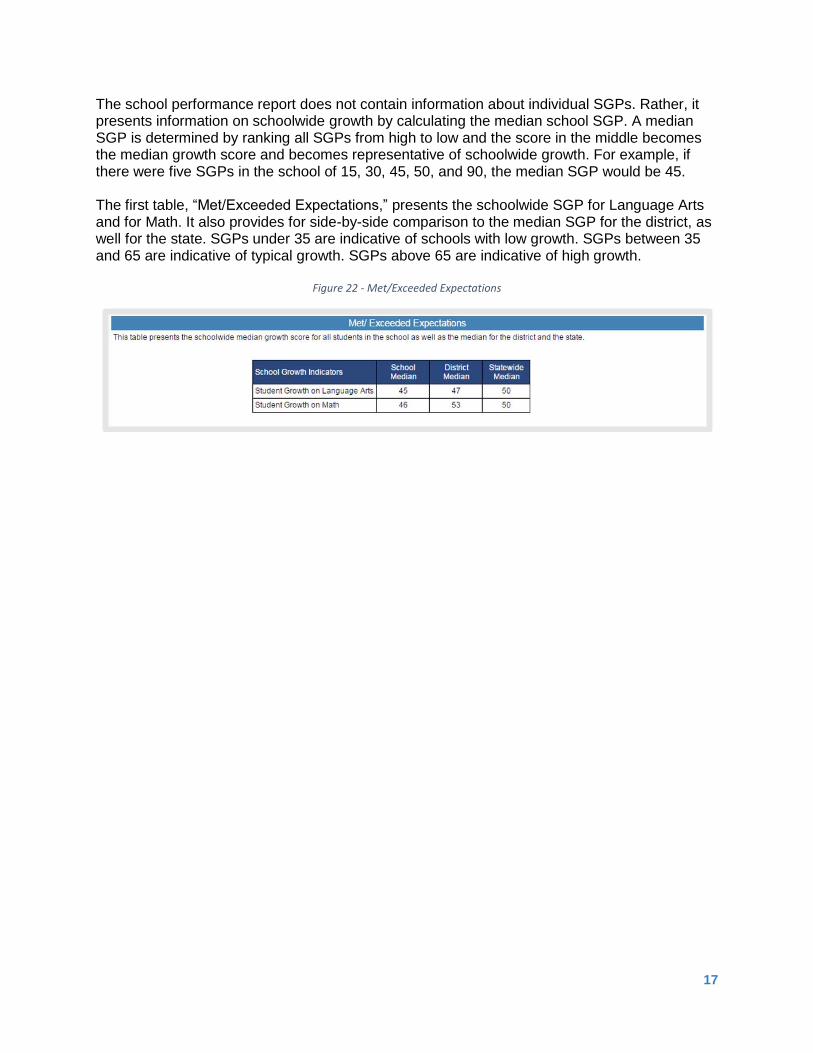
The school performance report does not contain information about individual SGPs. Rather, it presents information on schoolwide growth by calculating the median school SGP. A median SGP is determined by ranking all SGPs from high to low and the score in the middle becomes the median growth score and becomes representative of schoolwide growth. For example, if there were five SGPs in the school of 15, 30, 45, 50, and 90, the median SGP would be 45. The first table, “Met/Exceeded Expectations,” presents the schoolwide SGP for Language Arts and for Math. It also provides for side-by-side comparison to the median SGP for the district, as well for the state. SGPs under 35 are indicative of schools with low growth. SGPs between 35 and 65 are indicative of typical growth. SGPs above 65 are indicative of high growth.
Figure 22 - Met/Exceeded Expectations

18
These classifications of low, typical, and high growth also pertain to student SGPs. The tables, “Student Growth ELA” and “Student Growth Math,” present information on how students with low, typical, and high growth last school year performed on the PARCC exams for this school year. It is important to note that growth levels do not correspond directly to PARCC performance. For example, it is possible for a student with a high growth score to still score below expectations on PARCC because performance against standards in one year is different than the growth made by the student since the last year. Remember, SGP is a calculation of a student’s growth compared to their academic peer group. A student that has made rapid gains over his or her peer group could have high growth but still score below expectations.
Figure 23 - Student Growth ELA
Figure 24 - Student Growth Math

19
College and Career Readiness
The College and Career Readiness section of the New Jersey School Performance Reports provides information about student behaviors that correlate with greater success in college and career. These behaviors include taking college entrance exams, taking advanced coursework, participating in visual and performing arts and career and technical education programs, and regularly attending school. Information on the PSAT and ACT are new to the school performance report this year. For the purposes of these reports, the PSAT population includes students in grades nine and ten, the SAT population includes students in grades eleven and twelve, and the ACT population includes students in grades twelve only.
Figure 25 - College and Career Readiness

20
College Readiness Exams
The table, “PSAT/SAT/ACT Participation,” presents information on student participation in college readiness exams. These include the Preliminary SAT or PSAT, SAT, and ACT. For more information on the PSAT and the SAT, please visit: https://www.collegeboard.org/ For more information on the ACT, please visit: http://www.act.org/ The first row of the table displays the percentage of students who have participated in the PSAT in the school and in the state. The second and third rows display the percentage of students who have participated in either the SAT or ACT in the school and in the state. Students who participated in both may be counted in both rows.
Figure 26 - PSAT/SAT/ACT Participation

21
The table, “PSAT/SAT/ACT Benchmarks” presents the percentage of students that have scored at or above College Readiness benchmark scores in this school and throughout the state. This data allows for the comparison of the performance of students in the school to the overall state of New Jersey. The first row presents the percentage of students who have scored at or above the benchmark score on the PSAT. The School Performance Report considers scores from the PSAT 8/9, PSAT 10, and PSAT NMSQT. Each of these tests have their own College and Career Readiness benchmark, thus an overall PSAT benchmark is not provided. For the SAT, the table presents the percentages of students who have scored at or above the benchmark score of 480 on the Reading and Writing component and those who have scored at or above the benchmark score of 530 on the Math component. For more information on SAT scores, please visit: https://collegereadiness.collegeboard.org/sat/scores/understanding-scores For the ACT, the table presents the percentages of students who have scored at or above the benchmark scaled scores of 22 in Reading, 18 in English, 22 in Math, and 23 in Science for the past three school years. For more information on ACT scores, please visit: http://www.act.org/content/act/en/products-and-services/the-act/your-scores/understanding-your-scores.html
Figure 27 - PSAT/SAT/ACT Benchmarks
22
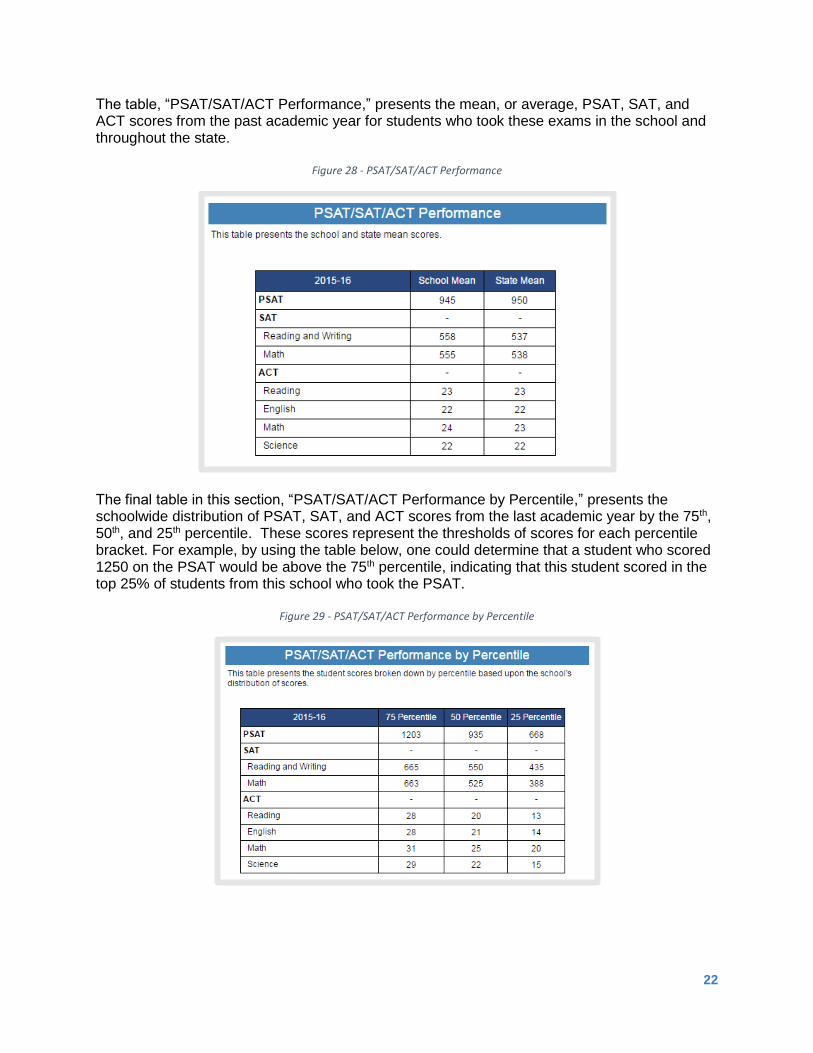
The table, “PSAT/SAT/ACT Performance,” presents the mean, or average, PSAT, SAT, and ACT scores from the past academic year for students who took these exams in the school and throughout the state.
Figure 28 - PSAT/SAT/ACT Performance
The final table in this section, “PSAT/SAT/ACT Performance by Percentile,” presents the schoolwide distribution of PSAT, SAT, and ACT scores from the last academic year by the 75th, 50th, and 25th percentile. These scores represent the thresholds of scores for each percentile bracket. For example, by using the table below, one could determine that a student who scored 1250 on the PSAT would be above the 75th percentile, indicating that this student scored in the top 25% of students from this school who took the PSAT.
Figure 29 - PSAT/SAT/ACT Performance by Percentile
23
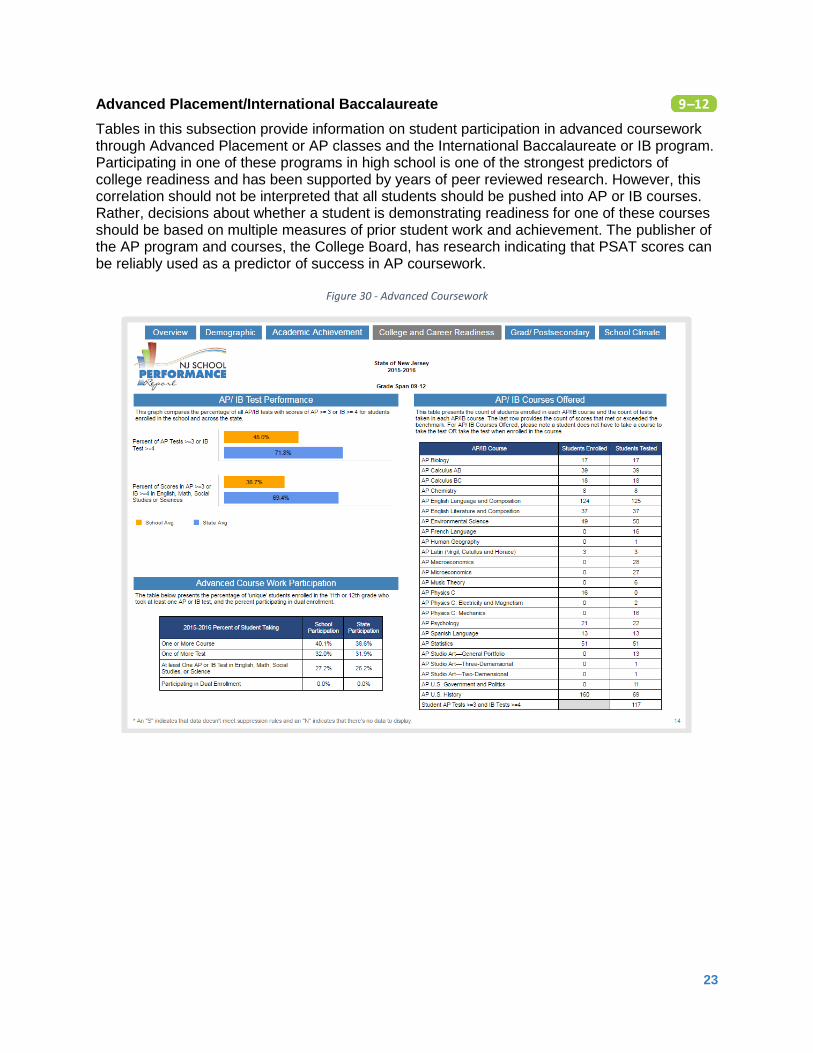
Advanced Placement/International Baccalaureate
Tables in this subsection provide information on student participation in advanced coursework through Advanced Placement or AP classes and the International Baccalaureate or IB program. Participating in one of these programs in high school is one of the strongest predictors of college readiness and has been supported by years of peer reviewed research. However, this correlation should not be interpreted that all students should be pushed into AP or IB courses. Rather, decisions about whether a student is demonstrating readiness for one of these courses should be based on multiple measures of prior student work and achievement. The publisher of the AP program and courses, the College Board, has research indicating that PSAT scores can be reliably used as a predictor of success in AP coursework.
Figure 30 - Advanced Coursework

24
The graph, “AP/IB Test Performance,” compares school and state test results for AP scores of 3 (Qualified) or higher or IB scores of 4 (Satisfactory) or higher. The first set of bars compares scores on all tests, while the second set of bars looks at only the core areas of English, Math, Social Studies, and Science. Note that these are percentages of tests, not students. If a student took multiple tests, they will be counted more than once.
Figure 31 - AP/IB Test Performance
The “Advanced Course Work Participation” table presents information on students who are taking AP or IB courses and/or tests. The first three rows present the percentages of 11th and 12th grade students in the school and in the state who have participated in one or more AP or IB course, taken one or more AP or IB test, and taken at least one or more AP or IB test in a core subject area. The last row presents the percentages of students in the school and in the state who are participating in dual enrollment. Dual enrollment is a program that allows high school students to enroll in college courses for credit prior to their high school graduation.
Figure 32 - Advanced Course Work Participation

25
The “AP/IB Courses Offered” table presents all of the AP and IB courses that are offered at the school, as well as the number of students who enrolled in the course and took the corresponding exam. The last row of the table presents the number of tests that met or exceeded a score of 3 on AP exams and 4 on IB exams. Note, a school does not have to offer the course for a student to take the test and a student is not mandated to take the test if they take the course.
Figure 33 - AP/IB Courses Offered

26
Visual and Performing Arts
This section presents information on student participation in visual and performing arts courses. The Visual and Performing Arts have been a part of the New Jersey Core Curriculum Content Standards and the state’s graduation requirements since 1996. Numerous studies have identified links between involvement in the visual and performing arts and improved attendance, school engagement, academic performance, and higher levels of postsecondary attendance. You can contact your school to learn what visual and performing arts courses were offered. The “Visual and Performing Arts” bar graph displays the percentage of students who were enrolled in at least one music, drama, dance, or visual arts course for this academic year, in this school and in the state. The donut charts to the right indicate the overall participation rate of the students in music, drama, dance, and visual arts courses in the school and in the state.
Figure 34 - Visual and Performing Arts

27
Career and Technical Education
The “Career and Technical Education Participation” bar graph presents the percentage of students who participated in an approved Career and Technical Education program in this school, as well as in the state. Career and Technical Education, or CTE, provides students with opportunities to learn academic, technical, and professional skills that are vital for today’s learners. CTE Participants are students who have completed only one CTE course. CTE Concentrators are students who have completed at least two CTE courses. The Structured Learning Environment participation rate is the percentage of students who have completed a course in a Structured Learning Environment. Participation in a Structured Learning Environment is separate from CTE. Students can participate in a Structured Learning Environment and not be in a CTE program.
Figure 35 - Career and Technical Education Participation

28
Attendance
The New Jersey School Performance Reports present information on school attendance, including both overall absenteeism and chronic absenteeism. This information is new to the school performance reports this year. The bar graph, “Absenteeism,” presents the percentage of students who were absent, in each category: 0 absences, 1-5 absences, 6-10 absences, 11-15 absences, and 15+ absences. An absence is defined as being “not present” and includes both excused and unexcused absences.
Figure 36 - Absenteeism

29
The line graph, “Chronic Absenteeism Trend,” presents the percentage of students who were
chronically absent over the past three years for the school. For the purpose of these reports, a
chronically absent student is defined as a student who is absent for 10% or more of the days
they were enrolled in the school. For example, if a student was enrolled for the full year at this
school and there were 180 days of school, this student would be considered chronically absent
if the total number of absences was 18 or more days. If a student transferred into the school
during the school year and was only enrolled for 80 days, this student would be considered
chronically absent with 8 or more absences. Note, chronic absenteeism data for the state was
not calculated prior to this school year.
Figure 37 - Chronic Absenteeism Trend
30
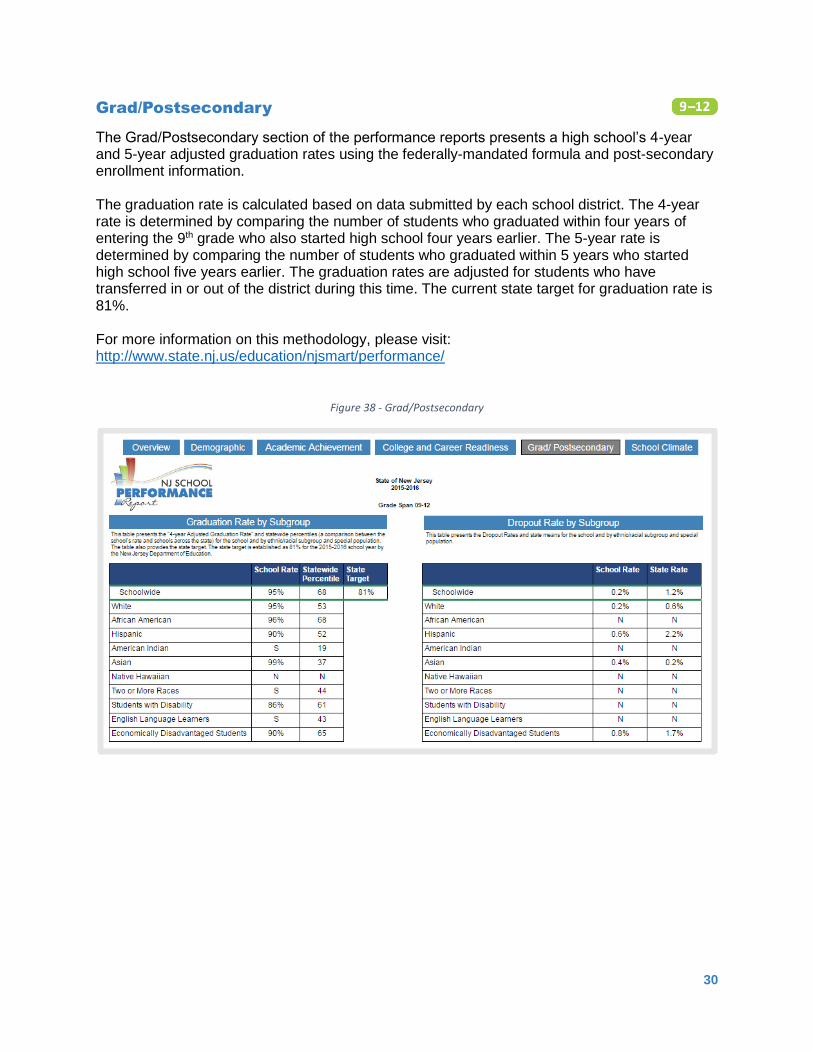
Grad/Postsecondary
The Grad/Postsecondary section of the performance reports presents a high school’s 4-year and 5-year adjusted graduation rates using the federally-mandated formula and post-secondary enrollment information. The graduation rate is calculated based on data submitted by each school district. The 4-year rate is determined by comparing the number of students who graduated within four years of entering the 9th grade who also started high school four years earlier. The 5-year rate is determined by comparing the number of students who graduated within 5 years who started high school five years earlier. The graduation rates are adjusted for students who have transferred in or out of the district during this time. The current state target for graduation rate is 81%. For more information on this methodology, please visit: http://www.state.nj.us/education/njsmart/performance/
Figure 38 - Grad/Postsecondary

31
Graduation Rate
The table, “Graduation Rate by Subgroup,” presents the 4-year adjusted graduation rate in the school for each of the previously identified subgroups. The table also presents information about where this percentage ranks in the state by indicating the subgroup’s graduation rate statewide percentile.
Figure 39 - Graduation Rate by Subgroup
The table, “Extended Year Graduation Rate,” presents the 4-year and 5-year graduation rates for the past four graduating cohorts. There will be no 5-year graduation rate for this year’s current cohort, as these students have not yet graduated.
Figure 40 - Extended Year Graduation Rate

32
Dropout Rate
The table, “Dropout Rate by Subgroup,” presents information on the percentage of students who are classified as dropouts both schoolwide and for each subgroup population. This rate is calculated by dividing the number of students who are classified as dropouts by total school enrollment. Students who exit school for other reasons are not included in this percentage.
Figure 41 - Dropout Rate by Subgroup
33
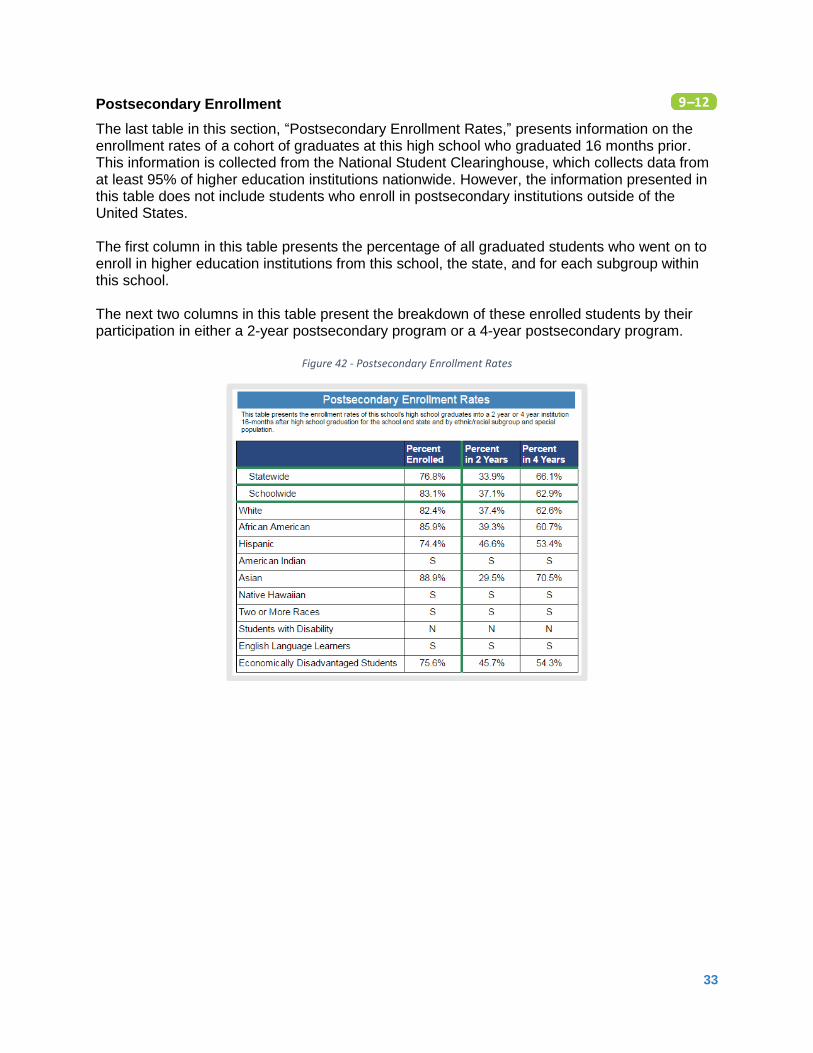
Postsecondary Enrollment
The last table in this section, “Postsecondary Enrollment Rates,” presents information on the enrollment rates of a cohort of graduates at this high school who graduated 16 months prior. This information is collected from the National Student Clearinghouse, which collects data from at least 95% of higher education institutions nationwide. However, the information presented in this table does not include students who enroll in postsecondary institutions outside of the United States. The first column in this table presents the percentage of all graduated students who went on to enroll in higher education institutions from this school, the state, and for each subgroup within this school. The next two columns in this table present the breakdown of these enrolled students by their participation in either a 2-year postsecondary program or a 4-year postsecondary program.
Figure 42 - Postsecondary Enrollment Rates
34
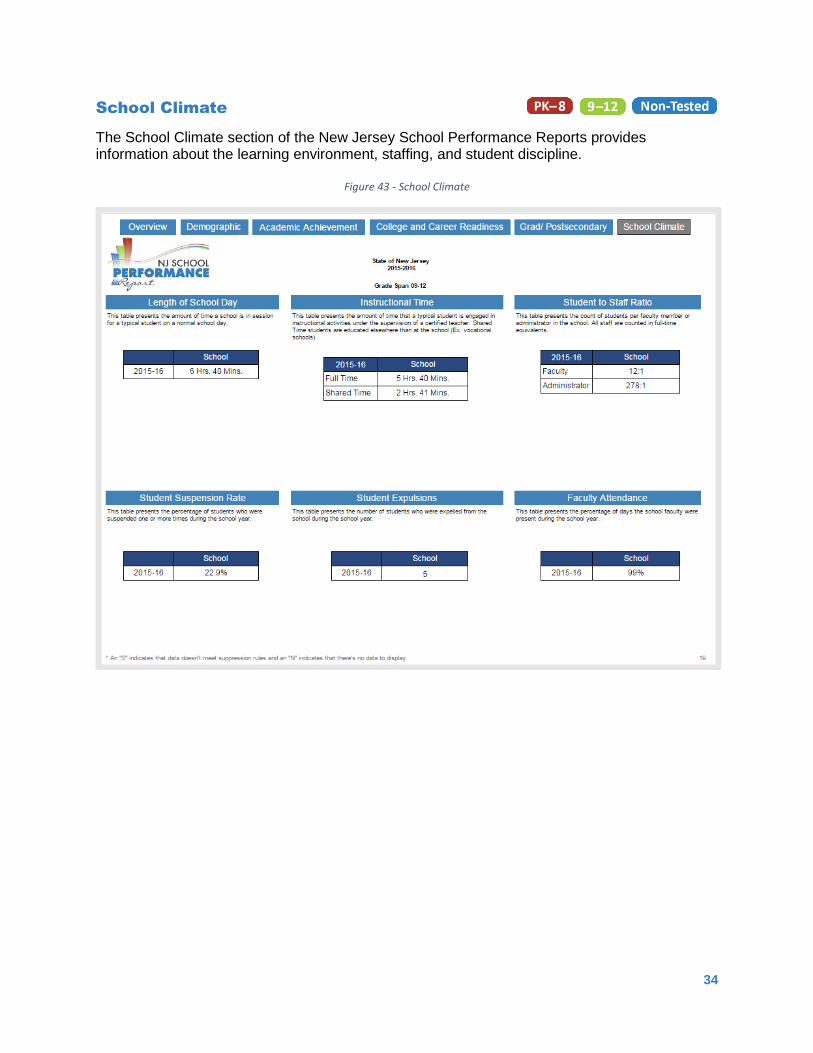
School Climate
The School Climate section of the New Jersey School Performance Reports provides information about the learning environment, staffing, and student discipline.
Figure 43 - School Climate

35
Learning Environment
The “Length of School Day” table presents the amount of time a typical student would spend in school on a normal school day. This time includes both instructional and non-instructional activities.
Figure 44 - Length of School Day
The “Instructional Time” table presents the amount of time that a typical full-time student is participating in instructional activities with a certified teacher. This differs from the length of the school day because it only counts time students spend in instructional activities and does not include time spent in non-instructional activities, such as lunch. The table also presents information about the amount of time that a typical shared-time student spends participating in instructional activities with a certified teacher in this school. (Shared time students split time between two schools.)
Figure 45 - Instructional Time

36
Staffing
The “Student to Staff Ratio” table presents the number of students per faculty member or administrator in the school. The faculty ratio is representative of all full-time certified staff members and not just teachers. Thus, this is not representative of class size for the school.
Figure 46 - Student to Staff Ratio
The “Faculty Attendance” table is new to the school performance report this year and presents the percentage of days’ school staff were present during the school year. This is calculated by dividing the sum of the days all faculty members were present by the total number of days possible.
Figure 47 - Faculty Attendance

37
Student Discipline
The “Student Suspension Rate” table presents the percentage of students who were suspended from school at least once during the school year. A suspension from school can be either an in-school suspension, which removes the student from regular school activities, or an out of school suspension, in which the student is not permitted to come to school for a designated length of time.
Figure 48 - Student Suspension Rate
The “Student Expulsions” table presents the number of students who were expelled from the school during the school year. An expulsion refers to the banning of a student from the school and district for the year.
Figure 49 - Student Expulsions
38
Data Investigation Protocol
Remember, the school performance reports present a high-level review of performance data. To further explore school performance, use this template to record key clarifying questions and other ideas that your review of the performance reports has generated. Then, identify additional information and data elements you will need in order to further investigate your findings.
Possible Areas for School Improvement Discovered Through a Review of the Performance Reports
1.
2.
3.
4.
Questions I Have Related to These Areas for School Improvement
1.
2.
3.
4.
Identifying Data Elements Needed
For each question, list below any additional information you need in order to address the
question.
Question #1: _________________________________________________________________
Information Needed to Address the Question
Where can you go, or who can you contact to get this information?

39
Question #2: _________________________________________________________________
Information Needed to Address the Question
Where can you go, or who can you contact to get this information?
Question #3: _________________________________________________________________
Information Needed to Address the Question
Where can you go, or who can you contact to get this information?
Question #4: _________________________________________________________________
Information Needed to Address the Question
Where can you go, or who can you contact to get this information?

40
School Performance Report Resources
What to do if… Action
I want to give feedback, suggest
improvements, or request
additional data for future reports
Fill out our feedback survey at
www.surveymonkey.com/r/VLDZPCM or email us at
I want more data about my child or
school that is not in this report Contact your school
I’m having technical issues with
the reports Contact [email protected]
I’m a school/district employee and
I want to flag an issue with the
data
Contact [email protected]
I have questions about how to
understand the data in the reports Contact [email protected]
I want to know how my
school/district is addressing
performance
Contact your school or district
I’m looking for previous year
reports Choose your school year of choice from the selection criteria page located at https://rc.doe.state.nj.us/SearchForSchool.aspx
I don’t understand what the “S”
means in a data table
Read about suppression rules at
www.nj.gov/education/njsmart/download/
I want to know what
courses/programs are offered at
my school
Contact your school
I want to download the data from
these reports
Database files are available at
https://rc.doe.state.nj.us/ReportsDatabase.aspx
I’m looking for a list of schools in
the state
Find the NJ school directory at
homeroom5.doe.state.nj.us/directory/
I’m a researcher and I want to
request data for a research project Contact [email protected]
41
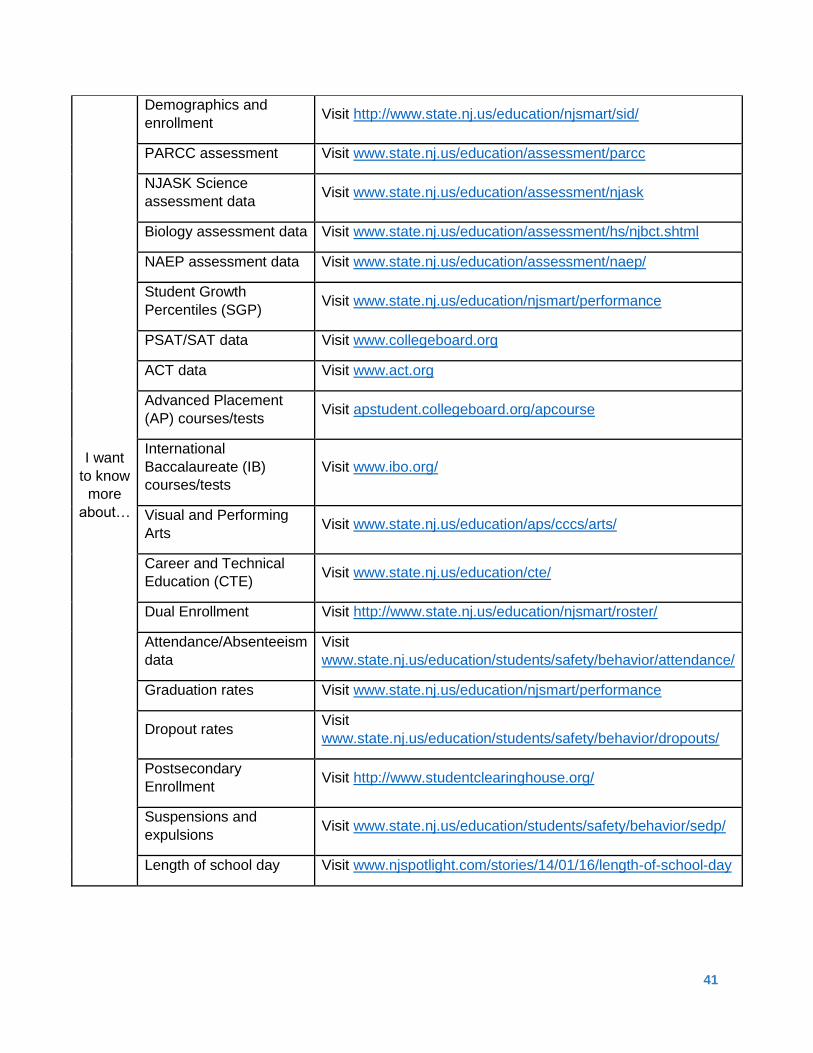
I want
to know
more
about…
Demographics and
enrollment Visit http://www.state.nj.us/education/njsmart/sid/
PARCC assessment Visit www.state.nj.us/education/assessment/parcc
NJASK Science
assessment data Visit www.state.nj.us/education/assessment/njask
Biology assessment data Visit www.state.nj.us/education/assessment/hs/njbct.shtml
NAEP assessment data Visit www.state.nj.us/education/assessment/naep/
Student Growth
Percentiles (SGP) Visit www.state.nj.us/education/njsmart/performance
PSAT/SAT data Visit www.collegeboard.org
ACT data Visit www.act.org
Advanced Placement
(AP) courses/tests Visit apstudent.collegeboard.org/apcourse
International
Baccalaureate (IB)
courses/tests
Visit www.ibo.org/
Visual and Performing
Arts Visit www.state.nj.us/education/aps/cccs/arts/
Career and Technical
Education (CTE) Visit www.state.nj.us/education/cte/
Dual Enrollment Visit http://www.state.nj.us/education/njsmart/roster/
Attendance/Absenteeism
data
Visit
www.state.nj.us/education/students/safety/behavior/attendance/
Graduation rates Visit www.state.nj.us/education/njsmart/performance
Dropout rates Visit
www.state.nj.us/education/students/safety/behavior/dropouts/
Postsecondary
Enrollment Visit http://www.studentclearinghouse.org/
Suspensions and
expulsions Visit www.state.nj.us/education/students/safety/behavior/sedp/
Length of school day Visit www.njspotlight.com/stories/14/01/16/length-of-school-day