Nitrogen source tracing in the Choptank River Watershed Midshore Riverkeeper Conservancy University...
33
Nitrogen source tracing in the Choptank River Watershed Midshore Riverkeeper Conservancy University of Maryland Center for Environmental Science National Fish and Wildlife Foundation
-
Upload
tariq-campany -
Category
Documents
-
view
214 -
download
0
Transcript of Nitrogen source tracing in the Choptank River Watershed Midshore Riverkeeper Conservancy University...
Nitrogen source tracing in the Choptank River Watershed
Midshore Riverkeeper ConservancyUniversity of Maryland Center for Environmental Science
National Fish and Wildlife Foundation
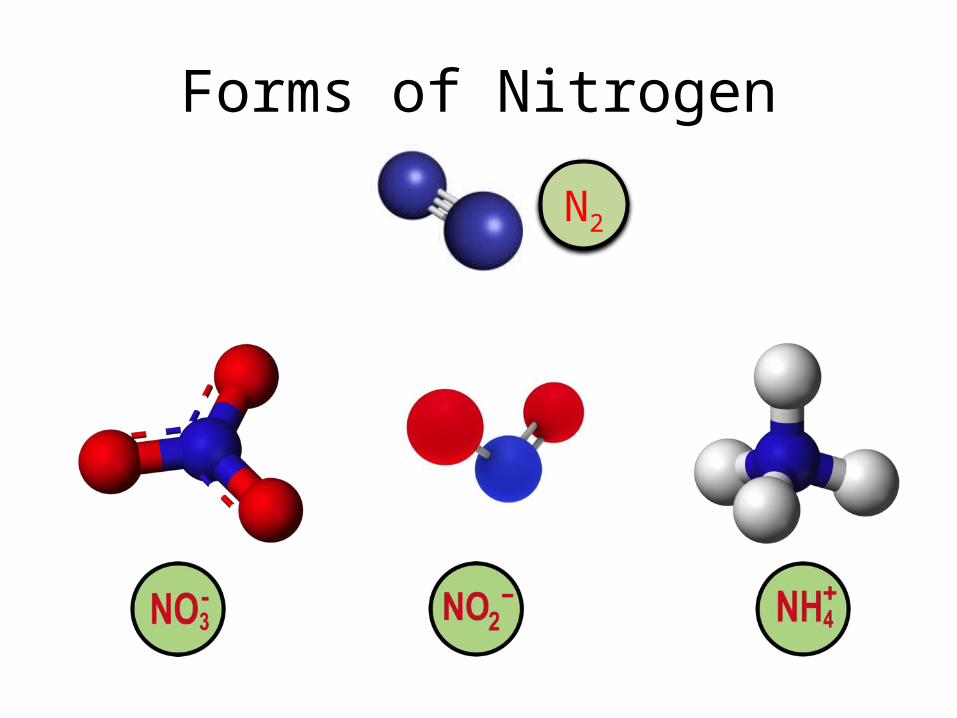
Forms of Nitrogen
N2
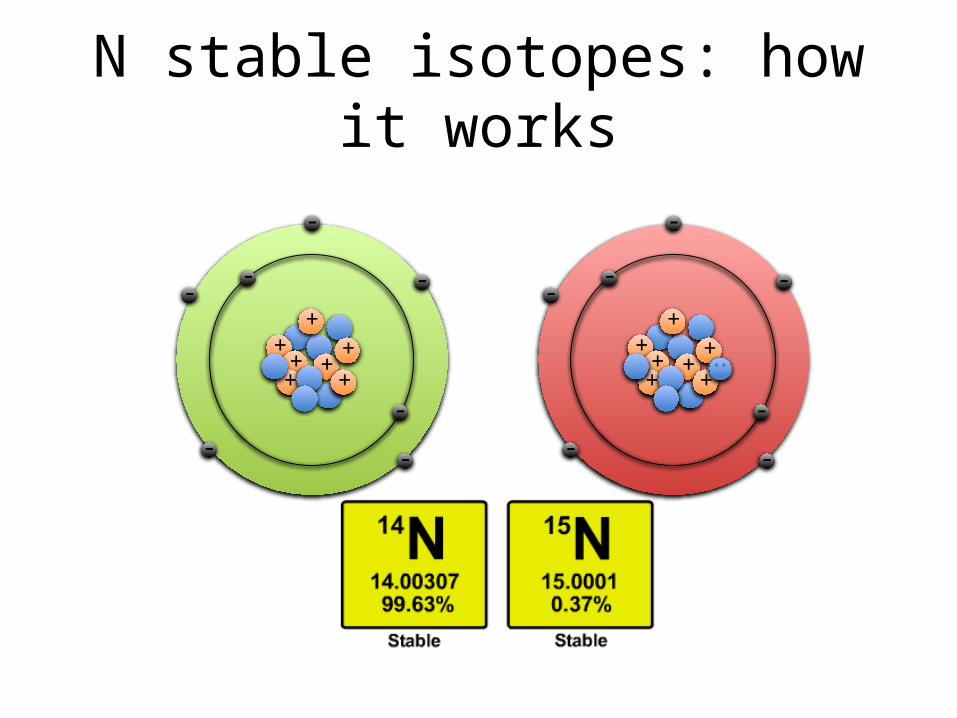
N stable isotopes: how it works
++ +
++
+
+
-
-
-
--
- -
++ +
++
+
+
-
-
-
--
- -
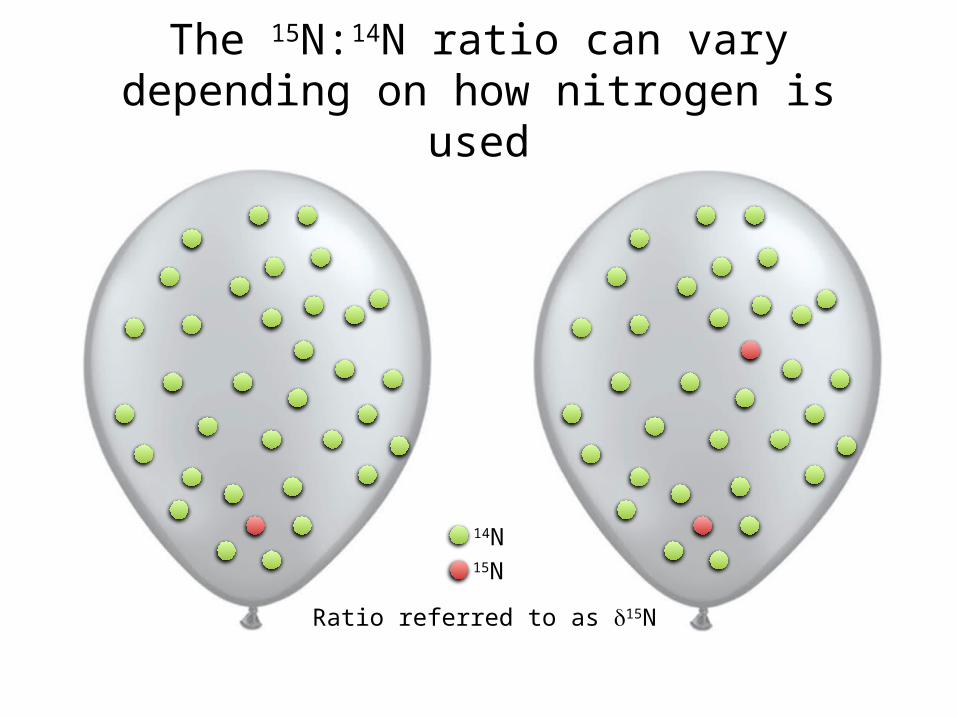
The 15N:14N ratio can vary depending on how nitrogen is used
15N
14N
Ratio referred to as d15N
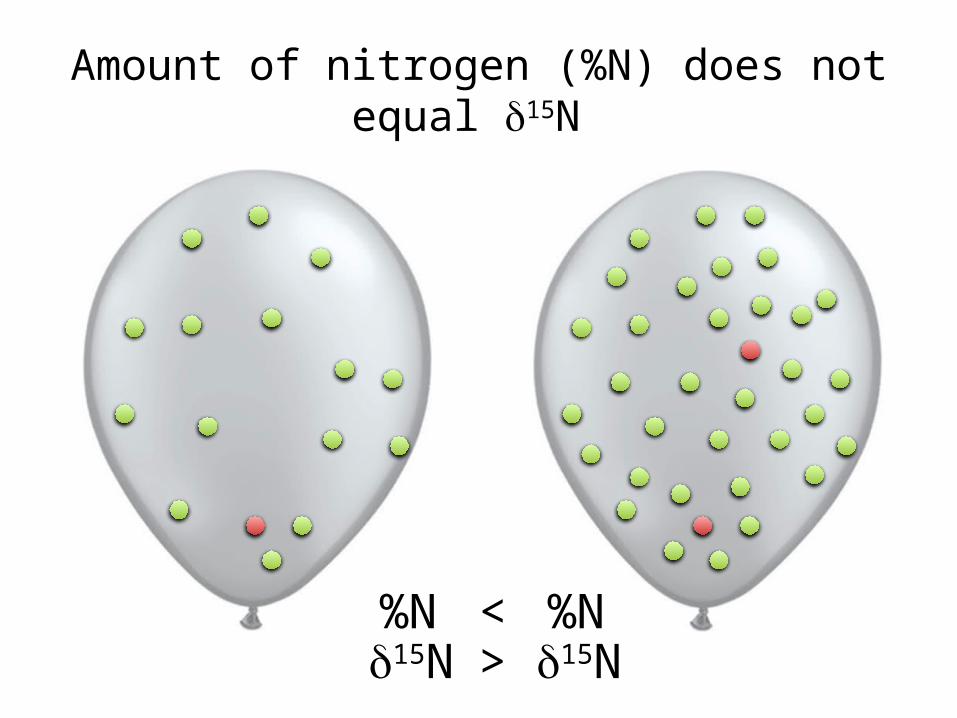
Amount of nitrogen (%N) does not equal d15N
%Nd15N
%Nd15N
<>
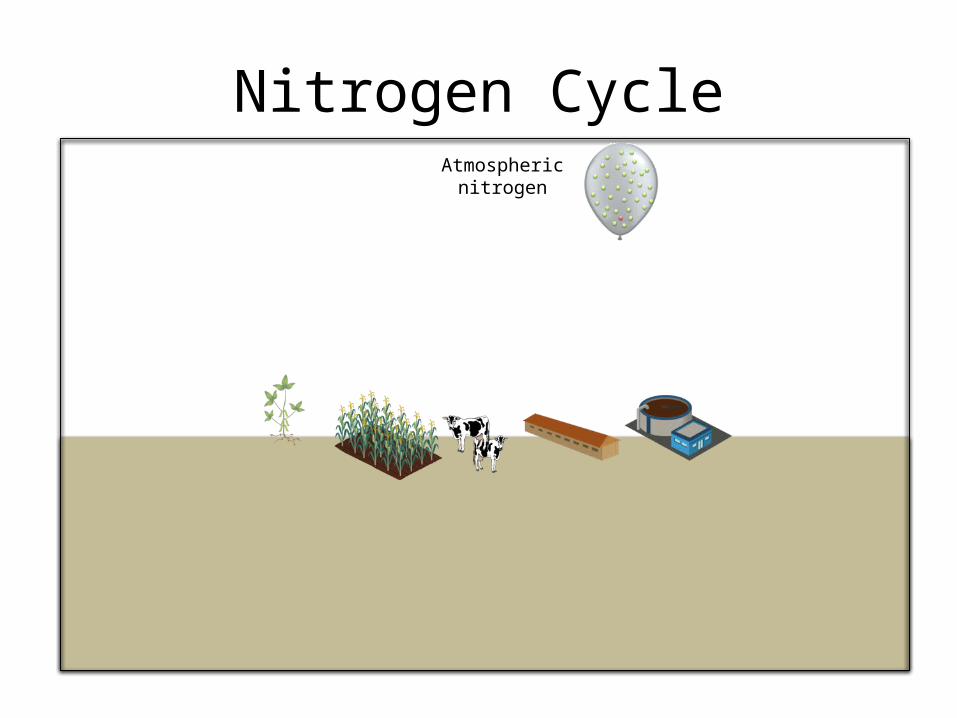
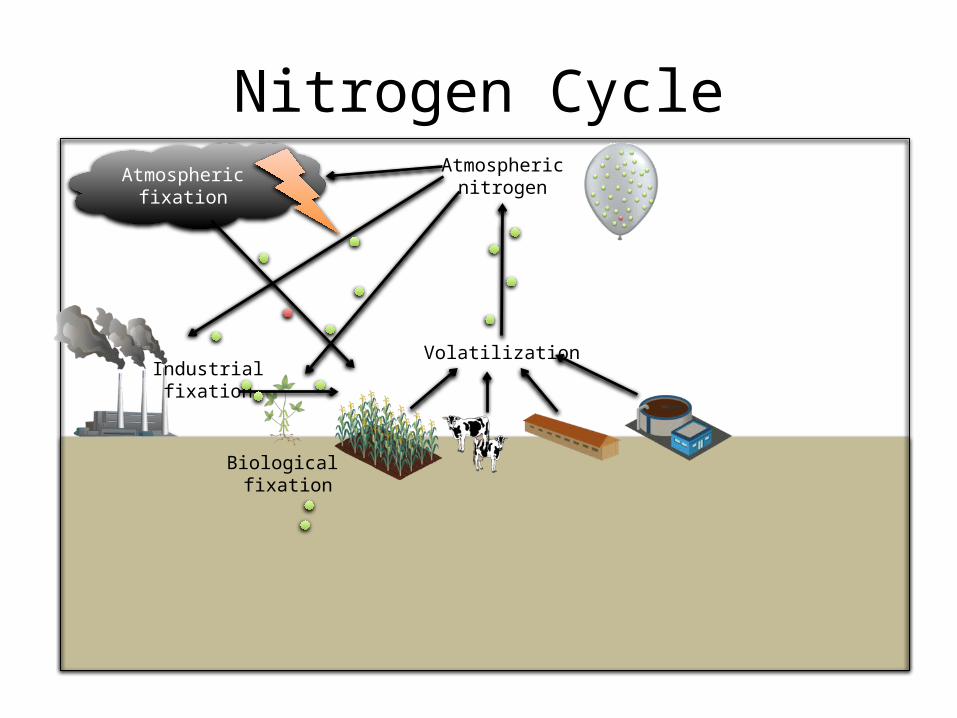
Nitrogen CycleAtmospheric
nitrogenAtmospheric
fixation
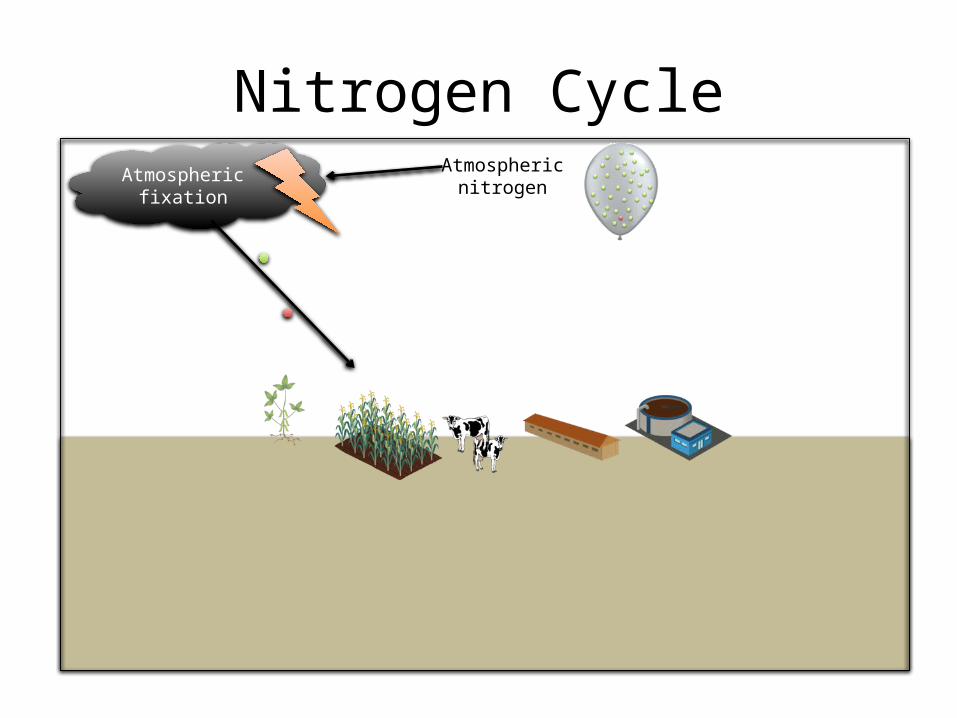
Nitrogen CycleAtmospheric
nitrogenAtmospheric
fixation
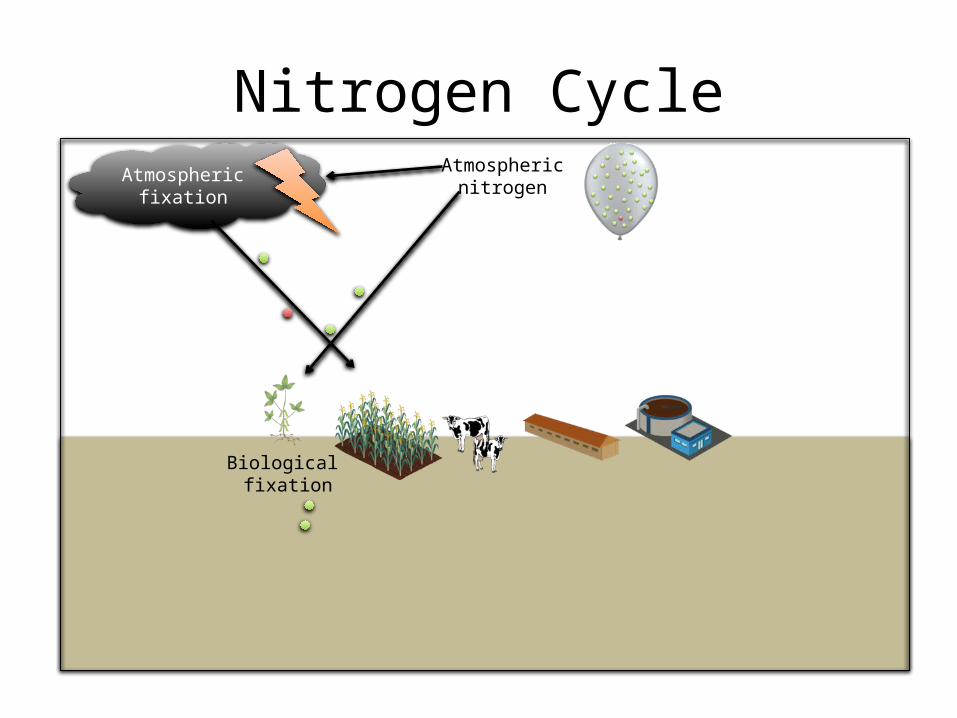
Nitrogen CycleAtmospheric
nitrogenAtmospheric
fixation
Biological fixation
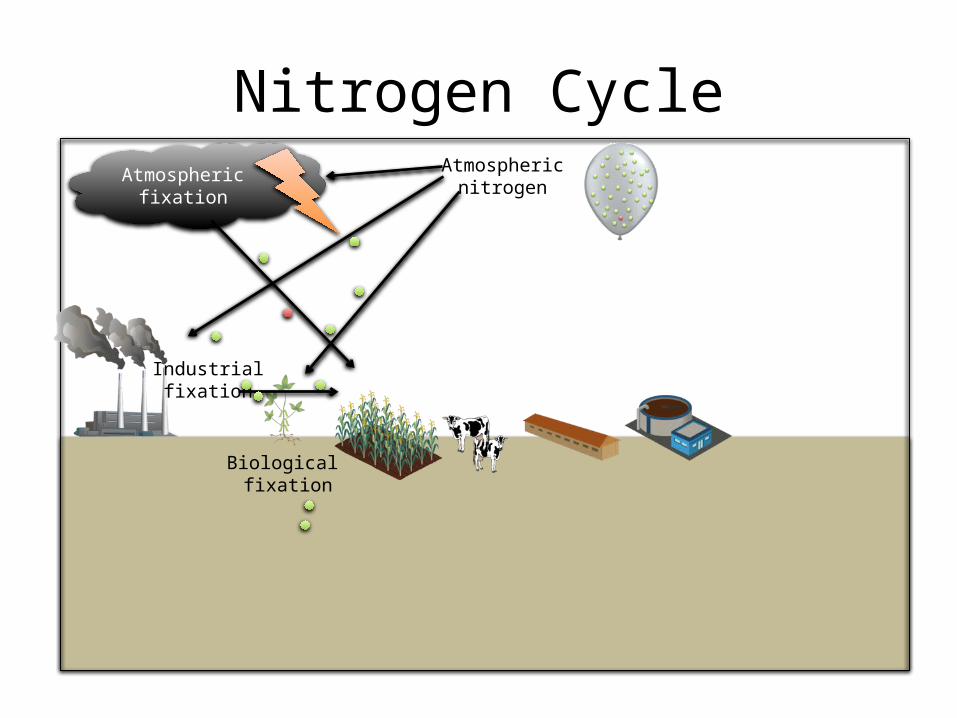
Nitrogen CycleAtmospheric
nitrogenAtmospheric
fixation
Industrialfixation
Biological fixation
Nitrogen CycleAtmospheric
nitrogenAtmospheric
fixation
VolatilizationIndustrialfixation
Biological fixation
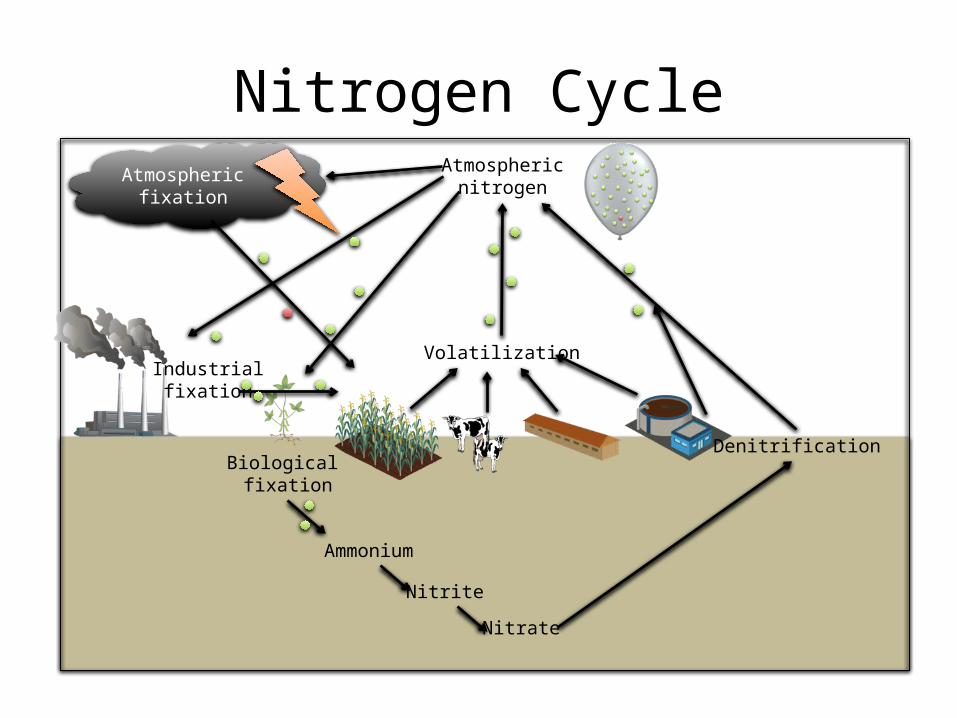
Nitrogen CycleAtmospheric
nitrogenAtmospheric
fixation
Denitrification
Ammonium
Nitrite
Nitrate
VolatilizationIndustrialfixation
Biological fixation
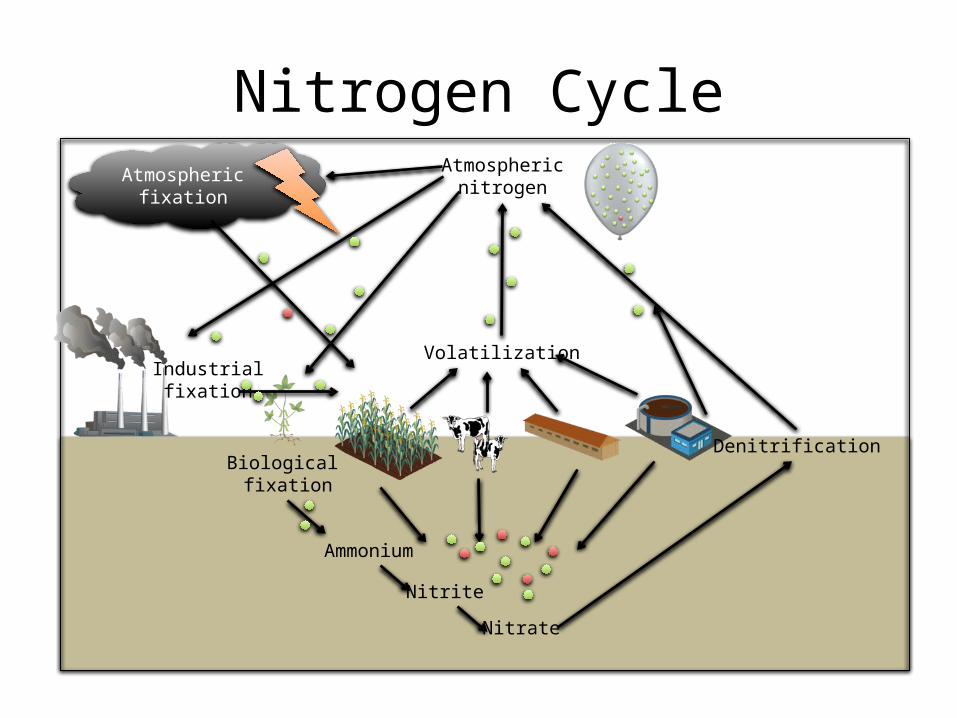
Nitrogen CycleAtmospheric
nitrogenAtmospheric
fixation
Denitrification
Ammonium
Nitrite
Nitrate
VolatilizationIndustrialfixation
Biological fixation

% Nitrogen
d15
N
0 5
0
30
-5
5
10
15
20
25
1 2 3 4
DenitrificationAnimal Waste
Volatilization enrichment
Fertilizer sourceLow nitrogen and activity
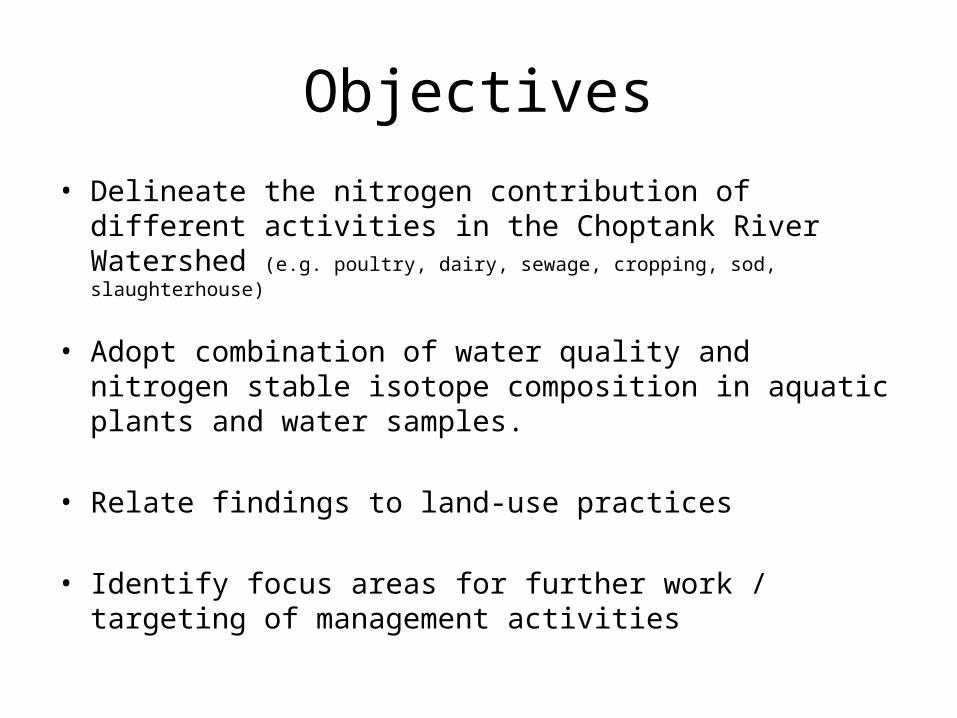
Objectives
• Delineate the nitrogen contribution of different activities in the Choptank River Watershed (e.g. poultry, dairy, sewage, cropping, sod, slaughterhouse)
• Adopt combination of water quality and nitrogen stable isotope composition in aquatic plants and water samples.
• Relate findings to land-use practices
• Identify focus areas for further work / targeting of management activities
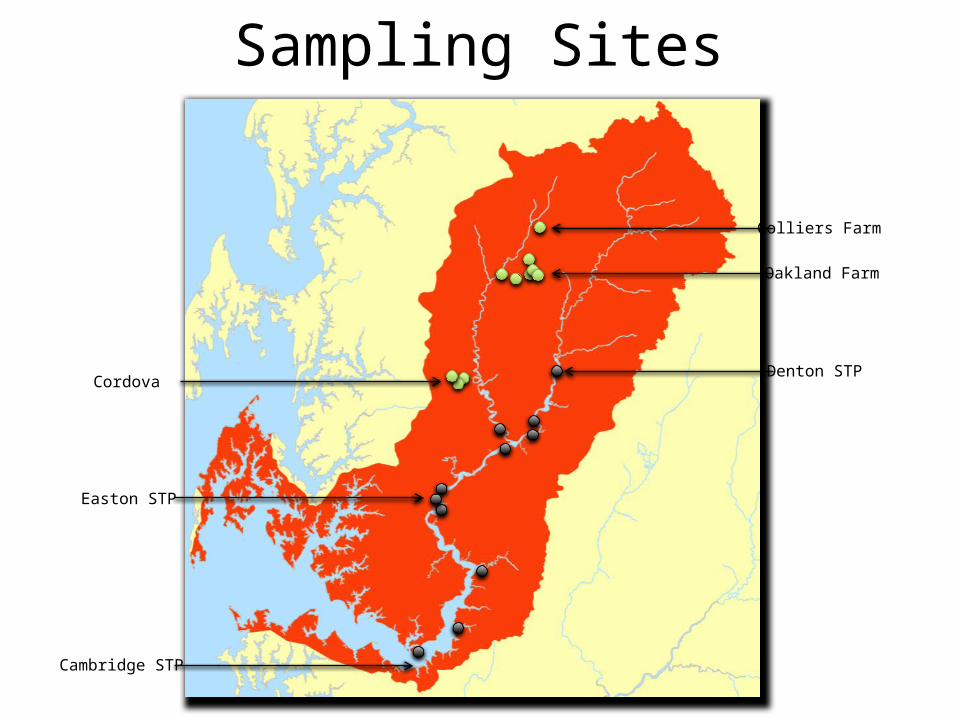
Sampling Sites
Easton STP
Cambridge STP
Denton STPCordova
Oakland Farm
Colliers Farm

What we collected• Phragmites along Choptank River – d15N– %N
• Grasses in Choptank watershed– d15N– %N
• Water quality– MRC– This project
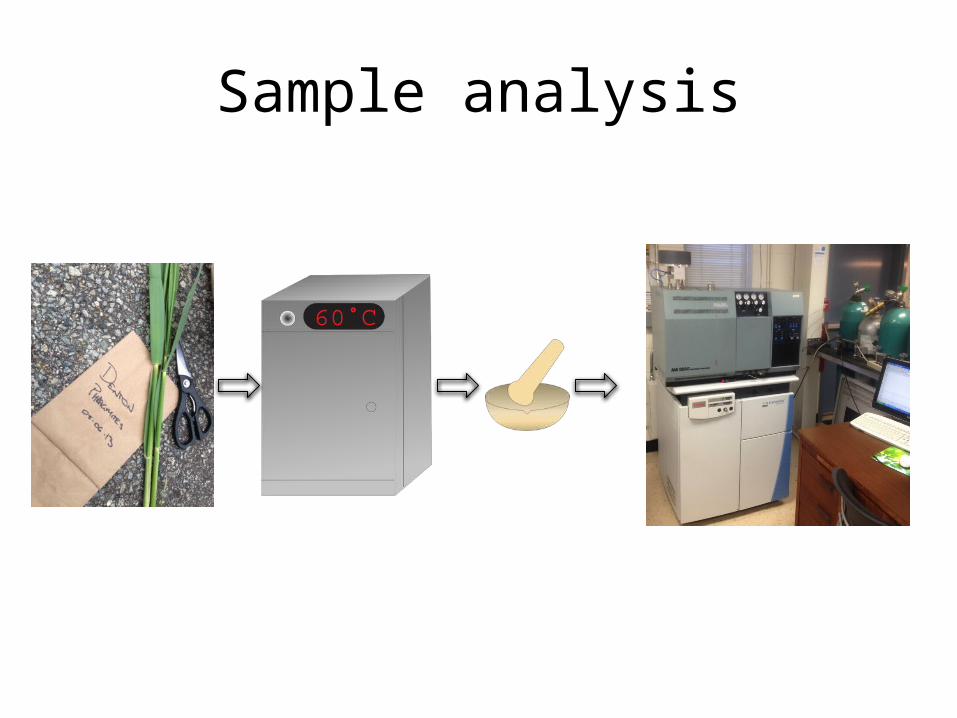
Sample analysis
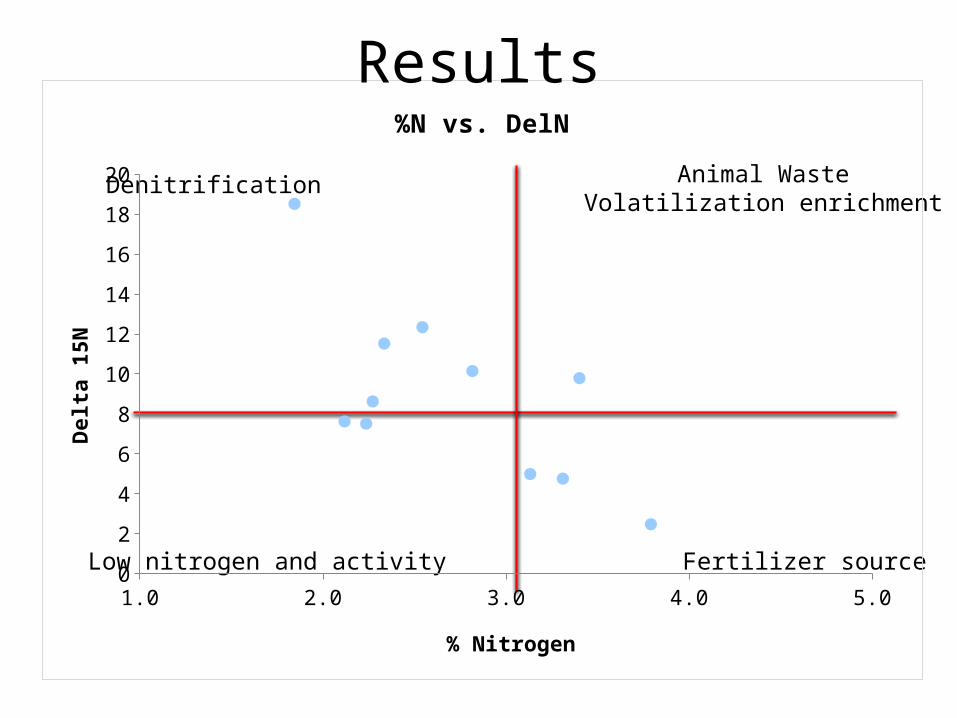
Denitrification Animal WasteVolatilization enrichment
Fertilizer sourceLow nitrogen and activity
1.0 2.0 3.0 4.0 5.00
2
4
6
8
10
12
14
16
18
20
%N vs. DelN
% Nitrogen
Delta
15N
Results
1.0 2.0 3.0 4.0 5.00
2
4
6
8
10
12
14
16
18
20
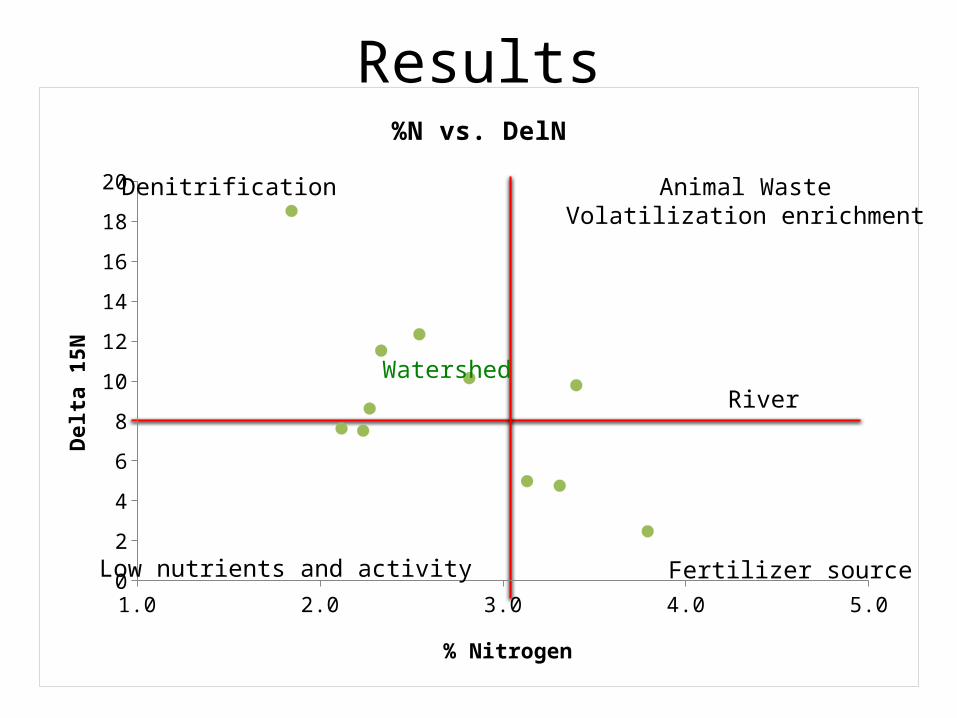
%N vs. DelN
% Nitrogen
Delta
15N
Denitrification Animal WasteVolatilization enrichment
Fertilizer sourceLow nutrients and activity
RiverWatershed
Results
2.8 3.0 3.2 3.4 3.6 3.8 4.0 4.2 4.40
2
4
6
8
10
12
14
16
18
20
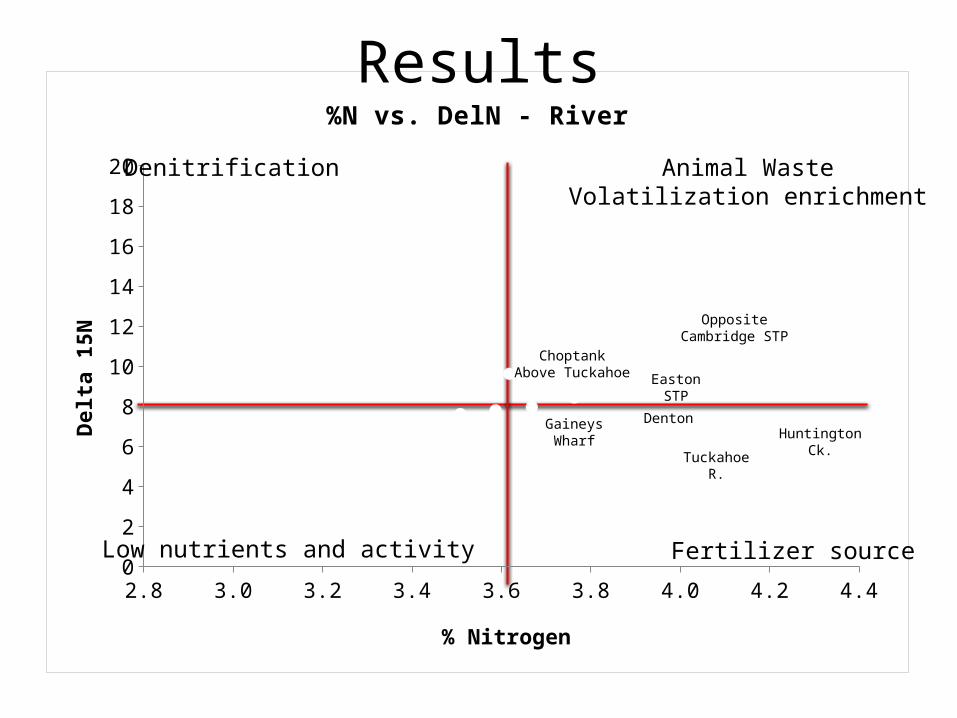
%N vs. DelN - River
% Nitrogen
Delta
15N
Denitrification Animal WasteVolatilization enrichment
Fertilizer sourceLow nutrients and activity
OppositeCambridge STP
Denton
TuckahoeR.
HuntingtonCk.
GaineysWharf
ChoptankAbove Tuckahoe Easton
STP
Results

2.8 3.0 3.2 3.4 3.6 3.8 4.0 4.2 4.40
2
4
6
8
10
12
14
16
18
20
%N vs. DelN - River
% Nitrogen
Delta
15N
Denitrification Animal WasteVolatilization enrichment
Fertilizer sourceLow nutrients and activity
OppositeCambridge STP
Denton
TuckahoeR.
HuntingtonCk.
GaineysWharf
ChoptankAbove Tuckahoe Easton
STP
Results

1.0 2.0 3.0 4.0 5.00
2
4
6
8
10
12
14
16
18
20
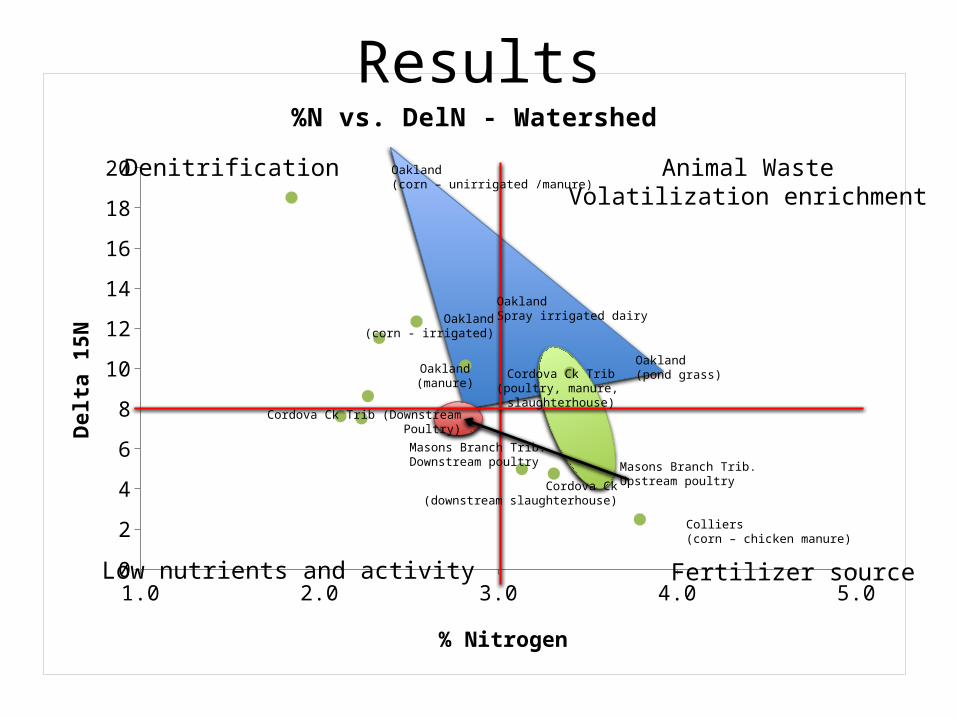
%N vs. DelN - Watershed
% Nitrogen
Delta
15N
Denitrification Animal WasteVolatilization enrichment
Fertilizer sourceLow nutrients and activity
Oakland(corn – unirrigated /manure)
Oakland(corn - irrigated)
OaklandSpray irrigated dairy
Cordova Ck Trib(poultry, manure, slaughterhouse)
Oakland(pond grass)Oakland
(manure)
Cordova Ck Trib (DownstreamPoultry)
Colliers(corn – chicken manure)
Cordova Ck(downstream slaughterhouse)
Masons Branch Trib.Upstream poultry
Masons Branch Trib.Downstream poultry
Results
1.0 2.0 3.0 4.0 5.00
2
4
6
8
10
12
14
16
18
20
%N vs. DelN - Watershed
% Nitrogen
Delta
15N
Denitrification Animal WasteVolatilization enrichment
Fertilizer sourceLow nutrients and activity
Oakland(corn – unirrigated /manure)
Oakland(corn - irrigated)
OaklandSpray irrigated dairy
Cordova Ck Trib(poultry, manure, slaughterhouse)
Oakland(pond grass)Oakland
(manure)
Cordova Ck Trib (DownstreamPoultry)
Colliers(corn – chicken manure)
Cordova Ck(downstream slaughterhouse)
Masons Branch Trib.Upstream poultry
Masons Branch Trib.Downstream poultry
Results
10 15 20 25 30 35 40 45 50 555
6
7
8
9
10
11
2
3
4
5
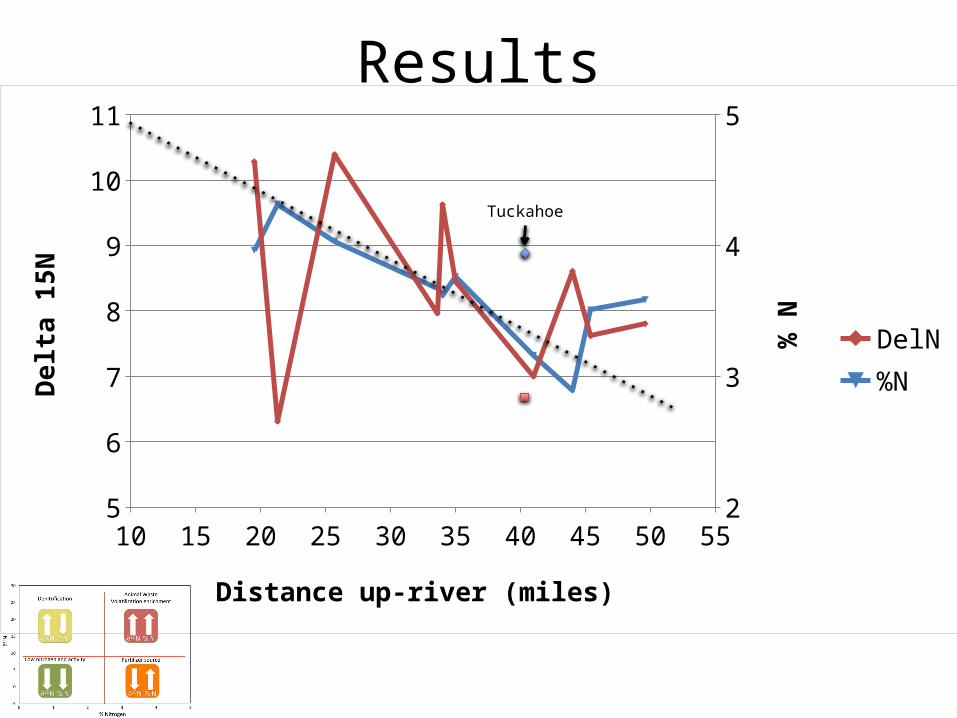
DelN%N
Distance up-river (miles)
Del
ta 1
5N
% N
Tuckahoe
Results
0 10 20 30 40 50 600.0
0.5
1.0
1.5
2.0
2.5
3.0
3.5
4.0
4.5
5.0
0.00
0.50
1.00
1.50
2.00
2.50
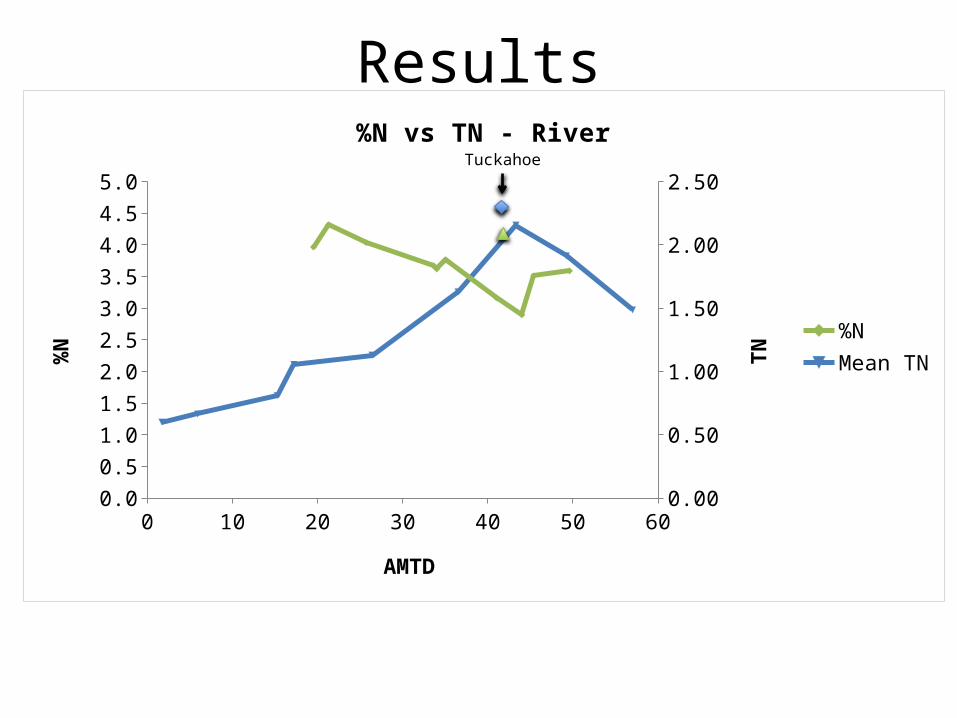
%N vs TN - River
%NMean TN
AMTD
%N TN
Tuckahoe
Results
Results
2 3 4 50
2
4
6
8
10
12
14
16
18
20
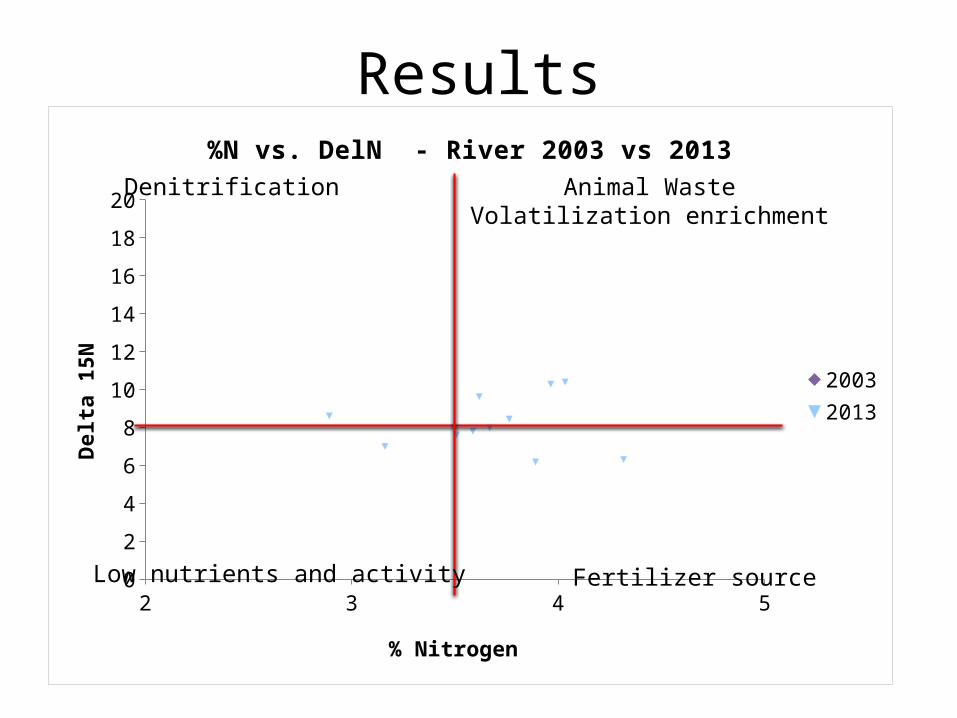
%N vs. DelN - River 2003 vs 2013
20032013
% Nitrogen
Delta
15N
Denitrification Animal WasteVolatilization enrichment
Fertilizer sourceLow nutrients and activity
Results
0.40 0.60 0.80 1.00 1.20 1.40 1.60 1.80 2.00 2.20 2.400.00
0.02
0.04
0.06
0.08
0.10
0.12
0.14
0.16
0.18
0.20
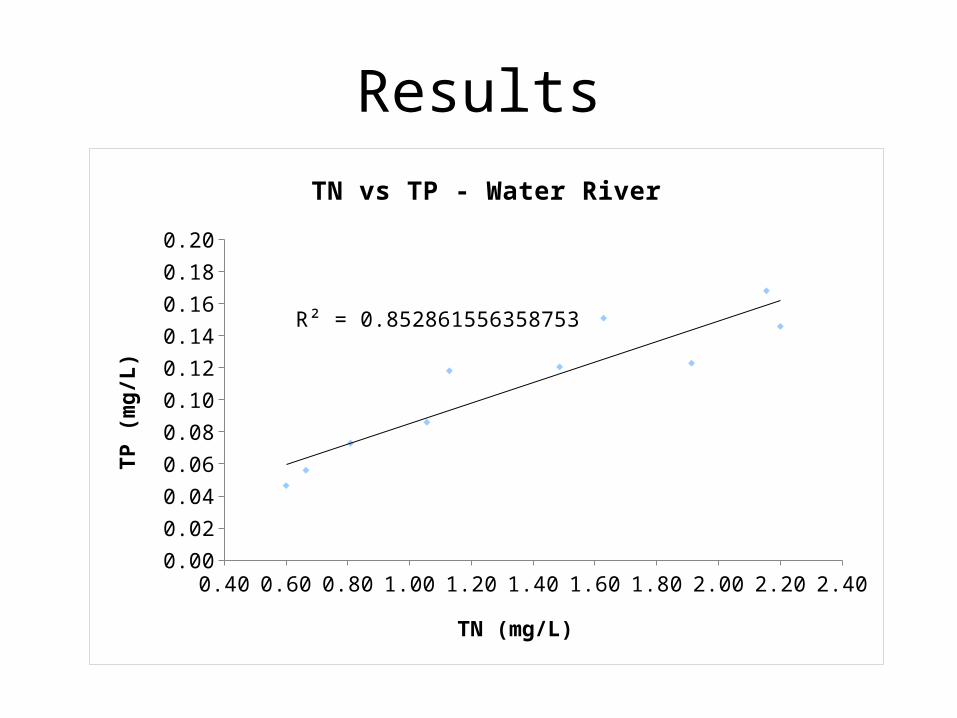
R² = 0.852861556358753
TN vs TP - Water River
TN (mg/L)
TP (m
g/L)

Oakland Pond Cordova CkDown. Slaughterhouse
Cordova CkDown. Poultry
Cordova Ck Trib(poultry, manure, slaughterhouse)
Masons Branch Trib.Upstream poultry
Masons Branch Trib.Downstream poultry
Results
5 6 7 8 9 10 11 120.00
0.02
0.04
0.06
0.08
0.10
0.12
0.14
0.16
0.18
0.20
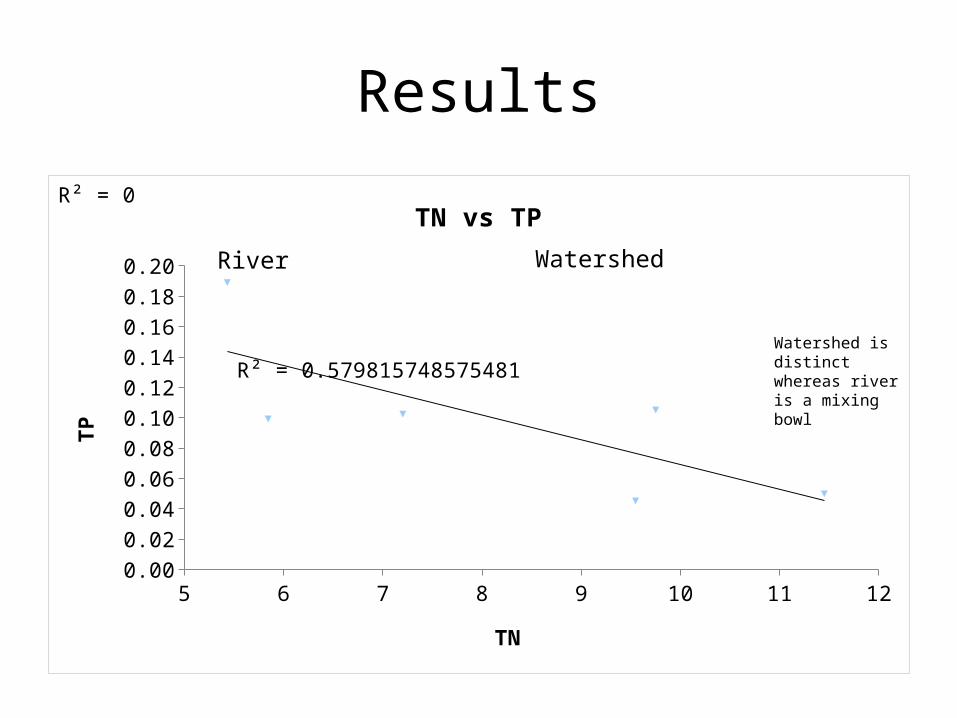
R² = 0.579815748575481
TN vs TP - Water Watershed
TN
TP
Results
5 6 7 8 9 10 11 120.00
0.02
0.04
0.06
0.08
0.10
0.12
0.14
0.16
0.18
0.20
R² = 0.579815748575481
R² = 0TN vs TP
TN
TP
River Watershed
Watershed is distinct whereas river is a mixing bowl
Summary
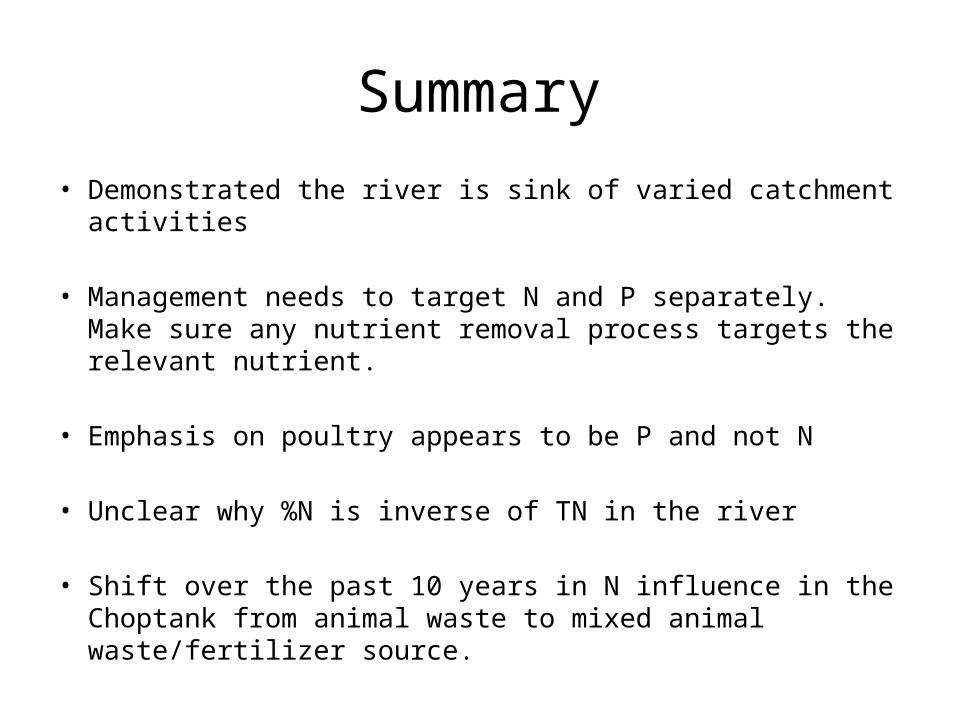
• Demonstrated the river is sink of varied catchment activities
• Management needs to target N and P separately. Make sure any nutrient removal process targets the relevant nutrient.
• Emphasis on poultry appears to be P and not N
• Unclear why %N is inverse of TN in the river
• Shift over the past 10 years in N influence in the Choptank from animal waste to mixed animal waste/fertilizer source.
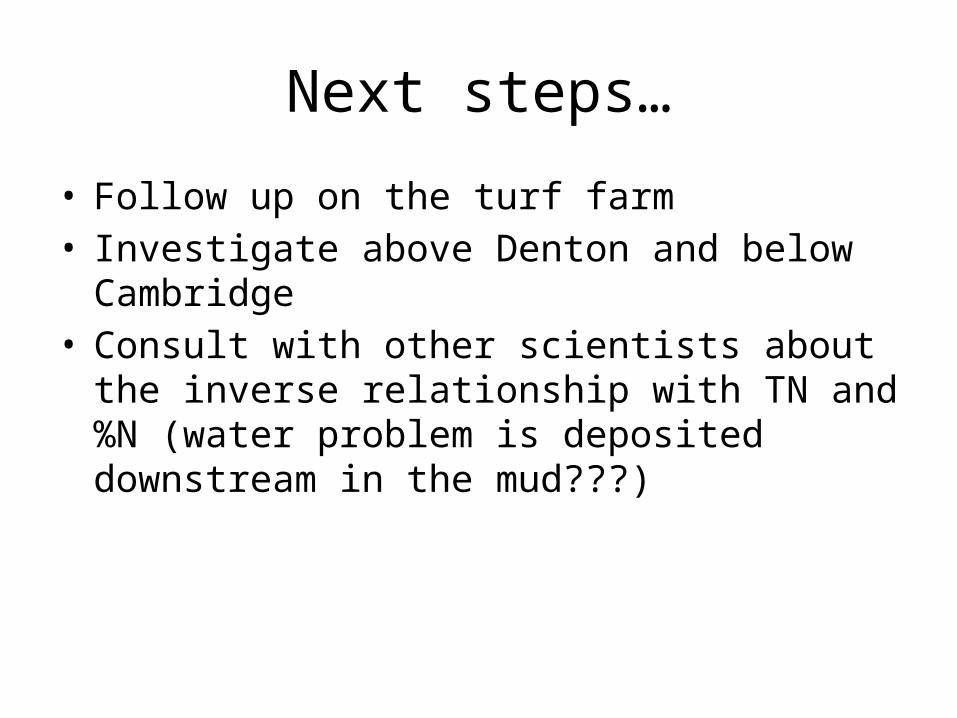
Next steps…
• Follow up on the turf farm• Investigate above Denton and below Cambridge• Consult with other scientists about the inverse
relationship with TN and %N (water problem is deposited downstream in the mud???)
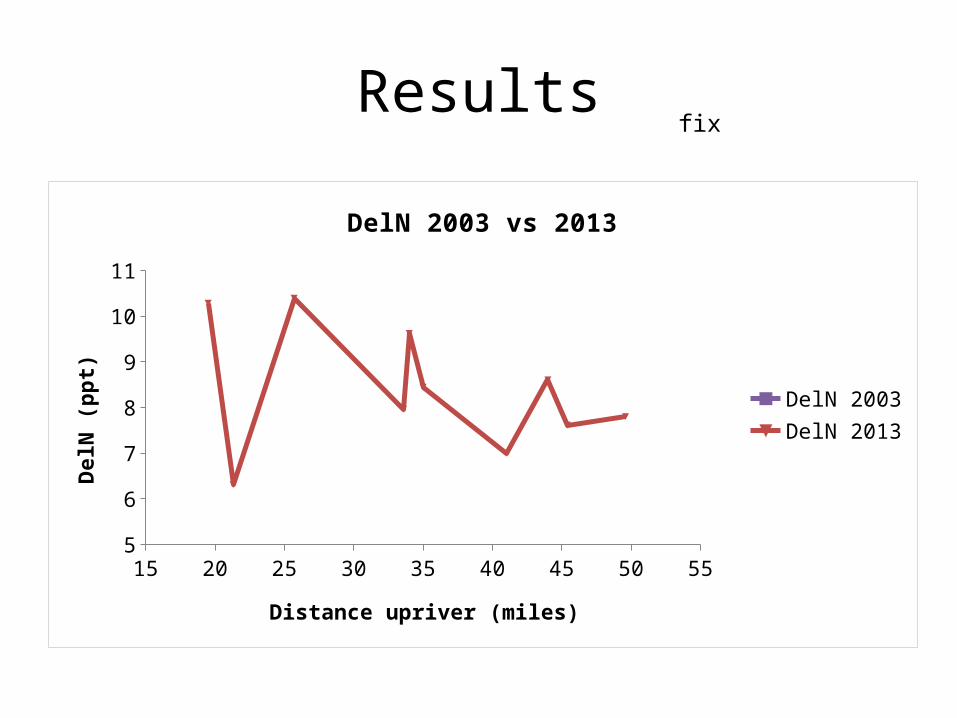
Results
15 20 25 30 35 40 45 50 555
6
7
8
9
10
11
DelN 2003 vs 2013
DelN 2003DelN 2013
Distance upriver (miles)
DelN
(ppt
)
fix
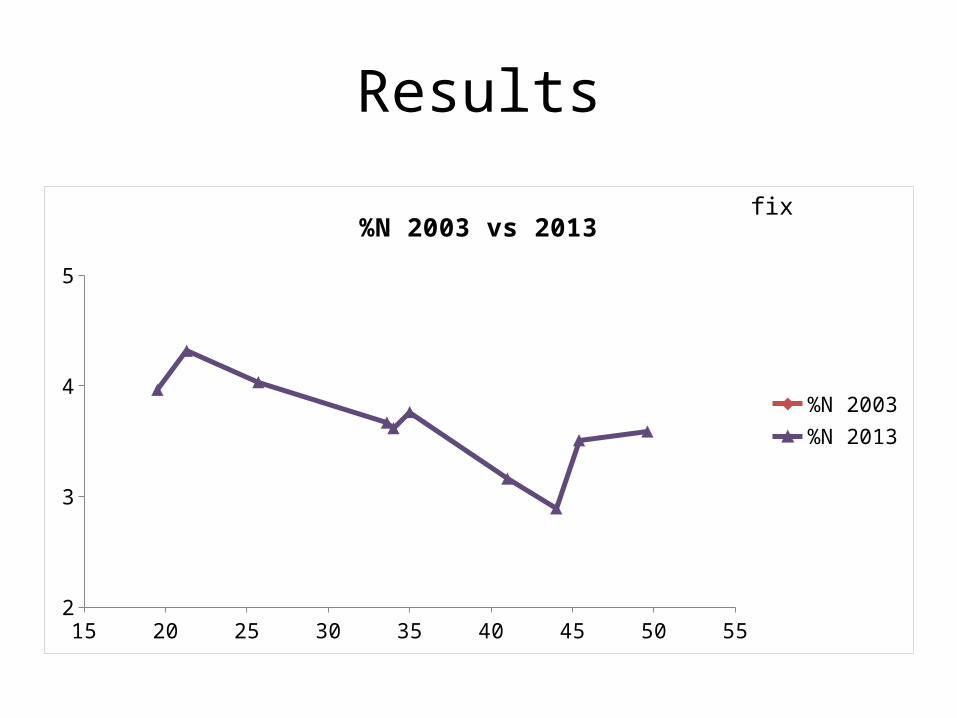
Results
15 20 25 30 35 40 45 50 552
3
4
5
%N 2003 vs 2013
%N 2003%N 2013
fix