WEB OF SCIENCE™ CORE COLLECTION NOAA-NIST-NTIA Kristen Faeth Customer Education [email protected].
NIST Data Collection Instruments 004
NIST-NOAA Survey Tool for Business Disruption and Recovery Associated With Extreme Events:
General Instrument Applied to the Beaumont and
Port Arthur, Texas Small- and Medium-Sized Business and Nonprofit Organizations
Community Post-Hurricane Harvey
Michelle Meyer Joy Semien
Jennifer Helgeson
This publication is available free of charge from:
https://doi.org/10.6028/NIST.DCI.004
NIST Data Collection Instruments 004
NIST-NOAA Survey Tool for Business Disruption and Recovery Associated With Extreme Events:
General Instrument Applied to the Beaumont and
Port Arthur, Texas Small- and Medium-Sized Business and Nonprofit Organizations
Community Post-Hurricane Harvey
Michelle Meyer Joy Semien
Hazard Reduction and Recovery Center Texas A&M University
Jennifer Helgeson
Applied Economics Office
This publication is available free of charge from: https://doi.org/10.6028/NIST.DCI.004
August 2021
U.S. Department of Commerce Gina M. Raimondo, Secretary
National Institute of Standards and Technology
James K. Olthoff, Performing the Non-Exclusive Functions and Duties of the Under Secretary of Commerce for Standards and Technology & Director, National Institute of Standards and Technology
Certain commercial entities, equipment, or materials may be identified in this
document in order to describe an experimental procedure or concept adequately. Such identification is not intended to imply recommendation or endorsement by the National Institute of Standards and Technology, nor is it intended to imply that the entities, materials, or equipment are necessarily the best available for the purpose.
The NIST Data Collection Instruments series include questionnaires or survey instruments, interview guides, and other structured means of collecting data. Some of these instruments are designed for human
subjects research focused on households, social institutions, and businesses. The instruments are approved by both NIST Institutional Review Board (IRB) and OMB/Paperwork Reduction Act.
National Institute of Standards and Technology Data Collection Instruments 004 Natl. Inst. Stand. Technol. Data Collect. Instr. 004, 90 pages (August 2021)
This publication is available free of charge from: https://doi.org/10.6028/NIST.DCI.004
i
This publication is available free of charge from: https://doi.org/10.6028/N
IST.DC
I.004
Abstract
To gather more in-depth information about how disasters affect businesses and nonprofits, the
National Institute of Standards and Technology (NIST) and the National Oceanic and
Atmospheric Administration (NOAA) launched a study of business disruption and recovery
related to several recent disasters.
This report outlines the survey instrument used as the basis for the research designed and
conducted in partnership between Texas Sea Grant and the Texas A&M University Hazard
Reduction and Recovery Center (HRRC), The Southern Climate Impacts Planning Program
(SCIPP), NIST Applied Economics Office (AEO), and the NOAA Regional Integrated
Sciences and Assessment (RISA) Program.
This research protocol uses a mixed-method research approach to study businesses and
nonprofit organizations that were impacted by Hurricane Harvey in 2017 and their long-term
recovery process. The approach combines both quantitative and qualitative data collection
methods of in-person and telephone surveys to obtain organizational disruption and recovery
information from organizational owners and managers.
Keywords
Adaptive capacity; Built infrastructure; Business recovery; Extreme weather events; Nonprofit
recovery; Resilience planning; Recovery; Small businesses; Small- and Medium-sized
Enterprises
ii
This publication is available free of charge from: https://doi.org/10.6028/N
IST.DC
I.004
Acknowledgements
The authors wish to thank all those who contributed ideas and suggestions to the development of this report and the survey instrument. We would like to acknowledge the collaboration set forth between the NOAA RISA, Southern Climate Impacts Program (SCIPP), Texas Sea Grant, and the Hazard Reduction and Recovery Center. We would like to acknowledge investigators of this research project: Pamela Plotkin, Ph.D., Cynthia Lyle M.S., and Walter M. Peacock, M.S. with Texas Sea Grant; Michelle Meyer, Ph.D., and Walter Gillis Peacock, Ph.D., with the Hazard Reduction and Recovery Center at Texas A&M University. Sincere appreciation to the entire research team at Texas A&M University: Joy Semien, Alexander Abuabara, Ryke Moore, Carlo Chunga Pizarro, Melina Matos, and Chandler Wilkins as well as undergraduate students Ricardo Fernandez, Romel Fernandez, Enrique Perez, Yujie Wang, Monicky Saucedo, and Alondra Rosas. Thanks to Claudia Nierenberg and Ariela Zycherman of the NOAA Climate Program Office for their review, feedback, and guidance throughout the research process. Appreciation extended to Donghwan Gu, Ph.D., Alfredo Roa Henriquez, Ph.D., and David Butry, Ph.D. at the National Institute of Standards and Technology (NIST). Author Information
Michelle A. Meyer, Ph.D. Director and Associate Professor Hazard Reduction & Recovery Center Department of Landscape Architecture and Urban Planning Texas A&M University, 3137 TAMU College Station, TX, USA 77843-3137 E-mail: [email protected] Joy Semien, M.A. Ph.D. Candidate and Research Assistant Hazard Reduction & Recovery Center Department of Landscape Architecture and Urban Planning Texas A&M University, 3137 TAMU College Station, TX, USA 77843-3137 E-mail: [email protected] Jennifer F. Helgeson, Ph.D. Research Economist Applied Economics Office Engineering Laboratory, National Institute of Standards and Technology 100 Bureau Drive, Mailstop 8603 Gaithersburg, MD, USA 20899-8603 Email: [email protected] Table of Contents
iii
This publication is available free of charge from: https://doi.org/10.6028/N
IST.DC
I.004
Abstract ..................................................................................................................................... i Keywords .................................................................................................................................. i Acknowledgements ................................................................................................................. ii Author Information ................................................................................................................ ii Glossary ................................................................................................................................... v 1. Executive Summary ......................................................................................................... 1 2. A Note ............................................................................................................................... 2 3. Background and Motivation ........................................................................................... 4 4. Relevance and Objectives ............................................................................................... 6
4.1. Hurricane Harvey ........................................................................................................... 6 4.2. Importance of Considering Business and Nonprofit Recovery ...................................... 6 4.3. Objectives .................................................................................................................... 7
5. Scope and Framing .......................................................................................................... 8 5.1. Organizational Size and Leadership Structure ............................................................... 8 5.2. Business Age ............................................................................................................... 9 5.3. Industry Type .............................................................................................................. 9 5.4. Facility Ownership .................................................................................................... 10 5.5. Owner Characteristics ............................................................................................... 11 5.6. Prior Financial Conditions ......................................................................................... 11 5.7. Physical Establishment Damage ............................................................................... 11 5.8. Infrastructure Disruption ........................................................................................... 12 5.9. Risk Perception .......................................................................................................... 12
6. Sampling Procedures ..................................................................................................... 12 6.1. Respondents ............................................................................................................... 12 6.2. Small Businesses and Nonprofits Sampled ............................................................... 13
6.2.1. Industries ............................................................................................................. 15 6.2.2. Locations ............................................................................................................. 16
7. Survey Instrument ......................................................................................................... 18 7.1. Survey Consent .......................................................................................................... 18 7.2. Survey Sections ......................................................................................................... 18
7.2.1. Organizational Background ................................................................................... 18 7.2.2. Risk Perception ...................................................................................................... 20 7.2.3. Damage and Business Interruption ........................................................................ 22 7.2.4. Employee related information ............................................................................... 29
iv
This publication is available free of charge from: https://doi.org/10.6028/N
IST.DC
I.004
7.2.5. Organizational Recovery ....................................................................................... 31 7.2.6. Recovery Finance and Mitigation .......................................................................... 33 7.2.8. Business Information ............................................................................................. 35 7.2.8. Nonprofit Information ........................................................................................... 36 7.2.9. Organizational Social Networks ............................................................................ 37 7.2.9. Participant Demographics...................................................................................... 38 7.9.10. Thank You ........................................................................................................... 39
8. Data Collection Methodology ....................................................................................... 40 8.1. Training ........................................................................................................................ 40
8.2. Daily Data Collection .............................................................................................. 40 8.3 Data Entry .................................................................................................................. 41
9. Conclusions and Lessons Learned ............................................................................... 42 References .............................................................................................................................. 46 Appendix A – Complete Survey........................................................................................... 55 Appendix B – Consent Script ............................................................................................... 79 Appendix C – Descriptions of Business Damage States .................................................... 80 Appendix D – Field Guide, Table of Contents ................................................................... 81 Appendix E – Business Communication Tracking ............................................................ 82
List of Tables
Table 1. Sampling Frame for Businesses in Beaumont and Port Arthur, Texas .................... 15 Table 2. Sampling Frame for Nonprofits in Beaumont and Port Arthur, Texas ..................... 16
List of Figures
Figure 1. Hurricane Harvey Flood Inundation in Beaumont and Port Arthur, Texas ............ 17
v
This publication is available free of charge from: https://doi.org/10.6028/N
IST.DC
I.004
Glossary
AEO Applied Economics Office
ATM Automated Teller Machine
CISA Carolinas Integrated Sciences and Assessments
COVID-19 Coronavirus Disease 2019
CPO Climate Program Office
HRRC Hazard Reduction and Recovery Center
NAICS North American Industry Classification System
NIST National Institute of Standards and Technology
NOAA National Oceanic and Atmospheric Administration
NPO Not-for-profit organization
RISA Regional Integrated Sciences and Assessments
SCIPP Southern Climate Impacts Planning Program
SME Small- and Medium-sized Enterprise
SETX Southeast Texas
TAMU Texas A&M University
1
This publication is available free of charge from: https://doi.org/10.6028/N
IST.DC
I.004
1. Executive Summary
To gather in-depth information about how disasters affect small- and medium-sized enterprises
(SMEs), the National Institute of Standards and Technology (NIST) launched a study of business
disruption following several disasters. This study aimed to allow for the development of policies
and programs that would improve the overall recovery process for businesses and nonprofits.
Coordination of these efforts took place in cooperation with the Climate Program Office (CPO) of
the National Oceanic and Atmospheric Association (NOAA). NIST’s coastal resilience initiative
focused on study sites in the Carolinas (associated with the NOAA Regional Integrated Sciences
and Assessments [RISA] team Carolina Integrated Sciences and Assessments [CISA]) and the
western Gulf Coast (associated with the NOAA RISA team Southern Climate Impacts Planning
Program [SCIPP]).
This report outlines the implementation of a business disruption survey used as the basis for the
research design conducted in partnership with NIST, SCIPP, Texas Sea Grant, and the Texas A&M
University’s Hazard Reduction and Recovery Center (HRRC). The location that this research
focuses on was the combined study area of Port Arthur and Beaumont, Texas. The research
protocol used a mixed-method research approach to study businesses and nonprofits that were
impacted by Hurricane Harvey in 2017. The methodological information for the application of the
survey protocol applied in the Carolinas study can be found in Helgeson et al. (2020a).
The research protocol employed both qualitative and quantitative data collection methods to obtain
business disruption and recovery information from business owners/managers (referred to
“operators”) and nonprofit leaders. Inclusion of nonprofit leaders was unique to the Texas
application of the study protocol. The information was collected via face-to-face and telephone
surveys as well as interviews. The data collection instruments assessed the perceptions and
behavior of the operators related to (1) mitigation and preparedness behaviors, (2) operational
interruptions, (3) financial stability, (4) short-term disaster recovery, and (5) recovery processes.
Risk perceptions toward hazards, past and future, were also assessed.
2
This publication is available free of charge from: https://doi.org/10.6028/N
IST.DC
I.004
2. A Note
The objective of this collaborative project across agencies and academic research institutions was
to provide cross-sectional data through place-based research that could have some aspects of
comparability between the Carolinas and Texas study areas. However, throughout the time of the
data collection the Texas study site was impacted by a number of additional acute and prolonged
disaster events, which made disentangling impacts from and a clear recovery trajectory associated
with Hurricane Harvey challenging. These included (1) an industrial spill (2019), (2) Tropical
Storm Imelda (2019), (3) COVID-19 (2020-2021), and (4) Hurricane Laura (2020).
Tropical Storm Imelda impacted the Southeast Texas Gulf Coast two months after implementing
data collection in September 2019. According to the National Hurricane Center, the storm dropped
30 inches (76.2 cm) of rain across multiple counties in the region (Latto and Berg, 2019). Flood
water in Jefferson County damaged over five thousand homes and businesses. In addition, the
storm caused flooding to the two major roadways (I-10 east and HWY 90) in the area preventing
the immediate ability to perform high-water rescues (Latto and Berg, 2019). The flooding severely
limited the transportation of goods and services throughout the region as floodwaters continued to
rise.
Shortly after adapting the research protocol to incorporate and control for Tropical Storm Imelda’s
immediate impacts and recovery efforts, the county experienced an industrial explosion (Dwyer,
2019). The industrial explosion released 1,3-Butadiene and led to the evacuation of those living
and working within a 4-mile (6.4 km) radius, directly impacting our study area (Dwyer, 2019).
Finally, after adapting the research protocol again to address industrial impacts, the United States
released a National Emergency Declaration for the COVID-19 pandemic (CDC, 2021). The
pandemic has severely limited the ability to collect data in-person, due to the CDC’s social
distancing guidelines (CDC, 2021) and TAMU research guidelines. In addition, data collection
over the telephone has not been possible due to ongoing quarantine measures and closures as
required by local ordinances and managed through individual organizational planning. Thus, data
collection was stalled from March 2020 through September 2020, at which time it was decided to
close data collection and provide the results from the data that had been collected pre-pandemic.
3
This publication is available free of charge from: https://doi.org/10.6028/N
IST.DC
I.004
However, lessons learned outlined within this report provide guidance on compound risk and
complex events – both for the objects of the study and for research processes themselves. A Ph.D.
Dissertation study entitled “Organizational Disruption and Recovery Post Hurricane Harvey in
Southeast Texas (SETX)” using the data collected through this protocol is currently underway by
Doctoral Candidate Joy Semien and is supported by Texas A&M University.
4
This publication is available free of charge from: https://doi.org/10.6028/N
IST.DC
I.004
3. Background and Motivation
According to NOAA, 2017 was the most damaging hurricane season in the Atlantic (NOAA,
2017). The storms with the greatest impact on the United States were Harvey, Irma, and Maria
having estimated damage of $300 billion (NOAA, 2018). In total the season produced 17 named
storms, 10 hurricanes, in which six were major hurricanes, ranking as Category 3, 4, or 5 on the
Saffir-Simpson scale (NHCCPHC, n.d.; NOAA, 2017). The damages occurring from these events
left entire communities without homes and businesses.
Businesses, especially those that are small- and medium-sized, are the economic engine of the
community – acting as a conduit for money to flow into and out of the communities (Schrank,
Marshall, Hall-Philips, Wiatt, and Jones, 2013). Businesses, directly and indirectly, support
community recovery by providing local goods, services, and employment opportunities. This local
investment in the community provides support for the local households through personal economic
growth and the community tax base (Tierney, 2007; Xiao et al., 2018; Zhang et al., 2009; Xiao
and Peacock, 2014; Xiao and Drucker, 2013; Watson et al., 2020). In addition, these organizations
can provide a space to increase cultural and social capital while also supporting local community-
focused political agendas (Chamlee-Wright and Storr, 2011).
Nonprofit organizations provide human, financial, as well as political resources and assistance at
the community level, making them important to community survival (Aeberhard, 2008; Chikoto-
Schultz et al., 2018). These institutions provide access to services like shelter, childcare, clothing,
and fresh food (Fowler, 2007; Gajewski et al., 2011). Nonprofit organizations often work to
increase the capacity of residents by hosting workshops and trainings (Chikoto-Schultz et al.,
2018). Like businesses, these organizations play a pivotal role in the disaster readiness and the
recovery process, as they are often the first responders in the hardest-hit areas and many serve as
“gatekeepers for larger humanitarian and governmental networks to gain access to community
members (Chikoto et al., 2013).
Both businesses and nonprofit organizations often experience post-disaster impacts and must
endure the recovery process in concurrence with community recovery (Marshall et al., 2015,
Watson et al., 2020; Kapucu et al., 2018). This process is challenging to say the least, and many
organizations lose their entire inventory, utility operations, supplies, services, and social networks
5
This publication is available free of charge from: https://doi.org/10.6028/N
IST.DC
I.004
(Dahlhamer and Tierney, 1996; Marshall et al., 2015). In addition, businesses may experience loss
of employment while nonprofit organizations may experience a loss of volunteers, increasing the
workload on the core individuals of the organization (Flatt and Stys, 2013; Kapucu et. al., 2011).
Understanding the impacts, risk, and recovery processes are pivotal to develop methods to better
support these organizations post-disaster. Yet, research on disaster recovery of both businesses,
especially small businesses, and nonprofits remains limited. This limitation of available research
is problematic as both businesses as well as non-profits are financial and social gatekeepers,
respectively, to the communities in which they occupy (Flora and Flora, 2008; Beaulieu, 2014).
Without these organizations communities would experience lack financial and social capital
inhibiting the overall long-term resilience of the community (Scandlyn et al., 2013; Brett and
Oviatt, 2013; Xiao and Van Zandt, 2012).
6
This publication is available free of charge from: https://doi.org/10.6028/N
IST.DC
I.004
4. Relevance and Objectives 4.1. Hurricane Harvey
Hurricane Harvey (2017) initially made landfall near Rockport, Texas. Over a six-day period the
Category 4 hurricane dropped 27 trillion gallons (102.2 liters) of rainwater (Blake and Zelinsky,
2018; FEMA, 2017). Recorded rainfall depth in some communities was between 65 inches and 70
inches (165.1 cm to 177.8 cm) of rain in a few days (Blake and Zelinsky, 2018). Harvey caused
only limited wind damage and most of the physical damage experienced was the result of
continuous onset of rainwater (Blake and Zelinsky, 2018). The floodwaters caused severe damage
to homes and businesses across Texas. According to the National Hurricane Center (NHC) the
impact of the storm produced approximately 68 direct deaths and 35 indirect deaths. Direct deaths
are “those occurring as a direct result of the forces of the tropical cyclone” and indirect deaths are
those occurring due to “factors [like] heart attacks, house fires, electrocutions from downed power
lines, vehicle accidents on wet roads” etc. (Blake and Zelinsky, 2018).
Hurricanes and tropical storms are not new phenomena for this region, as communities often
experience continuous and compounding impacts (Perry, 2007). This repeated experience provides
researchers with a unique opportunity to examine the recovery of businesses and nonprofits. This
study aimed to gather data and deeper understandings to in turn allow for the development of
policies and programs that would improve the overall recovery process for businesses and
nonprofits.
This study of Hurricane Harvey's organizational impacts coincides with a similar study in
Charleston, South Carolina (Helgeson et. al., 2020a). Research topics and case study locations
were aligned to support comparability across the studies. Together, the projects provide much more
information on ways to support businesses during disaster recovery and successes and challenges
to research in areas that are facing increasing frequency and intensity of disasters.
4.2. Importance of Considering Business and Nonprofit Recovery Small businesses and nonprofit organizations, especially those that are local, are both socially and
economically significant to the survival of communities. Businesses play a role in providing jobs
to residents and serving as an economic tax-base to support the community. While nonprofit
7
This publication is available free of charge from: https://doi.org/10.6028/N
IST.DC
I.004
organizations play a role in acting as a community advocate, liaison, as well as social services
provider (Fowler et al., 2007; Gajewski et al., 2011).
Small businesses and nonprofit organization operations are volatile post-disaster (Alesch et al.,
2001; Kapucu, 2001). Both types of organizations often face reduced funding streams and
workforce, which may limit recovery and operations (Kapucu, 2007). These organizations often
lack the preparedness resources, supplies, and human capital to support day-to-day operations
needed to bounce back from a disaster quickly (Highfield et al., 2014).
4.3. Objectives
The objectives of this project as reflected in the survey instrument are to:
1. Understand what factors impact an organization's ability to recover.
2. Understand how for-profit and nonprofit organizations compare.
3. Understand how socio-vulnerability factors of the organization and the neighborhoods affect
their recovery process.
8
This publication is available free of charge from: https://doi.org/10.6028/N
IST.DC
I.004
5. Scope and Framing
Previous disaster research has primarily focused on the impact of disasters on the household
(Tierney, 1997a). Recently studies of disasters have broadened to incorporate organizations like
businesses and nonprofits (e.g., Xiao and Van Zandt, 2012; Xiao et al., 2018). These organizations
are similar in their experiences before and after a disaster as they play a pivotal role in the entire
communities’ response and recovery to disastrous impacts (Watson et al., 2020).
Previous disaster organizational studies focus primarily on the individual impacts to organizations.
Rarely does the literature examine the comparative impacts that disasters may have on both
businesses and nonprofits within a community. It is proposed that doing so may enable the
development of key resources that can support both types of organizations. The literature also
focuses heavily on the long-term recovery as compared to the immediate impact, response, and
short-term recovery that organizations experience (Marshall et al., 2015, Dahlhamer and Tierney,
1996; Xiao and Van Zandt, 2012).
5.1. Organizational Size and Leadership Structure
Studies like Dahlhamer and Tierney (1998) have indicated that the size of the organization plays
a role in the survival of the organization post-disaster impact. Typically, smaller organizations lack
the fiscal resources to properly mitigate and prepare for the onset of a disaster (Kroll et. al., 1991).
They may also lack the social network that would encourage participation in collective hazard
mitigation programming (Clay et al., 2016). Without access to these resources (financial and
social), these organizations become susceptible to closure impact (Dahlhammer and D’Souza,
1997; Xiao 2011; Marshall et al., 2015). Larger organizations often have the financial reserves to
invest in mitigation practices, such as insurance or physical retrofitting that reduce the risk of
damages (Aldrich and Auster, 1986). These organizations are often well connected, with large
social networks that often share resources pre-post disaster impact.
Ownership structure has also been shown to indicate the survival of the organization's post-disaster
impact (Alesch et al., 2001).
9
This publication is available free of charge from: https://doi.org/10.6028/N
IST.DC
I.004
Businesses that are part of a corporation or a franchise typically have access to a broad range of
resources that reduces their risk of unintended closure (temporary or permanent) post-disaster
impact (Webb et al., 2002). Single location businesses typically are more susceptible to disaster
impacts, especially if the single location is inaccessible/or inoperable due to utility loss
(Dahlhamer and Tierney, 1998). Businesses that are owner-operated (i.e., having one single owner)
also experience difficulties post-disaster as compared to corporations and franchises as they are
often limited in resources as well as social networks (Aldrich and Auster, 1986). Owner-operated
businesses often experience dual responsibilities in managing damages of the business as well as
the needs of their home life (Winter et. al, 2004; Marshall et al., 2 015).
Nonprofit leaders have been shown to have similar experiences to that of business owners (Alesch
et al., 2001). Larger nonprofits connected at a regional or national level often have access to a wide
range of resources and information that can reduce their vulnerability to disaster impacts. This
access may be attributed to the nonprofit leaders’ political and social connections. Upon obtaining
this information it can then be distributed to their clientele to reduce susceptibility down the chain
of services provided by the nonprofit. Nonprofits are typically operated by a board of individuals,
the more socially connected these board members are increasing a nonprofit ability to recover post-
disaster impact (Rivera and Nickels, 2014).
5.2. Business Age
The length of time an organization has been in operation can indicate its ability to survive disaster
impacts. Stinchcombe (1965) indicates that this survival is linked to their tenure as social actors,
limited competition, and established clientele. Newer organizations often fall into “liability of
newness” as they may lack the fiscal and social resources needed to survive post-disaster impact
(Singh and Lumsden, 1990).
5.3. Industry Type
The industry type of organization can be an indicator of recovery post-disaster impact. Webb
(2002) showed that businesses that operate in the retail/trade sector are more vulnerable
immediately post-disaster. The manufacturing and construction sectors are often more resilient
10
This publication is available free of charge from: https://doi.org/10.6028/N
IST.DC
I.004
immediately post-disaster, as the materials sold in these organizations often needed those forced
to rebuild post-disaster impact. Service organizations are often able to maintain revenue by
retaining clientele through the use of remote services. The ability of a business to remain open
during a disaster is imperative to continue to build revenue through sales and services. Businesses
that close temporarily can be faced with decreased revenue and may lose clientele to competing
organizations.
Nonprofit organizations are often registered with a 501(c)3 designation; they provide services to
the public in the realms of religion, health, public societal benefits, environment and animals,
international foreign affairs, education, arts, and culture, human services, and food bank (Smith,
and Birkland, 2012; Jenkins et al., 2015; Kapucu, 2001). These organizations are necessary to
provide resources that support the immediate response and recovery (Joshi, 2010; Smith and
Birkland, 2012). Religious institutions often provide edification to spiritual and mental well beings
of parishioners, in many cases these organizations can offer disaster supplies and resources (Joshi,
2010). Health, human services, food banks, and other public social benefits often are the most
needed post-disaster as they are often tasked with reaching socially vulnerable groups (Kapucu,
2001; Jenkins et al., 2015). Organizations that focus on the environment and animals are also
pivotal in assessing environmental impacts as well as collecting stray animals.
5.4. Facility Ownership
The ownership of the physical structure in which the organization operates may play a role in the
ability to continue operations post-disaster impact (Webb et al., 2002). Organizations that own the
building in which they operate may possess more agency than renters in taking mitigation and
preparedness measures pre-disaster (Tierney and Dahlhamer, 1997). Post-disaster these
organizations can directly work to make the premises ready to reopen compared to renters who
may have to wait on the building owner to approve or undertake steps to properly remodel after
receiving damages to the physical structure (ibid.).
11
This publication is available free of charge from: https://doi.org/10.6028/N
IST.DC
I.004
5.5. Owner Characteristics
Dahlhamer et al. (1999) indicated that the characteristics of the owner (i.e., race, gender, and
income) can influence the level of damage received on the physical structure of the business, as
well as the time period required for the organization to recover. Organizations owned and operated
by a person of color can receive disproportionately less recovery funding and resources compared
to their white counterparts (Alesch et al., 2001; Bullard and Wright, 2009; Bolin and Bolton, 1986).
Similarly, female-led organizations often experience a disproportionate recovery process post-
disaster impact (Losccco and Robinson, 1991; Loscococo et al., 1991). The personal income of an
organizational owner may hinder the recovery process of a business if they lack the financial
reserves to invest back into their damaged business and support their own fiscal household needs
(Haynes et al., 2019; Marshall and Schrank, 2014).
5.6. Prior Financial Conditions
The number of financial reserves that an organization has before a disastrous impact can influence
how they mitigate, prepare, and respond (Dahlahmer and D' Souza, 1997; Dahlhamer, Tierney,
and Webb, 1999) Organizations that lack financial reserves before the disaster occurs will not have
the fiscal ability to purchase materials needed to mitigate nor prepare to increase their susceptibility
to disastrous impact (Haynes et al., 2019; Marshall and Schrank, 2014; Schran et al., 2013). Failure
to properly mitigate and prepare can lead to increased damages post-disaster impact and without
sufficient liquidity the organization will have to rely heavily on possible insurance money, loans,
or other fiscal support (Haynes et al., 2019; Marshall et al., 2015; Tierney, 1997b). This reliance
is often problematic for owners of color and those who are low-income, as they may lack the social
and human capital to apply and meet the requirements associated with outside fiscal support
(Miller and Rivera, 2007; Xiao and Nilawar, 2013; Rufat et al., 2015).
5.7. Physical Establishment Damage
A study by Tierney (1997a) that examined business recovery after the 1993 Mid-West Floods
indicated that there is a direct correlation between business interruption and damages received.
These interruptions were the direct result of damages attained to the operational lifelines of the
12
This publication is available free of charge from: https://doi.org/10.6028/N
IST.DC
I.004
organization (Webb, Tierney, and Dahlhamer, 2002). Predictors of recovery can include physical
damage, damage to contents, machinery, and equipment (Webb et al., 2002). Organizational
operational disruptions increase as the extent of physical damage increases.
5.8. Infrastructure Disruption
Physical infrastructure damage that is common post-disaster (e.g., poor drainage, downed
powerlines, loss of access to other utilities, and downed trees), can hinder organizational
operations both directly and indirectly (Webb et al., 2002; Durkin, 1985). The inability of the
organizational owner, employees, and clients to reach the physical structure of the organization
can delay sales leading to revenue decreases. Organizations that only operate from one location
and fail to have a back-up operating location are more susceptible to closure as sales decrease
(Webb et al., 2002). While organizations that have multiple locations or can operate remotely are
less susceptible to experiencing a decrease in sales (ibid.). Infrastructure disruptions can also
hinder the import/export of shipments filled with supplies and product distribution.
5.9. Risk Perception
According to organizational disaster recovery studies, risk perception can influence the decision
of an organizational leader to prepare and mitigate against impacts before disasters occur (Bourque
et al., 2013; Dahlhamer and D'Souza, 1997; Xiao and Peacock, 2014). Misperceptions of risk can
increase an organization's susceptibility to disaster impact. Organizations that perceive their risk
of impact as minimal will be less likely to take steps to prepare and mitigate before disaster impact
regardless of the objective risk faced. This lack of preparedness and mitigation then affects
recovery trajectories, often slowing their recovery process.
6. Sampling Procedures 6.1. Respondents
The unit of analysis for this study is the individual organization and draws on a sample of small
businesses and nonprofits. To be considered for this study, an organization had to have been in
existence before Hurricane Harvey (i.e., August 25, 2017).
13
This publication is available free of charge from: https://doi.org/10.6028/N
IST.DC
I.004
This study assessed businesses from the following six economic sectors: wholesale/retail,
manufacturing/construction, services, finance/insurance/real estate, and others (agriculture,
forestry, fishing, mining, transportation, communications, and utilities). We collapsed the
population of businesses into six economic categories based on their North American Industry
Classification System (NAICS) code. These six categories are based on an adapted version of a
business study conducted by Webb et al. (2002). We omitted automated teller machines (ATM),
all schools, colleges and universities, tutoring agencies, health services, public administration,
justice, public order and safety, churches, water and sewer companies, as well as all libraries from
the studies sample. We also omitted all sole proprietors having less than two employees from the
sample. Otherwise we included businesses with up to 250 employees (Watson et al., 2020).
The original nonprofit population contained 16 types of non-profits listed by variant 501(c) codes
(Table 1). The study assessed nonprofits with the federal classification of a 501c(3): charitable,
religious, scientific, literary, and other organizations. We choose to only assess organizations with
a 501c(3) designation following the study of Chikoto-Schultz et al. (2018) definition for a
nonprofit: “A nonprofit organization as a “critical civil infrastructure” that provides social services
to the general public specifically those to the vulnerable populations.” We omitted all other 501(c)
categories that did not fall within critical civil infrastructure.
In distributing the survey, we asked a representative from the organization to respond to the survey.
In order to act as a representative of a business, an individual had to serve as an owner and/or
manager at the location surveyed. To act as a representatibe of a nonprofit, an individual should
have held one or more of the following positions: board president, board member, executive
director, operating officer, associate director, program coordinator/manager. We sought answers
from these respondents under the assumption that given their position in the organization they
would have necessary knowledge to respond to address questions.
6.2. Small Businesses and Nonprofits Sampled
This study used a three-stage proportionate stratified random sampling design to select businesses,
in which the size of each stratum is proportionate to the size of the population. The original
population size for businesses located in Beaumont were 4 286 and 952 for businesses located in
Port Arthur. Using this sampling design, we drew a sample size of 600 businesses with a target
14
This publication is available free of charge from: https://doi.org/10.6028/N
IST.DC
I.004
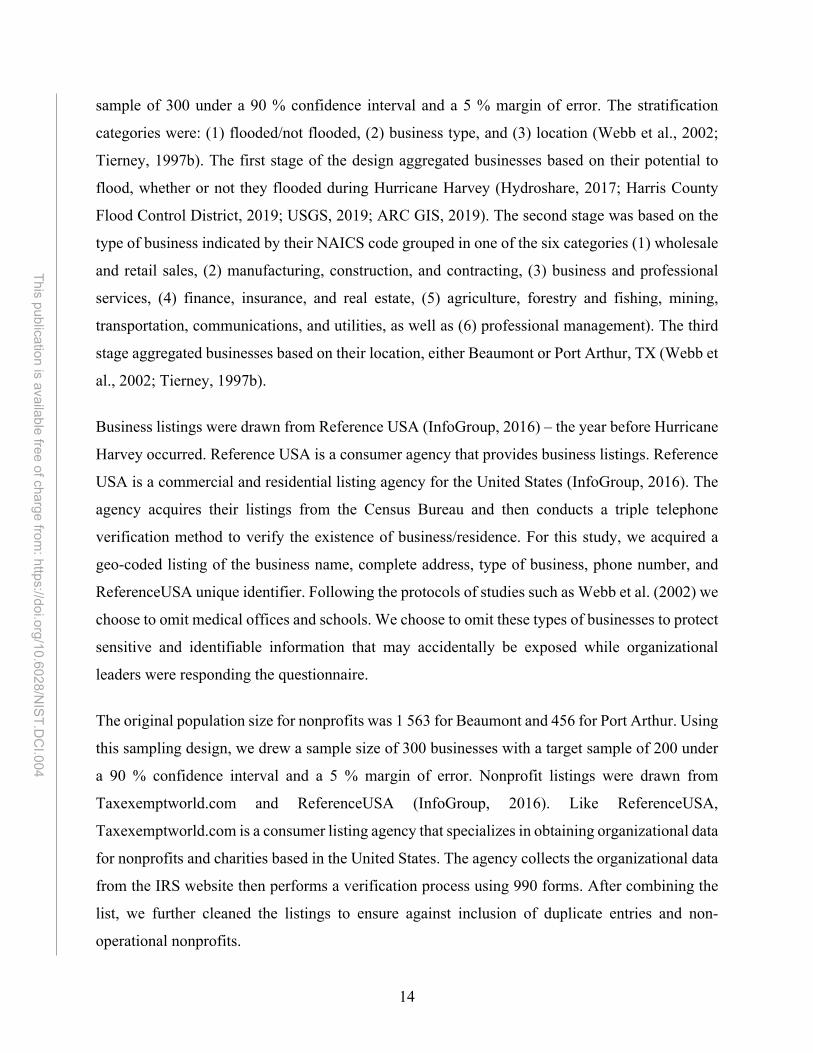
sample of 300 under a 90 % confidence interval and a 5 % margin of error. The stratification
categories were: (1) flooded/not flooded, (2) business type, and (3) location (Webb et al., 2002;
Tierney, 1997b). The first stage of the design aggregated businesses based on their potential to
flood, whether or not they flooded during Hurricane Harvey (Hydroshare, 2017; Harris County
Flood Control District, 2019; USGS, 2019; ARC GIS, 2019). The second stage was based on the
type of business indicated by their NAICS code grouped in one of the six categories (1) wholesale
and retail sales, (2) manufacturing, construction, and contracting, (3) business and professional
services, (4) finance, insurance, and real estate, (5) agriculture, forestry and fishing, mining,
transportation, communications, and utilities, as well as (6) professional management). The third
stage aggregated businesses based on their location, either Beaumont or Port Arthur, TX (Webb et
al., 2002; Tierney, 1997b).
Business listings were drawn from Reference USA (InfoGroup, 2016) – the year before Hurricane
Harvey occurred. Reference USA is a consumer agency that provides business listings. Reference
USA is a commercial and residential listing agency for the United States (InfoGroup, 2016). The
agency acquires their listings from the Census Bureau and then conducts a triple telephone
verification method to verify the existence of business/residence. For this study, we acquired a
geo-coded listing of the business name, complete address, type of business, phone number, and
ReferenceUSA unique identifier. Following the protocols of studies such as Webb et al. (2002) we
choose to omit medical offices and schools. We choose to omit these types of businesses to protect
sensitive and identifiable information that may accidentally be exposed while organizational
leaders were responding the questionnaire.
The original population size for nonprofits was 1 563 for Beaumont and 456 for Port Arthur. Using
this sampling design, we drew a sample size of 300 businesses with a target sample of 200 under
a 90 % confidence interval and a 5 % margin of error. Nonprofit listings were drawn from
Taxexemptworld.com and ReferenceUSA (InfoGroup, 2016). Like ReferenceUSA,
Taxexemptworld.com is a consumer listing agency that specializes in obtaining organizational data
for nonprofits and charities based in the United States. The agency collects the organizational data
from the IRS website then performs a verification process using 990 forms. After combining the
list, we further cleaned the listings to ensure against inclusion of duplicate entries and non-
operational nonprofits.
15
This publication is available free of charge from: https://doi.org/10.6028/N
IST.DC
I.004
We conducted this cleaning process by verifying the operation of each nonprofit in the sample by
using a combination of Google Search, GuideStar (https://www.guidestar.org/search), White
Pages, and Facebook. If an organization could not be verified using one or more of these sources,
we assumed it inoperable and removed it from the sampling frame.
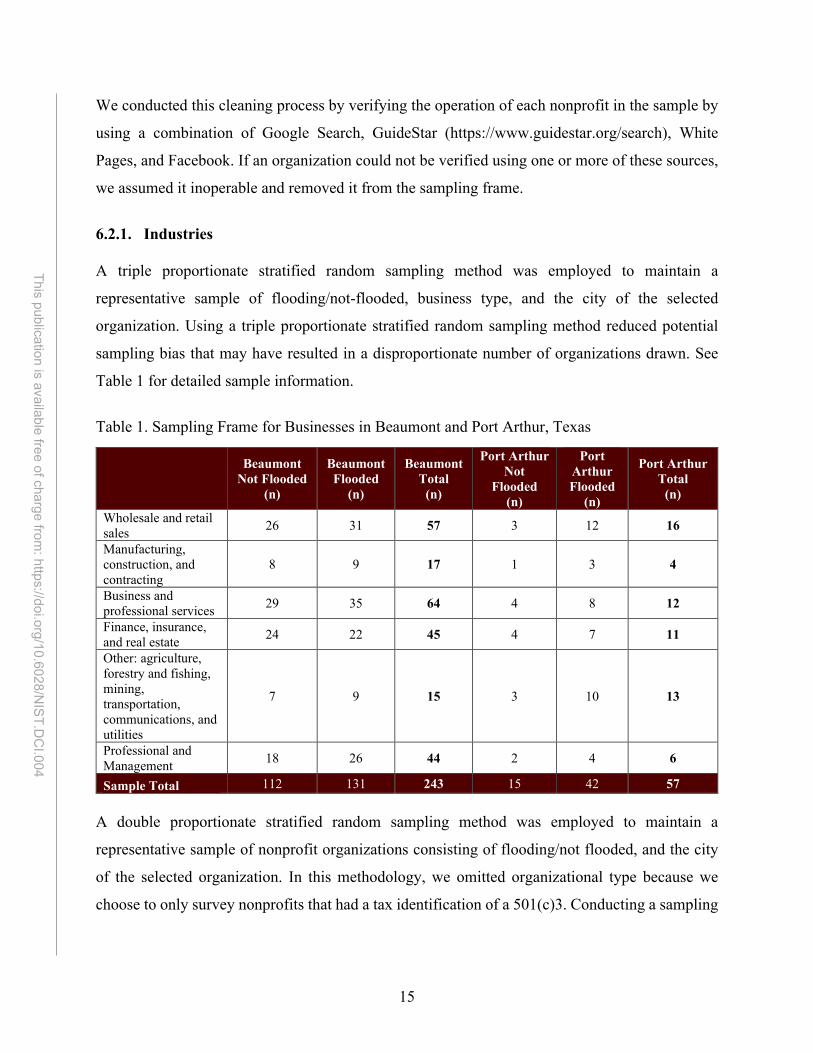
6.2.1. Industries A triple proportionate stratified random sampling method was employed to maintain a
representative sample of flooding/not-flooded, business type, and the city of the selected
organization. Using a triple proportionate stratified random sampling method reduced potential
sampling bias that may have resulted in a disproportionate number of organizations drawn. See
Table 1 for detailed sample information.
Table 1. Sampling Frame for Businesses in Beaumont and Port Arthur, Texas
Beaumont Not Flooded
(n)
Beaumont Flooded
(n)
Beaumont Total
(n)
Port Arthur Not
Flooded (n)
Port Arthur Flooded
(n)
Port Arthur Total
(n)
Wholesale and retail sales 26 31 57 3 12 16
Manufacturing, construction, and contracting
8 9 17 1 3 4
Business and professional services 29 35 64 4 8 12
Finance, insurance, and real estate 24 22 45 4 7 11
Other: agriculture, forestry and fishing, mining, transportation, communications, and utilities
7 9 15 3 10 13
Professional and Management 18 26 44 2 4 6
Sample Total 112 131 243 15 42 57 A double proportionate stratified random sampling method was employed to maintain a
representative sample of nonprofit organizations consisting of flooding/not flooded, and the city
of the selected organization. In this methodology, we omitted organizational type because we
choose to only survey nonprofits that had a tax identification of a 501(c)3. Conducting a sampling
16
This publication is available free of charge from: https://doi.org/10.6028/N
IST.DC
I.004
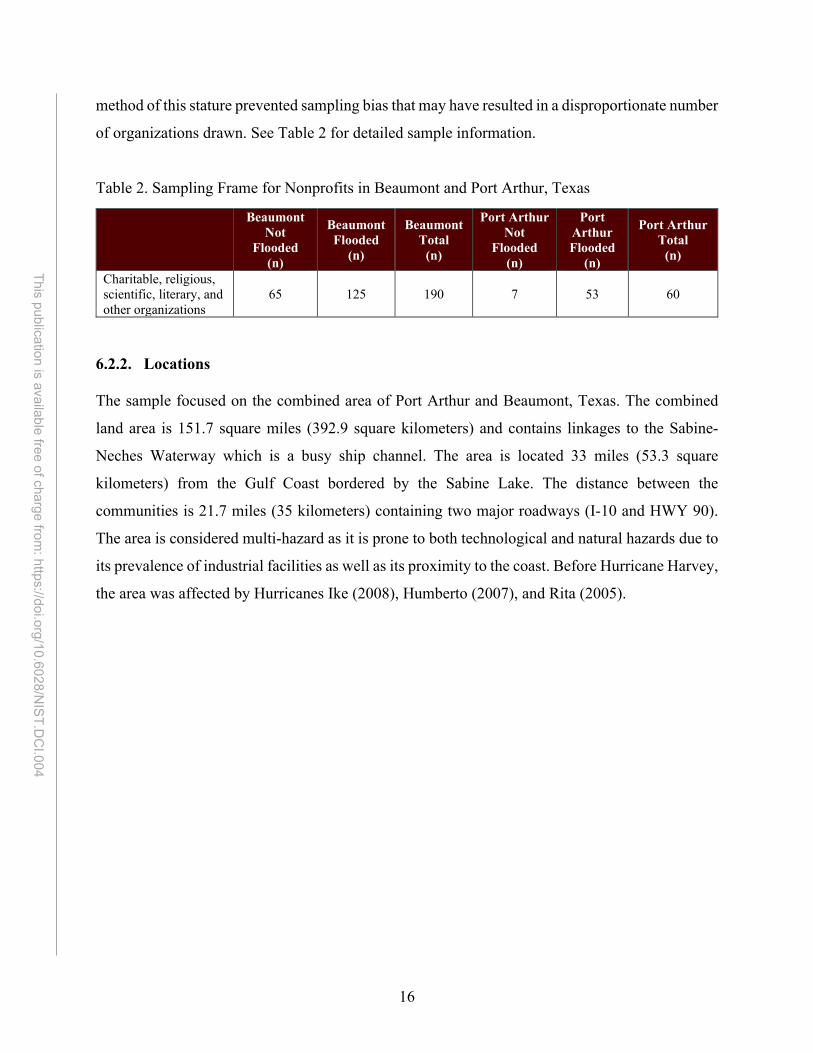
method of this stature prevented sampling bias that may have resulted in a disproportionate number
of organizations drawn. See Table 2 for detailed sample information.
Table 2. Sampling Frame for Nonprofits in Beaumont and Port Arthur, Texas
Beaumont Not
Flooded (n)
Beaumont Flooded
(n)
Beaumont Total
(n)
Port Arthur Not
Flooded (n)
Port Arthur Flooded
(n)
Port Arthur Total
(n)
Charitable, religious, scientific, literary, and other organizations
65 125 190 7 53 60
6.2.2. Locations
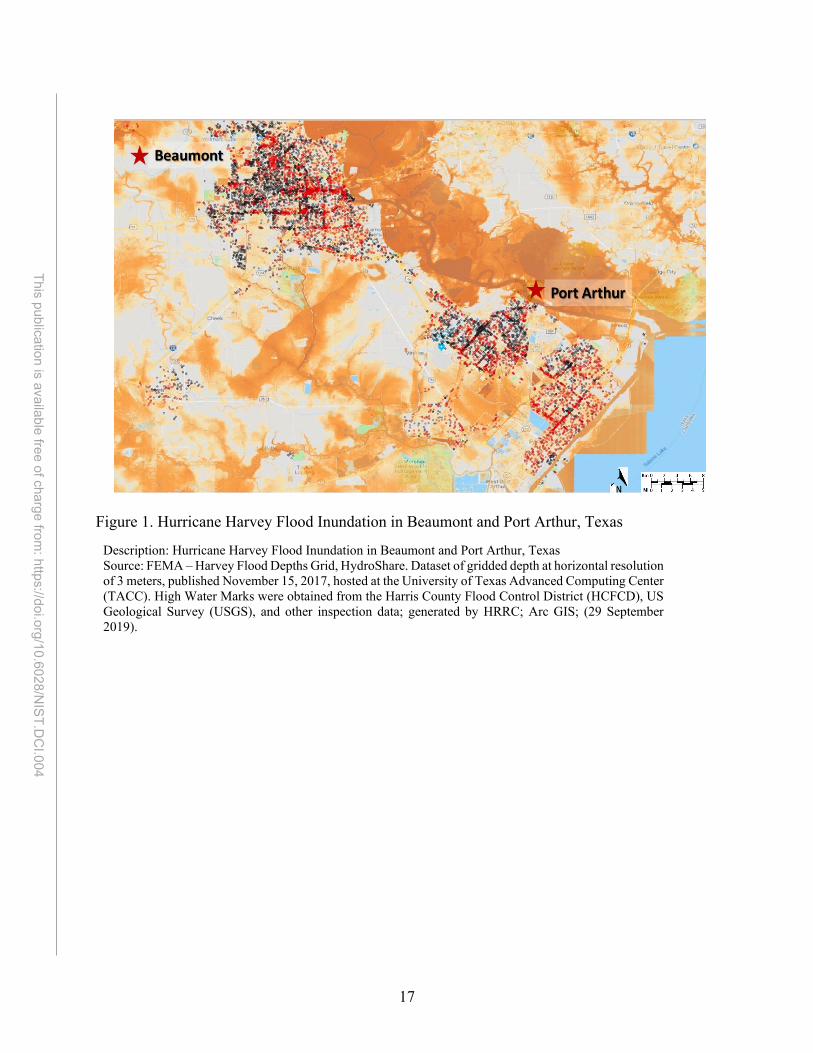
The sample focused on the combined area of Port Arthur and Beaumont, Texas. The combined
land area is 151.7 square miles (392.9 square kilometers) and contains linkages to the Sabine-
Neches Waterway which is a busy ship channel. The area is located 33 miles (53.3 square
kilometers) from the Gulf Coast bordered by the Sabine Lake. The distance between the
communities is 21.7 miles (35 kilometers) containing two major roadways (I-10 and HWY 90).
The area is considered multi-hazard as it is prone to both technological and natural hazards due to
its prevalence of industrial facilities as well as its proximity to the coast. Before Hurricane Harvey,
the area was affected by Hurricanes Ike (2008), Humberto (2007), and Rita (2005).
17
This publication is available free of charge from: https://doi.org/10.6028/N
IST.DC
I.004
Figure 1. Hurricane Harvey Flood Inundation in Beaumont and Port Arthur, Texas
Description: Hurricane Harvey Flood Inundation in Beaumont and Port Arthur, Texas Source: FEMA – Harvey Flood Depths Grid, HydroShare. Dataset of gridded depth at horizontal resolution of 3 meters, published November 15, 2017, hosted at the University of Texas Advanced Computing Center (TACC). High Water Marks were obtained from the Harris County Flood Control District (HCFCD), US Geological Survey (USGS), and other inspection data; generated by HRRC; Arc GIS; (29 September 2019).
18
This publication is available free of charge from: https://doi.org/10.6028/N
IST.DC
I.004
7. Survey Instrument The survey instrument can be generalized to assess other extreme weather-related, especially
flood-related, events. The instrument used in this study has been adapted from Watson et al. (2000)
and Helgeson et al. (2020). The number of survey questions and topics were adjusted to fit the
impacts organizations experienced during Hurricane Harvey. The survey questions have been
tailored to measure organizational background, perception, organizational interruption, employee
information, organizational information, and participant demographics.
7.1. Survey Consent Surveys were conducted in-person when possible; telephone contact was employed as needed.
After introducing ourselves and the research project the following consent script was used; see
below. Participants were asked to select “yes” on an electronic tablet to confirm study consent. If
the survey was conducted in-person, the participant also received a physical copy of the consent
form. Those surveyed over the telephone consented verbally and the consent form was made
available by e-mail upon request for those surveyed over the phone. The full consent language is
available in Appendix B.
7.2. Survey Sections
The survey instrument consists of nine major sections: (1) organization background, (2) risk
perception, (3) damage and business interruption, (4) employee-related questions, (5)
organizational recovery, (6) recovery finance and mitigation, (7) organizational information, (8)
organizational social networks, and (9) participant demographics. The survey questions in this
survey are specific to the events occurring before and after the onset of Hurricane Harvey. To use
this survey in the future the name of the storm can be replaced. A summary of each survey section
is provided below. The full survey is provided in Appendix A.
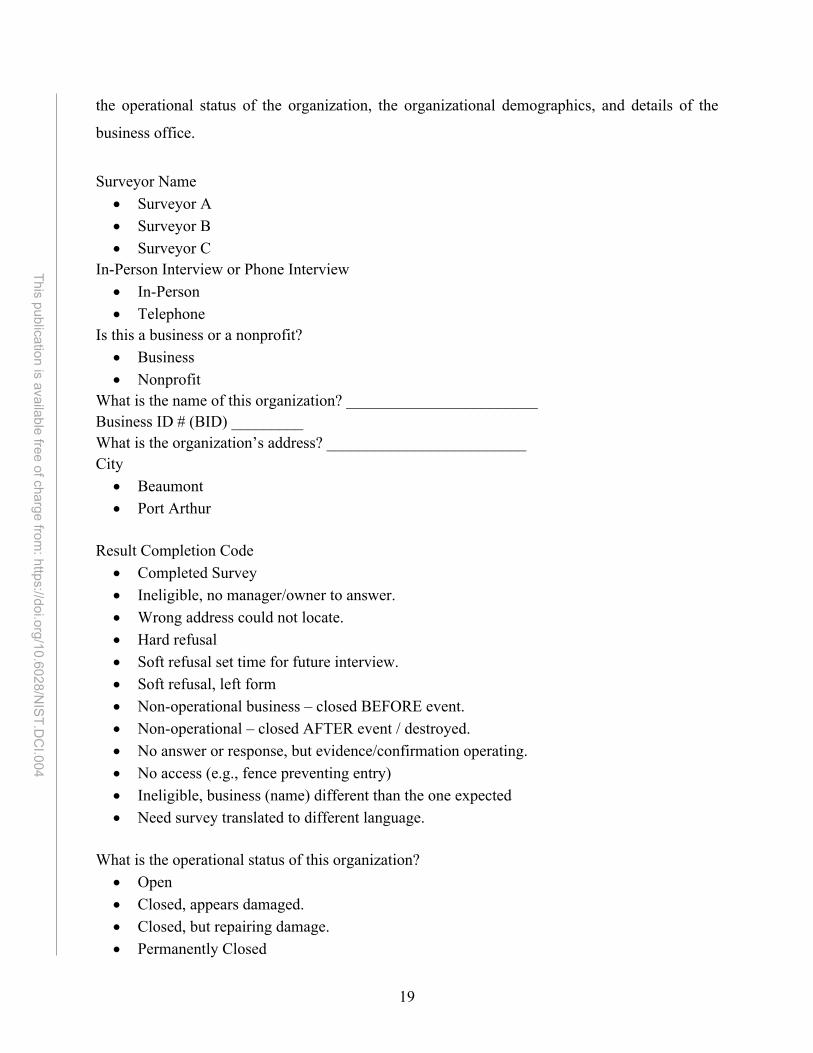
7.2.1. Organizational Background
This first section of the survey assessed basic organizational information. Specifically, this section
gathered information about the organization, the interviewing process, the type of organization,
19
This publication is available free of charge from: https://doi.org/10.6028/N
IST.DC
I.004
the operational status of the organization, the organizational demographics, and details of the
business office.
Surveyor Name
• Surveyor A • Surveyor B • Surveyor C
In-Person Interview or Phone Interview • In-Person • Telephone
Is this a business or a nonprofit? • Business • Nonprofit
What is the name of this organization? ________________________ Business ID # (BID) _________ What is the organization’s address? _________________________ City
• Beaumont • Port Arthur
Result Completion Code
• Completed Survey • Ineligible, no manager/owner to answer. • Wrong address could not locate. • Hard refusal • Soft refusal set time for future interview. • Soft refusal, left form • Non-operational business – closed BEFORE event. • Non-operational – closed AFTER event / destroyed. • No answer or response, but evidence/confirmation operating. • No access (e.g., fence preventing entry) • Ineligible, business (name) different than the one expected • Need survey translated to different language.
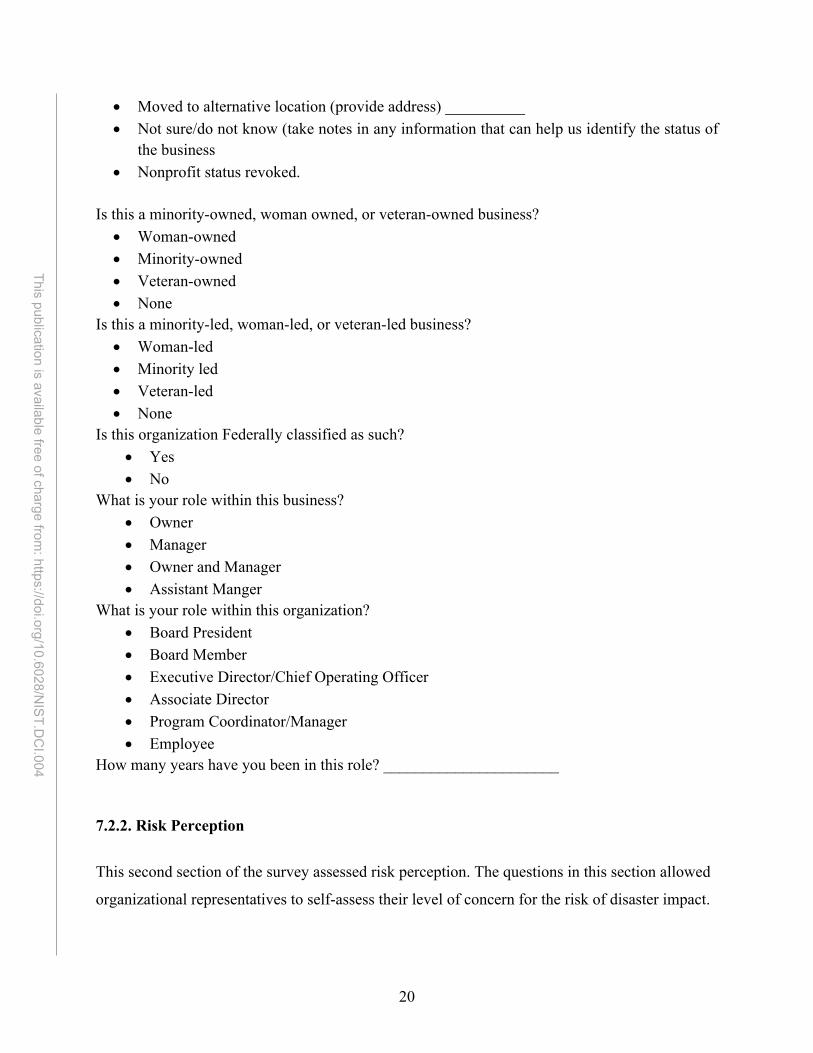
What is the operational status of this organization?
• Open • Closed, appears damaged. • Closed, but repairing damage. • Permanently Closed
20
This publication is available free of charge from: https://doi.org/10.6028/N
IST.DC
I.004
• Moved to alternative location (provide address) __________ • Not sure/do not know (take notes in any information that can help us identify the status of
the business • Nonprofit status revoked.
Is this a minority-owned, woman owned, or veteran-owned business?
• Woman-owned • Minority-owned • Veteran-owned • None
Is this a minority-led, woman-led, or veteran-led business? • Woman-led • Minority led • Veteran-led • None
Is this organization Federally classified as such? • Yes • No
What is your role within this business? • Owner • Manager • Owner and Manager • Assistant Manger
What is your role within this organization? • Board President • Board Member • Executive Director/Chief Operating Officer • Associate Director • Program Coordinator/Manager • Employee
How many years have you been in this role? ______________________
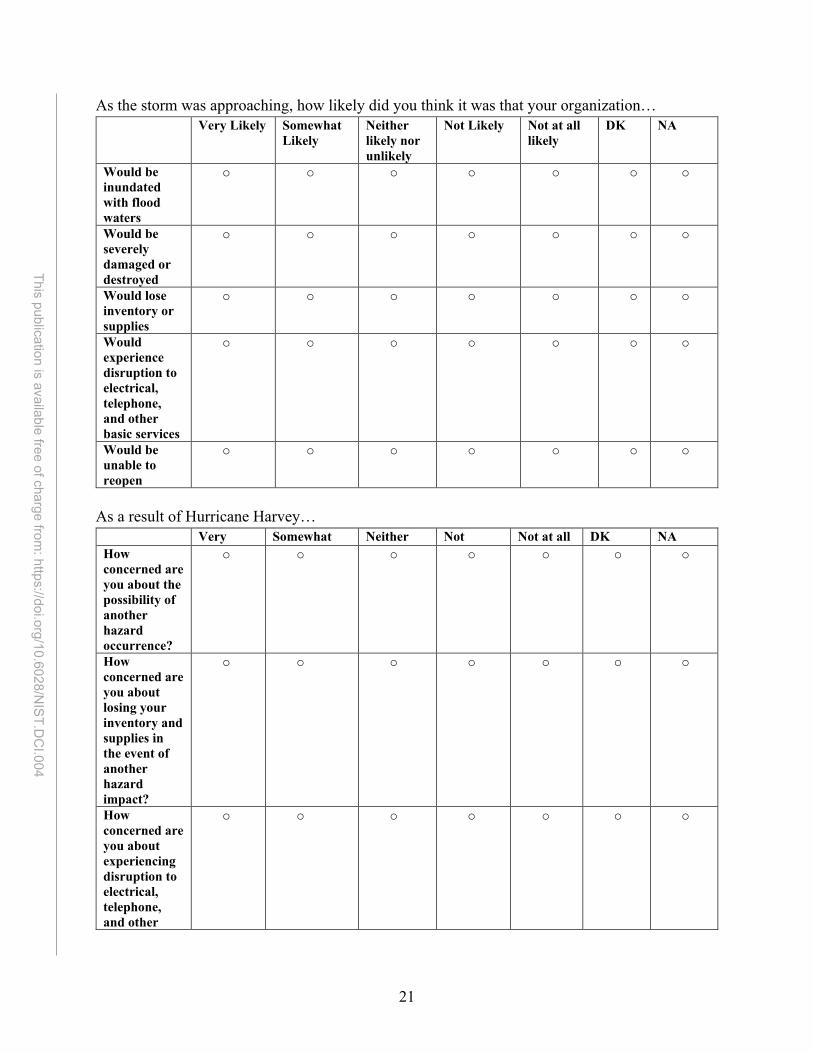
7.2.2. Risk Perception
This second section of the survey assessed risk perception. The questions in this section allowed
organizational representatives to self-assess their level of concern for the risk of disaster impact.
21
This publication is available free of charge from: https://doi.org/10.6028/N
IST.DC
I.004
As the storm was approaching, how likely did you think it was that your organization… Very Likely Somewhat
Likely Neither likely nor unlikely
Not Likely Not at all likely
DK NA
Would be inundated with flood waters
o o o o o o o
Would be severely damaged or destroyed
o o o o o o o
Would lose inventory or supplies
o o o o o o o
Would experience disruption to electrical, telephone, and other basic services
o o o o o o o
Would be unable to reopen
o o o o o o o
As a result of Hurricane Harvey…
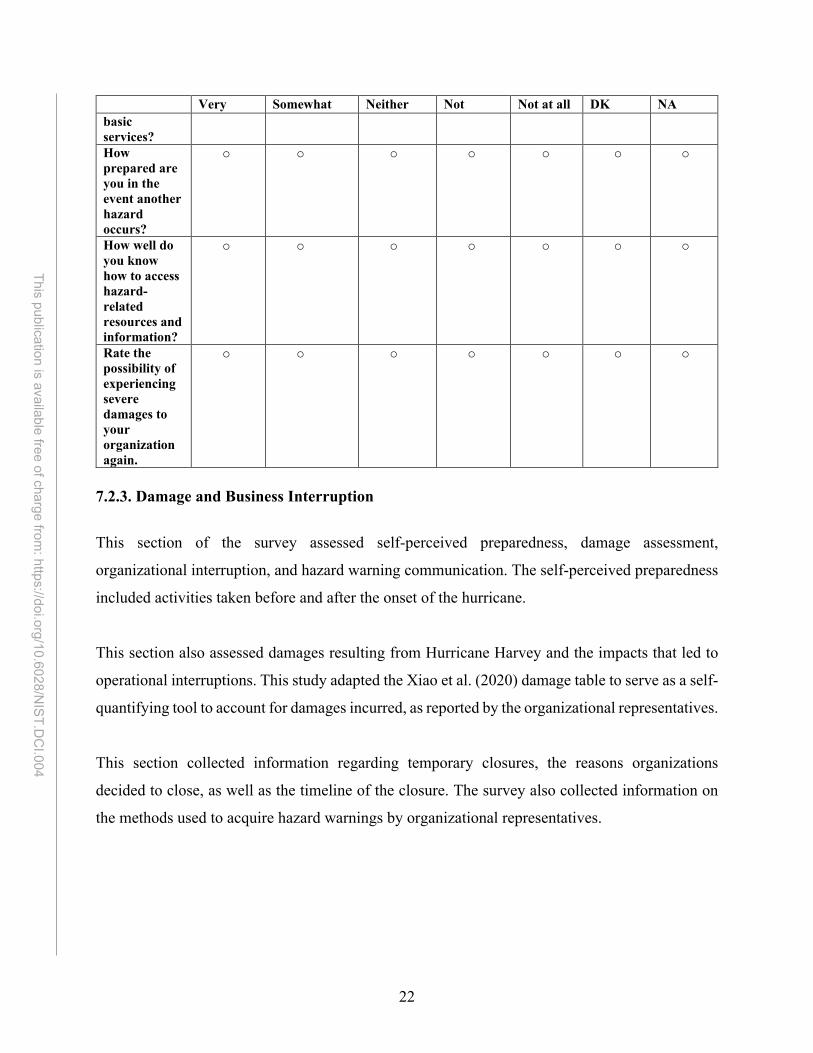
Very Somewhat Neither Not Not at all DK NA How concerned are you about the possibility of another hazard occurrence?
o o o o o o o
How concerned are you about losing your inventory and supplies in the event of another hazard impact?
o o o o o o o
How concerned are you about experiencing disruption to electrical, telephone, and other
o o o o o o o
22
This publication is available free of charge from: https://doi.org/10.6028/N
IST.DC
I.004
Very Somewhat Neither Not Not at all DK NA basic services? How prepared are you in the event another hazard occurs?
o o o o o o o
How well do you know how to access hazard-related resources and information?
o o o o o o o
Rate the possibility of experiencing severe damages to your organization again.
o o o o o o o
7.2.3. Damage and Business Interruption
This section of the survey assessed self-perceived preparedness, damage assessment,
organizational interruption, and hazard warning communication. The self-perceived preparedness
included activities taken before and after the onset of the hurricane.
This section also assessed damages resulting from Hurricane Harvey and the impacts that led to
operational interruptions. This study adapted the Xiao et al. (2020) damage table to serve as a self-
quantifying tool to account for damages incurred, as reported by the organizational representatives.
This section collected information regarding temporary closures, the reasons organizations
decided to close, as well as the timeline of the closure. The survey also collected information on
the methods used to acquire hazard warnings by organizational representatives.
23
This publication is available free of charge from: https://doi.org/10.6028/N
IST.DC
I.004
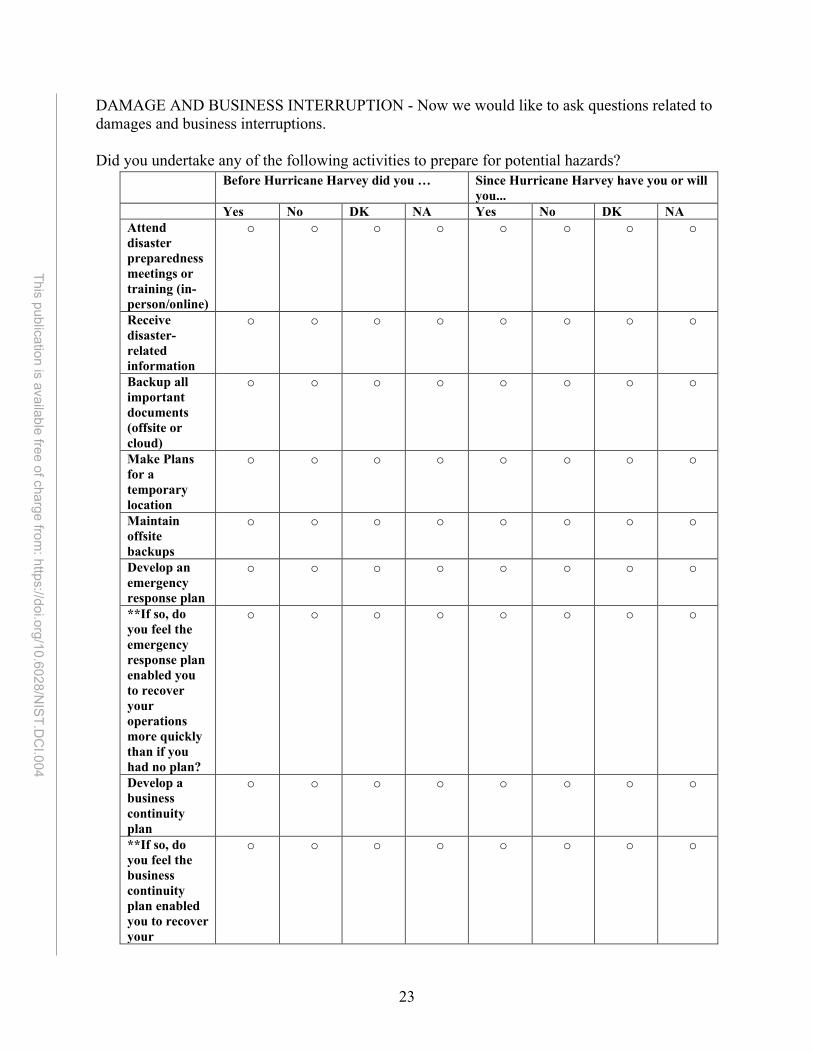
DAMAGE AND BUSINESS INTERRUPTION - Now we would like to ask questions related to damages and business interruptions. Did you undertake any of the following activities to prepare for potential hazards?
Before Hurricane Harvey did you … Since Hurricane Harvey have you or will you...
Yes No DK NA Yes No DK NA Attend disaster preparedness meetings or training (in-person/online)
o o o o o o o o
Receive disaster-related information
o o o o o o o o
Backup all important documents (offsite or cloud)
o o o o o o o o
Make Plans for a temporary location
o o o o o o o o
Maintain offsite backups
o o o o o o o o
Develop an emergency response plan
o o o o o o o o
**If so, do you feel the emergency response plan enabled you to recover your operations more quickly than if you had no plan?
o o o o o o o o
Develop a business continuity plan
o o o o o o o o
**If so, do you feel the business continuity plan enabled you to recover your
o o o o o o o o
24
This publication is available free of charge from: https://doi.org/10.6028/N
IST.DC
I.004
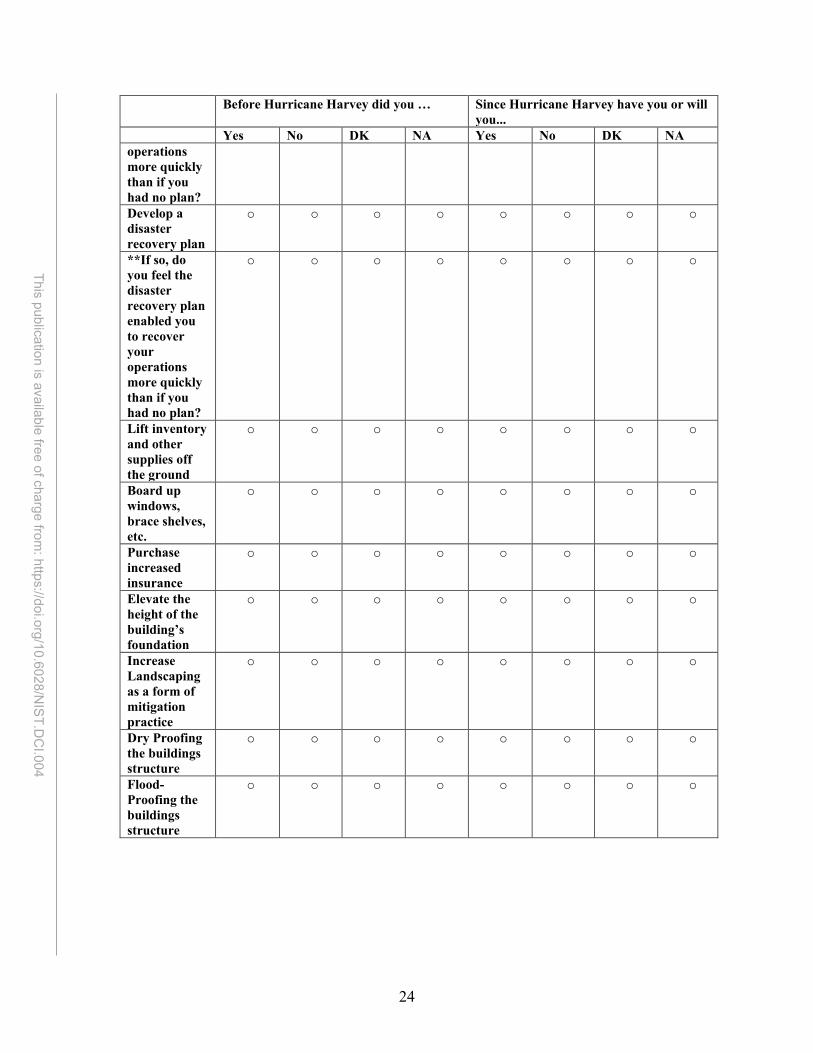
Before Hurricane Harvey did you … Since Hurricane Harvey have you or will you...
Yes No DK NA Yes No DK NA operations more quickly than if you had no plan? Develop a disaster recovery plan
o o o o o o o o
**If so, do you feel the disaster recovery plan enabled you to recover your operations more quickly than if you had no plan?
o o o o o o o o
Lift inventory and other supplies off the ground
o o o o o o o o
Board up windows, brace shelves, etc.
o o o o o o o o
Purchase increased insurance
o o o o o o o o
Elevate the height of the building’s foundation
o o o o o o o o
Increase Landscaping as a form of mitigation practice
o o o o o o o o
Dry Proofing the buildings structure
o o o o o o o o
Flood- Proofing the buildings structure
o o o o o o o o
25
This publication is available free of charge from: https://doi.org/10.6028/N
IST.DC
I.004
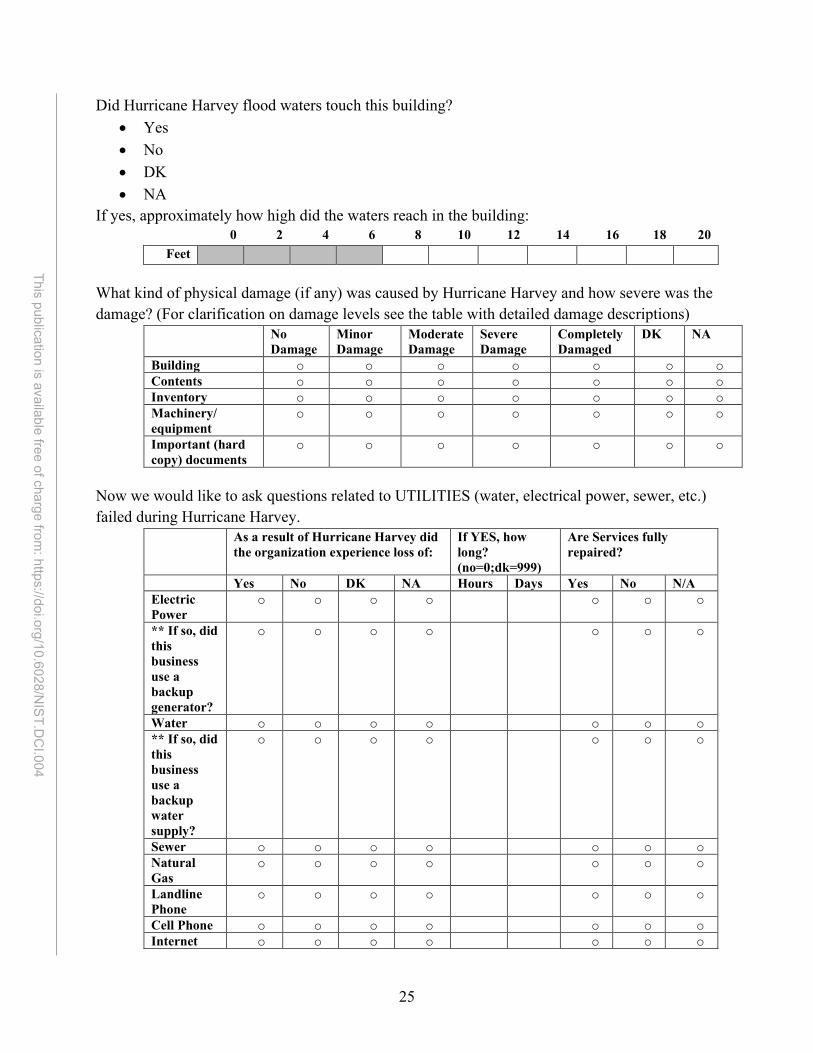
Did Hurricane Harvey flood waters touch this building? • Yes • No • DK • NA
If yes, approximately how high did the waters reach in the building: 0 2 4 6 8 10 12 14 16 18 20
Feet What kind of physical damage (if any) was caused by Hurricane Harvey and how severe was the damage? (For clarification on damage levels see the table with detailed damage descriptions)
No Damage
Minor Damage
Moderate Damage
Severe Damage
Completely Damaged
DK NA
Building o o o o o o o Contents o o o o o o o Inventory o o o o o o o Machinery/ equipment
o o o o o o o
Important (hard copy) documents
o o o o o o o
Now we would like to ask questions related to UTILITIES (water, electrical power, sewer, etc.) failed during Hurricane Harvey.
As a result of Hurricane Harvey did the organization experience loss of:
If YES, how long? (no=0;dk=999)
Are Services fully repaired?
Yes No DK NA Hours Days Yes No N/A Electric Power
o o o o o o o
** If so, did this business use a backup generator?
o o o o o o o
Water o o o o o o o ** If so, did this business use a backup water supply?
o o o o o o o
Sewer o o o o o o o Natural Gas
o o o o o o o
Landline Phone
o o o o o o o
Cell Phone o o o o o o o Internet o o o o o o o
26
This publication is available free of charge from: https://doi.org/10.6028/N
IST.DC
I.004
Did this organization use any other backup systems besides a generator or water supply?
• Yes • No • DK
If [yes] please describe __________________________ Immediately after Hurricane Harvey, operations were at what level of capacity?
• Full Capacity • Half Capacity • Partial Capacity • Operations Completely Ceased
How long did it take for your organization to resume operations (in days)? (dk=999) _______________________________ As a result of Hurricane Harvey has the business gross revenue
• Decreased Greatly • Decreased Slightly • Stayed the Same • Increased Slightly • Increased Greatly
Has the organization donations and/or external funding…? • Decreased Greatly • Decreased Slightly • Stayed the Same • Increased Slightly • Increased Greatly
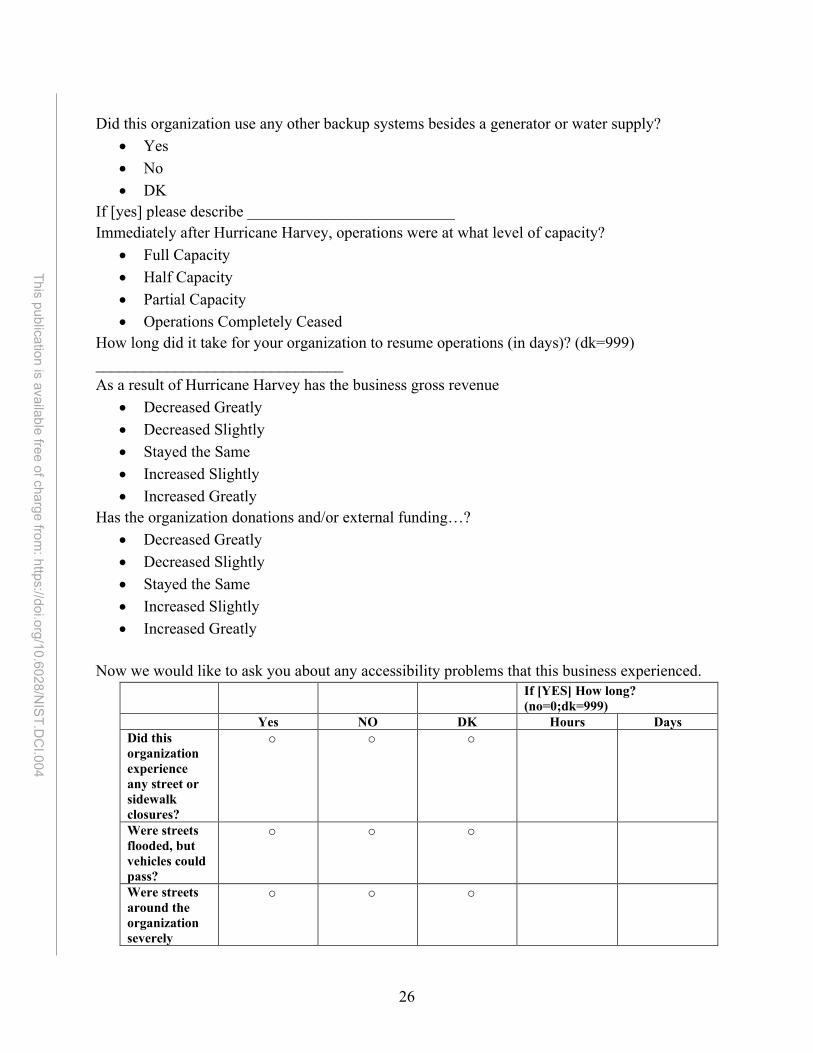
Now we would like to ask you about any accessibility problems that this business experienced.
If [YES] How long? (no=0;dk=999)
Yes NO DK Hours Days Did this organization experience any street or sidewalk closures?
o o o
Were streets flooded, but vehicles could pass?
o o o
Were streets around the organization severely
o o o
27
This publication is available free of charge from: https://doi.org/10.6028/N
IST.DC
I.004
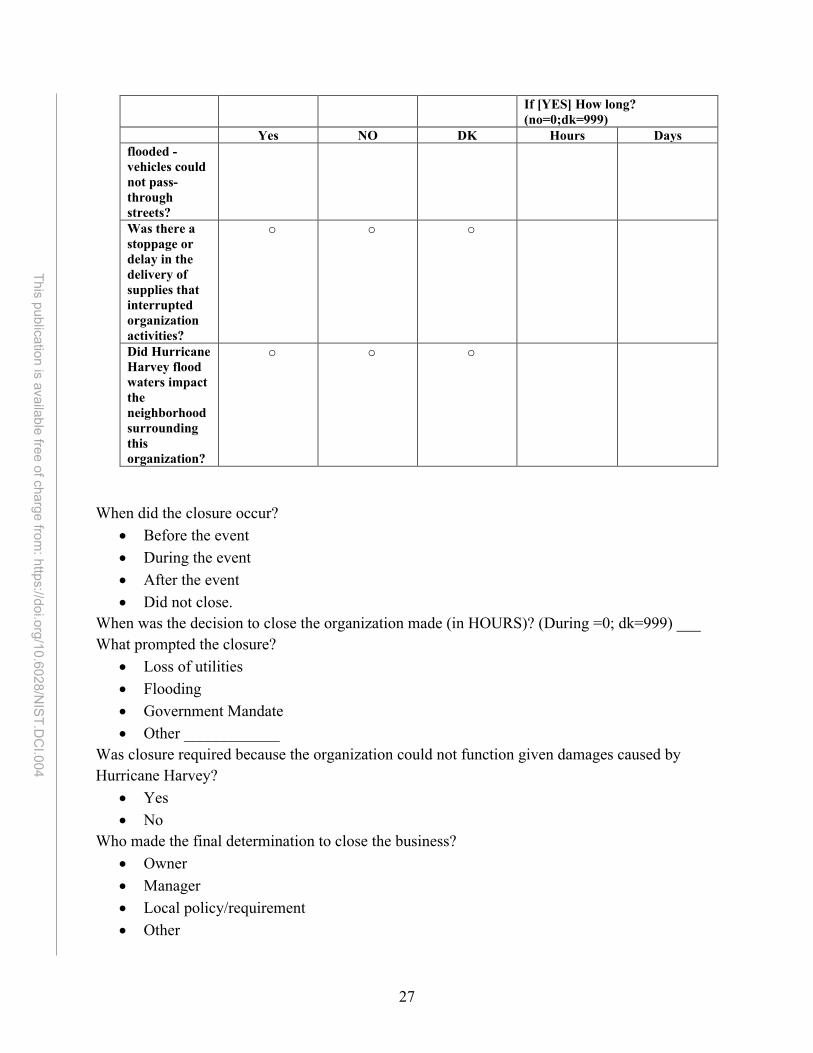
If [YES] How long? (no=0;dk=999)
Yes NO DK Hours Days flooded - vehicles could not pass-through streets? Was there a stoppage or delay in the delivery of supplies that interrupted organization activities?
o o o
Did Hurricane Harvey flood waters impact the neighborhood surrounding this organization?
o o o
When did the closure occur? • Before the event • During the event • After the event • Did not close.
When was the decision to close the organization made (in HOURS)? (During =0; dk=999) ___ What prompted the closure?
• Loss of utilities • Flooding • Government Mandate • Other ____________
Was closure required because the organization could not function given damages caused by Hurricane Harvey?
• Yes • No
Who made the final determination to close the business? • Owner • Manager • Local policy/requirement • Other
28
This publication is available free of charge from: https://doi.org/10.6028/N
IST.DC
I.004
Who made the final determination to close this organization? • Executive Director/ Chief Operating Officer • Associate Director • Program Coordinator/Manager • Local Policy/requirement • Board Members • Other ___________
What was the most important information used to close your organization? ____________ Which statement most influenced your decision to close your business?
• Seeing area organization close • Seeing friends, relatives, neighbors, or coworkers evacuating • Hearing an announcement of a hurricane “watch” or “warning” • Hearing local authorities issue official recommendations. • Previous personal experience with hurricane storm conditions • Concern about protecting your business from storm impact. • Concern about lost revenue
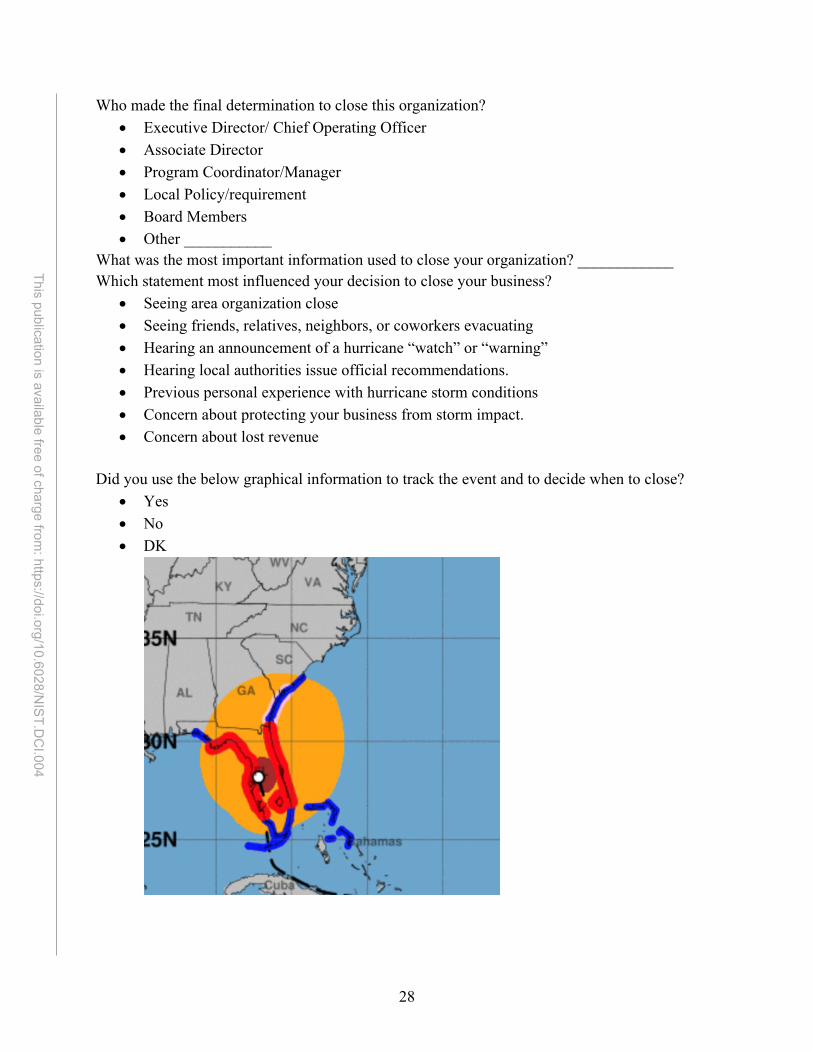
Did you use the below graphical information to track the event and to decide when to close?
• Yes • No • DK
29
This publication is available free of charge from: https://doi.org/10.6028/N
IST.DC
I.004
Which of the following did you use to get your information? (Mark all that apply)
• Local network TV news • National TV • Weather Channel • Accuweather • Local Government • Community Leaders • Radio • Internet Source • Friends/Family • Social Media • National Weather Service (directly) • Organizations • Other: ______________
How were the status of the organization communicated (e.g., open or not) to potential customers and the public (mark all that apply)?
• Telephone • E-mail • Text Message • Social Media • TV • Newspaper • Radio • Word of Mouth • Other: ___________
Can this organization operate without a physical location?
• Not dependent on physical location at all • Somewhat dependent on a physical location • Extremely dependent on a physical location
7.2.4. Employee related information
The employee-related section of the survey assesses employee-related preparedness and impact.
Initially we asked organizational representatives to identify alternative work locations, hours spent
30
This publication is available free of charge from: https://doi.org/10.6028/N
IST.DC
I.004
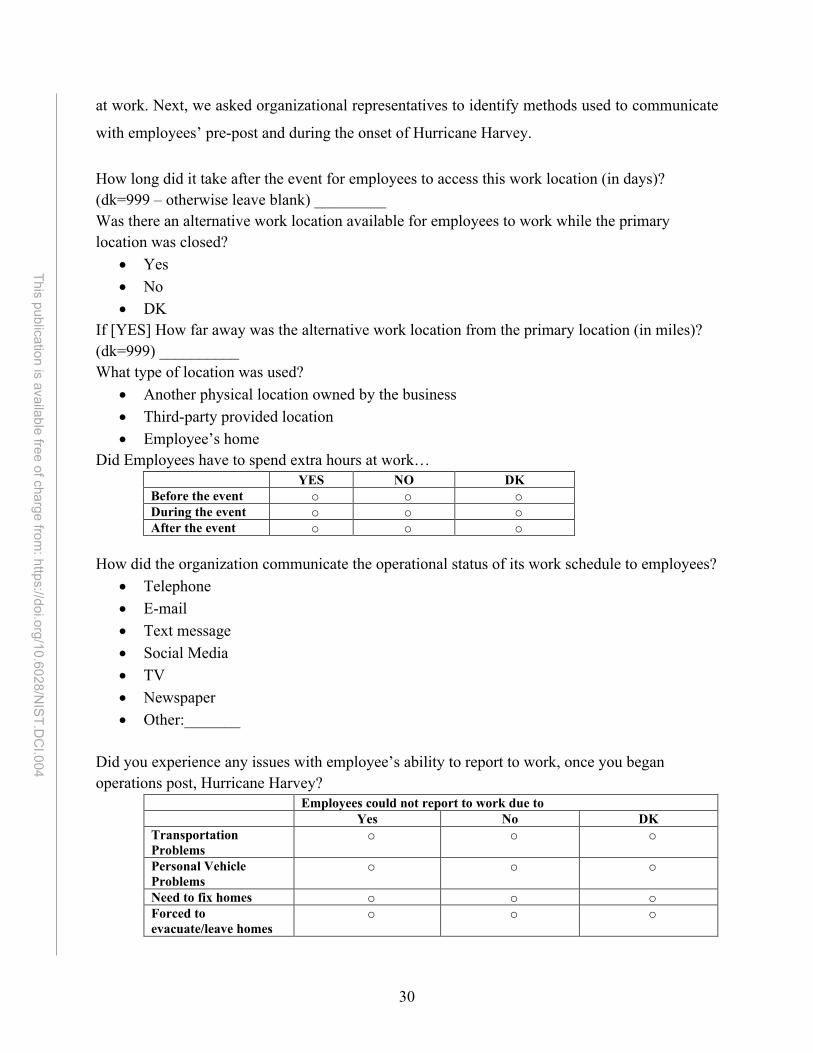
at work. Next, we asked organizational representatives to identify methods used to communicate
with employees’ pre-post and during the onset of Hurricane Harvey.
How long did it take after the event for employees to access this work location (in days)? (dk=999 – otherwise leave blank) _________ Was there an alternative work location available for employees to work while the primary location was closed?
• Yes • No • DK
If [YES] How far away was the alternative work location from the primary location (in miles)? (dk=999) __________ What type of location was used?
• Another physical location owned by the business • Third-party provided location • Employee’s home
Did Employees have to spend extra hours at work… YES NO DK Before the event o o o During the event o o o After the event o o o
How did the organization communicate the operational status of its work schedule to employees?
• Telephone • E-mail • Text message • Social Media • TV • Newspaper • Other:_______
Did you experience any issues with employee’s ability to report to work, once you began operations post, Hurricane Harvey?
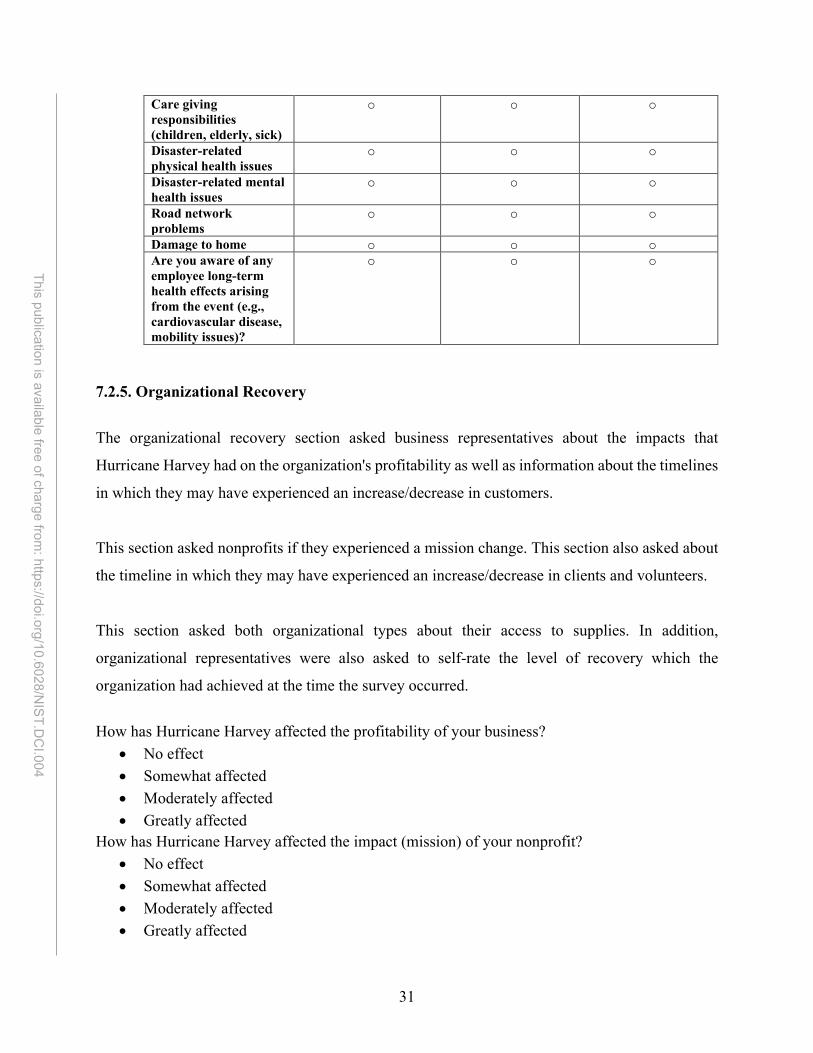
Employees could not report to work due to Yes No DK Transportation Problems
o o o
Personal Vehicle Problems
o o o
Need to fix homes o o o Forced to evacuate/leave homes
o o o
31
This publication is available free of charge from: https://doi.org/10.6028/N
IST.DC
I.004
Care giving responsibilities (children, elderly, sick)
o o o
Disaster-related physical health issues
o o o
Disaster-related mental health issues
o o o
Road network problems
o o o
Damage to home o o o Are you aware of any employee long-term health effects arising from the event (e.g., cardiovascular disease, mobility issues)?
o o o
7.2.5. Organizational Recovery
The organizational recovery section asked business representatives about the impacts that
Hurricane Harvey had on the organization's profitability as well as information about the timelines
in which they may have experienced an increase/decrease in customers.
This section asked nonprofits if they experienced a mission change. This section also asked about
the timeline in which they may have experienced an increase/decrease in clients and volunteers.
This section asked both organizational types about their access to supplies. In addition,
organizational representatives were also asked to self-rate the level of recovery which the
organization had achieved at the time the survey occurred.
How has Hurricane Harvey affected the profitability of your business?
• No effect • Somewhat affected • Moderately affected • Greatly affected
How has Hurricane Harvey affected the impact (mission) of your nonprofit? • No effect • Somewhat affected • Moderately affected • Greatly affected
32
This publication is available free of charge from: https://doi.org/10.6028/N
IST.DC
I.004
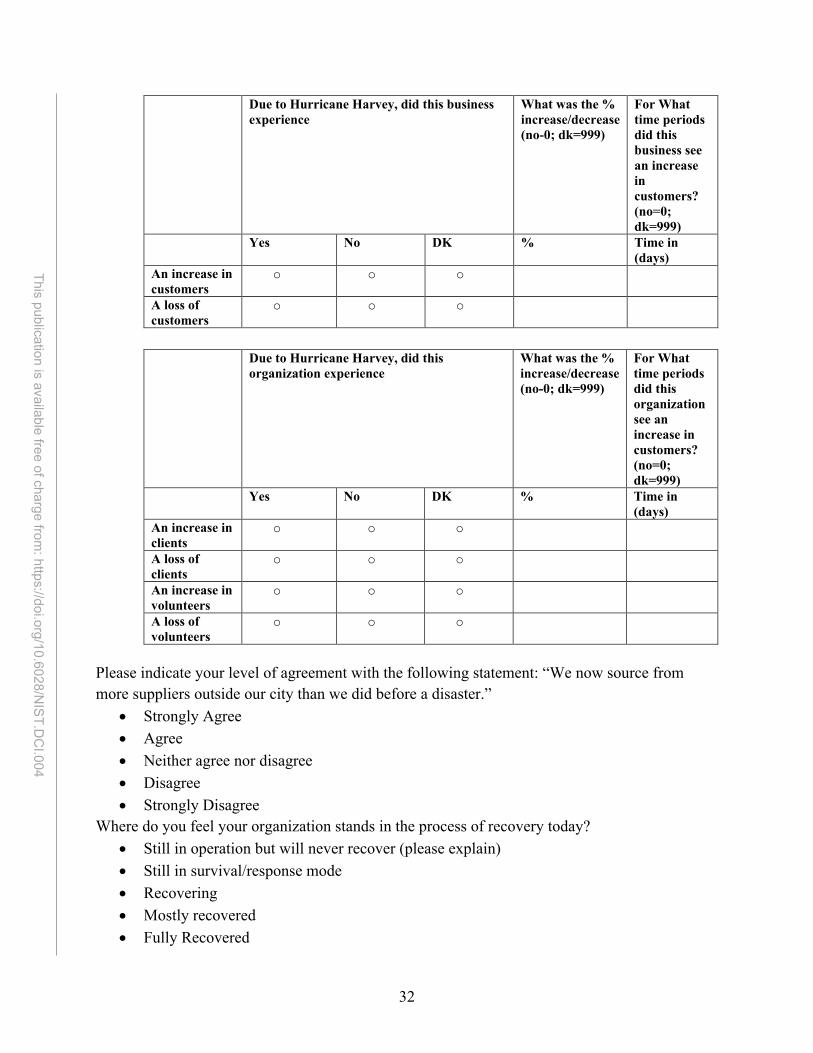
Due to Hurricane Harvey, did this business experience
What was the % increase/decrease (no-0; dk=999)
For What time periods did this business see an increase in customers? (no=0; dk=999)
Yes No DK % Time in (days)
An increase in customers
o o o
A loss of customers
o o o
Due to Hurricane Harvey, did this
organization experience What was the % increase/decrease (no-0; dk=999)
For What time periods did this organization see an increase in customers? (no=0; dk=999)
Yes No DK % Time in (days)
An increase in clients
o o o
A loss of clients
o o o
An increase in volunteers
o o o
A loss of volunteers
o o o
Please indicate your level of agreement with the following statement: “We now source from more suppliers outside our city than we did before a disaster.”
• Strongly Agree • Agree • Neither agree nor disagree • Disagree • Strongly Disagree
Where do you feel your organization stands in the process of recovery today? • Still in operation but will never recover (please explain) • Still in survival/response mode • Recovering • Mostly recovered • Fully Recovered
33
This publication is available free of charge from: https://doi.org/10.6028/N
IST.DC
I.004
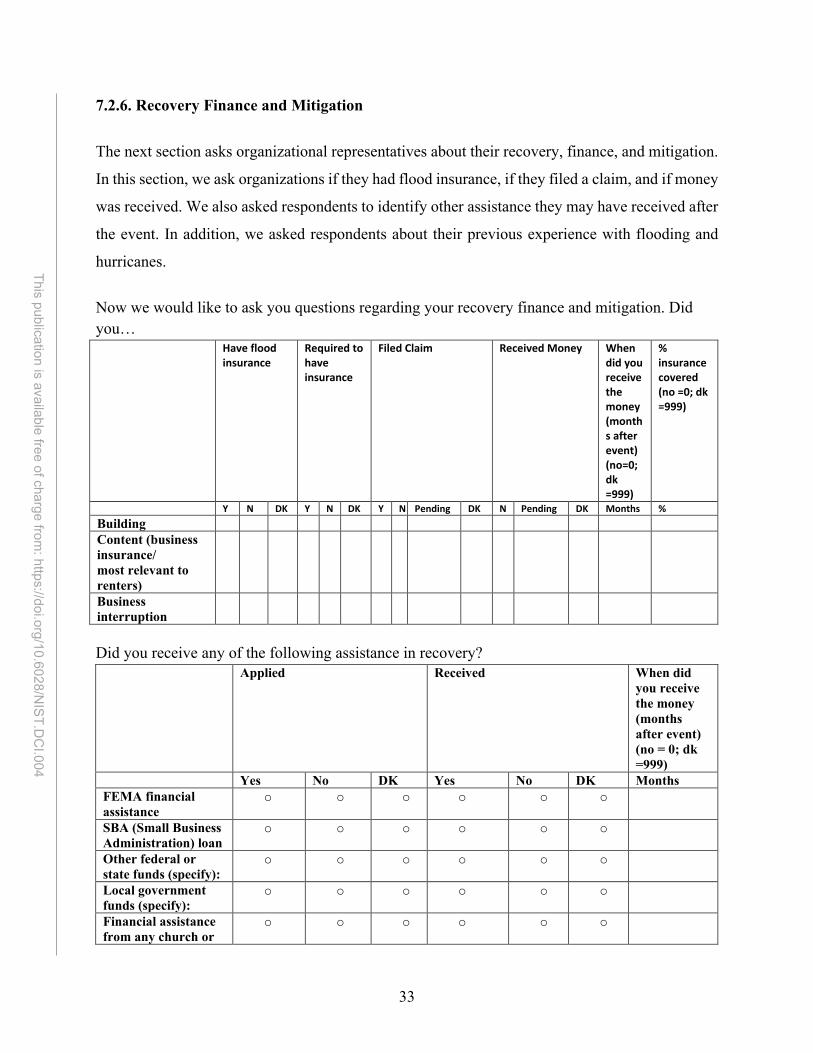
7.2.6. Recovery Finance and Mitigation
The next section asks organizational representatives about their recovery, finance, and mitigation.
In this section, we ask organizations if they had flood insurance, if they filed a claim, and if money
was received. We also asked respondents to identify other assistance they may have received after
the event. In addition, we asked respondents about their previous experience with flooding and
hurricanes.
Now we would like to ask you questions regarding your recovery finance and mitigation. Did you… Have flood
insurance Required to have insurance
Filed Claim Received Money When did you receive the money (months after event) (no=0; dk =999)
% insurance covered (no =0; dk =999)
Y N DK Y N DK Y N Pending DK N Pending DK Months % Building Content (business insurance/ most relevant to renters)
Business interruption
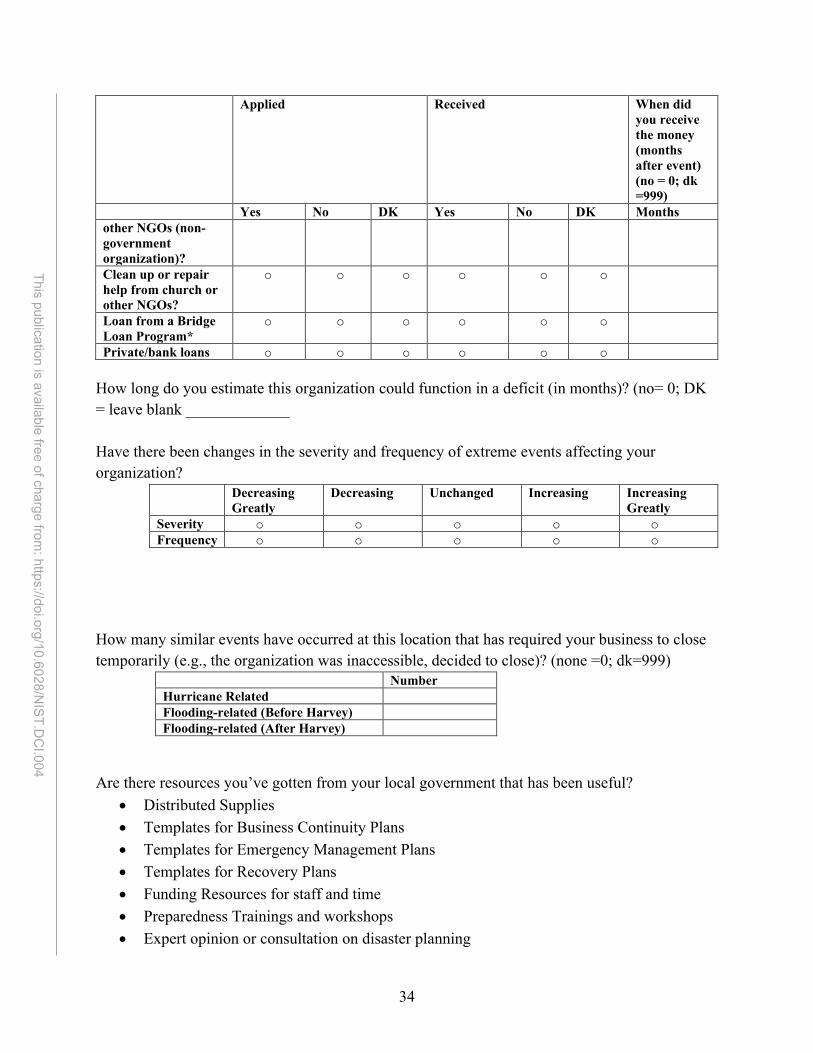
Did you receive any of the following assistance in recovery?
Applied Received When did you receive the money (months after event) (no = 0; dk =999)
Yes No DK Yes No DK Months FEMA financial assistance
o o o o o o
SBA (Small Business Administration) loan
o o o o o o
Other federal or state funds (specify):
o o o o o o
Local government funds (specify):
o o o o o o
Financial assistance from any church or
o o o o o o
34
This publication is available free of charge from: https://doi.org/10.6028/N
IST.DC
I.004
Applied Received When did you receive the money (months after event) (no = 0; dk =999)
Yes No DK Yes No DK Months other NGOs (non-government organization)? Clean up or repair help from church or other NGOs?
o o o o o o
Loan from a Bridge Loan Program*
o o o o o o
Private/bank loans o o o o o o
How long do you estimate this organization could function in a deficit (in months)? (no= 0; DK = leave blank _____________
Have there been changes in the severity and frequency of extreme events affecting your organization?
Decreasing Greatly
Decreasing Unchanged Increasing Increasing Greatly
Severity o o o o o Frequency o o o o o
How many similar events have occurred at this location that has required your business to close temporarily (e.g., the organization was inaccessible, decided to close)? (none =0; dk=999)
Number Hurricane Related Flooding-related (Before Harvey) Flooding-related (After Harvey)
Are there resources you’ve gotten from your local government that has been useful?
• Distributed Supplies • Templates for Business Continuity Plans • Templates for Emergency Management Plans • Templates for Recovery Plans • Funding Resources for staff and time • Preparedness Trainings and workshops • Expert opinion or consultation on disaster planning
35
This publication is available free of charge from: https://doi.org/10.6028/N
IST.DC
I.004
• Interagency Cooperation • Other: _________
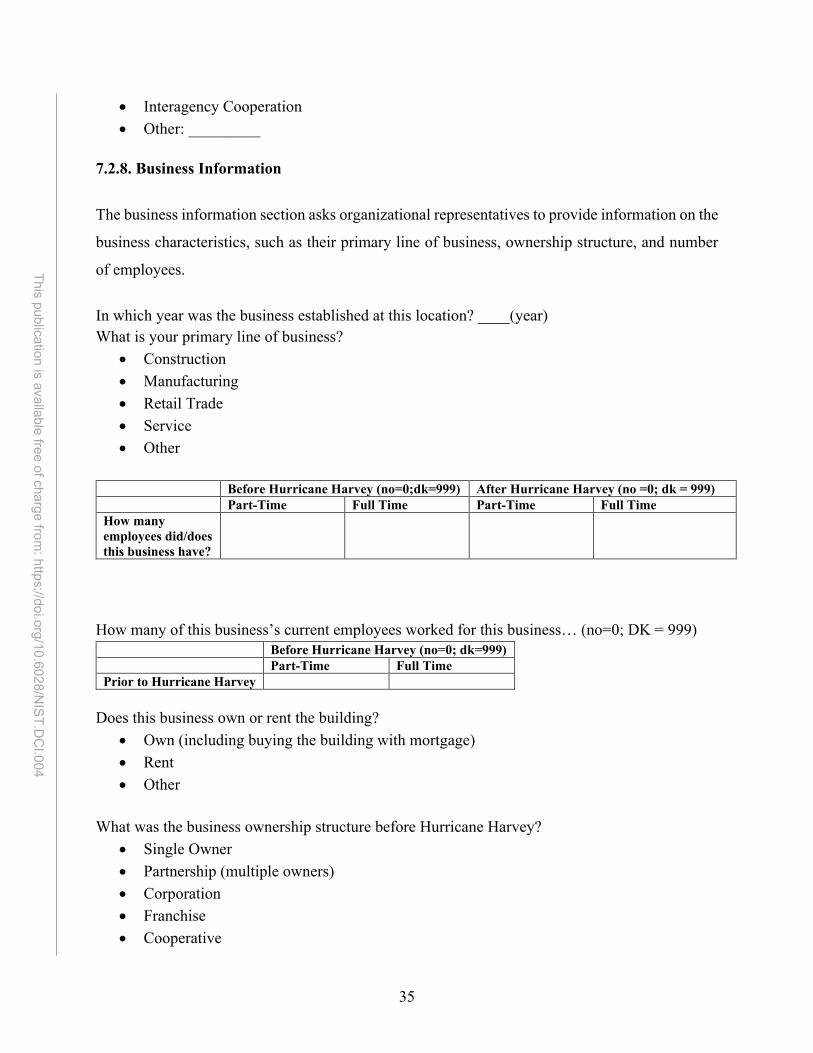
7.2.8. Business Information
The business information section asks organizational representatives to provide information on the
business characteristics, such as their primary line of business, ownership structure, and number
of employees.
In which year was the business established at this location? ____(year) What is your primary line of business?
• Construction • Manufacturing • Retail Trade • Service • Other
Before Hurricane Harvey (no=0;dk=999) After Hurricane Harvey (no =0; dk = 999) Part-Time Full Time Part-Time Full Time How many employees did/does this business have?
How many of this business’s current employees worked for this business… (no=0; DK = 999)
Before Hurricane Harvey (no=0; dk=999) Part-Time Full Time Prior to Hurricane Harvey
Does this business own or rent the building?
• Own (including buying the building with mortgage) • Rent • Other
What was the business ownership structure before Hurricane Harvey?
• Single Owner • Partnership (multiple owners) • Corporation • Franchise • Cooperative
36
This publication is available free of charge from: https://doi.org/10.6028/N
IST.DC
I.004
• Other (please specify): ____________
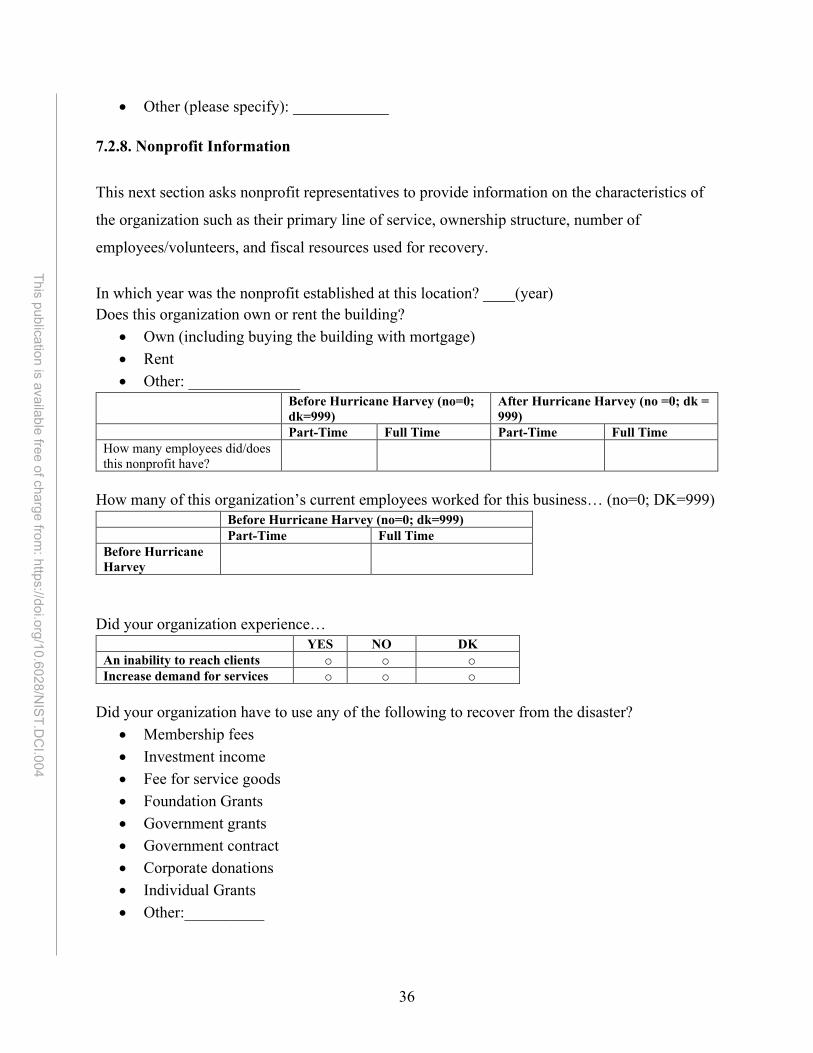
7.2.8. Nonprofit Information
This next section asks nonprofit representatives to provide information on the characteristics of
the organization such as their primary line of service, ownership structure, number of
employees/volunteers, and fiscal resources used for recovery.
In which year was the nonprofit established at this location? ____(year) Does this organization own or rent the building?
• Own (including buying the building with mortgage) • Rent • Other: ______________
Before Hurricane Harvey (no=0; dk=999)
After Hurricane Harvey (no =0; dk = 999)
Part-Time Full Time Part-Time Full Time How many employees did/does this nonprofit have?
How many of this organization’s current employees worked for this business… (no=0; DK=999)
Before Hurricane Harvey (no=0; dk=999) Part-Time Full Time Before Hurricane Harvey
Did your organization experience…
YES NO DK An inability to reach clients o o o Increase demand for services o o o
Did your organization have to use any of the following to recover from the disaster?
• Membership fees • Investment income • Fee for service goods • Foundation Grants • Government grants • Government contract • Corporate donations • Individual Grants • Other:__________
37
This publication is available free of charge from: https://doi.org/10.6028/N
IST.DC
I.004
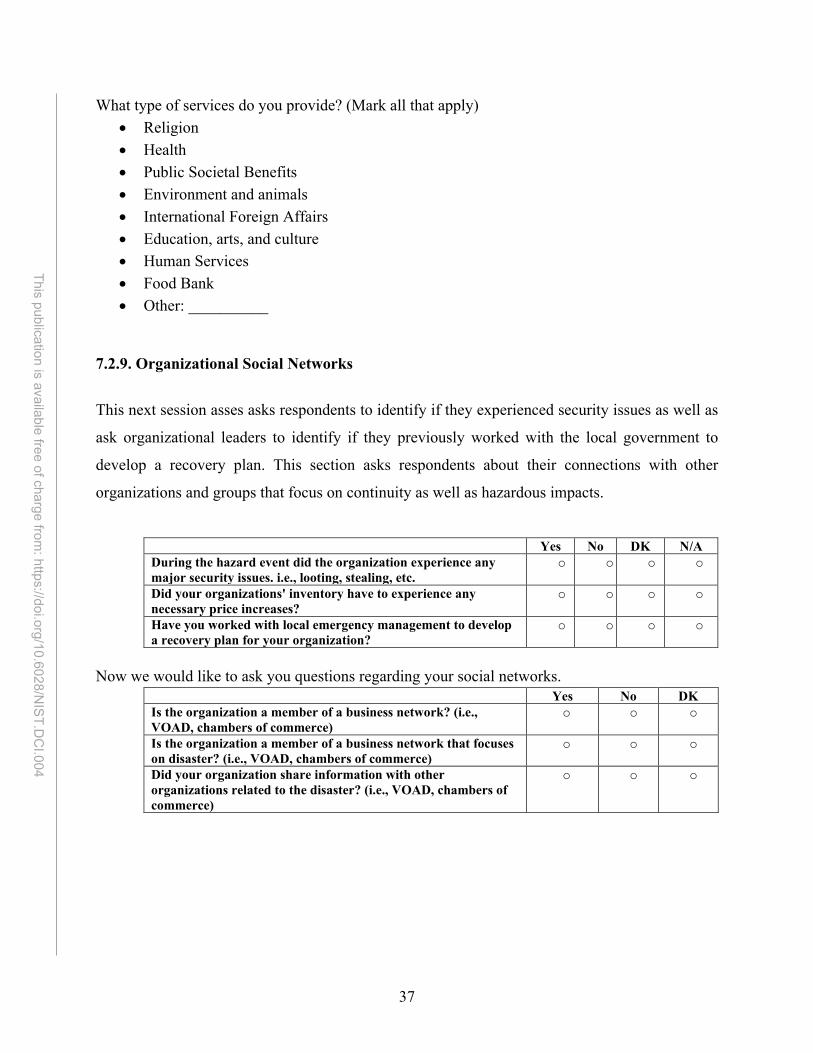
What type of services do you provide? (Mark all that apply) • Religion • Health • Public Societal Benefits • Environment and animals • International Foreign Affairs • Education, arts, and culture • Human Services • Food Bank • Other: __________
7.2.9. Organizational Social Networks
This next session asses asks respondents to identify if they experienced security issues as well as
ask organizational leaders to identify if they previously worked with the local government to
develop a recovery plan. This section asks respondents about their connections with other
organizations and groups that focus on continuity as well as hazardous impacts.
Yes No DK N/A During the hazard event did the organization experience any major security issues. i.e., looting, stealing, etc.
o o o o
Did your organizations' inventory have to experience any necessary price increases?
o o o o
Have you worked with local emergency management to develop a recovery plan for your organization?
o o o o
Now we would like to ask you questions regarding your social networks.
Yes No DK Is the organization a member of a business network? (i.e., VOAD, chambers of commerce)
o o o
Is the organization a member of a business network that focuses on disaster? (i.e., VOAD, chambers of commerce)
o o o
Did your organization share information with other organizations related to the disaster? (i.e., VOAD, chambers of commerce)
o o o
38
This publication is available free of charge from: https://doi.org/10.6028/N
IST.DC
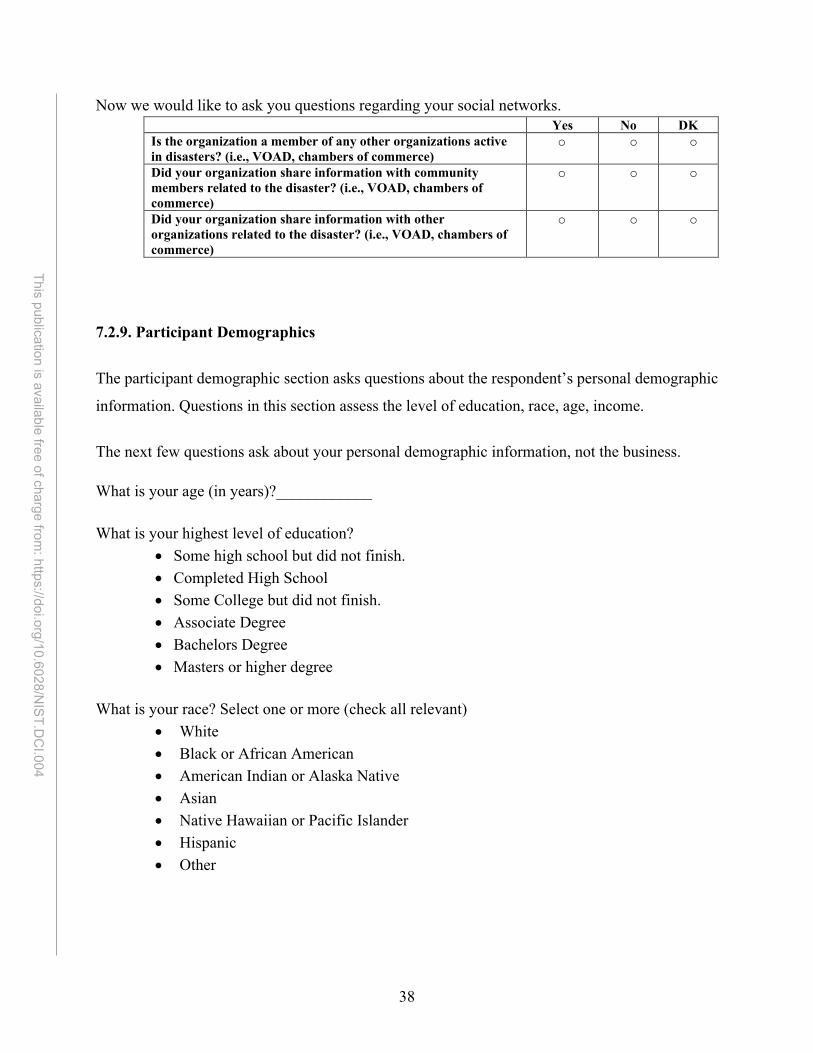
I.004
Now we would like to ask you questions regarding your social networks. Yes No DK Is the organization a member of any other organizations active in disasters? (i.e., VOAD, chambers of commerce)
o o o
Did your organization share information with community members related to the disaster? (i.e., VOAD, chambers of commerce)
o o o
Did your organization share information with other organizations related to the disaster? (i.e., VOAD, chambers of commerce)
o o o
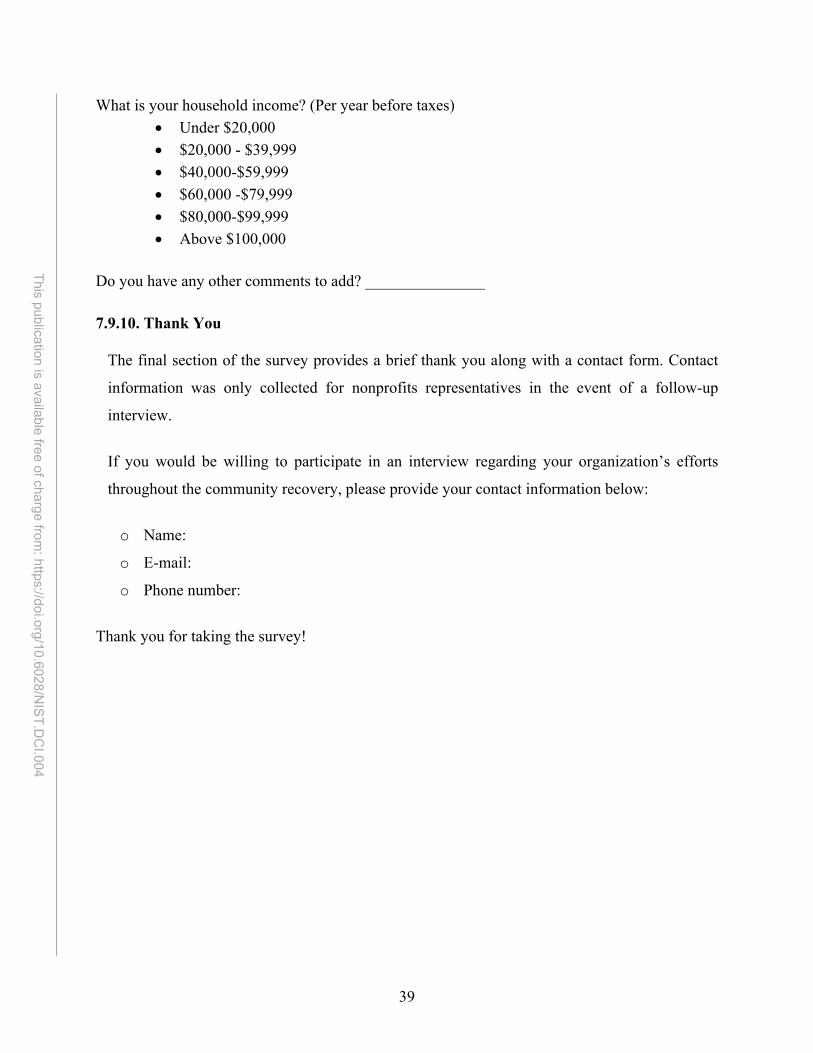
7.2.9. Participant Demographics
The participant demographic section asks questions about the respondent’s personal demographic
information. Questions in this section assess the level of education, race, age, income.
The next few questions ask about your personal demographic information, not the business. What is your age (in years)?____________ What is your highest level of education?
• Some high school but did not finish. • Completed High School • Some College but did not finish. • Associate Degree • Bachelors Degree • Masters or higher degree
What is your race? Select one or more (check all relevant)
• White • Black or African American • American Indian or Alaska Native • Asian • Native Hawaiian or Pacific Islander • Hispanic • Other
39
This publication is available free of charge from: https://doi.org/10.6028/N
IST.DC
I.004
What is your household income? (Per year before taxes) • Under $20,000 • $20,000 - $39,999 • $40,000-$59,999 • $60,000 -$79,999 • $80,000-$99,999 • Above $100,000
Do you have any other comments to add? _______________
7.9.10. Thank You
The final section of the survey provides a brief thank you along with a contact form. Contact
information was only collected for nonprofits representatives in the event of a follow-up
interview.
If you would be willing to participate in an interview regarding your organization’s efforts
throughout the community recovery, please provide your contact information below:
o Name:
o E-mail:
o Phone number:
Thank you for taking the survey!
40
This publication is available free of charge from: https://doi.org/10.6028/N
IST.DC
I.004
8. Data Collection Methodology 8.1. Training This project solicited support from eight undergraduate students, one master’s degree student, two
doctoral students, and two planning specialists. Each team member was required to attend a Survey
Bootcamp designed by co-author Joy Semien and complete the IRB-required CITI Human
Research Training program. The Survey Bootcamp provided instructions on survey administration
and data entry; this two-hour informational training consisted of one-hour practice scenarios and
a one-hour real survey practice. The Table of Contents for the associated Research Field Guide,
which provided over 100 pages of practical information and guidance can be found in Appendix
D; a full copy may be requested from the authors of this report.
8.2. Daily Data Collection
Field surveyors were tasked with administering surveys in the field for eight hours a day five days
a week for three weeks. Telephone surveyors were tasked with administering surveys over the
telephone throughout the fall 2020 semester (September-November). It was estimated that one
survey could be administered in thirty minutes. On average the surveyors completed approximately
seven to ten surveys each day.
Surveyors were encouraged to be well prepared prior to administering a survey. Surveyors’
supplies included electronic tablets, extra surveys, pens, note-pads leave-behind materials, and
survey cards. Electronic tablets were used to record the survey on Qualtrics, extra surveys and
pens were brought along in case of technical issues with the electronic tablets, and a notepad was
used to record surveyor notes. Survey cards, having shorten version of some survey questions,
were also carried along with the surveyors to help guide participants through survey questions.
These survey cards helped to reduce bias and survey fatigue as a result of the length of time it took
to orally disseminate survey questions. Survey cards were only used for in-person field survey
dissemination.
Field teams were required to stay in teams of two whereas one surveyor could serve as a notetaker,
and the other surveyor could serve as the administrator of the survey. Surveyors were heavily
encouraged to take consistent field notes incase discrepancies of entered data arise in the future.
41
This publication is available free of charge from: https://doi.org/10.6028/N
IST.DC
I.004
Surveyors used the rule of three to acquire samples from organizations visiting organizations three
times to obtain a respondent. If a respondent could not be obtained after visiting three times the
organization was replaced with a new possible sample of the same organization type.
Upon completing a survey, surveyors were encouraged to at once upload the survey over wi-fi into
a secured server. Completed forms were labeled:
(S) – Submitted online
(I) – Incomplete Survey
(C) – Complete but need online submission
In person field surveyors debriefed daily to discuss problems, concerns, possible changes, and
overall activity. Debriefing sessions also discussed: The types of businesses revisited, average time
it takes to administer the survey, swiftness, and effectiveness of the surveyor’s ability to administer
the survey, as well as the number of surveys completed. For telephone surveyors the debriefing
sessions were administered once a week, in which the principal investigator used a t-table to
discuss problems and solutions for administering the survey. Surveyors were encouraged to double
check the survey for completion being sure to check against missing answer choices.
8.3 Data Entry
This study used Qualtrics as a data collection tool to record survey responses on tablets. Students
were given a Qualtrics web link to the survey in which they recorded participant responses to all
survey questions. In addition, students were instructed to take detailed notes using a note-taking
outline (See Appendix A) and to enter completion data into an Excel-based document, shared on
the Google Drive platform. There was also a Business Communication Tracking master list
available (see Appendix E) to help the full team keep track of the status of each institution visited
and whether a survey had been completed.
42
This publication is available free of charge from: https://doi.org/10.6028/N
IST.DC
I.004
9. Conclusions and Lessons Learned
This study faced a wide range of challenges and was halted prior to completing the contact with
all originally sampled organizations. At the time of fieldwork pause, we had sampled 368
organizations out of the initial 500 total target organizations (300 non-profits and 200 businesses).
We contacted 265 organizations out of the 500 organizations attempted for contact. Of these 265
organizations, 90 organizations refused participation, 79 organizations asked us to revisit, and 96
organizations completed the surveys. Of the 96 organizations that completed the survey, 66 were
businesses and 30 were nonprofits. Small business respondents stated the ownership structure
primarily consisted of single owners, partnerships, and corporations. Of those responding 34%
indicated that they were a minority-owned businesses (i.e., racial-ethnic minority, woman, or
veteran-owned), and 69 % indicated that the were a minority-led nonprofit.
Limitations of the study design relative to external circumstances led to the early closure of the
study. The limitation was inclusive of compound hazard events like Hurricane Harvey, Tropical
Storm Imelda, an industrial spill, and COVID-19; Hurricane Laura also occurred post-data
collection closure. The multiple and compound disasters happening during data collection on a
topic that is about disaster impact and recovery trajectories created data collection challenges and
theoretical challenges. In terms of data collection, the team was able to adapt the way we
administered the survey questions to remind respondents to think about Hurricane Harvey,
opposed to other disaster events, like Imelda and the industrial spill.
Participants who encountered compound hazards had a difficult time differentiating between
hazard occurrences and attributable damage and interruptions. This lack of differentiation suggests
hazard researchers who focus on organizational disruptions and recovery specifically should
reconsider the implications of studying compound events, multiple events, and starting and
stopping data collection.
Adapting to the massive societal disruption from the COVID-19 pandemic proved to be more
challenging and was unprecedented. The resulting methodological and theoretical, as well as
practical concerns ultimately led to the decision to close the study early. In March 2020, data
collection was at full capacity and proceeding well. Data collection paused during the closure of
TAMU for two weeks at the start of the pandemic shutdown. Data collection remained paused as
43
This publication is available free of charge from: https://doi.org/10.6028/N
IST.DC
I.004
TAMU determining protocols for human subject research, which ultimately rescinded all research
travel and in-person data collection. At that time, telephone protocols were put into place to
contact all the sampled organizations. With the closures of most businesses across the state of
Texas and many primarily working from home, phone contact at the business location was
unsuccessful. The research team decided to remain paused, in hopes that the pandemic
transmission period would subside, and data collection could continue later in the summer of 2020.
By September of 2020, it was determined that this would not be possible and data collection
officially closed. Undergraduate students did, in the meantime, follow the sampled businesses on
their websites and Facebook to track their open/closure status during the pandemic.
Ethically, we also determined that closing data collection was necessary. Participating in disaster
research has been documented to be therapeutic for respondents (Legerski and Burnell, 2010;
Collogan, Tuma, Dlan-Sewell, Borja, and Fleschman, 2004). That statement, though, relates to
individuals who are interviewed after a disaster, whether during response or recovery. Interviewing
during the COVID-19 pandemic about disaster impacts and recovery for a different disaster
seemed ethically questionable – especially for small businesses and nonprofits that were closed
for an unforeseen amount of time, were experiencing overall uncertainty in their work and home
lives and were generally in crisis or survival mode. We determined it was best not to attempt
further contact while COVID-19 impacts were actively ongoing.
Theoretically, the pandemic introduced a large, compound hazard and recovery process that raises
questions not currently addressed in the hazards and disaster methods literature (Simonovic et al.,
2021; Ashraf, 2021; Quigley et al., 2021). COVID-19 is unique in terms of embodying aspects
characteristic of both acute and chronic disasters, which challenges theoretical paradigms well-
established in the literature, especially as it relates to organizational survival (Helgeson et al.,
2020).
We could not determine just how different subjects’ responses would be post-COVID-19 or during
COVID-19 compared to those collected before COVID-19. Would the study have to turn into a
natural experiment that would be more about COVID-19 than the original intent of recovery from
Hurricane Harvey? This methodological change would have been feasible if we knew that the
organizations were able to differentiate between Harvey (and Imelda and the industrial incident)
44
This publication is available free of charge from: https://doi.org/10.6028/N
IST.DC
I.004
and COVID-19 impacts and recovery. Would the ongoing pandemic have clouded the memory of
Harvey impacts and recovery? How would respondents assess the impact and recovery from
Harvey, now in light of the extreme and widespread damage of the pandemic closures? We could
not determine that the data collected before the pandemic and after the pandemic would be
comparable or that the questions themselves would provide reliable and valid measures of recovery
trajectories associated with Harvey considering the significant change in the social context.
These methodological, ethical, and theoretical issues call for additional research on and expansion
of disaster research methods when the subjects are dealing with complex events that are not easy
disentangled (i.e., undergoing or have gone through compound, complex, and sequential disasters).
Methodologically, the question is whether subjects can accurately report the impacts and recovery
to the different events in one instrument or data collection process? Having secondary data to
confirm subjects’ responses could provide validity and reliability checks for measures in such
studies. Also, rapid response research that is completed within days of the disaster and then
conducted longitudinally following the next disaster – though hard to predict – would be needed
to check changes in subjects’ responses following compound and sequential events. Both of these
call for much larger investments of research funding for teams of researchers across the country
who can quickly enter the field and have the resources for longitudinal follow-ups. It also calls for
the need to have core data collection protocols and instruments in place that are easily adjusted
based on the event type and location.
This study calls for additional research on research ethics, specifically subjects’ experiences in
research studies in disaster settings. Questions remain around the burden of research sampling on
subjects – who are free to decline participation – but nonetheless are interrupted during their
response or recovery. Questions also remain as to how respondents who represent organizations
like businesses and nonprofits feel about study participation in comparison to individuals affected
by disaster directly, such as households. Finally, if we want to reduce burden on respondents, this
means added coordination between researchers and institutions so that subjects are not sampled
multiple times for different, but similar studies. Especially knowing that in the current modern
society, individuals and organizational representatives are surveyed and researched numerous
times by academics, private organizations, media polls, and many others, we must continue to find
ways to coordinate research studies to limit this burden.
45
This publication is available free of charge from: https://doi.org/10.6028/N
IST.DC
I.004
Beyond this large challenge of the complexity surrounding multiple disasters, limitations also
included other data collection challenges. We found that higher response rates to the survey were
often received from businesses as compared to nonprofits. As a result, we adapted nonprofit data
collection to a more inductive qualitative interview strategy. This does reduce direct comparability
of results between businesses and nonprofits as many nonprofits did not complete the same
structured survey data collection instrument. In administering the survey, we found that those
organizational operators approached on Mondays and Fridays had a higher rate of refusal or made
more requests to return on a different day in contrast to the middle days of the workweek (i.e.,
Tuesday, Wednesday, and Thursday).
While the limitations of this study were challenging, this research laid the groundwork for
continuing studies that address some of these theoretical and methodological questions. The
research team secured funding to return to the sampled organizations in this study with follow-up
questions following COVID-19. This data collection began in March 2021. Those data will be
compared with additional responses from the part of the sample that was not reached pre-COVID-
19 and add additional study areas surrounding Lake Charles, Louisiana which was affected by
Hurricane Laura during the pandemic. Using similar survey instruments, we will look for
challenges faced by organizations that had already experienced Hurricane Harvey before the
pandemic as well as those that were undergoing pandemic disruption when Hurricane Laura
occurred.
46
This publication is available free of charge from: https://doi.org/10.6028/N
IST.DC
I.004
References
Aeberhard, P. (2008). Expectations are Changing for Disaster Relief. Nonprofit and Voluntary
Sector Quarterly. 37(1_suppl), 17S-24S.
Alesch, D. J., Holly, J. N., Mittler, E., and Nagy, R. (2001). Organizations at Risk: What
Happens When Small Businesses and Not-for-profits Encounter Natural Disasters. Public Entity
Risk Institute. 1-116
Aldrich, H., and Auster, E. R. (1986). Even Dwarfs Started Small: Liabilities of Age and Size
and Their Strategic Implications. Research in Organizational Behavior, 8, 165-198.
Ashraf, A. (2021). Lessons Learned from COVID-19 Response for Disaster Risk Management.
Natural Hazards, 107(2), 2027-2032.
Blake, E. S., and Zelinsky, D. A. (2018). National Hurricane Center Tropical Cyclone Report:
Hurricane Harvey. NOAA/NWS Rep. Al092017,
https://www.nhc.noaa.gov/data/tcr/AL092017_Harvey.pdf.
Bolin, R. C., and Bolton, P. A. (1986). Race, Religion, and Ethnicity in Disaster Recovery.
University of Colorado Natural Hazard Center Collection, 254-265.
Bourque, L. B., Regan, R., Kelley, M. M., Wood, M. M., Kano, M., and Mileti, D. S. (2013). An
Examination of the Effect of Perceived Risk on Preparedness Behavior. Environment and
Behavior. 45(5), 615-649.
Bullard, R. D., and Wright, B. (Eds.). (2009). Race, Place, and Environmental Justice After
Hurricane Katrina: Struggles to Reclaim, Rebuild, and Revitalize New Orleans and the Gulf
Coast. Perseus Books.
Center for Disease Control (CDC). (2021). CDC timeline. Retrieved February 16, 2021, from
https://www.cdc.gov/museum/timeline/index.html
47
This publication is available free of charge from: https://doi.org/10.6028/N
IST.DC
I.004
Chamlee-Wright, E., and Storr, V. H. (2011). Social Capital as Collective Narratives and Post-
Disaster Community Recovery. The Sociological Review. 59(2), 266-282.
Chikoto, G. L., Sadiq, A. A., and Fordyce, E. (2013). Disaster Mitigation and Preparedness:
Comparison of Nonprofit, Public, and Private Organizations. Nonprofit and Voluntary Sector
Quarterly, 42(2), 391-410.
Chikoto-Schultz, G. L., Russo, A., Manson, P., and White, J. (2018). Oregon Nonprofit Disaster
Preparedness: Finding from the 2018 Survey. The Nonprofit Institute Research. 2.
https://pdxscholar.library.pdx.edu/npi_research/2
Clay, P. M., Colburn, L. L., and Seara, T. (2016). Social bonds and recovery: An analysis of
Hurricane Sandy in the first year after landfall. Marine Policy. 74, 334-340.
Collogan, L. K., Tuma, F., Dolan-Sewell, R., Borja, S., and Fleischman, A. R. (2004). Ethical
issues pertaining to research in the aftermath of a disaster. Journal of Traumatic Stress. 17(5),
363-372.
Dahlhamer, J. M., and D'Souza, M. J. (1997). Determinants of Business Disaster Preparedness in
Two US Metropolitan Areas. Preliminary Papers 224. The University of Delaware Disaster
Research Center. http://udspace.udel.edu/handle/19716/632
Dahlhamer, J. M., and Tierney, K. J. (1996). Winners and losers: predicting business disaster
recovery outcomes following the Northridge earthquake. Presented at the Annual Meeting of the
American Sociological Association. Toronto, Ontario, Canada.
Dahlhamer, J. M., and Tierney, K. J. (1998). Rebounding from disruptive events: business
recovery following the Northridge earthquake. Sociological Spectrum. 18(2), 121-141.
Dahlhamer, J. M., Tierney, K. J., and Webb, G. R. (1999). Predicting Business Financial Losses
in the 1989 Loma Prieta and 1994 Northridge Earthquakes: Implications for Loss Estimation
Research. Preliminary Paper 282. The University of Delaware Disaster Research Center.
http://udspace.udel.edu/handle/19716/664
48
This publication is available free of charge from: https://doi.org/10.6028/N
IST.DC
I.004
Dillman, D. A. (1978). Mail and Telephone Surveys: The Total Design Method (Vol. 19). New
York: Wiley.
Dillman, D. A. (2000). Procedures for conducting government-sponsored establishment surveys:
Comparisons of the total design method (TDM), a traditional cost-compensation model, and
tailored design. In Proceedings of American Statistical Association, Second International
Conference on Establishment Surveys (pp. 343-352).
Dillman, D. A., Smyth, J. D., and Christian, L. M. (2014). Internet, Phone, Mail, and Mixed-
mode Surveys: The Tailored Design Method. John Wiley and Sons.
Durkin, M. E. (1985). The behavior of Building Occupants in Earthquakes. Earthquake spectra.
1(2), 271-283.
Dwyer, C. (2019). Port Neches Residents Asked to Leave Their Homes Near Site of Plant
Explosion. National Public Radio. Retrieved February 16, 2021, from
https://www.npr.org/2019/12/05/785023209/port-neches-residents-asked-to-leave-their-homes-
near-site-of-plant-explosion
FEMA. (2017). 2017 Hurricane Season FEMA After Action Report. Retrieved October 08, 2020,
from https://www.fema.gov/sites/default/files/2020-08/fema_hurricane-season-after-action-
report_2017.pdf.
Flatt, V. B., and Stys, J. (2013). Long-term Recovery in Disaster Response and the Role of
Nonprofits. Oñati Socio-Legal Series, 3(2), Available at
SSRN: https://ssrn.com/abstract=2119879.
Fowler, K. L., Kling, N. D., and Larson, M. D. (2007). Organizational Preparedness for Coping
with a Major Crisis or Disaster. Business and Society. 46(1), 88-103.
49
This publication is available free of charge from: https://doi.org/10.6028/N
IST.DC
I.004
Gajewski, S., Bell, H., Lein, L., and Angel, R. J. (2011). Complexity and Instability: The
Response of Nongovernmental Organization Organizations to the Recovery Of Hurricane
Katrina Survivors in a Host Community. Nonprofit and Voluntary Sector Quarterly. 40, 389-403.
Haynes, G. W., Danes, S. M., Schrank, H. L., and Lee, Y. (2019). Survival and Success of
Family‐Owned Small Businesses After Hurricane Katrina: Impact of Disaster Assistance and
Adaptive Capacity. Journal of Contingencies and Crisis Management. 27(2), 130-144.
Helgeson, J. F., Pierel, E. D., and Dow, K. (2020). NIST-NOAA Survey Instrument for Business
Disruption and Recovery Associated with Extreme Events: General Instrument Applied to the
Greater Charleston, SC Small-and Medium-Sized Business Community Post-Hurricane Irma.
Retrieved May 16, 2021, from https://nvlpubs.nist.gov/nistpubs/dci/NIST.DCI.001.pdf.
Helgeson, J. , Fung, J. , Zhang, Y. , Roa, A. , Zycherman, A. , Nierenberg, C. , Butry, D. and
Ramkissoon, D. (2020), Eliciting Lessons from Small- and Medium-Sized Enterprises (SMEs)
for Natural Disaster Resilience Planning and Recovery During the COVID-19 Pandemic: SME
Complex Event Resilience, National Institute of Standards and Technology, Gaithersburg, MD.
Retrieved May 16, 2021, from https://doi.org/10.6028/NIST.DCI.002.
Highfield, W. E., Peacock, W. G., and Van Zandt, S. (2014). Mitigation Planning: Why Hazard
Exposure, Structural Vulnerability, and Social Vulnerability Matter. Journal of Planning
Education and Research. 34(3), 287-300.
InfoGroup. (2017). List of Businesses in Beaumont and Port Arthur. ReferenceUSA. Retrieved
from referenceusa.com. May 26, 2019.
Jenkins, P., Lambeth, T., Mosby, K., and Van Brown, B. (2015). Local Nonprofit Organizations
in a post-Katrina Landscape: Help in a Context of Recovery. American Behavioral Scientist.
59(10), 1263-1277.
Joshi, P. (2010). Faith-based and Community Organizations' Participation in Emergency
Preparedness and Response Activities. Institute for Homeland Security Solutions. Retrieved
50
This publication is available free of charge from: https://doi.org/10.6028/N
IST.DC
I.004
September 1, 2019 from, https://www.fema.gov/sites/default/files/2020-03/fema_faith-
communities_desk-study-final-report_1.pdf.
Kapucu, Naim. 2001. Nonprofit Response to Catastrophic Disasters. 2008. Collaborative
Emergency Management: Better Community Organizing, Better Public Preparedness, and
Response. Disasters. 32(2): 239-262.
Kapucu, N. (2007). Non‐profit Response to Catastrophic Disasters. Disaster Prevention and
Management: An International Journal, 16(4), 551-561.
Kapucu, N., Yuldashev, F., and Feldheim, M. A. (2011). Nonprofit Organizations in Disaster
Response and Management: A Network Analysis. European Journal of Economic and Political
Studies. 4(1), 83-112.
Legerski, J. P., and Bunnell, S. L. (2010). The Risks, Benefits, and Ethics of Trauma-focused
Research Participation. Ethics and Behavior. 20(6), 429-442.
Loscocco, K. A., and Robinson, J. (1991). Barriers to Women's Small-business Success in the
United States. Gender and Society. 5(4), 511-532.
Loscocco, K. A., Robinson, J., Hall, R. H., and Allen, J. K. (1991). Gender and Small Business
Success: An Inquiry into Women's Relative Disadvantage. Social forces. 70(1), 65-85.
Latto, A., and Berg, R. (2019). Tropical Storm Imelda. Retrieved February 15, 2021, from
https://www.nhc.noaa.gov/data/tcr/AL112019_Imelda.pdf.
Marshall, M. I., and Schrank, H. L. (2014). Small Business Disaster Recovery: A Research
Framework. Natural Hazards. 72(2), 597-616.
Marshall, M. I., Niehm, L. S., Sydnor, S. B., and Schrank, H. L. (2015). Predicting Small
Business Demise after a Natural Disaster: An Analysis of Pre-existing Conditions. Natural
Hazards. 79(1), 331-354.
51
This publication is available free of charge from: https://doi.org/10.6028/N
IST.DC
I.004
Miller, D. S., and Rivera, J. D. (2007). Landscapes of disaster and Place Orientation in the
Aftermath of Hurricane Katrina. In Brunsma, D. L., Overfelt, D., & Picou, J. S. (Eds). The
Sociology of Katrina: Perspectives on a Modern Catastrophe (pp. 141-154), Lanham, MD:
Rowman & Littlefield Publishers.
NOAA. (2018). Hurricanes and Tropical Storms - Annual 2018. Retrieved Aug. 25, 2020, from
https://www.ncdc.noaa.gov/sotc/tropical-cyclones/201813.
NOAA. (2018). National Hurricane Center Tropical Cyclone Report Hurricane Harvey.
Retrieved October 08, 2020, from
https://www.nhc.noaa.gov/data/tcr/AL092017_Harvey.pdfNHCCPHC.
Perry, R. W. (2007). What is a disaster? In H. Rodríguez, E. L. Quarantelli, & R. R. Dynes
(Eds.), Handbook of Disaster Research (pp. 1-15). Springer, New York, NY.
Quigley, M. C., Attanayake, J., King, A., and Prideaux, F. (2020). A Multi-hazards Earth
Science Perspective on the COVID-19 Pandemic: The Potential for Concurrent and Cascading
Crises. Environment Systems and Decisions. 40, 199-215.
Rivera, J. D., and Nickels, A. E. (2014). Social Capital, Community Resilience, and Faith‐based
Organizations in Disaster Recovery: A case study of Mary Queen of Vietnam Catholic Church.
Risk, Hazards, and Crisis in Public Policy. 5(2), 178-211.
Rufat, S., Tate, E., Burton, C. G., and Maroof, A. S. (2015). Social Vulnerability to Floods:
Review of Case Studies and Implications for Measurement. International Journal of Disaster
Risk Reduction. 14, 470-486.
Scandlyn, J., Thomas, D. S. K. and Brett, J. (2013). “Theoretical Framing of Worldviews,
Values, and Structural Dimensions of Disasters.” Pp. 33-56 in Social Vulnerability to Disasters,
2nd ed., edited by D. S. K. Thomas, B. D. Phillips, W. E. Lovekamp, and A. Fothergill. Boca
Raton, FL: CRC Press.
52
This publication is available free of charge from: https://doi.org/10.6028/N
IST.DC
I.004
Schrank, H.L., Marshall, M.I., Hall-Philips, A., Wiatt, R.F., and Jones, N.E. (2013) Small
Business Demise and Recovery after Katrina: Rate of Survival and Demise. Natural Hazards.
65, 2353–2374.
Simonovic, S. P., Kundzewicz, Z. W., and Wright, N. (2021). Floods and the COVID‐19
Pandemic—A new Double Hazard Problem. Wiley Interdisciplinary Reviews: Water. 8(2),
e1509.
Singh, J. V., and Lumsden, C. J. (1990). Theory and Research in Organizational Ecology.
Annual review of sociology. 16(1), 161-195.
Smith, G. and Birkland, T. (2012). Building a Theory of Recovery: Institutional Dimensions.
International Journal of Mass Emergencies and Disasters. 30(2), 147-170.
Stinchcombe, A. (1965). Organization-creating Organizations. Society. 2(2), 34-35.
Tierney, K. J. (1997a). Impacts of Recent Disasters on businesses: The 1993 Midwest Floods
and the 1994 Northridge Earthquake', in Jones, B.G. (Ed.), Economic Consequences of
Earthquakes: Preparing for the Unexpected. National Center for Earthquake Engineering
Research, Buffalo. (pp. 189-238).
Tierney, K. J. (1997b). Business Impacts of the Northridge Earthquake. Journal of Contingencies
and Crisis Management. 5(2), 87–97.
Tierney, K. J. (2007). Businesses and Disasters: Vulnerability, Impacts, and Recovery. In H.
Rodríguez, E. L. Quarantelli, & R. R. Dynes (Eds.), Handbook of Disaster Research. (pp. 275-
296). Springer, New York, NY.
Tierney, K. J. (1999). Toward a Critical Sociology of Risk. Sociological Forum. 14(2), 215-242.
Tierney, K. J., and Dahlhamer, J. M. (1997). Business Disruption, Preparedness, and Recovery:
Lessons from the Northridge Earthquake. Preliminary Papers 257. The University of Delaware
Disaster Research Center. http://udspace.udel.edu/handle/19716/657
53
This publication is available free of charge from: https://doi.org/10.6028/N
IST.DC
I.004
Watson, M., Xiao, Y., Helgeson, J., and Dillard, M. (2020). Importance of Households in
Business Disaster Recovery. Natural Hazards Review. 21(4), 05020008.
Webb, G. R., Tierney, K. J., and Dahlhamer, J.M. (2000). Businesses and Disasters: Empirical
Patterns and Unanswered Questions. Natural Hazards Review. 1(2): 83-90.
Webb, G. R., Tierney, K. J., and Dahlhamer, J. M. (2002). Predicting Long-term Business
Recovery from Disaster: a Comparison of the Loma Prieta Earthquake and Hurricane Andrew.
Global Environmental Change Part B: Environmental Hazards. 4(2), 45-58.
Winter, M., Danes, S. M., Koh, S. K., Fredericks, K., and Paul, J. J. (2004). Tracking Family
Businesses and their Owners Over Time: Panel Attrition, Manager Departure, and Business
Demise. Journal of Business Venturing. 19(4), 535-559.
Xiao, Y. (2011). Local Economic Impacts of Natural Disasters. Journal of Regional Science.
51(4), 804-820.
Xiao, Y., and Drucker, J. (2013). Does Economic Diversity Enhance Regional Disaster
Resilience? Journal of the American Planning Association. 79(2), 148-160.
Xiao, Y., and Nilawar, U. (2013). Winners and Losers: Analyzing Post‐disaster Spatial
Economic Demand Shift. Disasters. 37(4), 646-668.
Xiao, Y., and Peacock, W. G. (2014). Do Hazard Mitigation and Preparedness Reduce Physical
Damage to Businesses in Disasters? Critical Role of Business Disaster Planning. Natural
Hazards Review. 15(3), 04014007.
Xiao, Y., Wu, K., Finn, D., and Chandrasekhar, D. (2018). Community Businesses as Social
Units in Post-Disaster Recovery. Journal of Planning Education and Research.
0739456X18804328.
Xiao, Y., and Van Zandt, S. (2012). Building Community Resiliency: Spatial Links between
Household and Business Post-Disaster Return. Urban Studies 49(11): 2523-2542.
54
This publication is available free of charge from: https://doi.org/10.6028/N
IST.DC
I.004
Xiao, Y., Watson, M., Helgeson, J., Farokhnia, K., van de Lindt, J., Mitrani-Reiser, J., Sutley, E.,
Deniz, D., Tomiczek, T., Barbosa, A., Fung, J., Nofal, O., and Koliou, M. (2020). Business
Survey Instrument, January 19, 2018: Wave 2. In A Longitudinal Community Resilience Focused
Technical Investigation of the Lumberton, North Carolina Flood of 2016. DesignSafe-
CI. https://doi.org/10.17603/ds2-f9kt-fm93.
Zhang, Y., Lindell, M. K., and Prater, C. S. (2009). The Vulnerability of Community Businesses
to Environmental Disasters. Disasters. 33(1), 38-57.
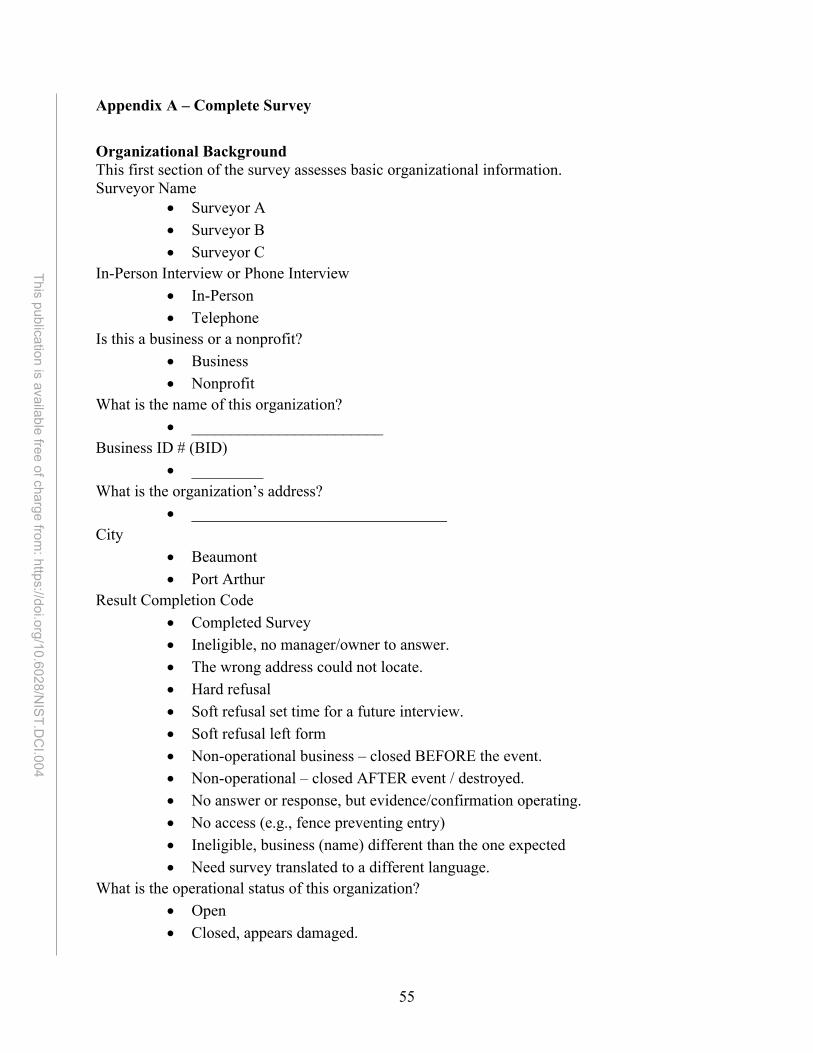
55
This publication is available free of charge from: https://doi.org/10.6028/N
IST.DC
I.004
Appendix A – Complete Survey
Organizational Background This first section of the survey assesses basic organizational information. Surveyor Name
• Surveyor A • Surveyor B • Surveyor C
In-Person Interview or Phone Interview • In-Person • Telephone
Is this a business or a nonprofit? • Business • Nonprofit
What is the name of this organization? • ________________________
Business ID # (BID) • _________
What is the organization’s address? • ________________________________
City • Beaumont • Port Arthur
Result Completion Code • Completed Survey • Ineligible, no manager/owner to answer. • The wrong address could not locate. • Hard refusal • Soft refusal set time for a future interview. • Soft refusal left form • Non-operational business – closed BEFORE the event. • Non-operational – closed AFTER event / destroyed. • No answer or response, but evidence/confirmation operating. • No access (e.g., fence preventing entry) • Ineligible, business (name) different than the one expected • Need survey translated to a different language.
What is the operational status of this organization? • Open • Closed, appears damaged.
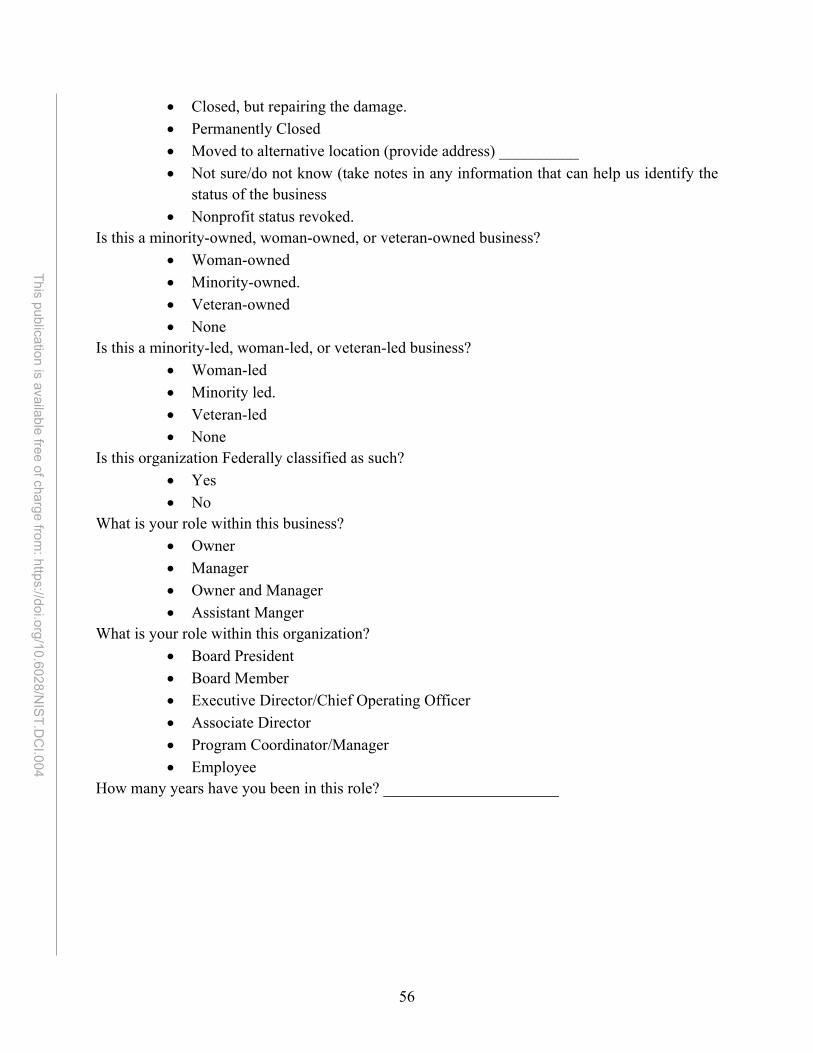
56
This publication is available free of charge from: https://doi.org/10.6028/N
IST.DC
I.004
• Closed, but repairing the damage. • Permanently Closed • Moved to alternative location (provide address) __________ • Not sure/do not know (take notes in any information that can help us identify the
status of the business • Nonprofit status revoked.
Is this a minority-owned, woman-owned, or veteran-owned business? • Woman-owned • Minority-owned. • Veteran-owned • None
Is this a minority-led, woman-led, or veteran-led business? • Woman-led • Minority led. • Veteran-led • None
Is this organization Federally classified as such? • Yes • No
What is your role within this business? • Owner • Manager • Owner and Manager • Assistant Manger
What is your role within this organization? • Board President • Board Member • Executive Director/Chief Operating Officer • Associate Director • Program Coordinator/Manager • Employee
How many years have you been in this role? ______________________
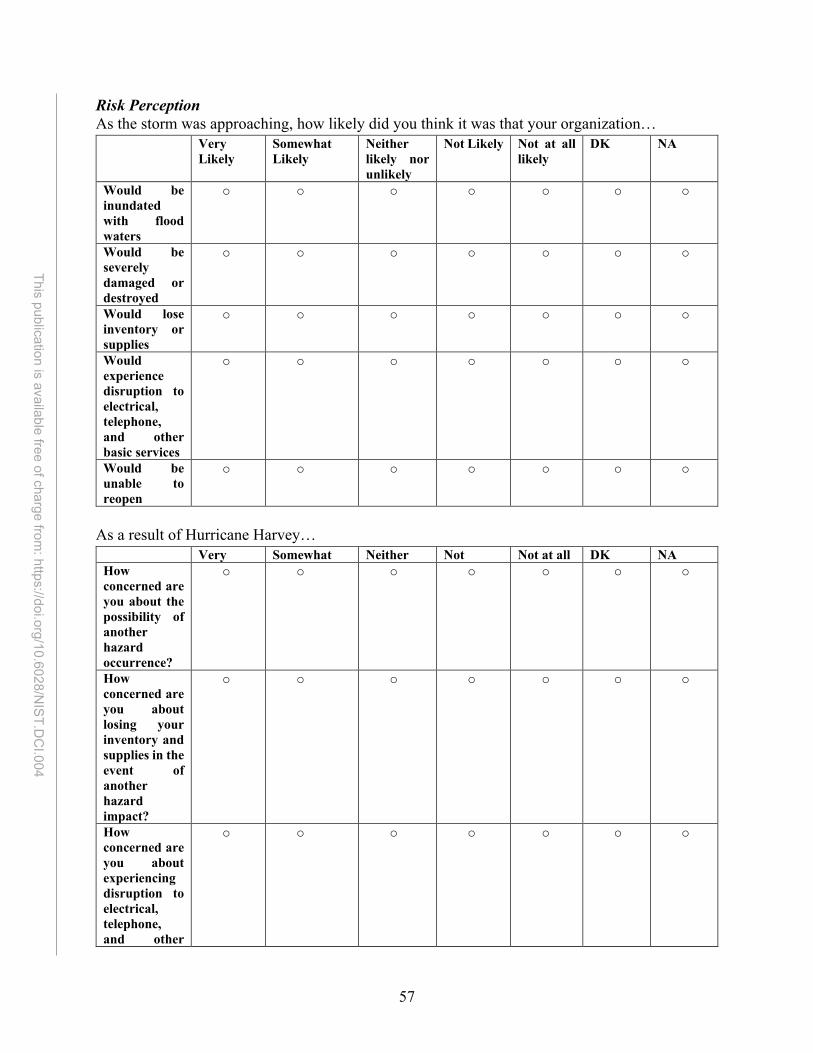
57
This publication is available free of charge from: https://doi.org/10.6028/N
IST.DC
I.004
Risk Perception As the storm was approaching, how likely did you think it was that your organization…
Very Likely
Somewhat Likely
Neither likely nor unlikely
Not Likely Not at all likely
DK NA
Would be inundated with flood waters
o o o o o o o
Would be severely damaged or destroyed
o o o o o o o
Would lose inventory or supplies
o o o o o o o
Would experience disruption to electrical, telephone, and other basic services
o o o o o o o
Would be unable to reopen
o o o o o o o
As a result of Hurricane Harvey…
Very Somewhat Neither Not Not at all DK NA How concerned are you about the possibility of another hazard occurrence?
o o o o o o o
How concerned are you about losing your inventory and supplies in the event of another hazard impact?
o o o o o o o
How concerned are you about experiencing disruption to electrical, telephone, and other
o o o o o o o
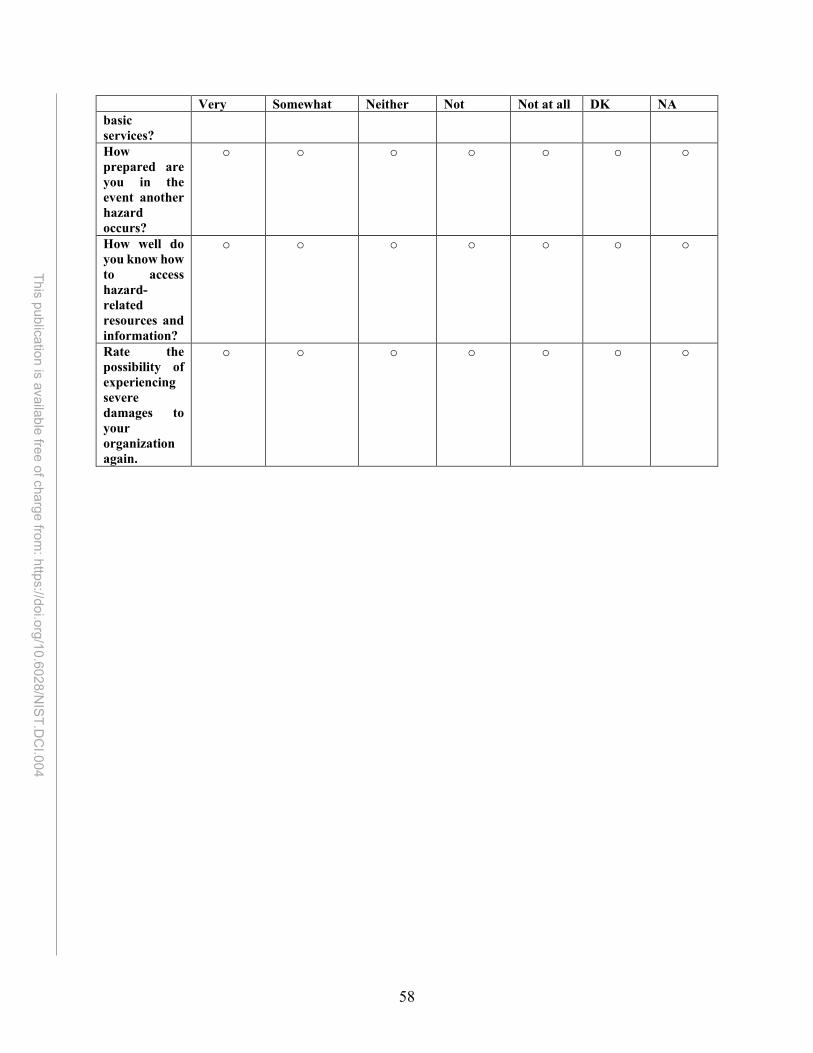
58
This publication is available free of charge from: https://doi.org/10.6028/N
IST.DC
I.004
Very Somewhat Neither Not Not at all DK NA basic services? How prepared are you in the event another hazard occurs?
o o o o o o o
How well do you know how to access hazard-related resources and information?
o o o o o o o
Rate the possibility of experiencing severe damages to your organization again.
o o o o o o o
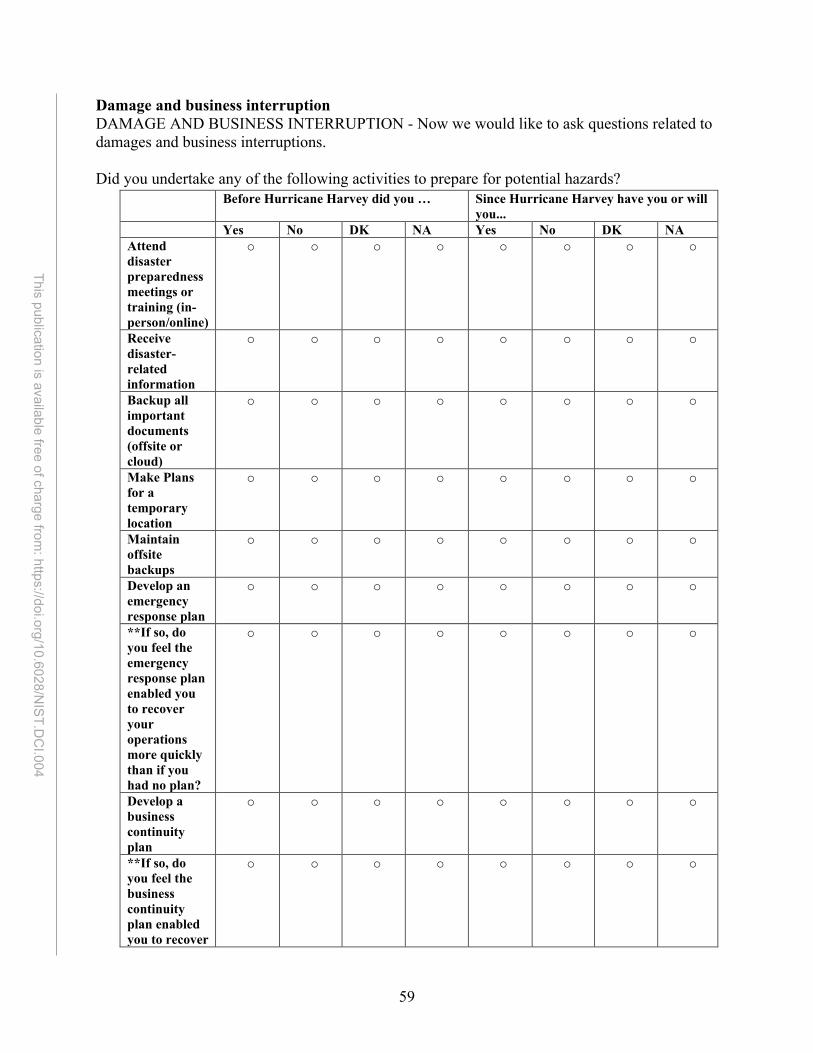
59
This publication is available free of charge from: https://doi.org/10.6028/N
IST.DC
I.004
Damage and business interruption DAMAGE AND BUSINESS INTERRUPTION - Now we would like to ask questions related to damages and business interruptions. Did you undertake any of the following activities to prepare for potential hazards?
Before Hurricane Harvey did you … Since Hurricane Harvey have you or will you...
Yes No DK NA Yes No DK NA Attend disaster preparedness meetings or training (in-person/online)
o o o o o o o o
Receive disaster-related information
o o o o o o o o
Backup all important documents (offsite or cloud)
o o o o o o o o
Make Plans for a temporary location
o o o o o o o o
Maintain offsite backups
o o o o o o o o
Develop an emergency response plan
o o o o o o o o
**If so, do you feel the emergency response plan enabled you to recover your operations more quickly than if you had no plan?
o o o o o o o o
Develop a business continuity plan
o o o o o o o o
**If so, do you feel the business continuity plan enabled you to recover
o o o o o o o o
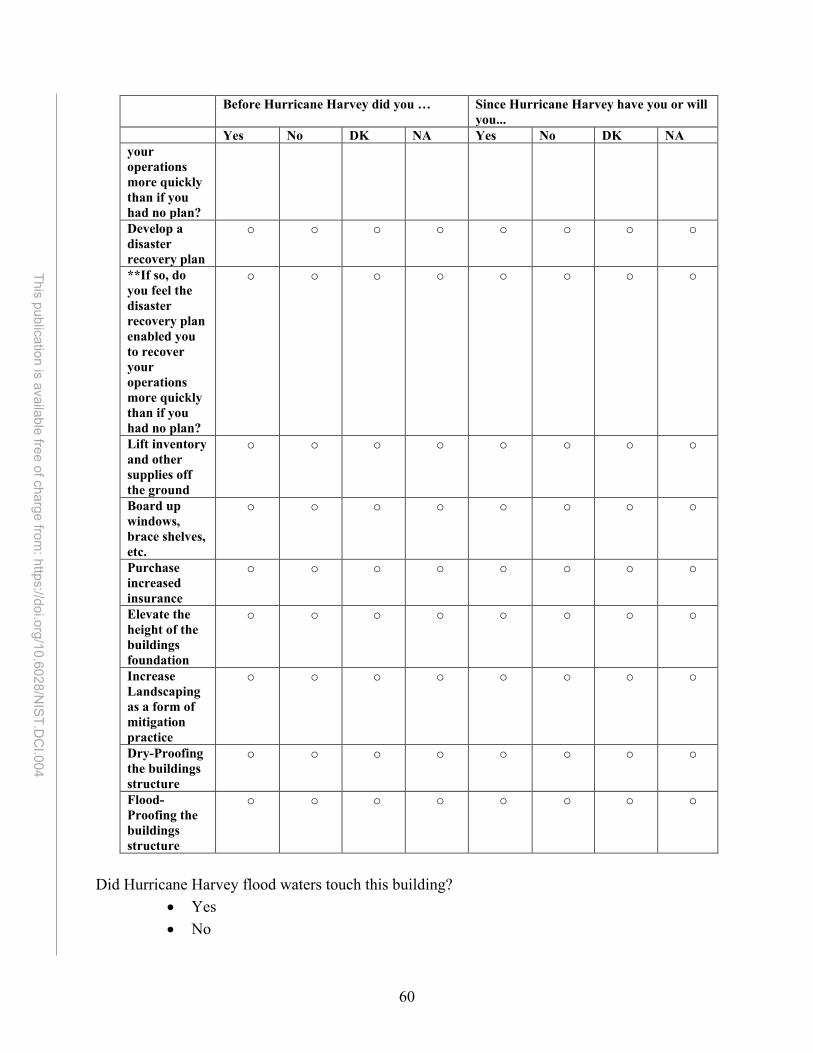
60
This publication is available free of charge from: https://doi.org/10.6028/N
IST.DC
I.004
Before Hurricane Harvey did you … Since Hurricane Harvey have you or will you...
Yes No DK NA Yes No DK NA your operations more quickly than if you had no plan? Develop a disaster recovery plan
o o o o o o o o
**If so, do you feel the disaster recovery plan enabled you to recover your operations more quickly than if you had no plan?
o o o o o o o o
Lift inventory and other supplies off the ground
o o o o o o o o
Board up windows, brace shelves, etc.
o o o o o o o o
Purchase increased insurance
o o o o o o o o
Elevate the height of the buildings foundation
o o o o o o o o
Increase Landscaping as a form of mitigation practice
o o o o o o o o
Dry-Proofing the buildings structure
o o o o o o o o
Flood- Proofing the buildings structure
o o o o o o o o
Did Hurricane Harvey flood waters touch this building?
• Yes • No
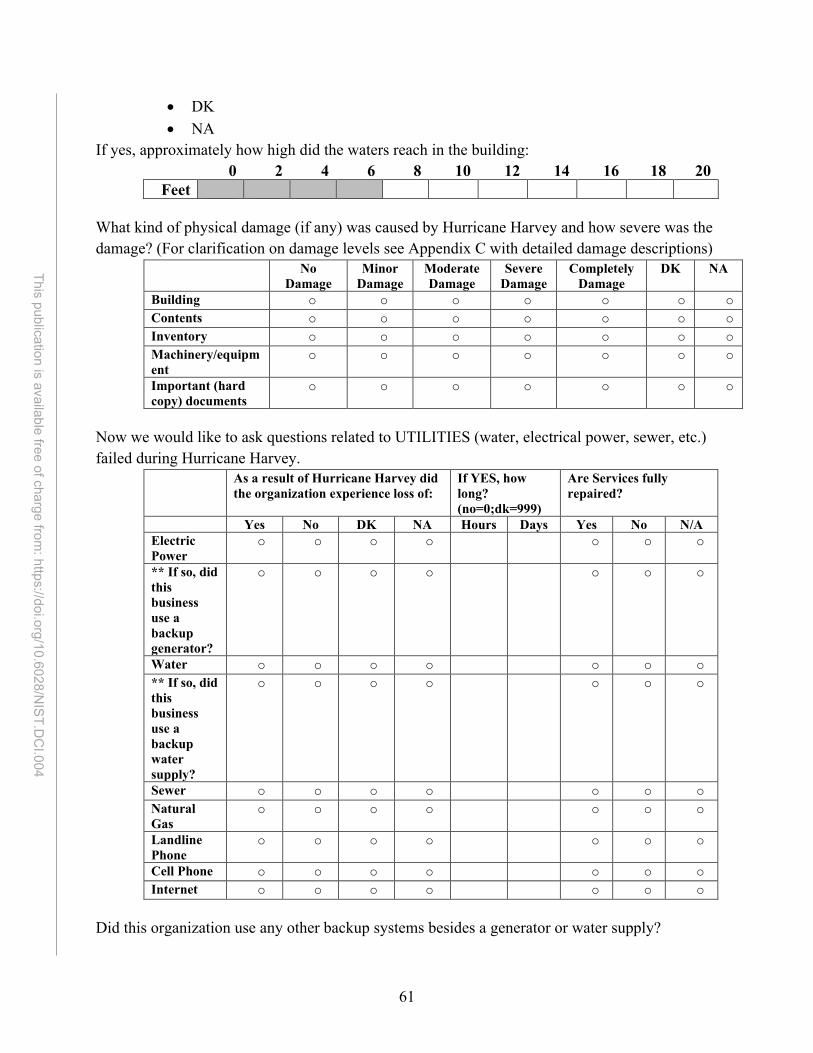
61
This publication is available free of charge from: https://doi.org/10.6028/N
IST.DC
I.004
• DK • NA
If yes, approximately how high did the waters reach in the building: 0 2 4 6 8 10 12 14 16 18 20
Feet What kind of physical damage (if any) was caused by Hurricane Harvey and how severe was the damage? (For clarification on damage levels see Appendix C with detailed damage descriptions)
No Damage
Minor Damage
Moderate Damage
Severe Damage
Completely Damage
DK NA
Building o o o o o o o Contents o o o o o o o Inventory o o o o o o o Machinery/equipment
o o o o o o o
Important (hard copy) documents
o o o o o o o
Now we would like to ask questions related to UTILITIES (water, electrical power, sewer, etc.) failed during Hurricane Harvey.
As a result of Hurricane Harvey did the organization experience loss of:
If YES, how long? (no=0;dk=999)
Are Services fully repaired?
Yes No DK NA Hours Days Yes No N/A Electric Power
o o o o o o o
** If so, did this business use a backup generator?
o o o o o o o
Water o o o o o o o ** If so, did this business use a backup water supply?
o o o o o o o
Sewer o o o o o o o Natural Gas
o o o o o o o
Landline Phone
o o o o o o o
Cell Phone o o o o o o o Internet o o o o o o o
Did this organization use any other backup systems besides a generator or water supply?
62
This publication is available free of charge from: https://doi.org/10.6028/N
IST.DC
I.004
• Yes • No • DK
If [yes] please describe __________________________ Immediately after Hurricane Harvey, operations were at what level of capacity?
• Full Capacity • Half Capacity • Partial Capacity • Operations Completely Ceased
How long did it take for your organization to resume operations (in days)? (dk=999) _______________________________ As a result of Hurricane Harvey has the business gross revenue
• Decreased Greatly • Decreased Slightly • Stayed the Same • Increased Slightly • Increased Greatly
Has the organization donations and/or external funding… • Decreased Greatly • Decreased Slightly • Stayed the Same • Increased Slightly • Increased Greatly
Now we would like to ask you about any accessibility problems that this business experienced… Now we would like to ask you about any accessibility problems that this business experienced.
If [YES] How long? (no=0;dk=999)
Yes NO DK Hours Days Did this organization experience any street or sidewalk closures?
o o o
Were streets flooded, but vehicles could pass?
o o o
Were streets around the organization severely flooded - vehicles could not pass
o o o
63
This publication is available free of charge from: https://doi.org/10.6028/N
IST.DC
I.004
If [YES] How long? (no=0;dk=999)
Yes NO DK Hours Days through streets? Was there a stoppage or delay in the delivery of supplies that interrupted organization activities?
o o o
Did Hurricane Harvey floodwaters impact the neighborhood surrounding this organization?
o o o
When did the closure occur?
• Before the event • During the event • After the event • Did not close
When was the decision to close the organization made (in HOURS)? (During =0; dk=999) • __________________
What prompted the closure? • Loss of utilities • Flooding • Government Mandate • Other ____________
Was closure required because the organization could not function given damages caused by Hurricane Harvey?
• Yes • No
Who made the final determination to close the business? • Owner • Manager • Local policy/requirement • Other
Who made the final determination to close this organization? • Executive Director/ Chief Operating Officer
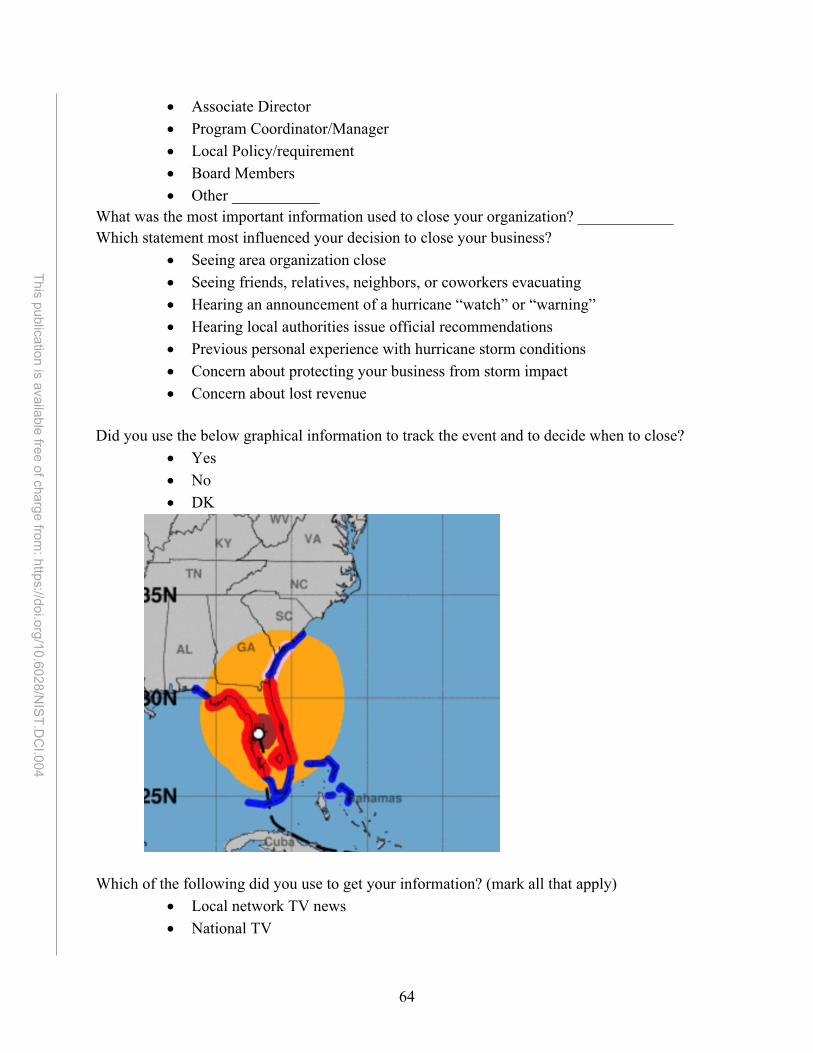
64
This publication is available free of charge from: https://doi.org/10.6028/N
IST.DC
I.004
• Associate Director • Program Coordinator/Manager • Local Policy/requirement • Board Members • Other ___________
What was the most important information used to close your organization? ____________ Which statement most influenced your decision to close your business?
• Seeing area organization close • Seeing friends, relatives, neighbors, or coworkers evacuating • Hearing an announcement of a hurricane “watch” or “warning” • Hearing local authorities issue official recommendations • Previous personal experience with hurricane storm conditions • Concern about protecting your business from storm impact • Concern about lost revenue
Did you use the below graphical information to track the event and to decide when to close?
• Yes • No • DK
Which of the following did you use to get your information? (mark all that apply)
• Local network TV news • National TV
65
This publication is available free of charge from: https://doi.org/10.6028/N
IST.DC
I.004
• Weather Channel • Accuweather • Local Government • Community Leaders • Radio • Internet Source • Friends/Family • Social Media • National Weather Service (directly) • Organizations • Other: ______________
How was the status of the organization communicated (e.g. open or not) to potential customers and the public (mark all that apply)?
• Telephone • E-mail • Text Message • Social Media • TV • Newspaper • Radio • Word of Mouth • Other: ___________
Can this organization operate without a physical location? • Not dependent on physical location at all • Somewhat dependent on a physical location • Extremely dependent on a physical location
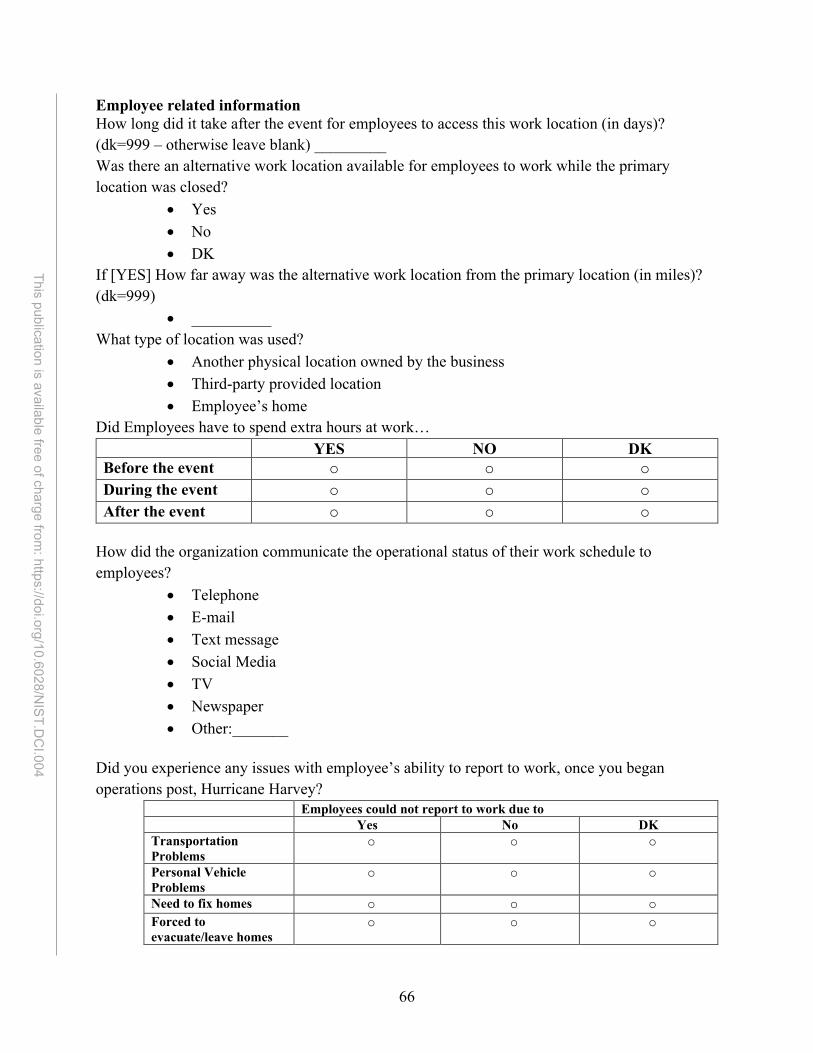
66
This publication is available free of charge from: https://doi.org/10.6028/N
IST.DC
I.004
Employee related information How long did it take after the event for employees to access this work location (in days)? (dk=999 – otherwise leave blank) _________ Was there an alternative work location available for employees to work while the primary location was closed?
• Yes • No • DK
If [YES] How far away was the alternative work location from the primary location (in miles)? (dk=999)
• __________ What type of location was used?
• Another physical location owned by the business • Third-party provided location • Employee’s home
Did Employees have to spend extra hours at work… YES NO DK Before the event o o o During the event o o o After the event o o o
How did the organization communicate the operational status of their work schedule to employees?
• Telephone • E-mail • Text message • Social Media • TV • Newspaper • Other:_______
Did you experience any issues with employee’s ability to report to work, once you began operations post, Hurricane Harvey?
Employees could not report to work due to Yes No DK Transportation Problems
o o o
Personal Vehicle Problems
o o o
Need to fix homes o o o Forced to evacuate/leave homes
o o o
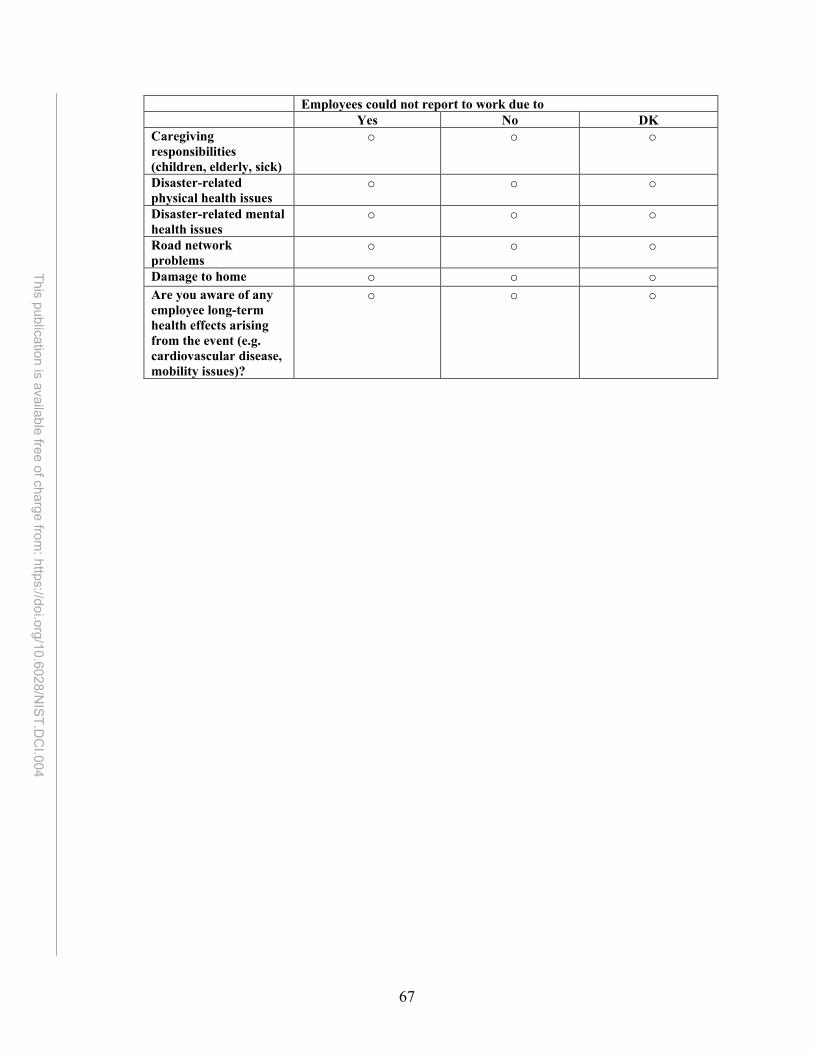
67
This publication is available free of charge from: https://doi.org/10.6028/N
IST.DC
I.004
Employees could not report to work due to Yes No DK Caregiving responsibilities (children, elderly, sick)
o o o
Disaster-related physical health issues
o o o
Disaster-related mental health issues
o o o
Road network problems
o o o
Damage to home o o o Are you aware of any employee long-term health effects arising from the event (e.g. cardiovascular disease, mobility issues)?
o o o
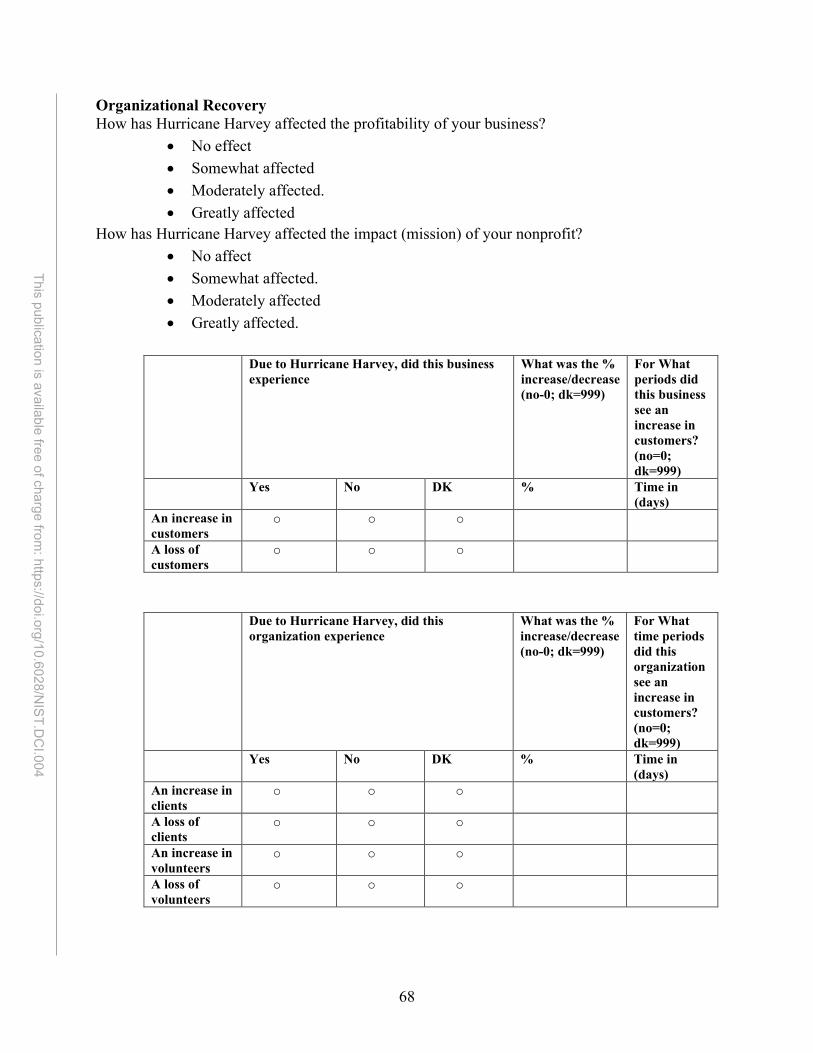
68
This publication is available free of charge from: https://doi.org/10.6028/N
IST.DC
I.004
Organizational Recovery How has Hurricane Harvey affected the profitability of your business?
• No effect • Somewhat affected • Moderately affected. • Greatly affected
How has Hurricane Harvey affected the impact (mission) of your nonprofit? • No affect • Somewhat affected. • Moderately affected • Greatly affected.
Due to Hurricane Harvey, did this business
experience What was the % increase/decrease (no-0; dk=999)
For What periods did this business see an increase in customers? (no=0; dk=999)
Yes No DK % Time in (days)
An increase in customers
o o o
A loss of customers
o o o
Due to Hurricane Harvey, did this organization experience
What was the % increase/decrease (no-0; dk=999)
For What time periods did this organization see an increase in customers? (no=0; dk=999)
Yes No DK % Time in (days)
An increase in clients
o o o
A loss of clients
o o o
An increase in volunteers
o o o
A loss of volunteers
o o o
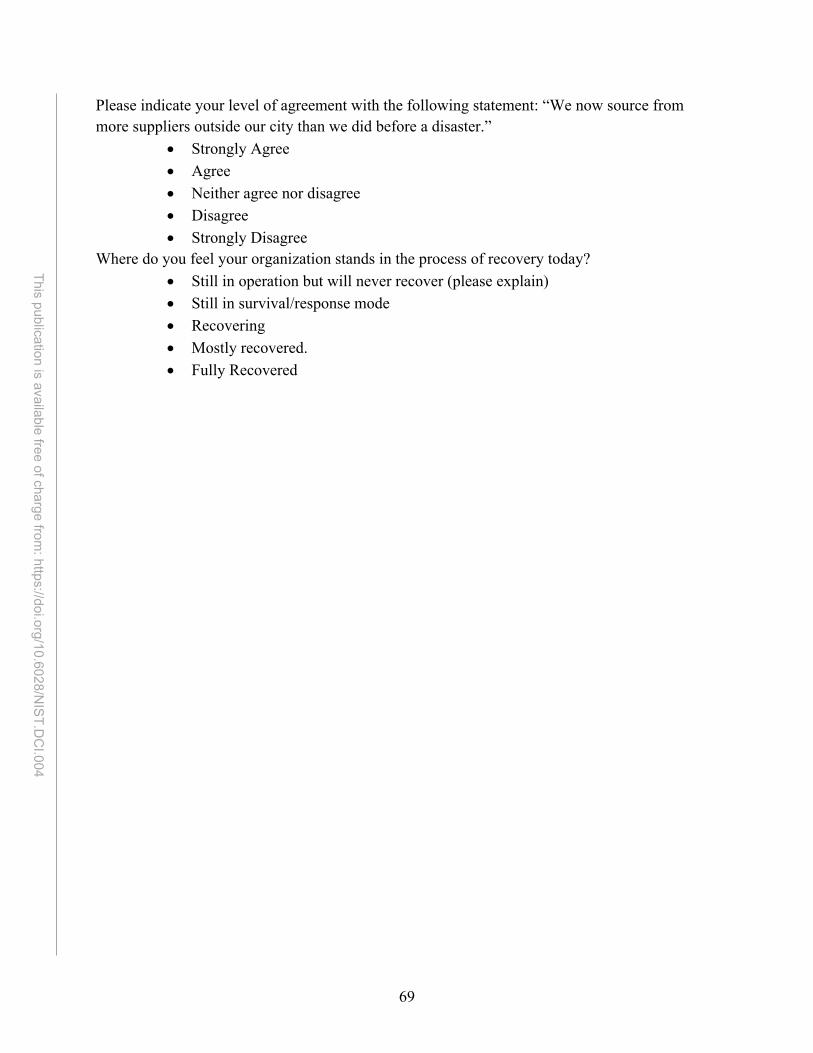
69
This publication is available free of charge from: https://doi.org/10.6028/N
IST.DC
I.004
Please indicate your level of agreement with the following statement: “We now source from more suppliers outside our city than we did before a disaster.”
• Strongly Agree • Agree • Neither agree nor disagree • Disagree • Strongly Disagree
Where do you feel your organization stands in the process of recovery today? • Still in operation but will never recover (please explain) • Still in survival/response mode • Recovering • Mostly recovered. • Fully Recovered
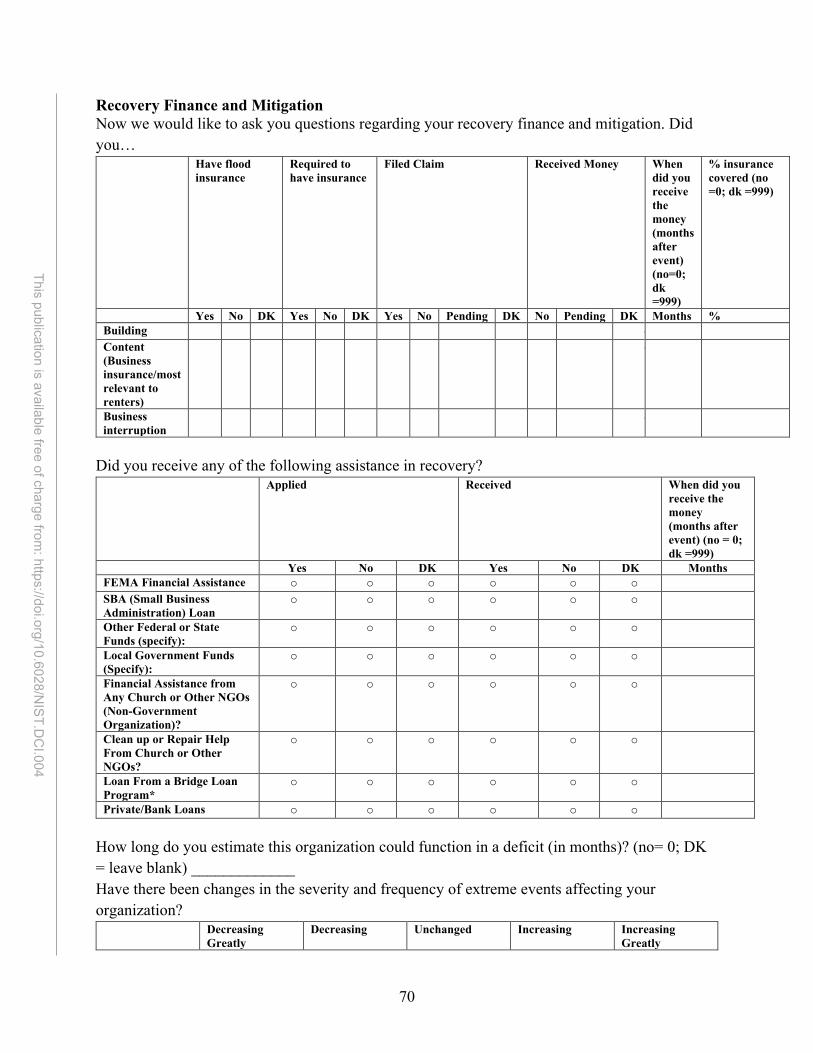
70
This publication is available free of charge from: https://doi.org/10.6028/N
IST.DC
I.004
Recovery Finance and Mitigation Now we would like to ask you questions regarding your recovery finance and mitigation. Did you…
Have flood insurance
Required to have insurance
Filed Claim Received Money When did you receive the money (months after event) (no=0; dk =999)
% insurance covered (no =0; dk =999)
Yes No DK Yes No DK Yes No Pending DK No Pending DK Months % Building o Content (Business insurance/most relevant to renters)
o
Business interruption
o
Did you receive any of the following assistance in recovery?
Applied Received When did you receive the money (months after event) (no = 0; dk =999)
Yes No DK Yes No DK Months FEMA Financial Assistance o o o o o o SBA (Small Business Administration) Loan
o o o o o o
Other Federal or State Funds (specify):
o o o o o o
Local Government Funds (Specify):
o o o o o o
Financial Assistance from Any Church or Other NGOs (Non-Government Organization)?
o o o o o o
Clean up or Repair Help From Church or Other NGOs?
o o o o o o
Loan From a Bridge Loan Program*
o o o o o o
Private/Bank Loans o o o o o o
How long do you estimate this organization could function in a deficit (in months)? (no= 0; DK = leave blank) _____________ Have there been changes in the severity and frequency of extreme events affecting your organization?
Decreasing Greatly
Decreasing Unchanged Increasing Increasing Greatly
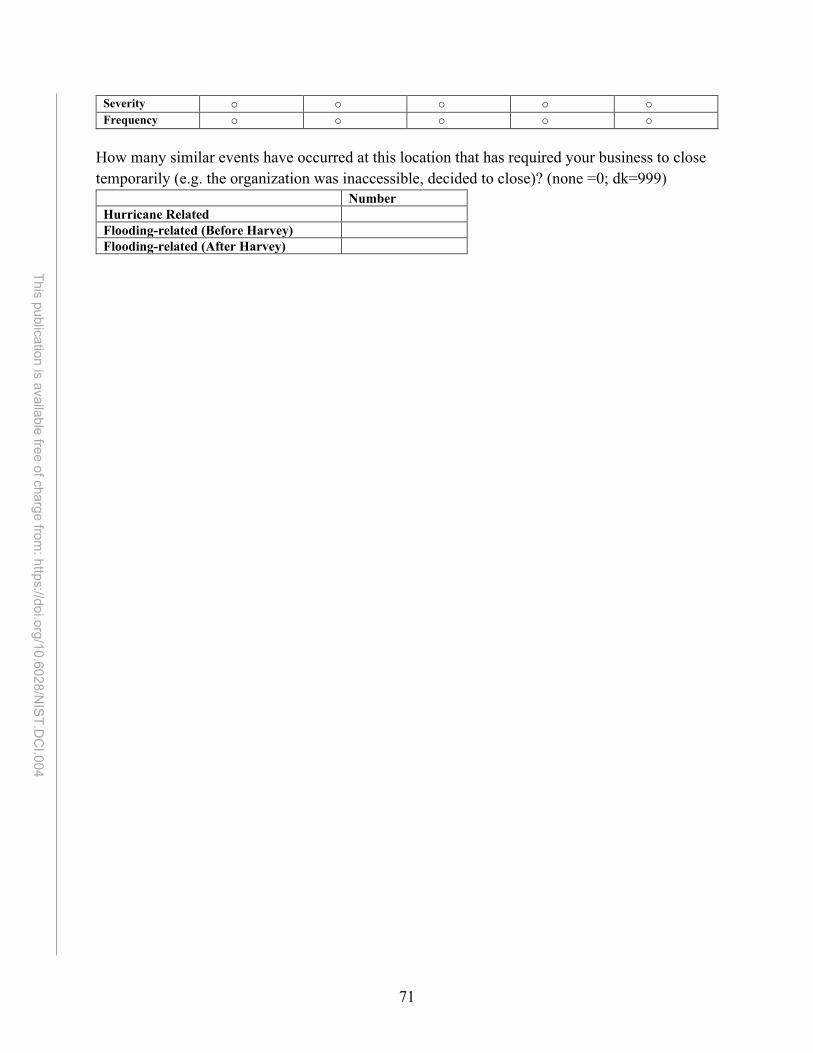
71
This publication is available free of charge from: https://doi.org/10.6028/N
IST.DC
I.004
Severity o o o o o Frequency o o o o o
How many similar events have occurred at this location that has required your business to close temporarily (e.g. the organization was inaccessible, decided to close)? (none =0; dk=999)
Number Hurricane Related Flooding-related (Before Harvey) Flooding-related (After Harvey)
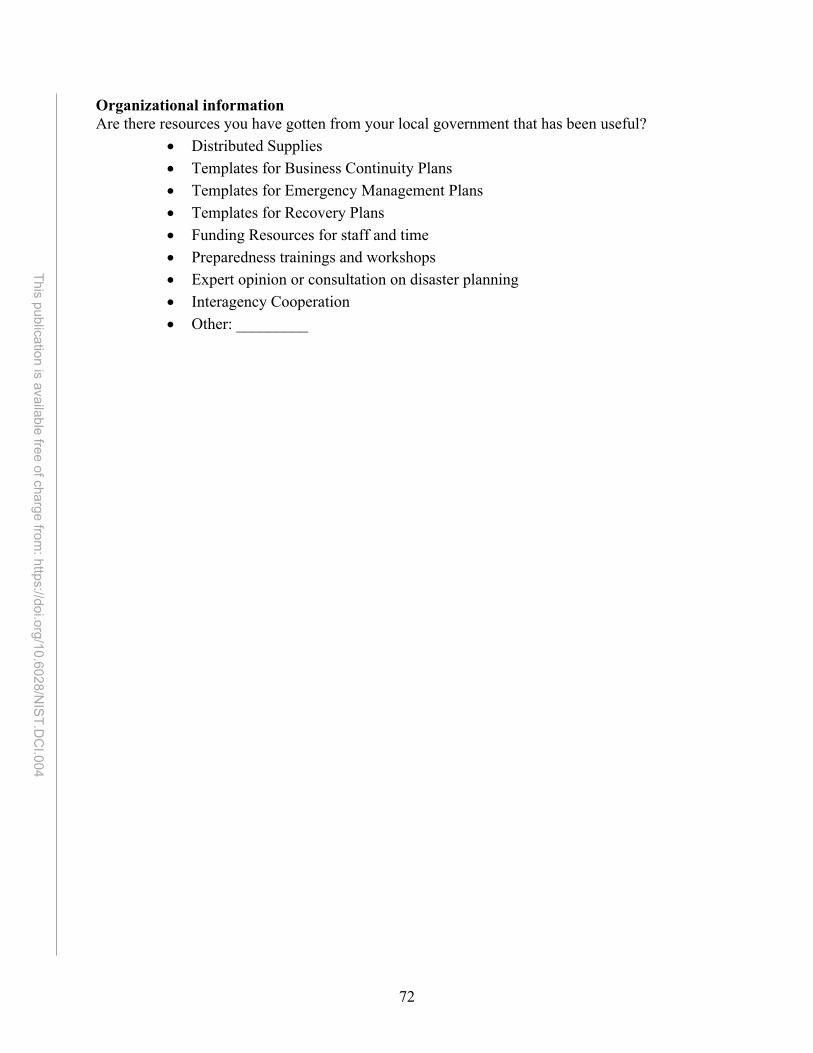
72
This publication is available free of charge from: https://doi.org/10.6028/N
IST.DC
I.004
Organizational information Are there resources you have gotten from your local government that has been useful?
• Distributed Supplies • Templates for Business Continuity Plans • Templates for Emergency Management Plans • Templates for Recovery Plans • Funding Resources for staff and time • Preparedness trainings and workshops • Expert opinion or consultation on disaster planning • Interagency Cooperation • Other: _________
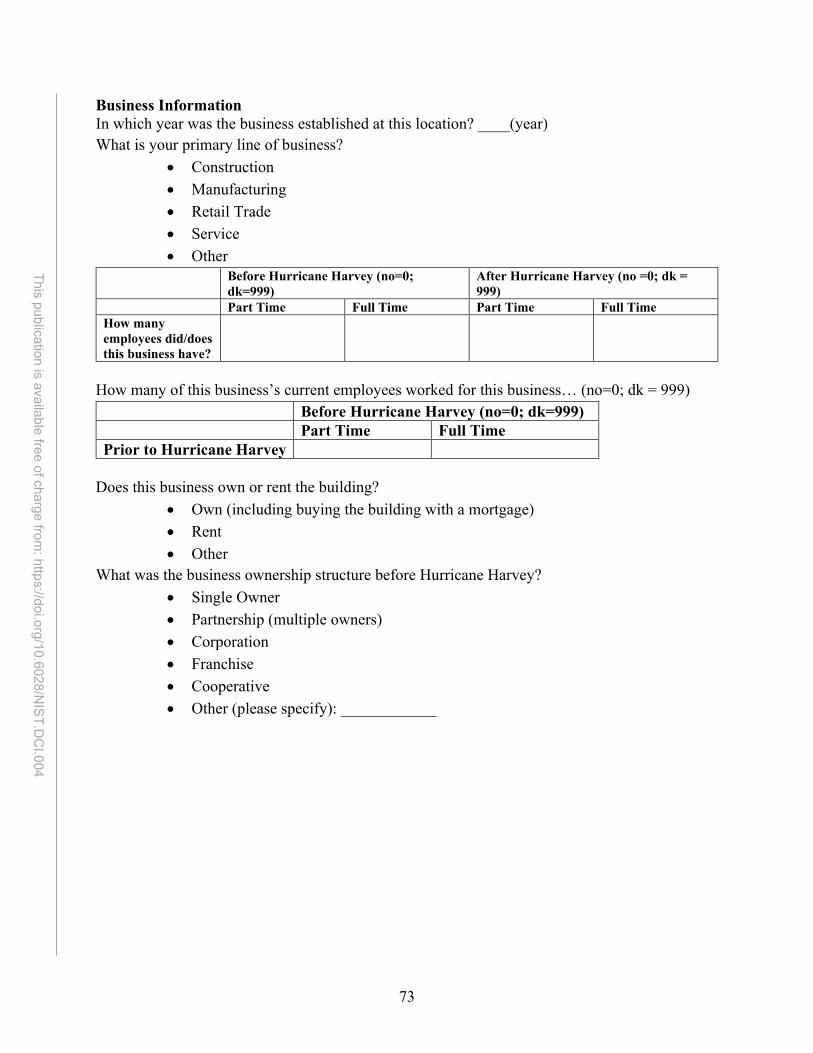
73
This publication is available free of charge from: https://doi.org/10.6028/N
IST.DC
I.004
Business Information In which year was the business established at this location? ____(year) What is your primary line of business?
• Construction • Manufacturing • Retail Trade • Service • Other
Before Hurricane Harvey (no=0; dk=999)
After Hurricane Harvey (no =0; dk = 999)
Part Time Full Time Part Time Full Time How many employees did/does this business have?
How many of this business’s current employees worked for this business… (no=0; dk = 999) Before Hurricane Harvey (no=0; dk=999) Part Time Full Time Prior to Hurricane Harvey
Does this business own or rent the building?
• Own (including buying the building with a mortgage) • Rent • Other
What was the business ownership structure before Hurricane Harvey? • Single Owner • Partnership (multiple owners) • Corporation • Franchise • Cooperative • Other (please specify): ____________
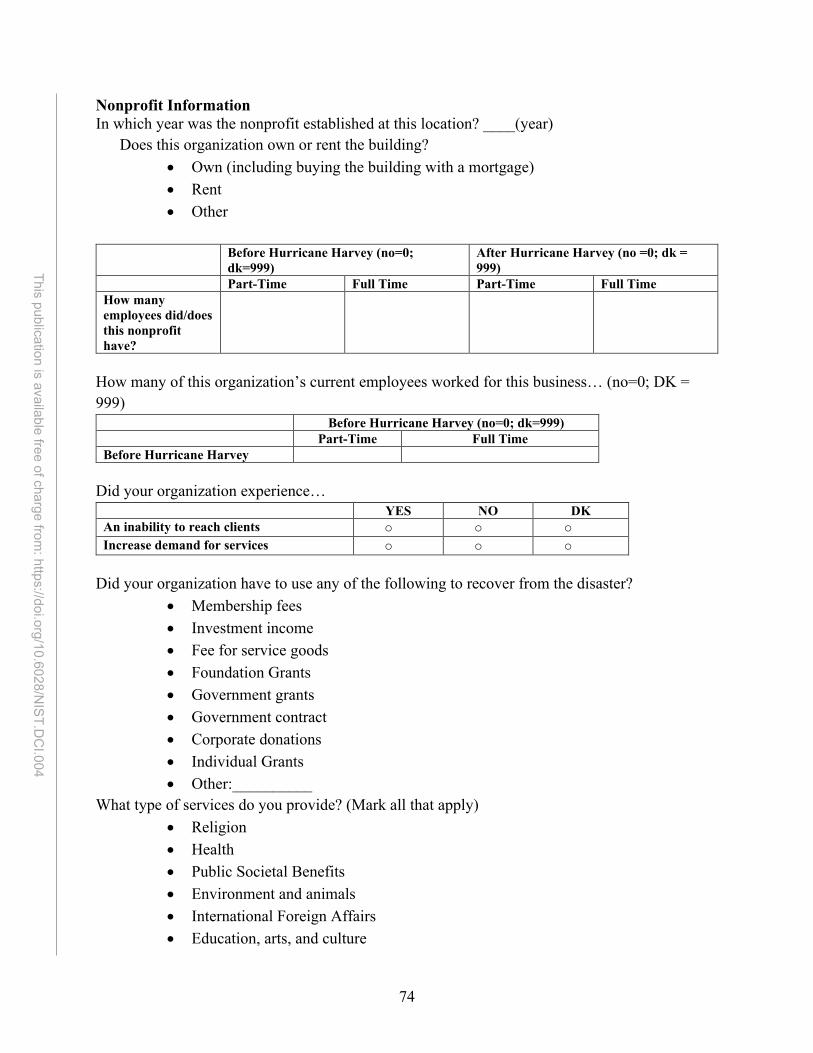
74
This publication is available free of charge from: https://doi.org/10.6028/N
IST.DC
I.004
Nonprofit Information In which year was the nonprofit established at this location? ____(year)
Does this organization own or rent the building? • Own (including buying the building with a mortgage) • Rent • Other
Before Hurricane Harvey (no=0;
dk=999) After Hurricane Harvey (no =0; dk = 999)
Part-Time Full Time Part-Time Full Time How many employees did/does this nonprofit have?
How many of this organization’s current employees worked for this business… (no=0; DK = 999)
Before Hurricane Harvey (no=0; dk=999) Part-Time Full Time Before Hurricane Harvey
Did your organization experience…
YES NO DK An inability to reach clients o o o Increase demand for services o o o
Did your organization have to use any of the following to recover from the disaster?
• Membership fees • Investment income • Fee for service goods • Foundation Grants • Government grants • Government contract • Corporate donations • Individual Grants • Other:__________
What type of services do you provide? (Mark all that apply) • Religion • Health • Public Societal Benefits • Environment and animals • International Foreign Affairs • Education, arts, and culture
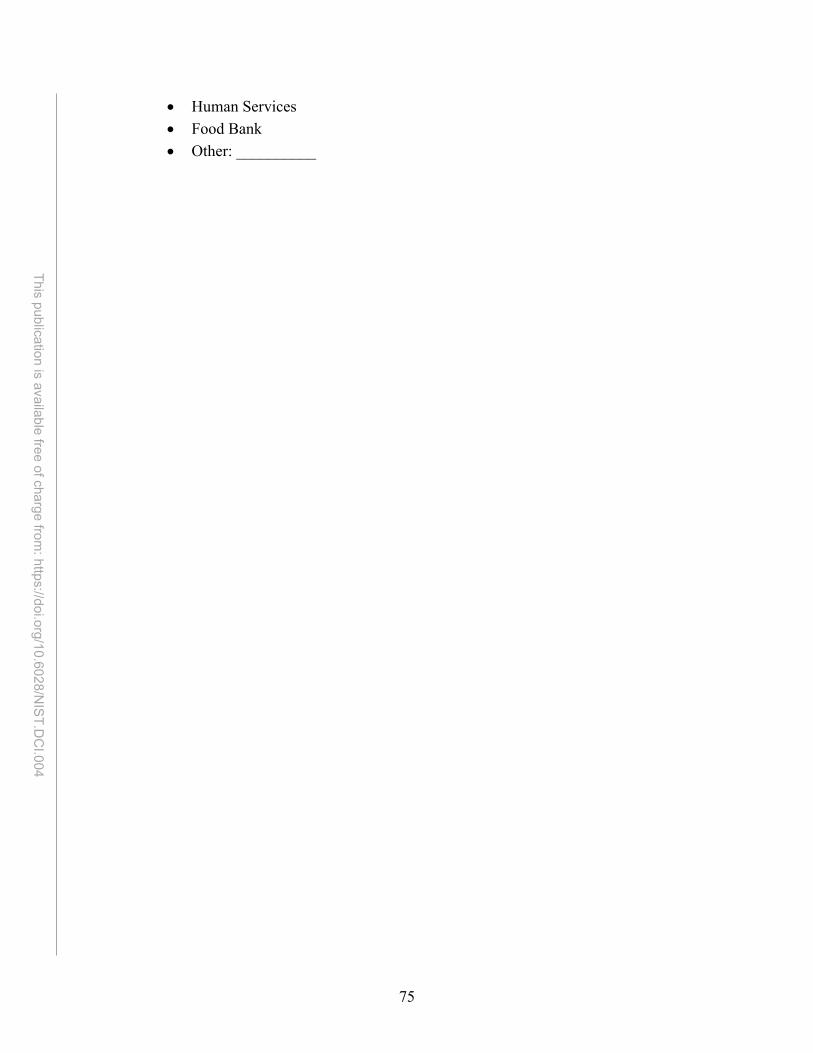
75
This publication is available free of charge from: https://doi.org/10.6028/N
IST.DC
I.004
• Human Services • Food Bank • Other: __________
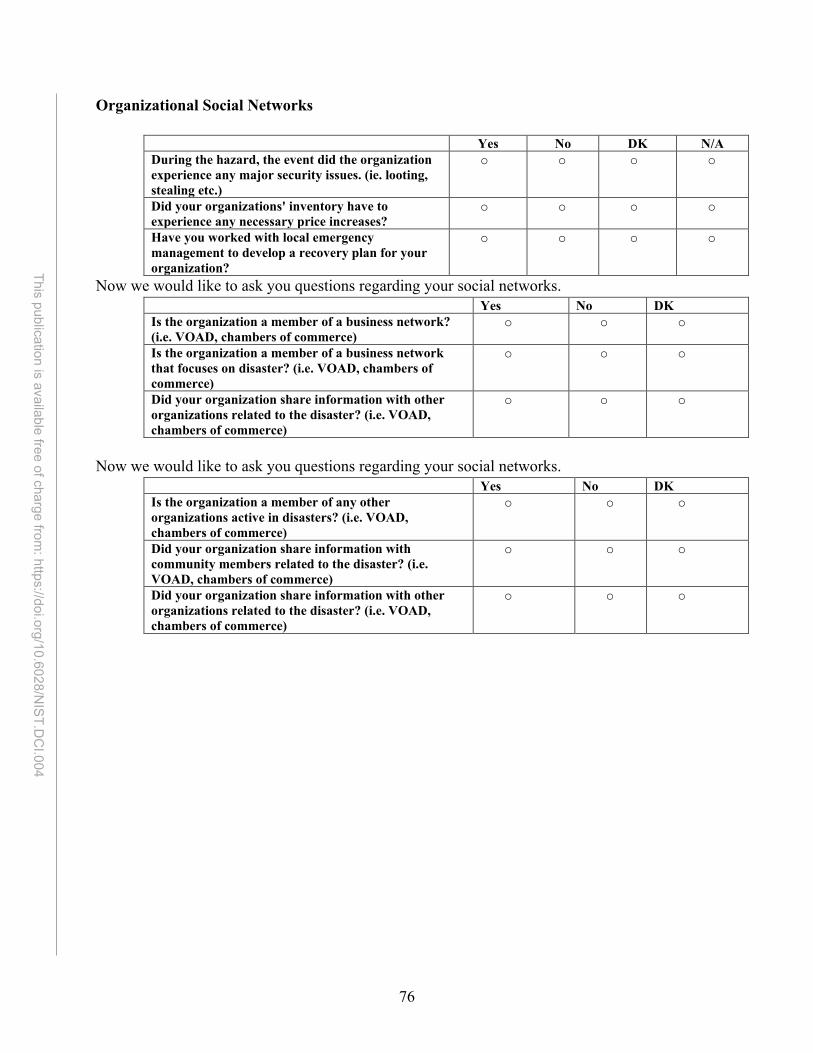
76
This publication is available free of charge from: https://doi.org/10.6028/N
IST.DC
I.004
Organizational Social Networks
Yes No DK N/A During the hazard, the event did the organization experience any major security issues. (ie. looting, stealing etc.)
o o o o
Did your organizations' inventory have to experience any necessary price increases?
o o o o
Have you worked with local emergency management to develop a recovery plan for your organization?
o o o o
Now we would like to ask you questions regarding your social networks. Yes No DK Is the organization a member of a business network? (i.e. VOAD, chambers of commerce)
o o o
Is the organization a member of a business network that focuses on disaster? (i.e. VOAD, chambers of commerce)
o o o
Did your organization share information with other organizations related to the disaster? (i.e. VOAD, chambers of commerce)
o o o
Now we would like to ask you questions regarding your social networks.
Yes No DK Is the organization a member of any other organizations active in disasters? (i.e. VOAD, chambers of commerce)
o o o
Did your organization share information with community members related to the disaster? (i.e. VOAD, chambers of commerce)
o o o
Did your organization share information with other organizations related to the disaster? (i.e. VOAD, chambers of commerce)
o o o
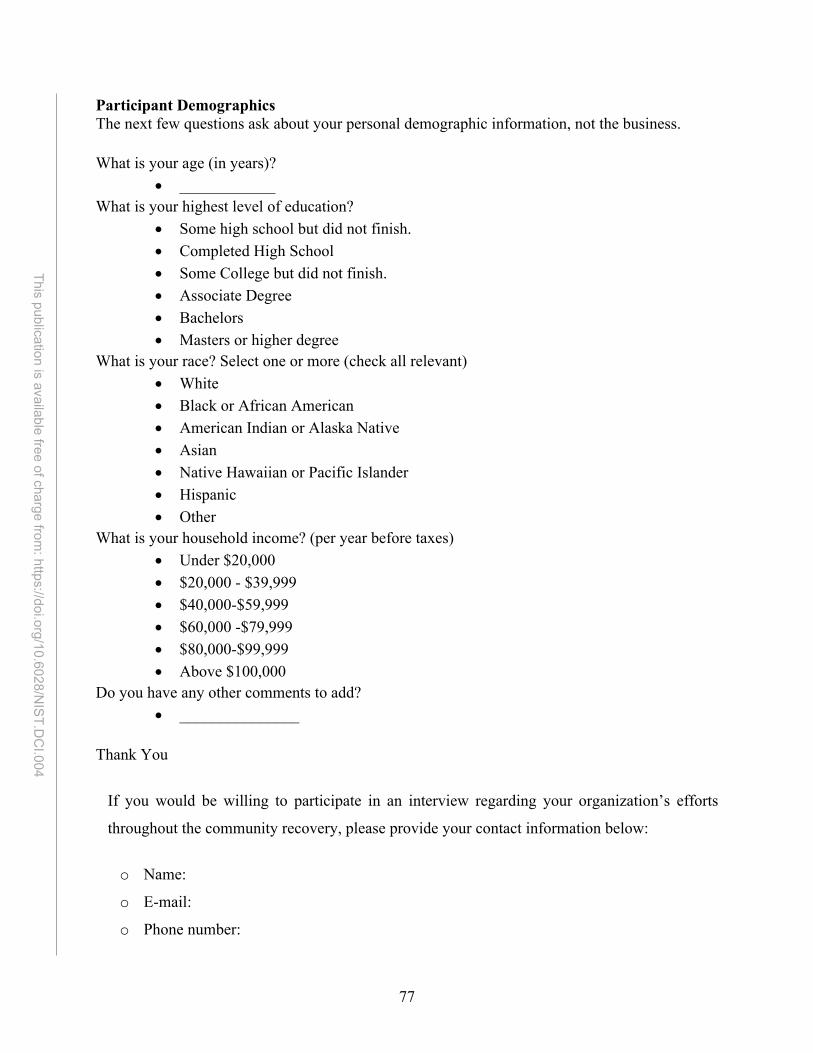
77
This publication is available free of charge from: https://doi.org/10.6028/N
IST.DC
I.004
Participant Demographics The next few questions ask about your personal demographic information, not the business. What is your age (in years)?
• ____________ What is your highest level of education?
• Some high school but did not finish. • Completed High School • Some College but did not finish. • Associate Degree • Bachelors • Masters or higher degree
What is your race? Select one or more (check all relevant) • White • Black or African American • American Indian or Alaska Native • Asian • Native Hawaiian or Pacific Islander • Hispanic • Other
What is your household income? (per year before taxes) • Under $20,000 • $20,000 - $39,999 • $40,000-$59,999 • $60,000 -$79,999 • $80,000-$99,999 • Above $100,000
Do you have any other comments to add? • _______________
Thank You
If you would be willing to participate in an interview regarding your organization’s efforts
throughout the community recovery, please provide your contact information below:
o Name:
o E-mail:
o Phone number:
78
This publication is available free of charge from: https://doi.org/10.6028/N
IST.DC
I.004
o Result Completion Code o Completed Survey o Ineligible, no manager/owner to answer. o The wrong address could not locate. o Hard refusal o Soft refusal set time for a future interview. o Soft refusal left form o Non-operational business – closed BEFORE the event. o Non-operational – closed AFTER event / destroyed. o No answer or response, but evidence/confirmation operating. o No access (e.g., fence preventing entry) o Ineligible, business (name) different than the one expected o Need survey translated to a different language.
THANK YOU VERY MUCH FOR COMPLETING THE SURVEY!
This collection of information contains Paperwork Reduction Act (PRA) requirements approved by the Office of Management and Budget (OMB). Notwithstanding any other provisions of the law, no person is required to respond to, nor shall any person be subject to a penalty for failure to comply with, a collection of information subject to the requirements of the PRA unless that collection of information displays a currently valid OMB control number. For this collection, the OMB Control number is:0693-0078 with an expiration date: July 31, 2019. Public reporting burden for this collection is estimated to be 15 minutes per survey, including the time for reviewing instructions, searching existing data sources, gathering and maintaining the data needed and completing and reviewing the collection of information. Send comments regarding this burden estimate or any aspect of this collection of information, including suggestions for reducing this burden, to the National Institute of Standards and Technology, Attn: Dr. Jennifer Helgeson, NIST, 100 Bureau Drive, MS 8603, Gaithersburg, MD 20899-1710, telephone 301-975-6133, or via email: [email protected].
79
This publication is available free of charge from: https://doi.org/10.6028/N
IST.DC
I.004
Appendix B – Consent Script
Post-Hurricane Harvey Field Study in Beaumont/Port Arthur, Texas Organization Recovery Survey Consent Script We are conducting a research study on recovery following the flooding that occurred in Beaumont/Port Arthur, Texas in the days following Hurricane Harvey. Hurricane Harvey hit Texas first and then traveled across the Gulf coast hitting Louisiana as a tropical storm on August 25, 2017. We would like to speak with you about how this event affected your organization. We are interested in learning about the process of recovering from the flooding. There have been a few different flood events since Hurricane Harvey, but we ask that you answer the survey with regards to your experience with Hurricane Harvey. There are some sections that ask about flood events more generally as well. This study is part of a larger project led by the National Oceanic and Atmospheric Administration (NOAA) RISA and the National Institute of Standards and Technology (NIST). Locally, the Texas Sea Grant Offices and the Hazard Reduction and Recovery centers are leading this effort. We would like to ask you some brief survey questions about your organization's experience after the flood as well as some details about your organization during this time. Participation will take approximately 15 to 20 minutes, depending on the experience of your organization with Hurricane Harvey. Your participation is voluntary. If you decide to participate in the study, you may withdraw your consent and stop participation at any time without penalty. We will be collecting information about the damage to your organization, the repair process, and how the flood disrupted your organizations' employees, services, and revenues. When we report and share our findings, we will combine the data from all participants into summary statistics and tables so no unique individual or organization can be identified. There are NO KNOWN RISKS or direct benefits to you. We hope to gain more knowledge on how you and others were affected by Hurricane Harvey and the flooding so that we can learn from your experiences to help Beaumont/Port Arthur and other communities better prepare for similar events in the future. If you are the owner, manager, chief executive officer, etc. of the organization that was here at the time of Hurricane Harvey and the flooding OR someone who knows about what happened to the organization would you be willing to complete the survey? This collection of information contains Paperwork Reduction Act (PRA) requirements approved by the Office of Management and Budget (OMB). Notwithstanding any other provisions of the law, no person is required to respond to, nor shall any person be subject to a penalty for failure to comply with, a collection of information subject to the requirements of the PRA unless that collection of information displays a currently valid OMB control number. For this collection, the OMB Control number is:0693-0078 with an expiration date: July 31, 2019. Public reporting burden for this collection is estimated to be 15 minutes per survey, including the time for reviewing instructions, searching existing data sources, gathering and maintaining the data needed and completing and reviewing the collection of information. Send comments regarding this burden estimate or any aspect of this collection of information, including suggestions for reducing this burden, to the National Institute of Standards and Technology, Attn: Dr. Jennifer Helgeson, NIST, 100 Bureau Drive, MS 8603, Gaithersburg, MD 20899-1710, telephone 301-975-6133, or via email:[email protected].
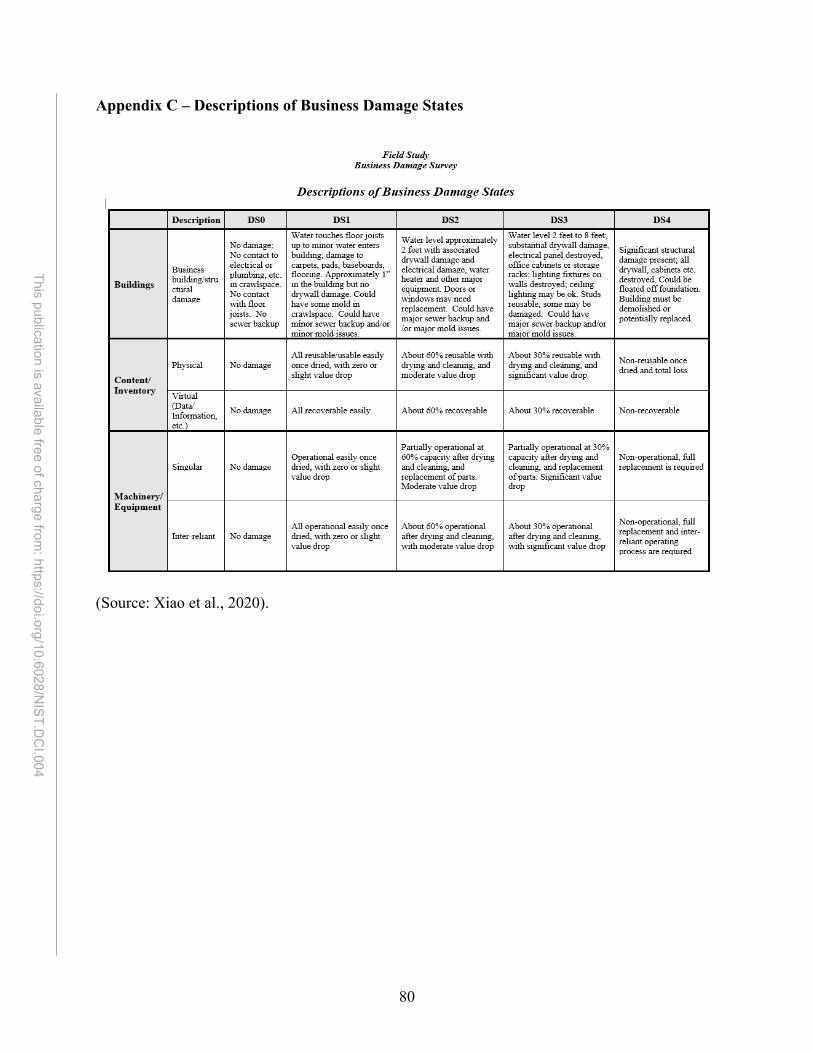
80
This publication is available free of charge from: https://doi.org/10.6028/N
IST.DC
I.004
Appendix C – Descriptions of Business Damage States
(Source: Xiao et al., 2020).
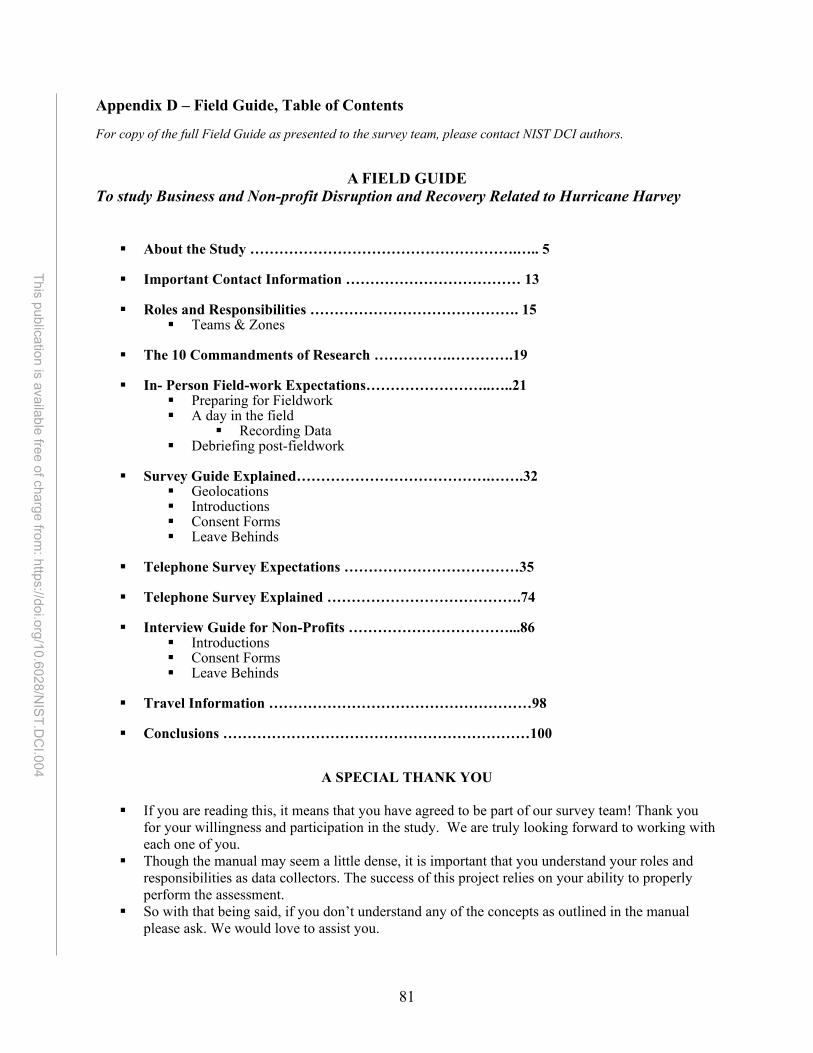
81
This publication is available free of charge from: https://doi.org/10.6028/N
IST.DC
I.004
Appendix D – Field Guide, Table of Contents
For copy of the full Field Guide as presented to the survey team, please contact NIST DCI authors.
A FIELD GUIDE To study Business and Non-profit Disruption and Recovery Related to Hurricane Harvey About the Study ……………………………………………….….. 5
Important Contact Information ……………………………… 13
Roles and Responsibilities ……………………………………. 15
Teams & Zones
The 10 Commandments of Research …………….………….19
In- Person Field-work Expectations……………………..…..21 Preparing for Fieldwork A day in the field
Recording Data Debriefing post-fieldwork
Survey Guide Explained………………………………….…….32
Geolocations Introductions Consent Forms Leave Behinds
Telephone Survey Expectations ………………………………35
Telephone Survey Explained ………………………………….74
Interview Guide for Non-Profits ……………………………...86
Introductions Consent Forms Leave Behinds
Travel Information ………………………………………………98
Conclusions ………………………………………………………100
A SPECIAL THANK YOU If you are reading this, it means that you have agreed to be part of our survey team! Thank you
for your willingness and participation in the study. We are truly looking forward to working with each one of you.
Though the manual may seem a little dense, it is important that you understand your roles and responsibilities as data collectors. The success of this project relies on your ability to properly perform the assessment.
So with that being said, if you don’t understand any of the concepts as outlined in the manual please ask. We would love to assist you.
82
This publication is available free of charge from: https://doi.org/10.6028/N
IST.DC
I.004
Appendix E – Business Communication Tracking
o Business Identification (BID) o Sample Code o First Name o Last Name o Business Name o Address o City o State o Zip Code o Area Code o Phone Number o E-mail o Target Trip Date o Initials of Surveyor o Attempt Date 1 o Attempt Date 2 o Attempt Date 3 o Complete Survey (Y/N) o Survey Response Documented (Y/N) o Need2revisit (Y/N) o Need replacement (Y/N) o Replacement_ given (Y/N) o Need to adjust in final results? o Notes o Telephone/ in person (T/I)