Nissan Motor Co., Ltd. · In calculating “Comprehensive ... operating results and cash flows or...
41
Quarterly Securities Report Second Quarter of FY2011 (From July 1, 2011, to September 30, 2011) ( The English translation of the Quarterly Securities Report “Shihanki-Houkokusho” ) Nissan Motor Co., Ltd.
Transcript of Nissan Motor Co., Ltd. · In calculating “Comprehensive ... operating results and cash flows or...
Quarterly Securities Report Second Quarter of FY2011
(From July 1, 2011, to September 30, 2011)
( The English translation of the Quarterly Securities Report “Shihanki-Houkokusho” )
Nissan Motor Co., Ltd.
Table of Contents
Page Cover .......................................................................................................................................................................... 1
Part I Information on the Company .......................................................................................................... 2
1. Overview of the Company......................................................................................................................... 2 1. Key financial data and trends ....................................................................................................................... 2 2. Description of business ................................................................................................................................ 2
2. Business Overview........................................................................................................................................ 3 1. Business and other risks ............................................................................................................................... 3 2. Important business contracts ........................................................................................................................ 3 3. Analysis of financial position, operating results and cash flows .................................................................. 3
3. Corporate Information............................................................................................................................... 7 1. Information on the Company’s shares.......................................................................................................... 7 2. Members of the Board of Directors and Corporate Auditors ....................................................................... 9
4. Financial Information ............................................................................................................................... 10 1. Quarterly Consolidated Financial Statements ............................................................................................ 11 2. Other........................................................................................................................................................... 35
Part II Information on Guarantors for the Company...................................................................... 36 Independent Auditor’s Quarterly Review Report ................................................................................. 37 Confirmation Note .............................................................................................................................................. 38
【Cover】
【Document Submitted】 Quarterly Securities Report (“Shihanki-Houkokusho”)
【Article of the Applicable Law Requiring
Submission of This Document】
Article 24-4-7, Paragraph 1 of the Financial Instruments and
Exchange Law
【Filed to】 Director, Kanto Local Finance Bureau
【Date of Submission】 November 9, 2011
【Accounting Period】 Second Quarter of 113th Fiscal Term
(from July 1, 2011, to September 30, 2011)
【Company Name】 Nissan Jidosha Kabushiki-Kaisha
【Company Name (in English)】 Nissan Motor Co., Ltd.
【Position and Name of Representative】 Carlos Ghosn, President
【Location of Head Office】 2, Takaracho, Kanagawa-ku, Yokohama-shi, Kanagawa
【Phone No.】 (045) 461- 7410
【Contact for Communications】 Makoto Tagami, Manager, Consolidation Accounting Group,
Budget and Accounting Department
【Nearest Contact】 1-1, Takashima 1-chome, Nishi-ku, Yokohama-shi, Kanagawa
【Phone No.】 (045) 523- 5523 (switchboard)
【Contact for Communications】 Makoto Tagami, Manager, Consolidation Accounting Group,
Budget and Accounting Department
【Place Where Available for Public
Inspection】
Tokyo Stock Exchange, Inc.
2-1, Nihonbashi Kabutocho, Chuo-ku, Tokyo
- 1 -

Part I Information on the Company 1. Overview of the Company 1. Key financial data and trends Consolidated financial data
Fiscal year
112th Six months
ended September 30, 2010
113th Six months
ended September 30, 2011
112th
Accounting period From April 1, 2010
To September 30, 2010
From April 1, 2011 To September 30,
2011
From April 1, 2010 To March 31, 2011
Net sales (Current Second Quarter) (Millions of yen) 4,319,077
(2,268,940) 4,367,446
(2,285,492) 8,773,093
Ordinary income (Millions of yen) 315,136 295,367 537,814 Net income (Current Second Quarter) (Millions of yen) 208,381
(101,732) 183,430 (98,407) 319,221
Comprehensive income (Millions of yen) 47,733 (4,464) 189,198
Net assets (Millions of yen) 3,154,909 3,243,736 3,273,783
Total assets (Millions of yen) 10,085,288 10,310,712 10,736,693 Basic net income per share (Current Second Quarter) (Yen) 49.98
(24.31) 43.85
(23.52) 76.44
Diluted net income per share (Yen) ― 43.84 ―
Net assets as a percentage of total assets (%) 28.1 28.2 27.4
Cash flows from operating activities (Millions of yen) 242,401 264,604 667,502
Cash flows from investing activities (Millions of yen) (110,585) (314,088) (331,118)
Cash flows from financing activities (Millions of yen) (112,270) (198,641) 110,575
Cash and cash equivalents at end of the period (Millions of yen) 736,167 869,808 1,153,453
Notes: 1. Non-consolidated financial data is not presented as the Company prepares quarterly consolidated financial statements.
2. Net sales are presented exclusive of consumption tax. 3. In calculating “Comprehensive income” for the six months ended September 30, 2010, of the 112th
fiscal year, the figure is retroactively adjusted by applying “the Accounting Standard for Presentation of Comprehensive Income” (ASBJ Statement No. 25 issued on June 30, 2010).
4. Diluted net income per share for the 112th fiscal year and for the six months ended September 30, 2010, of the 112th fiscal year is not presented because the Company had no securities with dilutive effects.
2. Description of business There have been no significant changes in the business in which Nissan Motor Co., Ltd. (the “Company”)
and its subsidiaries and affiliates operate during the six months ended September 30, 2011. No changes were made to major subsidiaries and affiliates.
- 2 -

2. Business Overview 1. Business and other risks
During the six months ended September 30, 2011, there were no abnormal fluctuations with regard to financial position, operating results and cash flows or important changes in the “Business and other risks,” which are described in the securities report for the prior fiscal year.
2. Important business contracts
No important business contracts were determined or entered into during the six months ended September 30, 2011.
3. Analysis of financial position, operating results and cash flows
Any future forecasts included in the following descriptions are based on the best estimates or judgment of the Company and its consolidated subsidiaries (collectivelly, the “Group”) as of September 30, 2011, the end of the current second quarter.
(1) Operating results Summary
Net sales of the Group for the six months ended September 30, 2011, were ¥4,367.4 billion, an increase of ¥48.3 billion (1.1%) from the corresponding period in the prior fiscal year (“the last year”), whereas operating income decreased by ¥25.2 billion (7.5%) to ¥309.7 billion, on a consolidated basis. Net non-operating loss of ¥14.3 billion was recorded for the six months ended September 30, 2011, improving by ¥5.5 billion from the last year. As a result, ordinary income decreased by ¥19.7 billion (6.3%) from the last year to ¥295.4 billion. Net special losses of ¥18.7 billion were recorded, for a deterioration of ¥19.1 billion from the last year. This deterioration was primarily attributable to a loss on disaster recorded due to the Great East Japan Earthquake and a decrease in gain on sales of fixed assets despite an increase in gain on sales of investment securities. Income before income taxes and minority interests for the six months ended September 30, 2011, amounted to ¥276.7 billion, a decline of ¥38.8 billion (12.3%) from the last year. As a result, net income for the six months ended September 30, 2011, was ¥183.4 billion, a decline of ¥25.0 billion (12.0%) from the last year.
The operating results by reportable segment are summarized as follows: a. Automobiles
Net sales in the automobile segment (including inter-segment sales) for the six months ended September 30, 2011, were ¥4,153.5 billion, an increase of ¥77.6 billion (1.9%) from the last year. Operating income decreased by ¥53.8 billion (19.2%) from the last year to ¥226.1 billion. Major profit declining factors were exchange fluctuations and an increase of raw material and energy costs despite of cost reduction and sales volume increase.
b. Sales finance
Net sales in the sales financing segment (including inter-segment sales) for the six months ended September 30, 2011, were ¥241.8 billion, a decline of ¥16.0 billion (6.2%) from the last year. Operating income amounted to ¥76.0 billion, an increase of ¥24.1 billion (46.4%) from the last year. A major profit-increasing factor was a decrease of allowance for loss on credit in North America.
Operating results by geographic segment are summarized as follows:
a. Japan
• Net sales (including inter-segment sales) for the six months ended September 30, 2011, were ¥2,220.1 billion, a decline of ¥14.7 billion (0.7%) from the last year.
• Operating income decreased by ¥28.8 billion (33.8%) from the last year to ¥56.2 billion. Major profit-declining factors were a sales volume decrease and exchange rate fluctuations.
- 3 -
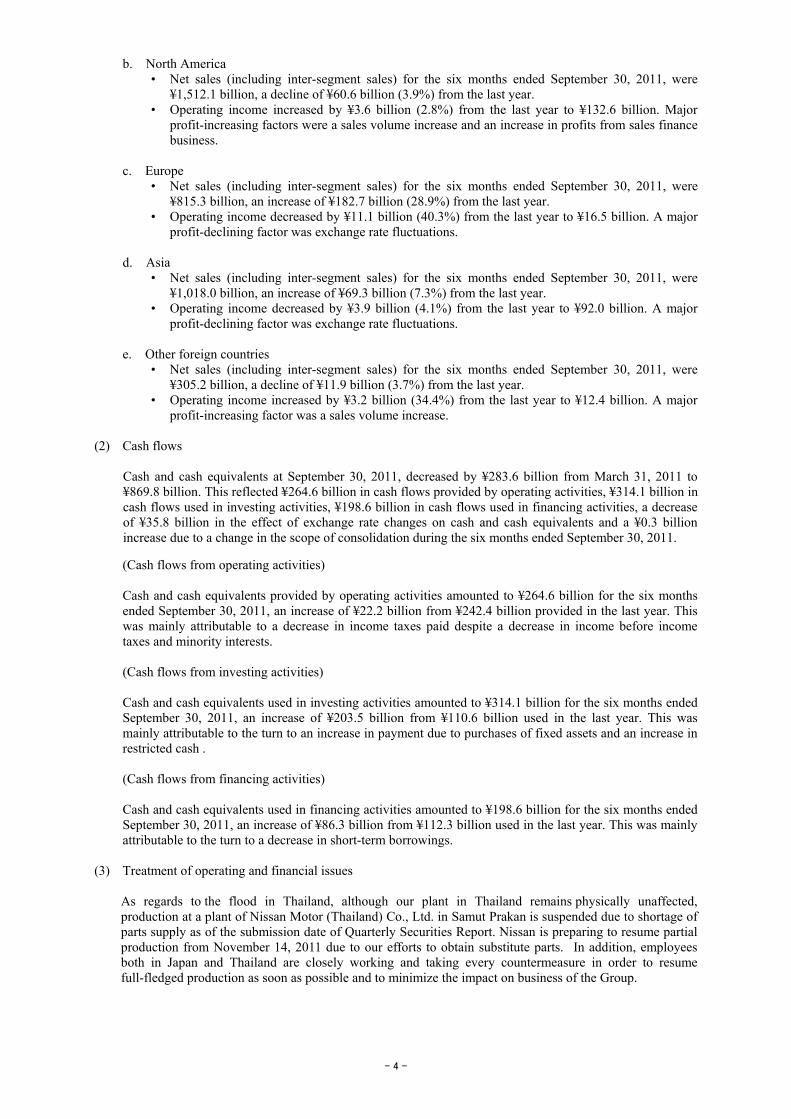
b. North America • Net sales (including inter-segment sales) for the six months ended September 30, 2011, were
¥1,512.1 billion, a decline of ¥60.6 billion (3.9%) from the last year. • Operating income increased by ¥3.6 billion (2.8%) from the last year to ¥132.6 billion. Major
profit-increasing factors were a sales volume increase and an increase in profits from sales finance business.
c. Europe • Net sales (including inter-segment sales) for the six months ended September 30, 2011, were
¥815.3 billion, an increase of ¥182.7 billion (28.9%) from the last year. • Operating income decreased by ¥11.1 billion (40.3%) from the last year to ¥16.5 billion. A major
profit-declining factor was exchange rate fluctuations.
d. Asia • Net sales (including inter-segment sales) for the six months ended September 30, 2011, were
¥1,018.0 billion, an increase of ¥69.3 billion (7.3%) from the last year. • Operating income decreased by ¥3.9 billion (4.1%) from the last year to ¥92.0 billion. A major
profit-declining factor was exchange rate fluctuations.
e. Other foreign countries • Net sales (including inter-segment sales) for the six months ended September 30, 2011, were
¥305.2 billion, a decline of ¥11.9 billion (3.7%) from the last year. • Operating income increased by ¥3.2 billion (34.4%) from the last year to ¥12.4 billion. A major
profit-increasing factor was a sales volume increase.
(2) Cash flows Cash and cash equivalents at September 30, 2011, decreased by ¥283.6 billion from March 31, 2011 to
¥869.8 billion. This reflected ¥264.6 billion in cash flows provided by operating activities, ¥314.1 billion in cash flows used in investing activities, ¥198.6 billion in cash flows used in financing activities, a decrease of ¥35.8 billion in the effect of exchange rate changes on cash and cash equivalents and a ¥0.3 billion increase due to a change in the scope of consolidation during the six months ended September 30, 2011.
(Cash flows from operating activities) Cash and cash equivalents provided by operating activities amounted to ¥264.6 billion for the six months
ended September 30, 2011, an increase of ¥22.2 billion from ¥242.4 billion provided in the last year. This was mainly attributable to a decrease in income taxes paid despite a decrease in income before income taxes and minority interests.
(Cash flows from investing activities) Cash and cash equivalents used in investing activities amounted to ¥314.1 billion for the six months ended
September 30, 2011, an increase of ¥203.5 billion from ¥110.6 billion used in the last year. This was mainly attributable to the turn to an increase in payment due to purchases of fixed assets and an increase in restricted cash .
(Cash flows from financing activities)
Cash and cash equivalents used in financing activities amounted to ¥198.6 billion for the six months ended September 30, 2011, an increase of ¥86.3 billion from ¥112.3 billion used in the last year. This was mainly attributable to the turn to a decrease in short-term borrowings.
(3) Treatment of operating and financial issues
As regards to the flood in Thailand, although our plant in Thailand remains physically unaffected, production at a plant of Nissan Motor (Thailand) Co., Ltd. in Samut Prakan is suspended due to shortage of parts supply as of the submission date of Quarterly Securities Report. Nissan is preparing to resume partial production from November 14, 2011 due to our efforts to obtain substitute parts. In addition, employees both in Japan and Thailand are closely working and taking every countermeasure in order to resume full-fledged production as soon as possible and to minimize the impact on business of the Group.
- 4 -

(4) Research-and-development activities The Group has been active in conducting research-and-development activities in the environment, safety and various other fields toward the realization of a sustainable, motorized society in the future. The research-and-development costs of the Group amounted to ¥177.5 billion for the six months ended September 30, 2011.
(5) Factors that may affect operating results, as well as the current status of and outlook on business strategies
The Group’s worldwide automobile sales (on a retail basis) increased by 10.7% from the last year to 2,225 thousand units. The overall demand for vehicles decreased by 23.7% in the domestic market, and the number of vehicles sold in Japan declined by 14.0%, resulting in 283 thousand units, accounting for a market share of 14.6%, an increase of 1.7 points from the last year. The overall demand for vehicles in China increased by 4.3%, and the number of vehicles sold in China increased by 18.2% to 595 thousand units, accounting for a market share of 6.9%, an increase of 0.8 points from the last year. The overall demand for vehicles in the United States of America increased by 6.3%, and the number of vehicles sold in the United States of America increased by 9.7% to 489 thousand units, accounting for a market share of 7.6%. Meanwhile, the number of vehicles sold in North America, including the United States of America, Mexico and Canada, increased by 10.8% to 642 thousand units. The overall demand for vehicles in Europe increased by 5.1%, and the number of vehicles sold in Europe increased by 22.6% to 339 thousand units, accounting for a market share of 3.6%. The number of vehicles sold in other countries including ASEAN, Central and South America and the Middle East increased by 13.9% to 366 thousand units. Although the effects of the Great East Japan Earthquake remained in sales in Japan and other markets, the overall sales for the six months ended September 30, 2011 remained strong as a result of the prompt response for normalization of the production level and the strong demand for the company’s products. As a result, vehicles sold for this period increased compared to last year. However, profit decreased mainly due to the appreciation of the yen and the rise in raw material prices compared to last year. While the company recognizes that the business environment, including global economic factors, is getting more uncertain, Nissan is confident that it will accomplish both sustainable growth and profitability through the implementation of its mid-term plan, NISSAN POWER 88.
(6) Analysis of sources of capital and liquidity
Cash and cash equivalents at September 30, 2011, decreased by ¥283.6 billion from March 31, 2011 to ¥869.8 billion. This reflected ¥264.6 billion in cash flows provided by operating activities, ¥314.1 billion in cash flows used in investing activities, ¥198.6 billion in cash flows used in financing activities, a decrease of ¥35.8 billion in the effect of exchange rate changes on cash and cash equivalents and a ¥0.3 billion increase due to a change in the scope of consolidation during the six months ended September 30, 2011. Although we must closely monitor the liquidity in light of the rapid environmental changes in the financial markets, the Group considers that the necessary liquidity is sufficiently ensured with measures such as commitment line agreements with principal banks in the world, as well as the cash and cash equivalents held by the Group.
- 5 -

(7) Production and sales Actual production
Number of vehicles produced (units) Location of
manufacturers Six months
ended September 30, 2010
Six months ended
September 30, 2011
Change (units)
Change (%)
Japan 574,723 539,798 (34,925) (6.1)
U.S.A. 259,062 270,181 11,119 4.3
Mexico 253,180 290,911 37,731 14.9
U.K. 207,850 227,834 19,984 9.6
Spain 50,591 77,887 27,296 54.0
China 317,783 352,216 34,433 10.8
Thailand 93,384 99,849 6,465 6.9
Indonesia 16,128 17,184 1,056 6.5
India 10,658 60,690 50,032 469.4
South Africa 18,164 23,389 5,225 28.8
Brazil 10,757 16,574 5,817 54.1
Total 1,812,280 1,976,513 164,233 9.1
Notes: 1. The figure in China represents the production figure for the 6-month period from January 1 to June 30, 2011. Those in the ten other countries represent the production figures for the 6-month period from April 1 to September 30, 2011.
2. The above numbers do not include forklift production data. Actual sales
Number of vehicles sold on a consolidated basis
(Units) Sales to Six months
ended September 30, 2010
Six months ended
September 30, 2011
Change (units)
Change (%)
Japan 321,209 277,446 (43,763) (13.6)
North America 586,585 634,399 47,814 8.2
U.S.A. 451,918 490,390 38,472 8.5
Europe 293,232 361,243 68,011 23.2
Asia 433,772 491,145 57,373 13.2
China 329,574 372,509 42,935 13.0
Others 223,945 247,784 23,839 10.6
Total 1,858,743 2,012,017 153,274 8.2
Notes: 1. The figures in China and Taiwan, which are included in “Asia” represent the sales figures for the 6-month period from January 1 to June 30, 2011. Those sold in Japan, North America, Europe, Others and Asia (excluding China and Taiwan) represent vehicles sold for the 6-month period from April 1 to September 30, 2011.
2. The above numbers do not include forklift sales data.
- 6 -
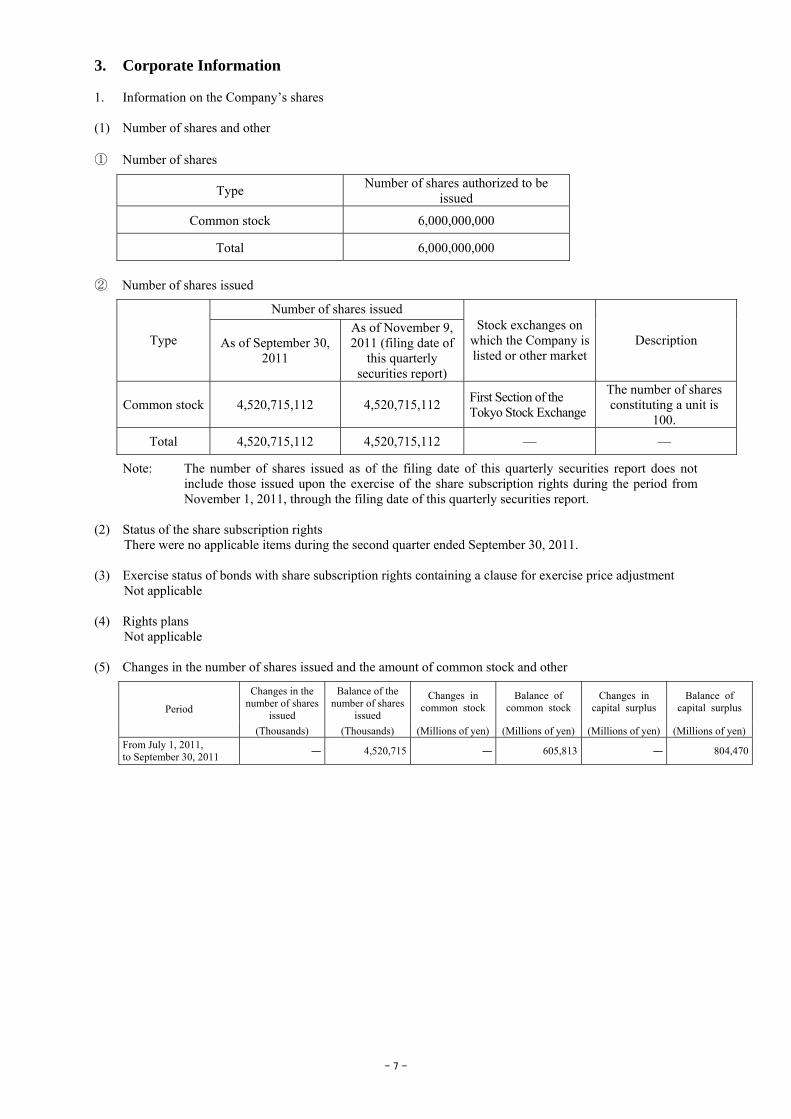
3. Corporate Information 1. Information on the Company’s shares (1) Number of shares and other ① Number of shares
Type Number of shares authorized to be issued
Common stock 6,000,000,000
Total 6,000,000,000 ② Number of shares issued
Number of shares issued
Type As of September 30, 2011
As of November 9, 2011 (filing date of
this quarterly securities report)
Stock exchanges on which the Company is listed or other market
Description
Common stock 4,520,715,112 4,520,715,112 First Section of the Tokyo Stock Exchange
The number of shares constituting a unit is
100. Total 4,520,715,112 4,520,715,112 — —
Note: The number of shares issued as of the filing date of this quarterly securities report does not include those issued upon the exercise of the share subscription rights during the period from November 1, 2011, through the filing date of this quarterly securities report.
(2) Status of the share subscription rights There were no applicable items during the second quarter ended September 30, 2011. (3) Exercise status of bonds with share subscription rights containing a clause for exercise price adjustment Not applicable
(4) Rights plans Not applicable (5) Changes in the number of shares issued and the amount of common stock and other
Changes in the number of shares
issued
Balance of the number of shares
issued
Changes in common stock
Balance of common stock
Changes in capital surplus
Balance of capital surplusPeriod
(Thousands) (Thousands) (Millions of yen) (Millions of yen) (Millions of yen) (Millions of yen)From July 1, 2011, to September 30, 2011 ― 4,520,715 ― 605,813 ― 804,470
- 7 -
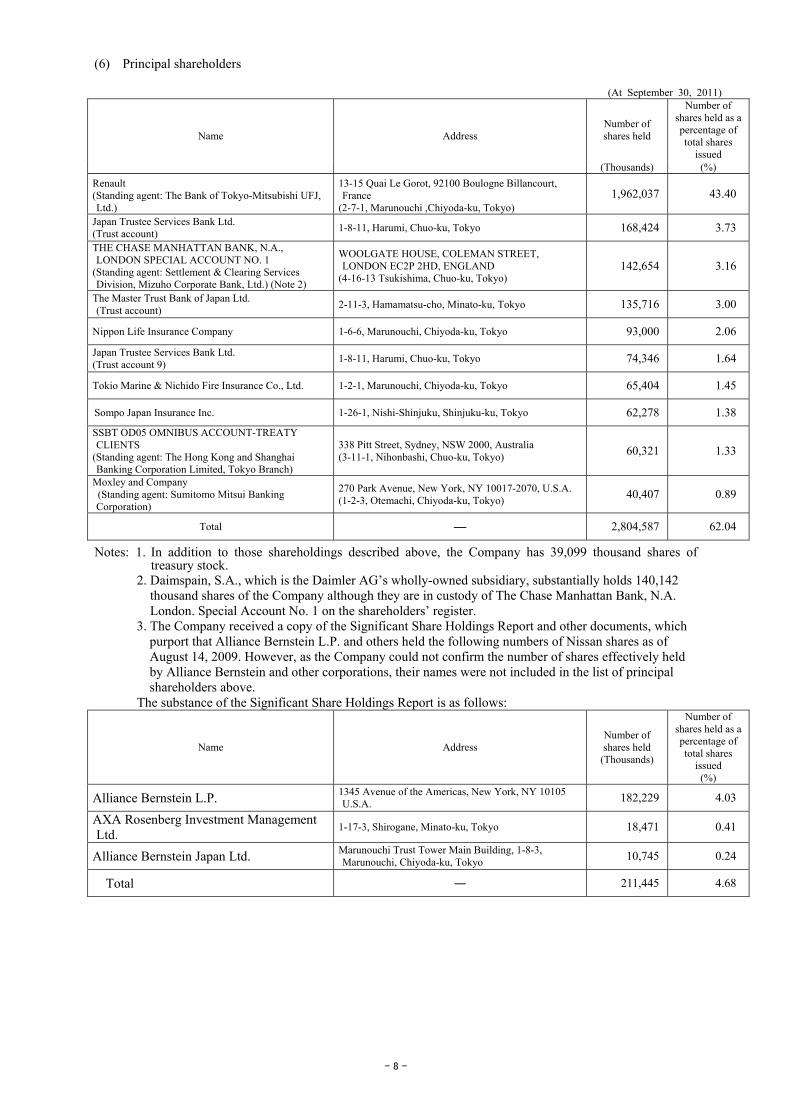
(6) Principal shareholders
(At September 30, 2011)
Number of shares held
Number of shares held as a percentage of total shares
issued
Name Address
(Thousands) (%) Renault (Standing agent: The Bank of Tokyo-Mitsubishi UFJ, Ltd.)
13-15 Quai Le Gorot, 92100 Boulogne Billancourt, France
(2-7-1, Marunouchi ,Chiyoda-ku, Tokyo) 1,962,037 43.40
Japan Trustee Services Bank Ltd. (Trust account) 1-8-11, Harumi, Chuo-ku, Tokyo 168,424 3.73 THE CHASE MANHATTAN BANK, N.A., LONDON SPECIAL ACCOUNT NO. 1
(Standing agent: Settlement & Clearing Services Division, Mizuho Corporate Bank, Ltd.) (Note 2)
WOOLGATE HOUSE, COLEMAN STREET, LONDON EC2P 2HD, ENGLAND
(4-16-13 Tsukishima, Chuo-ku, Tokyo) 142,654 3.16
The Master Trust Bank of Japan Ltd. (Trust account) 2-11-3, Hamamatsu-cho, Minato-ku, Tokyo 135,716 3.00
Nippon Life Insurance Company 1-6-6, Marunouchi, Chiyoda-ku, Tokyo 93,000 2.06
Japan Trustee Services Bank Ltd. (Trust account 9) 1-8-11, Harumi, Chuo-ku, Tokyo 74,346 1.64
Tokio Marine & Nichido Fire Insurance Co., Ltd. 1-2-1, Marunouchi, Chiyoda-ku, Tokyo 65,404 1.45
Sompo Japan Insurance Inc. 1-26-1, Nishi-Shinjuku, Shinjuku-ku, Tokyo 62,278 1.38
SSBT OD05 OMNIBUS ACCOUNT-TREATY CLIENTS
(Standing agent: The Hong Kong and Shanghai Banking Corporation Limited, Tokyo Branch)
338 Pitt Street, Sydney, NSW 2000, Australia (3-11-1, Nihonbashi, Chuo-ku, Tokyo) 60,321 1.33
Moxley and Company (Standing agent: Sumitomo Mitsui Banking Corporation)
270 Park Avenue, New York, NY 10017-2070, U.S.A. (1-2-3, Otemachi, Chiyoda-ku, Tokyo) 40,407 0.89
Total ― 2,804,587 62.04
Notes: 1. In addition to those shareholdings described above, the Company has 39,099 thousand shares of treasury stock.
2. Daimspain, S.A., which is the Daimler AG’s wholly-owned subsidiary, substantially holds 140,142 thousand shares of the Company although they are in custody of The Chase Manhattan Bank, N.A. London. Special Account No. 1 on the shareholders’ register.
3. The Company received a copy of the Significant Share Holdings Report and other documents, which purport that Alliance Bernstein L.P. and others held the following numbers of Nissan shares as of August 14, 2009. However, as the Company could not confirm the number of shares effectively held by Alliance Bernstein and other corporations, their names were not included in the list of principal shareholders above.
The substance of the Significant Share Holdings Report is as follows:
Name Address Number of shares held
(Thousands)
Number of shares held as a percentage of total shares
issued (%)
Alliance Bernstein L.P. 1345 Avenue of the Americas, New York, NY 10105 U.S.A. 182,229 4.03
AXA Rosenberg Investment Management Ltd. 1-17-3, Shirogane, Minato-ku, Tokyo 18,471 0.41
Alliance Bernstein Japan Ltd. Marunouchi Trust Tower Main Building, 1-8-3, Marunouchi, Chiyoda-ku, Tokyo 10,745 0.24
Total ― 211,445 4.68
- 8 -

(7) Status of voting rights ① Shares issued
(At September 30, 2011) Number of shares Number of voting rights Classification (Shares) (Units) Description
(Treasury stock) Common stock —
39,099,200 —
(Crossholding stock) Common stock —
Shares with full voting rights (Treasury stock, etc.)
211,200 —
Common stock Shares with full voting rights (Others) 4,480,755,300 44,807,553 —
Common stock Shares under one unit 649,412 — —
Total shares issued 4,520,715,112 — —
Total voting rights held by all shareholders — 44,807,553 —
Note: “Shares under one unit” include 27 shares of treasury stock and 30 crossholding shares. Crossholding shares under one unit (At September 30, 2011)
Shareholder Number of shares
Kai Nissan Motor Co., Ltd. 30
② Treasury stock, etc.
(At September 30, 2011)
Name of shareholders Addresses of shareholders
Number of shares held under own
name
Number of shares held under the
names of others
Total % of interest
Shares Shares Shares %Treasury stock:
Nissan Motor Co., Ltd. 2 Takara-cho, Kanagawa-ku,
Yokohama-shi, Kanagawa 39,099,200 ― 39,099,200 0.86
Crossholding stock:
Kochi Nissan Prince Motor Sales Co., Ltd. 2-21 Asahi-cho, Kochi-shi, Kochi 28,600 74,800 103,400 0.00
Kai Nissan Motor Co., Ltd. 706 Kamiimai-cho, Kofu-shi, Yamanashi 37,800 33,500 71,300 0.00
Nissan Prince Kagawa Sales Co., Ltd. 1037 Ikuno-cho, Zentsuji-shi, Kagawa ― 31,500 31,500 0.00
Kagawa Nissan Motor Co., Ltd. 1-1-8 Hanazono-cho, Takamatsu-shi, Kagawa 4,800 ― 4,800 0.00
Total 39,170,400 140,000 39,310,400 0.87
Note: The number of shares included in “Number of shares held under the names of others” represents those held by Nissan’s crossholding share association (address: 1-1, Takashima 1-chome, Nishi-ku, Yokohama-shi, Kanagawa). (Fractional numbers under 100 have been omitted.)
2. Members of the Board of Directors and Corporate Auditors
Not applicable
- 9 -
4. Financial Information 1. Basis of preparation of the quarterly consolidated financial statements The quarterly consolidated financial statements of the Company are prepared in accordance with the
Ministry of Finance Ordinance No. 64, 2007 “Regulations Concerning the Terminology, Forms and Preparation Methods of Quarterly Consolidated Financial Statements” (“Regulations for Quarterly Consolidated Financial Statements”).
Pursuant to Article 64, Section 3, and Article 83-2, Section 3, of the Regulations for Quarterly Consolidated Financial Statements, the quarterly consolidated statements of income and the quarterly consolidated comprehensive income statements are prepared.
2. Quarterly Review reports The quarterly consolidated financial statements for the second quarter (from July 1, 2011 to September 30,
2011) and for the six months ended September 30, 2011 (from April 1, 2011 to September 30, 2011) were reviewed by Ernst & Young ShinNihon LLC, pursuant to Article 193-2, Section 1 of the Financial Instruments and Exchange Law of Japan.
- 10 -

1. Quarterly Consolidated Financial Statements (1) Quarterly Consolidated Balance Sheet
(Millions of yen)
Prior Fiscal Year (As of March 31, 2011)
(Condensed)
Current Second Quarter(As of September 30,
2011)
Assets Current assets
Cash on hand and in banks 998,822 796,516 Trade notes and accounts receivable 738,950 717,356 Sales finance receivables 2,746,836 2,714,419 Securities 158,012 81,932 Merchandise and finished goods 641,055 682,131 Work in process 139,529 157,990 Raw materials and supplies 201,649 194,572 Other 802,937 840,475 Allowance for doubtful accounts (81,955) (60,012)Total current assets 6,345,835 6,125,379
Fixed assets Property, plant and equipment
Buildings and structures, net 645,414 603,142 Machinery, equipment and vehicles, net *1 1,841,480 *1 1,736,345 Land 659,985 653,901 Construction in progress 98,663 132,222 Other, net 391,500 327,698 Total property, plant and equipment 3,637,042 3,453,308
Intangible fixed assets 133,769 124,608 Investments and other assets
Investment securities 381,549 373,606 Other 242,851 237,771 Allowance for doubtful accounts (4,353) (3,960)Total investments and other assets 620,047 607,417
Total fixed assets 4,390,858 4,185,333 Total assets 10,736,693 10,310,712
- 11 -
(Millions of yen)
Prior Fiscal Year (As of March 31, 2011)
(Condensed)
Current Second Quarter
(As of September 30, 2011)
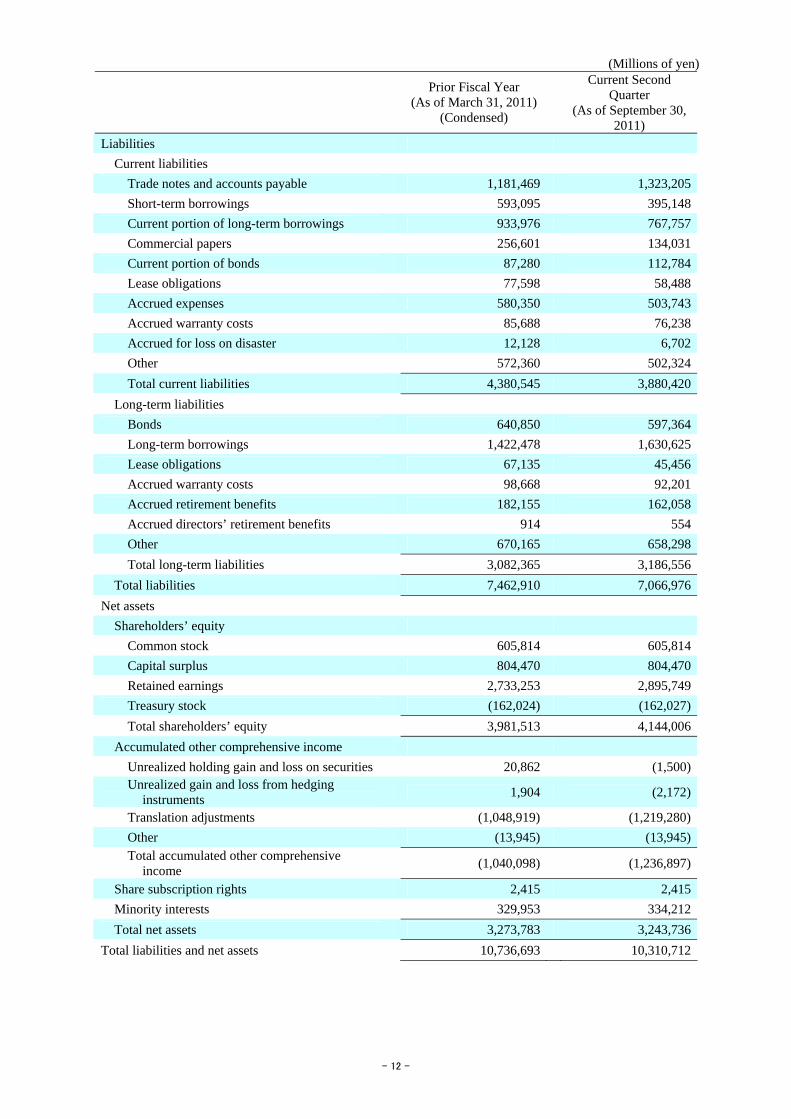
Liabilities Current liabilities
Trade notes and accounts payable 1,181,469 1,323,205 Short-term borrowings 593,095 395,148 Current portion of long-term borrowings 933,976 767,757 Commercial papers 256,601 134,031 Current portion of bonds 87,280 112,784 Lease obligations 77,598 58,488 Accrued expenses 580,350 503,743 Accrued warranty costs 85,688 76,238 Accrued for loss on disaster 12,128 6,702 Other 572,360 502,324 Total current liabilities 4,380,545 3,880,420
Long-term liabilities Bonds 640,850 597,364 Long-term borrowings 1,422,478 1,630,625 Lease obligations 67,135 45,456 Accrued warranty costs 98,668 92,201 Accrued retirement benefits 182,155 162,058 Accrued directors’ retirement benefits 914 554 Other 670,165 658,298 Total long-term liabilities 3,082,365 3,186,556
Total liabilities 7,462,910 7,066,976 Net assets
Shareholders’ equity Common stock 605,814 605,814 Capital surplus 804,470 804,470 Retained earnings 2,733,253 2,895,749 Treasury stock (162,024) (162,027)Total shareholders’ equity 3,981,513 4,144,006
Accumulated other comprehensive income Unrealized holding gain and loss on securities 20,862 (1,500)Unrealized gain and loss from hedging
instruments 1,904 (2,172)
Translation adjustments (1,048,919) (1,219,280)Other (13,945) (13,945)Total accumulated other comprehensive
income (1,040,098) (1,236,897)
Share subscription rights 2,415 2,415 Minority interests 329,953 334,212 Total net assets 3,273,783 3,243,736
Total liabilities and net assets 10,736,693 10,310,712
- 12 -

(2) Quarterly Consolidated Statements of Income and Quarterly Consolidated Comprehensive Income Statements
(The Six Months Ended September 30, 2011) Quarterly Consolidated Statement of Income (Millions of yen)
Six Months Ended September 30, 2010 (From April 1, 2010
To September 30, 2010)
Six Months Ended September 30, 2011 (From April 1, 2011 To September 30,
2011) Net sales 4,319,077 4,367,446 Cost of sales 3,459,479 3,587,405 Gross profit 859,598 780,041 Selling, general and administrative expenses
Advertising expenses 81,846 87,216 Provision for warranty costs 48,539 34,713 Other selling expenses 55,711 53,070 Salaries and wages 162,393 158,789 Provision for doubtful accounts or reversal of
provision for doubtful accounts 13,999 (10,374)
Other 162,246 146,944 Total selling, general and administrative
expenses 524,734 470,358
Operating income 334,864 309,683 Non-operating income
Interest income 6,401 8,310 Dividends income 825 5,300 Equity in earnings of affiliates 5,238 15,597 Derivative income 15,527 12,105 Miscellaneous income 6,153 4,607 Total non-operating income 34,144 45,919
Non-operating expenses Interest expense 14,028 15,893 Exchange loss 26,915 30,303 Miscellaneous expenses 12,929 14,039 Total non-operating expenses 53,872 60,235
Ordinary income 315,136 295,367 Special gains
Gain on sales of fixed assets 9,862 902 Gain on sales of investment securities 1,872 10,550 Other 1,602 1,959 Total special gains 13,336 13,411
Special losses Loss on disposal of fixed assets 3,252 2,117 Impairment loss 1,835 6,337 Loss on disaster - *1 21,126 Other 7,904 2,504Total special losses 12,991 32,084
Income before income taxes and minority interests 315,481 276,694 Income taxes 91,415 78,245 Income before minority interests 224,066 198,449 Income attributable to minority interests 15,685 15,019 Net income 208,381 183,430
- 13 -

Quarterly Consolidated Comprehensive Income Statement (Millions of yen)
Six Months Ended September 30, 2010 (From April 1, 2010 To September 30,
2010)
Six Months Ended September 30, 2011 (From April 1, 2011 To September 30,
2011) Income before minority interests 224,066 198,449 Other comprehensive income Unrealized holding gain and loss on securities 9,405 (22,734) Unrealized gain and loss from hedging instruments 1,573 (4,026) Unfunded retirement benefit obligation of foreign
subsidiaries (1,573) -
Translation adjustments (163,653) (191,538) The amount for equity method company portion (22,085) 15,385 Total of other comprehensive income (176,333) (202,913)Comprehensive income 47,733 (4,464)(Breakdown of comprehensive income) Parent company portion of comprehensive income 39,734 (13,370)Minority interest portion of comprehensive income 7,999 8,906
- 14 -

(Current Second Quarter) Quarterly Consolidated Statement of Income
(Millions of yen)
Prior Second Quarter(From July 1, 2010 To September 30,
2010)
Current Second Quarter
(From July 1, 2011 To September 30,
2011) Net sales 2,268,940 2,285,492 Cost of sales 1,833,662 1,884,249 Gross profit 435,278 401,243 Selling, general and administrative expenses
Advertising expenses 43,628 51,555 Provision for warranty costs 26,900 17,864 Other selling expenses 30,312 32,466 Salaries and wages 82,662 75,486 Provision for doubtful accounts or reversal of
provision for doubtful accounts 6,673 (8,127)Other 78,148 72,688 Total selling, general and administrative expenses 268,323 241,932
Operating income 166,955 159,311 Non-operating income
Interest income 3,091 4,044 Dividends income 160 435 Equity in earnings of affiliates 6,919 10,589 Derivative income 15,901 10,257 Miscellaneous income 3,172 2,462 Total non-operating income 29,243 27,787
Non-operating expenses Interest expense 6,704 8,070 Exchange loss 22,741 24,221 Miscellaneous expenses 6,619 7,124 Total non-operating expenses 36,064 39,415
Ordinary income 160,134 147,683 Special gains
Gain on sales of fixed assets 3,968 330 Gain on sales of investment securities 473 2,772 Other 378 1,102 Total special gains 4,819 4,204
Special losses Loss on disposal of fixed assets 2,323 1,280 Impairment loss 1,771 4,213 Other 2,932 695Total special losses 7,026 6,188
Income before income taxes and minority interests 157,927 145,699 Income taxes 48,147 39,613 Income before minority interests 109,780 106,086 Income attributable to minority interests 8,048 7,679 Net income 101,732 98,407
- 15 -
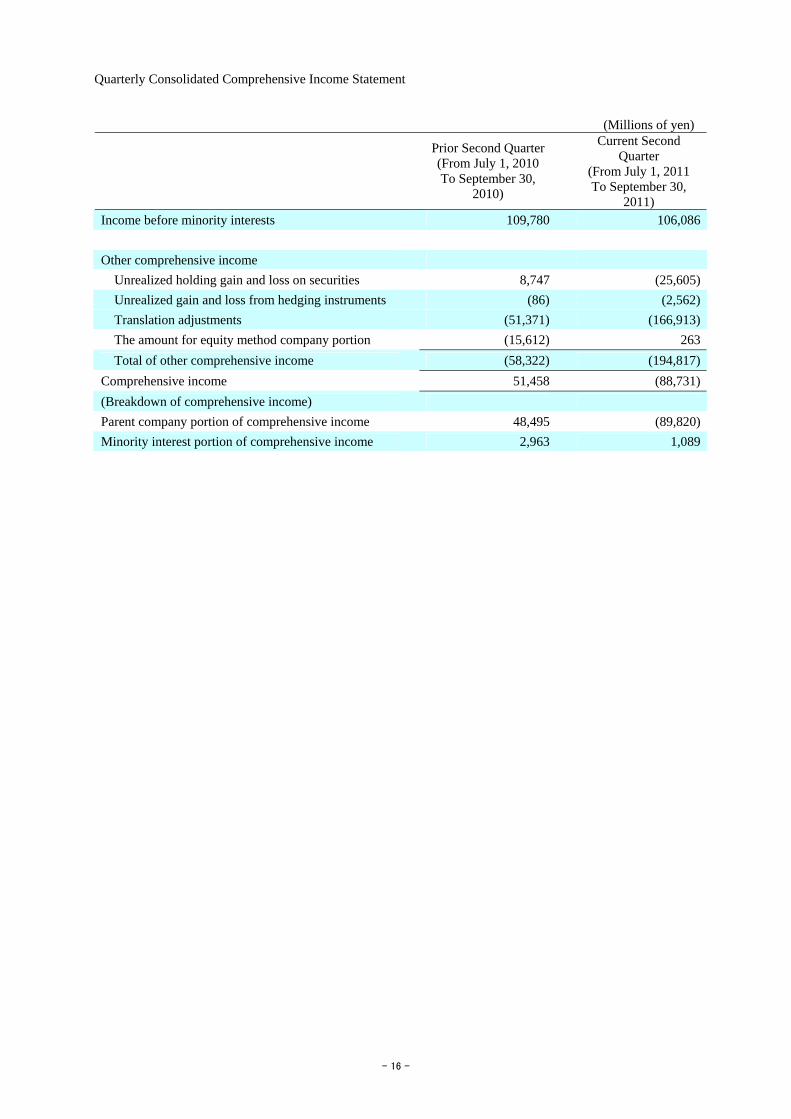
Quarterly Consolidated Comprehensive Income Statement (Millions of yen)
Prior Second Quarter(From July 1, 2010 To September 30,
2010)
Current Second Quarter
(From July 1, 2011 To September 30,
2011) Income before minority interests 109,780 106,086 Other comprehensive income Unrealized holding gain and loss on securities 8,747 (25,605) Unrealized gain and loss from hedging instruments (86) (2,562) Translation adjustments (51,371) (166,913) The amount for equity method company portion (15,612) 263 Total of other comprehensive income (58,322) (194,817)Comprehensive income 51,458 (88,731)(Breakdown of comprehensive income) Parent company portion of comprehensive income 48,495 (89,820)Minority interest portion of comprehensive income 2,963 1,089
- 16 -

(3) Quarterly Consolidated Statement of Cash Flows
(Millions of yen)
Six Months Ended September 30, 2010 (From April 1, 2010 To September 30,
2010)
Six Months Ended September 30, 2011 (From April 1, 2011 To September 30,
2011) Cash flows from operating activities
Income before income taxes and minority interests 315,481 276,694
Depreciation and amortization (for fixed assets excluding leased vehicles) 194,346 187,586
Depreciation and amortization (for other assets) 10,503 9,415 Depreciation and amortization (for leased vehicles) 109,373 95,334 Impairment loss 1,835 6,337 Loss on disaster - 4,605 Increase (decrease) in allowance for doubtful receivables 1,010 (16,075)Interest and dividend income (7,226) (13,610)Interest expense 43,345 43,439 Loss (gain) on sales of fixed assets (9,433) (52)Loss on disposal of fixed assets 3,252 2,117 Loss (gain) on sales of investment securities (1,869) (10,491)Decrease (increase) in trade notes and accounts receivable (78,872) (16,164)Decrease (increase) in sales finance receivables (179,713) (168,149)Decrease (increase) in inventories (177,450) (141,964)Increase (decrease) in trade notes and accounts payable 182,304 150,204 Amortization of net retirement benefit obligation at
transition 5,344 5,080
Retirement benefit expenses 24,519 24,920 Retirement benefit payments made against related accrual (16,881) (38,624)Other (9,128) (55,524)Subtotal 410,740 345,078 Interest and dividends received 7,337 14,164 Interest paid (44,531) (43,514)Income taxes paid (131,145) (51,124)Net cash provided by operating activities 242,401 264,604
Cash flows from investing activities
Net decrease (increase) in short-term investments 22,897 (5,406)Purchase of fixed assets (110,641) (141,126)Proceeds from sales of fixed assets 18,894 8,472 Purchase of leased vehicles (317,806) (324,095)Proceeds from sales of leased vehicles 186,208 167,716 Payments of long-term loans receivable (13,609) (3,919)Collection of long-term loans receivable 5,571 10,441 Purchase of investment securities (979) (5,163)Proceeds from sales of investment securities 556 6,058
Proceeds from sales of subsidiaries' shares resulting in changes in the scope of consolidation - 537
Payments for restructuring of domestic dealers - (927)Net decrease (increase) in restricted cash 95,193 (7,468)Other 3,131 (19,208)Net cash used in investing activities (110,585) (314,088)
- 17 -

(Millions of yen)
Six Months Ended September 30, 2010 (From April 1, 2010 To September 30,
2010)
Six Months Ended September 30, 2011 (From April 1, 2011 To September 30,
2011) Cash flows from financing activities
Net increase (decrease) in short-term borrowings 55,794 (317,252)Proceeds from long-term borrowings 399,341 705,024 Proceeds from issuance of bonds 164,402 85,767 Repayment of long-term borrowings (426,885) (517,536)Redemption of bonds (266,811) (87,302)Proceeds from minority shareholders 3,874 2,529 Purchase of treasury stock (5) (3)Repayment of lease obligations (40,903) (44,008)Cash dividends paid - (20,916)Cash dividends paid to minority shareholders (1,077) (4,944)Net cash used in financing activities (112,270) (198,641)
Effects of exchange rate changes on cash and cash equivalents (50,188) (35,781)
Increase (decrease) in cash and cash equivalents (30,642) (283,906)Cash and cash equivalents at beginning of the period 761,495 1,153,453 Increase due to inclusion in consolidation 5,314 261 Cash and cash equivalents at end of the period *1 736,167 *1 869,808
- 18 -

【Specific accounting policies adopted in preparing quarterly consolidated financial statements】
The six months ended September 30, 2011
(From April 1, 2011 To September 30, 2011)
(Calculation of tax expense) Income taxes are determined at the amount of income before income taxes and minority interests for the current second quarter ended September 30, 2011 multiplied by the effective tax rate, after adoption of tax-effect accounting, estimated for the whole fiscal year ending March 31, 2012 respectively. Deferred income taxes are included in the income taxes.
【Additional information】
The six months ended September 30, 2011
(From April 1, 2011 To September 30, 2011)
(Additional information)
Effective from the accounting changes made at and after the beginning of the first quarter ended June 30, 2011 and corrections of prior period errors, the Company applied the “Accounting Standard for Accounting Changes and Error Corrections” (ASBJ Statement No. 24 issued on December 4, 2009) and the “Guidance on Accounting Standard for Accounting Changes and Error Corrections” (ASBJ Guidance No. 24 issued on December 4, 2009).
- 19 -
【Notes to quarterly consolidated financial statements】 (For quarterly consolidated balance sheet)
(Millions of yen) Prior fiscal year
(As of March 31, 2011) Current second quarter
(As of September 30, 2011)
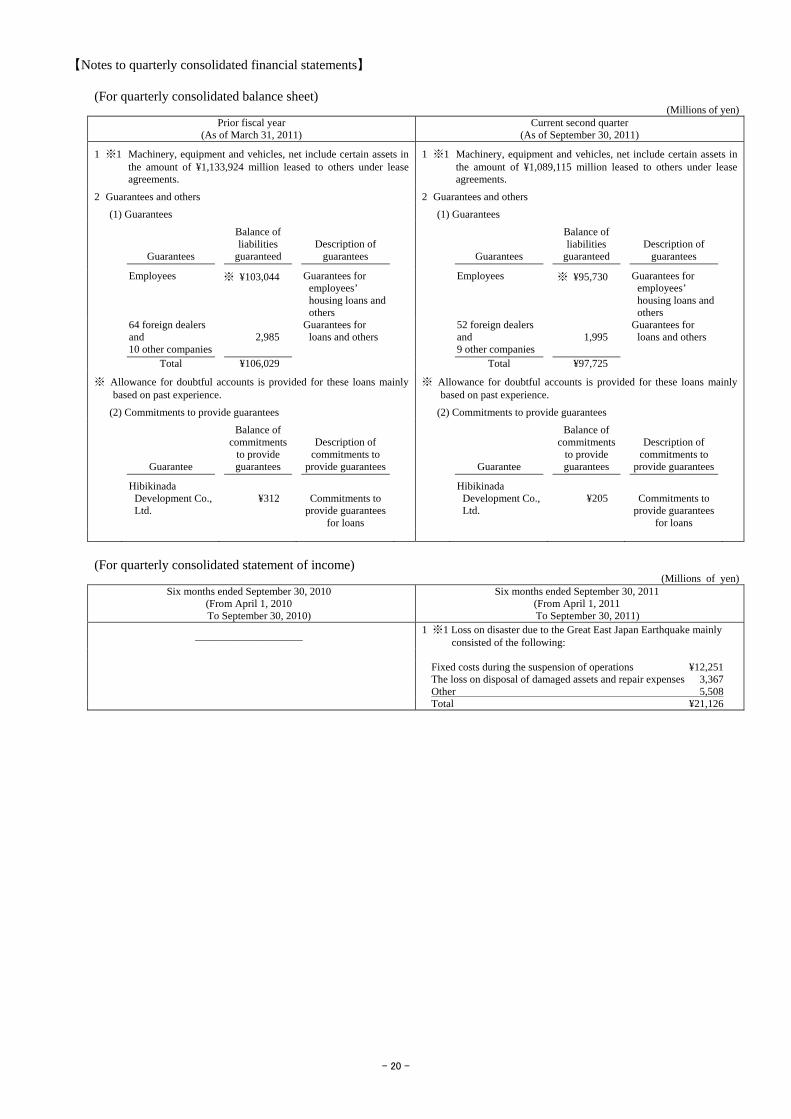
1 ※1 Machinery, equipment and vehicles, net include certain assets in the amount of ¥1,133,924 million leased to others under lease agreements.
1 ※1 Machinery, equipment and vehicles, net include certain assets in the amount of ¥1,089,115 million leased to others under lease agreements.
2 Guarantees and others 2 Guarantees and others
(1) Guarantees (1) Guarantees
Guarantees
Balance of liabilities
guaranteed Description of
guarantees
Guarantees
Balance of liabilities
guaranteed Description of
guarantees
Employees ※ ¥103,044 Guarantees for employees’ housing loans and others
Employees ※ ¥95,730 Guarantees for employees’ housing loans and others
64 foreign dealers and 2,985
Guarantees for loans and others
52 foreign dealers and 1,995
Guarantees for loans and others
10 other companies 9 other companies Total ¥106,029 Total ¥97,725
※ Allowance for doubtful accounts is provided for these loans mainly based on past experience.
(2) Commitments to provide guarantees
※ Allowance for doubtful accounts is provided for these loans mainly based on past experience.
(2) Commitments to provide guarantees
Guarantee
Balance of commitments
to provide guarantees
Description of commitments to
provide guarantees
Guarantee
Balance of commitments
to provide guarantees
Description of commitments to
provide guarantees
Hibikinada Development Co., Ltd.
¥312
Commitments to
provide guarantees for loans
Hibikinada Development Co., Ltd.
¥205
Commitments to
provide guarantees for loans
(For quarterly consolidated statement of income)
(Millions of yen) Six months ended September 30, 2010
(From April 1, 2010 To September 30, 2010)
Six months ended September 30, 2011 (From April 1, 2011
To September 30, 2011)
――――――――― 1 ※1 Loss on disaster due to the Great East Japan Earthquake mainly
consisted of the following: Fixed costs during the suspension of operations ¥12,251 The loss on disposal of damaged assets and repair expenses 3,367 Other 5,508 Total ¥21,126
- 20 -

(For quarterly consolidated statement of cash flows) (Millions of yen)
Six months ended September 30, 2010 (From April 1, 2010 To September 30, 2010)
Six months ended September 30, 2011 (From April 1, 2011
To September 30, 2011)
1 ※1 Cash and cash equivalents as of the end of the quarter under review are reconciled to the accounts reported in the quarterly consolidated balance sheet as follows:
1 ※1 Cash and cash equivalents as of the end of the quarter under review are reconciled to the accounts reported in the quarterly consolidated balance sheet as follows:
As of September 30, 2010: As of September 30, 2011: Cash on hand and in banks ¥735,013 Cash on hand and in banks ¥796,516 Time deposits with maturities of more than three months (64,344) Time deposits with maturities of more than three months (8,383) Cash equivalents included in securities (*) 65,498 Cash equivalents included in securities (*) 81,675 Cash and cash equivalents ¥736,167 Cash and cash equivalents ¥869,808
*This represents short-term, highly liquid investments readily convertible into cash held by foreign subsidiaries.
*This represents short-term, highly liquid investments readily convertible into cash held by foreign subsidiaries.
2 Significant non-cash transactions
Under the strategic cooperative relationship among the Company, Renault and Daimler AG, the three companies conducted capital alliance on April 28th, 2010. Followings are the transactions related to the Company.
(1) In accordance with the agreement between the Company and Renault, Renault delivered to the Company common shares of Daimler AG held by Renault. In response, the Company paid €584,246 thousand to Renault.
(2) In accordance with the agreement between the Company and Renault, the Company allotted to Renault the Company’s treasury shares (common shares). In response, Renault paid ¥73,738 million to the Company.
The Company made a yen selling/euro buying exchange contract for payment to Renault in (1) above and as a result, paid to Renault ¥73,738 million equivalent for common shares of Daimler AG, while at the same timing the Company received from Renault ¥73,738 million in exchange of the Company's treasury shares. From economical point of view these transactions were equivalent to an exchange of shares and were considered substantially as non-cash transactions. Therefore these are not presented in the quarterly consolidated cash flow statements.
Increase in Investment securities from the transactions mentioned above, ¥73,738 million
Decrease in Treasury shares from the transactions mentioned above, ¥99,990 million
Decrease in Retained earnings from the transactions mentioned above, ¥26,252 million
In addition to and on the same day with the capital alliance mentioned above, the following non-cash transactions were conducted for the purpose of maintaining the Company's equity ratio in Renault.
(3) The Company issued 1st unsecured convertible bond with share subscription right to Nissan Finance Co., Ltd. (”Nissan Finance") which is a 100% subsidiary of the Company. (Issue price: ¥7,555 million).
(4) Nissan Finance delivered Renault the convertible bond as investment in kind. In response, Renault issued its common shares to Nissan Finance.
(5) Renault immediately exercised the conversion right and the Company delivered its common shares to Renault using the Company's treasury shares.
Increase in Investment securities from the transactions mentioned above, ¥6,890 million
Decrease in Treasury shares from the transactions mentioned above, ¥10,244 million
Decrease in Retained earnings from the transactions mentioned above, ¥3,354 million
- 21 -

(For net assets) The six months ended September 30, 2010 (from April 1, 2010 to September 30, 2010) 1. Dividends paid
There were no applicable items during the six months ended September 30, 2010. 2. Dividends which the cutoff date fell in the period from April 1 to September 30, 2010, and the effective date
of which will be after September 30, 2010
Resolution Type of shares
Source of dividends
Total dividends
(Millions of yen)
Dividends per share
(Yen) Cut-off date Effective date
Meeting of the Board of
Directors on November 4,
2010
Common stock
Retained earnings 20,922 5 September 30,
2010 November 29,
2010
Note: Total dividends have been adjusted by the portion of dividends paid to Renault, an affiliate accounted for be the equity method.
3. Significant changes in the amount of shareholders’ equity
The Company transferred the treasury stocks on April 28, 2010 due to transfer of treasury stock by third party allotment and issued bonds with share subscription rights which were exercised for the purpose of the capital alliance among the Company, Renault and Daimler AG. The effect was to decrease Consolidated retained earnings by ¥20,731 million, to decrease Treasury stock by ¥106,302 million for the six months ended September 30, 2010. As a result, Consolidated retained earnings were ¥2,643,335 million and Treasury stock was ¥161,544 million at September 30, 2010.
The six months ended September 30, 2011 (from April 1, 2011 to September 30, 2011) 1. Dividends paid
Resolution Type of shares Total dividends (Millions of yen)
Dividends per share (Yen) Cut-off date Effective date Source of
dividends Annual general meeting of the
shareholders on June 29, 2011
Common stock 20,916 5 March 31,
2011 June 30,
2011 Retained earnings
Note: Total dividends have been adjusted by the portion of dividends paid to Renault, an affiliate accounted for be the equity method.
2. Dividends which the cutoff date fell in the period from April 1 to September 30, 2011, and the effective date
of which will be after September 30, 2011
Resolution Type of shares Total dividends (Millions of yen)
Dividends per share
(Yen) Cut-off date Effective date Source of
dividends
Meeting of the Board of
Directors on November 2,
2011
Common stock 41,832 10 September 30,
2011 November 29,
2011 Retained earnings
Note: Total dividends have been adjusted by the portion of dividends paid to Renault, an affiliate accounted for be the equity method.
- 22 -

(Segments of an enterprise and related information)
Segment information
1. General information about reportable segments The reportable segments of the Group are components for which discrete financial information is available and whose operating results are regularly reviewed by the Executive Committee to make decision about resource allocation and to assess their performance. Businesses of the Group are segmented into Automobile and Sales Financing based on feature of products and services. The Automobile business includes manufacturing and sales of vehicles, forklifts, marine products and related parts. The Sales Financing business provides sales finance service and leasing to support sales activities of the above business.
2. Calculation method of Sales and profits or losses by reportable segment
The accounting method for the reportable segments is the same as basis of preparation for the quarterly consolidated financial statements. The segment profits or losses are based on operating income or loss. Inter-segment sales are based on the price in arms-lengths transaction.
3. Sales and profits or losses by reportable segment The six months ended September 30, 2010 (from April 1, 2010 to September 30, 2010)
(Millions of yen) Reportable segments
Automobile Sales
financing Total
Elimination of inter-segment transactions
Six months ended
September 30, 2010
4,065,103 253,974 4,319,077 ― 4,319,077Net sales (1) Sales to third parties (2) Inter-segment sales 10,844 3,884 14,728 (14,728) ―
Total 4,075,947 257,858 4,333,805 (14,728) 4,319,077Segment profits 279,910 51,929 331,839 3,025 334,864
Prior second quarter (from July 1, 2010 to September 30, 2010)
(Millions of yen) Reportable segments
Automobile Sales financing
Total Elimination of inter-segment transactions
Prior second quarter
2,146,062 122,878 2,268,940 ― 2,268,940Net sales (1) Sales to third parties (2) Inter-segment sales 5,489 2,080 7,569 (7,569) ―
Total 2,151,551 124,958 2,276,509 (7,569) 2,268,940Segment profits 139,311 25,777 165,088 1,867 166,955
- 23 -

Notes: 1. Quarterly consolidated financial statements by business segment • The sales financing segment consists of Nissan Financial Services Co., Ltd. (Japan), Nissan Motor
Acceptance Corporation (USA), NR Finance Mexico S.A de C.V, SOFOM E.N.R (Mexico), other 7 companies, and the sales finance operations of Nissan Canada Inc. (Canada).
• The financial data on Automobile & Eliminations represent the differences between the consolidated figures and those for the Sales Financing segment.
(1) Summarized quarterly consolidated balance sheets by business segment
(Millions of yen) Prior second quarter (As of September 30, 2010)
Automobile & Eliminations Sales financing Consolidated
total
Assets I Current assets
Cash on hand and in banks 726,618 8,395 735,013Trade notes and accounts receivable 691,125 276 691,401Sales finance receivables (98,371) 2,712,802 2,614,431Inventories 912,931 17,382 930,313Other current assets 489,710 155,297 645,007
Total current assets 2,722,013 2,894,152 5,616,165II Fixed assets
Property, plant and equipment 2,559,826 1,101,871 3,661,697Investment securities 318,570 3,772 322,342Other fixed assets 341,948 143,136 485,084
Total fixed assets 3,220,344 1,248,779 4,469,123Total assets 5,942,357 4,142,931 10,085,288
Liabilities I Current liabilities
Trade notes and accounts payable 1,128,359 17,987 1,146,346Short-term borrowings (299,148) 1,784,547 1,485,399Lease obligations 74,066 182 74,248Other current liabilities 965,755 116,261 1,082,016
Total current liabilities 1,869,032 1,918,977 3,788,009II Long-term liabilities
Bonds 369,992 192,891 562,883Long-term borrowings 411,700 1,183,194 1,594,894Lease obligations 80,369 261 80,630Other long-term liabilities 486,294 417,669 903,963
Total long-term liabilities 1,348,355 1,794,015 3,142,370Total liabilities 3,217,387 3,712,992 6,930,379
Net assets I Shareholders’ equity
Common stock 497,328 108,486 605,814Capital surplus 773,623 30,847 804,470Retained earnings 2,253,896 389,439 2,643,335Treasury stock (161,544) ― (161,544)
Total shareholders’ equity 3,363,303 528,772 3,892,075II Valuation, translation adjustments and others
Translation adjustments (957,391) (99,176) (1,056,567)Other 2,470 (6,165) (3,695)
Total valuation, translation adjustments and others (954,921) (105,341) (1,060,262)
III Share subscription rights 2,419 ― 2,419IV Minority interests 314,169 6,508 320,677
Total net assets 2,724,970 429,939 3,154,909Total liabilities and net assets 5,942,357 4,142,931 10,085,288
Notes: 1. The sales finance receivables of Automobile & Eliminations represent the amount eliminated for intercompany transactions related to wholesale finance made by the Sales financing segment.
2. The borrowings of Automobile & Eliminations represent the amount after deducting internal loans receivable from the Sales financing segment amounting to ¥734,056 million.
- 24 -

(2) Summarized quarterly consolidated statements of income by business segment
(Millions of yen)
Six months ended September 30, 2010
(From April 1, 2010 To September 30, 2010)
Automobile & Eliminations Sales financing Consolidated
total Net sales 4,061,219 257,858 4,319,077
Cost of sales 3,287,190 172,289 3,459,479Gross profit 774,029 85,569 859,598
Operating income as a percentage of net sales 7.0% 20.1% 7.8%Operating income 282,935 51,929 334,864
Financial income/expenses, net (6,779) (23) (6,802)Other non-operating income and expenses, net (12,603) (323) (12,926)
Ordinary income 263,553 51,583 315,136Income before income taxes and minority interests 264,144 51,337 315,481Net income 174,709 33,672 208,381
(3) Summarized quarterly consolidated statements of cash flows by business segment
(Millions of yen)
Six months ended September 30, 2010
(From April 1, 2010 To September 30, 2010)
Automobile & Eliminations Sales financing Consolidated
total
I Cash flows from operating activities Income before income taxes and minority interests 264,144 51,337 315,481
Depreciation and amortization 199,520 114,702 314,222Decrease (increase) in sales finance receivables 26,118 (205,831) (179,713)Others (186,146) (21,443) (207,589)
Net cash provided by (used in) operating activities
303,636 (61,235) 242,401
II Cash flows from investing activities Proceeds from sales of investment securities 556 ― 556Proceeds from sales of fixed assets 18,695 199 18,894Purchase of fixed assets (110,083) (558) (110,641)Purchase of leased vehicles (12,311) (305,495) (317,806)Proceeds from sales of leased vehicles 1,688 184,520 186,208Others 13,516 98,688 112,204
Net cash used in investing activities (87,939) (22,646) (110,585)III Cash flows from financing activities
Net increase (decrease) in short-term borrowings (52,789) 108,583 55,794
Net changes in long-term borrowings and redemption of bonds (201,479) (92,876) (294,355)
Proceeds from issuance of bonds 99,750 64,652 164,402Others (38,006) (105) (38,111)
Net cash provided by (used in) financing activities (192,524) 80,254 (112,270)
IV Effects of exchange rate changes on cash and cash equivalents (49,073) (1,115) (50,188)
V Increase (decrease) in cash and cash equivalents (25,900) (4,742) (30,642)VI Cash and cash equivalents at beginning of the
period 746,528 14,967 761,495VII Increase due to inclusion in consolidation 5,314 ― 5,314VIII Cash and cash equivalents at end of the period 725,942 10,225 736,167
Notes: 1. The net increase (decrease) in short-term borrowings of Automobile & Eliminations includes the amount of ¥56,177 million eliminated for increase in internal loans receivable from the Sales financing segment.
2. The net change in long-term borrowings and redemption of bonds of Automobile & Eliminations includes the amount of ¥11,866 million eliminated for decrease in internal loans receivable from the Sales financing segment.
- 25 -

Notes: 2. Sales and profits or losses by region
The six months ended September 30, 2010 (from April 1, 2010 to September 30, 2010)
(Millions of yen)
Japan North America Europe Asia
Other foreign
countries Total Eliminations Consolidated
Net sales (1) Sales to third
parties 1,102,645 1,487,336 582,044 832,772 314,280 4,319,077 ― 4,319,077
(2) Inter-segment sales 1,132,159 85,431 50,590 115,922 2,781 1,386,883 (1,386,883) ―
Total 2,234,804 1,572,767 632,634 948,694 317,061 5,705,960 (1,386,883) 4,319,077Operating income 84,981 129,098 27,613 95,874 9,202 346,768 (11,904) 334,864
Prior second quarter (from July 1, 2010 to September 30, 2010) (Millions of yen)
Japan North America Europe Asia
Other foreign
countries Total Eliminations Consolidated
Net sales (1) Sales to third
parties 620,576 753,390 290,030 448,496 156,448 2,268,940 ― 2,268,940
(2) Inter-segment sales 571,103 44,461 27,914 66,530 1,561 711,569 (711,569) ―
Total 1,191,679 797,851 317,944 515,026 158,009 2,980,509 (711,569) 2,268,940Operating income 41,702 62,264 12,558 51,135 5,975 173,634 (6,679) 166,955Notes: 1. Regions are representing the location of the Company and its group companies.
2. Areas are segmented based on their geographical proximity and their mutual operational relationship. 3. Major countries and areas which belong to segments other than Japan are as follows:
(1) North America : The United States of America, Canada and Mexico (2) Europe : France, The United Kingdom, Spain and other European countries (3) Asia : China, Thailand, India and other Asian countries (4) Other foreign countries : Oceania, the Middle East, Central and South America excluding Mexico, and
South Africa
- 26 -
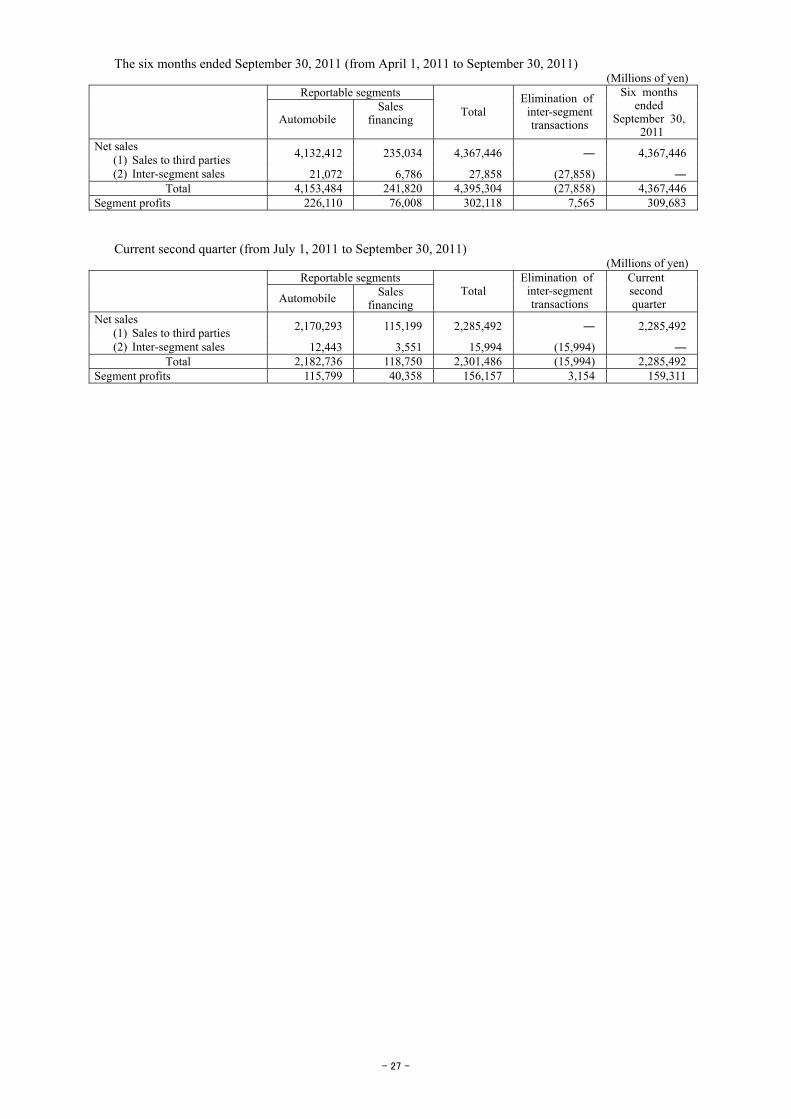
The six months ended September 30, 2011 (from April 1, 2011 to September 30, 2011) (Millions of yen)
Reportable segments Automobile
Sales financing
Total Elimination of inter-segment transactions
Six months ended
September 30, 2011
4,132,412 235,034 4,367,446 ― 4,367,446Net sales (1) Sales to third parties (2) Inter-segment sales 21,072 6,786 27,858 (27,858) ―
Total 4,153,484 241,820 4,395,304 (27,858) 4,367,446Segment profits 226,110 76,008 302,118 7,565 309,683
Current second quarter (from July 1, 2011 to September 30, 2011) (Millions of yen)
Reportable segments Automobile Sales
financing Total
Elimination of inter-segment transactions
Current second quarter
2,170,293 115,199 2,285,492 ― 2,285,492Net sales (1) Sales to third parties (2) Inter-segment sales 12,443 3,551 15,994 (15,994) ―
Total 2,182,736 118,750 2,301,486 (15,994) 2,285,492Segment profits 115,799 40,358 156,157 3,154 159,311
- 27 -

Notes: 1. Quarterly consolidated financial statements by business segment • The sales financing segment consists of Nissan Financial Services Co., Ltd. (Japan), Nissan Motor
Acceptance Corporation (USA), NR Finance Mexico S.A de C.V, SOFOM E.N.R (Mexico), other 7 companies, and the sales finance operations of Nissan Canada Inc. (Canada).
• The financial data on Automobile & Eliminations represent the differences between the consolidated figures and those for the Sales Financing segment.
(1) Summarized quarterly consolidated balance sheets by business segment
(Millions of yen) Current second quarter (As of September 30, 2011)
Automobile & Eliminations Sales financing Consolidated
total
Assets I Current assets
Cash on hand and in banks 775,330 21,186 796,516Trade notes and accounts receivable 716,889 467 717,356Sales finance receivables (86,388) 2,800,807 2,714,419Inventories 1,023,855 10,838 1,034,693Other current assets 673,524 188,871 862,395
Total current assets 3,103,210 3,022,169 6,125,379II Fixed assets
Property, plant and equipment 2,344,778 1,108,530 3,453,308Investment securities 369,183 4,423 373,606Other fixed assets 252,073 106,346 358,419
Total fixed assets 2,966,034 1,219,299 4,185,333Total assets 6,069,244 4,241,468 10,310,712
Liabilities I Current liabilities
Trade notes and accounts payable 1,305,908 17,297 1,323,205Short-term borrowings (472,387) 1,882,107 1,409,720Lease obligations 58,417 71 58,488Other current liabilities 966,772 122,235 1,089,007
Total current liabilities 1,858,710 2,021,710 3,880,420II Long-term liabilities
Bonds 339,996 257,368 597,364Long-term borrowings 547,278 1,083,347 1,630,625Lease obligations 45,311 145 45,456Other long-term liabilities 465,552 447,559 913,111
Total long-term liabilities 1,398,137 1,788,419 3,186,556Total liabilities 3,256,847 3,810,129 7,066,976
Net assets I Shareholders’ equity
Common stock 486,106 119,708 605,814Capital surplus 773,623 30,847 804,470Retained earnings 2,482,975 412,774 2,895,749Treasury stock (162,027) ― (162,027)
Total shareholders’ equity 3,580,677 563,329 4,144,006II Accumulated other comprehensive income
Translation adjustments (1,088,204) (131,076) (1,219,280)Other (9,974) (7,643) (17,617)
Total accumulated other comprehensive income (1,098,178) (138,719) (1,236,897)
III Share subscription rights 2,415 ― 2,415IV Minority interests 327,483 6,729 334,212
Total net assets 2,812,397 431,339 3,243,736Total liabilities and net assets 6,069,244 4,241,468 10,310,712
Notes: 1. The sales finance receivables of Automobile & Eliminations represent the amount eliminated for intercompany transactions related to wholesale finance made by the Sales financing segment.
2. The borrowings of Automobile & Eliminations represent the amount after deducting internal loans receivable from the Sales financing segment amounting to ¥1,046,228 million.
- 28 -
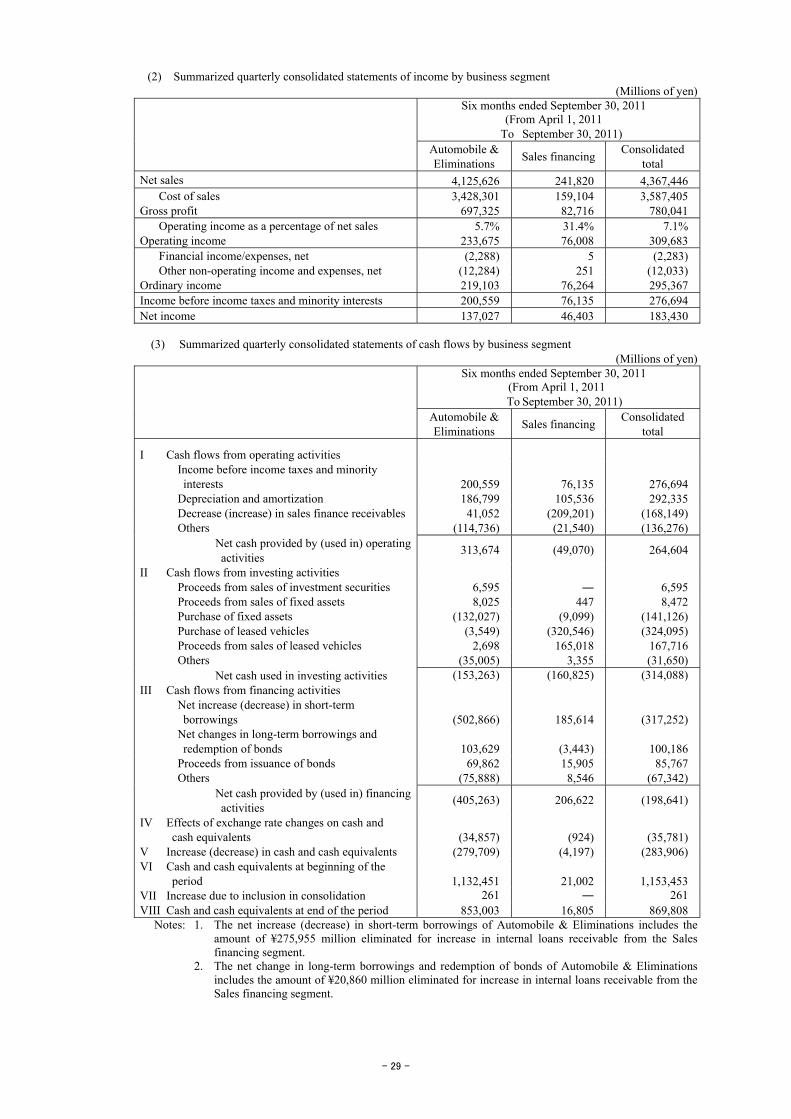
(2) Summarized quarterly consolidated statements of income by business segment
(Millions of yen)
Six months ended September 30, 2011
(From April 1, 2011 To September 30, 2011)
Automobile & Eliminations Sales financing Consolidated
total Net sales 4,125,626 241,820 4,367,446
Cost of sales 3,428,301 159,104 3,587,405Gross profit 697,325 82,716 780,041
Operating income as a percentage of net sales 5.7% 31.4% 7.1%Operating income 233,675 76,008 309,683
Financial income/expenses, net (2,288) 5 (2,283)Other non-operating income and expenses, net (12,284) 251 (12,033)
Ordinary income 219,103 76,264 295,367Income before income taxes and minority interests 200,559 76,135 276,694Net income 137,027 46,403 183,430
(3) Summarized quarterly consolidated statements of cash flows by business segment
(Millions of yen)
Six months ended September 30, 2011
(From April 1, 2011 To September 30, 2011)
Automobile & Eliminations Sales financing Consolidated
total
I Cash flows from operating activities Income before income taxes and minority interests 200,559 76,135 276,694
Depreciation and amortization 186,799 105,536 292,335Decrease (increase) in sales finance receivables 41,052 (209,201) (168,149)Others (114,736) (21,540) (136,276)
Net cash provided by (used in) operating activities
313,674 (49,070) 264,604
II Cash flows from investing activities Proceeds from sales of investment securities 6,595 ― 6,595Proceeds from sales of fixed assets 8,025 447 8,472Purchase of fixed assets (132,027) (9,099) (141,126)Purchase of leased vehicles (3,549) (320,546) (324,095)Proceeds from sales of leased vehicles 2,698 165,018 167,716Others (35,005) 3,355 (31,650)
Net cash used in investing activities (153,263) (160,825) (314,088)III Cash flows from financing activities
Net increase (decrease) in short-term borrowings (502,866) 185,614 (317,252)
Net changes in long-term borrowings and redemption of bonds 103,629 (3,443) 100,186
Proceeds from issuance of bonds 69,862 15,905 85,767Others (75,888) 8,546 (67,342)
Net cash provided by (used in) financing activities (405,263) 206,622 (198,641)
IV Effects of exchange rate changes on cash and cash equivalents (34,857) (924) (35,781)
V Increase (decrease) in cash and cash equivalents (279,709) (4,197) (283,906)VI Cash and cash equivalents at beginning of the
period 1,132,451 21,002 1,153,453VII Increase due to inclusion in consolidation 261 ― 261VIII Cash and cash equivalents at end of the period 853,003 16,805 869,808
Notes: 1. The net increase (decrease) in short-term borrowings of Automobile & Eliminations includes the amount of ¥275,955 million eliminated for increase in internal loans receivable from the Sales financing segment.
2. The net change in long-term borrowings and redemption of bonds of Automobile & Eliminations includes the amount of ¥20,860 million eliminated for increase in internal loans receivable from the Sales financing segment.
- 29 -

Notes: 2. Sales and profits or losses by region
The six months ended September 30, 2011 (from April 1, 2011 to September 30, 2011)
(Millions of yen)
Japan North America Europe Asia
Other foreign
countries Total Eliminations Consolidated
Net sales (1) Sales to third
parties 1,021,269 1,442,066 758,735 844,395 300,981 4,367,446 ― 4,367,446
(2) Inter-segment sales 1,198,845 70,080 56,575 173,561 4,192 1,503,253 (1,503,253) ―
Total 2,220,114 1,512,146 815,310 1,017,956 305,173 5,870,699 (1,503,253) 4,367,446Operating income 56,221 132,652 16,486 91,979 12,366 309,704 (21) 309,683
Current second quarter (from July 1, 2011 to September 30, 2011) (Millions of yen)
Japan North America Europe Asia
Other foreign
countries Total Eliminations Consolidated
Net sales (1) Sales to third
parties 566,078 766,890 360,350 429,033 163,141 2,285,492 ― 2,285,492
(2) Inter-segment sales 671,058 41,180 29,092 99,742 2,351 843,423 (843,423) ―
Total 1,237,136 808,070 389,442 528,775 165,492 3,128,915 (843,423) 2,285,492Operating income 42,022 60,603 7,248 44,391 7,441 161,705 (2,394) 159,311Notes: 1. Regions are representing the location of the Company and its group companies.
2. Areas are segmented based on their geographical proximity and their mutual operational relationship. 3. Major countries and areas which belong to segments other than Japan are as follows:
(1) North America : The United States of America, Canada and Mexico (2) Europe : France, The United Kingdom, Spain and other European countries (3) Asia : China, Thailand, India and other Asian countries (4) Other foreign countries : Oceania, the Middle East, Central and South America excluding Mexico, and
South Africa
- 30 -

4. Information about impairment loss of fixed assets by reportable segment The six months ended September 30, 2010 (from April 1, 2010 to September 30, 2010) There were no significant impairment losses of fixed assets in the reportable segments for the six months ended September 30, 2010. The six months ended September 30, 2011 (from April 1, 2011 to September 30, 2011) There were no significant impairment losses of fixed assets in the reportable segments for the six months ended September 30, 2011.
5. Information about goodwill by reportable segment
The six months ended September 30, 2010 (from April 1, 2010 to September 30, 2010) There were no significant changes in the reported amounts of goodwill in the reportable segments for the six months ended September 30, 2010. The six months ended September 30, 2011 (from April 1, 2011 to September 30, 2011) There were no significant changes in the reported amounts of goodwill in the reportable segments for the six months ended September 30, 2011.
6. Information about gain recognized on negative goodwill by reportable segment
The six months ended September 30, 2010 (from April 1, 2010 to September 30, 2010) There were no significant gains recognized on negative goodwill in the reportable segments for the six months ended September 30, 2010. The six months ended September 30, 2011 (from April 1, 2011 to September 30, 2011) There were no significant gains recognized on negative goodwill in the reportable segments for the six months ended September 30, 2011.
- 31 -

7. Information about geographical area Net sales The six months ended September 30, 2010 (from April 1, 2010 to September 30, 2010)
(Millions of yen) Japan North America Europe Asia Total
U.S.A. China
Other foreign countries
972,711 1,400,834 1,167,505 592,569 930,068 694,729 422,895 4,319,077
Prior second quarter (from July 1, 2010 to September 30, 2010)
(Millions of yen) Japan North America Europe Asia Total
U.S.A. China
Other foreign countries
556,561 704,930 594,185 295,896 513,214 375,568 198,339 2,268,940
Notes: 1. Regions are representing customers’ location. 2. Areas are segmented based on their geographical proximity and their mutual operational relationship.
3. Major countries and areas which belong to segments other than Japan are as follows: (1) North America : The United States of America, Canada and Mexico
(2) Europe : France, The United Kingdom, Spain and other European countries (3) Asia : China, Thailand, India and other Asian countries (4) Other foreign countries : Oceania, the Middle East, Central and South America excluding Mexico, and South
Africa, etc. The six months ended September 30, 2011 (from April 1, 2011 to September 30, 2011)
(Millions of yen) Japan North America Europe Asia Total
U.S.A. China
Other foreign countries
877,751 1,363,439 1,132,179 743,793 895,724 689,924 486,739 4,367,446
Current second quarter (from July 1, 2011 to September 30, 2011)
(Millions of yen) Japan North America Europe Asia Total
U.S.A. China
Other foreign countries
481,028 725,651 606,294 339,161 441,191 343,967 298,461 2,285,492
Notes: 1. Regions are representing customers’ location. 2. Areas are segmented based on their geographical proximity and their mutual operational relationship.
3. Major countries and areas which belong to segments other than Japan are as follows: (1) North America : The United States of America, Canada and Mexico
(2) Europe : France, The United Kingdom, Spain and other European countries (3) Asia : China, Thailand, India and other Asian countries (4) Other foreign countries : Oceania, the Middle East, Central and South America excluding Mexico, and South
Africa, etc. .
- 32 -

(For securities) For the fiscal year ended March 31, 2011 Other securities
(Millions of yen) Types of securities Acquisition cost Carrying value Difference
Stock 77,748 114,405 36,657Others 158,007 158,007 ―
Subtotal 235,755 272,412 36,657 For the six months ended September 30, 2011 Other securities are significant for the management of the Group’s business operations and underwent significant changes in value compared to the end of the prior fiscal year as follows.
(Millions of yen) Types of securities Acquisition cost Carrying value Difference
Stock 78,320 76,819 △1,501Others 81,675 81,675 ―
Subtotal 159,995 158,494 △1,501
- 33 -

(Amounts per share) Basic and diluted net income per share and their basis for calculation are as follows.
Six months ended September 30, 2010
(From April 1, 2010 To September 30, 2010)
Six months ended September 30, 2011
(From April 1, 2011 To September 30, 2011)
(1) Basic net income per share ¥49.98 ¥43.85(Basis for calculation) Net income (Millions of yen) 208,381 183,430Net income attributable to shares of common stock (Millions of yen) 208,381 183,430
Average number of shares of common stock during the period (Thousands) 4,169,150 4,183,135
(2) Diluted net income per share ― ¥43.84(Basis for calculation)
Effects of dilutive securities (Millions of yen) ― (36)
Any significant changes from the prior fiscal year-end in potential securities excluded from the computation of diluted net income per share because they do not have dilutive effects
― ―
Note: Diluted net income per share for the six months ended September 30, 2010, is not presented because the Company had no securities with dilutive effects.
(Significant subsequent events) There were no applicable matters.
- 34 -

2. Other Interim dividends for the fiscal year ending March 31, 2012 were approved on November 2, 2011 by resolution of the meeting of the Board of Directors as follows: According to its Articles of Incorporation, the Company plans to pay the following cash dividends to shareholders of record on September 30, 2011.
(1) Total interim dividends: ¥41,832 million (2) Dividends per share: ¥10 (3) Entitlement date and commencement date of the payment: November 29, 2011 Note: Total dividends were obtained by deducting the amount corresponding to the equity of Renault shares
held by the Company. Total amount of dividends before deducting the amount corresponding to the equity of Renault shares held by the Company was ¥44,816 million.
- 35 -
Part II Information on Guarantors for the Company
Not applicable
- 36 -
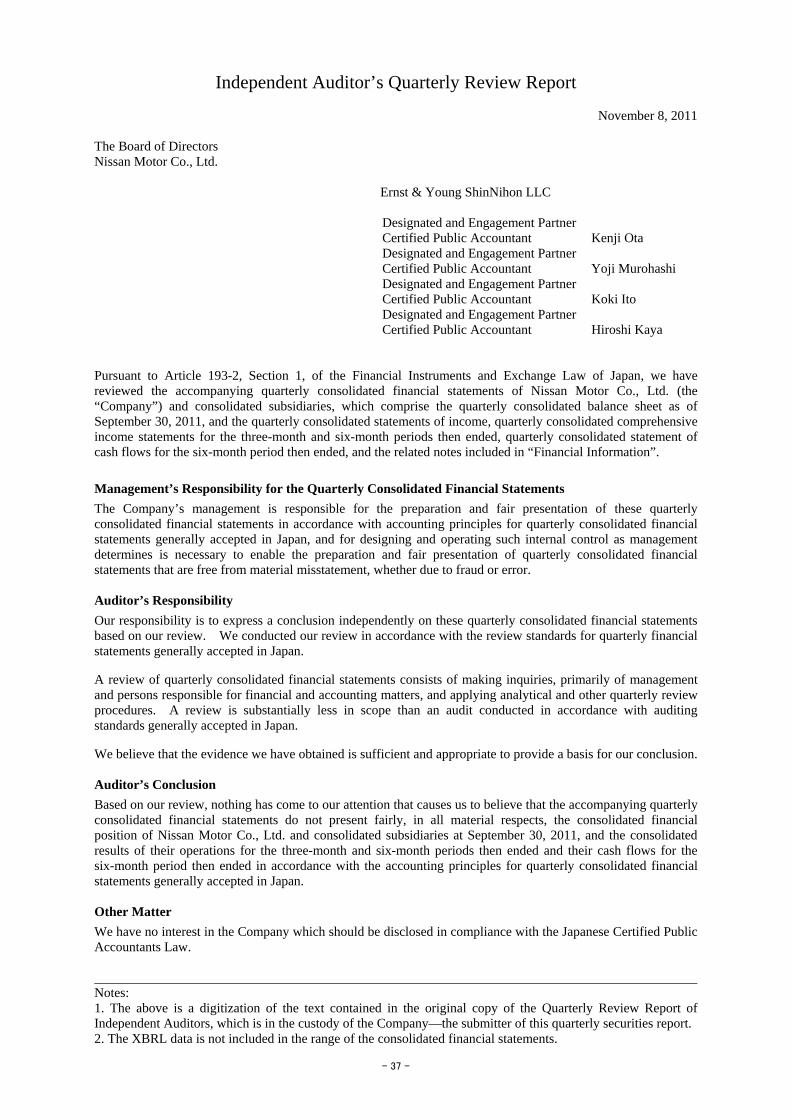
Independent Auditor’s Quarterly Review Report
November 8, 2011 The Board of Directors Nissan Motor Co., Ltd.
Ernst & Young ShinNihon LLC Designated and Engagement Partner Certified Public Accountant Kenji Ota Designated and Engagement Partner Certified Public Accountant Yoji Murohashi Designated and Engagement Partner Certified Public Accountant Koki Ito Designated and Engagement Partner Certified Public Accountant Hiroshi Kaya Pursuant to Article 193-2, Section 1, of the Financial Instruments and Exchange Law of Japan, we have reviewed the accompanying quarterly consolidated financial statements of Nissan Motor Co., Ltd. (the “Company”) and consolidated subsidiaries, which comprise the quarterly consolidated balance sheet as of September 30, 2011, and the quarterly consolidated statements of income, quarterly consolidated comprehensive income statements for the three-month and six-month periods then ended, quarterly consolidated statement of cash flows for the six-month period then ended, and the related notes included in “Financial Information”. Management’s Responsibility for the Quarterly Consolidated Financial Statements The Company’s management is responsible for the preparation and fair presentation of these quarterly consolidated financial statements in accordance with accounting principles for quarterly consolidated financial statements generally accepted in Japan, and for designing and operating such internal control as management determines is necessary to enable the preparation and fair presentation of quarterly consolidated financial statements that are free from material misstatement, whether due to fraud or error. Auditor’s Responsibility Our responsibility is to express a conclusion independently on these quarterly consolidated financial statements based on our review. We conducted our review in accordance with the review standards for quarterly financial statements generally accepted in Japan. A review of quarterly consolidated financial statements consists of making inquiries, primarily of management and persons responsible for financial and accounting matters, and applying analytical and other quarterly review procedures. A review is substantially less in scope than an audit conducted in accordance with auditing standards generally accepted in Japan. We believe that the evidence we have obtained is sufficient and appropriate to provide a basis for our conclusion. Auditor’s Conclusion Based on our review, nothing has come to our attention that causes us to believe that the accompanying quarterly consolidated financial statements do not present fairly, in all material respects, the consolidated financial position of Nissan Motor Co., Ltd. and consolidated subsidiaries at September 30, 2011, and the consolidated results of their operations for the three-month and six-month periods then ended and their cash flows for the six-month period then ended in accordance with the accounting principles for quarterly consolidated financial statements generally accepted in Japan. Other Matter We have no interest in the Company which should be disclosed in compliance with the Japanese Certified Public Accountants Law. Notes: 1. The above is a digitization of the text contained in the original copy of the Quarterly Review Report of Independent Auditors, which is in the custody of the Company—the submitter of this quarterly securities report. 2. The XBRL data is not included in the range of the consolidated financial statements.
- 37 -

【Cover】
【Document Submitted】 Confirmation Note
【Article of the Applicable Law Requiring
Submission of This Document】
Article 24-4-8, Paragraph 1, of the Financial Instruments and
Exchange Law
【Filed to】 Director, Kanto Local Finance Bureau
【Date of Submission】 November 9, 2011
【Company Name】 Nissan Jidosha Kabushiki-Kaisha
【Company Name (in English)】 Nissan Motor Co., Ltd.
【Position and Name of Representative】 Carlos Ghosn, President
【Position and Name of Chief Financial
Officer】
Joseph G. Peter, Executive Vice President
【Location of Head Office】 2, Takaracho, Kanagawa-ku, Yokohama-shi, Kanagawa
【Place Where Available for Public
Inspection】
Tokyo Stock Exchange, Inc.
2-1, Nihonbashi Kabutocho, Chuo-ku, Tokyo
- 38 -

1. Accuracy of the Descriptions in This Quarterly Securities Report Carlos Ghosn, President of Nissan Motor Co., Ltd., and Joseph G. Peter, Executive Vice President have confirmed that this quarterly securities report for the second quarter (from July 1 to September 30, 2011) of the 113th Fiscal Term is reasonably and fairly described in accordance with the Financial Instruments and Exchange Law.
2. Special Affairs
There are no noteworthy matters that are pertinent to this quarterly securities report.
- 39 -