Nippon Life India Asset Management - HDFC securities
10
28 July 2020 Results Review 1QFY21 Nippon Life India Asset Management HSIE Research is also available on Bloomberg ERH HDF <GO> & Thomson Reuters Market share remains elusive While we remain concerned about the loss of market share in both debt and equity assets—down 332/275bps since Mar-19 to 7.5/6.8%—we believe that post ownership change, NAM stands to benefit from increased credibility to raise HNI/institutional capital. We expect the company to focus on improving investment return performance and gradually recoup part of its lost market share, although this journey would neither be easy nor inexpensive. We expect NAM to post an FY21-23E revenue/PAT CAGR of 13.7/15.8% and retain a REDUCE rating with TP of Rs 280 i.e. at 36x (20% discount to HDFCAMC’s multiple) FY22E NOPLAT + cash and investments. Any signs of improving performance and market share will be key re-rating drivers for the stock. 1QFY21 highlights: Revenue at Rs 2.33bn (-28.3%/-15.1% YoY/QoQ) was 5.1% below our estimate as outflows from the credit risk fund and a reduction of equity in the mix resulted in a lower yield. Debt/equity QAAUM market share deteriorated 246/235bps YoY to 7.5/6.8%. Debt funds QAAUM declined 9.0% QoQ due to outflows and write-downs. The core operating profit was at Rs 966mn, -33.5/36.6% YoY/QoQ, mainly due to lower revenue. Recovery in equity markets and decline in bond yields resulted in treasury income of Rs 1.03bn (+192% YoY), raising APAT by 24.3% YoY to Rs 1.56bn. Management stated that it raised capital from HNIs/family offices (75+), corporate (26/100 BSE 100 began reinvesting), and institutions (adds: 120+ since Oct-19). NAM is revisiting its investment policy with the intent of reducing the volatility of treasury income. Outlook: We expect a gradual recovery in assets and earnings. For FY21E, we expect revenue/EBIT to decline 15.0/21.2% YoY respectively. Financial Summary (Rs bn) 1Q FY21 1Q FY20 YoY (%) 4Q FY20 QoQ (%) FY19 FY20 FY21E FY22E FY23E Revenue 2.33 3.25 -28.3 2.75 -15.1 14.8 12.0 10.2 11.7 13.2 Operating profits 0.97 1.45 -33.5 1.52 -36.6 5.3 5.7 4.5 5.5 6.6 OP Margin (%) 42.0 45.2 -322bps 55.6 -1366bps 35.8 47.3 43.8 47.4 49.8 APAT 1.56 1.25 24.6 0.04 4,101.6 4.9 4.2 4.9 5.7 6.6 EV/NOPLAT (x) 39.9 34.4 42.8 33.9 27.9 P/E (x) 34.0 40.7 34.4 29.8 25.6 ROE (%) 19.5 16.1 18.5 19.9 21.1 Source: Company, HSIE Research Change in estimates (Rs bn) FY21E Revised FY21E Old Change % / bps FY22E Revised FY22E Old Change % / bps Revenues 10.2 10.1 1.3 11.7 11.4 2.3 EBIT 4.5 4.4 3.9 5.6 5.4 3.7 EBIT margin (%) 44.3 43.1 114bps 47.8 47.2 64bps NOPLAT 3.4 3.3 3.7 4.2 4.0 3.4 NOPLAT margin (%) 33.0 32.2 77bps 35.8 35.4 36bps APAT 4.9 4.6 6.2 5.7 5.5 2.6 RoE (%) 18.5 17.6 97bps 19.9 19.6 30bps Source: Company, HSIE Research REDUCE CMP (as on 27 July 2020) Rs 270 Target Price Rs 280 NIFTY 11,132 KEY CHANGES OLD NEW Rating REDUCE REDUCE Price Target Rs 271 Rs 280 EPS % FY21E FY22E +6.2% +2.6% KEY STOCK DATA Bloomberg code NAM IN No. of Shares (mn) 612 MCap (Rs bn) / ($ mn) 165/2,213 6m avg traded value (Rs mn) 664 52 Week high / low Rs 453/201 STOCK PERFORMANCE (%) 3M 6M 12M Absolute (%) 12.2 (26.3) 18.9 Relative (%) (7.3) (18.4) 18.7 SHAREHOLDING PATTERN (%) Mar-20 Jun-20 Promoters 75.9 75.9 FIs & Local MFs 6.7 6.2 FPIs 5.3 5.8 Public & Others 12.1 12.1 Pledged Shares 0.00 0.00 Source : BSE Madhukar Ladha, CFA [email protected] +91-22-6171-7323
Transcript of Nippon Life India Asset Management - HDFC securities

28 July 2020 Results Review 1QFY21
Nippon Life India Asset Management
HSIE Research is also available on Bloomberg ERH HDF <GO> & Thomson Reuters
Market share remains elusive While we remain concerned about the loss of market share in both debt and
equity assets—down 332/275bps since Mar-19 to 7.5/6.8%—we believe that
post ownership change, NAM stands to benefit from increased credibility to
raise HNI/institutional capital. We expect the company to focus on improving
investment return performance and gradually recoup part of its lost market
share, although this journey would neither be easy nor inexpensive. We
expect NAM to post an FY21-23E revenue/PAT CAGR of 13.7/15.8% and retain
a REDUCE rating with TP of Rs 280 i.e. at 36x (20% discount to HDFCAMC’s
multiple) FY22E NOPLAT + cash and investments. Any signs of improving
performance and market share will be key re-rating drivers for the stock.
1QFY21 highlights: Revenue at Rs 2.33bn (-28.3%/-15.1% YoY/QoQ) was
5.1% below our estimate as outflows from the credit risk fund and a
reduction of equity in the mix resulted in a lower yield. Debt/equity
QAAUM market share deteriorated 246/235bps YoY to 7.5/6.8%. Debt funds
QAAUM declined 9.0% QoQ due to outflows and write-downs. The core
operating profit was at Rs 966mn, -33.5/36.6% YoY/QoQ, mainly due to
lower revenue. Recovery in equity markets and decline in bond yields
resulted in treasury income of Rs 1.03bn (+192% YoY), raising APAT by
24.3% YoY to Rs 1.56bn.
Management stated that it raised capital from HNIs/family offices (75+),
corporate (26/100 BSE 100 began reinvesting), and institutions (adds: 120+
since Oct-19). NAM is revisiting its investment policy with the intent of
reducing the volatility of treasury income.
Outlook: We expect a gradual recovery in assets and earnings. For FY21E,
we expect revenue/EBIT to decline 15.0/21.2% YoY respectively.
Financial Summary
(Rs bn) 1Q
FY21
1Q
FY20
YoY
(%)
4Q
FY20 QoQ (%) FY19 FY20 FY21E FY22E FY23E
Revenue 2.33 3.25 -28.3 2.75 -15.1 14.8 12.0 10.2 11.7 13.2
Operating profits 0.97 1.45 -33.5 1.52 -36.6 5.3 5.7 4.5 5.5 6.6
OP Margin (%) 42.0 45.2 -322bps 55.6 -1366bps 35.8 47.3 43.8 47.4 49.8
APAT 1.56 1.25 24.6 0.04 4,101.6 4.9 4.2 4.9 5.7 6.6
EV/NOPLAT (x)
39.9 34.4 42.8 33.9 27.9
P/E (x)
34.0 40.7 34.4 29.8 25.6
ROE (%)
19.5 16.1 18.5 19.9 21.1
Source: Company, HSIE Research
Change in estimates
(Rs bn) FY21E
Revised
FY21E
Old
Change
% / bps
FY22E
Revised
FY22E
Old
Change
% / bps
Revenues 10.2 10.1 1.3 11.7 11.4 2.3
EBIT 4.5 4.4 3.9 5.6 5.4 3.7
EBIT margin (%) 44.3 43.1 114bps 47.8 47.2 64bps
NOPLAT 3.4 3.3 3.7 4.2 4.0 3.4
NOPLAT margin (%) 33.0 32.2 77bps 35.8 35.4 36bps
APAT 4.9 4.6 6.2 5.7 5.5 2.6
RoE (%) 18.5 17.6 97bps 19.9 19.6 30bps
Source: Company, HSIE Research
REDUCE
CMP (as on 27 July 2020) Rs 270
Target Price Rs 280
NIFTY 11,132
KEY
CHANGES OLD NEW
Rating REDUCE REDUCE
Price Target Rs 271 Rs 280
EPS % FY21E FY22E
+6.2% +2.6%
KEY STOCK DATA
Bloomberg code NAM IN
No. of Shares (mn) 612
MCap (Rs bn) / ($ mn) 165/2,213
6m avg traded value (Rs mn) 664
52 Week high / low Rs 453/201
STOCK PERFORMANCE (%)
3M 6M 12M
Absolute (%) 12.2 (26.3) 18.9
Relative (%) (7.3) (18.4) 18.7
SHAREHOLDING PATTERN (%)
Mar-20 Jun-20
Promoters 75.9 75.9
FIs & Local MFs 6.7 6.2
FPIs 5.3 5.8
Public & Others 12.1 12.1
Pledged Shares 0.00 0.00
Source : BSE
Madhukar Ladha, CFA [email protected]
+91-22-6171-7323
Page | 2
Nippon Life India Asset Management: Results Review 1QFY21
NAM Results Summary: 1QFY21
(Rs mn) 1QFY21 1QFY20 YoY (%) 4QFY20 QoQ(%)
Revenue 2,331 3,251 (28.3) 2,745 (15.1)
Staff cost 715 825 (13.3) 529 35.3
Admin & other opex 439 629 (30.2) 402 9.1
Fee and commission 94 252 (62.8) 198 (52.7)
Total expenses 1,248 1,705 (26.8) 1,129 10.5
EBITDA 1,084 1,546 (29.9) 1,617 (33.0)
Depreciation and amortization 105 76 37.8 89 18.0
EBIT 979 1,470 (33.4) 1,528 (35.9)
Finance cost 13 17 (26.7) 5 173.9
Core operating profits 966 1,452 (33.5) 1,523 (36.6)
Other Income 1,031 353 192.0 -1,249 NM
PBT 1,997 1,805 10.6 274 630.1
Tax 436 549 (20.7) 232 87.6
PAT (pre minority interest) 1,561 1,256 24.3 41 3,680.1
Share of profit/ (loss) in associate 1.8 (2.0) NM (4.1) NM
Minority interest - - NM - NM
APAT 1,563 1,254 24.6 37 4,101.6
Adjustment (post-tax) - - NM - NM
RPAT 1,563 1,254 24.6 37 4,101.6
Margins and tax rate (%)
EBITDA 46.5 47.5 -106bps 58.9 -1240bps
EBIT 42.0 45.2 -322bps 55.6 -1366bps
Operating profits 41.4 44.7 -323bps 55.5 -1404bps
Operating profits (net of tax) 32.4 31.1 132bps 8.4 2403bps
PBT 85.7 55.5 3012bps 10.0 7569bps
PAT 67.0 38.6 2848bps 1.4 6569bps
Tax rate (%) 21.8 30.4 -862bps 84.9 -6309bps
Source: Company, HSIE Research
Operating metrics
As % of QAAUM (bps) (Annualised) 1QFY21 1QFY20 YoY (%) 4QFY20 QoQ(%)
Revenue 51.8 58.4 -7bps 53.6 -2bps
Staff cost 15.9 14.8 1bps 10.3 6bps
Admin & other opex 9.7 11.3 -2bps 7.8 2bps
Fee and commissions 2.1 4.5 -2bps 3.9 -2bps
EBITDA 24.1 27.8 -4bps 31.6 -7bps
Operating profits 21.5 26.1 -5bps 29.7 -8bps
Operating profits (net of tax) 16.8 18.2 -1bps 4.5 12bps
PBT 44.4 32.4 12bps 5.3 39bps
PAT 34.7 22.6 12bps 0.8 34bps
Source: Company, HSIE Research
Core operating profits at Rs
9.67bn (-33.5/-36.6%
YoY/QoQ) were 18.2%
below estimates.
Other income grew 192%
YoY on account of large
MTM gains.
EBITDA margins deteriorate
106bps YoY despite the fall
in total expenses (26.8%
YoY) as revenues declined
28.3% YoY.
Core operating profit yields
declined sequentially to
21.5bps as against 33.6bps
for HDFCAMC.

Page | 3
Nippon Life India Asset Management: Results Review 1QFY21
Five quarters at a glance
MF QAAUM (Rs bn) 1QFY20 2QFY20 3QFY20 4QFY20 1QFY21 YoY (%) QoQ (%)
Equity 935 871 899 861 684 (26.8) (20.5)
Debt 690 598 552 574 522 (24.3) (9.0)
Liquid 334 275 327 328 342 2.5 4.4
ETFs 267 284 266 287 252 (5.6) (12.1)
Total 2,226 2,028 2,043 2,049 1,801 (19.1) (12.1)
Retail AUM (Rs bn)* 863 519 546 444 460 (46.7) 3.7
Share in AUM (%)
Equity 42.0 43.0 44.0 42.0 38.0 -400bps -400bps
Debt 31.0 29.0 27.0 28.0 29.0 -200bps 100bps
Liquid 15.0 14.0 16.0 16.0 19.0 400bps 300bps
ETFs 12.0 14.0 13.0 14.0 14.0 200bps 0bps
Total 100.0 100.0 100.0 100.0 100.0
Retail AUM as % of total
AUM 38.8 25.6 26.7 21.7 25.6 -1321bps 389bps
Source: Company, HSIE Research
* Beginning 2QFY20 AMFI changed the definition of “Retail investor” classification” has been changed to
folio holding upto Rs 0.2mn from Rs 0.5mn earlier.
Equity QAAUM declined 20.5% QoQ
Source: Company, HSIE Research
Debt schemes losing share
Note: As a percentage of QAAUM.
Source: Company, HSIE Research
Equity QAAUMs declined
20.5% sequentially despite
the sharp recovery in the
market, indicating
redemptions remain high.
Debt AUM declined as a
result of redemptions and
write-down of stressed
credits.
Management has decided to
invest only in AA and above
rated paper in all schemes
except for the credit risk
fund.
Equity QAAUM declined
26.8/20.5% YoY/QoQ despite
markets showed strong
recovery.
Share of equity AUM in mix
has reduced considerably in
1QFY21 to 38.0% (-400bps
QoQ).
29.0 31.0 34.0 36.0 37.0 37.0 38.0 39.0 42.0 43.0 44.0 42.0 38.0
46.0 47.0 44.0 40.0 43.0 39.0 36.0 33.0 31.0 29.0 27.0 28.0 29.0
19.0 17.0 17.0 19.0 15.0 19.0 19.0 19.0 15.0 14.0 16.0 16.0 19.0
6.0 5.0 5.0 5.0 5.0 5.0 7.0 9.0 12.0 14.0 13.0 14.0 14.0
-
20.0
40.0
60.0
80.0
100.0
1Q
FY
18
2Q
FY
18
3Q
FY
18
4Q
FY
18
1Q
FY
19
2Q
FY
19
3Q
FY
19
4Q
FY
19
1Q
FY
20
2Q
FY
20
3Q
FY
20
4Q
FY
20
1Q
FY
21
Equity Debt Liquid ETFs%
647 717 828 882 889 906 898 911 935 871 899 861 684
1,026 1,088 1,072 980 1,034 955 851 771 690 598 552 574
522
424 393 414 465 361 465
449 444 334
275 327 328 342
134 116 122 122 120 122 165 210
267 284 266 287
252
-
500
1,000
1,500
2,000
2,500
1Q
FY
18
2Q
FY
18
3Q
FY
18
4Q
FY
18
1Q
FY
19
2Q
FY
19
3Q
FY
19
4Q
FY
19
1Q
FY
20
2Q
FY
20
3Q
FY
20
4Q
FY
20
1Q
FY
21
Equity Debt Liquid ETFsRs bn

Page | 4
Nippon Life India Asset Management: Results Review 1QFY21
Retail participation
Source: Company, HSIE Research
Beginning 2QFY20 AMFI changed the definition of “Retail investor” to folio holding upto Rs 0.2mn
from Rs 0.5mn earlier.
SIP book declined QoQ
Source: Company, HSIE Research
As a % of QAAUM
Source: Company, HSIE Research
Retail participation has
picked up meaningfully to
25.6% as market recovered.
Monthly avg. SIP inflows
declined to Rs 7.0bn (-13.6/-
2.8% YoY/QoQ); Avg. SIP
contribution/folio is at Rs
2,059.
Core operating profits were
21.5bps of QAAUM.
66.0 66.9 65.5 71.5
65.6 63.9 59.2 58.8 58.4 59.3 59.4
53.6 51.8
18.5 21.8 19.4 21.7 22.0 21.1 18.5
23.8 26.1 26.8 26.7 29.7
21.5
13.1 14.2 13.2 16.5 15.0 14.7 12.4
17.1 18.2 20.8 20.6
4.5
16.8
19.5 17.9
21.2 16.8
18.4
18.5 18.6 23.7 22.6 24.2
29.2
0.8
34.7
0
10
20
30
40
50
60
70
80
1Q
FY
18
2Q
FY
18
3Q
FY
18
4Q
FY
18
1Q
FY
19
2Q
FY
19
3Q
FY
19
4Q
FY
19
1Q
FY
20
2Q
FY
20
3Q
FY
20
4Q
FY
20
1Q
FY
21
Revenue Operating profits Operating profits (net of tax) PAT
8.1 7.6 7.5 7.2 7.0
2,5312,375
2,273 2,2502,059
0
500
1,000
1,500
2,000
2,500
3,000
6.4
6.6
6.8
7.0
7.2
7.4
7.6
7.8
8.0
8.2
1Q
FY
20
2Q
FY
20
3Q
FY
20
4Q
FY
20
1Q
FY
21
SIP Book (Rs bn) - LHS SIP (Rs/folio) - RHS
584 637 710 732 780 837 830 899 863 519 546 444 460
26.2 27.5 29.1 29.9 32.4
34.2 35.1 38.5 38.8
25.6 26.7
21.7 25.6
-
5.0
10.0
15.0
20.0
25.0
30.0
35.0
40.0
45.0
-
100
200
300
400
500
600
700
800
900
1,000
1Q
FY
18
2Q
FY
18
3Q
FY
18
4Q
FY
18
1Q
FY
19
2Q
FY
19
3Q
FY
19
4Q
FY
19
1Q
FY
20
2Q
FY
20
3Q
FY
20
4Q
FY
20
1Q
FY
21
Retail AUM (Rs bn) - LHS Retail AUM as % of total AUM - RHS

Page | 5
Nippon Life India Asset Management: Results Review 1QFY21
C/I Ratio deteriorated materially
Source: Company, HSIE Research
AUM Market share trend
Source: Company, HSIE Research *FY17 and FY18 numbers have been taken on closing AUM basis.
C/I ratio deteriorated
significantly in 1QFY21 by
~1,240bps QoQ to 53.5% as
revenue dipped 15.1% QoQ.
NAM’s debt/equity QAAUM
market share declined to
7.5/6.8% (-246/-235bps YoY).
69.2 65.3
68.3 69.1 64.1 64.8 66.2
58.8 52.5 51.7 51.5
41.1
53.5
-
10.0
20.0
30.0
40.0
50.0
60.0
70.0
80.0
1Q
FY
18
2Q
FY
18
3Q
FY
18
4Q
FY
18
1Q
FY
19
2Q
FY
19
3Q
FY
19
4Q
FY
19
1Q
FY
20
2Q
FY
20
3Q
FY
20
4Q
FY
20
1Q
FY
21
C-I Ratio (%)
12.0
9.5 9.99.0
8.07.6 7.6
7.3
9.19.6 9.5 9.1
8.5 8.4 8.2
6.8
13.1
12.1
10.8
9.9
8.5
7.5 7.6
7.5
7
8
9
10
11
12
13
14
FY17 FY18 FY19 1QFY20 2QFY20 3QFY20 4QFY20 1QFY21
Market share in QAAUM (%) Market share in Equity QAAUM (%)
Market share in Debt QAAUM (%)%
Page | 6
Nippon Life India Asset Management: Results Review 1QFY21
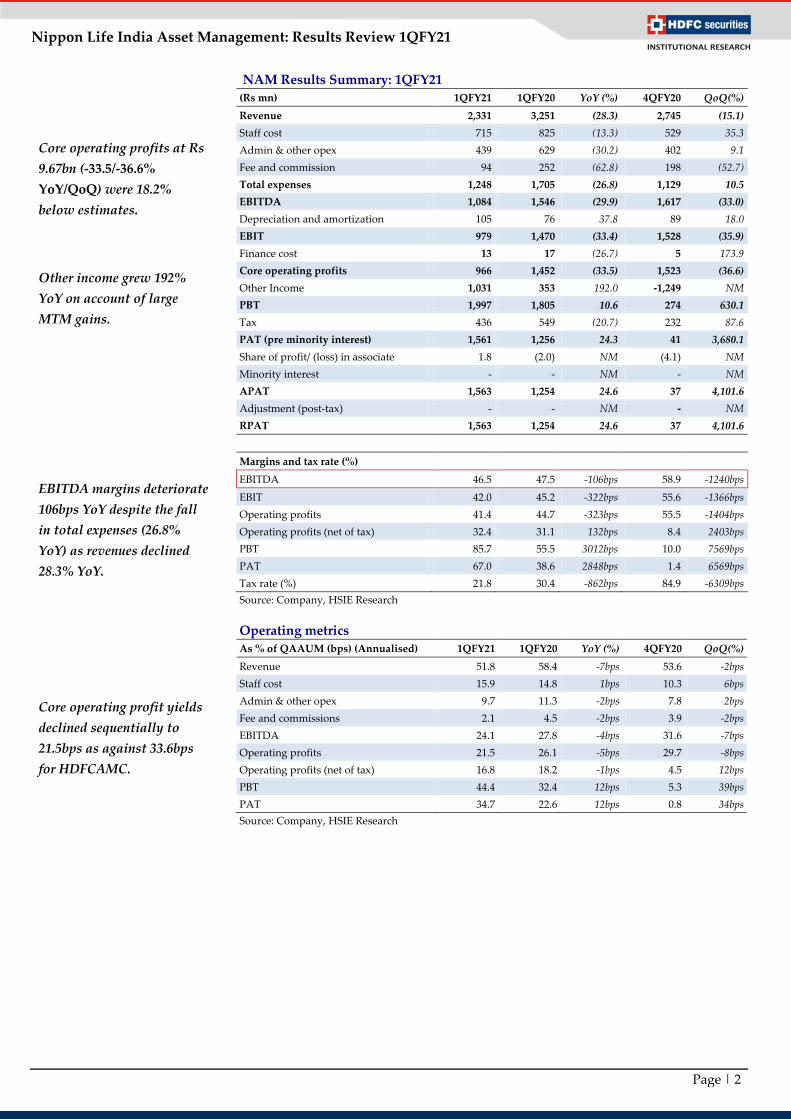
Assumptions
FY19 FY20 FY21E FY22E FY23E
Closing AUM (Rs bn)
Mutual fund 2,278 1,635 2,281 2,848 3,289
Managed accounts 35 39 47 54 62
Offshore funds and advisory 31 89 107 123 141
Pension 1,878 830 1,038 1,204 1,396
Total 4,222 2,593 3,472 4,228 4,888
MF AAAUM (Rs bn)
Equity 901 891 772 954 1,113
Debt 795 603 554 684 792
Liquid 395 316 365 478 533
ETFs 190 276 266 329 385
Total 2,282 2,086 1,958 2,445 2,823
Growth (%)
Equity 17.3 (1.1) (13.4) 23.6 16.7
Debt (23.5) (24.1) (8.2) 23.3 15.8
Liquid (6.2) (20.0) 15.7 30.9 11.3
ETFs 48.7 44.8 (3.4) 23.5 17.1
Total (3.2) (8.6) (6.2) 24.9 15.5
Share(%)
Equity 39.5 42.7 39.4 39.0 39.4
Debt 34.9 28.9 28.3 28.0 28.0
Liquid 17.3 15.1 18.7 19.6 18.9
ETFs 8.3 13.2 13.6 13.5 13.6
Total 100 100 100 100 100
As % of MF AAUM (bps)
Revenue 64.8 57.7 52.2 47.8 46.8
Staff cost 12.9 14.5 15.9 13.8 13.1
Admin & other opex 12.7 8.1 6.2 5.4 5.0
Marketing expenses 4.3 2.6 2.7 2.4 2.2
Brokerage expenses 11.3 3.4 2.2 1.9 1.8
EBITDA 23.6 29.2 25.2 24.4 24.7
PBT-OI 23.2 27.3 22.9 22.7 23.3
PBT-OI (net of tax) 16.1 20.3 17.2 17.1 17.6
PBT 30.7 26.8 33.3 30.7 31.0
APAT (post minority interest) 21.3 19.9 25.1 23.2 23.3
Efficiency Ratios
C/I Ratio (%) 64.2 52.2 55.7 52.2 49.9
Tax Rate (%) 30.4 25.7 24.6 24.6 24.6
Source: Company, HSIE Research
We expect closing total MF
AUM to increase 39.5/24.9%
YoY in FY21/22E.
We have fine tuned our
estimates to increase
revenues by 1.3/2.3% for
FY21E/FY22E.
Page | 7
Nippon Life India Asset Management: Results Review 1QFY21
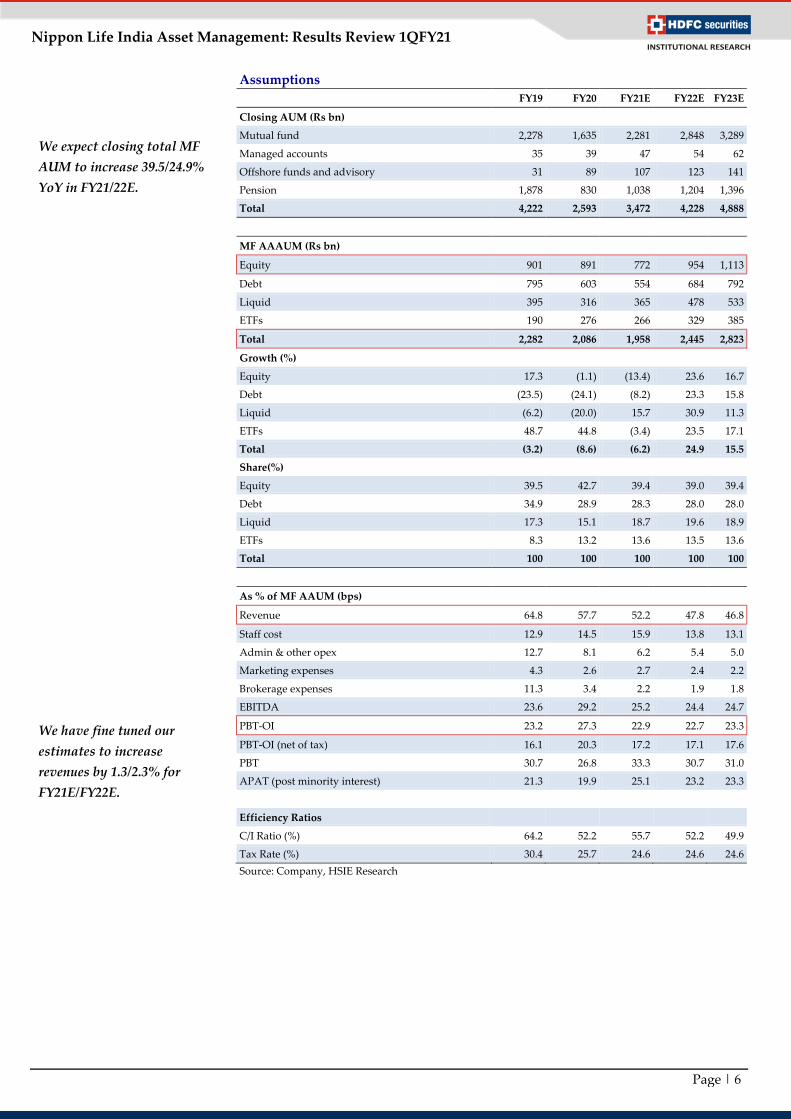
Financials Income statement
(Rs mn) FY16 FY17 FY18 FY19 FY20 FY21E FY22E FY23E
Net Revenues 11,999 13,074 15,918 14,786 12,030 10,229 11,689 13,218
Growth (%) 41.7% 9.0% 21.8% -7.1% -18.6% -15.0% 14.3% 13.1%
Employee benefits expenses 1,923 1,957 2,572 2,935 3,024 3,114 3,363 3,700
Operating expenses 5,911 6,451 8,250 6,461 2,921 2,178 2,361 2,548
EBITDA 4,166 4,665 5,096 5,390 6,085 4,936 5,965 6,971
EBITDA Margin (%) 34.7 35.7 32.0 36.5 50.6 48.3 51.0 52.7
EBIDTA Growth (%) 17.5% 12.0% 9.2% 5.8% 12.9% -18.9% 20.8% 16.9%
Depreciation 43 179 85 101 333 407 372 349
EBIT 4,122 4,486 5,011 5,290 5,753 4,530 5,593 6,622
Other Income (includes treasury ) 1,100 1,326 1,569 1,713 (98) 2,040 1,967 2,165
Interest & Financial Charges - - - - 57 55 49 44
PBT 5,222 5,812 6,579 7,002 5,598 6,515 7,511 8,742
Tax 1,242 1,786 1,984 2,132 1,441 1,603 1,848 2,151
RPAT 3,980 4,026 4,595 4,871 4,158 4,912 5,663 6,592
RPAT Growth (%) 12.4% 1.2% 14.1% 6.0% -14.6% 18.2% 15.3% 16.4%
APAT 3,980 4,026 4,580 4,861 4,158 4,912 5,663 6,592
APAT Growth (%) 12.4% 1.2% 13.8% 6.1% -14.5% 18.2% 15.3% 16.4%
AEPS 6.8 6.9 7.5 7.9 6.6 7.8 9.0 10.5
EPS Growth (%) 12.4% 1.2% 9.2% 6.1% -16.3% 18.2% 15.3% 16.4%
Source: Company, HSIE Research
Balance Sheet
(Rs mn) FY16 FY17 FY18 FY19 FY20 FY21E FY22E FY23E
SOURCES OF FUNDS
Share Capital 415 415 6,120 6,120 6,121 6,121 6,121 6,121
Reserves 17,504 18,311 17,533 19,580 19,809 20,953 23,601 26,717
Minority Interest 89 - 654 - - - - -
Total Shareholders Funds 18,008 18,726 24,307 25,700 25,931 27,074 29,722 32,838
Long-term Debt 1 - - - 591 725 616 554
Short-term Debt - - - - - - - -
Total Debt 1 - - - 591 725 616 554
Other Financial Liabilities & Provisions 110 216 297 435 393 336 384 435
Other Non Current Liabilities 1 - - - - - - -
Net Deferred Tax Liability (86) (37) (123) 0 (7) (7) (7) (7)
TOTAL SOURCES OF FUNDS 18,033 18,904 24,481 26,135 26,907 28,128 30,716 33,820
APPLICATION OF FUNDS
Net Block 119 2,512 2,603 2,568 3,256 3,118 3,079 3,030
Loans & Deposits 3,781 1,488 3,180 1,251 536 541 546 552
Other Non Current Assets 79 74 - - - - - -
Total Non-current Assets 3,979 4,074 5,783 3,819 3,792 3,659 3,625 3,582
Current Investments 9,108 9,465 9,934 12,900 18,846 20,730 22,803 25,083
Debtors 594 432 404 1,026 593 560 641 724
Cash & Equivalents 795 397 6,091 5,428 4,633 3,791 4,436 5,406
Loans & Advances 4,602 5,840 4,246 4,032 656 677 684 691
Other Current Assets 145 268 602 554 282 280 320 362
Total Current Assets 15,244 16,402 21,276 23,939 25,010 26,039 28,884 32,267
Creditors 650 1,083 1,329 474 677 588 673 760
Other Current Liabilities 539 489 1,249 1,150 1,218 981 1,121 1,267
Total Current Liabilities 1,190 1,572 2,578 1,623 1,895 1,569 1,793 2,028
Net Current Assets 14,054 14,830 18,698 22,316 23,115 24,469 27,091 30,239
TOTAL APPLICATION OF FUNDS 18,032 18,904 24,481 26,135 26,907 28,128 30,716 33,820
Source: Company, HSIE Research

Page | 8
Nippon Life India Asset Management: Results Review 1QFY21
Cash Flow (Rs mn) FY16 FY17 FY18 FY19 FY20 FY21E FY22E FY23E
Reported PBT 5,224 5,813 7,258 7,002 5,598 6,515 7,511 8,742
Non-operating & EO Items (1,029) (1,339) (2,132) (1,479) 592 (2,040) (1,967) (2,165)
Interest Expenses - - - - - - - -
Depreciation 43 179 336 101 333 407 372 349
Working Capital Change (591) 2,474 364 355 1,025 (374) 140 147
Tax Paid (1,432) (1,580) (1,883) (1,924) (1,301) (1,603) (1,848) (2,151)
OPERATING CASH FLOW ( a ) 2,214 5,547 3,942 4,055 6,247 2,905 4,208 4,922
Net Capex (91) (2,572) (151) (85) (40) (269) (333) (300)
(Purchase)/sale of net operating financial assets - - - - - - - -
Free Cash Flow (FCF) 2,124 2,975 3,791 3,971 6,207 2,637 3,875 4,623
Investments (739) (1,002) 2,047 (1,295) (535) (1,885) (2,073) (2,280)
Non-operating Income 545 632 953 837 742 2,040 1,967 2,165
INVESTING CASH FLOW ( b ) (285) (2,942) 2,849 (542) 168 (113) (439) (415)
Debt Issuance/(Repaid) - - - - - - - -
Interest Expenses - - - - - - - -
FCFE 2,124 2,975 3,791 3,971 6,207 2,637 3,875 4,623
Proceeds From Issue of Share Capital - - 5,869 - 24 - - -
Dividend (1,737) (3,003) (6,686) (2,923) (4,427) (3,769) (3,015) (3,476)
Others - - (280) (1,253) (2,806) 134 (109) (62)
FINANCING CASH FLOW ( c ) (1,737) (3,003) (1,097) (4,176) (7,209) (3,635) (3,124) (3,537)
NET CASH FLOW (a+b+c) 193 (398) 5,694 (663) (794) (842) 646 970
Opening Cash & Equivalents 602 795 397 6,091 5,428 4,633 3,791 4,436
Closing Cash & Equivalents 795 397 6,091 5,428 4,633 3,791 4,436 5,406
Source: Company, HSIE Research
Key Ratios FY16 FY17 FY18 FY19 FY20 FY21E FY22E FY23E
PROFITABILITY (%)
EBITDA Margin 34.7 35.7 32.0 36.5 50.6 48.3 51.0 52.7
EBIT Margin 34.4 34.3 31.5 35.8 47.3 43.8 47.4 49.8
APAT Margin 33.2 30.8 28.8 32.9 34.6 48.0 48.4 49.9
RoE 23.8 21.9 21.4 19.5 16.1 18.5 19.9 21.1
Core RoCE 66.5 65.1 81.1 96.8 140.9 135.4 166.0 205.3
RoCE 23.8 21.9 21.4 19.5 16.1 18.5 19.9 21.1
EFFICIENCY
Tax Rate (%) 23.8 30.7 30.2 30.4 25.7 24.6 24.6 24.6
Asset Turnover (x) 126.1 9.9 6.2 5.7 4.1 3.2 3.8 4.3
Debtors (days) 18 12 9 25 18 20 20 20
Other Current Assets (days) 4 7 14 14 9 10 10 10
Payables (days) 20 30 30 12 21 21 21 21
Other Current Liab & Prov (days) 16 14 29 28 37 35 35 35
Working Capital (days) -14 -24 -36 -1 -31 -26 -26 -26
Debt/EBITDA (x) 0.00 - - - 0.10 0.15 0.10 0.08
Net D/E (0.0) (0.0) (0.3) (0.2) (0.2) (0.1) (0.1) (0.1)
Interest Coverage - - - - - - - -
PER SHARE DATA
AEPS (Rs/sh) 6.8 6.9 7.5 7.9 6.6 7.8 9.0 10.5
CEPS (Rs/sh) 6.8 7.2 7.6 8.1 7.2 8.5 9.6 11.1
DPS (Rs/sh) 2.5 4.2 5.0 6.0 5.0 4.8 5.6 6.5
BV (Rs/sh) 30.5 31.9 38.6 42.0 41.4 43.2 47.5 52.5
VALUATION
P/E 39.9 39.4 36.1 34.0 40.7 34.4 29.8 25.6
P/BV 8.9 8.5 7.0 6.4 6.5 6.2 5.7 5.1
EV/NOPLAT 49.6 49.8 42.5 39.9 34.4 42.8 33.9 27.9
OCF/EV (%) 1.4 3.6 2.6 2.8 4.3 2.0 3.0 3.6
FCF/EV (%) 1.4 1.9 2.5 2.7 4.3 1.8 2.7 3.3
FCFE/MCAP (%) 1.3 1.8 2.2 2.3 3.7 1.6 2.3 2.7
Dividend Yield (%) 0.9 1.6 1.9 2.2 1.9 1.8 2.1 2.4
Source: Company, HSIE Research

Page | 9
Nippon Life India Asset Management: Results Review 1QFY21
Rating Criteria
BUY: >+15% return potential
ADD: +5% to +15% return potential
REDUCE: -10% to +5% return potential
SELL: > 10% Downside return potential
Date CMP Reco Target
9-Jul-19 221 BUY 254
13-Jul-19 219 BUY 254
30-Jul-19 227 NEU 235
22-Sep-19 254 NEU 267
14-Oct-19 267 NEU 240
25-Oct-19 319 NEU 260
9-Jan-20 343 NEU 320
11-Jan-20 343 NEU 321
24-Jan-20 347 NEU 321
2-Mar-20 391 ADD 440
11-Apr-20 287 BUY 349
21-Apr-20 285 BUY 349
16-May-20 243 BUY 288
13-Jul-20 290 REDUCE 271
28-Jul-20 270 REDUCE 280
From 2nd March 2020, we have moved to new rating system
RECOMMENDATION HISTORY
100
150
200
250
300
350
400
450
500
Jul-
19
Au
g-1
9
Sep
-19
Oct
-19
No
v-1
9
Dec
-19
Jan
-20
Feb
-20
Ma
r-2
0
Ap
r-2
0
Ma
y-2
0
Jun
-20
Jul-
20
Nippon India TP
Page | 10
Nippon Life India Asset Management: Results Review 1QFY21
Disclosure:
I, Madhukar Ladha, CFA, MBA author and the name subscribed to this report, hereby certify that all of the views expressed in this research report accurately
reflect our views about the subject issuer(s) or securities. HSL has no material adverse disciplinary history as on the date of publication of this report. We also
certify that no part of our compensation was, is, or will be directly or indirectly related to the specific recommendation(s) or view(s) in this report.
Research Analyst or his/her relative or HDFC Securities Ltd. does not have any financial interest in the subject company. Also Research Analyst or his relative
or HDFC Securities Ltd. or its Associate may have beneficial ownership of 1% or more in the subject company at the end of the month immediately preceding
the date of publication of the Research Report. Further Research Analyst or his relative or HDFC Securities Ltd. or its associate does not have any material
conflict of interest.
Any holding in stock –No
HDFC Securities Limited (HSL) is a SEBI Registered Research Analyst having registration no. INH000002475.
Disclaimer:
This report has been prepared by HDFC Securities Ltd and is solely for information of the recipient only. The report must not be used as a singular basis of any
investment decision. The views herein are of a general nature and do not consider the risk appetite or the particular circumstances of an individual investor;
readers are requested to take professional advice before investing. Nothing in this document should be construed as investment advice. Each recipient of this
document should make such investigations as they deem necessary to arrive at an independent evaluation of an investment in securities of the companies
referred to in this document (including merits and risks) and should consult their own advisors to determine merits and risks of such investment. The
information and opinions contained herein have been compiled or arrived at, based upon information obtained in good faith from sources believed to be
reliable. Such information has not been independently verified and no guaranty, representation of warranty, express or implied, is made as to its accuracy,
completeness or correctness. All such information and opinions are subject to change without notice. Descriptions of any company or companies or their
securities mentioned herein are not intended to be complete. HSL is not obliged to update this report for such changes. HSL has the right to make changes and
modifications at any time.
This report is not directed to, or intended for display, downloading, printing, reproducing or for distribution to or use by, any person or entity who is a citizen
or resident or located in any locality, state, country or other jurisdiction where such distribution, publication, reproduction, availability or use would be
contrary to law or regulation or what would subject HSL or its affiliates to any registration or licensing requirement within such jurisdiction.
If this report is inadvertently sent or has reached any person in such country, especially, United States of America, the same should be ignored and brought to
the attention of the sender. This document may not be reproduced, distributed or published in whole or in part, directly or indirectly, for any purposes or in
any manner.
Foreign currencies denominated securities, wherever mentioned, are subject to exchange rate fluctuations, which could have an adverse effect on their value or
price, or the income derived from them. In addition, investors in securities such as ADRs, the values of which are influenced by foreign currencies effectively
assume currency risk. It should not be considered to be taken as an offer to sell or a solicitation to buy any security.
This document is not, and should not, be construed as an offer or solicitation of an offer, to buy or sell any securities or other financial instruments. This report
should not be construed as an invitation or solicitation to do business with HSL. HSL may from time to time solicit from, or perform broking, or other services
for, any company mentioned in this mail and/or its attachments.
HSL and its affiliated company(ies), their directors and employees may; (a) from time to time, have a long or short position in, and buy or sell the securities of
the company(ies) mentioned herein or (b) be engaged in any other transaction involving such securities and earn brokerage or other compensation or act as a
market maker in the financial instruments of the company(ies) discussed herein or act as an advisor or lender/borrower to such company(ies) or may have any
other potential conflict of interests with respect to any recommendation and other related information and opinions.
HSL, its directors, analysts or employees do not take any responsibility, financial or otherwise, of the losses or the damages sustained due to the investments
made or any action taken on basis of this report, including but not restricted to, fluctuation in the prices of shares and bonds, changes in the currency rates,
diminution in the NAVs, reduction in the dividend or income, etc.
HSL and other group companies, its directors, associates, employees may have various positions in any of the stocks, securities and financial instruments dealt
in the report, or may make sell or purchase or other deals in these securities from time to time or may deal in other securities of the companies / organizations
described in this report.
HSL or its associates might have managed or co-managed public offering of securities for the subject company or might have been mandated by the subject
company for any other assignment in the past twelve months.
HSL or its associates might have received any compensation from the companies mentioned in the report during the period preceding twelve months from the
date of this report for services in respect of managing or co-managing public offerings, corporate finance, investment banking or merchant banking, brokerage
services or other advisory service in a merger or specific transaction in the normal course of business.
HSL or its analysts did not receive any compensation or other benefits from the companies mentioned in the report or third party in connection with
preparation of the research report. Accordingly, neither HSL nor Research Analysts have any material conflict of interest at the time of publication of this
report. Compensation of our Research Analysts is not based on any specific merchant banking, investment banking or brokerage service transactions. HSL may
have issued other reports that are inconsistent with and reach different conclusion from the information presented in this report.
Research entity has not been engaged in market making activity for the subject company. Research analyst has not served as an officer, director or employee of
the subject company. We have not received any compensation/benefits from the subject company or third party in connection with the Research Report.
HDFC securities Limited, I Think Techno Campus, Building - B, "Alpha", Office Floor 8, Near Kanjurmarg Station, Opp. Crompton Greaves, Kanjurmarg
(East), Mumbai 400 042 Phone: (022) 3075 3400 Fax: (022) 2496 5066 Compliance Officer: Binkle R. Oza Email: [email protected] Phone: (022)
3045 3600
HDFC Securities Limited, SEBI Reg. No.: NSE, BSE, MSEI, MCX: INZ000186937; AMFI Reg. No. ARN: 13549; PFRDA Reg. No. POP: 11092018; IRDA
Corporate Agent License No.: CA0062; SEBI Research Analyst Reg. No.: INH000002475; SEBI Investment Adviser Reg. No.: INA000011538; CIN -
U67120MH2000PLC152193
HDFC securities
Institutional Equities
Unit No. 1602, 16th Floor, Tower A, Peninsula Business Park,
Senapati Bapat Marg, Lower Parel, Mumbai - 400 013
Board: +91-22-6171-7330 www.hdfcsec.com