fining Cancer Subpopulations by Adaptive Strategies...
14
Integrated Systems and Technologies: Mathematical Oncology Defining Cancer Subpopulations by Adaptive Strategies Rather Than Molecular Properties Provides Novel Insights into Intratumoral Evolution Arig Ibrahim-Hashim 1 , Mark Robertson-Tessi 2 , Pedro M. Enriquez-Navas 1 , Mehdi Damaghi 1 , Yoganand Balagurunathan 1 , Jonathan W. Wojtkowiak 1 , Shonagh Russell 3 , Kam Yoonseok 1 , Mark C. Lloyd 4 , Marilyn M. Bui 4,5 , Joel S. Brown 2,7 , Alexander R.A. Anderson 2 , Robert J. Gillies 1,6 , and Robert A. Gatenby 2,6 Abstract Ongoing intratumoral evolution is apparent in molecular varia- tions among cancer cells from different regions of the same tumor, but genetic data alone provide little insight into environmental selection forces and cellular phenotypic adaptations that govern the underlying Darwinian dynamics. In three spontaneous murine cancers (prostate cancers in TRAMP and PTEN mice, pancreatic cancer in KPC mice), we identified two subpopulations with distinct niche construction adaptive strategies that remained stable in culture: (i) invasive cells that produce an acidic environment via upregulated aerobic glycolysis; and (ii) noninvasive cells that were angiogenic and metabolically near-normal. Darwinian interactions of these subpopulations were investigated in TRAMP prostate cancers. Computer simulations demonstrated invasive, acid-pro- ducing (C2) cells maintain a fitness advantage over noninvasive, angiogenic (C3) cells by promoting invasion and reducing efficacy of immune response. Immunohistochemical analysis of untreated tumors confirmed that C2 cells were invariably more abundant than C3 cells. However, the C2 adaptive strategy phenotype incurred a significant cost due to inefficient energy production (i.e., aerobic glycolysis) and depletion of resources for adaptations to an acidic environment. Mathematical model simulations pre- dicted that small perturbations of the microenvironmental extra- cellular pH (pHe) could invert the cost/benefit ratio of the C2 strategy and select for C3 cells. In vivo, 200 mmol/L NaHCO 3 added to the drinking water of 4-week-old TRAMP mice increased the intraprostatic pHe by 0.2 units and promoted proliferation of noninvasive C3 cells, which remained confined within the ducts so that primary cancer did not develop. A 0.2 pHe increase in established tumors increased the fraction of C3 cells and sign- ficantly diminished growth of primary and metastatic tumors. In an experimental tumor construct, MCF7 and MDA-MB-231 breast cancer cells were coinjected into the mammary fat pad of SCID mice. C2-like MDA-MB-231 cells dominated in untreated animals, but C3-like MCF7 cells were selected and tumor growth slowed when intratumoral pHe was increased. Overall, our data support the use of mathematical modeling of intratumoral Darwinian interactions of environmental selection forces and cancer cell adaptive strategies. These models allow the tumor to be steered into a less invasive pathway through the application of small but selective biological force. Cancer Res; 77(9); 2242–54. Ó2017 AACR. Introduction Several recent studies have demonstrated multiple genetically distinct populations within human cancers (1, 2) as a result of ongoing evolution. We note, however, that genetic characteristics alone provide little insight into the environmental selection pressures and cellular adaptive strategies that are the logical cause ! effect links that govern Darwinian dynamics (3). Here, we approach intratumoral evolution as a dynamical interaction among subpopulations defined not by their molecular properties but by adaptive strategies and the interactions of those strategies with microenvironmental properties. 1 Department of Cancer Imaging and Metabolism, H. Lee Moffitt Cancer Center, Tampa, Florida. 2 Department of Integrated Mathematical Oncology, H. Lee Moffitt Cancer Center, Tampa, Florida. 3 Department of Cancer Biology Ph.D. Program, University of South Florida, Tampa, Florida. 4 Analytic Microscopy Core, H. Lee Moffitt Cancer Center, Tampa, Florida. 5 Department of Pathology, H. Lee Moffitt Cancer Center, Tampa, Florida. 6 Department of Radiology, H. Lee Moffitt Cancer Center, Tampa, Florida. 7 Department of Evolutionary Biology, University of Illinois at Chicago, Chicago, Illinois. Note: Supplementary data for this article are available at Cancer Research Online (http://cancerres.aacrjournals.org/). Corresponding Author: Robert A. Gatenby, H. Lee Moffitt Cancer Center and Research Institute, 12902 Magnolia Drive, SRB 24000E, Tampa, FL 33612. Phone: 813-745-2843; Fax: 813-745-6070; E-mail: robert.gatenby@moffitt.org doi: 10.1158/0008-5472.CAN-16-2844 Ó2017 American Association for Cancer Research. Major Findings Defining intratumoral subpopulations by their adaptive strategies rather than the molecular properties used in branch- ing clonal evolution models allows the cellular and environ- mental interactions to be identified and framed mathemati- cally. With sufficient understanding of the underlying eco- evolutionary forces, the tendency of complex dynamic systems to magnify small perturbations can be exploited to steer a tumor into a noninvasive growth regime by applying relatively small biological perturbations. Cancer Research Cancer Res; 77(9) May 1, 2017 2242 on June 10, 2018. © 2017 American Association for Cancer Research. cancerres.aacrjournals.org Downloaded from Published OnlineFirst March 1, 2017; DOI: 10.1158/0008-5472.CAN-16-2844
Transcript of fining Cancer Subpopulations by Adaptive Strategies...
Integrated Systems and Technologies: Mathematical Oncology
Defining Cancer Subpopulations by AdaptiveStrategies Rather Than Molecular PropertiesProvides Novel Insights into IntratumoralEvolutionArig Ibrahim-Hashim1, Mark Robertson-Tessi2, Pedro M. Enriquez-Navas1,Mehdi Damaghi1, Yoganand Balagurunathan1, Jonathan W.Wojtkowiak1,Shonagh Russell3, Kam Yoonseok1, Mark C. Lloyd4, Marilyn M. Bui4,5, Joel S. Brown2,7,Alexander R.A. Anderson2, Robert J. Gillies1,6, and Robert A. Gatenby2,6
Abstract
Ongoing intratumoral evolution is apparent in molecular varia-tions among cancer cells from different regions of the same tumor,but genetic data alone provide little insight into environmentalselection forces and cellularphenotypic adaptations that govern theunderlying Darwinian dynamics. In three spontaneous murinecancers (prostate cancers in TRAMP and PTEN mice, pancreaticcancer in KPC mice), we identified two subpopulations withdistinct niche construction adaptive strategies that remained stablein culture: (i) invasive cells that produce an acidic environment viaupregulated aerobic glycolysis; and (ii) noninvasive cells that wereangiogenic andmetabolically near-normal. Darwinian interactionsof these subpopulations were investigated in TRAMP prostatecancers. Computer simulations demonstrated invasive, acid-pro-ducing (C2) cells maintain a fitness advantage over noninvasive,angiogenic (C3) cells by promoting invasion and reducing efficacyof immune response. Immunohistochemical analysis of untreatedtumors confirmed that C2 cells were invariably more abundantthan C3 cells. However, the C2 adaptive strategy phenotypeincurred a significant cost due to inefficient energy production(i.e., aerobic glycolysis) and depletion of resources for adaptations
to an acidic environment. Mathematical model simulations pre-dicted that small perturbations of the microenvironmental extra-cellular pH (pHe) could invert the cost/benefit ratio of the C2strategy and select for C3 cells. In vivo, 200mmol/LNaHCO3 addedto the drinking water of 4-week-old TRAMP mice increased theintraprostatic pHe by 0.2 units and promoted proliferation ofnoninvasive C3 cells, which remained confined within the ductsso that primary cancer did not develop. A 0.2 pHe increase inestablished tumors increased the fraction of C3 cells and sign-ficantly diminishedgrowthof primary andmetastatic tumors. In anexperimental tumor construct, MCF7 and MDA-MB-231 breastcancer cells were coinjected into the mammary fat pad of SCIDmice. C2-like MDA-MB-231 cells dominated in untreated animals,but C3-like MCF7 cells were selected and tumor growth slowedwhen intratumoral pHe was increased. Overall, our data supportthe use of mathematical modeling of intratumoral Darwinianinteractions of environmental selection forces and cancer celladaptive strategies. These models allow the tumor to be steeredinto a less invasive pathway through the application of small butselective biological force. Cancer Res; 77(9); 2242–54. �2017 AACR.
IntroductionSeveral recent studies have demonstrated multiple genetically
distinct populations within human cancers (1, 2) as a result ofongoing evolution. We note, however, that genetic characteristicsalone provide little insight into the environmental selectionpressures and cellular adaptive strategies that are the logical cause! effect links that govern Darwinian dynamics (3). Here, weapproach intratumoral evolution as a dynamical interactionamong subpopulations defined not by their molecular propertiesbut by adaptive strategies and the interactions of those strategieswith microenvironmental properties.
1Department of Cancer Imaging and Metabolism, H. Lee Moffitt Cancer Center,Tampa, Florida. 2Department of Integrated Mathematical Oncology, H. LeeMoffitt Cancer Center, Tampa, Florida. 3Department of Cancer Biology Ph.D.Program, University of South Florida, Tampa, Florida. 4Analytic MicroscopyCore, H. LeeMoffitt Cancer Center, Tampa, Florida. 5Department of Pathology, H.Lee Moffitt Cancer Center, Tampa, Florida. 6Department of Radiology, H. LeeMoffitt Cancer Center, Tampa, Florida. 7Department of Evolutionary Biology,University of Illinois at Chicago, Chicago, Illinois.
Note: Supplementary data for this article are available at Cancer ResearchOnline (http://cancerres.aacrjournals.org/).
Corresponding Author: Robert A. Gatenby, H. Lee Moffitt Cancer Center andResearch Institute, 12902Magnolia Drive, SRB 24000E, Tampa, FL 33612. Phone:813-745-2843; Fax: 813-745-6070; E-mail: [email protected]
doi: 10.1158/0008-5472.CAN-16-2844
�2017 American Association for Cancer Research.
Major FindingsDefining intratumoral subpopulations by their adaptive
strategies rather than themolecular properties used in branch-ing clonal evolution models allows the cellular and environ-mental interactions to be identified and framed mathemati-cally. With sufficient understanding of the underlying eco-evolutionary forces, the tendency of complex dynamic systemsto magnify small perturbations can be exploited to steer atumor into a noninvasive growth regime by applying relativelysmall biological perturbations.
CancerResearch
Cancer Res; 77(9) May 1, 20172242
on June 10, 2018. © 2017 American Association for Cancer Research. cancerres.aacrjournals.org Downloaded from
Published OnlineFirst March 1, 2017; DOI: 10.1158/0008-5472.CAN-16-2844
Quick Guide to Equations and AssumptionsHere, we build upon a previously developed and experimentally validated hybrid multiscale mathematical model of cancer
growth that incorporates the production of acid and acquired resistance to extracellular pH (4, 5). This model simulates a two-dimensional (2D) slice through a tumor and includes cellular metabolism and a dynamic vasculature. The scales of intracellularmetabolism, cellular behavior, and tissue microenvironment are coupled by using a cellular automaton (CA) along with partialdifferential equations (PDE). The model is fully described in the reference provided and summarized here.
The model consists of normal cells, tumor cells, vasculature, and empty space. The vasculature is a set of point sources spreadthrough the 2Ddomain, seededwith spacing consistent with thosemeasured in normal stroma. These serve as boundary conditionsthat deliver nutrients into the surrounding tissue via diffusion and act as sinks for extracellular acid. Molecular concentrations arecalculated using a set of reaction–diffusion PDEs. As the timescales of metabolism and cellular behavior, such as proliferation, aresignificantly different, we solve the PDEs to reach steady state between each step of the CA.
The internal metabolic network of each cell consists of glycolysis, oxidative phosphorylation, and acid production. Oxygenconditions dictate the baselinemetabolism, essentially inducing a Pasteur effect when hypoxia develops; therefore, all cells exhibit arange ofmetabolic behaviors depending on themicroenvironmental conditions. The concentration of diffusiblemolecules [oxygen(O), glucose (G), and protons (H)] is described by the set of PDE:
qCqt
¼ Dr2Cþ f x; tð Þ;
whereC is the concentration,D is the diffusion constant, and f(x,t) is the consumption or production rate of the particularmolecule.Oxygen consumption (fO) by cells is given by
fO ¼ �VOO
Oþ kO;
where VO is the maximal oxygen consumption by cells and kO is the concentration at which half maximal consumption occurs.Glucose consumption (fG) by cells is given by
fG ¼ � pGAo
2þ 27fO
10
� �G
Gþ kG;
where Ao is the normal target ATP production rate, kG is the concentration at which half maximal consumption occurs, and pG is thecell parameter representing aerobic glycolysis. For normal cells, pG¼1, whereas for tumor cells, it is one of thephenotypes allowed tochange upon proliferation (see below). The ATP production rate (fA) is given by
fA ¼ � 2fG þ 27fO5
� �
and proton production (fH) is given byfH ¼ kH
29 pGVO þ fOð Þ5
� �;
where kH is a buffering parameter.Figure 3A shows the mechanistic interactions between normal cells, tumor cells, the vasculature, and diffusible substances that
were used in the model. Normal cells only proliferate if the density of their neighbors falls below a certain amount (�80%); tumorcells can proliferate tofill all available space. Tumor cells can evolve across twophenotypic traits: the glycolytic capacity (x-axis of Fig.3C)with drift rateDG and the resistance to acidosis (y-axis) with drift rateDH. Increased glycolysis in a tumor cell essentially increasesthe absolute levels of glucose consumption by the cell, while still being sensitive to hypoxic influence through the Pasteur effect.Increases in glycolysis cause an excess of pyruvate, leading to generation of acidosis. We do not model the other pathways, such aspentose phosphate, that are also beneficiaries of increased glycolysis. Resistance to acidosis is a development of lower pH thresholdsin the model for which the cell enters quiescence or apoptosis due to the acidity. Drift rates are unbiased, so that any change inmedian phenotype of the population is due to selection.
TheCAdecision flowchart is shown in Fig. 3B. The primary function of the vasculature in thismodel is to spatiotemporally delivernutrients, drugs, and remove waste products, and although the point-source system is simplification, it is sufficient to creategradients of pH and nutrient concentrations that are dependent on vessel density. The vasculature is dynamic. Angiogenesis will addblood vessels to hypoxic regions until normoxia is attained, and vessels can be degraded by the growth of nearby tumor cells (e.g.,representing blood vessel leakiness, collapse, and constriction).
We include a cost associated with the acquisition of these two traits: (i) Cells with maximal acid resistance will have a cell-cycleduration that is double that of normal cells; (ii) cells with the highest glycolytic capacity will have double the cell cycle timecomparedwithmetabolically normal cells. These costs are independent andmultiplicative, so that a cellwithmaximal acquisitionofboth traits will take four times longer to divide. The cost varies linearly between the phenotypic extremes. In thismodel, we doubledthe rates of phenotypic drift, DH and DG, to 0.003 and 0.15, respectively, as compared with the previously published work.
The initial condition used for the simulations of primary tumor growth is a hollow duct with a layer of metabolically normaltumor cells along the duct wall. The duct contains no blood vessels; outside the duct are normal cells and vasculature. Formetastaticsimulations, a single cell was seeded into a normal tissue initial condition.
Additional model details are given in the Supplementary Material along with a table of parameters (Supplementary Table S1).
Modulating the Evolutionary Trajectory of Cancer
www.aacrjournals.org Cancer Res; 77(9) May 1, 2017 2243
on June 10, 2018. © 2017 American Association for Cancer Research. cancerres.aacrjournals.org Downloaded from
Published OnlineFirst March 1, 2017; DOI: 10.1158/0008-5472.CAN-16-2844
We address three general questions: (i) Can we define adaptivestrategies that are common among different cancers? (ii)What arethe evolutionary dynamics that govern the intratumoral compe-tition among subpopulations? (iii) How do these Darwinianinteractions at cellular and molecular scales affect tissue-scalechanges in tumor growth?
We address the first question by investigating tumor subpopu-lations obtained from tumors in TRAMP, PTEN, and KPC animalsthat are genetically engineered to form primary cancers (6–8). Insome cases (PTEN and TRAMP), subpopulations were derivedfrom the same tumors. In each tumor, we find two coexistingsubpopulations with different adaptive strategies that remainstable in culture:
1. An invasive phenotype that produces excess acid throughupregulation of fermentative glucose pathways even in thepresence of oxygen.
2. A noninvasive, angiogenic, nonmotile phenotype thatmaintains near-normal glucose metabolism.
Coexistent invasive and angiogenic subpopulations have beenreported in other mouse tumors (9) as well clinical breast cancers(10), colon cancers (11), skin cancers (12), and glioblastomamultiforme (13), suggesting this is a general phenomenon.
We address the second question by applying a multiscalemathematical model (vide supra; refs. 4, 5, 14) to define theeco-evolutionary competition among the adaptive strategies.Model simulations demonstrated the invasive glycolytic subpop-ulation is typically fitter and, thus, more abundant within mosttumor environments. However, model simulations also demon-strated that, if this cost/benefit ratio for the invasive phenotype isinverted by small increases in cost or decreases in benefit, theDarwinian dynamics could be reversed, causing a marked declinein the invasive population.
These predictions were tested in the TRAMP mouse model,which develops primary prostate cancers at approximately 12weeks of age and dies of disseminated disease within 52 weeks.IHC of the subpopulations in primary and metastatic lesionsconfirmed model predictions that the invasive, acid-producing,glycolytic phenotype (termed C2) is the most abundant popula-tion. We then increased intratumoral extracellular pH (pHe) 0.2units by adding 200 mmol/L NaHCO3 to the drinking water (15,16) at age 4weekswhen tumors were confined to the ducts (i.e., insitu or prostate Intraepithelial neoplasia lesions). At necropsy, thisproduced a significant population shift favoring the noninvasive,angiogenic, non–acid-producing (termed C3) phenotype. A sim-ilar increase in pHe of established tumors required 400 mmol/LNaHCO3 added to the water, and, at necropsy, the C3 phenotypewas the dominant population in these tumors.
To address the third question, we observed that, in the 4-week–treated cohort, because the C3 phenotypes did not penetrate thebasement membrane, the tumor remained almost entirely intra-ductal, preventing the development of invasive primary tumors.Similarly, in the cohort with established tumors, primary andmetastatic growth was significantly reduced.
We further investigated questions 2 and 3 in an experimentaltumor constructed from a mixture of the invasive human breastcancer cell line MDA-MB-231 and the noninvasive human breastcancer cell line MCF7 coinjected into the mammary fat pad ofnude mice. In vitro, the MDA-MB-231 cells exhibited a C2-likephenotype with high levels of motility and significantly upregu-
lated aerobic glycolysis and acid production. TheMCF7 cells wereC3-like with near-normal glucose metabolism and low levels ofmotility and invasion. In vivo, MCF7 cells are highly angiogenic(17). Similar to C2/C3 dichotomy, MDA-MB-231 cells were thedominant population in untreated animals. However, whenNaHCO3 was added to the drinking water, the MCF7 populationgreatly increased and the MDA-MB-231 population decreased,and tumor growth markedly slowed.
Materials and MethodsCell culture
Experiments were performedusingmouse TRAMP-C2, TRAMP-C3 cell lines, obtained from ATCC (ATCC, CRL-2731, - 2733).Both cell lines were grown in DMEM media supplemented with10% FBS, 1% penicillin/streptomycin, 100 nmol/L DHEA, and0.005 mg/mL insulin. The MCF7 cells, MDA-MB-231, PTEN-P8,and PTEN-CaP8 cell lines were acquired from ATCC (ATCC, CRL-3033, -3031) and maintained in RPMI medium 1640 (Life Tech-nologies Gibco, 11875-093) supplemented with 10% FBS(HyClone Laboratories) under standard cell culture conditions.UN-KPC-960andUN-KPC-961pancreatic cell lineswereobtainedvia MTA from Dr. Batra (University of Nebraska Medical Center,Omaha, NE) and maintained in DMEM containing heat-inacti-vated FBS, L-glutamine (200 mmol/L), 100� nonessential aminoacids (100 mmol/L), sodium bicarbonate, HEPES buffer, genta-micin (50mg/mL), and penicillin/streptomycin (100 mg/mL). Allcells were maintained in 37�C and 5% CO2. All steps wereperformed under sterile conditions in a tissue culture hood.
All cells were used within 6 months of purchase and have beenreauthenticated by short tandem repeat (STR) analysis. All cellswere obtained between years 2012 and 2015. All cells exceptMDA-MB-231 were used in passages below 16. All cells weremycoplasma free. All cells exceptMCF7 cells, MDA-MB-231, wereused within 6 months from arrival. MCF7 cells, MDA-MB-231,have been authenticated by STR analysis in theMolecular BiologyCore at Moffitt Cancer Center (Tampa, FL).
Animal, breeding, and treatmentThe TRAMP mice breeding was described previously (18). In
brief, the breeding colony was developed using the heterozygousfemale mice expressing the TRAMP transgene crossed with non-transgenic C587BL/6 male mice (also obtained from The JacksonLaboratory) and the progeny subjected to ear punch genotyping.Animals were maintained in a clean facility (USF Vivarium, at theMoffitt Cancer Research Center) in accordance with NIH Guidefor the Care and Use of Laboratory Animals and the local Insti-tutional Animal Care andUseCommittee guidelines. The 4weeksold obtained TRAMP mice were randomly distributed into pos-itive control and treated groups. Sodium bicarbonate (200 or 400mmol/L )was dissolved in tapwater and given to the TRAMPmiceto drink starting at either 4 weeks old and or 10 weeks old. Thewater consumption and weight of the mice were monitored andcompared with the mice drinking tap water (controls). Nontrans-genic mice were included as a negative control. Numbers ofanimals used are included in the figure legend of the correspond-ing experiment.
A cohort of 30 nu/nu mice (Harlan) was injected in themammary fat pad with 1 � 107 MDA-MB-231 cells or 1 � 107
MCF7 cells, or a mix composed by 5� 106 of each of the previouscell lines. One week prior to the cell injection, an estrogen pellet
Ibrahim-Hashim et al.
Cancer Res; 77(9) May 1, 2017 Cancer Research2244
on June 10, 2018. © 2017 American Association for Cancer Research. cancerres.aacrjournals.org Downloaded from
Published OnlineFirst March 1, 2017; DOI: 10.1158/0008-5472.CAN-16-2844
(0.72 mg low release, Innovative Research of America) wasimplanted in all mice. Three days after tumor injection, the micewere randomly separated in treated and nontreated (control)groups: n ¼ 4 for control groups, and n ¼ 6 for treated groups.Treated mice had 400 mmol/L of bicarbonate in the drinkingwater, whereas the others had regular tap water. Tumor volumeswere measured once a week using MRI T2-fast spin echo pulsesequence (TE/TR¼ 60/900ms), with an axial in-plane resolutionof 273 mm, and a slice thickness of 1.5 mm. Five weeks after theexperiment started, tumors were collected and stained for hema-toxylin and eosin (H&E) and estrogen receptor (ER) expression.The IHC slices were analyzed as it is explained below in theHistology section.
Oxygen consumption and extracellular acidificationmeasurements
Real-time basal oxygen consumption (OCR) and extracellu-lar acidification rates (ECAR) for TRAMP-C2 and C3, MCF7,MDA-MB-231, PTEN-P8, PTEN-CaP8, KPC 960, KPC 961 celllines, and normal human primary prostate epithelial cells(PCS) were determined using the Seahorse Extracellular Flux(XF-96) analyzer (Seahorse Bioscience). The XF-96 measuresthe concentration of oxygen and free protons in the mediumabove a monolayer of cells in real time. Cells seeded in an XFmicroplate were cultured for 2 hours in the presence or absenceof 2 g/L D-glucose prior to OCR and ECAR measurements.Protein concentration was determined for each well using astandard BCA protein assay. OCR and ECAR values werenormalized to mg/protein and plotted as the mean � SD.Sample size was not computed prior to assay design. In Sea-horse assays, on any given day, multiple independent wells(sample replicates) were assayed per group, and each measure-ment was repeated 3 to 5 times per condition (technicalreplicates), and the assays were performed independently mul-tiple times (biological replicates). For PTEN-P8 and PTEN-CaP8 cells, there were three biological, five assay, and fourtechnical replicates per group per test per assay. Among these,two different concentrations of oligomycin were used to ensuremaximal effective doses were achieved (1 and 2 mmol/L). Bothdoses yielded identical results, so 1 mmol/L oligomycin wasused for subsequent biological replicates. For KPC 960 andKPC961, respectively, 1 biological, 11 and 8 sample, and 4technical replicates were assayed,. For MCF7, MDA-MB-231,TRAMP C2, TRAMP C3, and PCS, two biological, 8 sample, and3 to 4 technical replicates were used per cell line per assay.Statistical analysis used unpaired t test with Welch correctionassuming Gaussian distribution.
Blood sodium measurementThe blood sodium concentration was obtained using an iSTAT
Portable Clinical Analyzer (Abaxis) with CG8þ cartridges. Bloodsamples (about 200 mL) were obtained from cardiac stick of themouse and inserted to the cartridge, and readings were recordedaccording to the manufacturer's specifications.
Measurements of MMPSense 680 activity in vivoTRAMP mice from Tap, 400 mmol/L NaHCO3 at 4 weeks and
10 weeks (n ¼ 6 for each cohort) were imaged at 32 weeks old.Twenty-four hours before imaging, mice were injected intrave-nously with activatable fluorescent probe, MMPSense 680 (Per-kinElmer). Mice were then imaged in vivo using the FMT2500
(PerkinElmer) tomographic imaging system. Region of interestwas quantified and normalized using an internal standard.
Quantitative PCRAll qRT-PCRs were performed on a 7900HT Fast Real-Time
System (Life Technologies Applied Biosystems) using an iScriptReal-Rime PCR Kit with SYBR Green (Bio-Rad, 170-8893).GAPDH expression was used as an internal control. mRNA(100 ng) was used per 20 mL reaction. TRIzol (Life TechnologiesInvitrogen) was used according to the manufacturer's directionsfor all RNA purification. RNA was isolated from TRAMP-C2 atphysiologic pH 7.4 and from low pH (6.7)–treated cell pelletsusing RNeasy Mini Kit (Qiagen).
Primers for MMP-2 and MMP-9 were obtained from SrikumarChellepan (H. Lee Moffitt Cancer Center and Research Institute).Primer sequences are included in Supplementary Materials andMethods.
Histology and image analysisAt necropsy, the lung/heart, liver, and genitourinary system
were collected. Tissues were processed, embedded in paraffin, and4 to 5 mm slices of the tissues were obtained. Slides were stainedwith H&E stain and were graded by a pathologist for presence oftumor tissue. Histology slides were scanned using the AperioScanScope XT with a 20�/0.8NA objective lens (200�) at a rateof 2 minutes per slide via Basler trilinear array. An Aperio PositivePixel Count v9.0 algorithm [with the following thresholds: huevalue ¼ 0.1; hue width ¼ 0.5; color saturation threshold ¼ 0.04;IWP(high) ¼ 220; Iwp(low) ¼ Ip(high) ¼ 175; Ip(low) ¼ Isp(high)¼ 100 Isp(low)¼ 0] was used to segment positive stainingof various intensities. The algorithm was applied to the entiredigital core image to determine the percentage of positive bio-marker staining by applicable area.
AntibodiesPolyclonal rabbit anti-mouse GLUT-1 antibody was purchased
fromMillipore (07-1401used at a concentrationof 1:800). Rabbitantibody that reacts to CD31 was purchased from Abcam(ab28364; used at a concentration of 1:200); rabbit antibodythat reacts to SMA was purchased from Abcam (ab32575; used atconcentration a of 1:250); rabbit antibody that reacts to VEGFwaspurchased from Abcam (ab46154, used at a concentration of1:1,500). Rabbit antibody to react to ER was purchased fromAbcam (ab32063, used at a concentration of 1:250). Slides werestained using a VentanaDiscovery XT automated system (VentanaMedical Systems) as per the manufacturer's protocol with pro-prietary reagents.
In vitro assay for cell migration and invasionIn vitro motility and invasiveness of C2- and C3-TRAMP cell
lines and in vitro motility of MDA-MB-231 and MCF7 werecompared by using xCELLigence Real Time Cell Analyzer (RTCA,ACEA Biosciences). For migration assay, cells were plated on theupper chamber containing serum-free media at 2� 104 cells/wellof CIM16 plate, of which lower chambers were filled with serum-free media (negative control) or media containing 10% FBS. Theamount of cells migrating toward the lower face of the filterbetween two chambers was monitored in real time by measuringimpedance produced by the cells, cell index. For invasion assay,the filter of the upper chamber was precoated with 10% ofbasement membrane extract from Cultrex. Cell index changes
Modulating the Evolutionary Trajectory of Cancer
www.aacrjournals.org Cancer Res; 77(9) May 1, 2017 2245
on June 10, 2018. © 2017 American Association for Cancer Research. cancerres.aacrjournals.org Downloaded from
Published OnlineFirst March 1, 2017; DOI: 10.1158/0008-5472.CAN-16-2844
weremonitored up to 24 hours for themigration and 72 hours forthe invasion. Migration and invasion assay (xCELLigence) hasthree biological replicates and n¼ 8 per cell line per test per assay.
Data processingMicrosoft Excel and GraphPad Prism were used for data proces-
singand tocalculate statistical significance,whichwas set atP�0.05.
Statistical analysesA two-tailed unpaired Student t testwas employed to determine
the statistical significance. P value less than 0.05 was consideredstatistically significant or otherwise indicated.Mann–Whitney testis a nonparametric statistic, similar to the family of rank-basedtests, which was used for migration and invasion assays.
ResultsCompeting intratumoral populations: C2 and C3 tumorphenotypes
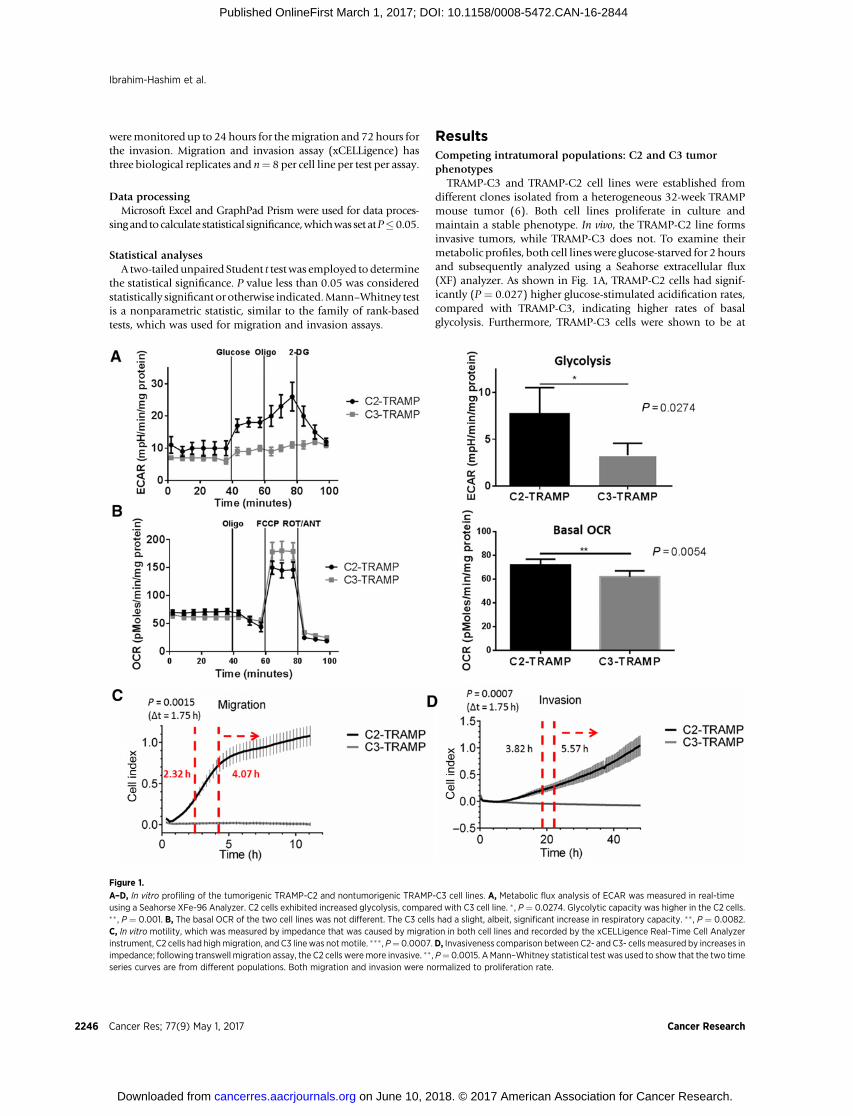
TRAMP-C3 and TRAMP-C2 cell lines were established fromdifferent clones isolated from a heterogeneous 32-week TRAMPmouse tumor (6). Both cell lines proliferate in culture andmaintain a stable phenotype. In vivo, the TRAMP-C2 line formsinvasive tumors, while TRAMP-C3 does not. To examine theirmetabolic profiles, both cell lineswere glucose-starved for 2 hoursand subsequently analyzed using a Seahorse extracellular flux(XF) analyzer. As shown in Fig. 1A, TRAMP-C2 cells had signif-icantly (P ¼ 0.027) higher glucose-stimulated acidification rates,compared with TRAMP-C3, indicating higher rates of basalglycolysis. Furthermore, TRAMP-C3 cells were shown to be at
Figure 1.
A–D, In vitro profiling of the tumorigenic TRAMP-C2 and nontumorigenic TRAMP-C3 cell lines. A, Metabolic flux analysis of ECAR was measured in real-timeusing a Seahorse XFe-96 Analyzer. C2 cells exhibited increased glycolysis, compared with C3 cell line. � , P ¼ 0.0274. Glycolytic capacity was higher in the C2 cells.�� , P ¼ 0.001. B, The basal OCR of the two cell lines was not different. The C3 cells had a slight, albeit, significant increase in respiratory capacity. �� , P ¼ 0.0082.C, In vitro motility, which was measured by impedance that was caused by migration in both cell lines and recorded by the xCELLigence Real-Time Cell Analyzerinstrument, C2 cells had highmigration, and C3 line was not motile. ��� , P¼0.0007.D, Invasiveness comparison between C2- and C3- cells measured by increases inimpedance; following transwell migration assay, the C2 cells weremore invasive. �� , P¼ 0.0015. AMann–Whitney statistical test was used to show that the two timeseries curves are from different populations. Both migration and invasion were normalized to proliferation rate.
Ibrahim-Hashim et al.
Cancer Res; 77(9) May 1, 2017 Cancer Research2246
on June 10, 2018. © 2017 American Association for Cancer Research. cancerres.aacrjournals.org Downloaded from
Published OnlineFirst March 1, 2017; DOI: 10.1158/0008-5472.CAN-16-2844
near-maximal glycolytic capacity at basal conditions, whereasTRAMP-C2 cells were far from capacity under identical condi-tions. The basal OCRs of the C2 cell line were also slightly, butsignificantly (P ¼ 0.0054), higher than that of the C3 cells (Fig.1B). Combined, the data from Fig. 1A and B indicate a muchhigher ATP turnover rate for C2 cells, along with much higherreliance on glycolytic fermentation. Addition of the mitochon-drial uncoupler, FCCP, yields a maximum potential OCR as ameasure of electron transport kinetics and demonstrated signif-icantly higher (P¼0.0082)mitochondrial capacity in the TRAMP-C3, compared with TRAMP-C2 cells.
Combined with the glycolytic analysis (Fig. 1A and B), theseresults demonstrate that the C3 line produced energy primarilythrough respiration (i.e., oxidative metabolism), while the C2cells, typical of an acid-adapted phenotype, were highly glyco-lytic. Metabolic profiles of the C2 TRAMP cell line in compar-ison with normal prostate epithelial cell line (PCS) were alsomeasured. The C2 line showed increased glycolytic capacity andsignificantly (P < 0.0001) lower ECAR after 2-DG comparedwith PCS. Furthermore, C2 cells also had higher OCRs, indi-cating the metabolic rates, and hence, ATP consumption ratesof C2 cells were significantly (P < 0.0001) elevated comparedwith normal prostate epithelial cells, PCS (Supplementary Fig.S1A–S1D). The high rates of glycolysis in C2 cells, rather thansatisfying global cellular ATP demand, may be more indicativeof compartmentalized need for ATP production at the plasmamembrane, as described in ref. 16. Expression of GLUT-1 isoften, but not always, observed in cells with increased glycol-ysis. Our IHC results (Supplementary Fig. S2A and S2B) showelevated GLUT-1 in the more malignant TRAMP tumor tissue oftap-treated mice, and significantly (P ¼ 0.002) less in the lessmalignant tumors of bicarbonate-treated mice (vide infra). Weinterpret these findings to indicate the more malignant TRAMPtumors with higher GLUT-1 levels also have higher rates ofglucose-stimulated acid production.
High rates of glycolysis and acid production in cancer cellssupport rapid, invasive, andmetastatic growth (19). Therefore, weinvestigated the migration and invasive capacity of both cell linesusing the xCELLigence label-free platform (see Materials andMethods). Figure 1C shows migratory capacity as a measure ofimpedance (cell index) for each cell line in the presenceand absence of FBS. C2 cells had significantly (P ¼ 0.0015) highrates of migration, which was reduced in the absence of FBS,whereas C3 cells exhibited no migratory capacity under eithercondition. Figure 1D shows the increase in impedance in atranswell migration assay, wherein cells have to cross a Matrigelbarrier toward the lower well containing FBS as a chemoattractantto generate a signal. Similar to themigrationassays, theC2 cell linewas significantly (P ¼ 0.0007) more invasive compared with C3.
Do invasive niche engineering phenotypes compete withnoninvasive, non–acid-producing populations in othercancers?
"Niche construction" is an ecological term to describe themodification of a microenvironment to benefit an invading orestablished species. We coopt this term to describe the ability ofinvading cancer cells to modify their local microenvironments inways that provide themwith the maximal benefit, while reducingthe fitness of the host tissues. As noted above, the observation ofsignificantly increased glucose uptake on FdG PET imaging in thevast majority of human cancers suggests that the niche construc-
tion phenotype is a common property of in vivo cancers. It isbeyond the scope of this report to systematically investigate allcancer types. However, we did investigate prostate epithelial cellsisolated from PTEN-null transgenic mice that were either hetero-zygous (PTEN-P8) or homozygous (PTEN-CaP8) for PTEN dele-tion (Supplementary Fig. S3A and S3B; ref. 7), and epithelialpancreatic cell lines derived from KrasG12D;Trp53R172H;Pdx1-Cre (KPC) model, UN-KPC-960, and UN-KPC-961(Supplemen-tary Fig. S4A and S4B; ref. 8). We observed, similar to the C2/C3phenotypic dichotomy, that PTEN-P8 cells are nontumorigenicand UN-KPC-960 are nonmetastatic and both relied on oxidativemetabolism, whereas the tumorigenic PTEN-CaP8 andmetastaticUN-KPC-961 cells were highly glycolytic (P < 0.01 and P < 0.001,respectively). Coexistent invasive and angiogenic subpopulationshave been reported in other mouse tumors (6) as well clinicalbreast (7), colon (8), and skin (9) cancers, as well as glioblastomamultiforme (10). These data suggest a dichotomy in metabolicphenotypes in cancer cells within the same tumor may be ageneralizable phenomenon.
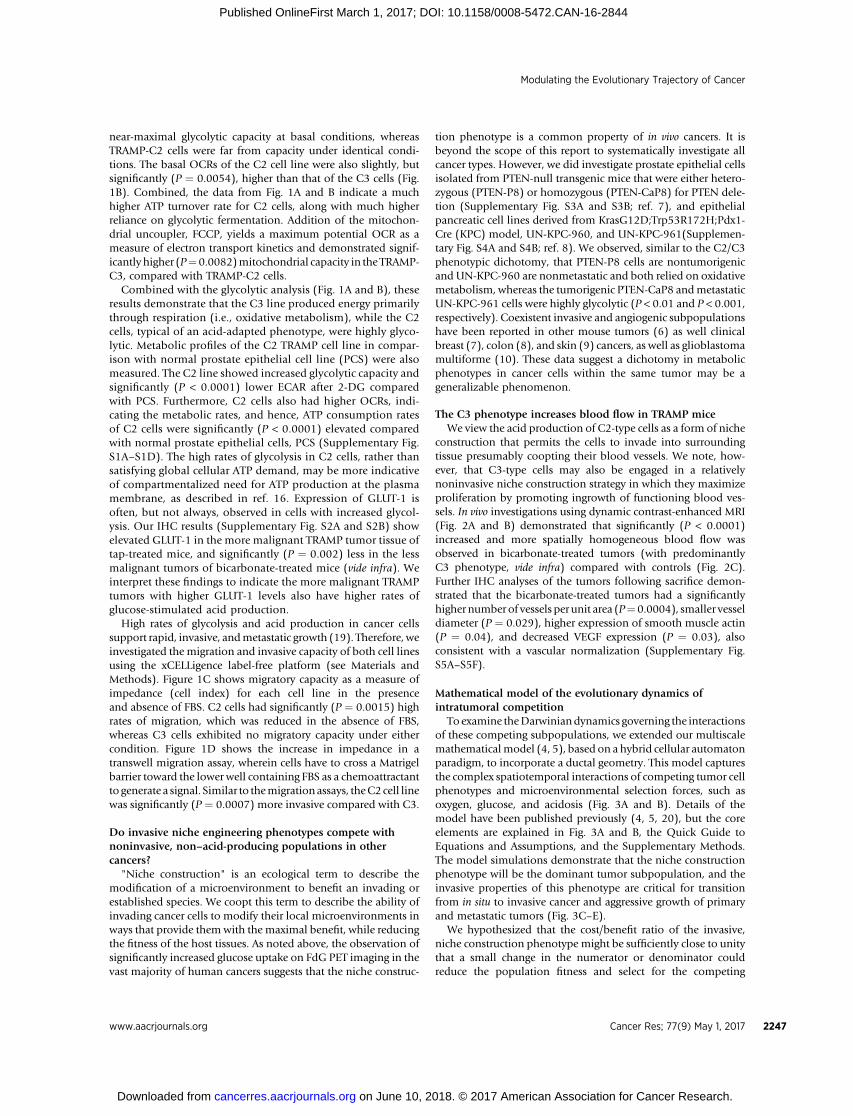
The C3 phenotype increases blood flow in TRAMP miceWe view the acid production of C2-type cells as a form of niche
construction that permits the cells to invade into surroundingtissue presumably coopting their blood vessels. We note, how-ever, that C3-type cells may also be engaged in a relativelynoninvasive niche construction strategy in which they maximizeproliferation by promoting ingrowth of functioning blood ves-sels. In vivo investigations using dynamic contrast-enhanced MRI(Fig. 2A and B) demonstrated that significantly (P < 0.0001)increased and more spatially homogeneous blood flow wasobserved in bicarbonate-treated tumors (with predominantlyC3 phenotype, vide infra) compared with controls (Fig. 2C).Further IHC analyses of the tumors following sacrifice demon-strated that the bicarbonate-treated tumors had a significantlyhigher number of vessels per unit area (P¼0.0004), smaller vesseldiameter (P ¼ 0.029), higher expression of smooth muscle actin(P ¼ 0.04), and decreased VEGF expression (P ¼ 0.03), alsoconsistent with a vascular normalization (Supplementary Fig.S5A–S5F).
Mathematical model of the evolutionary dynamics ofintratumoral competition
To examine theDarwiniandynamics governing the interactionsof these competing subpopulations, we extended our multiscalemathematicalmodel (4, 5), based on a hybrid cellular automatonparadigm, to incorporate a ductal geometry. This model capturesthe complex spatiotemporal interactions of competing tumor cellphenotypes and microenvironmental selection forces, such asoxygen, glucose, and acidosis (Fig. 3A and B). Details of themodel have been published previously (4, 5, 20), but the coreelements are explained in Fig. 3A and B, the Quick Guide toEquations and Assumptions, and the Supplementary Methods.The model simulations demonstrate that the niche constructionphenotype will be the dominant tumor subpopulation, and theinvasive properties of this phenotype are critical for transitionfrom in situ to invasive cancer and aggressive growth of primaryand metastatic tumors (Fig. 3C–E).
We hypothesized that the cost/benefit ratio of the invasive,niche construction phenotype might be sufficiently close to unitythat a small change in the numerator or denominator couldreduce the population fitness and select for the competing
Modulating the Evolutionary Trajectory of Cancer
www.aacrjournals.org Cancer Res; 77(9) May 1, 2017 2247
on June 10, 2018. © 2017 American Association for Cancer Research. cancerres.aacrjournals.org Downloaded from
Published OnlineFirst March 1, 2017; DOI: 10.1158/0008-5472.CAN-16-2844
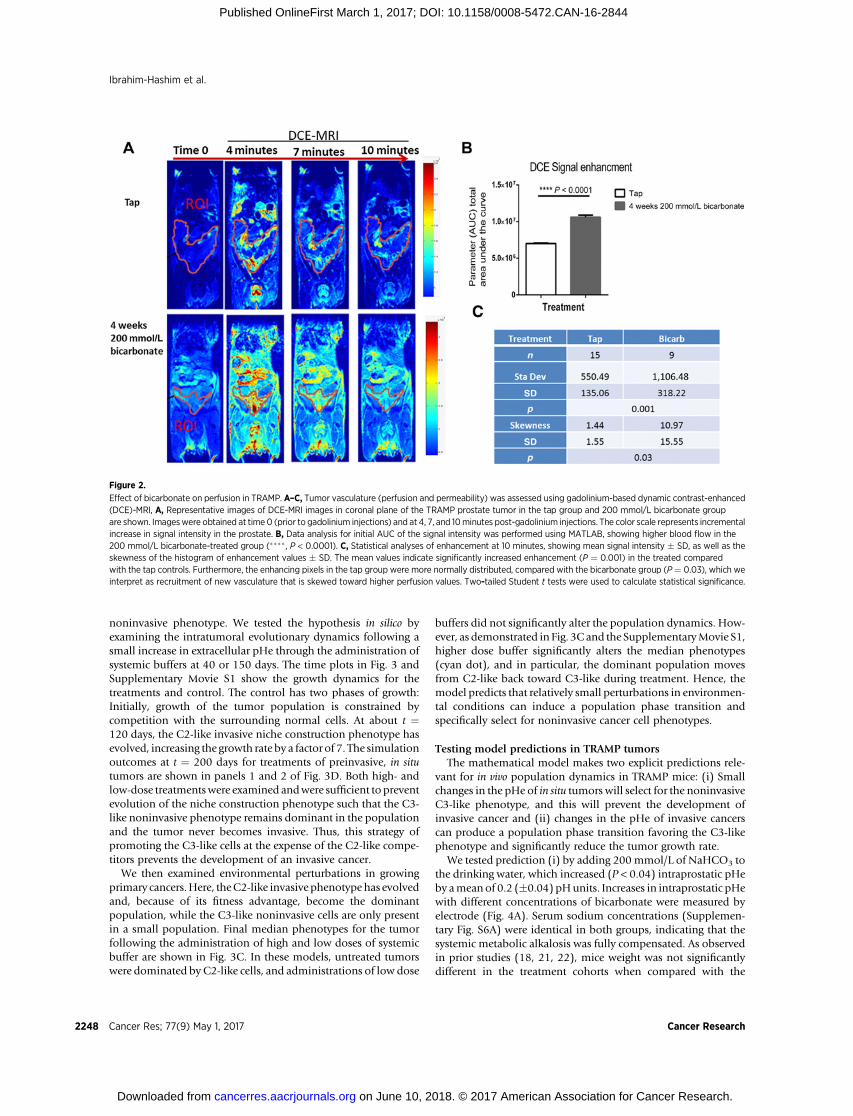
noninvasive phenotype. We tested the hypothesis in silico byexamining the intratumoral evolutionary dynamics following asmall increase in extracellular pHe through the administration ofsystemic buffers at 40 or 150 days. The time plots in Fig. 3 andSupplementary Movie S1 show the growth dynamics for thetreatments and control. The control has two phases of growth:Initially, growth of the tumor population is constrained bycompetition with the surrounding normal cells. At about t ¼120 days, the C2-like invasive niche construction phenotype hasevolved, increasing the growth rate by a factor of 7. The simulationoutcomes at t ¼ 200 days for treatments of preinvasive, in situtumors are shown in panels 1 and 2 of Fig. 3D. Both high- andlow-dose treatmentswere examined andwere sufficient to preventevolution of the niche construction phenotype such that the C3-like noninvasive phenotype remains dominant in the populationand the tumor never becomes invasive. Thus, this strategy ofpromoting the C3-like cells at the expense of the C2-like compe-titors prevents the development of an invasive cancer.
We then examined environmental perturbations in growingprimary cancers.Here, theC2-like invasive phenotype has evolvedand, because of its fitness advantage, become the dominantpopulation, while the C3-like noninvasive cells are only presentin a small population. Final median phenotypes for the tumorfollowing the administration of high and low doses of systemicbuffer are shown in Fig. 3C. In these models, untreated tumorswere dominated by C2-like cells, and administrations of low dose
buffers did not significantly alter the population dynamics. How-ever, as demonstrated in Fig. 3C and the SupplementaryMovie S1,higher dose buffer significantly alters the median phenotypes(cyan dot), and in particular, the dominant population movesfrom C2-like back toward C3-like during treatment. Hence, themodel predicts that relatively small perturbations in environmen-tal conditions can induce a population phase transition andspecifically select for noninvasive cancer cell phenotypes.
Testing model predictions in TRAMP tumorsThe mathematical model makes two explicit predictions rele-
vant for in vivo population dynamics in TRAMP mice: (i) Smallchanges in the pHe of in situ tumors will select for the noninvasiveC3-like phenotype, and this will prevent the development ofinvasive cancer and (ii) changes in the pHe of invasive cancerscan produce a population phase transition favoring the C3-likephenotype and significantly reduce the tumor growth rate.
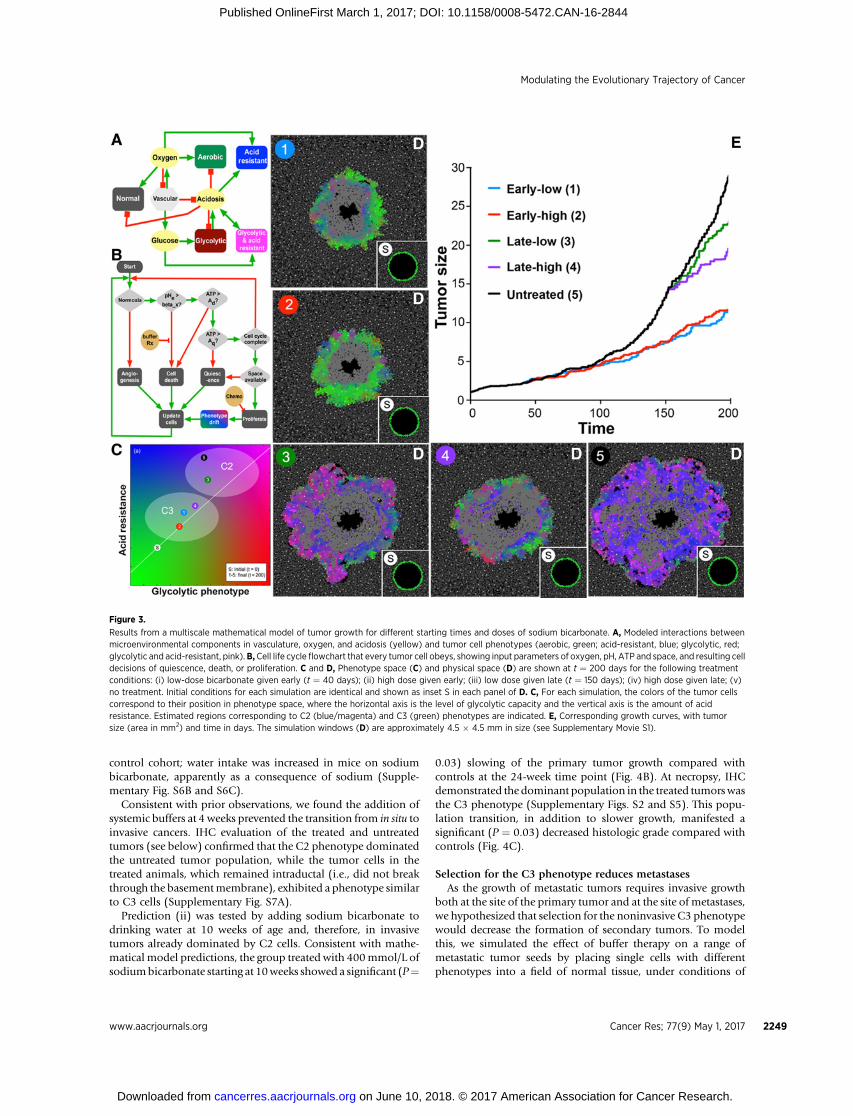
We tested prediction (i) by adding 200 mmol/L of NaHCO3 tothe drinking water, which increased (P < 0.04) intraprostatic pHeby amean of 0.2 (�0.04) pHunits. Increases in intraprostatic pHewith different concentrations of bicarbonate were measured byelectrode (Fig. 4A). Serum sodium concentrations (Supplemen-tary Fig. S6A) were identical in both groups, indicating that thesystemic metabolic alkalosis was fully compensated. As observedin prior studies (18, 21, 22), mice weight was not significantlydifferent in the treatment cohorts when compared with the
Figure 2.
Effect of bicarbonate on perfusion in TRAMP. A–C, Tumor vasculature (perfusion and permeability) was assessed using gadolinium-based dynamic contrast-enhanced(DCE)-MRI, A, Representative images of DCE-MRI images in coronal plane of the TRAMP prostate tumor in the tap group and 200 mmol/L bicarbonate groupare shown. Imageswere obtained at time 0 (prior to gadolinium injections) and at 4, 7, and 10minutes post-gadolinium injections. The color scale represents incrementalincrease in signal intensity in the prostate. B, Data analysis for initial AUC of the signal intensity was performed using MATLAB, showing higher blood flow in the200 mmol/L bicarbonate-treated group (���� , P < 0.0001). C, Statistical analyses of enhancement at 10 minutes, showing mean signal intensity � SD, as well as theskewness of the histogram of enhancement values � SD. The mean values indicate significantly increased enhancement (P ¼ 0.001) in the treated comparedwith the tap controls. Furthermore, the enhancing pixels in the tap group were more normally distributed, compared with the bicarbonate group (P¼ 0.03), which weinterpret as recruitment of new vasculature that is skewed toward higher perfusion values. Two-tailed Student t tests were used to calculate statistical significance.
Ibrahim-Hashim et al.
Cancer Res; 77(9) May 1, 2017 Cancer Research2248
on June 10, 2018. © 2017 American Association for Cancer Research. cancerres.aacrjournals.org Downloaded from
Published OnlineFirst March 1, 2017; DOI: 10.1158/0008-5472.CAN-16-2844
control cohort; water intake was increased in mice on sodiumbicarbonate, apparently as a consequence of sodium (Supple-mentary Fig. S6B and S6C).
Consistent with prior observations, we found the addition ofsystemic buffers at 4 weeks prevented the transition from in situ toinvasive cancers. IHC evaluation of the treated and untreatedtumors (see below) confirmed that the C2 phenotype dominatedthe untreated tumor population, while the tumor cells in thetreated animals, which remained intraductal (i.e., did not breakthrough the basementmembrane), exhibited a phenotype similarto C3 cells (Supplementary Fig. S7A).
Prediction (ii) was tested by adding sodium bicarbonate todrinking water at 10 weeks of age and, therefore, in invasivetumors already dominated by C2 cells. Consistent with mathe-matical model predictions, the group treated with 400mmol/L ofsodiumbicarbonate starting at 10weeks showed a significant (P¼
0.03) slowing of the primary tumor growth compared withcontrols at the 24-week time point (Fig. 4B). At necropsy, IHCdemonstrated the dominant population in the treated tumorswasthe C3 phenotype (Supplementary Figs. S2 and S5). This popu-lation transition, in addition to slower growth, manifested asignificant (P ¼ 0.03) decreased histologic grade compared withcontrols (Fig. 4C).
Selection for the C3 phenotype reduces metastasesAs the growth of metastatic tumors requires invasive growth
both at the site of the primary tumor and at the site of metastases,we hypothesized that selection for the noninvasive C3 phenotypewould decrease the formation of secondary tumors. To modelthis, we simulated the effect of buffer therapy on a range ofmetastatic tumor seeds by placing single cells with differentphenotypes into a field of normal tissue, under conditions of
Figure 3.
Results from a multiscale mathematical model of tumor growth for different starting times and doses of sodium bicarbonate. A, Modeled interactions betweenmicroenvironmental components in vasculature, oxygen, and acidosis (yellow) and tumor cell phenotypes (aerobic, green; acid-resistant, blue; glycolytic, red;glycolytic and acid-resistant, pink).B,Cell life cycle flowchart that every tumor cell obeys, showing input parameters of oxygen, pH, ATP and space, and resulting celldecisions of quiescence, death, or proliferation. C and D, Phenotype space (C) and physical space (D) are shown at t ¼ 200 days for the following treatmentconditions: (i) low-dose bicarbonate given early (t ¼ 40 days); (ii) high dose given early; (iii) low dose given late (t ¼ 150 days); (iv) high dose given late; (v)no treatment. Initial conditions for each simulation are identical and shown as inset S in each panel of D. C, For each simulation, the colors of the tumor cellscorrespond to their position in phenotype space, where the horizontal axis is the level of glycolytic capacity and the vertical axis is the amount of acidresistance. Estimated regions corresponding to C2 (blue/magenta) and C3 (green) phenotypes are indicated. E, Corresponding growth curves, with tumorsize (area in mm2) and time in days. The simulation windows (D) are approximately 4.5 � 4.5 mm in size (see Supplementary Movie S1).
Modulating the Evolutionary Trajectory of Cancer
www.aacrjournals.org Cancer Res; 77(9) May 1, 2017 2249
on June 10, 2018. © 2017 American Association for Cancer Research. cancerres.aacrjournals.org Downloaded from
Published OnlineFirst March 1, 2017; DOI: 10.1158/0008-5472.CAN-16-2844
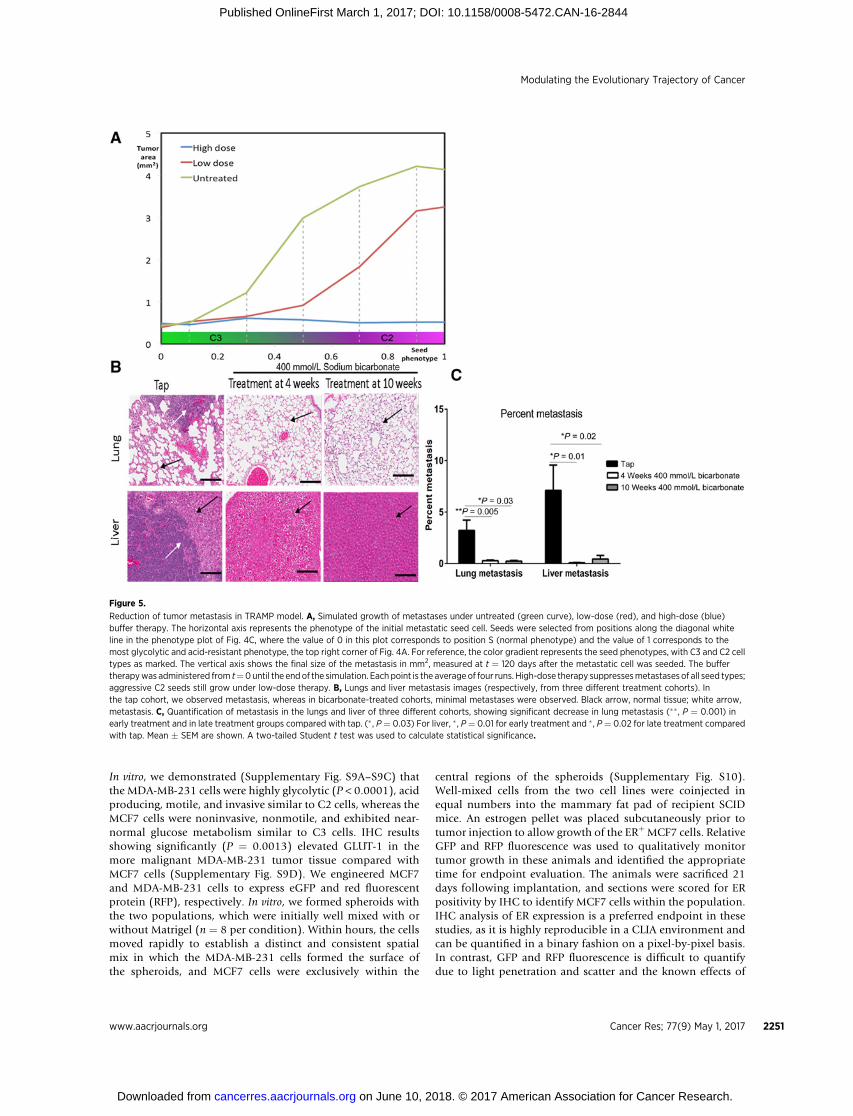
high dose, low dose, and no therapy. The simulations were rununtil t ¼ 120 days, at which point the size of the metastasis wasmeasured. The results (Fig. 5A) showed that the overall effect ofhigh-dose systemic buffers will depend on the distribution ofcirculating phenotypes and sizes at the time of treatment. How-ever, as with the primary tumors, the model predicts that highdoses of systemic buffers will significantly suppress metastatictumor growth.
On the basis of these mathematical model results, we theninvestigated whether a higher dose (400 mmol/L) of NaHCO3
initiated at 10weeks could inhibit the development ofmetastasis.There were fewer metastases to lung and liver, and their quanti-fication showed a significant (P < 0.03) decrease in in the treatedcohorts compared with controls (Fig. 5B and C).
Metastasis requires the release of various proteases, includingmetalloproteases (MMP; refs. 23, 24). To examineMMPactivity invivo, we injected with an MMP-activatable fluorescent probe
(MMPSense 680, see Materials and Methods) via the tail vein24 hours before analysis at 28 weeks (Supplementary Fig. S8A).Quantification of images demonstrated significantly (P < 0.05)lower activity in both the 4- and 10-week bicarbonate-treatedcohorts, compared with controls (Supplementary Fig. S8B). Invitro controls have previously shown that the activity of theseprobes is not pH dependent in the range of these experiments(25). Using qRT-PCR, we demonstrated MMP-9 mRNA expres-sion was specifically upregulated by acidosis in C2, in contrast toMMP-2, -3, and -13 (Supplementary Fig. S8C).
Can the results in TRAMP mice be reproduced in otherexperimental models?
To test the broad applicability of our results in the TRAMPmice, we designed an experiment that investigated the in vivocompetition of two metabolically different breast cancer celllines: noninvasive MCF7 and highly invasive MDA-MB-231.
Figure 4.
Reduction of tumor growth in TRAMP model. A, In vivo measurements of the pH of the prostate in tap, 200 mmol/L bicarbonate-treated groups, and 400 mmol/Lbicarbonate-treated group (n ¼ 3 for each cohort) were obtained immediately prior to euthanasia. pH was measured using single-barrel pH microelectrode,MI-419 (Microelectrode, Inc.). The results indicate a statistically significant increase inpH in the bicarbonate-treated animals comparedwith the tapanimals. � ,P¼0.015;� , P ¼ 0.04. Mean � SEM is shown. B, Prostate volume measurements of different treatments; nontransgenic (n ¼ 5), TAP (n ¼ 7), late start 200 mmol/Lbicarbonate treatment (n¼ 5), early treatment at 200mmol/L bicarbonate (n¼ 5), and late treated with 400 mmol/L bicarbonate (n¼ 7) cohorts obtained throughUS imaging. Data show that mice treated with higher dose (400 mmol/L sodium bicarbonate) at 4 weeks of age maintained reduced prostate volumesthroughout study (� , P¼ 0.016), whereas the late-treatedmice (started at 10 weeks) only showed reduced volume at 24weeks (� , P¼ 0.03). C,Histologic quantitativeanalysis of prostate tumors showing percent pixels associated with benign and malignant phenotypes in prostate tumors of different treatment cohorts. Theseshow significant differences in the percent of benign and malignant tumors observed in the 4-week-old treated mice and late treated with increased dosescompared with other groups. � , P ¼ 0.017 and � , P ¼ 0.03, respectively. A two-tailed Student t test was used to calculate statistical significance.
Ibrahim-Hashim et al.
Cancer Res; 77(9) May 1, 2017 Cancer Research2250
on June 10, 2018. © 2017 American Association for Cancer Research. cancerres.aacrjournals.org Downloaded from
Published OnlineFirst March 1, 2017; DOI: 10.1158/0008-5472.CAN-16-2844
In vitro, we demonstrated (Supplementary Fig. S9A–S9C) thatthe MDA-MB-231 cells were highly glycolytic (P < 0.0001), acidproducing, motile, and invasive similar to C2 cells, whereas theMCF7 cells were noninvasive, nonmotile, and exhibited near-normal glucose metabolism similar to C3 cells. IHC resultsshowing significantly (P ¼ 0.0013) elevated GLUT-1 in themore malignant MDA-MB-231 tumor tissue compared withMCF7 cells (Supplementary Fig. S9D). We engineered MCF7and MDA-MB-231 cells to express eGFP and red fluorescentprotein (RFP), respectively. In vitro, we formed spheroids withthe two populations, which were initially well mixed with orwithout Matrigel (n ¼ 8 per condition). Within hours, the cellsmoved rapidly to establish a distinct and consistent spatialmix in which the MDA-MB-231 cells formed the surface ofthe spheroids, and MCF7 cells were exclusively within the
central regions of the spheroids (Supplementary Fig. S10).Well-mixed cells from the two cell lines were coinjected inequal numbers into the mammary fat pad of recipient SCIDmice. An estrogen pellet was placed subcutaneously prior totumor injection to allow growth of the ERþMCF7 cells. RelativeGFP and RFP fluorescence was used to qualitatively monitortumor growth in these animals and identified the appropriatetime for endpoint evaluation. The animals were sacrificed 21days following implantation, and sections were scored for ERpositivity by IHC to identify MCF7 cells within the population.IHC analysis of ER expression is a preferred endpoint in thesestudies, as it is highly reproducible in a CLIA environment andcan be quantified in a binary fashion on a pixel-by-pixel basis.In contrast, GFP and RFP fluorescence is difficult to quantifydue to light penetration and scatter and the known effects of
Figure 5.
Reduction of tumor metastasis in TRAMP model. A, Simulated growth of metastases under untreated (green curve), low-dose (red), and high-dose (blue)buffer therapy. The horizontal axis represents the phenotype of the initial metastatic seed cell. Seeds were selected from positions along the diagonal whiteline in the phenotype plot of Fig. 4C, where the value of 0 in this plot corresponds to position S (normal phenotype) and the value of 1 corresponds to themost glycolytic and acid-resistant phenotype, the top right corner of Fig. 4A. For reference, the color gradient represents the seed phenotypes, with C3 and C2 celltypes as marked. The vertical axis shows the final size of the metastasis in mm2, measured at t ¼ 120 days after the metastatic cell was seeded. The buffertherapywas administered from t¼0until the endof the simulation. Each point is the averageof four runs. High-dose therapy suppressesmetastases of all seed types;aggressive C2 seeds still grow under low-dose therapy. B, Lungs and liver metastasis images (respectively, from three different treatment cohorts). Inthe tap cohort, we observed metastasis, whereas in bicarbonate-treated cohorts, minimal metastases were observed. Black arrow, normal tissue; white arrow,metastasis. C, Quantification of metastasis in the lungs and liver of three different cohorts, showing significant decrease in lung metastasis (��, P ¼ 0.001) inearly treatment and in late treatment groups compared with tap. (� , P¼ 0.03) For liver, � , P¼ 0.01 for early treatment and �, P¼ 0.02 for late treatment comparedwith tap. Mean � SEM are shown. A two-tailed Student t test was used to calculate statistical significance.
Modulating the Evolutionary Trajectory of Cancer
www.aacrjournals.org Cancer Res; 77(9) May 1, 2017 2251
on June 10, 2018. © 2017 American Association for Cancer Research. cancerres.aacrjournals.org Downloaded from
Published OnlineFirst March 1, 2017; DOI: 10.1158/0008-5472.CAN-16-2844
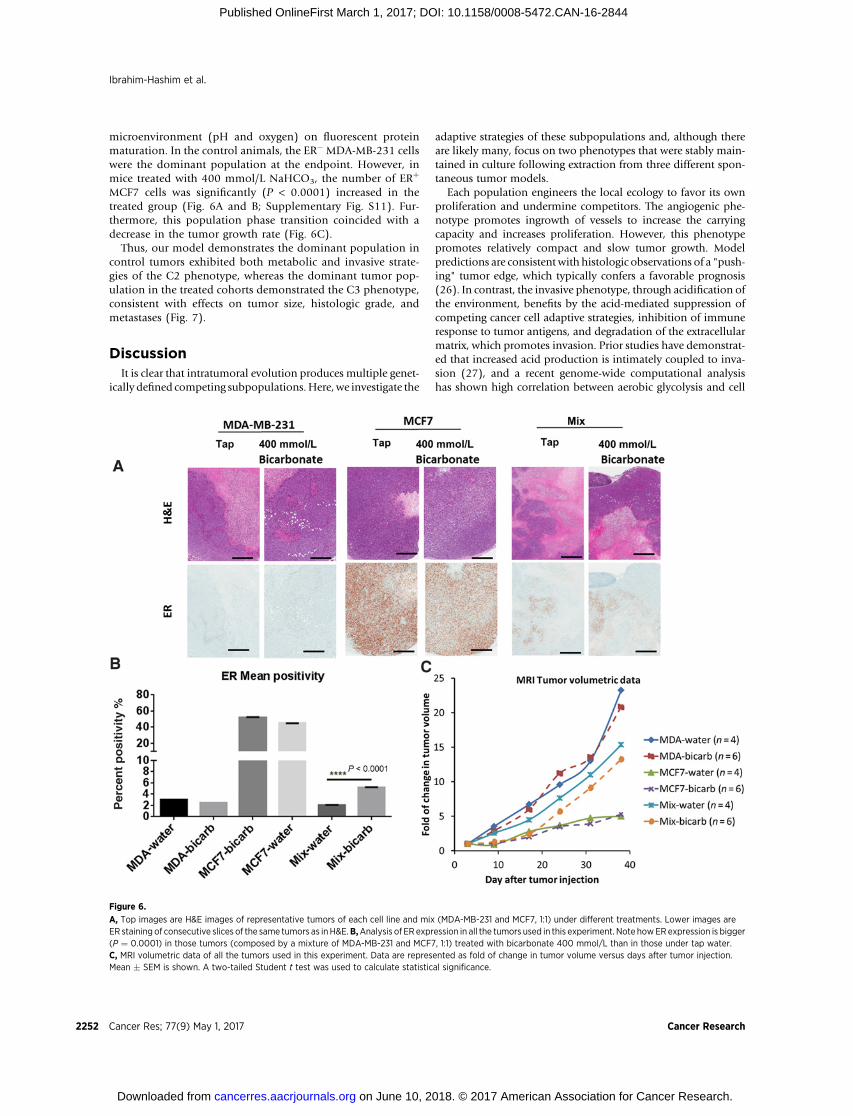
microenvironment (pH and oxygen) on fluorescent proteinmaturation. In the control animals, the ER� MDA-MB-231 cellswere the dominant population at the endpoint. However, inmice treated with 400 mmol/L NaHCO3, the number of ERþ
MCF7 cells was significantly (P < 0.0001) increased in thetreated group (Fig. 6A and B; Supplementary Fig. S11). Fur-thermore, this population phase transition coincided with adecrease in the tumor growth rate (Fig. 6C).
Thus, our model demonstrates the dominant population incontrol tumors exhibited both metabolic and invasive strate-gies of the C2 phenotype, whereas the dominant tumor pop-ulation in the treated cohorts demonstrated the C3 phenotype,consistent with effects on tumor size, histologic grade, andmetastases (Fig. 7).
DiscussionIt is clear that intratumoral evolution produces multiple genet-
ically defined competing subpopulations.Here, we investigate the
adaptive strategies of these subpopulations and, although thereare likely many, focus on two phenotypes that were stably main-tained in culture following extraction from three different spon-taneous tumor models.
Each population engineers the local ecology to favor its ownproliferation and undermine competitors. The angiogenic phe-notype promotes ingrowth of vessels to increase the carryingcapacity and increases proliferation. However, this phenotypepromotes relatively compact and slow tumor growth. Modelpredictions are consistent with histologic observations of a "push-ing" tumor edge, which typically confers a favorable prognosis(26). In contrast, the invasive phenotype, through acidification ofthe environment, benefits by the acid-mediated suppression ofcompeting cancer cell adaptive strategies, inhibition of immuneresponse to tumor antigens, and degradation of the extracellularmatrix, which promotes invasion. Prior studies have demonstrat-ed that increased acid production is intimately coupled to inva-sion (27), and a recent genome-wide computational analysishas shown high correlation between aerobic glycolysis and cell
Figure 6.
A, Top images are H&E images of representative tumors of each cell line and mix (MDA-MB-231 and MCF7, 1:1) under different treatments. Lower images areER staining of consecutive slices of the same tumors as in H&E.B,Analysis of ER expression in all the tumors used in this experiment. Note howERexpression is bigger(P ¼ 0.0001) in those tumors (composed by a mixture of MDA-MB-231 and MCF7, 1:1) treated with bicarbonate 400 mmol/L than in those under tap water.C, MRI volumetric data of all the tumors used in this experiment. Data are represented as fold of change in tumor volume versus days after tumor injection.Mean � SEM is shown. A two-tailed Student t test was used to calculate statistical significance.
Cancer Res; 77(9) May 1, 2017 Cancer Research2252
Ibrahim-Hashim et al.
on June 10, 2018. © 2017 American Association for Cancer Research. cancerres.aacrjournals.org Downloaded from
Published OnlineFirst March 1, 2017; DOI: 10.1158/0008-5472.CAN-16-2844

motility (28). Histologically, this phenotype will manifest as an"infiltrating" border, which confers a poor prognosis (26).
In ongoing intratumoral evolution, the benefits of each adap-tive strategy are weighed against the costs. For the invasivestrategy, costs include diminished efficiency of energy productiondue to aerobic glycolysis and the metabolic demands (due tomembrane proton pumps, for example) of adapting to an acidicenvironment. It seems likely that the benefits of niche construc-tion generally outweigh the costs, as the vast majority of primaryand metastatic cancers exhibit increased glucose accumulation inFdG PET imaging.
Here, we asked: how robust to external perturbations is thisapparent advantage? Complex dynamical systems, such as can-cers, are typically dominated by nonlinear interactions, dynamicsthat are difficult to anticipate intuitively. Thus, the experimentalwork was guided by mathematical models, which demonstratedeven small changes in the pHe could reduce the fitness advantageof the invasive, glycolytic phenotype, leading to a populationphase transition (Fig. 3) favoring non–acid-producing, noninva-sive phenotypes.
This prediction was confirmed in TRAMP mice as smallchanges in intraprostatic or intratumoral pHe promoted non-invasive phenotypes and significantly altered tumor growthpatterns. To explicitly investigate competition between thesetwo adaptive strategies, we constructed an experimental tumorusing two breast cancer cell lines: lowly invasive, metabolicallynear-normal, angiogenic MCF7 cells and highly invasive, highlyglycolytic, acid-secreting MDA-MB-231 cells. Consistent withmodel predictions and observations in TRAMP mice, we foundthat the MDA-MB-231 cells became the dominant populationin vivo. However, when the experiment was repeated with 400mmol/L of NaHCO3 added to the drinking water, MCF7 cellsbecame favored, and the tumor growth slowed significantly(Fig. 6; Supplementary Fig. S11).
In summary, we demonstrate that cancers, like other complexdynamical systems, can be steered into a less aggressive coursethrough application of relatively small but highly selective bio-logical "force." This can be achieved even in the absence of acomprehensive understanding of every component in the systemthrough the application of mathematical models that capture thekey underlying nonlinear Darwinian dynamics.
Disclosure of Potential Conflicts of InterestNo potential conflicts of interest were disclosed.
Authors' ContributionsConception and design: A. Ibrahim-Hashim, M. Robertson-Tessi, J.W. Wojt-kowiak, M.C. Lloyd, J.S. Brown, A.R.A. Anderson, R.J. Gillies, R.A. GatenbyDevelopment of methodology: A. Ibrahim-Hashim, M. Robertson-Tessi,Y. Balagurunathan, K. Yoonseok, M.C. Lloyd, A.R.A. Anderson, R.J. Gillies,R.A. GatenbyAcquisition of data (provided animals, acquired and managed patients,provided facilities, etc.): A. Ibrahim-Hashim, M. Robertson-Tessi, P.M. Enri-quez-Navas,M.Damaghi, J.W.Wojtkowiak, S. Russell, K. Yoonseok,M.C. Lloyd,M.M. Bui, R.J. Gillies, R.A. GatenbyAnalysis and interpretation of data (e.g., statistical analysis, biostatistics,computational analysis):M. Robertson-Tessi, P.M. Enriquez-Navas, M. Dama-ghi, Y. Balagurunathan, S. Russell, K. Yoonseok, M.C. Lloyd, M.M. Bui,J.S. Brown, A.R.A. Anderson, R.J. Gillies, R.A. GatenbyWriting, review, and/or revision of the manuscript: A. Ibrahim-Hashim,M. Robertson-Tessi, P.M. Enriquez-Navas, Y. Balagurunathan, M.M. Bui,J.S. Brown, A.R.A. Anderson, R.J. Gillies, R.A. GatenbyAdministrative, technical, or material support (i.e., reporting or organizingdata, constructing databases): A. Ibrahim-Hashim, R.J. GilliesStudy supervision: A. Ibrahim-Hashim, A.R.A. Anderson, R.J. GilliesOther (led the computational model development, implementation, andcalibration): A.R.A. Anderson
Grant SupportThis work was supported by NIH grants U54CA193489 to A.R.A. Anderson,
R.A. Gatenby, and R.J. Gillies; R01CA077575-15 to R.J. Gillies and
Figure 7.
Model for manipulation of nicheconstruction evolutionary strategy.Our hypotheses is that tumors consistof two distinct subpopulations of cells,highly glycolytic, acid-producing cells(red cells), and nonglycolytic, non–acid-producing cells (blue cells). Ourmodel predicts that smallperturbations in pHe could induce apopulation phase transition favoringthe non–acid-producing, noninvasivecancer populations. PIN, prostateintraepithelial neoplasia.
Modulating the Evolutionary Trajectory of Cancer
www.aacrjournals.org Cancer Res; 77(9) May 1, 2017 2253
on June 10, 2018. © 2017 American Association for Cancer Research. cancerres.aacrjournals.org Downloaded from
Published OnlineFirst March 1, 2017; DOI: 10.1158/0008-5472.CAN-16-2844
R.A Gatenby; and U01CA151924 to A.R.A. Anderson. The following corefacilities at the Moffitt Cancer Center were supported by the CCSG5P30CA76292-13: Animal images were completed with the support of theSmall Animal Imaging Lab (SAIL); IHCwas performed in the tissue core facility;image analysis was completed with the support of the Analytical Microscopycore facility and assistance was provided by the Tissue Core Facility.
The costs of publication of this articlewere defrayed inpart by the payment ofpage charges. This article must therefore be hereby marked advertisement inaccordance with 18 U.S.C. Section 1734 solely to indicate this fact.
Received October 25, 2016; revised December 12, 2016; accepted February22, 2017; published OnlineFirst March 1, 2017.
References1. Gerlinger M, Rowan AJ, Horswell S, Larkin J, Endesfelder D, Gronroos E,
et al. Intratumor heterogeneity and branched evolution revealed by multi-region sequencing. N Engl J Med 2012;366:883–92.
2. Sottoriva A, Spiteri I, Piccirillo SG, Touloumis A, Collins VP, Marioni JC,et al. Intratumor heterogeneity in human glioblastoma reflects cancerevolutionary dynamics. Proc Natl Acad Sci U S A 2013;110:4009–14.
3. Gatenby RA, Cunningham JJ, Brown JS. Evolutionary triage governs fitnessin driver and passenger mutations and suggests targeting never mutations.Nat Commun 2014;5:5499.
4. Anderson AR. A hybrid mathematical model of solid tumour invasion: theimportance of cell adhesion. Math Med Biol 2005;22:163–86.
5. Robertson-Tessi M, Gillies RJ, Gatenby RA, Anderson AR. Impact ofmetabolic heterogeneity on tumor growth, invasion, and treatment out-comes. Cancer Res 2015;75:1567–79.
6. Foster BA,Gingrich JR, KwonED,MadiasC,GreenbergNM.Characterizationof prostatic epithelial cell lines derived from transgenic adenocarcinoma ofthe mouse prostate (TRAMP) model. Cancer Res 1997;57:3325–30.
7. Jiao J, Wang S, Qiao R, Vivanco I, Watson PA, Sawyers CL, et al. Murine celllines derived from Pten null prostate cancer show the critical role of PTENin hormone refractory prostate cancer development. Cancer Res 2007;67:6083–91.
8. Torres MP, Rachagani S, Souchek JJ, Mallya K, Johansson SL, Batra SK.Novel pancreatic cancer cell lines derived from genetically engineeredmouse models of spontaneous pancreatic adenocarcinoma: applicationsin diagnosis and therapy. PLoS One 2013;8:e80580.
9. Wyder L, Suply T, Ricoux B, Billy E, Schnell C, Baumgarten BU, et al.Reduced pathological angiogenesis and tumor growth in mice lackingGPR4, a proton sensing receptor. Angiogenesis 2011;14:533–44.
10. Lloyd MC, Cunningham JJ, Bui MM, Gillies RJ, Brown JS, Gatenby RA.Darwinian dynamics of intratumoral heterogeneity: not solely randommutations but also variable environmental selection forces. Cancer Res2016;76:3136–44.
11. Georgiou L, Minopoulos G, Lirantzopoulos N, Fiska-Demetriou A, Mal-tezos E, Sivridis E. Angiogenesis and p53 at the invading tumor edge:prognostic markers for colorectal cancer beyond stage. J Surg Res 2006;131:118–23.
12. MitsuiH, Suarez-FarinasM,GulatiN, ShahKR,CannizzaroMV,Coats I, et al.Gene expression profiling of the leading edge of cutaneous squamous cellcarcinoma: IL-24-driven MMP-7. J Invest Dermatol 2014;134:1418–27.
13. Gill BJ, Pisapia DJ, Malone HR, Goldstein H, Lei L, Sonabend A, et al. MRI-localized biopsies reveal subtype-specific differences in molecular andcellular composition at the margins of glioblastoma. Proc Natl Acad SciU S A 2014;111:12550–5.
14. Rejniak KA, Anderson AR. Hybrid models of tumor growth. Wiley Inter-discip Rev Syst Biol Med 2011;3:115–25.
15. GreenbergNM,DeMayo F, FinegoldMJ,MedinaD, TilleyWD, Aspinall JO,et al. Prostate cancer in a transgenic mouse. Proc Natl Acad Sci U S A1995;92:3439–43.
16. Wang J, Eltoum IE, Lamartiniere CA. Genistein chemoprevention ofprostate cancer in TRAMP mice. J Carcinog 2007;6:3.
17. Guo P, Fang Q, Tao HQ, Schafer CA, Fenton BM, Ding I, et al. Over-expression of vascular endothelial growth factor by MCF-7 breast cancercells promotes estrogen-independent tumor growth in vivo. Cancer Res2003;63:4684–91.
18. Ibrahim-Hashim A, Cornnell HH, Abrahams D, LloydM, Bui M, Gillies RJ,et al. Systemic buffers inhibit carcinogenesis in TRAMP mice. J Urol2012;188:624–31.
19. Walenta S, Wetterling M, Lehrke M, Schwickert G, Sundfor K, Rofstad EK,et al. High lactate levels predict likelihood ofmetastases, tumor recurrence,and restricted patient survival in human cervical cancers. Cancer Res2000;60:916–21.
20. AndersonAR,Weaver AM,Cummings PT,Quaranta V. Tumormorphologyand phenotypic evolution driven by selective pressure from the microen-vironment. Cell 2006;127:905–15.
21. Ibrahim Hashim A, Cornnell HH, Coelho Ribeiro Mde L, Abrahams D,Cunningham J, LloydM, et al. Reduction ofmetastasis using a non-volatilebuffer. Clin Exp Metastasis 2011;28:841–9.
22. Robey IF, Baggett BK, Kirkpatrick ND, Roe DJ, Dosescu J, Sloane BF, et al.Bicarbonate increases tumor pH and inhibits spontaneous metastases.Cancer Res 2009;69:2260–8.
23. Goldfarb RH, Liotta LA. Proteolytic enzymes in cancer invasion andmetastasis. Semin Thromb Hemost 1986;12:294–307.
24. Liotta LA, Thorgeirsson UP, Garbisa S. Role of collagenases in tumor cellinvasion. Cancer Metastasis Rev 1982;1:277–88.
25. Rothberg JM, Bailey KM, Wojtkowiak JW, Ben-Nun Y, Bogyo M, Weber E,et al. Acid-mediated tumor proteolysis: contributionof cysteine cathepsins.Neoplasia 2013;15:1125–37.
26. Zlobec I, Baker K,Minoo P,Hayashi S, Terracciano L, Lugli A. Tumor borderconfiguration added to TNM staging better stratifies stage II colorectalcancer patients into prognostic subgroups. Cancer 2009;115:4021–9.
27. Estrella V, Chen T, LloydM, Wojtkowiak J, Cornnell HH, Ibrahim-HashimA, et al. Acidity generated by the tumor microenvironment drives localinvasion. Cancer Res 2013;73:1524–35.
28. Yizhak K, Le Devedec SE, Rogkoti VM, Baenke F, de Boer VC, Frezza C, et al.A computational study of the Warburg effect identifies metabolic targetsinhibiting cancer migration. Mol Syst Biol 2014;10:744.
Cancer Res; 77(9) May 1, 2017 Cancer Research2254
Ibrahim-Hashim et al.
on June 10, 2018. © 2017 American Association for Cancer Research. cancerres.aacrjournals.org Downloaded from
Published OnlineFirst March 1, 2017; DOI: 10.1158/0008-5472.CAN-16-2844
2017;77:2242-2254. Published OnlineFirst March 1, 2017.Cancer Res Arig Ibrahim-Hashim, Mark Robertson-Tessi, Pedro M. Enriquez-Navas, et al. Intratumoral EvolutionThan Molecular Properties Provides Novel Insights into Defining Cancer Subpopulations by Adaptive Strategies Rather
Updated version
10.1158/0008-5472.CAN-16-2844doi:
Access the most recent version of this article at:
Material
Supplementary
http://cancerres.aacrjournals.org/content/suppl/2017/03/01/0008-5472.CAN-16-2844.DC1
Access the most recent supplemental material at:
Cited articles
http://cancerres.aacrjournals.org/content/77/9/2242.full#ref-list-1
This article cites 28 articles, 12 of which you can access for free at:
Citing articles
http://cancerres.aacrjournals.org/content/77/9/2242.full#related-urls
This article has been cited by 2 HighWire-hosted articles. Access the articles at:
E-mail alerts related to this article or journal.Sign up to receive free email-alerts
Subscriptions
Reprints and
To order reprints of this article or to subscribe to the journal, contact the AACR Publications Department at
Permissions
Rightslink site. Click on "Request Permissions" which will take you to the Copyright Clearance Center's (CCC)
.http://cancerres.aacrjournals.org/content/77/9/2242To request permission to re-use all or part of this article, use this link
on June 10, 2018. © 2017 American Association for Cancer Research. cancerres.aacrjournals.org Downloaded from
Published OnlineFirst March 1, 2017; DOI: 10.1158/0008-5472.CAN-16-2844