![2000 Missouri State Park and Historic Site Visitor Survey ...1].pdf · 1. Describing the use patterns of state park and historic site visitors. 2. Describing the socio-demographic](https://static.fdocuments.in/doc/165x107/5f8acc2c72bc35569f27836a/2000-missouri-state-park-and-historic-site-visitor-survey-1pdf-1-describing.jpg)
Ninety Six National Historic Site Visitor Study
112
National Park Service U.S. Department of the Interior Natural Resource Program Center Ninety Six National Historic Site Visitor Study Spring 2010 Natural Resource Report NPS/NRPC/SSD/NRR—2010/463/106102
Transcript of Ninety Six National Historic Site Visitor Study

National Park Service U.S. Department of the Interior Natural Resource Program Center
Ninety Six National Historic Site Visitor Study Spring 2010 Natural Resource Report NPS/NRPC/SSD/NRR—2010/463/106102

ON THE COVER Stockade Fort at Ninety Six National Historic Site Photograph courtesy of Ninety Six National Historic Site

Ninety Six National Historic Site Visitor Study Spring 2010 Natural Resource Report NPS/NRPC/SSD/NRR—2010/463/106102
Ariel Blotkamp, Nancy C. Holmes, Steven J. Hollenhorst
Visitor Services Project Park Studies Unit University of Idaho Moscow, ID 83844-1139
December 2010
U.S. Department of the Interior National Park Service Natural Resource Program Center Fort Collins, Colorado

ii
The National Park Service Natural Resource Program Center publishes a range of reports that address natural resource topics of interest and applicability to a broad audience in the National Park Service and others in natural resource management, including scientists, conservation and environmental constituencies, and the public.
The Natural Resource Report Series is used to disseminate high-priority, current natural resource management information with managerial application. The series targets a general, diverse audience, and may contain NPS policy considerations or address sensitive issues of management applicability.
All manuscripts in the series receive the appropriate level of peer review to ensure that the information is scientifically credible, technically accurate, appropriately written for the intended audience, and designed and published in a professional manner.
Data in this report were collected and analyzed using methods based on established, peer-reviewed protocols and were analyzed and interpreted within the guidelines of the protocols.
Views, statements, findings, conclusions, recommendations, and data in this report do not necessarily reflect views and policies of the National Park Service, U.S. Department of the Interior. Mention of trade names or commercial products does not constitute endorsement or recommendation for use by the U.S. Government.
This report is available from the Social Science Division (http://www.nature.nps.gov/ socialscience/index.cfm) and the Natural Resource Publications Management website (http://www.nature.nps.gov/publications/NRPM).
Please cite this publication as:
Blotkamp, A., Holmes, N. C., Hollenhorst, S. J., 2010. Ninety Six National Historic Site Visitor Study: Spring 2010. Natural Resource Report NPS/NRPC/SSD/NRR—2010/463/106102. National Park Service, Fort Collins, Colorado.
NPS 463/106102, December 2010

iii
Contents CONTENTS ...................................................................................................................................................... IIIEXECUTIVE SUMMARY ................................................................................................................................... V
Acknowledgements ................................................................................................................................... viAbout the Authors ..................................................................................................................................... vi
INTRODUCTION ................................................................................................................................................ 1Organization of the Report......................................................................................................................... 1Presentation of the Results ....................................................................................................................... 2
METHODS ......................................................................................................................................................... 3Survey Design ............................................................................................................................................. 3
Sample size and sampling plan ............................................................................................................... 3Questionnaire design ............................................................................................................................... 4Survey procedure .................................................................................................................................... 4Data analysis ........................................................................................................................................... 5Limitations ................................................................................................................................................ 6Special conditions .................................................................................................................................... 6Checking non-response bias ................................................................................................................... 7
RESULTS........................................................................................................................................................... 9Group and Visitor Characteristics ............................................................................................................ 9
Visitor group size ..................................................................................................................................... 9Visitor group type ..................................................................................................................................... 9Visitors with organized groups ............................................................................................................... 10United States visitors by state of residence – General visitors ............................................................. 12United States visitors by state of residence – Encampment visitors ..................................................... 13Visitors from adjacent states, by county of residence – General visitors .............................................. 14Visitors from adjacent states, by county of residence – Encampment visitors ...................................... 15International visitors by country of residence – General visitors ........................................................... 16International visitors by country of residence – Encampment visitors ................................................... 16Number of visits ..................................................................................................................................... 17Visitor age .............................................................................................................................................. 18Awareness of park management ........................................................................................................... 19
Trip/Visit Characteristics and Preferences ............................................................................................ 20Information sources prior to visit ............................................................................................................ 20Information sources for future visit ........................................................................................................ 24Park website .......................................................................................................................................... 25Park as destination ................................................................................................................................ 28Reasons for visiting the park ................................................................................................................. 29Adequacy of directional signs ................................................................................................................ 31Routes used to reach the park .............................................................................................................. 34Number of vehicles ................................................................................................................................ 34Length of visit ......................................................................................................................................... 35Planned length of visit versus actual visit in the park ............................................................................ 35Sites visited ............................................................................................................................................ 38Activities on past visits ........................................................................................................................... 39Activities on this visit .............................................................................................................................. 40Primary reason for this visit ................................................................................................................... 41Ranger-led talks/programs .................................................................................................................... 42Topics learned this visit ......................................................................................................................... 44Improved level of understanding ........................................................................................................... 45Topics to learn on a future visit .............................................................................................................. 47Exhibits viewed ...................................................................................................................................... 49Interest in exhibit objects ....................................................................................................................... 49Length of exhibit text .............................................................................................................................. 50Hands-on exhibits .................................................................................................................................. 50Electronic exhibits .................................................................................................................................. 51

Ninety Six National Historic Site – VSP Visitor Study April 10 - June 13, 2010
iv
CONTENTS (continued)
Ratings of Services, Facilities, Attributes, and Resources .................................................................. 52Visitor services and facilities used ......................................................................................................... 52Importance ratings of visitor services and facilities ............................................................................... 53Quality ratings of visitor services and facilities ...................................................................................... 58Mean scores of importance and quality ratings for visitor services and facilities – General visitors .............................................................................................................................. 63Mean scores of importance and quality ratings for visitor services and facilities – Encampment visitors ..................................................................................................................... 64Quality of personal interaction with a park ranger ................................................................................. 65Importance of protecting park resources and attributes ........................................................................ 67
Preferences for Future Visit ..................................................................................................................... 69Visit in future .......................................................................................................................................... 69Preferred methods to learn about the park ............................................................................................ 70Ranger-led program preferences .......................................................................................................... 71Bookstore sales item preferences ......................................................................................................... 73Park trails ............................................................................................................................................... 77
Overall Quality ........................................................................................................................................... 78Visitor Comments ..................................................................................................................................... 79
National Park Service anniversary events ............................................................................................. 79What visitors liked most ......................................................................................................................... 83What visitors liked least ......................................................................................................................... 86Planning for the future ........................................................................................................................... 88Additional comments ............................................................................................................................. 91
APPENDIX 1: THE QUESTIONNAIRE ........................................................................................................... 93APPENDIX 2: ADDITIONAL ANALYSIS ........................................................................................................ 95APPENDIX 3: DECISION RULES FOR CHECKING NON-RESPONSE BIAS .............................................. 96
References ................................................................................................................................................. 97APPENDIX 4: VISITOR SERVICES PROJECT PUBLICATIONS .................................................................. 98

Ninety Six National Historic Site – VSP Visitor Study April 10 - June 13, 2010
v
Executive Summary • This report describes the results of a visitor study at Ninety Six National Historic Site (NHS) during April
10 - June 13, 2010, which included general visitors and the annual encampment special event (also known as Lifeways of the Cherokee Indians and Colonial Settlers). A total of 347 questionnaires were distributed to general visitor groups. Of those, 237 questionnaires were returned resulting in a 68.3% response rate. Another 206 questionnaires were distributed to encampment visitor groups. Of those, 143 were returned resulting in a 69.4% response rate. The overall response rate was 68.7%.
• This report profiles a systematic random sample of Ninety Six NHS visitors. Most results are presented in
graphs and frequency tables. • Fifty-three percent of general visitor groups and 38% of encampment visitor groups were in groups of two.
Sixty-two percent of general visitor groups and 65% of encampment visitor groups were in family groups. • General U.S. visitors were from 29 states. Encampment U.S. visitors were from 14 states. The highest
proportion of visitors was from South Carolina (57% general, 89% encampment). General international visitors were from two countries. There were no international encampment visitors.
• Seventy-four percent of general visitors and 42% of encampment visitors were visiting the park for the first
time. • Forty-four percent of general visitors were ages 51-70 years, 12% were ages 15 years or younger, and 12%
were ages 71 or older. Twenty-nine percent of encampment visitors were ages 51-70 years, 33% were 15 years or younger, and 6% were 71 or older.
• Most general visitor groups (88%) and all encampment visitor groups obtained information about the park
prior to their visit. Prior to this visit, both general visitor groups (37%) and encampment visitor groups (50%) most often obtained information about the park through friends/relatives/word of mouth. Most general visitor groups (94%) and most encampment visitor groups (93%) received the information they needed.
• For 44% of general visitor groups and 79% of encampment visitor groups, Ninety Six NHS was the primary
destination. Sixty percent of general visitor groups visited the park to the learn Revolutionary War history. Seventy-four percent of encampment visitor groups visited the park to attend a program or event.
• The average length of visit for general visitor groups was 2.2 hours and the average for encampment visitor
groups was 2.8 hours. • The most common park site general visitor groups visited was the visitor center (82%), and the most
common park site encampment visitor groups visited was the visitor center (75%). • The most common activities general visitor groups participated in were learning history (75%) and
walking/hiking (69%). The most common activities encampment visitor groups participated in were attending special events (86%) and learning history (73%).
• Most general visitor groups (96%) and most encampment visitor groups (94%) rated the overall quality of
facilities, services, and recreational opportunities at Ninety Six NHS as “very good” or “good.” No visitor groups rated the overall quality as “very poor” or “poor.”
For more information about the Visitor Services Project, please contact the Park Studies Unit at the University of Idaho at (208) 885-7863 or the following website http://www.psu.uidaho.edu..

Ninety Six National Historic Site – VSP Visitor Study April 10 - June 13, 2010
vi
Acknowledgements We thank Nancy Holmes for overseeing the fieldwork, the staff and volunteers of Ninety Six National Historic Site for assisting with the survey, and David Vollmer and Matthew Strawn for data processing.
About the Authors Ariel Blotkamp and Nancy Holmes are Research Assistants with the Visitor Services Project. Dr. Steven Hollenhorst is the Director of the Park Studies Unit, Department of Conservation Social Sciences, University of Idaho.

Ninety Six National Historic Site–VSP Visitor Study Report 226 April 10 - June 13, 2010
1
Introduction
This report describes the results of a visitor study at Ninety Six National Historic Site (NHS) in Ninety Six, South Carolina, conducted April 10 - June 13, 2010 by the National Park Service (NPS) Visitor Services Project (VSP), part of the Park Studies Unit (PSU) at the University of Idaho.
The National Park Service website for Ninety Six NHS describes it, “Here settlers struggled against the harsh backcountry to survive, Cherokee Indians hunted and fought to keep their land, two towns and a trading post were formed and abandoned to the elements, and two Revolutionary War battles that claimed over 100 lives took place” (www.nps.gov/nisi, retrieved August, 2010).
Organization of the Report The report is organized into three sections. Section 1: Methods. This section discusses the procedures, limitations, and special conditions that may affect the study results. Section 2: Results. This section provides summary information for each question in the questionnaire. The presentation of the results of this study does not follow the order of questions in the questionnaire. Section 3: Appendices Appendix 1: The Questionnaire. A copy of the questionnaire distributed to visitor groups.
Appendix 2: Additional Analysis. A list of sample questions for cross-references and cross- comparisons. Comparisons can be analyzed within park or between parks. Results of additional analyses are not included in this report.
Appendix 3: Decision rules for checking non-response bias. An explanation of how the non-response bias was determined.
Appendix 4: Visitor Services Project Publications. A complete list of publications by the VSP. Copies of these reports can be obtained by visiting the website: www.psu.uidaho.edu/vsp/reports.htm or by contacting the VSP office at (208) 885-7863. Visitor Comments Appendix: A separate appendix provides visitor responses to open-ended questions. It is bound separately from this report due to its size.

Ninety Six National Historic Site–VSP Visitor Study Report 226 April 10 - June 13, 2010
2
Presentation of the Results
Results are represented in the form of graphs (see example below), scatter plots, pie charts, tables, or text.
SAMPLE
1. The figure title describes the graph's information.
2. Listed above the graph, the “N” shows the number of individuals or visitor groups responding to the question. If “N” is less than 30, “CAUTION!” is shown on the graph to indicate the results may be unreliable.
* appears when total percentages do not equal 100 due to rounding.
**appears when total percentages do not equal 100 because visitors could select more than one answer choice.
3. Vertical information describes the response categories.
4. Horizontal information shows the number or proportions of responses in each category.
5. In most graphs, percentages provide additional information.
Figure 14. Number of visits to the park in past 12 months 1
2
3
4
5

Ninety Six National Historic Site–VSP Visitor Study Report 226 April 10 - June 13, 2010
3
Methods
Survey Design
Sample size and sampling plan All VSP questionnaires follow design principles outlined in Don A. Dillman's book Mail and Internet Surveys: The Tailored Design Method (2007). Using this methodology, the sample size was calculated based on the park visitation statistics of previous years.
Brief interviews were conducted with a systematic, random sample of visitor groups that arrived at selected locations in Ninety Six NHS during April 10 - June 13, 2010. Visitors were surveyed between the hours of 7 a.m. and 5 p.m. Table 1 shows the two locations, number of questionnaires distributed at each location, and the response rate for each location. During this survey, 574 visitor groups were contacted and 553 of these groups (96%) accepted questionnaires (average acceptance rate for 211 VSP visitor studies conducted from 1988 through 2009 is 91.3%). A total of 347 questionnaires were distributed to general visitor groups. Of those, 237 questionnaires were returned resulting in a 68.3% response rate. Another 206 questionnaires were distributed to encampment visitor groups. Of those, 143 were returned resulting in a 69.4% response rate. The overall response rate for this study was 68.7%. The average response rate for the 211 VSP visitor studies is 73.5%.
Table 1. Questionnaire distribution, spring 2010 (N1=number of questionnaires distributed; N2=number of questionnaires returned.)
Distributed Returned
Sampling site Dates N1 % N2 %
Visitor center – general visitors April 12 – June 13 282 51 216 57 Star Fort Reservoir – general visitors April 12-17 67 12 21 6 Encampment April 10-11 204 37 143 38
Total 553 100 380 101*
*Percentage does not equal 100 due to rounding.

Ninety Six National Historic Site–VSP Visitor Study Report 226 April 10 - June 13, 2010
4
Questionnaire design The Ninety Six NHS questionnaire was developed at a workshop held with park staff to design and prioritize the questions. Some of the questions were comparable with VSP studies conducted at other parks while others were customized for Ninety Six NHS. Many questions asked visitors to choose answers from a list of responses, often with an open-ended option, while others were completely open-ended. No pilot study was conducted to test the Ninety Six NHS questionnaire. However, all questions followed Office of Management and Budget (OMB) guidelines and/or were used in previous surveys, thus the clarity and consistency of the survey instrument have been tested and supported. Survey procedure Visitor groups were greeted, briefly introduced to the purpose of the study, and asked to participate. If visitors agreed, they were asked which member (at least 16 years old) had the next birthday. The individual with the next birthday was selected to complete the questionnaire for the group. An interview, lasting approximately two minutes, was conducted with that person to determine group size, group type, and the age of the member completing the questionnaire. These individuals were asked for their names, addresses, and telephone numbers or email addresses in order to mail them a reminder/thank you postcard and follow-ups. Visitors were asked to complete the survey after their visit, and return the questionnaire by mail. The questionnaires were pre-addressed and affixed with a U.S. first-class postage stamp. Two weeks following the survey, a reminder/thank you postcard was mailed to all participants who provided a valid mailing address (see Table 2). Replacement questionnaires were mailed to participants who had not returned their questionnaires four weeks after the survey. Seven weeks after the survey, a second round of replacement questionnaires was mailed to visitors who had not returned their questionnaires. In order to distribute all 553 questionnaires, the survey period was extended. This resulted in multiple rounds of follow-up mailings.

Ninety Six National Historic Site–VSP Visitor Study Report 226 April 10 - June 13, 2010
5
Table 2. Follow-up mailing distribution
Round 1 mailing Date U.S. International Total Postcards May 3, 2010 369 1 370 1st Replacement May 17, 2010 188 1 189 2nd Replacement June 7, 2010 156 0 156 Round 2 mailing Date U.S. International Total Postcards May 17, 2010 45 0 45 1st Replacement June 1, 2010 16 0 16 2nd Replacement June 21, 2010 9 0 9 Round 3 mailing Date U.S. International Total Postcards June 1, 2010 54 2 56 1st Replacement June 15, 2010 23 0 23 2nd Replacement July 6, 2010 18 0 18 Round 4 mailing Date U.S. International Total Postcards June 15, 2010 44 0 44 1st Replacement June 29, 2010 25 0 25 2nd Replacement July 20, 2010 16 0 16 Round 5 mailing Date U.S. International Total Postcards June 28, 2010 19 0 19 1st Replacement July 13, 2010 11 0 11 2nd Replacement August 2, 2010 11 0 11
Data analysis
Returned questionnaires were coded and the visitor responses were processed using custom and standard statistical software applications—Statistical Analysis Software® (SAS), and a custom designed FileMaker Pro® application. Descriptive statistics and cross-tabulations were calculated for the coded data and responses to open-ended questions were categorized and summarized. Double-key data entry validation was performed on numeric and text entry variables and the remaining checkbox (bubble) variables were read by optical mark recognition (OMR) software.

Ninety Six National Historic Site–VSP Visitor Study Report 226 April 10 - June 13, 2010
6
Limitations Like all surveys, this study has limitations that should be considered when interpreting the results.
1. This was a self-administered survey. Respondents completed the questionnaire after the visit, which may have resulted in poor recall. Thus, it is not possible to know whether visitor responses reflected actual behavior.
2. The data reflect visitor use patterns to the selected sites during the study period of April 10 - June 13, 2010. The results present a ‘snapshot-in-time’ and do not necessarily apply to visitors during other times of the year.
3. Caution is advised when interpreting any data with a sample size of less than 30, as the results may be unreliable. Whenever the sample size is less than 30, the word "CAUTION!" is included in the graph, figure, table, or text.
4. Occasionally, there may be inconsistencies in the results. Inconsistencies arise from missing data or incorrect answers (due to misunderstood directions, carelessness, or poor recall of information). Therefore, refer to both the percentage and N (number of individuals or visitor groups) when interpreting the results.
Special conditions The weather during the survey period was generally sunny and warm, with occasional breezy periods. Temperatures varied from the upper 60s to the lower 80s. During the first weekend of the survey, the park held an annual encampment special event (also known as Lifeways of the Cherokee Indians and Colonial Settlers), which drew a large number of visitors.

Ninety Six National Historic Site–VSP Visitor Study Report 226 April 10 - June 13, 2010
7
Checking non-response bias
Three variables were used to check non-response bias: respondents’ age, group size, and overall quality ratings. There was a significant difference in respondents’ age vs. nonrespondents’ age. Participants at the higher age range seemed to be more responsive to the survey. However, there were no significant differences in other variables (see Tables 3 and 4). See Appendix 3 for more details of the non-response bias checking procedures.
Table 3. Comparison of respondents and nonrespondents
Variable Respondents Nonrespondents p-value (t-test)
Encampment event
Age (years) 52.16 (N=143) 45.73 (N=60) 0.005 Group size 3.49 (N=141) 3.30 (N=61) 0.580
General Age (years) 53.97 (N=236) 46.65 (N=110) <0.001 Group size 2.44 (N=232) 2.19 (N=108) 0.097
Table 4. Comparison of respondents at different mailing waves (average overall quality rating)
Overall quality rating Before
reminders After reminders p-value (t-test) Encampment event 4.56 (N=91) 4.68 (N=50) 0.256 General 4.64 (N=160) 4.65 (N=75) 0.839

Ninety Six National Historic Site–VSP Visitor Study Report 226 April 10 - June 13, 2010
8

Ninety Six National Historic Site–VSP Visitor Study Report 226 April 10 - June 13, 2010
_______________ *total percentages do not equal 100 due to rounding **total percentages do not equal 100 because visitors could select more than one answer
9
Results
Group and Visitor Characteristics
Visitor group size Question 23b
On this visit, how many people were in your personal group, including yourself?
Results
• As shown in Figure 1, the most common visitor group size was: General
53% groups of two
Encampment 38% groups of two
0 20 40 60 80 100Proportion of respondents
1
2
3
4
5 or more
17%
53%
13%
11%
7%
11%
38%
15%
13%
23%
Encampment: N=141 visitor groupsGeneral: N=232 visitor groups*
Groupsize
Figure 1. Visitor group size
Visitor group type Question 23a
On this visit, what kind of personal group (not guided tour/school/other organized group) were you with?
Results
• As shown in Figure 2, the most common visitor group type was: General
62% family Encampment
65% family
• No “other” group types were specified.
0 20 40 60 80 100Proportion of respondents
Other
Friends
Alone
Family andfriends
Family
2%
13%
17%
6%
62%
0%
7%
12%
15%
65%
Encampment: N=142 visitor groups*General: N=234 visitor groups
Grouptype
Figure 2. Visitor group type

Ninety Six National Historic Site–VSP Visitor Study Report 226 April 10 - June 13, 2010
_______________ *total percentages do not equal 100 due to rounding **total percentages do not equal 100 because visitors could select more than one answer
10
Visitors with organized groups Question 22a
On this visit, were you and your personal group part of a commercial guided tour group?
Results
• As shown in Figure 3, the proportion of visitor groups with a commercial guided tour group were: 1% General 1% Encampment
0 20 40 60 80 100Proportion of respondents
No
Yes
99%
1%
99%
1%
Encampment: N=122 visitor groupsGeneral: N=198 visitor groups
Withcommercialguided tour?
Figure 3. Visitors with a commercial guided tour group
Question 22b
On this visit, were you and your personal group part of a school/ educational group?
Results
• As shown in Figure 4, the proportion of visitor groups with a school/educational group were: 4% General 5% Encampment
0 20 40 60 80 100Proportion of respondents
No
Yes
96%
4%
95%
5%
Encampment: N=124 visitor groupsGeneral: N=201 visitor groups
With school/educationalgroup?
Figure 4. Visitors with a school/educational group
Question 22c
On this visit, were you and your personal group part of an “other” organized group (scouts, work, church, senior center)?
Results
• As shown in Figure 5, the proportion of visitor groups with an “other” organized group (scouts, work, church, senior center) were: 7% General 8% Encampment
0 20 40 60 80 100Proportion of respondents
No
Yes
93%
7%
92%
8%
Encampment: N=123 visitor groupsGeneral: N=203 visitor groups
With ''other''organizedgroup?
Figure 5. Visitors with an “other” organized group

Ninety Six National Historic Site–VSP Visitor Study Report 226 April 10 - June 13, 2010
_______________ *total percentages do not equal 100 due to rounding **total percentages do not equal 100 because visitors could select more than one answer
11
Question 22d
If you were with one of these organized groups, how many people, including yourself, were in this group?
Results - Interpret with CAUTION!
• Not enough visitor groups responded to this question to provide reliable results (see Figure 6).
0 20 40 60 80 100Proportion of respondents
Up to 7
8-14
15 or more
27%
33%
40%
29%
57%
14%
Encampment: N=7 visitor groupsGeneral: N=15 visitor groups
Numberof people
CAUTION!
Figure 6. Organized group size

Ninety Six National Historic Site–VSP Visitor Study Report 226 April 10 - June 13, 2010
_______________ *total percentages do not equal 100 due to rounding **total percentages do not equal 100 because visitors could select more than one answer
12
United States visitors by state of residence – General visitors Question 24b
For you and your personal group on this visit, what is your state of residence?
Note: Response was limited to
seven members from each visitor group.
Results
• U.S. visitors were from 29 states and comprised 99% of total visitation to the park during the survey period.
• 57% came from South Carolina (see Table 5a and Figure 7).
• 7% came from North
Carolina.
• Smaller proportions came from 27 other states.
Table 5a. United States visitors by state of residence* (General visitors)
State Number
of visitors
Percent of U.S. visitors
N=523 individuals
Percent of total visitors
N=527 individuals
South Carolina 297 57 56 North Carolina 36 7 7 Florida 23 4 4 Georgia 18 3 3 Pennsylvania 16 3 3 Tennessee 13 2 2 Texas 12 2 2 Illinois 11 2 2 New York 11 2 2 Virginia 11 2 2 Ohio 10 2 2 Maryland 8 2 2 17 other states 57 11 11
Figure 7. Proportions of United States visitors by state of residence - General visitors

Ninety Six National Historic Site–VSP Visitor Study Report 226 April 10 - June 13, 2010
_______________ *total percentages do not equal 100 due to rounding **total percentages do not equal 100 because visitors could select more than one answer
13
United States visitors by state of residence – Encampment visitors Question 24b
For you and your personal group on this visit, what is your state of residence?
Note: Response was limited to
seven members from each visitor group.
Results
• U.S. visitors were from 14 states and comprised 100% of total visitation to the park during the survey period.
• 89% came from South Carolina (see Table 5b and Figure 8).
• 3% came from Georgia
and 2% were from Florida.
• Smaller proportions came from 11 other states.
Table 5b: United States visitors by state of residence* (Encampment visitors)
State
Number of
visitors
Percent of U.S. visitors
N=419 individuals
Percent of total
visitors N=419
individualsSouth Carolina 371 89 89 Georgia 12 3 3 Florida 7 2 2 Wisconsin 6 1 1 North Carolina 5 1 1 Michigan 4 1 1 8 other states 14 3 3
Figure 8. Proportions of United States visitors by state of residence - Encampment visitors

Ninety Six National Historic Site–VSP Visitor Study Report 226 April 10 - June 13, 2010
_______________ *total percentages do not equal 100 due to rounding **total percentages do not equal 100 because visitors could select more than one answer
14
Visitors from S. Carolina and adjacent states, by county of reseidence – General visitors
• Visitors from adjacent states were from 32 counties and comprised 61% of the U.S. general visitation to the park during the survey period.
• 31% came from Greenwood County, SC (see Table 6a and Figure 9).
• 9% came from Greenville County, SC.
• 9% came from Spartanburg County, SC.
• Smaller proportions came from 29 other counties.
Table 6a. Visitors from adjacent states by county of residence* (General visitors)
County, State
Number of adjacent state visitors
N=318 individuals
Percent Greenwood, SC 97 31 Greenville, SC 29 9 Spartanburg, SC 29 9 Aiken, SC 17 5 Laurens, SC 16 5 Pickens, SC 13 4 Anderson, SC 11 3 Lexington, SC 10 3 Beaufort, SC 9 3 Charleston, SC 9 3 Abbeville, SC 8 3 Richland, SC 8 3 Buncombe, NC 7 2 Berkeley, SC 6 2 Horry, SC 6 2 McCormick, SC 6 2 Columbus, NC 5 2 Newberry, SC 5 2 14 other counties 27 8
N= 318 individuals Number of visitors per county
Figure 9. Number of visitors by county of residence - General visitors

Ninety Six National Historic Site–VSP Visitor Study Report 226 April 10 - June 13, 2010
_______________ *total percentages do not equal 100 due to rounding **total percentages do not equal 100 because visitors could select more than one answer
15
Visitors from S. Carolina and adjacent states, by county of residence – Encampment visitors
• Visitors from adjacent states were from 27 counties and comprised 93% of the encampment U.S. visitation to the park during the survey period.
• 54% came from Greenwood County, SC (see Table 6b and Figure 10).
• 9% came from Greenville, SC.
• 9% came from Newberry County, SC.
• Smaller proportions came from 24 other counties.
Table 6b. Visitors from adjacent states by county of residence* (Encampment visitors)
County, State
Number of adjacent state visitors
N=388 individuals
PercentGreenwood, SC 211 54 Greenville, SC 36 9 Newberry, SC 36 9 Aiken, SC 16 4 Abbeville, SC 9 2 Richland, SC 9 2 Lexington, SC 8 2 Saluda, SC 8 2 Spartanburg, SC 8 2 Anderson, SC 5 1 Laurens, SC 5 1 Richmond, GA 5 1 Berkeley, SC 4 1 McCormick, SC 4 1 Edgefield, SC 3 1 Kershaw, SC 3 1 Mecklenburg, NC 3 1 10 other counties 15 4
N=388 individuals Number of visitors per county
Figure 10. Number of visitors by county of residence - Encampment visitors

Ninety Six National Historic Site–VSP Visitor Study Report 226 April 10 - June 13, 2010
_______________ *total percentages do not equal 100 due to rounding **total percentages do not equal 100 because visitors could select more than one answer
16
International visitors by country of residence – General visitors Question 24b
For you and your personal group on this visit, what is your country of residence?
Note: Response was limited
to seven members from each visitor group.
Results – Interpret with CAUTION!
• Not enough visitor groups responded to this question to provide reliable results (see Table 7).
Table 7. International visitors by country of residence* (General visitors) - CAUTION!
Country
Number of
visitors
Percent of international visitors
N=4 individuals
Percent of
total visitors N=527
individualsUnited Kingdom 3 75 <1
Canada 1 25 <1
International visitors by country of residence – Encampment visitors Question 24b
For you and your personal group on this visit, what is your country of residence?
Note: Response was limited to
seven members from each visitor group.
Results
• No encampment visitors were international visitors.

Ninety Six National Historic Site–VSP Visitor Study Report 226 April 10 - June 13, 2010
_______________ *total percentages do not equal 100 due to rounding **total percentages do not equal 100 because visitors could select more than one answer
17
Number of visits Question 24c
For you and your personal group on this visit, how often do you visit Ninety Six NHS (including this visit)?
Note: Response was limited to seven
members from each visitor group. Results
• As shown in Figure 11, the proportion of first time visitors was: 75% General 42% Encampment
• The proportion of visitors who visit the park several times a year was: 18% General 49% Encampment
0 20 40 60 80 100Proportion of respondents
First visit
Daily
Several timesa month
Several timesa year
75%
1%
6%
18%
42%
2%
7%
49%
Encampment: N=402 individualsGeneral: N=483 individuals
Frequencyof visits
Figure 11. Number of visits to park in lifetime

Ninety Six National Historic Site–VSP Visitor Study Report 226 April 10 - June 13, 2010
_______________ *total percentages do not equal 100 due to rounding **total percentages do not equal 100 because visitors could select more than one answer
18
Visitor age Question 24a
For you and your personal group on this visit, what is your current age?
Note: Response was limited to seven
members from each visitor group.
Results • Visitor ages ranged from:
General: 1- 92 years Encampment: 1- 84 years
• As shown in Figure 12, visitor age
groups included: General
44% 51 - 70 years 12% 15 and younger 12% 71 and older
Encampment
29% 51 - 70 years 33% 15 and younger 6% 71 and older
0 10 20 30 40Proportion of respondents
10 or younger
11-15
16-20
21-25
26-30
31-35
36-40
41-45
46-50
51-55
56-60
61-65
66-70
71-75
76 or older
8%
4%
1%
2%
3%
4%
7%
7%
8%
9%
12%
12%
11%
6%
6%
26%
7%
2%
3%
3%
3%
8%
7%
5%
7%
7%
8%
7%
4%
2%
Encampment: N=434 individuals*General: N=530 individuals
Age group(years)
Figure 12. Visitor age

Ninety Six National Historic Site–VSP Visitor Study Report 226 April 10 - June 13, 2010
_______________ *total percentages do not equal 100 due to rounding **total percentages do not equal 100 because visitors could select more than one answer
19
Awareness of park management
Question 2a Prior to this visit, were you and your personal group aware that Ninety Six NHS is a Revolutionary War battle site?
Results
• As shown in Figure 13, the proportion of visitor groups that were aware that Ninety Six NHS is a Revolutionary War battle site was: 78% General 90% Encampment
0 20 40 60 80 100Proportion of respondents
No
Yes
22%
78%
10%
90%
Encampment: N=143 visitor groupsGeneral: N=232 visitor groups
Aware?
Figure 13. Visitor groups that were aware that Ninety Six NHS is a Revolutionary War battle site
Question 2b
Prior to this visit, were you and your personal group aware that Ninety Six NHS is managed by the National Park Service?
Results
• As shown in Figure 14, the proportion of visitor groups that were aware that Ninety Six NHS is managed by the National Park Service was: 68% General 80% Encampment
0 20 40 60 80 100Proportion of respondents
No
Yes
32%
68%
20%
80%
Encampment: N=143 visitor groupsGeneral: N=234 visitor groups
Aware?
Figure 14. Visitor groups that were aware that Ninety Six NHS is managed by the National Park Service

Ninety Six National Historic Site–VSP Visitor Study Report 226 April 10 - June 13, 2010
_______________ *total percentages do not equal 100 due to rounding **total percentages do not equal 100 because visitors could select more than one answer
20
Trip/Visit Characteristics and Preferences Information sources prior to visit Question 1a
Prior to your visit, how did you and your personal group obtain information about Ninety Six NHS?
Results
• As shown in Figure 15, the proportion of visitor groups that obtained information about Ninety Six NHS prior to their visit was: 88% General 100% Encampment
• As shown in Figure 16,
among those visitor groups that obtained information about Ninety Six NHS prior to their visit, the most common sources were: General
37% Friends/relatives/word of mouth 34% Park website 25% Previous visits
Encampment 50% Friends/relatives/word of mouth 39% Previous visits 31% Newspaper/magazine
articles
0 20 40 60 80 100Proportion of respondents
No
Yes
12%
88%
0%
100%
Encampment: N=133 visitor groupsGeneral: N=233 visitor groups
Obtainedinformation?
Figure 15. Visitor groups that obtained information about Ninety Six NHS prior to visit
0 20 40 60Proportion of respondents
Other
Social media
Local businesses
Television/radioprograms/DVDs
School/class program
Chamber of commerce/visitors bureau/state
welcome center
Travel guides/tour books
Inquiry to park viaphone, mail, email
Other National ParkService sites/units
Other websites
Maps/brochures
Ninety SixNHS website
Newspaper/magazine articles
Previous visits
Friends/relatives/word of mouth
13%
1%
4%
5%
2%
7%
11%
5%
13%
9%
23%
34%
8%
25%
37%
7%
1%
2%
4%
5%
5%
5%
8%
9%
10%
16%
23%
32%
39%
50%
Encampment: N=133 visitor groups**General: N=193 visitor groups**
Source
Figure 16. Sources of information used by visitor groups prior to visit

Ninety Six National Historic Site–VSP Visitor Study Report 226 April 10 - June 13, 2010
_______________ *total percentages do not equal 100 due to rounding **total percentages do not equal 100 because visitors could select more than one answer
21
• “Other” sources used to obtain
information about the park prior to their visit were: General (13%)
Book Boy Scout Blue Ridge Council Driving by Former employee Genealogy research Google Maps History books Moved to the area National Park Passport Book National Park Regional
Guidebook Native Plant Society Revolutionary War research Road signs SC DNR Fishing
Encampment (7%) Camdam Flyer in library Geocaching Live locally Local library Reenactor Road signs

Ninety Six National Historic Site–VSP Visitor Study Report 226 April 10 - June 13, 2010
_______________ *total percentages do not equal 100 due to rounding **total percentages do not equal 100 because visitors could select more than one answer
22
Question 1c
From the sources used prior to your visit, did you and your personal group receive the type of information about the park that you needed?
Results
• As shown in Figure 17, the proportion of visitor groups that received needed information prior to their visit was:
94% General 93% Encampment
0 20 40 60 80 100Proportion of respondents
No
Yes
6%
94%
7%
93%
Encampment: N=124 visitor groupsGeneral: N=178 visitor groups
Receivedneededinformation?
Figure 17. Visitor groups that received needed information prior to their visit
Question 1d
If NO, what type of park information did you and your personal group need that was not available? (open-ended)
Results – Interpret with CAUTION! • 6 general visitor groups listed
information they needed but was not available (see Table 8a).
• 8 encampment visitor groups listed information they needed but was not available (see Table 8b).
Table 8a. Needed information – General visitors (N=6 comments) CAUTION!
Type of information
Number of times mentioned
Could not find much historical information 1 Directional signs to the park in Ninety Six 1Directions to the park from major South
Carolina cities 1
Information about events 1Need the park's street address or GPS
coordinates 1
Hours of operation 1

Ninety Six National Historic Site–VSP Visitor Study Report 226 April 10 - June 13, 2010
_______________ *total percentages do not equal 100 due to rounding **total percentages do not equal 100 because visitors could select more than one answer
23
Table 8b. Needed information – Encampment visitors (N=9 comments; one visitor group made more than one comment.) CAUTION!
Type of information
Number of times mentioned
Better directions 1 Better map on the website 1Had no idea about it until a friend told me 1 How to sign up for future mailing 1 Map of the Greenwood area 1Only knew about reenactors 1 Time schedules 1 Times of events on the website 1Types of demonstrations 1

Ninety Six National Historic Site–VSP Visitor Study Report 226 April 10 - June 13, 2010
_______________ *total percentages do not equal 100 due to rounding **total percentages do not equal 100 because visitors could select more than one answer
24
Information sources for future visit Question 1b
If you were to visit Ninety Six NHS in the future, how would you and your personal group prefer to obtain information about the park?
Results
• As shown in Figure 18, the most common sources of information that visitor groups preferred for a future visit were: General
62% Park website 22% Maps/brochures
Encampment
49% Park website 43% Newspaper/magazine
articles
• “Other” sources were: 2% General
National Parks Passport book Reenacting Revolutionary War pension application
5% Encampment
Live locally
0 20 40 60 80Proportion of respondents
Other
School/class program
Social media
Local businesses
Chamber of commerce/visitors bureau/state
welcome center
Other websites
Other National ParkService sites/units
Travel guides/tour books
Television/radioprograms/DVDs
Inquiry to park viaphone, mail, email
Maps/brochures
Previous visits
Friends/relatives/word of mouth
Newspaper/magazine articles
Ninety SixNHS website
2%
1%
1%
6%
11%
15%
16%
14%
5%
19%
22%
18%
14%
14%
62%
5%
4%
5%
6%
7%
9%
10%
10%
12%
15%
18%
20%
31%
43%
49%
Encampment: N=98 visitor groups**General: N=159 visitor groups**
Source
Figure 18. Sources of information to use for a future visit

Ninety Six National Historic Site–VSP Visitor Study Report 226 April 10 - June 13, 2010
_______________ *total percentages do not equal 100 due to rounding **total percentages do not equal 100 because visitors could select more than one answer
25
Park website Question 9a
Did you and your personal group use the park website (http://www.nps.gov/nisi) to plan your trip to Ninety Six NHS?
Results
• As shown in Figure 19, the proportion of visitor groups that used the park website was: 33% General 33% Encampment
0 20 40 60 80 100Proportion of respondents
No
Yes
67%
33%
67%
33%
Encampment: N=141 visitor groupsGeneral: N=231 visitor groups
Usedwebsite?
Figure 19. Visitor groups that used the park website
Question 9b
Overall, how would you rate the importance of the information provided on the park website?
Results • As shown in Figure 20, the
proportion of visitor groups that rated the information on the park website as “extremely important” or “very important” in planning their visit was: 70% General 66% Encampment
• The proportion that rated the information on the park website as “moderately important” was: 22% General 21% Encampment
0 20 40 60 80 100Proportion of respondents
Notimportant
Somewhatimportant
Moderatelyimportant
Veryimportant
Extremelyimportant
4%
4%
22%
48%
22%
5%
8%
21%
55%
11%
Encampment: N=38 visitor groupsGeneral: N=69 visitor groups
Rating
Figure 20. Importance of park website

Ninety Six National Historic Site–VSP Visitor Study Report 226 April 10 - June 13, 2010
_______________ *total percentages do not equal 100 due to rounding **total percentages do not equal 100 because visitors could select more than one answer
26
Question 9c
Overall, how would you rate the quality of information provided on the park website?
Results • As shown in Figure 21, the
proportion of visitor groups that rated the quality of the information provided on the park website as “very good” or “good” was: 84% General 71% Encampment
• The proportion that rated the quality of the information on the park website as “average” was: 16% General 29% Encampment
0 20 40 60 80 100Proportion of respondents
Very poor
Poor
Average
Good
Very good
0%
0%
16%
53%
31%
0%
0%
29%
38%
33%
Encampment: N=45 visitor groupsGeneral: N=68 visitor groups
Rating
Figure 21. Quality of park website
Question 9d
Did you find the information that you needed on the park website?
Results • As shown in Figure 22, the
proportion of visitor groups that received needed information on the park website was: 84% General 73% Encampment
0 20 40 60 80 100Proportion of respondents
No
Yes
16%
84%
27%
73%
Encampment: N=41 visitor groupsGeneral: N=62 visitor groups
Foundneededinformation?
Figure 22. Visitor groups that found needed information on the park website

Ninety Six National Historic Site–VSP Visitor Study Report 226 April 10 - June 13, 2010
_______________ *total percentages do not equal 100 due to rounding **total percentages do not equal 100 because visitors could select more than one answer
27
Question 9e
If NO, what type of information did you and your personal group need that was not available on the park website? (open-ended)
Results – Interpret with CAUTION! • 5 general visitor groups listed information they
needed but was not available on the park website (see Table 9a).
• 8 encampment visitor groups listed information
they needed but was not available on the park website (see Table 9b).
Table 9a. Needed information – General visitors (N=5 comments) CAUTION!
Type of information
Number of times mentioned
History/curriculum for park itself 1 Include information useful to GPS:
coordinates and address 1
Need better directions 1 PDF of the paper brochure handed out at
the visitor center 1
Should have Junior Ranger books downloadable
1
Table 9b. Needed information – Encampment visitors (N=8 comments) CAUTION!
Type of information
Number of times mentioned
Schedule of events 2A link to Google Maps to show where park
is located 1
Better directions to the site coordinated with Google and Mapquest
1
Detailed information of activities 1 History of the area prior to the
Revolutionary War 1
Schedule of demonstrations 1 Time frame 1

Ninety Six National Historic Site–VSP Visitor Study Report 226 April 10 - June 13, 2010
_______________ *total percentages do not equal 100 due to rounding **total percentages do not equal 100 because visitors could select more than one answer
28
Park as destination
Question 6
How did your visit to Ninety Six NHS fit into your personal group’s travel plans?
Results
• As shown in Figure 23, the proportion of visitor groups for which Ninety Six NHS was the primary destination was: 44% General 79% Encampment
0 20 40 60 80 100Proportion of respondents
Ninety Six NHSwas not a planned
destination
Ninety Six NHSwas one of several
destinations
Ninety Six NHSwas the primary
destination
21%
35%
44%
9%
12%
79%
Encampment: N=141 visitor groupsGeneral: N=228 visitor groups
How visitfit intotravelplans
Figure 23. How visit to park fit into visitor groups’ travel plans

Ninety Six National Historic Site–VSP Visitor Study Report 226 April 10 - June 13, 2010
_______________ *total percentages do not equal 100 due to rounding **total percentages do not equal 100 because visitors could select more than one answer
29
Reasons for visiting the park Question 3
On this trip, what were the reasons that you and your personal group visited Ninety Six NHS?
Results • As shown in Figure 24, the most
common reasons for visiting Ninety Six NHS were: General
60% Learn Revolutionary War history
43% Participate in recreation Encampment
74% Attend a program or special event
59% Learn Revolutionary War history
0 20 40 60 80 100Proportion of respondents
Other
Saw a signon highway
Obtain stamp inNational Park Passport book
Participate in JuniorRanger program
Visit a National ParkService site
Show park torelatives/friends
Participate in recreation
Learn RevolutionaryWar history
Attend a programor event
15%
16%
14%
5%
24%
24%
43%
60%
7%
9%
1%
1%
3%
6%
20%
43%
59%
74%
Encampment: N=143 visitor groups**General: N=237 visitor groups**
Reason
Figure 24. Reasons for visiting the park

Ninety Six National Historic Site–VSP Visitor Study Report 226 April 10 - June 13, 2010
_______________ *total percentages do not equal 100 due to rounding **total percentages do not equal 100 because visitors could select more than one answer
30
• “Other” primary reasons for visiting
the park were: General (15%)
Brought grandkids to skate Buy metal soldiers at store Came to get a park pass Came with SC Native Plant Society Celebrate a birthday Cub Scout merit badge Display for program Enjoy nature Genealogy Natural history study Passing by on scooter Photography Picnic Research Research for possible future staff
ride Saw marking on SC road map SC National Heritage Corridor
recommended To relate experience to SAR camp To view new film Travel books and AAA auto book Try to imagine the historical events
which took place here Visit Star Fort Visitor center Wife found on map Wildflower walk
Encampment (9%) Boy Scout historic site Buy a book about Col. James Williams Educational and fun Engage chief ranger for a group
educational program Family regularly attends Revolutionary
War events Family told us Grew up in this area Live locally Look at old weapons and kvatts Out for a ride Research and photos to write history
book Revolutionary reenactors event Take pictures of grandson

Ninety Six National Historic Site–VSP Visitor Study Report 226 April 10 - June 13, 2010
_______________ *total percentages do not equal 100 due to rounding **total percentages do not equal 100 because visitors could select more than one answer
31
Adequacy of directional signs
Question 5 On this visit, were the signs directing you and your personal group to Ninety Six NHS adequate?
Results
• Figures 25 – 27 show the proportion of visitor groups that rated directional signs as adequate.
a. Interstate signs
34% General 16% Encampment
0 20 40 60 80 100Proportion of respondents
Did not use
No
Yes
62%
4%
34%
72%
12%
16%
Encampment: N=117 visitor groupsGeneral: N=198 visitor groups
Interstatesignsadequate?
Figure 25. Visitor groups’ opinions on adequacy of interstate signs
b. State highway signs
61% General 45% Encampment
0 20 40 60 80 100Proportion of respondents
Did not use
No
Yes
26%
13%
61%
44%
11%
45%
Encampment: N=126 visitor groupsGeneral: N=219 visitor groups
Highwaysignsadequate?
Figure 26. Visitor groups’ opinions on adequacy of state highway signs
c. Signs in local communities
67% General 64% Encampment
0 20 40 60 80 100Proportion of respondents
Did not use
No
Yes
20%
14%
67%
21%
15%
64%
Encampment: N=137 visitor groupsGeneral: N=220 visitor groups*
Communitysignsadequate?
Figure 27. Visitor groups’ opinions on adequacy of signs in the local communities

Ninety Six National Historic Site–VSP Visitor Study Report 226 April 10 - June 13, 2010
_______________ *total percentages do not equal 100 due to rounding **total percentages do not equal 100 because visitors could select more than one answer
32
Question 5d
If you answered NO for any of the above, please explain.
Results • 34 general visitor groups commented on
problems with directional signs (see Table 10a).
• 27 encampment visitor groups commented on problems with directional signs (see Table 10b).
Table 10a. Comments on directional signs – General visitors (N=48 comments; some visitor groups made more than one comment.)
Sign type
Comment
Number of times mentioned
Interstate Saw no signs for park on I-26 3 Hard to see 1 No signage for park 1
State highway Not enough signs 3 Saw no signs 3 Saw no signs until entrance 2 Saw one state road sign 2 Coming from Columbia on 178 would appreciate a
sign for the park 1
Did not see signs until SC 72/221 intersected 1 Hard to see 1 Not adequate 1 Saw no sign at Ninety-Six town intersection 1 Saw no signs even within 10 miles from North and
East 1
Saw no signs until Ninety Six 1 Signs only in community 1 There didn't seem to be signs from 96 on the 248 1 Would have been nice to have a sign on 25 N 1
Local No sign in Ninety Six 4 communities Saw no signs 4 Too few signs 3 Had to ask how to get to Ninety Six 2 Had to find route again - signs gone 1 Hard to see 1 Need a sign in downtown Ninety Six by the fountain 1 Not adequate 1 Not until the actual road 3 miles from site 1 Only saw the sign in one direction 1 Saw very small sign in Ninety Six 1 The sign wasn't brown, it was green 1 Too few signs to Star Fort from Ninety Six 1 We were nearby and had to lookup on a map 1

Ninety Six National Historic Site–VSP Visitor Study Report 226 April 10 - June 13, 2010
_______________ *total percentages do not equal 100 due to rounding **total percentages do not equal 100 because visitors could select more than one answer
33
Table 10b. Comments on directional signs – Encampment visitors (N=34 comments; some visitor groups made more than one comment.)
Sign type
Comment
Number of times mentioned
Interstate Saw no signs 4 Live in area 1 Roadwork/detour (took alternate route) 1 Saw no signs on I-26 South 1 Took wrong exit 1 Vague on direction to go 1
State highway Saw no signs 7 From Route 34, no sign on Route 248 1 None on State Highway 25 1 Signs Highway 248 from the north were few; route
hard to follow 1
Vague on direction to go 1
Local Saw no signs 3 communities No sign in Ninety Six 2 Came to the Start Fort Pond sign first and turned
there instead of the road to the fort 1
Didn't see sign on Louden Road 1 No sign indicating when to turn off Main Street, from
the west 1
Nothing in Greenwood or Ninety Six about special event this weekend
1
Only one at turn in 34 1 The sign was very late 1 There was only one 1 Vague on direction to go 1 We saw no signs except in Ninety Six 1

Ninety Six National Historic Site–VSP Visitor Study Report 226 April 10 - June 13, 2010
_______________ *total percentages do not equal 100 due to rounding **total percentages do not equal 100 because visitors could select more than one answer
34
Routes used to reach the park
Question 4
On this visit to Ninety Six NHS, which routes did you and your personal group use to reach the park?
Results
• As shown in Figure 28, the route most commonly used by visitor groups to reach Ninety Six NHS was: General
34% Highway 248 from the north
Encampment
34% Highway 248 from the north
• “Other” routes were:
General (6%)
Highway 34 from east Highway 34 from west
Encampment (6%) Highway 34 from east Highway 34 from west
0 10 20 30 40 50Proportion of respondents
Other routes
Paysinger Road
Harter Road
Louden Road
Highway 72from the east
Highway 246from the south
Highway 72from the west
Highway 246from the north
Highway 248from the south
Highway 248from the north
6%
0%
0%
1%
15%
8%
20%
17%
15%
34%
6%
0%
0%
4%
9%
10%
16%
16%
21%
34%
Encampment: N=126 visitor groups**General: N=197 visitor groups**
Route
Figure 28. Routes used by visitor groups to reach the park
Number of vehicles
Question 23c
On this visit, how many vehicles did you and your personal group use to arrive at the park?
Results • As shown in Figure 29, the
proportion of visitor groups that used one vehicle to arrive at the park was: 93% General 81% Encampment
0 20 40 60 80 100Proportion of respondents
0
1
2
3 or more
0%
93%
5%
2%
1%
81%
14%
5%
Encampment: N=139 visitor groups*General: N=220 visitor groups
Numberof vehicles
Figure 29. Number of vehicles used

Ninety Six National Historic Site–VSP Visitor Study Report 226 April 10 - June 13, 2010
_______________ *total percentages do not equal 100 due to rounding **total percentages do not equal 100 because visitors could select more than one answer
35
Length of visit
Question 8 On this visit, how much time in total did you and your personal group spend at Ninety Six NHS?
Results • As shown in Figure 30, the number
of hours spent visiting the park included: General
42% 2 hours 29% Up to 1 hour
Encampment 33% 2 hours 25% 3 hours
The average length of visit • The average length of visit for all
visitor groups was: General: 2.2 hours Encampment: 2.8 hours
0 20 40 60 80 100Proportion of respondents
Up to 1
2
3
4
5 or more
29%
42%
17%
7%
4%
11%
33%
25%
19%
12%
Encampment: N=140 visitor groupsGeneral: N=230 visitor groups*
Numberof hours
Figure 30. Number of hours spent visiting the park
Planned length of visit versus actual visit in the park Question 7
How did the amount of time you and your personal group spent at Ninety Six NHS compare with the time you had planned to stay there?
Results
• As shown in Figure 31, the proportion of visitor groups that did not have a planned amount of time were: 56% General 54% Encampment
0 20 40 60 80 100Proportion of respondents
Spent less timethan planned
Spent about thetime planned
Spent more timethan was planned
Did not have aplanned amount of time
2%
30%
12%
56%
1%
30%
15%
54%
Encampment: N=140 visitor groupsGeneral: N=231 visitor groups
Timespent
Figure 31. Time spent compared to time planned

Ninety Six National Historic Site–VSP Visitor Study Report 226 April 10 - June 13, 2010
_______________ *total percentages do not equal 100 due to rounding **total percentages do not equal 100 because visitors could select more than one answer
36
Question 7 If YES, why?
Results • 31 general visitor groups listed reasons the
length of their visit was different than planned (see Table 11a).
• 23 encampment visitor groups listed reasons the length of their visit was different than planned (see Table 11b).
Table 11a. Reasons for length of visit different than planned – General visitors (N=36 comments; some visitor groups made more than one comment.)
Comment Number of times
mentioned
Visit was longer than planned (N=33) Walked/hiked trails/battlefield 6Found it very interesting 5 Watched the video 4 More extensive then expected 2More to do than expected 2 Very pleasant/enjoyable 2 Beautiful park 1Because of how nice the park service has taken care of a
great historical site 1
Great park 1 Had no prior information about the area 1 History and natural beauty 1Pleasant employees 1 Reading all the information available 1 Really enjoyed fishing 1To read plaques and dwell 1 Too much fun to leave 1 Very interesting to see wagon road, Indian trail,
battlefield, museum 1
Was not a planned stop 1 Visit was shorter than planned (N=3) Late arrival 2 Scheduling 1

Ninety Six National Historic Site–VSP Visitor Study Report 226 April 10 - June 13, 2010
_______________ *total percentages do not equal 100 due to rounding **total percentages do not equal 100 because visitors could select more than one answer
37
Table 11b. Reasons for length of visit different than planned – Encampment visitors (N=26 comments; some visitor groups made more than one comment.)
Comment Number of times
mentioned
Visit longer than planned (N=24) Enjoyed the events 4Enjoyed the park 4 Enjoyed reeanctors 2 Awesome experience 1Children had so much fun, they did not want to leave 1 Children wanted to stay and talk 1 Felt welcomed and things were interesting 1Grandchildren enjoyed site 1 Interesting 1 Kids program - Ninety Six militia 1Liked information and people there 1 More to see than expected 1 Much to see and learn 1New interpretive signs 1 Talking with people there 1 The reenactment stations were great 1We were somewhat slower that day 1 Visit was shorter than planned (N=2) We arrived late 1 Work 1

Ninety Six National Historic Site–VSP Visitor Study Report 226 April 10 - June 13, 2010
_______________ *total percentages do not equal 100 due to rounding **total percentages do not equal 100 because visitors could select more than one answer
38
Sites visited
Question 10
On this visit to Ninety Six NHS, which park sites did you and your personal group visit?
Results • As shown in Figure 32, the most
common sites that visitor groups visited were:
General
82% Visitor center 76% Walking tour
Encampment 75% Visitor center 72% Walking tour
• “Other” trails were:
3% General
Fishing trail around pond Nature walk Old Charlestown Road Other gravel trails
Encampment (6%)
All the exhibits Island Ford Road Just where the special
demonstrations were Revolutionary reenactment
areas Special tour Walked length of Charleston
Road Went to look at the Hamilton
Survey Line
• “Other” sites were:
4% General Log house Off-trail with naturalist-led hike Restrooms Stayed in circular CRV Drive Stockade Fort Taver
0 20 40 60 80 100Proportion of respondents
Other
Other trails
Star Fort Pond
Goudy Trail
Cherokee Path Trail
Picnic Area
Walking tour
Visitor center
4%
3%
16%
14%
15%
13%
76%
82%
20%
6%
9%
20%
21%
36%
72%
75%
Encampment: N=141 visitor groups**General: N=233 visitor groups**
Parksites
Figure 32. Sites visited
• “Other” sites (continued): Encampment (20%)
Bunker and special activity Campsites near Black Swan Tavern Colonial Days exhibits Colonial reenactment area Fort Fort Holmes Grounds around the log cabin Indian dancing, stockade weapon
demonstration Lifeways of Settlers Lifeways of the Cherokee Indians Living history village Logan House and area in front of that Looked at special program Reenactment sites Reserved sites (tents) Special event Star Fort Stockade Fort

Ninety Six National Historic Site–VSP Visitor Study Report 226 April 10 - June 13, 2010
_______________ *total percentages do not equal 100 due to rounding **total percentages do not equal 100 because visitors could select more than one answer
39
Activities on past visits Question 12a
On past visits, in which activities have you and your personal group participated within Ninety Six NHS?
Results • As shown in Figure 33, the
proportion of visitor groups for which this was their first visit was:
48% General 27% Encampment
• As shown in Figure 34, the most
common sites visited on past visits were:
General
64% Learning history 58% Walking/hiking
Encampment 77% Learning history 77% Attending special events
• “Other” activities were:
General (13%)
Catering for film company Junior Ranger program Learning about the area Looking for ghosts Museum Photography Scout outing Setting up living history activities/
displays Viewing film
Encampment (10%) Bike riding Boy Scouts Cherokee Indian program Family day at park Geocaching School program Viewing film
0 20 40 60 80 100Proportion of respondents
No
Yes
52%
48%
73%
27%
Encampment: N=143 visitor groupsGeneral: N=232 visitor groups
Firstvisit?
Figure 33. Visitor groups visiting for the first time
0 20 40 60 80 100Proportion of respondents
Other
Horseback riding
Getting NPSPassport
book stamped
Genealogicalresearch
Birdwatching
Jogging
Nature study
Creative arts
Fishing
Walking dogs
Picnicking
Shopping/browsingin bookstore
Walking/hiking
Attending specialevents
Learning history
13%
3%
6%
5%
4%
5%
4%
13%
18%
9%
13%
36%
58%
31%
64%
10%
2%
3%
4%
6%
6%
8%
11%
11%
12%
28%
47%
68%
77%
77%
Encampment: N=99 visitor groups*General: N=117 visitor groups*
Activity
Figure 34. Activities on past visits

Ninety Six National Historic Site–VSP Visitor Study Report 226 April 10 - June 13, 2010
_______________ *total percentages do not equal 100 due to rounding **total percentages do not equal 100 because visitors could select more than one answer
40
Activities on this visit Question 12b
On this visit, in which activities did you and your personal group participate within Ninety Six NHS?
Results • As shown in Figure 35, the most
common activities included:
General 75% Learning history 69% Walking/hiking 51% Shopping/browsing in
visitor center bookstore
Encampment 86% Attending special events 73% Learning history 53% Walking/hiking
Note: Visitor groups that participated in
horseback riding may be underrepresented, as they did not enter the park at the location where visitors were contacted for the study.
0 50 100 150Proportion of respondents
Fishing
Horseback riding
Getting NPS Passportbook stamped
Jogging
Conductinggenealogical research
Walking dogs
Birdwatching
Nature study
Creative arts
Picnicking
Shopping/browsing invisitor center bookstore
Walking/hiking
Learning history
Attendingspecial events
8%
1%
15%
2%
5%
6%
8%
11%
9%
9%
51%
69%
75%
7%
0%
0%
1%
1%
3%
4%
6%
7%
8%
18%
33%
53%
73%
86%
Encampment: N=120 visitor groups**General: N=175 visitor groups**
Activity
Figure 35. Activities on this visit

Ninety Six National Historic Site–VSP Visitor Study Report 226 April 10 - June 13, 2010
_______________ *total percentages do not equal 100 due to rounding **total percentages do not equal 100 because visitors could select more than one answer
41
Primary reason for this visit
Question 12c
Which one of the above activities in column (b) was most important to you and your personal group on this visit to Ninety Six NHS?
Results • As shown in Figure 36, visitor
groups’ most important activities on this visit to Ninety Six NHS were: General
61% Learning history 13% Walking/hiking
Encampment 44% Attending special events 40% Learning history
• “Other” activities were:
General (3%)
Reenacting living history Setting up living history
activities/displays Watching video
Encampment (4%)
Watching video
0 20 40 60 80 100Proportion of respondents
Other
Birdwatching
Horseback riding
Nature study
Conducting genealogicalresearch
Creative arts
Jogging
Picnicking
Shopping/browsing invisitor center bookstore
Walking dogs
Attending special events
Getting NPS Passportbook stamped
Fishing
Walking/hiking
Learning history
3%
0%
0%
1%
1%
1%
1%
1%
1%
1%
3%
4%
7%
13%
61%
4%
0%
1%
0%
0%
0%
0%
0%
1%
1%
44%
0%
0%
8%
40%
Encampment: N=99 visitor groups*General: N=157 visitor groups*
Activity
Figure 36. Most important activity
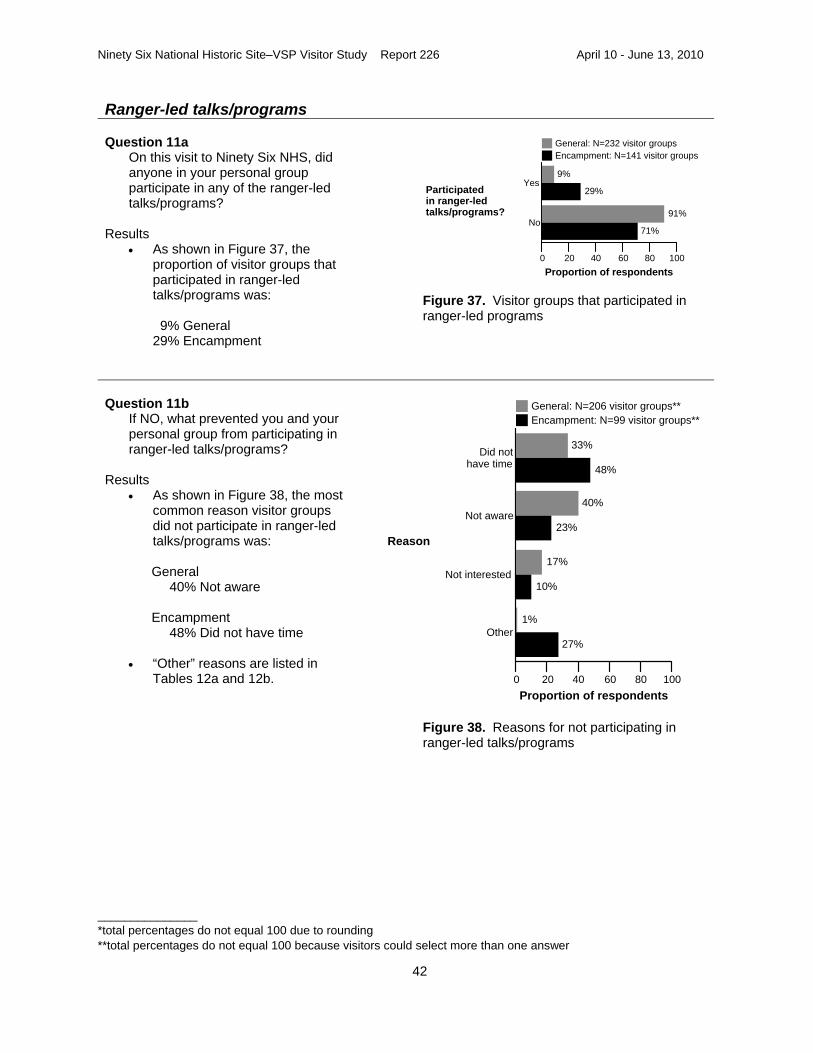
Ninety Six National Historic Site–VSP Visitor Study Report 226 April 10 - June 13, 2010
_______________ *total percentages do not equal 100 due to rounding **total percentages do not equal 100 because visitors could select more than one answer
42
Ranger-led talks/programs
Question 11a
On this visit to Ninety Six NHS, did anyone in your personal group participate in any of the ranger-led talks/programs?
Results • As shown in Figure 37, the
proportion of visitor groups that participated in ranger-led talks/programs was:
9% General 29% Encampment
0 20 40 60 80 100Proportion of respondents
No
Yes
91%
9%
71%
29%
Encampment: N=141 visitor groupsGeneral: N=232 visitor groups
Participatedin ranger-ledtalks/programs?
Figure 37. Visitor groups that participated in ranger-led programs
Question 11b
If NO, what prevented you and your personal group from participating in ranger-led talks/programs?
Results • As shown in Figure 38, the most
common reason visitor groups did not participate in ranger-led talks/programs was:
General
40% Not aware Encampment
48% Did not have time
• “Other” reasons are listed in Tables 12a and 12b.
0 20 40 60 80 100Proportion of respondents
Other
Not interested
Not aware
Did nothave time
1%
17%
40%
33%
27%
10%
23%
48%
Encampment: N=99 visitor groups**General: N=206 visitor groups**
Reason
Figure 38. Reasons for not participating in ranger-led talks/programs

Ninety Six National Historic Site–VSP Visitor Study Report 226 April 10 - June 13, 2010
_______________ *total percentages do not equal 100 due to rounding **total percentages do not equal 100 because visitors could select more than one answer
43
Table 12a. “Other” reasons (19%) for not attending ranger-led talks/programs – General visitors (N=38 comments)
Reason
Number of times mentioned
None offered at time of visit 9 Saw the film 7 Just there for walking/exercise 4 Came only to fish 3 Already attended in the past 2 Raining 2 Time of arrival too late 2 Did not see ranger 1 Had a master naturalist guide 1 Have heard these talks previously 1 Not open when we were there 1 No programs offered at pond 1 Poison ivy in the past 1 Was led around site by someone else 1 With elderly relative 1 You need to hire more staff 1 Table 12b. “Other” reasons (27%) for not attending talks/ranger-led programs – Encampment visitors (N=25 comments)
Reason
Number of times mentioned
Had small children along 5 Attended reenactment events not led by
rangers 2
Came for reenactment 2 Did other activities 2 Had participated before 2 Arrival time wrong 1 End of weekend 1 Got there too late 1 I was alone (67 years old) 1 Not going on when we were there 1 Physical limitations 1 Preferred to explore at our own pace 1 Seniors 1 Signs on paths offer enough information 1 They were full 1 Walked and read signs 1 Watching movie when tour started 1

Ninety Six National Historic Site–VSP Visitor Study Report 226 April 10 - June 13, 2010
_______________ *total percentages do not equal 100 due to rounding **total percentages do not equal 100 because visitors could select more than one answer
44
Topics learned this visit
Question 17a
Ninety Six NHS interpretive programs and exhibits discuss topics related to the Revolutionary War battle that took place here and colonial backcountry life. Please indicate all the topics you learned (or learned more) about on this visit.
Results • As shown in Figure 39, the
proportion of visitor groups that learned about topics this visit was:
86% General 95% Encampment
• As shown in Figure 40, the
topics that most visitor groups learned about were: General
98% Revolutionary War 93% Colonial life/settlement
Encampment 98% Colonial life/settlement 89% Revolutionary War
0 20 40 60 80 100Proportion of respondents
No
Yes
14%
86%
5%
95%
Encampment: N=141 visitor groupsGeneral: N=230 visitor groups
Learnedabouttopics?
Figure 39. Visitor groups that learned about any topics on this visit
0 20 40 60 80 100Proportion of respondents
Cherokee Indian Tribe
Weapons used duringRevolutionary War
Colonial life/settlement
Revolutionary War
84%
87%
93%
98%
86%
88%
98%
89%
Encampment: N=133 visitor groups**General: N=196 visitor groups**
Topic
Figure 40. Topics visitor groups learned about

Ninety Six National Historic Site–VSP Visitor Study Report 226 April 10 - June 13, 2010
_______________ *total percentages do not equal 100 due to rounding **total percentages do not equal 100 because visitors could select more than one answer
45
Improved level of understanding
Question 17b
Please indicate how much your level of understanding of each topic improved during your visit.
Results
• Figures 41 – 44 and Tables 13a and 13b show the degree to which visitors’ level of understanding of each topic improved.
0 20 40 60 80 100Proportion of respondents
Not at all
A little
Somewhat
A lot
1%
5%
32%
63%
1%
9%
34%
56%
Encampment: N=116 visitor groupsGeneral: N=192 visitor groups*
Level ofimprovement
Figure 41. Understanding of Revolutionary War
0 20 40 60 80 100Proportion of respondents
Not at all
A little
Somewhat
A lot
6%
28%
35%
30%
4%
23%
36%
37%
Encampment: N=113 visitor groupsGeneral: N=164 visitor groups*
Level ofimprovement
Figure 42. Understanding of Cherokee Indian Tribe
0 20 40 60 80 100Proportion of respondents
Not at all
A little
Somewhat
A lot
6%
22%
40%
32%
1%
13%
35%
51%
Encampment: N=116 visitor groupsGeneral: N=171 visitor groups
Level ofimprovement
Figure 43. Understanding of weapons of used during Revolutionary War
0 20 40 60 80 100Proportion of respondents
Not at all
A little
Somewhat
A lot
2%
18%
39%
41%
1%
9%
26%
64%
Encampment: N=129 visitor groupsGeneral: N=182 visitor groups
Level ofimprovement
Figure 44. Understanding of colonial life/settlement

Ninety Six National Historic Site–VSP Visitor Study Report 226 April 10 - June 13, 2010
_______________ *total percentages do not equal 100 due to rounding **total percentages do not equal 100 because visitors could select more than one answer
46
Table 13a. Improved level of understanding of topics learned this visit – General visitors (N=number of visitor groups that responded to each item)
Improvement (%)
Topic N
Not at all %
A little %
Somewhat %
A lot %
Revolutionary War 192 1 5 32 63
Cherokee Indian Tribe 164 6 28 35 30 Weapons used during Revolutionary War 171 6 22 40 32
Colonial life/settlement 182 2 18 39 41 Table 13b. Improved level of understanding of topics learned this visit – Encampment visitors (N=number of visitor groups that responded to each item)
Improvement (%)
Topic N
Not at all %
A little %
Somewhat %
A lot %
Revolutionary War 116 1 9 34 56
Cherokee Indian Tribe 113 4 23 36 37 Weapons used during Revolutionary War 116 1 13 35 51
Colonial life/settlement 129 1 9 26 64

Ninety Six National Historic Site–VSP Visitor Study Report 226 April 10 - June 13, 2010
_______________ *total percentages do not equal 100 due to rounding **total percentages do not equal 100 because visitors could select more than one answer
47
Topics to learn on a future visit
Question 17c
Next, indicate the topics you would be interested in learning (or learning more) about on a future visit.
Results • As shown in Figure 45, the
topics that most visitor groups are interested in learning or learning more about on a future visit were: General
93% Revolutionary War 91% Cherokee Indian Tribe 90% Colonial life/settlement
Encampment 98% Revolutionary War 98% Colonial life/settlement 97% Cherokee Indian Tribe
Figure 45. Topics to learn or learn more about on a future visit
Question 17d
Please list any additional topics you and your personal group are interested in learning about at Ninety Six NHS.
Results
• 16 general visitor groups listed topics they would be interested in learning about on a future visit (see Table 14a).
• 20 encampment visitor groups listed topics they would be interested in learning about on a future visit (see Table 14b).
Table 14a. “Other” topics to learn about on a future visit – General visitors (N=18 comments; some visitor groups made more than one comment.)
Topic
Number of times mentioned
Reenacting events 2 All that has to do with history 1Anything the staff may produce 1 Anything to help kids understand past and future of Ninety Six 1Cherokee Nation involvement in the war 1 Explaining who were patriots and loyalists 1 Food cooked 1How trading post operated 1 List of the patriots present at siege of Ninety Six in 1781 1

Ninety Six National Historic Site–VSP Visitor Study Report 226 April 10 - June 13, 2010
_______________ *total percentages do not equal 100 due to rounding **total percentages do not equal 100 because visitors could select more than one answer
48
Table 14a. “Other” topics to learn about on a future visit – General visitors (continued)
Topic
Number of times mentioned
Living history (weapons) 1 Living history with key trades people 1 Memorial to fallen soldiers with names, dates 1More battle strategy 1 Native plants and animals 1 Natural history 1Travel time from Ninety Six to Charleston back then 1 Units involved in the battle 1 Table 14b. “Other” topics to learn about on a future visit – Encampment visitors (N=23 comments; some visitor groups made more than one comment.)
Topic
Number of times mentioned
Archaeological excavations 2 Anglo-Cherokee War History 1 Any Jewish settlers 1Colonial life 1 Details of the war 1 Enjoyed learning about useful herbs 1French-Indian War 1 Furniture making 1History of original families 1 Information on area after Revolutionary War to present 1 Kids hands-on programs 1Knitting 1 More detail about participants of siege 1 More stories of our past history 1Names and surnames of earliest settlers and burial sites
in the area 1
Native herbal/gardening walk (edible plants) 1Occupations of pre-historic people 1 Pre-historic information 1 Seen and heard most 1The archaeology history and discoveries of the site 1 The role that Christianity played to settlers 1 Trade and trading post 1

Ninety Six National Historic Site–VSP Visitor Study Report 226 April 10 - June 13, 2010
_______________ *total percentages do not equal 100 due to rounding **total percentages do not equal 100 because visitors could select more than one answer
49
Exhibits viewed
Question 18a
On this visit, did you and your personal group view the Ninety Six NHS visitor center exhibits?
Results • As shown in Figure 46, the
proportion of visitor groups that viewed visitor center exhibits was:
79% General 66% Encampment
0 20 40 60 80 100Proportion of respondents
No
Yes
21%
79%
34%
66%
Encampment: N=143 visitor groupsGeneral: N=236 visitor groups
Viewedexhibits?
Figure 46. Visitor groups that viewed visitor center exhibits
Interest in exhibit objects
Question 18b
If YES, did you and your personal group find the exhibit objects interesting?
Results • As shown in Figure 47, the
proportion of visitor groups that found the visitor center exhibits interesting was:
98% General 95% Encampment
0 20 40 60 80 100Proportion of respondents
No
Yes
2%
98%
5%
95%
Encampment: N=91 visitor groupsGeneral: N=182 visitor groups
Exhibit objectsinteresting?
Figure 47. Visitor groups that found the visitor center exhibits interesting

Ninety Six National Historic Site–VSP Visitor Study Report 226 April 10 - June 13, 2010
_______________ *total percentages do not equal 100 due to rounding **total percentages do not equal 100 because visitors could select more than one answer
50
Length of exhibit text
Question 18c
Please rate the length of the exhibit text.
Results • As shown in Figure 48, the
proportion of visitor groups that found the length of the visitor center exhibit text to be “about right” was:
89% General 83% Encampment
0 20 40 60 80 100Proportion of respondents
Too long
About right
Too short
1%
89%
10%
1%
83%
16%
Encampment: N=89 visitor groupsGeneral: N=183 visitor groups
Rating
Figure 48. Visitor groups’ ratings of the length of visitor center exhibits
Hands-on exhibits
Question 18d
Would you and your personal group like more hands-on exhibits?
Results • As shown in Figure 49, the
proportion of visitor groups that would was like more hands-on exhibits was:
52% General 77% Encampment
0 20 40 60 80 100Proportion of respondents
Not sure
No
Yes
32%
15%
52%
21%
2%
77%
Encampment: N=91 visitor groupsGeneral: N=185 visitor groups*
More hands-onexhibits?
Figure 49. Visitor groups that would like more hands-on exhibits

Ninety Six National Historic Site–VSP Visitor Study Report 226 April 10 - June 13, 2010
_______________ *total percentages do not equal 100 due to rounding **total percentages do not equal 100 because visitors could select more than one answer
51
Electronic exhibits
Question 18e
Would you and your personal group like more electronic exhibits?
Results • As shown in Figure 50, the
proportion of visitor groups that would like more electronic exhibits was:
36% General 30% Encampment
0 20 40 60 80 100Proportion of respondents
Not sure
No
Yes
35%
29%
36%
33%
37%
30%
Encampment: N=91 visitor groupsGeneral: N=185 visitor groups
More electronicexhibits?
Figure 50. Visitor groups that would like more electronic exhibits

Ninety Six National Historic Site–VSP Visitor Study Report 226 April 10 - June 13, 2010
_______________ *total percentages do not equal 100 due to rounding **total percentages do not equal 100 because visitors could select more than one answer
52
Ratings of Services, Facilities, Attributes, and Resources Visitor services and facilities used Question 14a
Please indicate all the visitor services and facilities that you or your personal group used at Ninety Six NHS during this visit.
Results
• As shown in Figure 51, the most common visitor services and facilities used by visitor groups were:
General
81% Visitor center 80% Restrooms 67% Trails
Encampment
76% Outdoor exhibits 72% Visitor center 65% Restrooms
• The least used
service/facility was:
General 1% Weapons firing
demonstrations
Encampment 9% Junior Ranger
program
0 20 40 60 80 100Proportion of respondents
Junior Ranger program
Access for peoplewith disabilities
Ranger-led programs
Bookstore sales items
Videos/filmsin visitor center
Directional signs
Assistance frompark staff
Park brochure/map
Weapons firingdemonstrations
Trails
Restrooms
Visitor center
Outdoor exhibits
5%
12%
3%
52%
53%
56%
53%
60%
1%
67%
80%
81%
49%
9%
10%
17%
30%
34%
49%
51%
51%
54%
63%
65%
72%
76%
Encampment: N=134 visitor groups**General: N=217 visitor groups**
Service/facility
Figure 51. Visitor services and facilities used

Ninety Six National Historic Site–VSP Visitor Study Report 226 April 10 - June 13, 2010
_______________ *total percentages do not equal 100 due to rounding **total percentages do not equal 100 because visitors could select more than one answer
53
Importance ratings of visitor services and facilities Question 14b
Next, for only those services and facilities that you or your personal group used, please rate their importance to your visit from 1-5.
1=Not important 2=Somewhat important 3=Moderately important 4=Very important 5=Extremely important
Results
• Figure 52 shows the combined proportions of “extremely important” and “very important” ratings for visitor services and facilities that were rated by 30 or more visitor groups.
• The services and facilities
receiving the highest combined proportion of “extremely important” and “very important” ratings were:
General
92% Restrooms
Encampment 93% Restrooms
• Figures 53 to 65 show the importance ratings for each service and facility.
• The services and facilities receiving the highest “not important” ratings that were rated by 30 or more visitor groups were:
General
3% Bookstore sales items
Encampment 3% Bookstore sales times 3% Weapons firing
demonstration
Figure 52. Combined proportions of “extremely important” and “very important” ratings of visitor services and facilities
• CAUTION! Only two general visitor groups rated the importance of the weapons firing demonstrations.

Ninety Six National Historic Site–VSP Visitor Study Report 226 April 10 - June 13, 2010
_______________ *total percentages do not equal 100 due to rounding **total percentages do not equal 100 because visitors could select more than one answer
54
0 20 40 60 80 100Proportion of respondents
Notimportant
Somewhatimportant
Moderatelyimportant
Veryimportant
Extremelyimportant
5%
9%
5%
14%
68%
0%
9%
0%
45%
45%
Encampment: N=11 visitor groups*General: N=22 visitor groups*
Rating
CAUTION!
Figure 53. Importance of access for people with disabilities
0 20 40 60 80 100Proportion of respondents
Notimportant
Somewhatimportant
Moderatelyimportant
Veryimportant
Extremelyimportant
1%
5%
15%
36%
44%
0%
5%
12%
44%
39%
Encampment: N=66 visitor groupsGeneral: N=110 visitor groups*
Rating
Figure 54. Importance of assistance from park staff
0 20 40 60 80 100Proportion of respondents
Notimportant
Somewhatimportant
Moderatelyimportant
Veryimportant
Extremelyimportant
3%
14%
35%
29%
19%
3%
23%
20%
25%
30%
Encampment: N=40 visitor groups*General: N=104 visitor groups
Rating
Figure 55. Importance of bookstore sales items (selection, price, etc.)
0 20 40 60 80 100Proportion of respondents
Notimportant
Somewhatimportant
Moderatelyimportant
Veryimportant
Extremelyimportant
0%
7%
9%
36%
49%
0%
6%
14%
37%
43%
Encampment: N=65 visitor groupsGeneral: N=115 visitor groups*
Rating
Figure 56. Importance of directional signs

Ninety Six National Historic Site–VSP Visitor Study Report 226 April 10 - June 13, 2010
_______________ *total percentages do not equal 100 due to rounding **total percentages do not equal 100 because visitors could select more than one answer
55
0 20 40 60 80 100Proportion of respondents
Notimportant
Somewhatimportant
Moderatelyimportant
Veryimportant
Extremelyimportant
0%
0%
10%
20%
70%
0%
17%
17%
42%
25%
Encampment: N=12 visitor groups*General: N=10 visitor groups
Rating
CAUTION!
Figure 57. Importance of Junior Ranger program
0 20 40 60 80 100Proportion of respondents
Notimportant
Somewhatimportant
Moderatelyimportant
Veryimportant
Extremelyimportant
0%
0%
50%
0%
50%
3%
3%
33%
36%
25%
Encampment: N=69 visitor groupsGeneral: N=2 visitor groups
Rating
CAUTION!
Figure 58. Importance of weapons firing demonstrations
0 20 40 60 80 100Proportion of respondents
Notimportant
Somewhatimportant
Moderatelyimportant
Veryimportant
Extremelyimportant
0%
2%
16%
32%
50%
1%
3%
9%
35%
52%
Encampment: N=100 visitor groupsGeneral: N=101 visitor groups
Rating
Figure 59. Importance of outdoor exhibits
0 20 40 60 80 100Proportion of respondents
Notimportant
Somewhatimportant
Moderatelyimportant
Veryimportant
Extremelyimportant
1%
2%
14%
27%
56%
0%
3%
21%
24%
52%
Encampment: N=66 visitor groupsGeneral: N=122 visitor groups
Rating
Figure 60. Importance of park brochure/ map

Ninety Six National Historic Site–VSP Visitor Study Report 226 April 10 - June 13, 2010
_______________ *total percentages do not equal 100 due to rounding **total percentages do not equal 100 because visitors could select more than one answer
56
0 20 40 60 80 100Proportion of respondents
Notimportant
Somewhatimportant
Moderatelyimportant
Veryimportant
Extremelyimportant
0%
0%
17%
50%
33%
0%
0%
23%
23%
55%
Encampment: N=22 visitor groups*General: N=6 visitor groups
Rating
CAUTION!
Figure 61. Importance of ranger-led programs
0 20 40 60 80 100Proportion of respondents
Notimportant
Somewhatimportant
Moderatelyimportant
Veryimportant
Extremelyimportant
0%
1%
6%
31%
61%
0%
1%
6%
21%
72%
Encampment: N=82 visitor groupsGeneral: N=162 visitor groups*
Rating
Figure 62. Importance of restrooms
0 20 40 60 80 100Proportion of respondents
Notimportant
Somewhatimportant
Moderatelyimportant
Veryimportant
Extremelyimportant
0%
3%
7%
31%
59%
0%
0%
11%
36%
52%
Encampment: N=44 visitor groups*General: N=109 visitor groups
Rating
Figure 63. Importance of videos/films shown in visitor center
0 20 40 60 80 100Proportion of respondents
Notimportant
Somewhatimportant
Moderatelyimportant
Veryimportant
Extremelyimportant
0%
1%
7%
39%
53%
0%
1%
9%
39%
51%
Encampment: N=80 visitor groupsGeneral: N=134 visitor groups
Rating
Figure 64. Importance of trails

Ninety Six National Historic Site–VSP Visitor Study Report 226 April 10 - June 13, 2010
_______________ *total percentages do not equal 100 due to rounding **total percentages do not equal 100 because visitors could select more than one answer
57
0 20 40 60 80 100Proportion of respondents
Notimportant
Somewhatimportant
Moderatelyimportant
Veryimportant
Extremelyimportant
1%
2%
12%
30%
55%
0%
0%
11%
42%
47%
Encampment: N=93 visitor groupsGeneral: N=165 visitor groups
Rating
Figure 65. Importance of visitor center

Ninety Six National Historic Site–VSP Visitor Study Report 226 April 10 - June 13, 2010
_______________ *total percentages do not equal 100 due to rounding **total percentages do not equal 100 because visitors could select more than one answer
58
Quality ratings of visitor services and facilities Question 14c
Finally, for only those services and facilities that you or your personal group used, please rate their quality from 1-5.
1=Very poor 2=Poor 3=Average 4=Good 5=Very good
Results
• Figure 66 shows the combined proportions of “very good” and “good” quality ratings for visitor services and facilities that were rated by 30 or more visitor groups.
General
99% Videos/films in visitor center
97% Trails 97% Assistance from park
staff
Encampment 98% Trails 98% Assistance from park
staff 97% Park brochure/map
• Figures 67 to 79 show the
importance ratings for each service and facility.
• The services and facilities receiving the highest “very poor” ratings that were rated by 30 or more visitor groups were:
General
2% Restrooms
Encampment 3% Bookstore sales items
Figure 66. Combined proportions of “very good” and “good” quality ratings of visitor services and facilities
• CAUTION! Only one general visitor group rated the quality of the weapons firing demonstrations.

Ninety Six National Historic Site–VSP Visitor Study Report 226 April 10 - June 13, 2010
_______________ *total percentages do not equal 100 due to rounding **total percentages do not equal 100 because visitors could select more than one answer
59
0 20 40 60 80 100Proportion of respondents
Very poor
Poor
Average
Good
Very good
5%
0%
15%
25%
55%
0%
8%
8%
42%
42%
Encampment: N=12 visitor groupsGeneral: N=20 visitor groups
Rating
CAUTION!
Figure 67. Quality of access for people with disabilities
0 20 40 60 80 100Proportion of respondents
Very poor
Poor
Average
Good
Very good
0%
1%
2%
21%
76%
0%
0%
2%
27%
71%
Encampment: N=66 visitor groupsGeneral: N=110 visitor groups
Rating
Figure 68. Quality of assistance from park staff
0 20 40 60 80 100Proportion of respondents
Very poor
Poor
Average
Good
Very good
0%
2%
15%
33%
50%
3%
3%
21%
31%
44%
Encampment: N=39 visitor groups*General: N=103 visitor groups
Rating
Figure 69. Quality of bookstore sales items (selection, price, etc.)
0 20 40 60 80 100Proportion of respondents
Very poor
Poor
Average
Good
Very good
0%
1%
4%
35%
60%
0%
3%
8%
20%
69%
Encampment: N=64 visitor groupsGeneral: N=114 visitor groups
Rating
Figure 70. Quality of directional signs

Ninety Six National Historic Site–VSP Visitor Study Report 226 April 10 - June 13, 2010
_______________ *total percentages do not equal 100 due to rounding **total percentages do not equal 100 because visitors could select more than one answer
60
0 20 40 60 80 100Proportion of respondents
Very poor
Poor
Average
Good
Very good
0%
0%
0%
30%
70%
0%
0%
18%
27%
55%
Encampment: N=11 visitor groupsGeneral: N=10 visitor groups
Rating
CAUTION!
Figure 71. Quality of Junior Ranger program
0 20 40 60 80 100Proportion of respondents
Very poor
Poor
Average
Good
Very good
0%
0%
0%
0%
100%
0%
0%
11%
30%
59%
Encampment: N=66 visitor groupsGeneral: N=1 visitor groups
Rating
CAUTION!
Figure 72. Quality of weapons firing demonstrations
0 20 40 60 80 100Proportion of respondents
Very poor
Poor
Average
Good
Very good
0%
3%
8%
25%
64%
0%
0%
4%
24%
72%
Encampment: N=95 visitor groupsGeneral: N=101 visitor groups
Rating
Figure 73. Quality of outdoor exhibits
0 20 40 60 80 100Proportion of respondents
Very poor
Poor
Average
Good
Very good
1%
1%
6%
23%
69%
0%
0%
3%
31%
66%
Encampment: N=64 visitor groupsGeneral: N=120 visitor groups
Rating
Figure 74. Quality of park brochure/map

Ninety Six National Historic Site–VSP Visitor Study Report 226 April 10 - June 13, 2010
_______________ *total percentages do not equal 100 due to rounding **total percentages do not equal 100 because visitors could select more than one answer
61
0 20 40 60 80 100Proportion of respondents
Very poor
Poor
Average
Good
Very good
0%
0%
20%
0%
80%
0%
0%
4%
30%
65%
Encampment: N=23 visitor groups*General: N=5 visitor groups
Rating
CAUTION!
Figure 75. Quality of ranger-led programs
0 20 40 60 80 100Proportion of respondents
Very poor
Poor
Average
Good
Very good
2%
4%
22%
27%
46%
1%
0%
13%
19%
68%
Encampment: N=80 visitor groups*General: N=160 visitor groups*
Rating
Figure 76. Quality of restrooms
0 20 40 60 80 100Proportion of respondents
Very poor
Poor
Average
Good
Very good
0%
0%
1%
16%
83%
0%
2%
5%
18%
75%
Encampment: N=44 visitor groupsGeneral: N=109 visitor groups
Rating
Figure 77. Quality of videos/films shown in visitor center
0 20 40 60 80 100Proportion of respondents
Very poor
Poor
Average
Good
Very good
0%
0%
3%
29%
68%
0%
1%
1%
27%
71%
Encampment: N=82 visitor groupsGeneral: N=133 visitor groups
Rating
Figure 78. Quality of trails

Ninety Six National Historic Site–VSP Visitor Study Report 226 April 10 - June 13, 2010
_______________ *total percentages do not equal 100 due to rounding **total percentages do not equal 100 because visitors could select more than one answer
62
0 20 40 60 80 100Proportion of respondents
Very poor
Poor
Average
Good
Very good
0%
1%
7%
33%
60%
0%
1%
9%
29%
61%
Encampment: N=90 visitor groupsGeneral: N=166 visitor groups*
Rating
Figure 79. Quality of visitor center

Ninety Six National Historic Site–VSP Visitor Study Report 226 April 10 - June 13, 2010
_______________ *total percentages do not equal 100 due to rounding **total percentages do not equal 100 because visitors could select more than one answer
63
Mean scores of importance and quality ratings for visitor services and facilities – General visitors
• Figures 80 and 81
show the mean scores of importance and quality ratings for all visitor services/facilities that were rated by 30 or more visitor groups.
• All visitor services/
facilities were rated above average.
Figure 80. Mean scores of importance and quality ratings for visitor services and facilities (General visitors)
Figure 81. Detail of Figure 80

Ninety Six National Historic Site–VSP Visitor Study Report 226 April 10 - June 13, 2010
_______________ *total percentages do not equal 100 due to rounding **total percentages do not equal 100 because visitors could select more than one answer
64
Mean scores of importance and quality ratings for visitor services and facilities – Encampment visitors
• Figures 82 and 83
show the mean scores of importance and quality ratings for all visitor services/facilities that were rated by 30 or more visitor groups.
• All visitor services/
facilities were rated above average.
Figure 82. Mean scores of importance and quality ratings for visitor services and facilities (Encampment visitors)
Figure 83. Detail of Figure 82

Ninety Six National Historic Site–VSP Visitor Study Report 226 April 10 - June 13, 2010
_______________ *total percentages do not equal 100 due to rounding **total percentages do not equal 100 because visitors could select more than one answer
65
Quality of personal interaction with a park ranger
Question 20a
During this visit to Ninety Six NHS, did you and your personal group have any personal interaction with a park ranger?
Results
• As shown in Figure 84, the proportion of visitor groups that had personal interactions with a park ranger was: 63% General 70% Encampment
0 20 40 60 80 100Proportion of respondents
No
Yes
37%
63%
30%
70%
Encampment: N=143 visitor groupsGeneral: N=236 visitor groups
Personalinteractionwith ranger?
Figure 84. Visitor groups that had personal interactions with park rangers
Question 20b If YES, please rate the quality of your interaction with the park ranger.
Results • As shown in Figure 85 the
combined proportions of “very good” and “good” quality ratings of visitor groups’ interactions with park rangers were: General
98% Helpfulness 97% Quality of information
provided 96% Courteousness
Encampment 99% Helpfulness 98% Courteousness 97% Quality of information
provided
• Figures 86 – 88 show visitor groups’ rating of the quality of each element of interactions with park rangers.
Figure 85. Combined proportions of “very good” and “good” quality ratings of interactions with park rangers

Ninety Six National Historic Site–VSP Visitor Study Report 226 April 10 - June 13, 2010
_______________ *total percentages do not equal 100 due to rounding **total percentages do not equal 100 because visitors could select more than one answer
66
0 20 40 60 80 100Proportion of respondents
Very poor
Poor
Average
Good
Very good
1%
1%
1%
21%
77%
0%
0%
1%
29%
70%
Encampment: N=99 visitor groupsGeneral: N=146 visitor groups*
Rating
Figure 86. Quality of interaction: Helpfulness
0 50 100 150Proportion of respondents
Very poor
Poor
Average
Good
Very good
1%
0%
3%
12%
84%
0%
0%
2%
21%
77%
Encampment: N=99 visitor groupsGeneral: N=146 visitor groups
Rating
Figure 87. Quality of interaction: Courteousness
0 20 40 60 80 100Proportion of respondents
Very poor
Poor
Average
Good
Very good
1%
1%
2%
20%
77%
0%
0%
3%
25%
72%
Encampment: N=99 visitor groupsGeneral: N=145 visitor groups*
Rating
Figure 88. Quality of interaction: Information provided

Ninety Six National Historic Site–VSP Visitor Study Report 226 April 10 - June 13, 2010
_______________ *total percentages do not equal 100 due to rounding **total percentages do not equal 100 because visitors could select more than one answer
67
Importance of protecting park resources and attributes Question 15
It is the National Park Service’s responsibility to protect Ninety Six NHS’s natural, scenic, and cultural resources while at the same time providing for public enjoyment. How important is protection of the following resources/attributes in the park to you and your personal group?
Results
• As shown in Figure 89, the highest combined proportions of “extremely important” and “very important” ratings of park resources and attributes included:
General
90% Historic structures/ buildings
90% Clean water 85% Clean air (visibility) 83% Educational opportunities
Encampment 92% Historic structures/
buildings 92% Clean water 91% Clean air (visibility) 86% Educational opportunities
• The resource/attribute that received the highest “not important” rating was: General
5% Recreational opportunities
Encampment 3% Recreational opportunities
• Tables 15a and 15b show the
importance ratings of park resources and attributes.
Figure 89. Combined proportions of “extremely important” and “very important” ratings of park resources and attributes

Ninety Six National Historic Site–VSP Visitor Study Report 226 April 10 - June 13, 2010
_______________ *total percentages do not equal 100 due to rounding **total percentages do not equal 100 because visitors could select more than one answer
68
Table 15a. Visitor ratings of importance of protecting park resources and attributes – General visitors (N=number of visitors that rated each resource/attribute.)
Rating (%)
Resource/attribute
N
Not important
Somewhat important
Moderately important
Very important
Extremely important
Clean air (visibility) 231 1 3 11 32 53 Clean water 232 1 2 8 29 61 Educational opportunities 228 <1 4 13 39 44 Historic structures/buildings 230 <1 1 9 36 54 Native plants 225 <1 8 16 33 42 Native wildlife 224 1 8 16 33 43 Natural quiet/sounds of
nature 226 1 6 13 31 48
Recreational opportunities 223 5 18 27 27 22 Scenic views 228 1 8 15 36 40
Table 15b. Visitor ratings of importance of protecting park resources and attributes – Encampment visitors (N=number of visitors that rated each resource/attribute.)
Rating (%)
Resource/attribute
N
Not important
Somewhat important
Moderately important
Very important
Extremely important
Clean air (visibility) 141 2 3 4 39 52 Clean water 143 2 2 4 31 61 Educational opportunities 141 1 1 11 41 45 Historic structures/buildings 142 1 1 6 38 54 Native plants 141 1 3 23 39 34 Native wildlife 142 1 4 21 37 38 Natural quiet/sounds of
nature 141 2 3 13 40 41
Recreational opportunities 142 3 6 25 40 26 Scenic views 143 1 4 12 46 38

Ninety Six National Historic Site–VSP Visitor Study Report 226 April 10 - June 13, 2010
_______________ *total percentages do not equal 100 due to rounding **total percentages do not equal 100 because visitors could select more than one answer
69
Preferences for Future Visit Visit in future
Question 25
Would you and your personal group be likely to visit Ninety Six NHS again in the future?
Results
• As shown in Figure 90, the proportion of visitor groups that would be likely to visit Ninety Six NHS again in the future was: 73% General 92% Encampment
0 20 40 60 80 100Proportion of respondents
Not sure
No, unlikely
Yes, likely
18%
9%
73%
4%
4%
92%
Encampment: N=142 visitor groupsGeneral: N=232 visitor groups
Likely tovisit again?
Figure 90. Visitor groups that would be likely to visit Ninety Six NHS again in the future

Ninety Six National Historic Site–VSP Visitor Study Report 226 April 10 - June 13, 2010
_______________ *total percentages do not equal 100 due to rounding **total percentages do not equal 100 because visitors could select more than one answer
70
Preferred methods to learn about the park Question 19
If you were to visit Ninety Six NHS in the future, how would you and your personal group prefer to learn about cultural and natural history/features of Ninety Six NHS?
Results
• As shown in Figure 91, the proportion of visitor groups that were interested in learning about the park on a future visit were: 90% General 97% Encampment
• As shown in Figure 92, among those visitor groups that were interested in learning about the park, the most preferred methods were:
General
71% Outdoor exhibits 66% Printed materials
Encampment 84% Outdoor exhibits 79% Special events
• “Other” methods were: General (3%)
Battle reenactments similar to 1976 reenactment
Gun shop and repair Historian talks Lists of soldiers who fought there
Encampment (1%)
Christian church services
0 20 40 60 80 100Proportion of respondents
No
Yes
10%
90%
3%
97%
Encampment: N=139 visitor groupsGeneral: N=231 visitor groups
Interestedin learning?
Figure 91. Visitor groups that were interested in learning about the park
0 20 40 60 80 100Proportion of respondents
Other
Electronic media/devices
Senior Ranger program
Volunteer opportunities
Junior Ranger program
Park website
Other children's programs
Audiovisual programs
Printed materials
Weapons firingdemonstrations
Indoor exhibits
Ranger-led interpretiveprograms/costumed
interpretive programs
Self-guided tours
Special events
Outdoor exhibits
3%
29%
16%
9%
8%
36%
12%
47%
66%
42%
62%
58%
63%
34%
71%
1%
16%
17%
20%
25%
25%
30%
39%
55%
57%
63%
64%
64%
79%
84%
Encampment: N=135 visitor groups*General: N=207 visitor groups*
Method
Figure 92. Preferred methods for learning

Ninety Six National Historic Site–VSP Visitor Study Report 226 April 10 - June 13, 2010
_______________ *total percentages do not equal 100 due to rounding **total percentages do not equal 100 because visitors could select more than one answer
71
Ranger-led program preferences Question 16a
If you were to visit in the future, would you and your personal group be interested in attending ranger-led programs at Ninety Six NHS?
Results
• As shown in Figure 93, the proportion of visitor groups that would be interested in attending ranger-led programs on a future visit were: 63% General 68% Encampment
0 20 40 60 80 100Proportion of respondents
Not sure
No, unlikely
Yes, likely
23%
14%
63%
22%
10%
68%
Encampment: N=143 visitor groupsGeneral: N=233 visitor groups
Interested?
Figure 93. Visitor groups that were interested in attending ranger-led programs on a future visit
Question 16b
If YES, which types of programs would you and your personal group be most likely to attend?
Results
• As shown in Figure 94, the most common types of programs that visitor groups would be most likely to attend were:
General
93% On-site programs at the park
66% Activities at historic cabin
Encampment 94% On-site programs at the
park 79% Hands-on demonstrations
• “Other” methods were: General (6%)
Anything for kids Historian talks Programs to learn time period
crafts for holiday seasons Reenactments Volunteer programs Would likely attend any program
0 20 40 60 80 100Proportion of respondents
Other
Off-site programs
Evening programs
Activities athistoric cabin
Hands-ondemonstrations
On-site programs
6%
6%
23%
66%
62%
93%
4%
11%
39%
78%
79%
94%
Encampment: N=95 visitor groups**General: N=146 visitor groups**
Type ofprogram
Figure 94. Preferred types of programs
• “Other” methods (continued) Encampment (4%)
Historic wagon/hay ride (ranger-led) Nature information walks or rides Ranger-led Staff ride of battle

Ninety Six National Historic Site–VSP Visitor Study Report 226 April 10 - June 13, 2010
_______________ *total percentages do not equal 100 due to rounding **total percentages do not equal 100 because visitors could select more than one answer
72
Question 16c
If YES, what length of program would you and your personal group be most likely to attend?
Results
• As shown in Figure 95, the length of program that most visitor groups were most likely to attend was: General
60% One half hour to one hour
Encampment
61% One half hour to one hour
• “Other” lengths were:
General (3%)
1 hour to whatever it takes 1/2 day 3-4 hours All day Depends on program One day/two day
Encampment (2%)
Depends on program
0 20 40 60 80 100Proportion of respondents
Other
Under 1/2 hour
1/2 - 1 hour
1 - 2 hours
3%
15%
60%
21%
2%
5%
61%
32%
Encampment: N=94 visitor groupsGeneral: N=144 visitor groups*
Length
Figure 95. Preferred length of ranger-led program

Ninety Six National Historic Site–VSP Visitor Study Report 226 April 10 - June 13, 2010
_______________ *total percentages do not equal 100 due to rounding **total percentages do not equal 100 because visitors could select more than one answer
73
Bookstore sales item preferences Question 21a
If you were to visit the Ninety Six NHS visitor center bookstore in the future, are there any sales items that you and your personal group would like to purchase that are not currently available?
Results
• As shown in Figure 96, the proportion of visitor groups that would like to purchase items from the bookstore that are not currently available were: 20% General 21% Encampment
0 20 40 60 80 100Proportion of respondents
No
Yes
80%
20%
79%
21%
Encampment: N=139 visitor groupsGeneral: N=234 visitor groups
Purchase itemson future visit?
Figure 96. Visitor groups that would like to purchase bookstore sales items that are not currently available
Question 21b
If YES, which items would you like to have available for purchase?
Results
• As shown in Figure 97, the most common types of bookstore sales items that visitor groups would like to have available for purchase were:
General
56% Additional publications 44% Additional maps
Encampment – CAUTION! Not enough visitor groups responded to this question to provide reliable results.
• Tables 16a and 16b list the
subjects of publications that visitor groups were interested in having available in the bookstore.
0 20 40 60 80 100Proportion of respondents
Other
Additional maps
CDs, DVDs,downloadable
digital files
Additionalpublications
29%
44%
33%
56%
43%
39%
32%
75%
Encampment: N=28 visitor groups**General: N=45 visitor groups**
Item
CAUTION!
Figure 97. Preferred bookstore sales items

Ninety Six National Historic Site–VSP Visitor Study Report 226 April 10 - June 13, 2010
_______________ *total percentages do not equal 100 due to rounding **total percentages do not equal 100 because visitors could select more than one answer
74
• “Other” sales items visitor groups
would like to have available for purchase were: General (29%)
"Don't tread on me" items List of all national parks More war era memorabilia (like
Guilford Courthouse shop and Kings Mountain National Military Park)
NPS hiking stick medallions Postcard of 3lb cannon Shot glass Silver metal soldiers The 2010 national parks stamp
set
Encampment (43%)
Food/drink Better patch Commemorative stamps and coins Knives/swords Larger selection of items in the gift
shop More T-shirts, moccasins, etc. Ninety Six maps Period replicas Star Fort postcard (out-of-stock in store
at time of visit)

Ninety Six National Historic Site–VSP Visitor Study Report 226 April 10 - June 13, 2010
_______________ *total percentages do not equal 100 due to rounding **total percentages do not equal 100 because visitors could select more than one answer
75
Question 21b
List subjects you are interested in (open-ended).
Results • 21 general visitor groups subjects for
additional publications (see Table 16a).
• 15 encampment visitor groups listed subjects for additional publications (see Table 16b).
Table 16a. Subjects for additional publications - General visitors (N=26 comments; some visitor groups made more than one comment)
Subject
Number of times mentioned
Revolutionary War history 3 Colonial life 2 Area trail guides 1Battle of Musgrove's Hill 1 Book on Colonel James Williams 1 Book selection is pretty good 1Botany 1 Calhoun settlement 1 Colonial South Carolina primary sources 1Crow Indians 1 Decorative flags or windsocks 1Drill Manuals 1 Entire Ninety Six district pre-revolution 1 From other parks to 1History of nearby towns 1 Local farming and early manufacturing 1 Long Canes 1More history about Ninety Six area 1 Novels about revolutions - for adults and
children 1
Revolutionary War battles, leaders, campaigns 1 Revolutionary War items 1 Spoons and shot glasses 1Weapons used in this battle 1

Ninety Six National Historic Site–VSP Visitor Study Report 226 April 10 - June 13, 2010
_______________ *total percentages do not equal 100 due to rounding **total percentages do not equal 100 because visitors could select more than one answer
76
Table 16b. Subjects for additional publications – Encampment visitors (N=20 comments; some visitor groups made more than one comment.)
Subject
Number of times mentioned
Anglo-Cherokee War 1 Detailed time lines 1Diaries of folks who experienced the battle 1 French and Indian War 1 Hand tools and their uses 1Historical fiction 1 History 1 I would like to see my books for sale 1More about native Americans 1 More for elementary school age children 1 More selection of Revolutionary history and
colonial history 1
Parker's Guide to Revolutionary War in South Carolina
1
Pre-revolution 1 Revolution/colonial life 1 Revolutionary war and colonial life 1Revolutionary war in South Carolina 1 South Carolina history 1T-shirts 1 Time-Life civil war series 1 Walking tour guide 1

Ninety Six National Historic Site–VSP Visitor Study Report 226 April 10 - June 13, 2010
_______________ *total percentages do not equal 100 due to rounding **total percentages do not equal 100 because visitors could select more than one answer
77
Park trails
Question 13
Currently, Ninety Six NHS has several relatively short trails (up to 2 miles long). If you were to visit the park in the future, would you and your personal group be interested in walking a longer nature trail?
Results
• As shown in Figure 98, the proportion of visitor groups that would be interested in walking a longer nature trail was: 54% General 54% Encampment
0 20 40 60 80 100Proportion of respondents
Not sure
No, unlikely
Yes, likely
23%
24%
54%
26%
20%
54%
Encampment: N=142 visitor groupsGeneral: N=233 visitor groups*
Interested?
Figure 98. Visitor groups that would be interested in walking a longer nature trail
Question 26
If Ninety Six NHS were to have an electric golf cart available for visitors unable to walk the 1-mile historic trail, is there anyone in your group who would be likely to use it?
Results • As shown in Figure 99, the
proportion of visitor groups that would be likely to use an electric golf cart was:
32% General 38% Encampment
0 20 40 60 80 100Proportion of respondents
Not sure
No, unlikely
Yes, likely
8%
59%
32%
9%
54%
38%
Encampment: N=140 visitor groups*General: N=232 visitor groups*
Likely to usegolf cart?
Figure 99. Visitor groups that would be likely to use an electric golf cart

Ninety Six National Historic Site–VSP Visitor Study Report 226 April 10 - June 13, 2010
_______________ *total percentages do not equal 100 due to rounding **total percentages do not equal 100 because visitors could select more than one answer
78
Overall Quality Question 31
Overall, how would you rate the quality of the facilities, services, and recreational opportunities provided to you and your personal group at Ninety Six NHS during this visit?
Results
• As shown in Figure 100, the proportion of visitor groups that rated the overall quality of facilities, services, and recreational opportunities as “very good” or “good” was: 96% General 94% Encampment
• No visitor groups rated the overall quality as “very poor” or “poor.”
0 20 40 60 80 100Proportion of respondents
Very poor
Poor
Average
Good
Very good
0%
0%
4%
28%
68%
0%
0%
6%
28%
66%
Encampment: N=141 visitor groupsGeneral: N=235 visitor groups
Rating
Figure 100. Overall quality rating of facilities,
services, and recreational opportunities

Ninety Six National Historic Site–VSP Visitor Study Report 226 April 10 - June 13, 2010
79
Visitor Comments National Park Service anniversary events Question 28
The National Park Service will be celebrating its 100th anniversary in 2016. How would you and your personal group like to see Ninety Six NHS celebrate this event? (open-ended)
Results
• 52% of general visitor groups (N=123) responded to this question.
• 55% of encampment visitor groups
(N=77) responded to this question.
• Tables 17a and 17b show a summary of visitor comments. A complete copy of hand-written comments is included in the Visitor Comments Appendix.
Table 17a. NPS anniversary event suggestions – General visitors (N=150 comments; some visitor groups made more than one comment.)
Comment
Number of times mentioned
Would support a celebration 25Reenactment 21 Don't know/not sure 16 Living history activities 8 Revolutionary War battle reenactment 8 Fireworks 7 Interpretive programs 5 Special events 4 Reenactment of village life during the era 3 Barbecue 2 Big party/celebration 2 Children's events 2 Costumed interpreter guided walks 2 Food and drinks from the period 2 Invite famous actors 2 Living history demonstrations 2 Revolutionary War era fair 2 Additional information 1 All about park and people 1 Anything would be fine 1 Candlelight walks 1 Combine with tour of Kings Mountain NMP and Cowpens NB 1 Community event 1 Don't do events 1 Erect a monument to patriots 1 Evening worship/gospel sing 1 Exhibits of village culture 1 Extended celebration with activities 1 Fundraiser for additional historic structures 1 Fundraising 1 Happy birthday banner 1 Historians on site 1

Ninety Six National Historic Site–VSP Visitor Study Report 226 April 10 - June 13, 2010
80
Table 17a. NPS anniversary event suggestions – General visitors (continued)
Comment
Number of times mentioned
Historical presentations 1 Improve advertisement to schools 1 Indians 1 Invite descendants of Ninety Six settlers 1 Live music 1 Living history hands-on demonstrations 1 Media coverage 1 More local and regional publicity 1 More staff along the trail to interact with visitors 1 Not important 1 Open house at the cabin 1 Open the tunnel 1 Picnic 1 Provide lists of other national parks 1 Ranger presence 1 Reconstruct the shooting tower 1 Remembrances of early park employees/founders 1 Special event with food 1 Special fishing days for seniors and disabled 1 Special site-specific stamp for the 100th 1 Time line of the establishment of this park 1 Weapons demonstrations 1

Ninety Six National Historic Site–VSP Visitor Study Report 226 April 10 - June 13, 2010
81
Table 17b. NPS anniversary event suggestions – Encampment visitors (N=77 comments; some visitors made more than one comment.)
Comment
Number of times mentioned
Reenactment 10 Revolutionary War battle reenactment 9 Living history encampment 6 Special events 5 Don't know/not sure 4 Fireworks 4 Anything 3 Crafts 3 Living history exhibits/demonstration 3 Big party/celebration 2 Monthly special events throughout the year 2 More interpretive/ranger programs/tours 2 Not interested 2 Parade 2 Activities and events for all ages 1 Big screen movie about Star Fort battle 1 Bring Smokey Bear 1 Cake and coffee served in the cabin 1 Celebrate colonial life 1 Celebration of Indians 1 Celebration with live music 1 Cherokee Indian reenactment battles 1 Christian church service 1 Demonstrations throughout the site (Star Fort and
original town) 1
Give door prizes 1 Family fun day 1 Focus on what this site brought to U.S. history 1 Food 1 Food and drinks 1 Food and drinks from the period 1 Hand-outs on British history 1 Hands-on colonial events 1 Have a cookout 1 Hay rides 1 History programs 1 Independence Day festivities 1 Indian pow-wow 1 Interpretive/ranger programs/tours 1 Involve local schools 1

Ninety Six National Historic Site–VSP Visitor Study Report 226 April 10 - June 13, 2010
82
Table 17b. NPS anniversary event suggestions – Encampment visitors (continued)
Comment
Number of times mentioned
Like it as it is 1 Live music 1 Local entertainment 1 Military programs 1 More character presentations like Goudy's 1 More exhibits 1 More historical structures (replicas) 1 More information on slavery in the Carolina colonies 1 More school programs 1 Native Americans 1 Nature walks 1 New exhibits 1 Night time weapons firing 1 Old movies about the Revolutionary War 1 Period activities for children 1 Place a 100th Anniversary geocache 1 Programs like today's 1 Publicize at other parks 1 Rebuild the town 1 Rendezvous 1 Sell shirts 1 Similar to 4th of July celebration 1 Similar to April 11, 2010 but even more 1 Special events on multiple weekends 1 Special events throughout the year 1 Special guided tour 1 Star-themed activities 1 Storytellers 1 Tours 1

Ninety Six National Historic Site–VSP Visitor Study Report 226 April 10 - June 13, 2010
83
What visitors liked most Question 27a
What did you and your personal group like most about your visit to Ninety Six NHS? (open-ended)
Results
• 89% of General visitor groups (N=210) responded to this question.
• 84% of Encampment visitor groups
(N=120) responded to this question.
• Tables 18a and 18b show a summary of visitor comments. A complete copy of hand-written comments is included in the Visitor Comments Appendix.
Table 18a. Liked most – General visitors (N=333 comments; some visitor groups made more than one comment.)
Comment
Number of times mentioned
PERSONNEL (5%) Friendly staff/rangers 8 Knowledgeable rangers 4 Helpful staff/rangers 2 Rangers 2 Other comment 1 INTERPRETIVE SERVICES (39%) Park video 34 Interpretive trail 17 Historical information 15 Learning about history 11 Trailside signs/exhibits 9 Informative/educational 8 Indoor exhibits 6 Learning Revolutionary War history 6 Walking tour 4 Bookstore 2 Historical relevance/significance 2 Junior Ranger program 2 Museum 2 Portraits/paintings in the visitor center 2 Ranger program 2 U.S. history 2 Other comments 6

Ninety Six National Historic Site–VSP Visitor Study Report 226 April 10 - June 13, 2010
84
Table 18a. Liked most – General visitors (continued)
Comment
Number of times mentioned
FACILTIES/MAINTENANCE (16%) Cleanliness/maintenance of site 19 Trails 13 Interpretive trail 5 Paved trails 3 Visitor center 3 Historic roads/trails still maintained 2 Other comments 7 POLICY/MANAGEMENT (2%) Off-trail walking allowed 2 Other comments 3 RESOURCE MANAGEMENT (10%) Seeing the Star Fort 11 Seeing the Earthenworks 4 Historical structures 3 Preservation of site 2 Reservoir/Star Fort Pond 2 Seeing the town site 2 Other comments 9 GENERAL (29%) Peacefulness/quiet 21 Everything 9 Fishing 8 Walk/exercise 8 Beautiful place 5 Nature 5 Scenery 5 Natural beauty 3 Being outside 2 Did not know it existed 2 Enjoyed visit 2 Park is accessible 2 Site 2 Trailside signs/exhibits 2 Other comments 20

Ninety Six National Historic Site–VSP Visitor Study Report 226 April 10 - June 13, 2010
85
Table 18b. Liked most – Encampment visitors (N=195 comments; some visitor groups made more than one comment.)
Comment
Number of times mentioned
PERSONNEL (3%) Friendly park staff 3 Other comments 2 INTERPRETIVE SERVICES (23%) Learning history 13 Park video 8 History 6 Trailside signs/exhibits 6 Ranger-led program/walking tour 5 Exhibits 2 Other comments 4 INTERPRETATION/REENACTMENT (37%) Reenactment activities/demonstrations 12 Reenactment event 8 Friendly reenactors 8 Conversations/interaction with reenactors 6 Indian reenactors/dancers 5 Living history of colonial life 5 Knowledgeable reenactors 4 Authenticity of the reeanctment 2 Beehive ovens 2 Cannon firing demonstration 2 Reenactment craft demonstrations 2 Weapons demonstrations 2 Other comments 15 FACILITIES/MAINTENANCE (13%) Trails 10 Cleanliness/maintenance of park 7 Other comments 9 RESOURCE MANAGEMENT (2%) Comments 3 GENERAL (23%) Liked everything 4 Scenery 4 Beauty 3 Being outdoors 3 Peacefulness/quiet 3 Nature 2 People 2 Proximity to home 2 Walking/hiking 2 Other comments 19

Ninety Six National Historic Site–VSP Visitor Study Report 226 April 10 - June 13, 2010
86
What visitors liked least Question 27a
What did you and your personal group like least about your visit to Ninety Six NHS? (open-ended)
Results
• 51% of general visitor groups (N=121) responded to this question.
• 56% of encampment visitor groups
(N=80) responded to this question.
• Tables 19a and 19b show a summary of visitor comments. A complete copy of hand-written comments is included in the Visitor Comments Appendix.
Table 19a. Liked least – General visitors (N=138 comments; some visitor groups made more than one comment.)
Comment
Number of times mentioned
PERSONNEL (2%) More staff needed 2 Other comment 1 INTERPRETIVE SERVICES (14%) Lack of interpretive programs 2 Other comments 18 FACILITIES/MAINTENANCE (26%) Lack of directional signs 4 Restrooms 4 Walk/trail was too long 4 More parking after hours 3 Museum is too small 2 Other comments 19 POLICY/MANAGEMENT (4%) Comments 5 RESOURCE MANAGEMENT (8%) Increase creel limits for fish 2 Lack of historic structures 2 Other comments 7 GENERAL (46%) Nothing to dislike 31 Not enough time 12 Heat 6 Missed the special event 3 Enjoyed visit 2 Humidity 2 Other comments 7

Ninety Six National Historic Site–VSP Visitor Study Report 226 April 10 - June 13, 2010
87
Table 19b. Liked least – Encampment visitors (N=86 comments; some visitor groups made more than one comment.)
Comment
Number of times mentioned
PERSONNEL (1%) Comment 1 INTERPRETIVE SERVICES (13%) Indian dancers 2 Other comments 9 FACILITIES/MAINTENANCE (22%) Need more seating/benches 3 Improve directional signage (highway) 2 Portable toilets 2 Visitor center 2 Other comments 10 POLICY/MANAGEMENT (5%) The survey 2 Other comments 2 RESOURCE MANGEMENT (2%) Comments 2 GENERAL (57%) Nothing to dislike 27 No food services 5 Not enough time 4 Other comments 13

Ninety Six National Historic Site–VSP Visitor Study Report 226 April 10 - June 13, 2010
88
Planning for the future Question 29
If you were a manager planning for the future of Ninety Six NHS, what would you and your personal group propose? (open-ended)
Results
• 48% of general visitor groups (N=114) responded to this question.
• 50% of encampment visitor groups
(N=72) responded to this question.
• Tables 20a and 20b show a summary of visitor comments. A complete copy of hand-written comments is included in the Visitor Comments Appendix.
Table 20a. Planning for future – General visitors (N=173 comments; some visitor groups made more than one comment.)
Comment
Number of times mentioned
PERSONNEL (3%) More rangers 2 Other comments 4 INTERPRETIVE SERVICES (45%) Expand the museum exhibits 6 Living history events/demonstrations 5 Promote non-historic aspects of the site (running,
hiking, nature) 3
Ranger-led tours/programs 3 3-D map/model of the battlefield 2 Continue historical preservation 2 iPod/smart phone/headphone tours 2 Identification of plants/trees/shrubs 2 Interactive web/YouTube tours 2 Larger video screen 2 More outdoor activities 2 Reenactments 2 Other comments 45 FACILITIES/MAINTENANCE (17%) Improve directional signage 5 Golf carts for the mobility-challenged 3 Continue high level of park maintenance 2 More walk/hiking trails 2 Other comments 18

Ninety Six National Historic Site–VSP Visitor Study Report 226 April 10 - June 13, 2010
89
Table 20a. Planning for future – General visitors (continued)
Comment
Number of times mentioned
POLICY/MANAGEMENT (19%) Maintain park to current standards 7 More advertisement 4 Advertise via newspaper and internet 2 Increase publicity/advertising 2 Keep it open 2 Open log cabin to the public 2 Other comments 14 RESOURCE MANAGEMENT (10%) Reconstruct/restore historic buildings 6 Reconstruction of siege/battle works 6 Reconstruct historical buildings 2 Other comments 4 GENERAL (5%) No suggestions 5 Other comments 3

Ninety Six National Historic Site–VSP Visitor Study Report 226 April 10 - June 13, 2010
90
Table 20b. Planning for future – Encampment visitors (N=113 comments; some visitor groups made more than one comment.)
Comment
Number of times mentioned
PERSONNEL (2%) Comments 2 INTERPRETIVE SERVICES (35%) Increase outreach to area schools 4 Add hands-on experiences/activities 3 Add interactive exhibits 2 Expand/update museum and exhibits 2 More information on Cherokee Indians 2 Other comments 27 FACILITIES/MAINTENANCE (18%) Improve directional signage to the park 2 Improve/modernize/replace visitor center 2 More horse trails 2 More walking trails 2 Other comments 12 POLICY/MANAGEMENT (21%) Increase advertisement of the fort/site 6 Advertise through local television/radio/newspaper 2 Keep up the good work 2 Offer food service 2 Other comments 12 RESOURCE MANAGEMENT (17%) Reconstruct historic buildings 5 More archeological research 3 Continue researching Ninety Six village 2 Restore/reconstruct the Star Fort 2 Other comments 7 GENERAL (7%) Enjoyed visit 2 Other comments 6

Ninety Six National Historic Site–VSP Visitor Study Report 226 April 10 - June 13, 2010
91
Additional comments Question 30
Is there anything else you and your personal group would like to tell us about your visit to Ninety Six NHS? (open-ended)
Results
• 41% of general visitor groups (N=98) responded to this question.
• 38% of encampment visitor groups
(N=54) responded to this question.
• Tables 21a and 21b show a summary of visitor comments. A complete copy of hand-written comments is included in the Visitor Comments Appendix.
Table 21a. Additional comments – General visitors (N=136 comments; some visitor groups made more than one comment.)
Comment
Number of times mentioned
PERSONNEL (19%) Helpful staff 9 Courteous staff 4 Friendly staff 4 Knowledgeable staff 3 Other comments 6 INTERPRETIVE SERVICES (15%) Educational experience/opportunity 5 Interpretive signs were informative 2 Park video was informational 2 Other comments 12 FACILITIES/MAINTENANCE (13%) Clean/well-maintained 9 Enjoy the trails 2 Other comments 7 POLICY/MANAGEMENT (4%) Questionnaire is too long 2 Other comments 4 RESOURCE MANAGEMENT (4%) Comments 5 GENERAL COMMENTS (44%) Enjoyed visit 33 No comment 6 Will return 4 Keep up the good work 3 Enjoyed walk 2 Other comments 12

Ninety Six National Historic Site–VSP Visitor Study Report 226 April 10 - June 13, 2010
92
Table 21b. Additional comments – Encampment visitors (N=80 comments; some visitor groups made more than one comment.)
Comment
Number of times mentioned
PERSONNEL (5%) Comments 4 INTERPRETIVE SERVICES (25%) Visit was educational/informative 7 Historically significant 2 Other comments 11 FACILITIES/MAINTENANCE (13%) Enjoyed the trails 2 Grounds have been much improved 2 Other comments 6 POLICY/MANAGEMENT (8%) Comments 6 GENERAL (50%) Enjoyed visit 14 Great job 4 Thank you 3 We love the park 3 Enjoyed nature 2 Park is good for children 2 Other comments 12

Ninety Six National Historic Site–VSP Visitor Study Report 226 April 10 - June 13, 2010
93
Appendix 1: The Questionnaire

Ninety Six National Historic Site–VSP Visitor Study Report 226 April 10 - June 13, 2010
94

Ninety Six National Historic Site–VSP Visitor Study Report 226 April 10 - June 13, 2010
95
Appendix 2: Additional Analysis The Visitor Services Project (VSP) offers the opportunity to learn more from VSP visitor study data through additional analysis. Two-way and three-way cross tabulations can be made with any questions. Below are some examples of the types of cross tabulations that can be requested. To make a request, please use the contact information below, and include your name, address and phone number in the request. 1. What proportion of family groups with children attend interpretive programs? 2. Is there a correlation between visitors’ ages and their preferred sources of information about the park? 3. Are highly satisfied visitors more likely to return for a future visit? 4. How many international visitors participate in hiking? 5. What ages of visitors would use the park website as a source of information on a future visit? 6. Is there a correlation between visitor groups’ rating of the overall quality of their park experience, and
their ratings of individual services and facilities? 7. Do larger visitor groups (e.g., four or more) participate in different activities than smaller groups? 8. Do frequent visitors rate the overall quality of their park experiences differently than less frequent
visitors? For more information please contact: Visitor Services Project, PSU College of Natural Resources P.O. Box 441139 University of Idaho Moscow, ID 83844-1139 Phone: 208-885-7863 Fax: 208-885-4261 Email: [email protected] Website: http://www.psu.uidaho.edu

Ninety Six National Historic Site–VSP Visitor Study Report 226 April 10 - June 13, 2010
96
Appendix 3: Decision Rules for Checking Non-response Bias Non-response bias is one of the major threats to the quality of a survey project. It affects the ability to generalize from a sample to the general population (Salant and Dillman 1994; Dillman, 2007; Stoop 2004; Filion 1976; Dey 1997). Since non-response bias is usually caused by participants failing to return their questionnaires, a higher response rate is more desirable. However, higher response rates do not guarantee low non-response bias. Researchers have suggested different methods to detect non-response bias. The most common variables used to detect non-response bias are demographic variables. Some researchers such as Van Kenhove (2002) and Groves (2000) also suggest that saliency of topic has an effect on response rate. In this visitor study, visitor satisfaction (overall quality rating) could be considered as one of the salient factors as we aim to collect opinions from both unsatisfied and satisfied visitors. There are also several methods for checking non-response bias suggested in the literature. We decided to follow the method suggested by Groves (2006), De Rada (2005), and Rogelberg and Luong (1998) to compare the demographic characteristics as well as satisfaction scores of respondents in three different mailing waves. This seems to be the most suitable method because the visitor population is generally unknown. Respondents and nonrespondents were compared using age and group size. Independent sample T-test was used to test the different between respondents and nonrespondents. Respondents were then categorized based on the date their questionnaire was received. Average overall quality ratings were compared between respondent who returned their questionnaires before and after reminders were sent. The hypothesis was that respondents have the same average overall quality rating. This is based on the assumption that satisfaction with park services and facilities is independent from the likelihood of returning a questionnaire. If the p-value is greater than 0.05, the difference in group type is judged to be insignificant. Therefore, the hypotheses for checking non-response bias are:
1. There was no significant difference between respondents’ and nonrespondents’ average age. 2. There was no significant difference between respondents’ and nonrespondents’ average group
size. 3. Average quality rating among respondents who returned their questionnaire before reminders
is the same as those who returned questionnaires after reminder.
Tables 3 and 4 show no significant difference in group size and average quality rating. However, there is a significant difference in average age. Sometimes, a younger person in the group accepted the questionnaire but an older person in the group actually completed it. This may cause discrepancy in age. While it is necessary to exercise some caution in interpreting visitor demographic, there is no evidence of potential bias in visitors’ opinions about park operation.

Ninety Six National Historic Site–VSP Visitor Study Report 226 April 10 - June 13, 2010
97
References De Rada, D. V. (2005). The Effect of Follow-up Mailings on the Response Rate and Response Quality in
Mail Survey. Quality & Quantity, Vol 38: 1-18. Dey, E.L. (1997). Working with Low Survey Response Rates: The Efficacy of Weighting Adjustment.
Research in Higher Education, 38(2): 215-227. Dillman D. A. (2007). Mail and Internet Surveys: The Tailored Design Method, Updated version with
New Internet, Visual, and Mixed-Mode Guide, 2nd Edition, New York: John Wiley and Sons, Inc. Filion F. L. (Winter 1975-Winter 1976). Estimating Bias due to Non-response in Mail Surveys. Public
Opinion Quarterly, Vol 39 (4): 482-492. Goudy, W. J. (1976). Non-response Effect on Relationships Between Variables. Public Opinion
Quarterly, Vol 40 (3): 360-369. Groves, R. M. (2006). Nonresponse Rates and Nonresponse Bias in Household Surveys. Public Opinion
Quarterly, Vol 70 (5): 646-675. Groves, R. M., Singer, E., and Corning, A. (2000). Leverage-Saliency Theory of Survey Participation
Description and Illustration. Public Opinion Quarterly, Vol 64: 299-308. Rogelberg, S. G. and Luong, A. (1998). Nonresponse to Mailed Surveys: A Review and Guide. Current
Directions in Psychological Science, Vol 7 (2): 60-65. Salant, P. and Dillman, D. A. (1994). How to Conduct Your Own Survey. U.S.: John Wiley and Sons,
Inc. Stoop, I. A. L. (2004). Surveying Non-respondents. Field Methods, 16 (1): 23. Van Kenhove, P., Wijnen, K., and De Wulf K. (2002). The Influence of Topic Involvement on Mail-
Survey Response Behavior. Psychology and Marketing, Vol 19 (3): 293-301. .

Ninety Six National Historic Site–VSP Visitor Study Report 226 April 10 - June 13, 2010
98
Appendix 4: Visitor Services Project Publications
All VSP reports are available on the Park Studies Unit website at www.psu.uidaho.edu.vsp.reports.htm. All studies were conducted in summer unless otherwise noted.
1982 1. Mapping interpretive services: A pilot study at
Grand Teton National Park.
1983 2. Mapping interpretive services: Identifying
barriers to adoption and diffusion of the method.
3. Mapping interpretive services: A follow-up study at Yellowstone National Park and Mt Rushmore National Memorial.
4. Mapping visitor populations: A pilot study at Yellowstone National Park.
1985 5. North Cascades National Park Service
Complex 6. Crater Lake National Park 1986 7. Gettysburg National Military Park 8. Independence National Historical Park 9. Valley Forge National Historical Park 1987 10. Colonial National Historical Park (summer &
fall) 11. Grand Teton National Park 12. Harpers Ferry National Historical Park 13. Mesa Verde National Park 14. Shenandoah National Park (summer & fall) 15. Yellowstone National Park 16. Independence National Historical Park: Four Seasons Study
1988 17. Glen Canyon National Recreational Area 18. Denali National Park and Preserve 19. Bryce Canyon National Park 20. Craters of the Moon National Monument
1989 21. Everglades National Park (winter) 22. Statue of Liberty National Monument 23. The White House Tours, President's Park
1989 (continued) 24. Lincoln Home National Historic Site 25. Yellowstone National Park 26. Delaware Water Gap National Recreation Area 27. Muir Woods National Monument 1990 28. Canyonlands National Park (spring) 29. White Sands National Monument 30. National Monuments & Memorials,
Washington, D.C. 31. Kenai Fjords National Park 32. Gateway National Recreation Area 33. Petersburg National Battlefield 34. Death Valley National Monument 35. Glacier National Park 36. Scott's Bluff National Monument 37. John Day Fossil Beds National Monument
1991 38. Jean Lafitte National Historical Park (spring) 39. Joshua Tree National Monument (spring) 40. The White House Tours, President's Park
(spring) 41. Natchez Trace Parkway (spring) 42. Stehekin-North Cascades NP/Lake Chelan
NRA 43. City of Rocks National Reserve 44. The White House Tours, President's Park (fall)
1992 45. Big Bend National Park (Encampment) 46. Frederick Douglass National Historic Site
(Encampment) 47. Glen Echo Park (Encampment) 48. Bent's Old Fort National Historic Site 49. Jefferson National Expansion Memorial 50. Zion National Park 51. New River Gorge National River 52. Klondike Gold Rush National Historical Park,
AK 53. Arlington House-The Robert E. Lee Memorial

Ninety Six National Historic Site–VSP Visitor Study Report 226 April 10 - June 13, 2010
99
Visitor Services Project Publications (continued)
1993 54. Belle Haven Park/Dyke Marsh Wildlife Park
(spring) 55. Santa Monica Mountains National
Recreation Area (spring) 56. Whitman Mission National Historic Site 57. Sitka National Historical Park 58. Indiana Dunes National Lakeshore 59. Redwood National Park 60. Channel Islands National Park 61. Pecos National Historical Park 62. Canyon de Chelly National Monument 63. Bryce Canyon National Park (fall) 1994 64. Death Valley National Monument
Backcountry (winter) 65. San Antonio Missions National Historical
Park (spring) 66. Anchorage Alaska Public Lands Information
Center 67. Wolf Trap Farm Park for the Performing Arts 68. Nez Perce National Historical Park 69. Edison National Historic Site 70. San Juan Island National Historical Park 71. Canaveral National Seashore 72. Indiana Dunes National Lakeshore (fall) 73. Gettysburg National Military Park (fall) 1995 74. Grand Teton National Park (winter) 75. Yellowstone National Park (winter) 76. Bandelier National Monument 77. Wrangell-St. Elias National Park & Preserve 78. Adams National Historic Site 79. Devils Tower National Monument 80. Manassas National Battlefield Park 81. Booker T. Washington National Monument 82. San Francisco Maritime National Historical
Park 83. Dry Tortugas National Park 1996 84. Everglades National Park (spring) 85. Chiricahua National Monument (spring)
1996 (continued) 86. Fort Bowie National Historic Site (spring) 87. Great Generals Park, Virginia (spring) 88. Great Smoky Mountains National Park 89. Chamizal National Memorial 90. Death Valley National Park (fall) 91. Prince William Forest Park (fall) 92. Great Smoky Mountains National Park (fall) 1997 93. Virgin Islands National Park (winter) 94. Mojave National Preserve (spring) 95. Martin Luther King, Jr., National Historic Site
(spring) 96. Lincoln Boyhood National Memorial 97. Grand Teton National Park 98. Bryce Canyon National Park 99. Voyageurs National Park 100. Lowell National Historical Park 1998 101. Jean Lafitte National Historical Park & Park
(spring) 102. Chattahoochee River National Recreation
Area (spring) 103. Cumberland Island National Seashore
(spring) 104. Iwo Jima/Netherlands Carillon Memorials 105. National Monuments & Memorials,
Washington, D.C. 106. Klondike Gold Rush National Historical Park,
AK 107. Whiskeytown National Recreation Area 108. Acadia National Park 1999 109. Big Cypress National Preserve (winter) 110. San Juan National Historic Site, Puerto Rico
(winter) 111. St. Croix National Scenic Riverway 112. Rock Creek Park 113. New Bedford Whaling National Historical Park 114. Glacier Bay National Park & Preserve 115. Kenai Fjords National Park 116. Lassen Volcanic National Park 117. Cumberland Gap National Historical Park (fall)

Ninety Six National Historic Site–VSP Visitor Study Report 226 April 10 - June 13, 2010
100
Visitor Services Project Publications (continued)
2000 118. Haleakala National Park (spring) 119. White House Tour and White House Visitor
Center (spring) 120. USS Arizona Memorial 121. Olympic National Park 122. Eisenhower National Historic Site 123. Badlands National Park 124. Mount Rainier National Park 2001 125. Biscayne National Park (spring) 126. Colonial National Historical Park (Jamestown) 127. Shenandoah National Park 128. Pictured Rocks National Lakeshore 129. Crater Lake National Park 130. Valley Forge National Historical Park 2002 131. Everglades National Park (spring) 132. Dry Tortugas National Park (spring) 133. Pinnacles National Monument (spring) 134. Great Sand Dunes National Park & Preserve 135. Pipestone National Monument 136. Outer Banks Group (Cape Hatteras National
Seashore, Ft. Raleigh National Historic Site, and Wright Brothers National Memorial)
137. Sequoia & Kings Canyon National Parks and Sequoia National Forest
138. Catoctin Mountain Park 139. Hopewell Furnace National Historic Site 140. Stones River National Battlefield (fall) 2003 141. Gateway National Recreation Area: Floyd
Bennett Field (spring) 142. Cowpens National Battlefield (spring) 143. Grand Canyon National Park – North Rim 144. Grand Canyon National Park – South Rim 145. C&O Canal National Historical Park 146. Capulin Volcano National Monument 147. Oregon Caves National Monument 148. Knife River Indian Villages National Historic
Site 149. Fort Stanwix National Monument 150. Arches National Park
2003 continued 151. Mojave National Preserve (fall) 2004 152. Joshua Tree National Park (spring) 153. New River Gorge National River 154. George Washington Birthplace National
Monument 155. Craters of the Moon National Monument &
Preserve 156. Dayton Aviation Heritage National Historical
Park 157. Apostle Islands National Lakeshore 158. Keweenaw National Historical Park 159. Effigy Mounds National Monument 160. Saint-Gaudens National Historic Site 161. Manzanar National Historic Site 162. John Day Fossil Beds National Monument
2005 163. Congaree National Park (spring) 164. San Francisco Maritime National Historical
Park (spring) 165. Lincoln Home National Historic Site 166. Chickasaw National Recreation Area 167. Timpanogos Cave National Monument 168. Yosemite National Park 169. Fort Sumter National Monument 170. Harpers Ferry National Historical Park 171. Cuyahoga Valley National Park 172. Johnstown Flood National Memorial 173. Nicodemus National Historic Site 2006 174. Kings Mountain National Military Park (spring) 175. John Fitzgerald Kennedy National Historic Site176. Devils Postpile National Monument 177. Mammoth Cave National Park 178. Yellowstone National Park 179. Monocacy National Battlefield 180. Denali National Park & Preserve 181. Golden Spike National Historic Site 182. Katmai National Park and Preserve 183. Zion National Park (spring and fall)

Ninety Six National Historic Site–VSP Visitor Study Report 226 April 10 - June 13, 2010
101
Visitor Services Project Publications (continued) 2007 184.1. Big Cypress National Preserve (spring) 184.2. Big Cypress National Preserve (ORV Permit
Holder/Camp Owner) 185. Hawaii Volcanoes National Park (spring) 186. Glen Canyon National Recreation Area (spring
and summer) 187. Lava Beds National Monument 188. John Muir National Historic Site 189. Fort Union Trading Post NHS 190. Fort Donelson National Battlefield 191. Agate Fossil Beds National Monument 192. Mount Rushmore National Memorial 193. Ebey's Landing National Historical Reserve 194. Rainbow Bridge National Monument 195. Independence National Historical Park 196. Minute Man National Historical Park 2008 197. Blue Ridge Parkway (fall and summer) 198. Yosemite National Park (winter) 199. Everglades National Park (winter and spring) 200. Horseshoe Bend National Military Park
(spring) 201. Carl Sandburg Home National Historic Site
(spring) 202. Fire Island National Seashore resident (spring)203. Fire Island National Seashore visitor 204. Capitol Reef National Park 205.1 Great Smoky Mountains National Park
(summer) 205.2 Great Smoky Mountains National Park (fall) 206. Grand Teton National Park 207. Herbert Hoover National Historic Site 208. City of Rocks National Reserve 2009 209. Fort Larned National Historic Site 210. Homestead National Monument of America 211. Minuteman Missile National Historic Site
2009 (continued) 212. Perry’s Victory & International Peace Memorial213. Women’s Rights National Historical Park 214. Klondike Gold Rush National Historical Park
Unit -Seattle 215. Yosemite National Park 216. Sleeping Bear Dunes National Lakeshore 217. James A. Garfield National Historic Site 218. Boston National Historical Park 219. Bryce Canyon National Park 220. Indiana Dunes National Lakeshore 221. Acadia National Park 222. Laurance S. Rockefeller Preserve 223. Martin Van Buren National Historic Site
2010 224.1. Death Valley National Park (fall 2009) 224.2. Death Valley National Park (spring) 225. San Juan National Historic Site 226. Ninety Six National Historic Site (spring)
For more information about the Visitor Services Project, please contact the University of Idaho Park Studies Unit, website: www.psu.uidaho.edu or phone (208) 885-7863.


The Department of the Interior protects and manages the nation’s natural resources and cultural heritage; provides scientific and other information about those resources; and honors its special responsibilities to American Indians, Alaska Natives, and affiliated Island Communities.
Natural Resource Report NPS/NRPC/SSD/NRR—2010/397/106048, January 2011

National Park Service U.S. Department of the Interior
Natural Resource Program Center 1201 Oakridge Drive, Suite 150 Fort Collins, CO 80525 www.nature.nps.gov
EXPERIENCE YOUR AMERICA TM